Embed Size (px)
Citation preview
Infrastructure for an island
population of 8 million
February 2010

02
The Irish Academy of Engineering
The Irish Academy of Engineering is an all-Ireland body,
concerned with long-term issues where the engineering
profession can make a unique contribution to economic,
social and technological development.
Its members are Irish engineers of distinction, drawn from a
wide range of disciplines and membership currently stands
at approximately 120.
Drawing on the experiences and knowledge of its
distinguished members, The Academy works to facilitate
communication and dialogue on engineering-related
matters. It publishes reports and analyses, some jointly with
other learned and professional bodies.
The Irish Academy of Engineering,
22 Clyde Road, Ballsbridge, Dublin 4
Tel: 00353 1 665 1337
www.iae.ie
Engineers Ireland
Engineers Ireland was founded in 1835, has over 24,000
members and is the largest professional body operating on
the island. It is concerned with promoting the development
of the engineering profession and an environment which
will stimulate world-class development on the island.
Engineers Ireland is the operating name of the Institute of
Engineers of Ireland.
Engineers Ireland,
22 Clyde Road, Ballsbridge, Dublin 4
Tel: 00353 1 665 1300
www.engineersireland.ie
InterTradeIreland
InterTradeIreland, the Trade and Business Development
Body, is one of the six cross-border bodies set up under the
1998 Belfast Agreement. InterTradeIreland’s mission is “to
identify and help realise opportunities to improve
competitiveness, generate economic growth and create
sustainable, quality jobs in both jurisdictions through
increased levels of North/South trade and co-operation on
innovation and business development opportunities”.
InterTradeIreland, The Old Gasworks Business Park,
Kilmorey Street, Newry BT34 2DE
from Republic Tel: 00353 (0) 48 3083 4100
from NI/UK Tel: 0044 (0) 28 3083 4100
www.intertradeireland.com
Acknowledgement
The Irish Academy of Engineering and Engineers Ireland wish
to thank InterTradeIreland for their kind support for this Report.
This report has been prepared jointly by the Irish Academy of Engineering and Engineers
Ireland, both of which are all-island engineering organisations. The report was
commissioned by InterTradeIreland.
CONTENTS
Infrastructure for an Island Population of 8 Million
03
Taskforce Members 04Foreword 05Summary and Key Recommendations 06
1 Introduction 10
2 City Regions 12Key Recommendations 122.1 Introduction 122.2 Urbanisation and Increasing Urban
Density – International Trends 122.3 Role of Cities in Driving International
Competitiveness 122.4 Infrastructure Planning – City Regions 132.5 Advantages of High Density 142.6 Density of Cities on the Island of Ireland 142.7 Urbanisation in City Regions 172.8 Income Per Capita in Cities 172.9 The Dublin–Belfast Corridor 182.10 The South Western Corridor 192.11 Summary 19
3 Transport 20Key Recommendations 203.1 Introduction 203.2 Roads 203.3 Rail 223.4 Public Transport 253.5 Ports 263.6 Airports 28
4 Energy 30Key Recommendations 304.1 Introduction 304.2 Electricity 304.3 Gas 334.4 District Heating 37
5 Environment 38Key Recommendations 385.1 Waste 385.2 Water 395.3 Wastewater 40
6 Climate Change 42Key Recommendations 426.1 Introduction 426.2 GHG Abatement 426.3 Infrastructure Adaptation 44
7 Information and Communications Technology (ICT) 48Key Recommendations 487.1 Overview 487.2 Communications Networks 497.3 Broadband 497.4 Broadband Speed 507.5 Growth in Demand 507.6 International Connections 517.7 Data Centres 51
8 Enterprise 52Key Recommendations 528.1 Industry Location 528.2 Education and R&D 54
9 Engineering for Health 58Key Recommendation 589.1 Introduction 589.2 Preventive Health & Safety Measures 589.3 Life Expectancy 589.4 Specialisation 589.5 Opportunities 589.6 Education and Training 589.7 ICT Infrastructure 59
10 Infrastructure Integration 60Key Recommendation 6010.1 Road and Rail Integration 6010.2 Gas Storage, LNG, and Oil Distillate
Storage at Power Stations 6010.3 Electric Cars and Wind Energy Storage 6010.4 Increased City Density and
District Heating 6010.5 Increased City Density and Energy
Use in Transport 6010.6 Tidal Barriers and Transport Infrastructure 6110.7 R&D, Education and the Development
of Strategic Industrial Sectors 61
11 Economic Assessment 62Key Recommendations 6211.1 The Context 6211.2 Additional Projects and Potential Sources
of Funding 6411.3 Funding the Island’s Infrastructure
Investment 64
AnnexesAnnex 1 Indicative Costs of Projects having
an Island Emphasis 65Annex 2 Menu of Funding Options 66Annex 3 Proposed Transport Solutions 67Annex 4 Electricity Transmission System 69Annex 5 List of Acronyms 70

Liam Connellan (Chairman)
Chairman, Veolia Environnement Ireland, formerly
Chairman, National Roads Authority
Don Moore (Project Facilitator)
formerly Managing Director, ESB International
Anne Butler
Environmental Consultant, formerly Director,
Environmental Protection Agency
Michael Phillips
Dublin City Engineer and Director of Traffic
David Croughan
Head of Economics and Taxation, IBEC
David Gavaghan
Chief Executive, Strategic Investment Board, NI
Jonathan Hegan
formerly Chairman, RPS (Northern Region)
Martin Hynes
Executive Director, Irish Research Council for Science,
Engineering & Technology
Billy McCoubrey
formerly Chief Executive, Roads Service NI
Eoin Magennis
Policy Research Manager, InterTradeIreland
Gordon Millington
formerly Senior Partner, Kirk McClure Morton
John Power
Director General, Engineers Ireland
Dr Reg Shaw
formerly Managing Director, Wyeth Biotech
Brian Torpey
formerly Chief Engineer, Dublin Port
Brendan Tuohy
formerly Secretary General, Dept. of Communications,
Marine & Natural Resources
Gerry Walsh
Director, Spruce Consulting Ltd, formerly Chief Executive,
BGE
David Waters
formerly Managing Director, Irish Rail
The Irish Academy of Engineering and Engineers Ireland
would like to acknowledge the following, who also
contributed to the report:
Martin Spollen
Strategic Investment Board, NI
Johann Gallagher
Strategic Investment Board, NI
Aidan Gough
InterTradeIreland
Anne-Marie McAteer
InterTradeIreland
David Moore
Aecom Design Build (Ireland) Ltd.
Tom Weymes
formerly IDA
TASKFORCE MEMBERS
Irish Academy of Engineering and Engineers Ireland
04
The members of the Taskforce participated in extensive discussions in the course of a series of meetings and submitted comments on a series
of drafts of the report. Its content conveys the general tone and direction of the discussions, but its recommendations do not necessarily reflect
a common position reached by all members of the Taskforce, nor do they necessarily represent the views of the organisations to which the
members belong.
This report has been prepared by a Taskforce organised by
the Irish Academy of Engineering and Engineers Ireland
representing the engineering profession on the island of
Ireland. It has been commissioned by InterTradeIreland.
The purpose of the report is to identify and make
recommendations on the long-term infrastructure which
will be required in order to achieve world-class
competitiveness for the island. Adopting a long-term
perspective ensures that economic choices are made and
avoids the risk of revisiting incremental decisions based on
short-term pressures.
The world economy is going through a period of
unprecedented change and adaptation. The rapid growth
in the economic power of China and India, the threats
posed by climate change and to energy supplies, the global
banking crisis and the enlargement of the European Union
all present new challenges.
Estimates of the population of the island which were
prepared by the Official Statistics Agencies, North and
South, before the onset of the current recession, indicated
that, based on certain assumptions (used by the CSO), the
population of the island could reach eight million around
2030. The projections were based on the M2F1 traditional
variant which combines continued (albeit declining)
international migration with constant fertility. This increase
in population will be accompanied by a major demographic
change with the proportion of the population over 65
growing from 11% in 2007 to approximately 22% in 2030.
The recession seems likely to postpone the achievement of
the eight million estimate by a number of years. It is still
important, nonetheless, to identify and put in place in an
integrated manner the infrastructure required for an
economy with an increased population of eight million
given the long-term nature of this activity.
In economic terms, the gross national income per capita of
the island economy ranks in the top 13 in the world. An
economic growth rate from 2012 in excess of 3% per
annum will be necessary to sustain the population increase
assumed as the basis for this report.
The pressures of the global economy emphasise the
importance of achieving substantial improvement in the
infrastructure of the island which will support an
enhancement in economic competitiveness and quality of
life for this population.
FOREWORD
Infrastructure for an Island Population of 8 Million
505
Context
The combined economies on the island of Ireland comprise
a very small percentage of world economic output. They
compete in an international market place which has become
ever more globalised. The living standards of people on the
island are among the highest in the world. This has been
achieved by investment in education and health, and having
favourable conditions for industrial location.
However, there are very significant changes occurring in the
world economy including increased competition from the
so called BRIC countries (Brazil, Russia, India and China), the
pressures of climate change and limits on the supply of oil.
It is of fundamental importance that industry on the island
has the opportunity to operate efficiently, innovatively and
flexibly in this framework of changing international
conditions, and can continue to achieve world-class
competitiveness.
It is our considered view that for the island to take its place
amongst the most advanced competitive economies in the
world, the following is required:
■ a focus on eight City Regions accounting for 90% of the
population which will deliver economies of scale and
efficiencies necessary for international competitiveness;
■ increased urbanisation and density of the city
populations, which will allow the delivery of the first-
class infrastructure;
■ a Dublin–Belfast Corridor with a population of four
million and appropriate infrastructure investment which
can compete with other major European urban zones;
this would be complemented by a South Western
corridor linking Cork, Limerick and Galway and
comprising a further two million people;
■ high quality connectivity both within and between the
eight City Regions;
■ development of Dublin Airport, complemented by
Belfast International, as an international hub to improve
worldwide connectivity for business on the island; and,
■ use of innovative financing to fund infrastructure
development.
A key element in the future growth of Ireland’s economy
and in attracting investment to Ireland is the quality of its
infrastructure. A number of competitiveness surveys point
to the significant infrastructure gap on the island of Ireland.
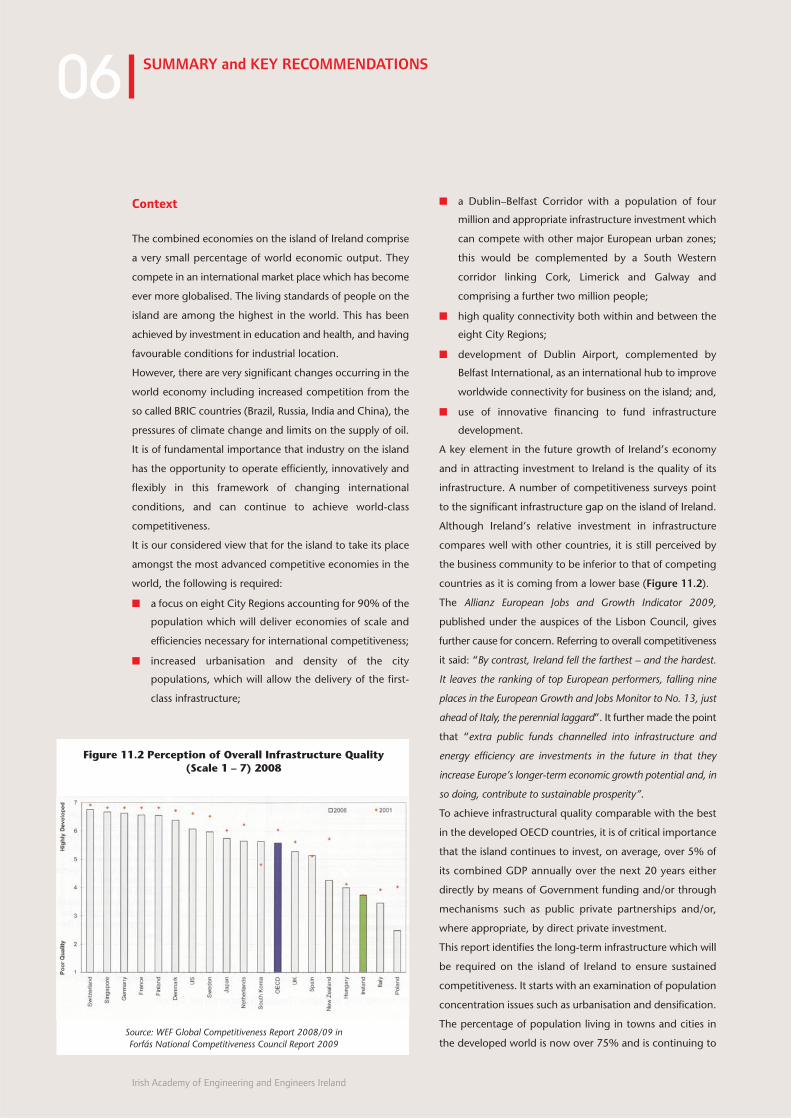
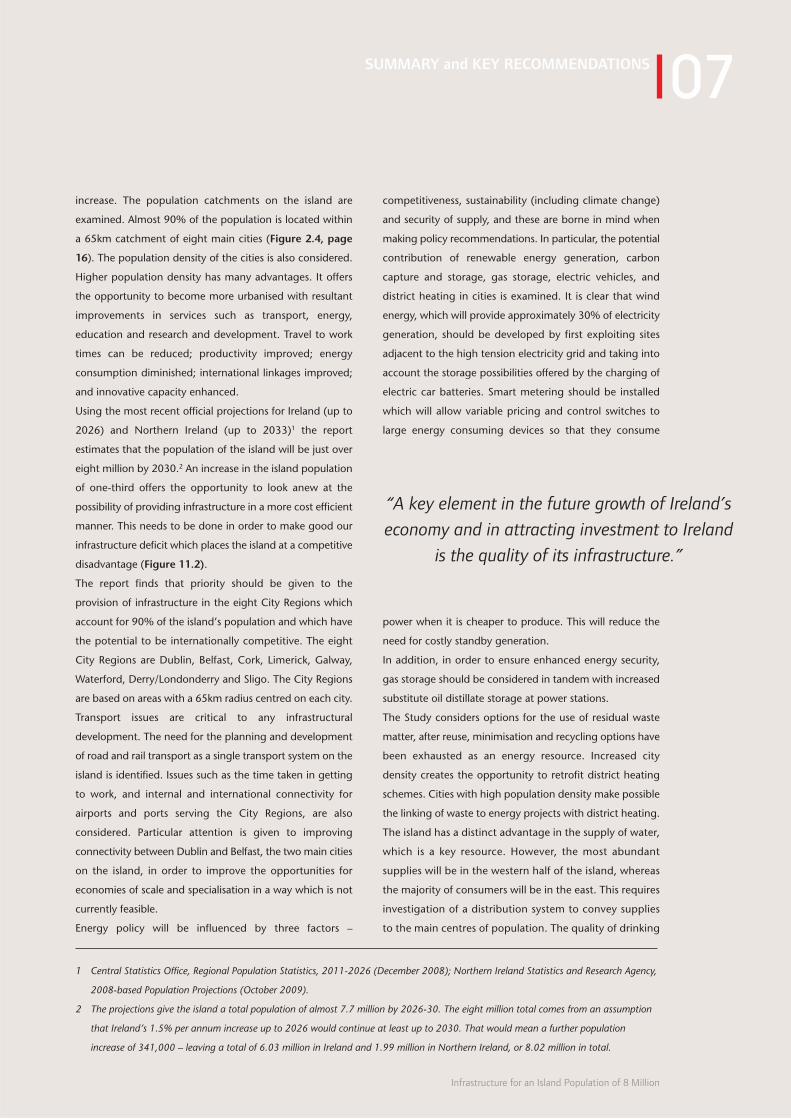
Although Ireland’s relative investment in infrastructure
compares well with other countries, it is still perceived by
the business community to be inferior to that of competing
countries as it is coming from a lower base (Figure 11.2).
The Allianz European Jobs and Growth Indicator 2009,
published under the auspices of the Lisbon Council, gives
further cause for concern. Referring to overall competitiveness
it said: “By contrast, Ireland fell the farthest – and the hardest.
It leaves the ranking of top European performers, falling nine
places in the European Growth and Jobs Monitor to No. 13, just
ahead of Italy, the perennial laggard”. It further made the point
that “extra public funds channelled into infrastructure and
energy efficiency are investments in the future in that they
increase Europe’s longer-term economic growth potential and, in
so doing, contribute to sustainable prosperity”.
To achieve infrastructural quality comparable with the best
in the developed OECD countries, it is of critical importance
that the island continues to invest, on average, over 5% of
its combined GDP annually over the next 20 years either
directly by means of Government funding and/or through
mechanisms such as public private partnerships and/or,
where appropriate, by direct private investment.
This report identifies the long-term infrastructure which will
be required on the island of Ireland to ensure sustained
competitiveness. It starts with an examination of population
concentration issues such as urbanisation and densification.
The percentage of population living in towns and cities in
the developed world is now over 75% and is continuing to
SUMMARY and KEY RECOMMENDATIONS
Irish Academy of Engineering and Engineers Ireland
06
Figure 11.2 Perception of Overall Infrastructure Quality (Scale 1 – 7) 2008
Source: WEF Global Competitiveness Report 2008/09 in Forfás National Competitiveness Council Report 2009
increase. The population catchments on the island are
examined. Almost 90% of the population is located within
a 65km catchment of eight main cities (Figure 2.4, page
16). The population density of the cities is also considered.
Higher population density has many advantages. It offers
the opportunity to become more urbanised with resultant
improvements in services such as transport, energy,
education and research and development. Travel to work
times can be reduced; productivity improved; energy
consumption diminished; international linkages improved;
and innovative capacity enhanced.
Using the most recent official projections for Ireland (up to
2026) and Northern Ireland (up to 2033)1 the report
estimates that the population of the island will be just over
eight million by 2030.2 An increase in the island population
of one-third offers the opportunity to look anew at the
possibility of providing infrastructure in a more cost efficient
manner. This needs to be done in order to make good our
infrastructure deficit which places the island at a competitive
disadvantage (Figure 11.2).
The report finds that priority should be given to the
provision of infrastructure in the eight City Regions which
account for 90% of the island’s population and which have
the potential to be internationally competitive. The eight
City Regions are Dublin, Belfast, Cork, Limerick, Galway,
Waterford, Derry/Londonderry and Sligo. The City Regions
are based on areas with a 65km radius centred on each city.
Transport issues are critical to any infrastructural
development. The need for the planning and development
of road and rail transport as a single transport system on the
island is identified. Issues such as the time taken in getting
to work, and internal and international connectivity for
airports and ports serving the City Regions, are also
considered. Particular attention is given to improving
connectivity between Dublin and Belfast, the two main cities
on the island, in order to improve the opportunities for
economies of scale and specialisation in a way which is not
currently feasible.
Energy policy will be influenced by three factors –
competitiveness, sustainability (including climate change)
and security of supply, and these are borne in mind when
making policy recommendations. In particular, the potential
contribution of renewable energy generation, carbon
capture and storage, gas storage, electric vehicles, and
district heating in cities is examined. It is clear that wind
energy, which will provide approximately 30% of electricity
generation, should be developed by first exploiting sites
adjacent to the high tension electricity grid and taking into
account the storage possibilities offered by the charging of
electric car batteries. Smart metering should be installed
which will allow variable pricing and control switches to
large energy consuming devices so that they consume
power when it is cheaper to produce. This will reduce the
need for costly standby generation.
In addition, in order to ensure enhanced energy security,
gas storage should be considered in tandem with increased
substitute oil distillate storage at power stations.
The Study considers options for the use of residual waste
matter, after reuse, minimisation and recycling options have
been exhausted as an energy resource. Increased city
density creates the opportunity to retrofit district heating
schemes. Cities with high population density make possible
the linking of waste to energy projects with district heating.
The island has a distinct advantage in the supply of water,
which is a key resource. However, the most abundant
supplies will be in the western half of the island, whereas
the majority of consumers will be in the east. This requires
investigation of a distribution system to convey supplies
to the main centres of population. The quality of drinking
SUMMARY and KEY RECOMMENDATIONS
Infrastructure for an Island Population of 8 Million
07
1 Central Statistics Office, Regional Population Statistics, 2011-2026 (December 2008); Northern Ireland Statistics and Research Agency,
2008-based Population Projections (October 2009).
2 The projections give the island a total population of almost 7.7 million by 2026-30. The eight million total comes from an assumption
that Ireland’s 1.5% per annum increase up to 2026 would continue at least up to 2030. That would mean a further population
increase of 341,000 – leaving a total of 6.03 million in Ireland and 1.99 million in Northern Ireland, or 8.02 million in total.
“A key element in the future growth of Ireland’s
economy and in attracting investment to Ireland
is the quality of its infrastructure.”
water tends to be much higher in urban areas than in
rural areas.
Climate change matters must also be addressed. Greater city
density will make public transport more feasible, with
consequential lower carbon emissions. Most cities are built
on river estuaries and so rising sea levels need to be
considered in determining flood protection measures. In
addition, increased world population and climate change are
likely to lead to food shortages by 2030. The island’s “climate
advantage” will allow it to increase its production of meat,
cereals and dairy products.
Advanced broadband penetration will be a critical element in
supporting the industries of the future. Ireland is currently ranked
in a low position in the percentage of households and enterprises
with access to broadband. Broadband speeds which match the
performance of the most advanced global economies will be
required in all of the eight city catchments using fibre to the
home technology. This will have a special relevance to the
provision of tele-medical health services in the home. The
development of the island economy is dependent on
increasing the productive capacity of manufacturing industry
(including food processing) and internationally traded services.
The main growth sectors are likely to be in pharmaceutical and
medical devices, information and communications technology,
energy, green enterprise, food and forestry, connected health
and business and financial services. Foreign direct investment
tends to locate in the larger cities. The fastest growing sector
is internationally traded business services which accounts for
the majority of projects in Dublin, Belfast and Cork.
Investment in research and development will remain a fast
growing sector for an advanced economy and bears a strong
correlation with the supply of PhD graduates. Over 85% of
new foreign investment in research projects is located in the
five largest cities on the island. The development of strategic
industrial clusters and innovation centres and an integrated
approach combining research, development and education
will increase the likelihood of synergy between these sectors.
The integration of all of the above elements of infrastructure
will be crucial in improving efficiency, effectiveness and
competitiveness at minimum cost. Higher density cities can
make a very substantial contribution to improving
competitiveness on the island. The greatest opportunity lies in
developing much greater synergy along the Dublin–Belfast
Corridor, which is the most highly populated conurbation on
the island. Strictly enforced planning guidelines can play a
major role in improving the quality of life and increasing the
population density of cities.
Key Recommendations
City Regions1. Concentrate on improving the competitiveness of the
eight City Regions.
2. Plan for greater urbanisation and an increase in the
population density in cities by one-third by 2030.
3. Develop the Dublin–Belfast Corridor with appropriate
infrastructure investment between both cities and the
important nodal points along the Corridor.
4. Promote a South Western Corridor linking Cork,
Limerick and Galway.
Transport
1. Improve transport connections, including a high speed,
high frequency intercity rail system, between the cities
of Dublin and Belfast.
2. Develop a second transport corridor along the South
Western Corridor between Cork, Limerick and Galway.
3. Improve the motorway network to meet the projected
increased traffic flows between the eight principal cities
and links to ports and airports.
4. Determine the complementary role of road and rail
when planning to improve traffic flows between the
main centres.
5. Make capacity available in Dublin Port by relocating the
Oil Zone to a new dedicated port with pipelines to
supply aviation fuel directly to Dublin Airport.
6. Develop Dublin Airport, complemented by Belfast
International, as a major international hub to improve
worldwide connectivity for business on the island.
Energy
1. Prioritise investment in research and development of
offshore wind, marine renewables and smart grid
technologies.
2. Determine the optimum share that gas, coal and
nuclear should contribute to the non-renewable
segment of electricity generation.
SUMMARY and KEY RECOMMENDATIONS
Irish Academy of Engineering and Engineers Ireland
08

3. Prioritise the location of new wind farms adjacent to the
high tension electricity grid.
4. Increase energy security by providing long-term strategic
storage capacity equivalent to 20% of annual natural gas
usage on the island in line with international norms.
5. Make district heating a requirement in all new high-
density residential and commercial developments.
Environment
1. Base development plans for all City Regions on clear
sustainable principles.
2. Establish appropriately sized waste to energy (WTE)
plants and strategically locate them to cater for residual
waste from the City Regions.
3. Manage demand for water with an emphasis on
conservation, loss reduction, metering and an economic
charge for water.
4. Develop a shared water mains network which will allow
for bulk transfer of water between sources of supply and
population centres.
5. Undertake a programme of sewer renewal in urban
areas. Have separate storm and foul water sewers where
practicable.
Climate Change
1. Increase the energy efficiency of residential and
commercial buildings.
2. Develop new non-greenhouse gas (GHG) emitting baseload
electricity generation, coal or gas with carbon capture and
storage technology and imported nuclear power.
3. Plan for the protection of cities in coastal areas and river
basins against flood damage and rising sea levels.
4. Establish a register of critical infrastructure vulnerable to
climate change. Carry out a flood risk assessment for
each critical infrastructure asset identifying its frequency
of exposure to a hazard, its resilience to exposure and
the consequences of its failure.
5. Focus climate research on identifying key parameters
critical for infrastructure design.
Information & CommunicationsTechnology (ICT)
1. Develop a high speed and large capacity information
highway which will match the performance of that in
the most advanced global economies. Prioritise the high
density population corridor linking Dublin and Belfast
and also the South Western Corridor.
2. Harness the potential of advanced IT and
communications technologies to improve efficiencies
and enable a sustainable competitive economy.
3. Establish a direct connection to Europe, in addition to
routes through Great Britain, using advanced
communication technology, thus enabling Ireland to be
a virtual extension of the main internet exchanges in
mainland Europe.
Enterprise
1. Encourage the development of specialised industrial
clusters and innovation hubs in each city.
2. Maximise the enterprise opportunities arising from the
island’s climate advantage.
3. Support research and development (R&D) and
innovation in higher education institutions. Support
industrial investment in R&D.
Engineering for Health
1. Build an advanced IT infrastructure within the healthcare
system linked to the broadband network, which will enable
the use of sophisticated personal-use diagnostic devices
and allow for early detection of life-threatening events.
Infrastructure Integration
1. Adopt an integrated approach to all infrastructure
planning to ensure improved efficiency, effectiveness
and competitiveness at minimum cost.
Economic Assessment
1. Finance the development of infrastructure using a
combination of innovative financing sources including
the Exchequer, public private partnerships, a possible
island of Ireland infrastructure bank, capital markets and
the European Investment Bank.
2. Develop a framework which will allow the private sector
SUMMARY and KEY RECOMMENDATIONS
Infrastructure for an Island Population of 8 Million
09

to increase its share of investment in provision of
infrastructure.
PrefaceThe purpose of this report is to make recommendations on
critical elements of infrastructure required on the island of
Ireland in order to cater for an increased population of eight
million, and to support a world class competitive economy.
By considering the combined needs on an all-island basis it
is clear that there will be economies of scale which will
benefit the population.
An advanced competitive economy requires first-class
infrastructure, which will deliver efficient and integrated
transport systems, high quality technical connectivity,
including broadband, cost effective energy, sustainable
environmental solutions and an attractive quality of life for
its people.
It is our considered view that for the island to takes its place
amongst the most advanced competitive economies in the
world, the following is required:
■ a focus on eight City Regions accounting for 90% of the
population which will deliver economies of scale and
efficiencies necessary for international competitiveness;
■ increased urbanisation and density of the city
populations, which will allow the delivery of the first-
class infrastructure;
■ a Dublin–Belfast Corridor with a population of four
million and appropriate infrastructure investment which
can compete with other major European urban zones;
■ high quality connectivity both within and between the
eight City Regions;
■ development of Dublin Airport, complemented by
Belfast International, as an international hub to improve
worldwide connectivity for business on the island; and,
■ use of innovative financing to fund infrastructure
development.
The Context
Using the most recent official projections for Ireland (up to
2026) and Northern Ireland (up to 2033)3 the report
estimates that the population of the island will be just over
eight million by 2030.4 In the South the population increase
will be based upon continuing (albeit declining)
international migration and constant fertility. Of relevance
to this report, it is likely to be accompanied by traditional
internal migration patterns and movement of younger
people to the urban areas. This will result in a rise from 4.23
million (2006) to 5.69 million (2026).5 In the North natural
growth (fertility) and improvements in mortality are the
main factors behind the 0.7% per annum increase.
To achieve infrastructural quality comparable with the best
in the developed OECD countries and to support the above
population it is of critical importance that medium to long-
term infrastructural planning takes place. There is clear
evidence that there is at present an infrastructural deficit on
the island. This deficit must be eliminated and we must then
keep pace with developments in the more advanced
INTRODUCTION
Irish Academy of Engineering and Engineers Ireland
10
Chapter 1
INTRODUCTION
3 Central Statistics Office, Regional Population Statistics, 2011-2026 (December 2008); Northern Ireland Statistics and Research Agency,
2008-based Population Projections (October 2009).
4 The projections give the island a total population of almost 7.7 million by 2026-30. The eight million total comes from an assumption
that Ireland’s 1.5% per annum increase up to 2026 would continue at least up to 2030. That would mean a further population
increase of 341,000 – leaving a total of 6.03 million in Ireland and 1.99 million in Northern Ireland, or 8.02 million in total.
5 It should be noted that these projections were released in October 2008 before the current economic downturn and more recent signs
of emigration. What effect this will have on the overall growth rate is open to question.

competing economies which will continue to drive forward
and improve their infrastructure.
Some guiding principles were adopted in preparing our
report. We recognised that there are severe limitations
on the financial resources likely to be available. It has
been demonstrated internationally that cities are the key
drivers of economic and social development. They are
the engines of development within wider City Regions.
We have focused on City Regions comprising a circle of
65km radius from the city centre and have identified
eight City Regions, which together account for almost
90% of the population of the island and where we
believe best value can be obtained from limited
resources. The influence of a city does of course extend
further, particularly along the transport corridors which
link it to other cities.
Irish cities are small by international standards. We have
therefore also considered the opportunities for the
development of one or two conurbations which could
have the economies of scale to compete with some of
the larger urban zones in Europe. The Dublin–Belfast
Corridor is the primary conurbation, and a second
possibility exists on the South West Corridor linking Cork,
Limerick and Galway.
The globalisation of world trade and travel is a further
consideration. It is critical that there is a very high level
of connectivity within the island and between the island
and international centres of trade. This will involve the
development of a major international airport hub on the
island.
The cost of providing the necessary infrastructure will be
substantial. It will be necessary to harness all the available
public and private resources in a manner which will
provide the highest return in employment and
exchequer revenue to the people of the island. Focus
should be on providing essential infrastructure for the
high growth City Regions which have the greatest
attraction for inward investment and which will provide
the highest return, and lead to higher employment and
living standards. The alternative of spreading limited
resources too thinly will yield less positive results.
INTRODUCTION
Infrastructure for an Island Population of 8 Million
11
“An advanced competitive economy requires
first-class infrastructure, which will deliver
efficient and integrated transport systems, high
quality technical connectivity, including
broadband, cost effective energy, sustainable
environmental solutions and an attractive
quality of life for its people.”
Key Recommendations1. Concentrate on improving the competitiveness of the
eight City Regions.
2. Plan for greater urbanisation and an increase in the
population density in cities by one-third by 2030.
3. Develop the Dublin–Belfast Corridor with appropriate
infrastructure investment between both cities and the
important nodal points along the Corridor.
4. Promote a South Western Corridor linking Cork,
Limerick and Galway.
2.1 IntroductionInfrastructure is a uniquely human requirement. From
transport systems to water treatment, from specialist
facilities to modern energy and communications networks,
infrastructure helps to enhance the quality of human life by
supporting economic productivity, improving health and
wellbeing, protecting our environment and providing
opportunities and venues for social engagement and
enjoyment. In this sense, infrastructure requirements are
driven by people and communities whose needs support the
economic case for investment.
In assessing optimal future infrastructure requirements,
therefore, it is important first to understand the potential
future size of the population and its settlement patterns
across the island. This report takes as its formative
assumption a population of eight million on the island of
Ireland. The purpose of this chapter is to assess the likely
settlement pattern of this population and the growing
importance of cities and their hinterland (together referred
to as the ‘City Region’ in this report) to future sustainable
growth and prosperity.
2.2 Urbanisation and Increasing UrbanDensity – International TrendsAcross the developed world, more and more people are
moving to cities. The urbanisation trend and the increasing
density in cities are driven by a desire for higher living
standards, proximity to employment opportunities, access
to a wide range of services, better infrastructure and social
and cultural needs. At the same time, successful cities are
becoming more densely populated, rather than responding
to growth with excessive physical sprawl. Today, 79% of the
population of the US and 74% of the population of the EU
live in urban areas. By contrast, on the island of Ireland,
currently less than 66% of people live in urban areas
(defined in this report as settlements with populations
greater than 1,500 people) but the trend towards increased
urbanisation is evident here also. By 2030, it is likely that
levels of urbanisation in Ireland will be comparable to the
current average in the EU and that the development of our
cities and connections to their natural hinterlands will be an
important feature of this development.
2.3 Role of Cities in DrivingInternational Competitiveness Cities are increasingly seen as the drivers of national
competitiveness and of economic and social development.
Across the world cities are focusing on improving their
positions in a global league table. They play an increasingly
crucial role in the development of national competitiveness
in modern knowledge-based economies.
As cities on this island contend for high value-added mobile
business and talent, then the infrastructure needs to be on par
with, if not better than, competitors, all other things being
equal. Given that there are not infinite resources, investment
in our cities’ economic and social infrastructure must be
prioritised to maximise returns for the region as a whole.
CITY REGIONS
Irish Academy of Engineering and Engineers Ireland
12
Chapter 2
CITY REGIONS
6 National Competitiveness Council/Forfás, Our Cities: Drivers of National Competitiveness, April 2009.
The National Spatial Strategy (NSS) in Ireland (ROI) and the
Regional Development Strategy (RDS) in Northern Ireland
(NI) set out the spatial plans for the respective jurisdictions
over the next 20 years. They identify the key growth centres
and articulate the significance of cities in raising living
standards and securing the future prosperity of the regions.
The recent National Competitiveness Council/Forfás report6
identifies the key elements of successful cities as enterprise,
connectivity, sustainability, and attractiveness and
inclusiveness – achieving all these has significant
implications for infrastructure investment.
2.4 Infrastructure Planning – CityRegionsInfrastructure planning in City Regions and the provision of
efficient, cost-effective services require a clear understanding
of what is operationally and financially sustainable in
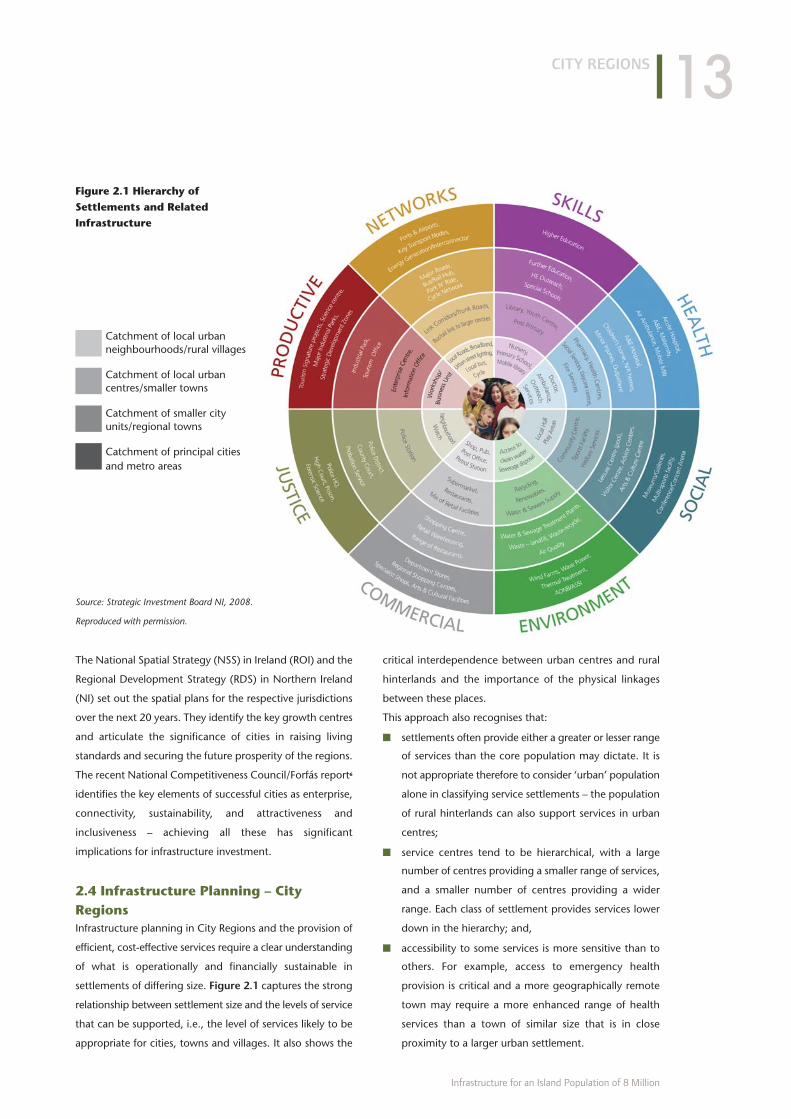
settlements of differing size. Figure 2.1 captures the strong
relationship between settlement size and the levels of service
that can be supported, i.e., the level of services likely to be
appropriate for cities, towns and villages. It also shows the
critical interdependence between urban centres and rural
hinterlands and the importance of the physical linkages
between these places.
This approach also recognises that:
■ settlements often provide either a greater or lesser range
of services than the core population may dictate. It is
not appropriate therefore to consider ‘urban’ population
alone in classifying service settlements – the population
of rural hinterlands can also support services in urban
centres;
■ service centres tend to be hierarchical, with a large
number of centres providing a smaller range of services,
and a smaller number of centres providing a wider
range. Each class of settlement provides services lower
down in the hierarchy; and,
■ accessibility to some services is more sensitive than to
others. For example, access to emergency health
provision is critical and a more geographically remote
town may require a more enhanced range of health
services than a town of similar size that is in close
proximity to a larger urban settlement.
CITY REGIONS
Infrastructure for an Island Population of 8 Million
13
Figure 2.1 Hierarchy of
Settlements and Related
Infrastructure
Catchment of local urbanneighbourhoods/rural villages
Catchment of local urbancentres/smaller towns
Catchment of smaller cityunits/regional towns
Catchment of principal cities and metro areas
Source: Strategic Investment Board NI, 2008.
Reproduced with permission.
City level functions are represented on the outer tier of the
wheel. These functions need a critical mass of population to
be functionally and operationally sustainable – and thus
draw on and serve the entire City Region population. At the
other end of the scale, quality local neighbourhoods –
whether in rural villages or in city neighbourhoods – are
important to sustain a high quality environment with access
to local services, whilst comprising an essential component
of the coherent City Region.
In planning successful City Regions, therefore, it will be
important to nurture the linkages between urban and rural
areas – between the local and the region-wide – recognising
the inter-dependencies of both. Rural areas and rural
dwellers form a vital part of successful City Regions.
2.5 Advantages of High DensityUrban density is an important aspect of a competitive
economy. The Annual Competitiveness Report 2008 for
Ireland recommends that “sustainable patterns of urban
development should be promoted, particularly, higher
residential densities in locations which are, or will be, served by
public transport”.
A more concentrated population increases the range of
economic, social, and cultural services available and creates
economies of scale, which reduces the cost of provision.
Advantages include:
■ cost savings in land, infrastructure and energy;
■ reduced economic cost of time spent travelling;
■ reduced cost of doing business in the public and private
sectors;
■ increase in the operational financial sustainability of
specialist services like tertiary hospital services, retail
offerings and visitor attractions;
■ concentration of knowledge and innovative activity in
the core of the city, thus supporting specialisation in
skills and markets;
■ provision of public spaces and amenities within walking
distance;
■ potential for reduced air emissions by increased use of
public transport and district heating;
■ sustainable living environment and promotion of social
connectedness; and,
■ encouragement of greater physical activity with
consequent health benefits.
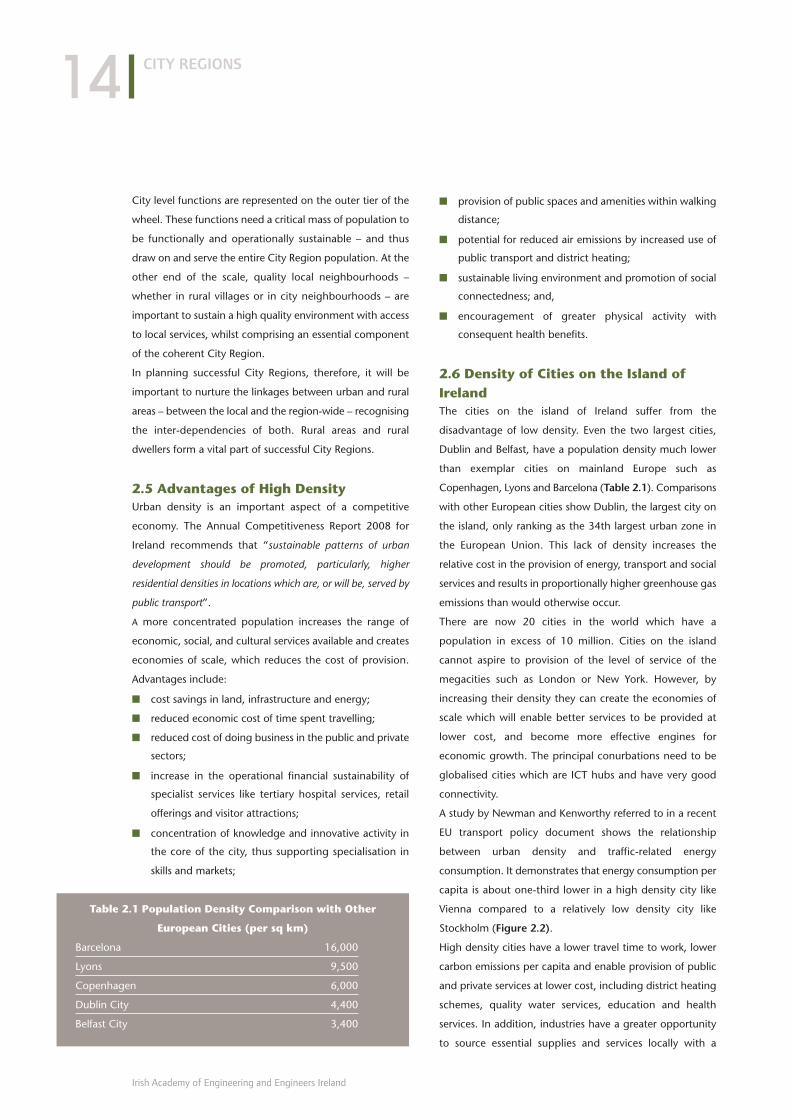
2.6 Density of Cities on the Island ofIrelandThe cities on the island of Ireland suffer from the
disadvantage of low density. Even the two largest cities,
Dublin and Belfast, have a population density much lower
than exemplar cities on mainland Europe such as
Copenhagen, Lyons and Barcelona (Table 2.1). Comparisons
with other European cities show Dublin, the largest city on
the island, only ranking as the 34th largest urban zone in
the European Union. This lack of density increases the
relative cost in the provision of energy, transport and social
services and results in proportionally higher greenhouse gas
emissions than would otherwise occur.
There are now 20 cities in the world which have a
population in excess of 10 million. Cities on the island
cannot aspire to provision of the level of service of the
megacities such as London or New York. However, by
increasing their density they can create the economies of
scale which will enable better services to be provided at
lower cost, and become more effective engines for
economic growth. The principal conurbations need to be
globalised cities which are ICT hubs and have very good
connectivity.
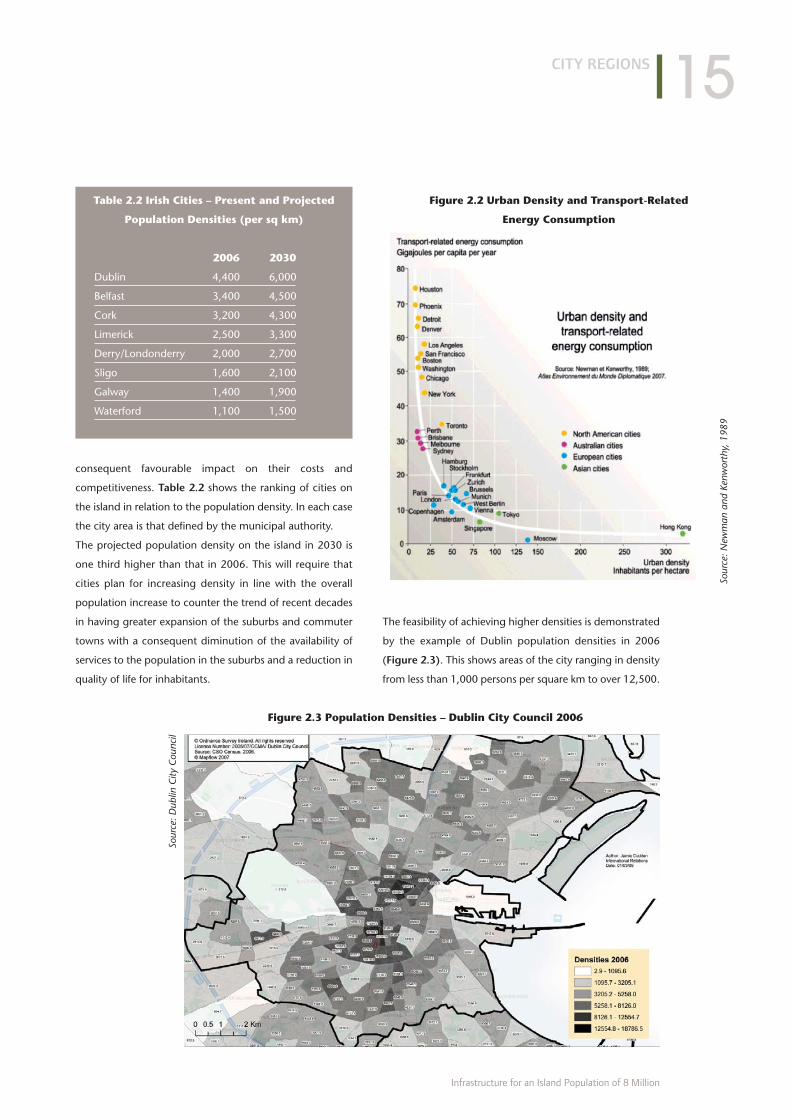
A study by Newman and Kenworthy referred to in a recent
EU transport policy document shows the relationship
between urban density and traffic-related energy
consumption. It demonstrates that energy consumption per
capita is about one-third lower in a high density city like
Vienna compared to a relatively low density city like
Stockholm (Figure 2.2).
High density cities have a lower travel time to work, lower
carbon emissions per capita and enable provision of public
and private services at lower cost, including district heating
schemes, quality water services, education and health
services. In addition, industries have a greater opportunity
to source essential supplies and services locally with a
CITY REGIONS
Irish Academy of Engineering and Engineers Ireland
14
Table 2.1 Population Density Comparison with Other
European Cities (per sq km)
Barcelona 16,000
Lyons 9,500
Copenhagen 6,000
Dublin City 4,400
Belfast City 3,400
consequent favourable impact on their costs and
competitiveness. Table 2.2 shows the ranking of cities on
the island in relation to the population density. In each case
the city area is that defined by the municipal authority.
The projected population density on the island in 2030 is
one third higher than that in 2006. This will require that
cities plan for increasing density in line with the overall
population increase to counter the trend of recent decades
in having greater expansion of the suburbs and commuter
towns with a consequent diminution of the availability of
services to the population in the suburbs and a reduction in
quality of life for inhabitants.
The feasibility of achieving higher densities is demonstrated
by the example of Dublin population densities in 2006
(Figure 2.3). This shows areas of the city ranging in density
from less than 1,000 persons per square km to over 12,500.
CITY REGIONS
Infrastructure for an Island Population of 8 Million
15
Table 2.2 Irish Cities – Present and Projected
Population Densities (per sq km)
2006 2030
Dublin 4,400 6,000
Belfast 3,400 4,500
Cork 3,200 4,300
Limerick 2,500 3,300
Derry/Londonderry 2,000 2,700
Sligo 1,600 2,100
Galway 1,400 1,900
Waterford 1,100 1,500
Figure 2.2 Urban Density and Transport-Related
Energy Consumption
Figure 2.3 Population Densities – Dublin City Council 2006So
urce
: New
man
and
Ken
wor
thy,
198
9
Sour
ce: D
ublin
City
Cou
ncil
CITY REGIONS
Irish Academy of Engineering and Engineers Ireland
16
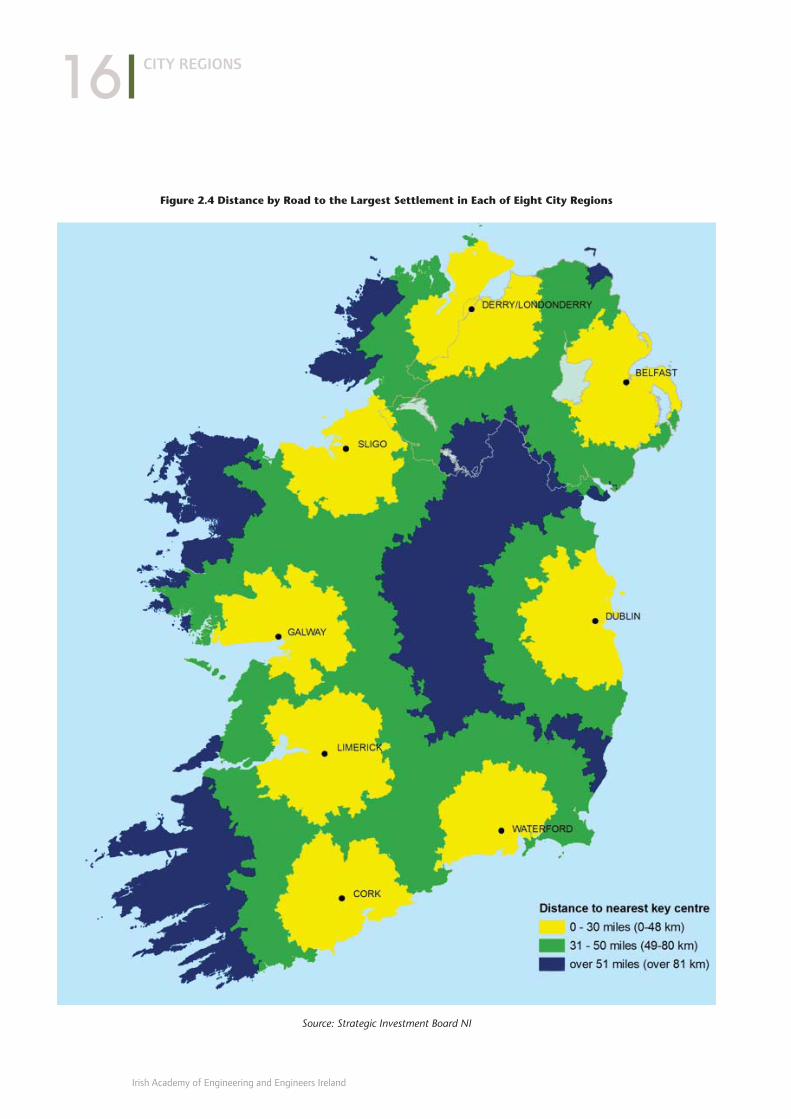
Figure 2.4 Distance by Road to the Largest Settlement in Each of Eight City Regions
Source: Strategic Investment Board NI
2.7 Urbanisation in City RegionsThe distribution of population on the island is likely to
become more concentrated along key transport corridors
and in the catchment areas around the main cities shown
in (Figure 2.4). Each of these cities has a substantial
population catchment based on its location and the area of
the island it serves. These centres will continue to grow and
increase in density over the years ahead, and each city
region will become more urbanised, as shown in Table 2.3.
When the distribution of an increased population of eight
million is estimated on a pro rata basis, taking into account
the relative increases in the eight cities and their catchments
over the past decade, the results reveal that the eight City
Regions will accommodate over 90% of the population in
2030 (living in urban and rural settlements) (Table 2.4) with
a wide variation in the degree of urbanisation in the
catchment areas of the principal cities. The eight City
Regions are Dublin, Belfast, Cork, Limerick, Galway,
Waterford, Derry/Londonderry and Sligo and they are based
on areas with a 65km radius centred on each city. Priority
should be given to the provision of infrastructure in these
City Regions. In addition to the eight cities above, the
Midlands Gateway and the Newry–Dundalk ‘Twin City’ also
play important regional roles and will continue to do so
going forward. Newry–Dundalk is an important node on the
Dublin–Belfast economic corridor, strategically placed and
well connected to both cities.
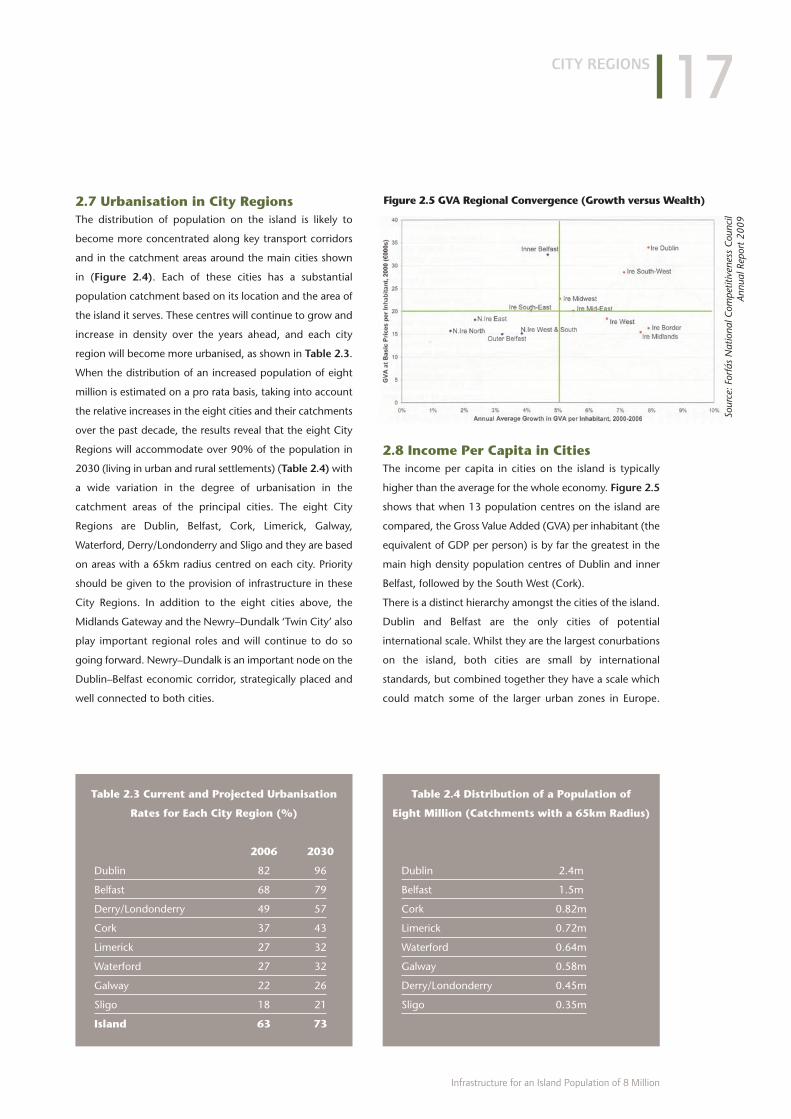
2.8 Income Per Capita in CitiesThe income per capita in cities on the island is typically
higher than the average for the whole economy. Figure 2.5
shows that when 13 population centres on the island are
compared, the Gross Value Added (GVA) per inhabitant (the
equivalent of GDP per person) is by far the greatest in the
main high density population centres of Dublin and inner
Belfast, followed by the South West (Cork).
There is a distinct hierarchy amongst the cities of the island.
Dublin and Belfast are the only cities of potential
international scale. Whilst they are the largest conurbations
on the island, both cities are small by international
standards, but combined together they have a scale which
could match some of the larger urban zones in Europe.
CITY REGIONS
Infrastructure for an Island Population of 8 Million
17
Table 2.3 Current and Projected Urbanisation
Rates for Each City Region (%)
2006 2030
Dublin 82 96
Belfast 68 79
Derry/Londonderry 49 57
Cork 37 43
Limerick 27 32
Waterford 27 32
Galway 22 26
Sligo 18 21
Island 63 73
Table 2.4 Distribution of a Population of
Eight Million (Catchments with a 65km Radius)
Dublin 2.4m
Belfast 1.5m
Cork 0.82m
Limerick 0.72m
Waterford 0.64m
Galway 0.58m
Derry/Londonderry 0.45m
Sligo 0.35m
Figure 2.5 GVA Regional Convergence (Growth versus Wealth)
Sour
ce: F
orfá
s N
atio
nal C
ompe
titiv
enes
s C
ounc
ilAn
nual
Rep
ort
2009

A recent Forfás report states the need to support all cities in
Ireland, but it recognises the distinct role of Dublin as the
key driver of national competitiveness.7 A report on the
future of Belfast recommends that “government should start
with the big places” and that “the Assembly should support
Belfast more as the largest city. It should focus upon
competitiveness as well as social cohesion”.8
Improving the connectivity between Belfast and Dublin
offers the opportunity to develop a corridor of very high
added value per person which can drive the more rapid
economic development of the whole island.
2.9 The Dublin–Belfast CorridorHalf the population of the island will be located in the
Dublin–Belfast Corridor including the Newry–Dundalk
gateway, with a population density five times greater than
the rest of the island. Figure 2.6 shows this eastern
concentration in the form of night-time electric light
emissions as captured by a satellite image.
The population of the Corridor is comparable to that of
larger urban zones such as Hamburg and Milan which rank
in the top ten urban zones in Europe. The challenge is to
create on the island a conurbation which can match in
competitiveness these highly developed centres, and
overcome the distance between the cities to the greatest
extent possible. Economies of scale can enable the Corridor
to become a more powerful magnet, comparable to
European Urban Zones having a population of four million
or more, for foreign direct investment, particularly in
advanced manufacturing and high added-value business
services such as software, international shared services
centres and financial and professional services.
An effective corridor will have strong interconnectivity
through fast and frequent transport services including top
quality air connectivity and access to ports. It will foster
linkages between businesses and have world-class
broadband communications and close liaison between
universities and industry, as well as well developed
education, health, and cultural services. It will also generate
higher incomes per capita. Development of such a corridor
will allow effective competition with other European urban
zones and add substantially to jobs and living standards on
the whole island.
Some international examples of economic corridors
include:
■ Frankfurt–Cologne;
■ Washington–Baltimore;
■ Glasgow–Edinburgh; and,
■ Vancouver–Seattle.
There is a unique opportunity to implement a vision of a
conurbation corridor which will have much greater
economies of scale than can be achieved by each city
operating separately.
CITY REGIONS
Irish Academy of Engineering and Engineers Ireland
18
7 Forfás/National Competitiveness Council, Our Cities, Drivers of National Competitiveness, 2009.
8 Where is Belfast Going? Professor Michael Parkinson, Liverpool John Moores University, July 2007.
Figure 2.6 Ireland – Satellite Image of Night-Time Electric Light
Emissions in 2000 (European Space Agency)

2.10 The South Western CorridorAbout one-quarter of the population of the island will be
located along a south western arc comprising Cork, Limerick
and Galway. The density of population along the arc is about
half that of the Dublin–Belfast Corridor, but considerably
greater than in the rest of the island. Here too, economies
of scale can be developed by a similar enhancement of
interconnectivity between the three cities including high-
speed transport services, broadband and access to ports and
airports.
The South Western Corridor has a leadership role on the
island in many sectors including the pharmaceutical and
biomedical sectors, agriculture and forestry and deepwater
ports. It has well developed fourth level education and
research and development resources, and has the second
highest income per capita on the island after the
Dublin–Belfast Corridor. The development of strong two-way
linkages between the two corridors will be of benefit to both.
2.11 SummaryThe emergence of increased urbanisation and greater
population density in the cities will be key features of the
island economy in 2030. These characteristics will be
essential prerequisites to the development of a more
competitive island economy. Global international
competition for investment will be between cities which can
provide the range of facilities and the quality of life required
by modern industry.
The recommendations in the remaining chapters of the
report suggest an integrated set of infrastructure policies
which will support the improved competitiveness and
dynamism of the island economy within the global economy.
CITY REGIONS
Infrastructure for an Island Population of 8 Million
19
“Half the population of the island will be
located in the Dublin–Belfast Corridor including
the Newry–Dundalk gateway, with a
population density five times greater than
the rest of the island.”
Key Recommendations1. Improve transport connections, including a high speed,
high frequency intercity rail system, between the cities
of Dublin and Belfast.
2. Develop a second transport corridor along the South
Western Corridor between Cork, Limerick and Galway.
3. Improve the motorway network to meet the projected
increased traffic flows between the eight principal cities
and links to ports and airports.
4. Determine the complementary role of road and rail
when planning to improve traffic flows between the
main centres.
5. Make capacity available in Dublin Port by relocating the
Oil Zone to a new dedicated port with pipelines to
supply aviation fuel directly to Dublin Airport
6. Develop Dublin Airport, complemented by Belfast
International, as a major international hub to improve
worldwide connectivity for business on the island.
3.1 IntroductionThe quality of transport infrastructure determines the ease
with which people can interact within City Regions and
between cities, and is a key consideration in determining the
competitiveness aspect of any location. Travel to work times
affect quality of life and have a significant impact on where
people choose to live. High density cities make feasible the
provision of public transport systems which use less energy
and emit less greenhouse gases (GHGs).
High quality rail and road connections reduce travel times
and stimulate business and social interaction. They
contribute to the achievement of economies of scale where
the strengths of cities can be combined and greater synergy
can be achieved than would be possible by cities operating
separately. They also enable a greater number of people to
access specialist services. Short journey times are particularly
important in the highly populated corridors such as those
between Dublin and Belfast, which will account for half the
population of the island, and the South Western Corridor
from Cork to Galway, which will account for a further
quarter.
3.2 Roads
3.2.1 Introduction
It is envisaged that roads will remain the primary transport
infrastructure up to 2030. The road network must therefore
be developed to ensure freely flowing traffic to meet
appropriate international standards for the level of service
to users.
Estimates of traffic volumes in 2030 take into account
historical experience of the annual growth of traffic volumes,
population growth and expected trends in car ownership
per capita.
Motorway or dual carriageway links will be required
between the cities. Forecast traffic volumes will be used to
determine the road classifications including the number of
lanes, and whether motorway status will be required to
provide a defined level of service to users.
3.2.2 Traffic Volumes
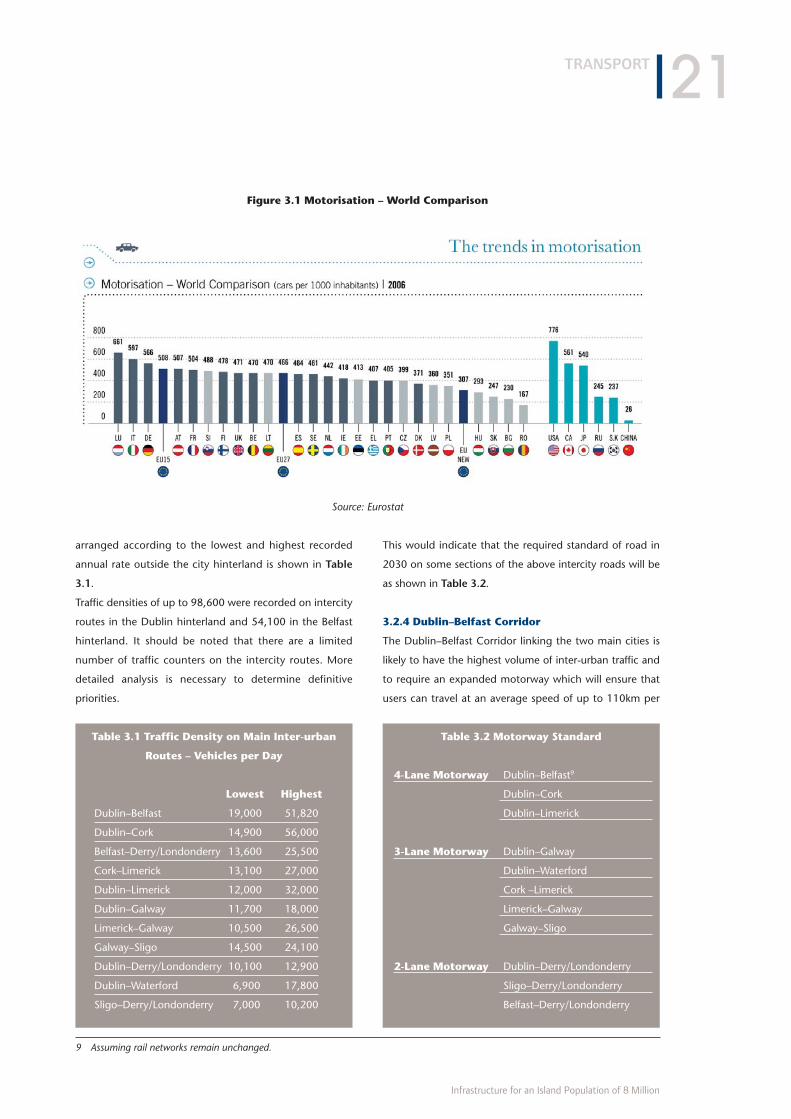
Car ownership in the Ireland and Northern Ireland is about
20% and 12%, respectively, below the average for Western
Europe and Great Britain. Figure 3.1 shows car density in
Europe in 2006.
3.2.3 Car Density in 2006
It is assumed that the annual rate of increase in road traffic
over the period to 2030 will be 3% in Ireland and 1.5% in
Northern Ireland (in line with projections of the TEMPRO
traffic prediction model used in NI) when growth resumes
at a rate to achieve a population of eight million on the
island after the current recession.
The traffic in 2006/2007 on the main inter-urban routes
TRANSPORT
Irish Academy of Engineering and Engineers Ireland
20
Chapter 3
TRANSPORT
arranged according to the lowest and highest recorded
annual rate outside the city hinterland is shown in Table
3.1.
Traffic densities of up to 98,600 were recorded on intercity
routes in the Dublin hinterland and 54,100 in the Belfast
hinterland. It should be noted that there are a limited
number of traffic counters on the intercity routes. More
detailed analysis is necessary to determine definitive
priorities.
This would indicate that the required standard of road in
2030 on some sections of the above intercity roads will be
as shown in Table 3.2.
3.2.4 Dublin–Belfast Corridor
The Dublin–Belfast Corridor linking the two main cities is
likely to have the highest volume of inter-urban traffic and
to require an expanded motorway which will ensure that
users can travel at an average speed of up to 110km per
TRANSPORT
Infrastructure for an Island Population of 8 Million
21
Figure 3.1 Motorisation – World Comparison
Source: Eurostat
Table 3.2 Motorway Standard
4-Lane Motorway Dublin–Belfast9
Dublin–Cork
Dublin–Limerick
3-Lane Motorway Dublin–Galway
Dublin–Waterford
Cork –Limerick
Limerick–Galway
Galway–Sligo
2-Lane Motorway Dublin–Derry/Londonderry
Sligo–Derry/Londonderry
Belfast–Derry/Londonderry
Table 3.1 Traffic Density on Main Inter-urban
Routes – Vehicles per Day
Lowest Highest
Dublin–Belfast 19,000 51,820
Dublin–Cork 14,900 56,000
Belfast–Derry/Londonderry 13,600 25,500
Cork–Limerick 13,100 27,000
Dublin–Limerick 12,000 32,000
Dublin–Galway 11,700 18,000
Limerick–Galway 10,500 26,500
Galway–Sligo 14,500 24,100
Dublin–Derry/Londonderry 10,100 12,900
Dublin–Waterford 6,900 17,800
Sligo–Derry/Londonderry 7,000 10,200
9 Assuming rail networks remain unchanged.
hour. The quality of the road corridor will be a key factor in
increasing trading and business interaction between the two
cities and will enable maximum advantage to be taken of
the potential for specialisation of services based on their
respective strengths. Improving transport connections
between the two cities will contribute to the creation of an
island conglomeration which can compete more effectively
with similar international agglomerations such as the
Glasgow–Edinburgh nexus.
The Dublin–Belfast Corridor has the busiest inter-city road
on the island followed by the Dublin-Portlaoise road which
serves both Cork and Limerick. Table 3.3 shows average
annual traffic density on the Dublin–Belfast Corridor at a
number of traffic counters in 2007 and indicative volumes
for 2030. It should be noted that the indicative figures for
2030 are likely to be delayed by the period required for
recovery from the current recession. They also assume that
rail transport will maintain the same percentage of total land
traffic as at present.
The figures indicate that a four-lane motorway will be
necessary for about two thirds of the distance,10 and that
rail traffic will maintain the same proportion of land traffic
as at present. Should there be a significant increase in rail
traffic it may be possible to reduce the need for a fourth
motorway lane until a future date. On the other hand, if the
speed and frequency of the rail service is not improved the
requirement to build a fourth lane will occur earlier.
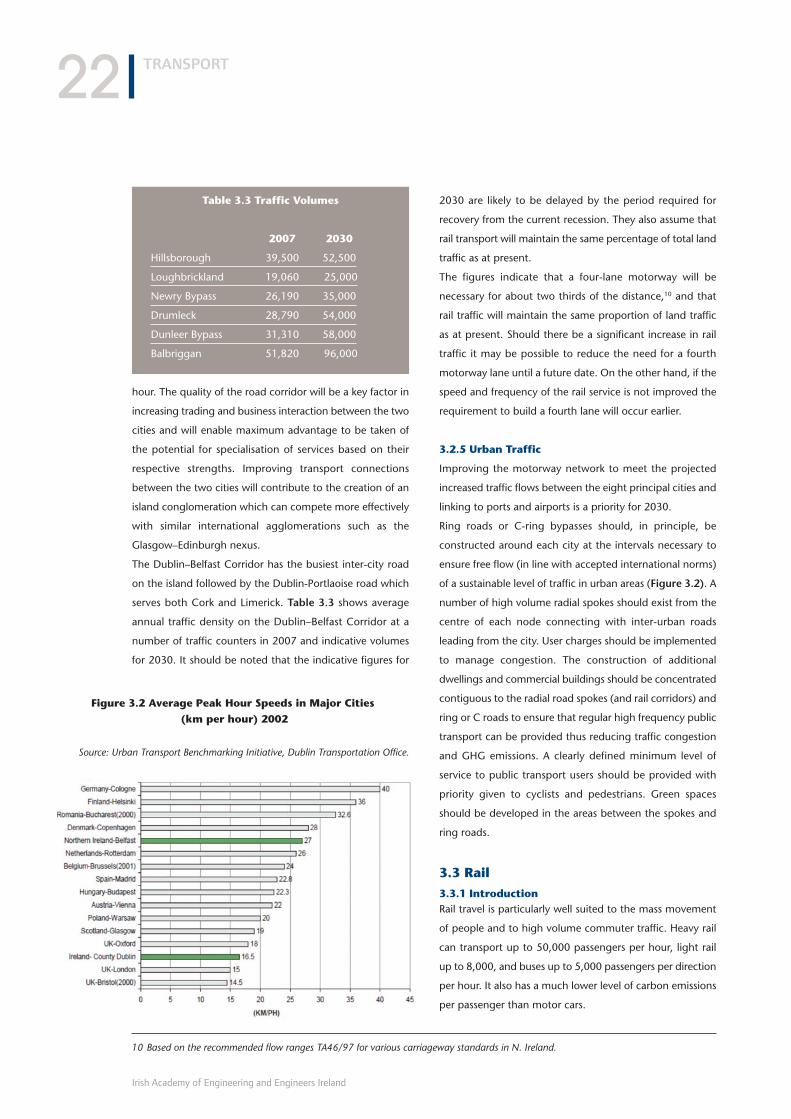
3.2.5 Urban Traffic
Improving the motorway network to meet the projected
increased traffic flows between the eight principal cities and
linking to ports and airports is a priority for 2030.
Ring roads or C-ring bypasses should, in principle, be
constructed around each city at the intervals necessary to
ensure free flow (in line with accepted international norms)
of a sustainable level of traffic in urban areas (Figure 3.2). A
number of high volume radial spokes should exist from the
centre of each node connecting with inter-urban roads
leading from the city. User charges should be implemented
to manage congestion. The construction of additional
dwellings and commercial buildings should be concentrated
contiguous to the radial road spokes (and rail corridors) and
ring or C roads to ensure that regular high frequency public
transport can be provided thus reducing traffic congestion
and GHG emissions. A clearly defined minimum level of
service to public transport users should be provided with
priority given to cyclists and pedestrians. Green spaces
should be developed in the areas between the spokes and
ring roads.
3.3 Rail
3.3.1 IntroductionRail travel is particularly well suited to the mass movement
of people and to high volume commuter traffic. Heavy rail
can transport up to 50,000 passengers per hour, light rail
up to 8,000, and buses up to 5,000 passengers per direction
per hour. It also has a much lower level of carbon emissions
per passenger than motor cars.
TRANSPORT
Irish Academy of Engineering and Engineers Ireland
22
Table 3.3 Traffic Volumes
2007 2030
Hillsborough 39,500 52,500
Loughbrickland 19,060 25,000
Newry Bypass 26,190 35,000
Drumleck 28,790 54,000
Dunleer Bypass 31,310 58,000
Balbriggan 51,820 96,000
Figure 3.2 Average Peak Hour Speeds in Major Cities
(km per hour) 2002
Source: Urban Transport Benchmarking Initiative, Dublin Transportation Office.
10 Based on the recommended flow ranges TA46/97 for various carriageway standards in N. Ireland.
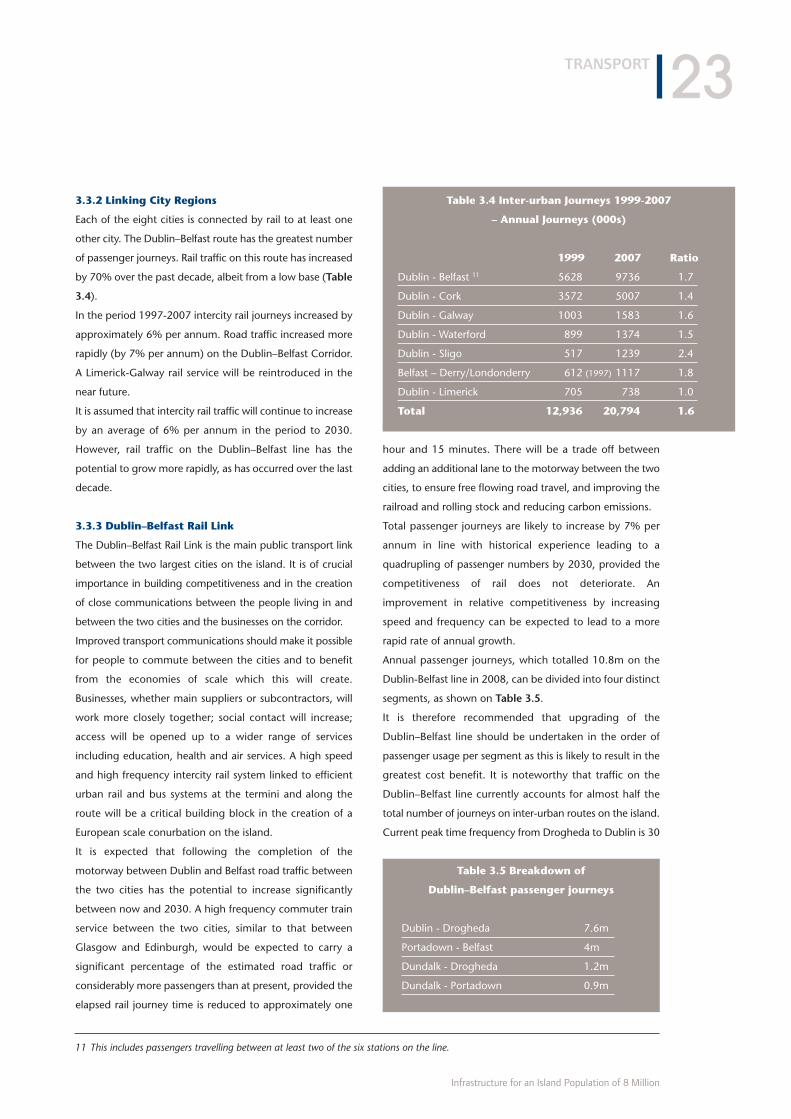
3.3.2 Linking City Regions
Each of the eight cities is connected by rail to at least one
other city. The Dublin–Belfast route has the greatest number
of passenger journeys. Rail traffic on this route has increased
by 70% over the past decade, albeit from a low base (Table
3.4).
In the period 1997-2007 intercity rail journeys increased by
approximately 6% per annum. Road traffic increased more
rapidly (by 7% per annum) on the Dublin–Belfast Corridor.
A Limerick-Galway rail service will be reintroduced in the
near future.
It is assumed that intercity rail traffic will continue to increase
by an average of 6% per annum in the period to 2030.
However, rail traffic on the Dublin–Belfast line has the
potential to grow more rapidly, as has occurred over the last
decade.
3.3.3 Dublin–Belfast Rail Link
The Dublin–Belfast Rail Link is the main public transport link
between the two largest cities on the island. It is of crucial
importance in building competitiveness and in the creation
of close communications between the people living in and
between the two cities and the businesses on the corridor.
Improved transport communications should make it possible
for people to commute between the cities and to benefit
from the economies of scale which this will create.
Businesses, whether main suppliers or subcontractors, will
work more closely together; social contact will increase;
access will be opened up to a wider range of services
including education, health and air services. A high speed
and high frequency intercity rail system linked to efficient
urban rail and bus systems at the termini and along the
route will be a critical building block in the creation of a
European scale conurbation on the island.
It is expected that following the completion of the
motorway between Dublin and Belfast road traffic between
the two cities has the potential to increase significantly
between now and 2030. A high frequency commuter train
service between the two cities, similar to that between
Glasgow and Edinburgh, would be expected to carry a
significant percentage of the estimated road traffic or
considerably more passengers than at present, provided the
elapsed rail journey time is reduced to approximately one
hour and 15 minutes. There will be a trade off between
adding an additional lane to the motorway between the two
cities, to ensure free flowing road travel, and improving the
railroad and rolling stock and reducing carbon emissions.
Total passenger journeys are likely to increase by 7% per
annum in line with historical experience leading to a
quadrupling of passenger numbers by 2030, provided the
competitiveness of rail does not deteriorate. An
improvement in relative competitiveness by increasing
speed and frequency can be expected to lead to a more
rapid rate of annual growth.
Annual passenger journeys, which totalled 10.8m on the
Dublin-Belfast line in 2008, can be divided into four distinct
segments, as shown on Table 3.5.
It is therefore recommended that upgrading of the
Dublin–Belfast line should be undertaken in the order of
passenger usage per segment as this is likely to result in the
greatest cost benefit. It is noteworthy that traffic on the
Dublin–Belfast line currently accounts for almost half the
total number of journeys on inter-urban routes on the island.
Current peak time frequency from Drogheda to Dublin is 30
TRANSPORT
Infrastructure for an Island Population of 8 Million
23
Table 3.4 Inter-urban Journeys 1999-2007
– Annual Journeys (000s)
1999 2007 Ratio
Dublin - Belfast 11 5628 9736 1.7
Dublin - Cork 3572 5007 1.4
Dublin - Galway 1003 1583 1.6
Dublin - Waterford 899 1374 1.5
Dublin - Sligo 517 1239 2.4
Belfast – Derry/Londonderry 612 (1997) 1117 1.8
Dublin - Limerick 705 738 1.0
Total 12,936 20,794 1.6
Table 3.5 Breakdown of
Dublin–Belfast passenger journeys
Dublin - Drogheda 7.6m
Portadown - Belfast 4m
Dundalk - Drogheda 1.2m
Dundalk - Portadown 0.9m
11 This includes passengers travelling between at least two of the six stations on the line.
minutes; and 20 minutes from Portadown to Belfast. A
continued 7% per annum increase on the Dublin-Belfast line
could lead to 39 million travelling non-stop between at least
two of the six stations of Dublin, Drogheda, Dundalk,
Newry, Portadown and Belfast, and would justify a
frequency of a train every 15 minutes.
The estimated cost of a new track alignment, to facilitate
140mph trains to reduce the journey time (Dublin-Belfast)
to 75 minutes, is approximately €2.5bn. This gross cost
would be offset to some extent by the cost of renewing the
existing track. The following are exemplar rail journey times
between linked cities:
Glasgow to Edinburgh: Combined population: 2.8m;
51 miles apart; frequency:
every 15 minutes; five stops;
travel time: 50 minutes.
Frankfurt to Cologne: Combined population: 6m; 110
miles apart; four stops; travel
time: one hour and 14 minutes.
The Dublin-Belfast rail should be the spine of the transport
corridor between the two cities and should be directly linked
to an integrated high frequency urban transport system
comprising heavy rail, light rail, and bus rapid transit to
deliver passengers seamlessly and speedily to their city
destination and to airports and ports for international
connections.
Rail passenger patronage between all the main cities has the
potential to grow significantly by 2030 provided that an
average rail speed comparable to average motor car speeds
is achieved. There is also considerable scope to develop rail
links along the South Western Corridor connecting Cork,
Limerick and Galway where road traffic is projected to
increase sharply.
Intercity services should be linked with commuter rail, light
rail and bus in a single overall timetable design with ease of
transfer between modes.
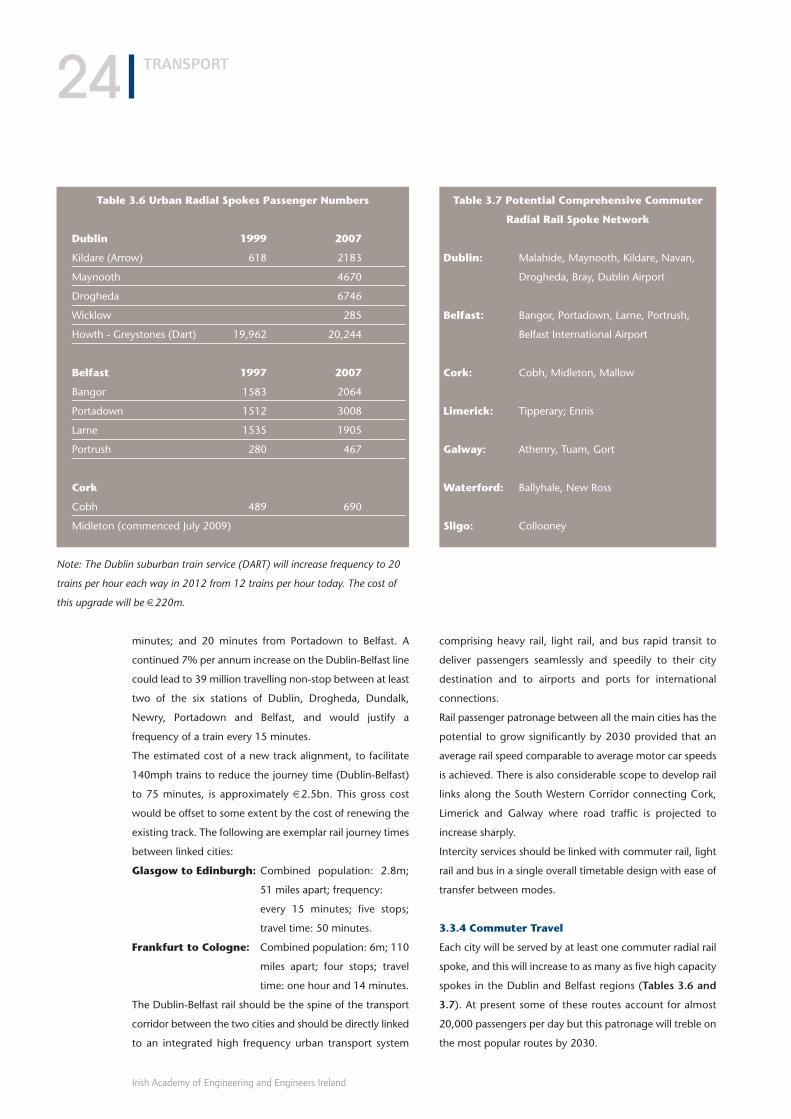
3.3.4 Commuter Travel
Each city will be served by at least one commuter radial rail
spoke, and this will increase to as many as five high capacity
spokes in the Dublin and Belfast regions (Tables 3.6 and
3.7). At present some of these routes account for almost
20,000 passengers per day but this patronage will treble on
the most popular routes by 2030.
TRANSPORT
Irish Academy of Engineering and Engineers Ireland
24
Table 3.6 Urban Radial Spokes Passenger Numbers
Dublin 1999 2007
Kildare (Arrow) 618 2183
Maynooth 4670
Drogheda 6746
Wicklow 285
Howth - Greystones (Dart) 19,962 20,244
Belfast 1997 2007
Bangor 1583 2064
Portadown 1512 3008
Larne 1535 1905
Portrush 280 467
Cork
Cobh 489 690
Midleton (commenced July 2009)
Table 3.7 Potential Comprehensive Commuter
Radial Rail Spoke Network
Dublin: Malahide, Maynooth, Kildare, Navan,
Drogheda, Bray, Dublin Airport
Belfast: Bangor, Portadown, Larne, Portrush,
Belfast International Airport
Cork: Cobh, Midleton, Mallow
Limerick: Tipperary; Ennis
Galway: Athenry, Tuam, Gort
Waterford: Ballyhale, New Ross
Sligo: Collooney
Note: The Dublin suburban train service (DART) will increase frequency to 20
trains per hour each way in 2012 from 12 trains per hour today. The cost of
this upgrade will be €220m.
An assessment of the potential for rail passenger traffic in
2030 should include the relative elapsed time to make the
journey from city centre to city centre by car and by train.
Experience on the island shows that more people will travel
by rail when rail speeds are faster than those by car. The
proportion travelling by rail was greater on the Dublin-Cork,
and Dublin-Galway routes where rail speeds were
significantly faster than average road speeds over the last
decade. The opposite was the case for the Dublin-Belfast
route where rail journey times were somewhat slower than
could be achieved by car. It is important, therefore, that all
plans to improve traffic flows between the main centres
determine the complementary role of road and rail and how
investment in the different forms of infrastructure can best
contribute to efficiencies and support each other.
3.4 Public TransportUrbanisation and higher densities will facilitate more use of
public transport as will the introduction of carbon taxes and
congestion charges. The proportion of people using public
transport to go to work is likely to double by 2030. The
average time taken to commute to work should not exceed
30 minutes as is currently the case in exemplar cities such
as Berlin, Lyons, and Barcelona.
The choice of heavy rail, light rail, bus rapid transport or
buses will be determined by potential traffic volumes. At
present all of these options are adopted but the move
towards greatest mass movements of people will stimulate
moves towards higher capacity transport modes to ensure
free flow of traffic, energy efficiency and lower carbon
emissions. In this context, it should be a requirement that
the quality of service demanded from service providers, both
state owned and private, should be given equal priority with
the quality of the public transport infrastructure.
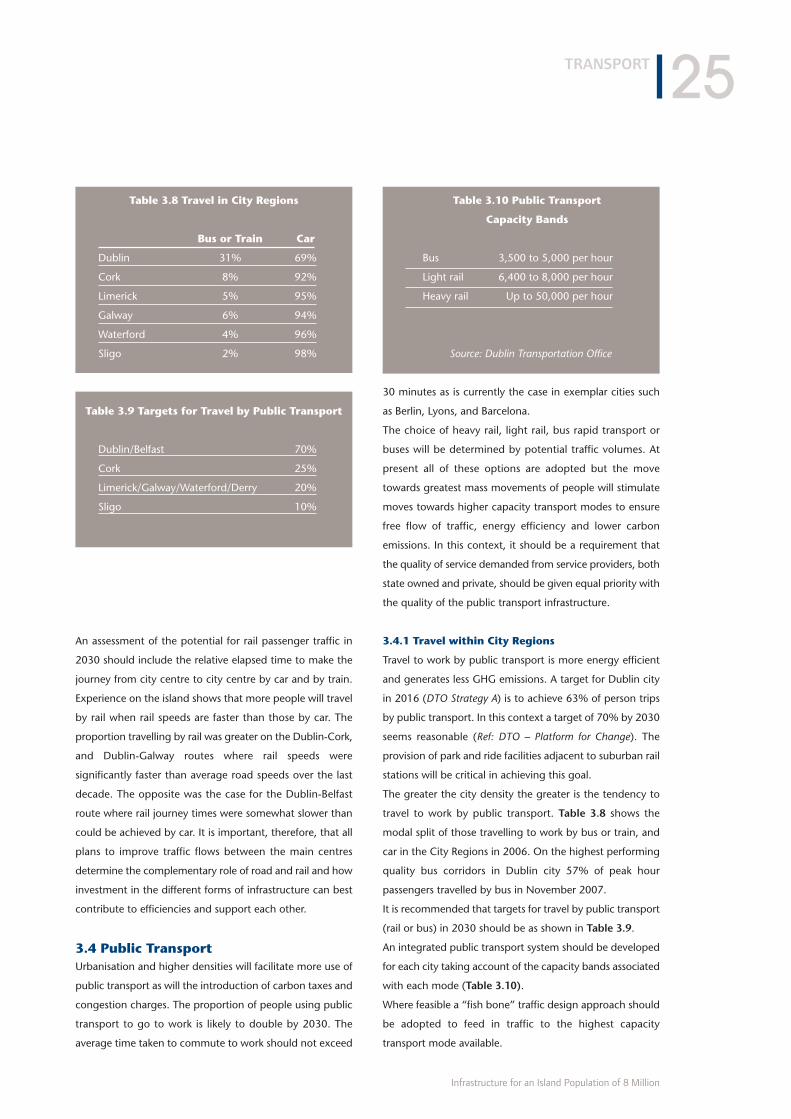
3.4.1 Travel within City Regions
Travel to work by public transport is more energy efficient
and generates less GHG emissions. A target for Dublin city
in 2016 (DTO Strategy A) is to achieve 63% of person trips
by public transport. In this context a target of 70% by 2030
seems reasonable (Ref: DTO – Platform for Change). The
provision of park and ride facilities adjacent to suburban rail
stations will be critical in achieving this goal.
The greater the city density the greater is the tendency to
travel to work by public transport. Table 3.8 shows the
modal split of those travelling to work by bus or train, and
car in the City Regions in 2006. On the highest performing
quality bus corridors in Dublin city 57% of peak hour
passengers travelled by bus in November 2007.
It is recommended that targets for travel by public transport
(rail or bus) in 2030 should be as shown in Table 3.9.
An integrated public transport system should be developed
for each city taking account of the capacity bands associated
with each mode (Table 3.10).
Where feasible a “fish bone” traffic design approach should
be adopted to feed in traffic to the highest capacity
transport mode available.
TRANSPORT
Infrastructure for an Island Population of 8 Million
25
Table 3.9 Targets for Travel by Public Transport
Dublin/Belfast 70%
Cork 25%
Limerick/Galway/Waterford/Derry 20%
Sligo 10%
Table 3.10 Public Transport
Capacity Bands
Bus 3,500 to 5,000 per hour
Light rail 6,400 to 8,000 per hour
Heavy rail Up to 50,000 per hour
Source: Dublin Transportation Office
Table 3.8 Travel in City Regions
Bus or Train Car
Dublin 31% 69%
Cork 8% 92%
Limerick 5% 95%
Galway 6% 94%
Waterford 4% 96%
Sligo 2% 98%
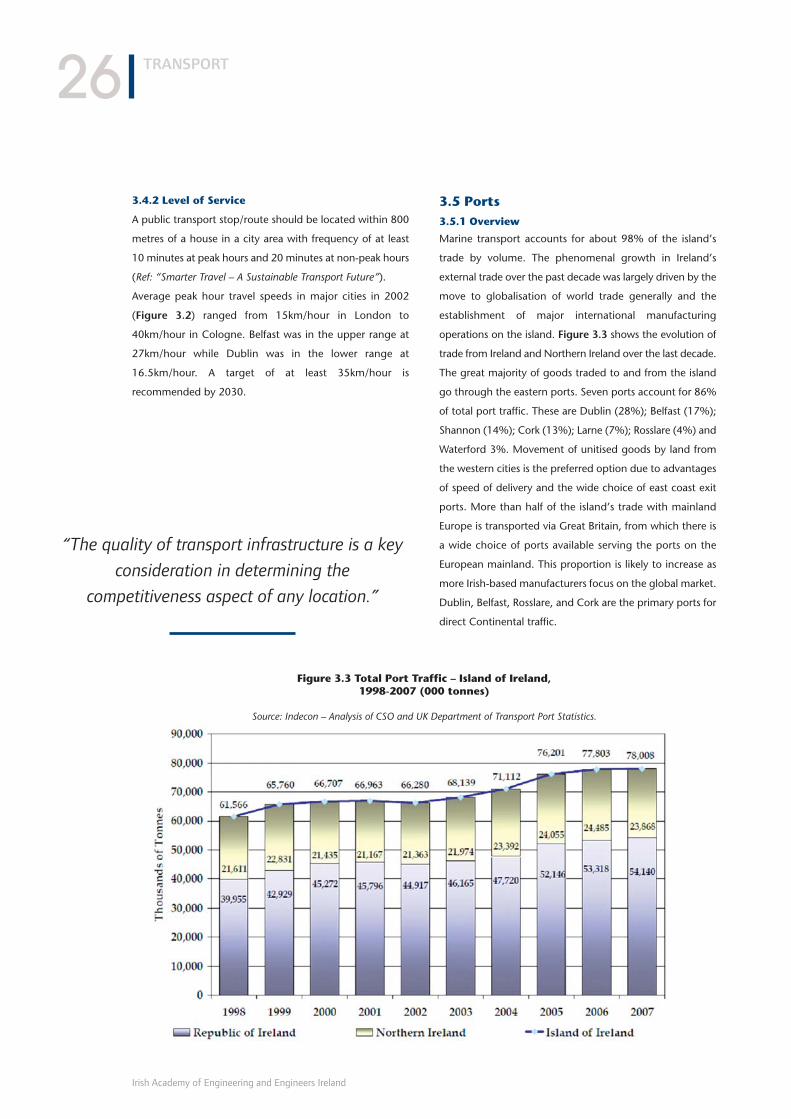
3.4.2 Level of Service
A public transport stop/route should be located within 800
metres of a house in a city area with frequency of at least
10 minutes at peak hours and 20 minutes at non-peak hours
(Ref: “Smarter Travel – A Sustainable Transport Future”).
Average peak hour travel speeds in major cities in 2002
(Figure 3.2) ranged from 15km/hour in London to
40km/hour in Cologne. Belfast was in the upper range at
27km/hour while Dublin was in the lower range at
16.5km/hour. A target of at least 35km/hour is
recommended by 2030.
3.5 Ports 3.5.1 Overview
Marine transport accounts for about 98% of the island’s
trade by volume. The phenomenal growth in Ireland’s
external trade over the past decade was largely driven by the
move to globalisation of world trade generally and the
establishment of major international manufacturing
operations on the island. Figure 3.3 shows the evolution of
trade from Ireland and Northern Ireland over the last decade.
The great majority of goods traded to and from the island
go through the eastern ports. Seven ports account for 86%
of total port traffic. These are Dublin (28%); Belfast (17%);
Shannon (14%); Cork (13%); Larne (7%); Rosslare (4%) and
Waterford 3%. Movement of unitised goods by land from
the western cities is the preferred option due to advantages
of speed of delivery and the wide choice of east coast exit
ports. More than half of the island’s trade with mainland
Europe is transported via Great Britain, from which there is
a wide choice of ports available serving the ports on the
European mainland. This proportion is likely to increase as
more Irish-based manufacturers focus on the global market.
Dublin, Belfast, Rosslare, and Cork are the primary ports for
direct Continental traffic.
TRANSPORT
Irish Academy of Engineering and Engineers Ireland
26
Figure 3.3 Total Port Traffic – Island of Ireland, 1998-2007 (000 tonnes)
Source: Indecon – Analysis of CSO and UK Department of Transport Port Statistics.
“The quality of transport infrastructure is a key
consideration in determining the
competitiveness aspect of any location.”

3.5.2 Review of Trade through Main
Commercial Ports
Trade is divided into five categories as follows:
■ Ro/Ro: Unitised trade
■ Lo/Lo: Containers or trailers
■ Liquid bulk: Oil, chemicals, etc.
■ Solid bulk: Coal, ore, etc.
■ Break bulk: Timber, steel, cars/vehicles
Among the commercial ports on the island only three
(Belfast, Cork and Dublin) are multi-modal, i.e., catering for
all five categories listed above. Most of the remaining
commercial ports are single mode, i.e., either roll on, roll off
(Ro/Ro) or lift on lift off (Lo/Lo), or specialise in one or more
of the bulk modes.
3.5.3 Unitised Traffic
76% of unitised (non-bulk) traffic is transported to or via
Great Britain. RoRo is the dominant mode and is increasing
market share. The remaining 24% of traffic sent directly to
mainland Europe is currently dominated by LoLo but the
market share of direct RoRo traffic to the Continent is
increasing. RoRo is the preferred mode of transport for
unitised goods, accounting for almost 74% of this traffic.
The share of RoRo has been increasing over the last decade
and this trend is likely to continue. Four ports, Dublin (40%),
Larne (25%), Belfast (17%), and Rosslare (9%), account for
over 90% of RoRo traffic. These ports are attractive as they
offer the greatest choice of services to ports in Britain, and
from there to the European mainland.
LoLo traffic is concentrated in Dublin (42%); Belfast (16%);
Cork (11%); and, Waterford (11%), which together account
for about 80% of LoLo traffic.
3.5.4 Increased Volumes
It is estimated that the volume of goods traffic through
Dublin and Belfast ports will double by 2030. These ports
are situated at either end of a conglomeration of population
with a hinterland which will account for half of the
population of the island.
Table 3.11 reflects the estimates of current port capacity on
the island. (Ref: Dublin Port National Development Plan Study,
Indecon - July 2009).
3.5.5 Development Plans
The commercial ports are essential links in the
import/export chain that services the economy of the
island of Ireland. It is estimated that demand will exceed
existing capacity by 2025. It is therefore of critical
importance that planning difficulties do not curtail the
ability of ports to respond to the growth needs of the
island’s development.
Most of the larger commercial ports have development
plans under consideration to cater for anticipated trade
growth over the medium term. There is potential to
improve capacity utilisation of ports on the island and this
should be pursued as a priority. Unitised shipping trade is
highly sensitive to port charges and the efficiency of service
offered, i.e., port access, speed of ship turnaround and
adequate storage areas will influence the share of trade
accounted for by each port.
In addition, capacity should be made available in Dublin
Port by relocating the Oil Zone to a new dedicated port
with pipelines to supply aviation fuel directly to Dublin
Airport. This would release approximately 20ha of existing
land for alternative port use.
TRANSPORT
Infrastructure for an Island Population of 8 Million
27
Table 3.11 Port Capacity
LoLo RoRo Total
Total RoI 71ha 39.1ha 110.1ha
Total NI 17ha 33.5ha 50.5ha
Total island 88ha 72.6ha 160.6ha
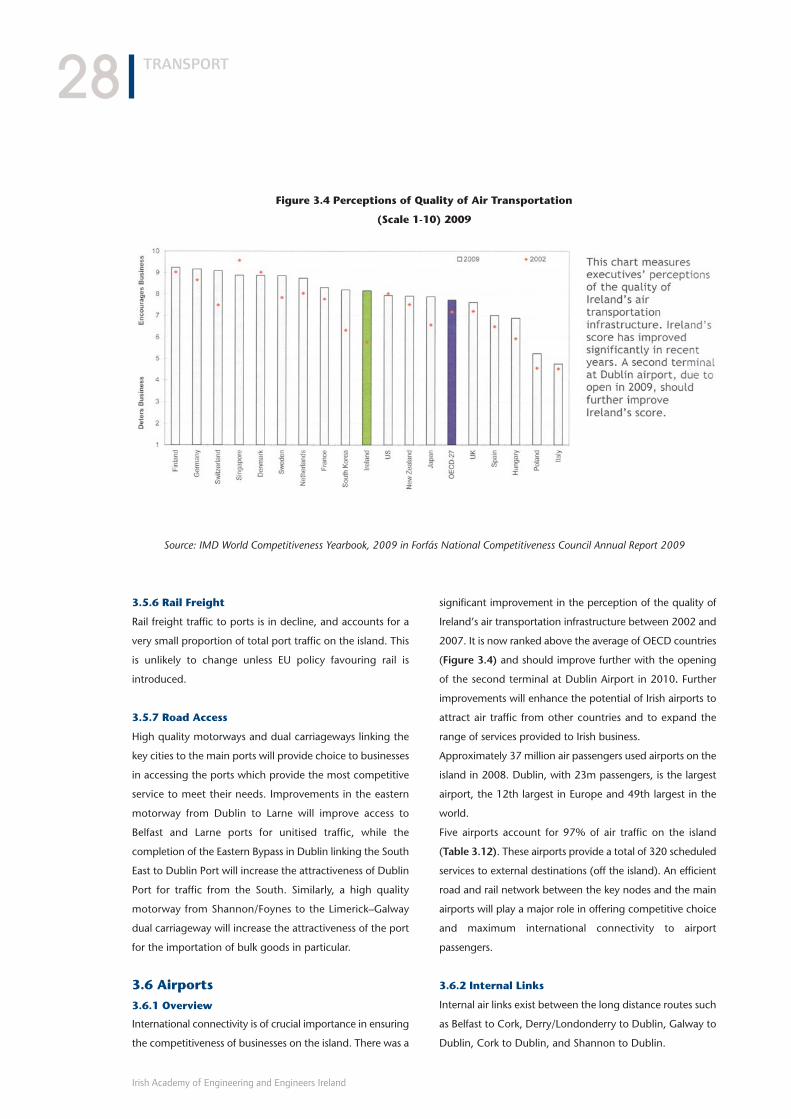
3.5.6 Rail Freight
Rail freight traffic to ports is in decline, and accounts for a
very small proportion of total port traffic on the island. This
is unlikely to change unless EU policy favouring rail is
introduced.
3.5.7 Road Access
High quality motorways and dual carriageways linking the
key cities to the main ports will provide choice to businesses
in accessing the ports which provide the most competitive
service to meet their needs. Improvements in the eastern
motorway from Dublin to Larne will improve access to
Belfast and Larne ports for unitised traffic, while the
completion of the Eastern Bypass in Dublin linking the South
East to Dublin Port will increase the attractiveness of Dublin
Port for traffic from the South. Similarly, a high quality
motorway from Shannon/Foynes to the Limerick–Galway
dual carriageway will increase the attractiveness of the port
for the importation of bulk goods in particular.
3.6 Airports
3.6.1 Overview
International connectivity is of crucial importance in ensuring
the competitiveness of businesses on the island. There was a
significant improvement in the perception of the quality of
Ireland’s air transportation infrastructure between 2002 and
2007. It is now ranked above the average of OECD countries
(Figure 3.4) and should improve further with the opening
of the second terminal at Dublin Airport in 2010. Further
improvements will enhance the potential of Irish airports to
attract air traffic from other countries and to expand the
range of services provided to Irish business.
Approximately 37 million air passengers used airports on the
island in 2008. Dublin, with 23m passengers, is the largest
airport, the 12th largest in Europe and 49th largest in the
world.
Five airports account for 97% of air traffic on the island
(Table 3.12). These airports provide a total of 320 scheduled
services to external destinations (off the island). An efficient
road and rail network between the key nodes and the main
airports will play a major role in offering competitive choice
and maximum international connectivity to airport
passengers.
3.6.2 Internal Links
Internal air links exist between the long distance routes such
as Belfast to Cork, Derry/Londonderry to Dublin, Galway to
Dublin, Cork to Dublin, and Shannon to Dublin.
TRANSPORT
Irish Academy of Engineering and Engineers Ireland
28
Figure 3.4 Perceptions of Quality of Air Transportation
(Scale 1-10) 2009
Source: IMD World Competitiveness Yearbook, 2009 in Forfás National Competitiveness Council Annual Report 2009

3.6.3 Market Share
The market share of the main airports has changed over the
last decade with Dublin Airport accounting for 62% of traffic
(Table 3.12). Air traffic through Dublin Airport has
quadrupled over the last 20 years. Traffic through Belfast
International has more than doubled.
As an international hub Dublin has scheduled services to
187 external airports, mainly to European destinations but
also to North America, the Middle East and North Africa.
This is followed by Belfast International, Cork, Shannon, and
Belfast City.
3.6.4 Increase in Traffic
Air traffic to and from the island is expected to double to
about 75m by about 2030. Of this total Dublin Airport is
expected to have a throughput of about 50m passengers;
Belfast International 9m; Belfast City 4m; Shannon 7m and
Cork 6m. A second terminal building at Dublin Airport due
to be completed in 2010 will increase capacity to 35 million
passengers. Construction of a third terminal is at the
planning stage.
The highest published target for Belfast International
envisages 12m passengers in 2030, and there is a possibility
of a rail link to the airport constructed along the mothballed
Lisburn-Antrim railway line as set out in the Belfast Airport
master plan.
The number of destinations served by scheduled services is
likely to increase substantially from the current 320. These
destinations will reflect the growing diversification of Irish
Trade in response to the increasing role of the BRIC countries
(Brazil, Russia, India and China) and the oil-producing
countries in world economic consumption. For example, 7%
of Irish exports are already sold to Asia and this percentage
is likely to increase sharply in the period to 2030 creating a
demand for direct air connections from the island to China
Japan, and India in particular. It is also possible that the
island may have an expanded role as an intermediate
fuelling destination for intercontinental flights to Asia and
the Middle East. It is important, therefore, that Dublin
Airport, complemented by Belfast International, is
developed as a major international hub to improve
worldwide connectivity for business.
3.6.5 Access to Dublin and Belfast Airports
Access to Dublin and Belfast hub airports will be by road,
rail and air. Motorway links between the key cities and these
primary airports will be of high importance. None of the
other six cities will be located more than 150 minutes from
a high frequency international airport serving an increasing
number of foreign destinations. In addition, rail links to
Dublin (including a Metro link) and Belfast International
Airports, which together will account for up to 80% of air
travel to and from the island, will ensure the efficient mass
movement of passengers between urban destinations and
reduced GHG emissions.
Opportunities for collaboration in developing high speed
surface transport links between the two main airports should
be explored.
TRANSPORT
Infrastructure for an Island Population of 8 Million
29
Table 3.12 Passenger Traffic – 2008
Airport Passenger Air TrafficNo Market Share
Dublin 22m 62%
Belfast International 5m 14%
Shannon 3m 9%
Cork 3m 9%
Belfast City 2.5m 5%
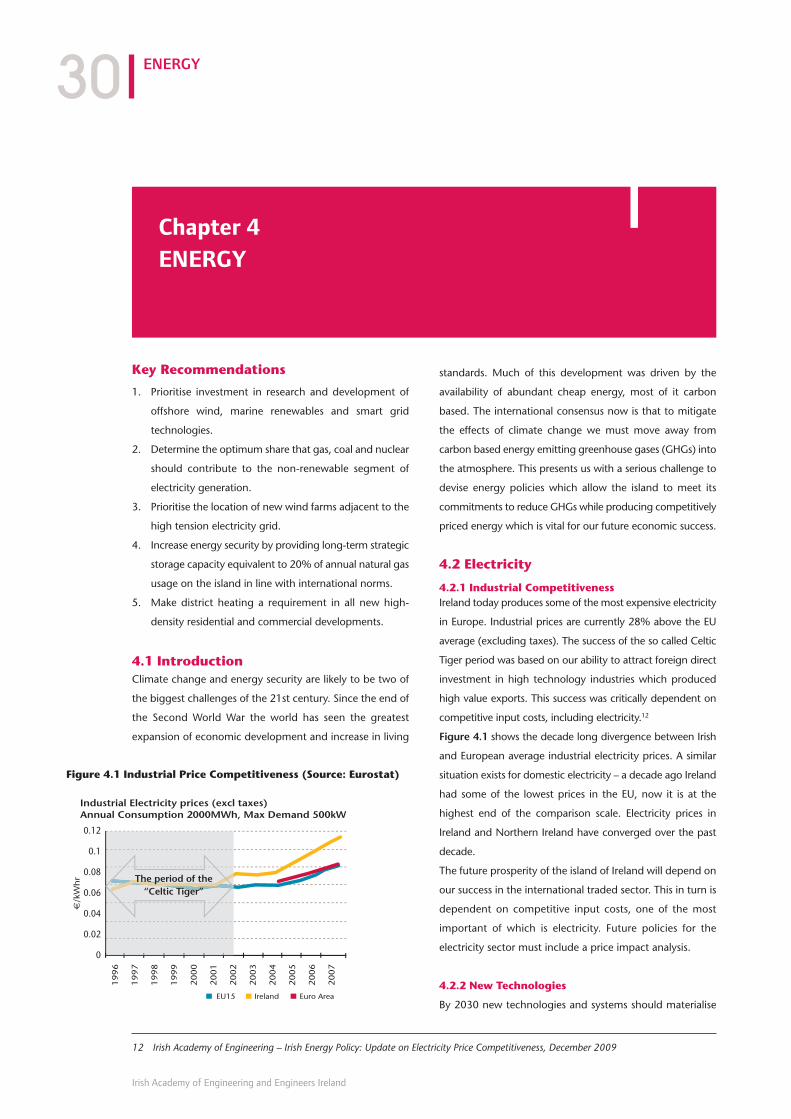
Key Recommendations
1. Prioritise investment in research and development of
offshore wind, marine renewables and smart grid
technologies.
2. Determine the optimum share that gas, coal and nuclear
should contribute to the non-renewable segment of
electricity generation.
3. Prioritise the location of new wind farms adjacent to the
high tension electricity grid.
4. Increase energy security by providing long-term strategic
storage capacity equivalent to 20% of annual natural gas
usage on the island in line with international norms.
5. Make district heating a requirement in all new high-
density residential and commercial developments.
4.1 IntroductionClimate change and energy security are likely to be two of
the biggest challenges of the 21st century. Since the end of
the Second World War the world has seen the greatest
expansion of economic development and increase in living
standards. Much of this development was driven by the
availability of abundant cheap energy, most of it carbon
based. The international consensus now is that to mitigate
the effects of climate change we must move away from
carbon based energy emitting greenhouse gases (GHGs) into
the atmosphere. This presents us with a serious challenge to
devise energy policies which allow the island to meet its
commitments to reduce GHGs while producing competitively
priced energy which is vital for our future economic success.
4.2 Electricity
4.2.1 Industrial CompetitivenessIreland today produces some of the most expensive electricity
in Europe. Industrial prices are currently 28% above the EU
average (excluding taxes). The success of the so called Celtic
Tiger period was based on our ability to attract foreign direct
investment in high technology industries which produced
high value exports. This success was critically dependent on
competitive input costs, including electricity.12
Figure 4.1 shows the decade long divergence between Irish
and European average industrial electricity prices. A similar
situation exists for domestic electricity – a decade ago Ireland
had some of the lowest prices in the EU, now it is at the
highest end of the comparison scale. Electricity prices in
Ireland and Northern Ireland have converged over the past
decade.
The future prosperity of the island of Ireland will depend on
our success in the international traded sector. This in turn is
dependent on competitive input costs, one of the most
important of which is electricity. Future policies for the
electricity sector must include a price impact analysis.
4.2.2 New Technologies
By 2030 new technologies and systems should materialise
ENERGY
Irish Academy of Engineering and Engineers Ireland
30
Chapter 4
ENERGY
0.12
0.1
0.08
0.06
0.04
0.02
0
€/k
Wh
r
EU15
Industrial Electricity prices (excl taxes)Annual Consumption 2000MWh, Max Demand 500kW
Ireland Euro Area
1996
1997
1998
1999
2000
2001
2002
2003
2004
2005
2006
2007
The period of the“Celtic Tiger”
Figure 4.1 Industrial Price Competitiveness (Source: Eurostat)
12 Irish Academy of Engineering – Irish Energy Policy: Update on Electricity Price Competitiveness, December 2009
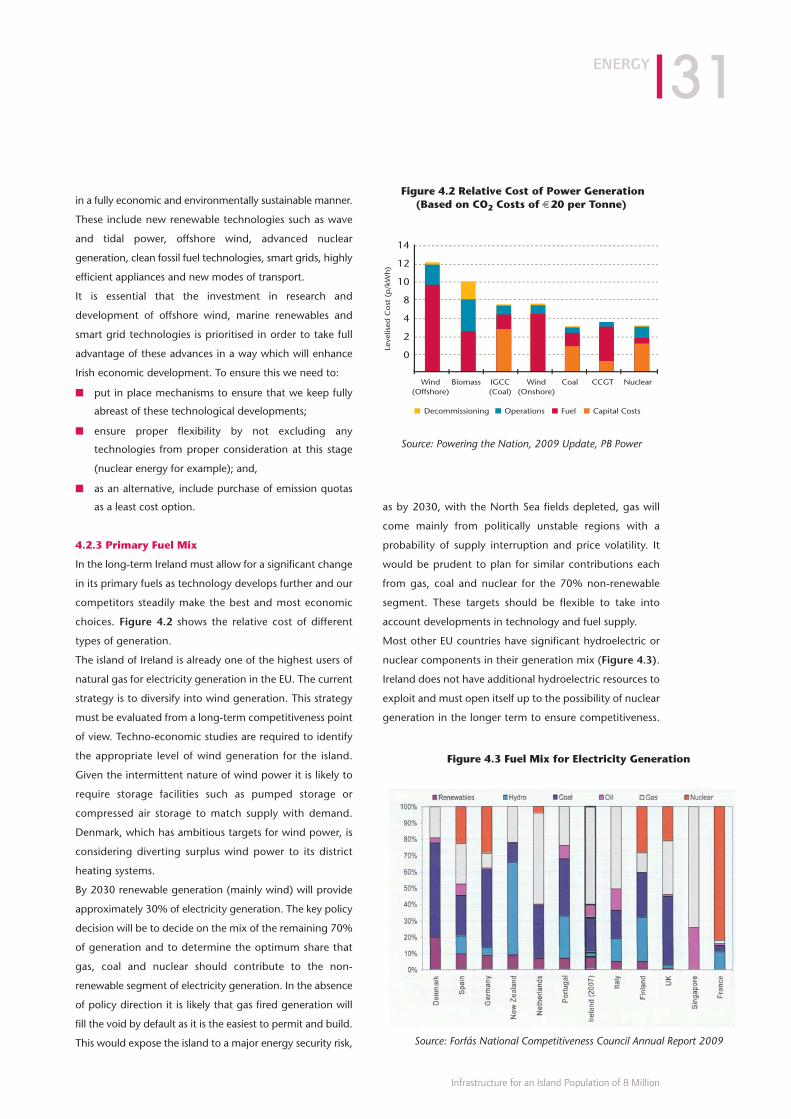
in a fully economic and environmentally sustainable manner.
These include new renewable technologies such as wave
and tidal power, offshore wind, advanced nuclear
generation, clean fossil fuel technologies, smart grids, highly
efficient appliances and new modes of transport.
It is essential that the investment in research and
development of offshore wind, marine renewables and
smart grid technologies is prioritised in order to take full
advantage of these advances in a way which will enhance
Irish economic development. To ensure this we need to:
■ put in place mechanisms to ensure that we keep fully
abreast of these technological developments;
■ ensure proper flexibility by not excluding any
technologies from proper consideration at this stage
(nuclear energy for example); and,
■ as an alternative, include purchase of emission quotas
as a least cost option.
4.2.3 Primary Fuel Mix
In the long-term Ireland must allow for a significant change
in its primary fuels as technology develops further and our
competitors steadily make the best and most economic
choices. Figure 4.2 shows the relative cost of different
types of generation.
The island of Ireland is already one of the highest users of
natural gas for electricity generation in the EU. The current
strategy is to diversify into wind generation. This strategy
must be evaluated from a long-term competitiveness point
of view. Techno-economic studies are required to identify
the appropriate level of wind generation for the island.
Given the intermittent nature of wind power it is likely to
require storage facilities such as pumped storage or
compressed air storage to match supply with demand.
Denmark, which has ambitious targets for wind power, is
considering diverting surplus wind power to its district
heating systems.
By 2030 renewable generation (mainly wind) will provide
approximately 30% of electricity generation. The key policy
decision will be to decide on the mix of the remaining 70%
of generation and to determine the optimum share that
gas, coal and nuclear should contribute to the non-
renewable segment of electricity generation. In the absence
of policy direction it is likely that gas fired generation will
fill the void by default as it is the easiest to permit and build.
This would expose the island to a major energy security risk,
as by 2030, with the North Sea fields depleted, gas will
come mainly from politically unstable regions with a
probability of supply interruption and price volatility. It
would be prudent to plan for similar contributions each
from gas, coal and nuclear for the 70% non-renewable
segment. These targets should be flexible to take into
account developments in technology and fuel supply.
Most other EU countries have significant hydroelectric or
nuclear components in their generation mix (Figure 4.3).
Ireland does not have additional hydroelectric resources to
exploit and must open itself up to the possibility of nuclear
generation in the longer term to ensure competitiveness.
ENERGY
Infrastructure for an Island Population of 8 Million
31
Figure 4.2 Relative Cost of Power Generation(Based on CO2 Costs of €20 per Tonne)
Source: Powering the Nation, 2009 Update, PB Power
14
12
10
8
4
2
0
Wind(Offshore)
Wind(Onshore)
Coal CCGT NuclearBiomassLe
velis
ed C
ost
(p
/kW
h)
Decommissioning Operations Fuel Capital Costs
IGCC(Coal)
Figure 4.3 Fuel Mix for Electricity Generation
Source: Forfás National Competitiveness Council Annual Report 2009
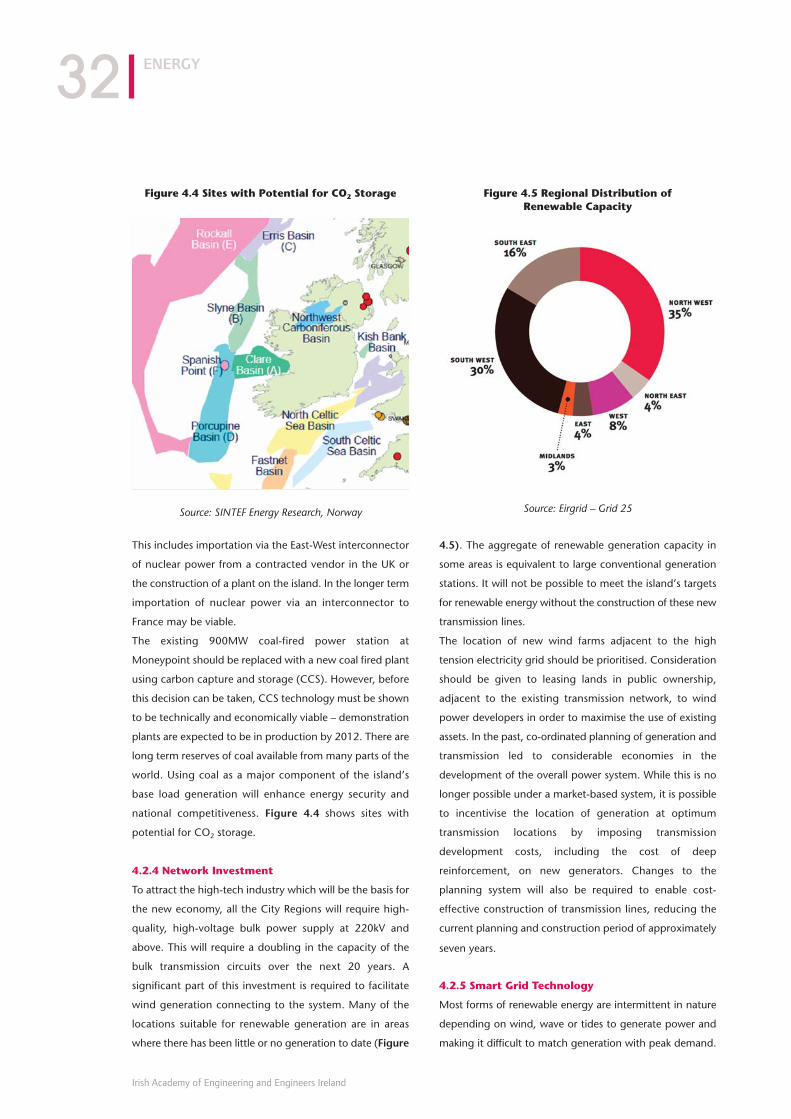
This includes importation via the East-West interconnector
of nuclear power from a contracted vendor in the UK or
the construction of a plant on the island. In the longer term
importation of nuclear power via an interconnector to
France may be viable.
The existing 900MW coal-fired power station at
Moneypoint should be replaced with a new coal fired plant
using carbon capture and storage (CCS). However, before
this decision can be taken, CCS technology must be shown
to be technically and economically viable – demonstration
plants are expected to be in production by 2012. There are
long term reserves of coal available from many parts of the
world. Using coal as a major component of the island’s
base load generation will enhance energy security and
national competitiveness. Figure 4.4 shows sites with
potential for CO2 storage.
4.2.4 Network Investment
To attract the high-tech industry which will be the basis for
the new economy, all the City Regions will require high-
quality, high-voltage bulk power supply at 220kV and
above. This will require a doubling in the capacity of the
bulk transmission circuits over the next 20 years. A
significant part of this investment is required to facilitate
wind generation connecting to the system. Many of the
locations suitable for renewable generation are in areas
where there has been little or no generation to date (Figure
4.5). The aggregate of renewable generation capacity in
some areas is equivalent to large conventional generation
stations. It will not be possible to meet the island’s targets
for renewable energy without the construction of these new
transmission lines.
The location of new wind farms adjacent to the high
tension electricity grid should be prioritised. Consideration
should be given to leasing lands in public ownership,
adjacent to the existing transmission network, to wind
power developers in order to maximise the use of existing
assets. In the past, co-ordinated planning of generation and
transmission led to considerable economies in the
development of the overall power system. While this is no
longer possible under a market-based system, it is possible
to incentivise the location of generation at optimum
transmission locations by imposing transmission
development costs, including the cost of deep
reinforcement, on new generators. Changes to the
planning system will also be required to enable cost-
effective construction of transmission lines, reducing the
current planning and construction period of approximately
seven years.
4.2.5 Smart Grid Technology
Most forms of renewable energy are intermittent in nature
depending on wind, wave or tides to generate power and
making it difficult to match generation with peak demand.
ENERGY
Irish Academy of Engineering and Engineers Ireland
32
Figure 4.4 Sites with Potential for CO2 Storage
Source: SINTEF Energy Research, Norway
Figure 4.5 Regional Distribution of Renewable Capacity
Source: Eirgrid – Grid 25
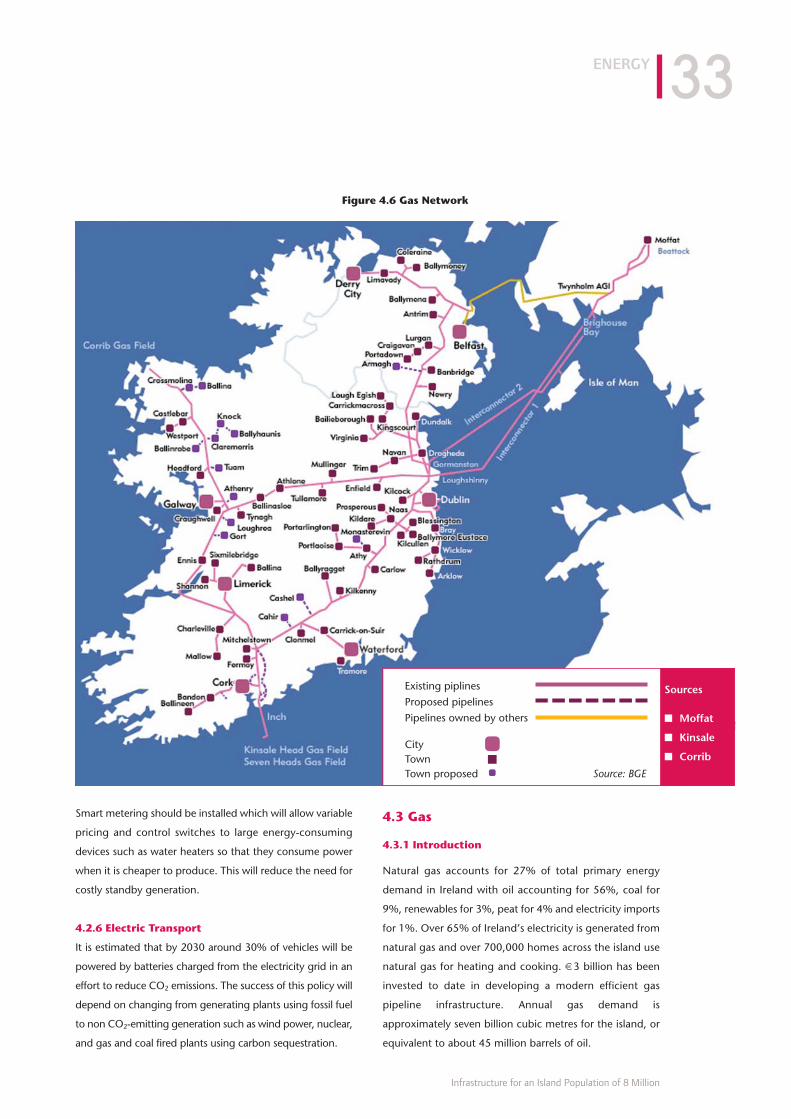
Smart metering should be installed which will allow variable
pricing and control switches to large energy-consuming
devices such as water heaters so that they consume power
when it is cheaper to produce. This will reduce the need for
costly standby generation.
4.2.6 Electric Transport
It is estimated that by 2030 around 30% of vehicles will be
powered by batteries charged from the electricity grid in an
effort to reduce CO2 emissions. The success of this policy will
depend on changing from generating plants using fossil fuel
to non CO2-emitting generation such as wind power, nuclear,
and gas and coal fired plants using carbon sequestration.
4.3 Gas
4.3.1 Introduction
Natural gas accounts for 27% of total primary energy
demand in Ireland with oil accounting for 56%, coal for
9%, renewables for 3%, peat for 4% and electricity imports
for 1%. Over 65% of Ireland’s electricity is generated from
natural gas and over 700,000 homes across the island use
natural gas for heating and cooking. €3 billion has been
invested to date in developing a modern efficient gas
pipeline infrastructure. Annual gas demand is
approximately seven billion cubic metres for the island, or
equivalent to about 45 million barrels of oil.
ENERGY
Infrastructure for an Island Population of 8 Million
33
Figure 4.6 Gas Network
Existing piplines
Proposed pipelines
Pipelines owned by others
CityTownTown proposed
Sources
■ Moffat
■ Kinsale
■ Corrib
Source: BGE
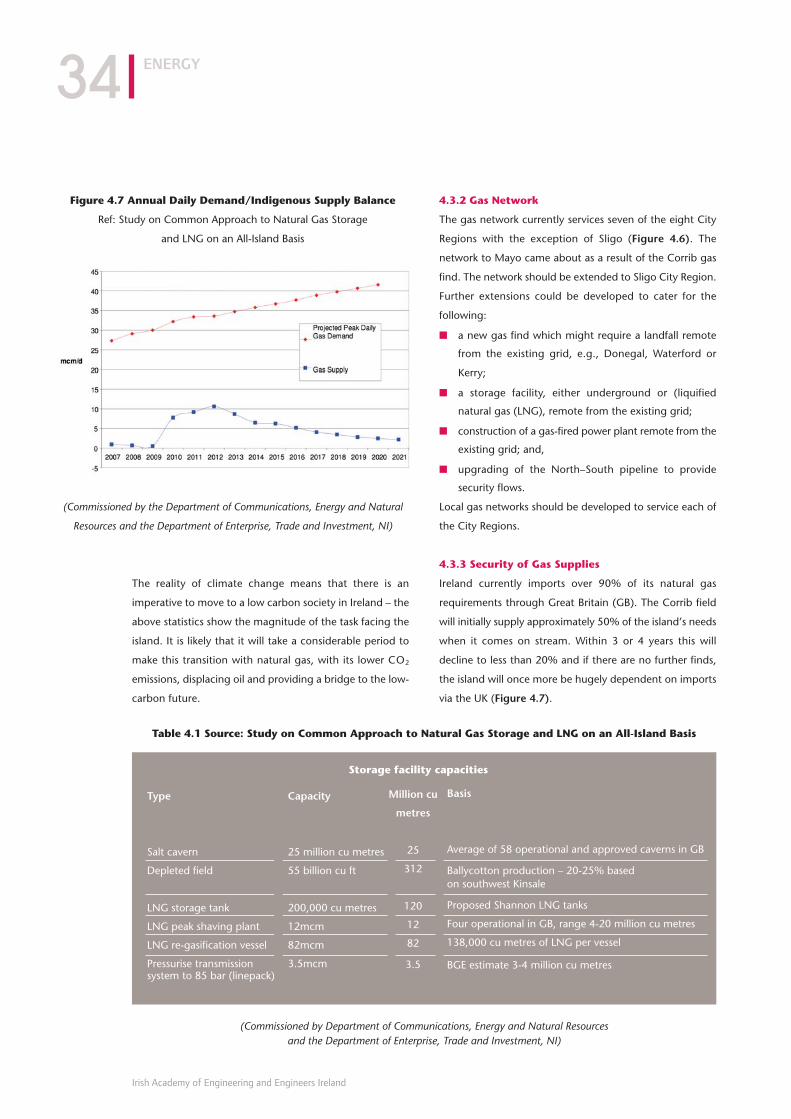
The reality of climate change means that there is an
imperative to move to a low carbon society in Ireland – the
above statistics show the magnitude of the task facing the
island. It is likely that it will take a considerable period to
make this transition with natural gas, with its lower CO2
emissions, displacing oil and providing a bridge to the low-
carbon future.
4.3.2 Gas Network
The gas network currently services seven of the eight City
Regions with the exception of Sligo (Figure 4.6). The
network to Mayo came about as a result of the Corrib gas
find. The network should be extended to Sligo City Region.
Further extensions could be developed to cater for the
following:
■ a new gas find which might require a landfall remote
from the existing grid, e.g., Donegal, Waterford or
Kerry;
■ a storage facility, either underground or (liquified
natural gas (LNG), remote from the existing grid;
■ construction of a gas-fired power plant remote from the
existing grid; and,
■ upgrading of the North–South pipeline to provide
security flows.
Local gas networks should be developed to service each of
the City Regions.
4.3.3 Security of Gas Supplies
Ireland currently imports over 90% of its natural gas
requirements through Great Britain (GB). The Corrib field
will initially supply approximately 50% of the island’s needs
when it comes on stream. Within 3 or 4 years this will
decline to less than 20% and if there are no further finds,
the island will once more be hugely dependent on imports
via the UK (Figure 4.7).
ENERGY
Irish Academy of Engineering and Engineers Ireland
34
Figure 4.7 Annual Daily Demand/Indigenous Supply Balance
Ref: Study on Common Approach to Natural Gas Storage
and LNG on an All-Island Basis
(Commissioned by the Department of Communications, Energy and Natural
Resources and the Department of Enterprise, Trade and Investment, NI)
Table 4.1 Source: Study on Common Approach to Natural Gas Storage and LNG on an All-Island Basis
(Commissioned by Department of Communications, Energy and Natural Resources and the Department of Enterprise, Trade and Investment, NI)
Type
Salt cavern
Depleted field
LNG storage tank
LNG peak shaving plant
LNG re-gasification vessel
Pressurise transmissionsystem to 85 bar (linepack)
Capacity
25 million cu metres
55 billion cu ft
200,000 cu metres
12mcm
82mcm
3.5mcm
Million cu
metres
25
312
120
12
82
3.5
Basis
Average of 58 operational and approved caverns in GB
Ballycotton production – 20-25% based on southwest Kinsale
Proposed Shannon LNG tanks
Four operational in GB, range 4-20 million cu metres
138,000 cu metres of LNG per vessel
BGE estimate 3-4 million cu metres
Storage facility capacities
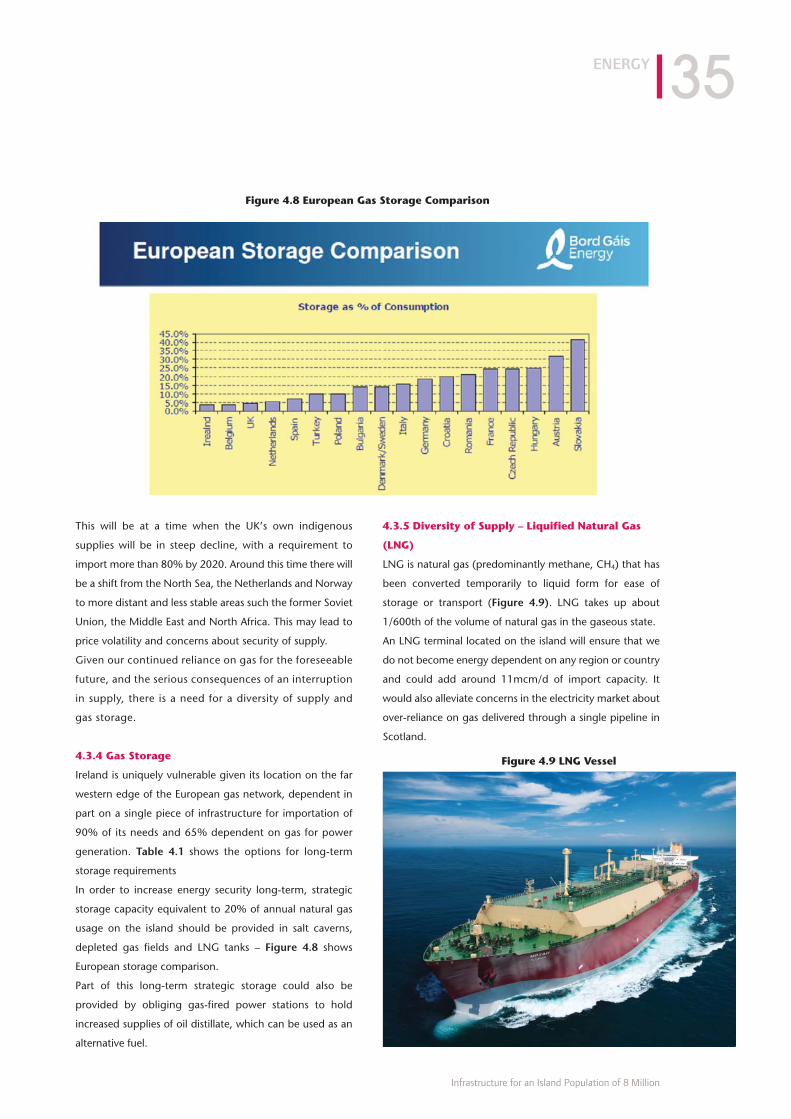
This will be at a time when the UK’s own indigenous
supplies will be in steep decline, with a requirement to
import more than 80% by 2020. Around this time there will
be a shift from the North Sea, the Netherlands and Norway
to more distant and less stable areas such the former Soviet
Union, the Middle East and North Africa. This may lead to
price volatility and concerns about security of supply.
Given our continued reliance on gas for the foreseeable
future, and the serious consequences of an interruption
in supply, there is a need for a diversity of supply and
gas storage.
4.3.4 Gas Storage
Ireland is uniquely vulnerable given its location on the far
western edge of the European gas network, dependent in
part on a single piece of infrastructure for importation of
90% of its needs and 65% dependent on gas for power
generation. Table 4.1 shows the options for long-term
storage requirements
In order to increase energy security long-term, strategic
storage capacity equivalent to 20% of annual natural gas
usage on the island should be provided in salt caverns,
depleted gas fields and LNG tanks – Figure 4.8 shows
European storage comparison.
Part of this long-term strategic storage could also be
provided by obliging gas-fired power stations to hold
increased supplies of oil distillate, which can be used as an
alternative fuel.
4.3.5 Diversity of Supply – Liquified Natural Gas
(LNG)
LNG is natural gas (predominantly methane, CH4) that has
been converted temporarily to liquid form for ease of
storage or transport (Figure 4.9). LNG takes up about
1/600th of the volume of natural gas in the gaseous state.
An LNG terminal located on the island will ensure that we
do not become energy dependent on any region or country
and could add around 11mcm/d of import capacity. It
would also alleviate concerns in the electricity market about
over-reliance on gas delivered through a single pipeline in
Scotland.
ENERGY
Infrastructure for an Island Population of 8 Million
35
Figure 4.8 European Gas Storage Comparison
Figure 4.9 LNG Vessel
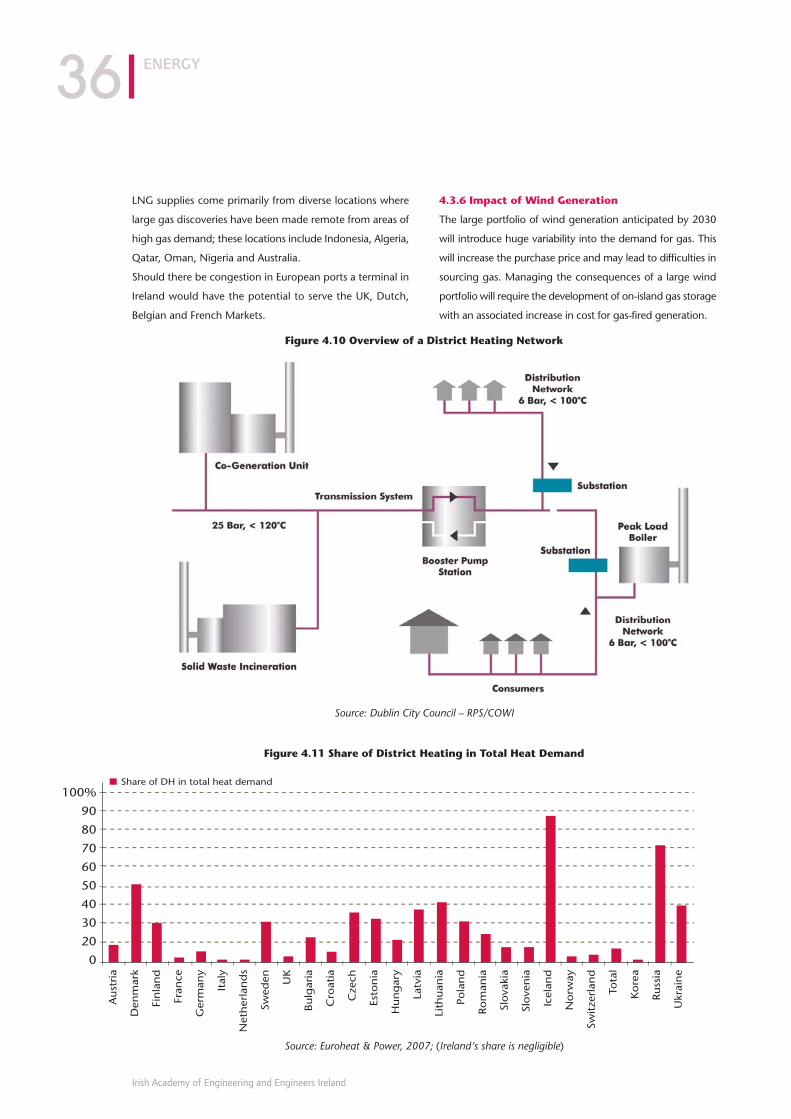
LNG supplies come primarily from diverse locations where
large gas discoveries have been made remote from areas of
high gas demand; these locations include Indonesia, Algeria,
Qatar, Oman, Nigeria and Australia.
Should there be congestion in European ports a terminal in
Ireland would have the potential to serve the UK, Dutch,
Belgian and French Markets.
4.3.6 Impact of Wind Generation
The large portfolio of wind generation anticipated by 2030
will introduce huge variability into the demand for gas. This
will increase the purchase price and may lead to difficulties in
sourcing gas. Managing the consequences of a large wind
portfolio will require the development of on-island gas storage
with an associated increase in cost for gas-fired generation.
ENERGY
Irish Academy of Engineering and Engineers Ireland
36
Figure 4.10 Overview of a District Heating Network
Source: Dublin City Council – RPS/COWI
Figure 4.11 Share of District Heating in Total Heat Demand
Source: Euroheat & Power, 2007; (Ireland’s share is negligible)
Share of DH in total heat demand100%
90
80
70
60
50
40
30
20
0
Aust
ria
Den
mar
k
Fin
lan
d
Fran
ce
Ger
man
y
Ital
y
Net
her
lan
ds
Swed
en UK
Bulg
aria
Cro
atia
Cze
ch
Esto
nia
Hun
gar
y
Latv
ia
Lith
uan
ia
Pola
nd
Rom
ania
Slova
kia
Slove
nia
Icel
and
Norw
ay
Swit
zerl
and
Tota
l
Kore
a
Russ
ia
Ukr
ain
e
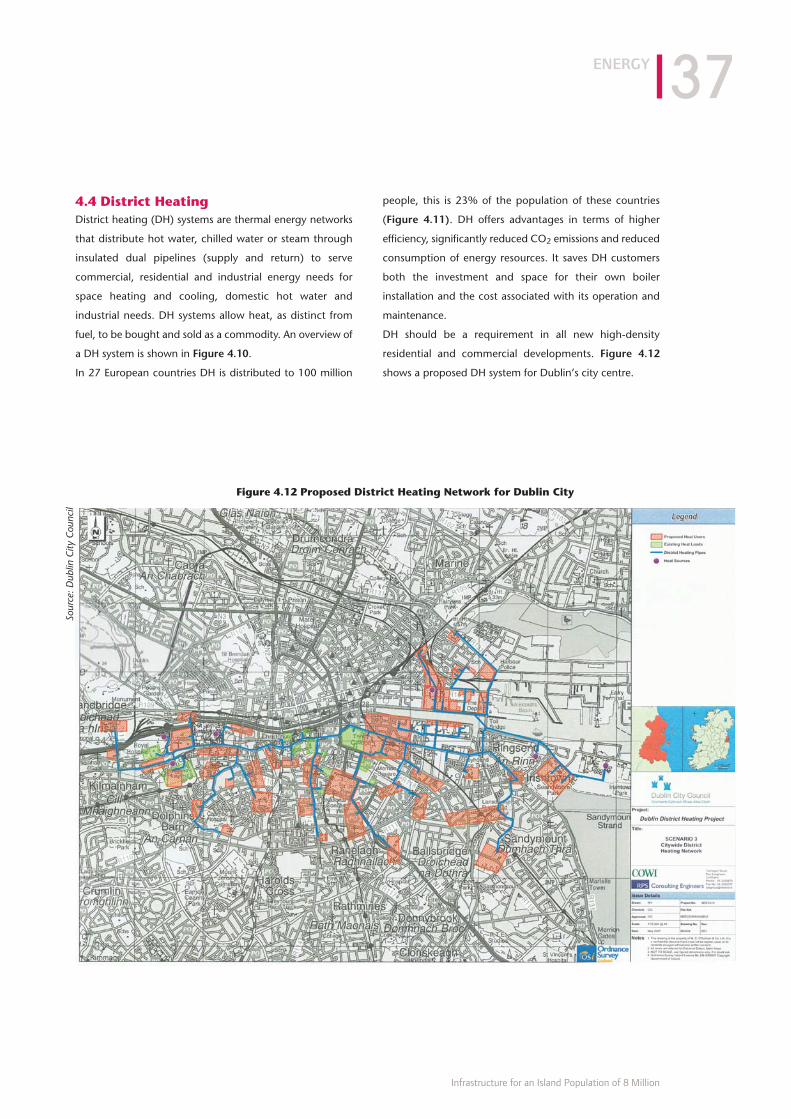
4.4 District HeatingDistrict heating (DH) systems are thermal energy networks
that distribute hot water, chilled water or steam through
insulated dual pipelines (supply and return) to serve
commercial, residential and industrial energy needs for
space heating and cooling, domestic hot water and
industrial needs. DH systems allow heat, as distinct from
fuel, to be bought and sold as a commodity. An overview of
a DH system is shown in Figure 4.10.
In 27 European countries DH is distributed to 100 million
people, this is 23% of the population of these countries
(Figure 4.11). DH offers advantages in terms of higher
efficiency, significantly reduced CO2 emissions and reduced
consumption of energy resources. It saves DH customers
both the investment and space for their own boiler
installation and the cost associated with its operation and
maintenance.
DH should be a requirement in all new high-density
residential and commercial developments. Figure 4.12
shows a proposed DH system for Dublin’s city centre.
ENERGY
Infrastructure for an Island Population of 8 Million
37
Figure 4.12 Proposed District Heating Network for Dublin City
Sour
ce: D
ublin
City
Cou
ncil
Key Recommendations1. Base development plans for all City Regions on clear
sustainable principles.
2. Establish appropriately sized waste to energy (WTE)
plants and strategically locate them to cater for residual
waste from the City Regions.
3. Manage demand for water with an emphasis on
conservation, loss reduction, metering and an economic
charge for water.
4. Develop a shared water mains network which will allow
for bulk transfer of water between sources of supply and
population centres.
5. Undertake a programme of sewer renewal in urban
areas. Have separate storm and foul water sewers where
practicable.
Cities compete to attract and retain mobile factors of
production, namely labour and capital, according to the
OECD. A key competitive factor in this regard is a high
quality environment which is defined by clean water, fresh
air, clean soil, and by the level of noise and the quality of
light. A sustainable city will operate with minimal impact on
the surrounding area and leave the smallest possible
ecological footprint. Development plans for the City Regions
should be based on clear sustainable principles.
5.1 Waste5.1.1 Introduction
Generation of waste should be decoupled from economic
development. An integrated waste management approach
should be applied to waste generated, with the objective of
minimising disposal to landfill. This policy will be in
accordance with EU directives which establish the following
hierarchy in dealing with waste:
■ prevention;
■ reuse;
■ minimisation;
■ recycling;
■ energy recovery; and,
■ disposal.
Targets should be 60% of waste recycled, 25% used for
energy recovery and the residual 15% disposed to landfill.
5.1.2 Public Education on Waste
Achievement of ambitious targets will be driven by delivering
a message to schools, businesses and communities on the
need for waste prevention and minimisation, with people
taking responsibility for their own waste.
5.1.3 Waste Infrastructure
Each city catchment should establish accessible facilities to
service its own needs. These should include:
■ recycling centres including facilities for green
composting;
■ kerbside collection with separate bins for dry and wet
recyclables and non-recyclable waste, funded by
“householder pay by weight”;
■ bring banks for each 1,000 of population;
■ managed landfill to cater for residual waste;a landfill tax
should be used to minimise this form of disposal; and,
■ WTE plants.
ENVIRONMENT
Irish Academy of Engineering and Engineers Ireland
38
Chapter 5
ENVIRONMENT
“A sustainable city will operate with minimal
impact on the surrounding area.”
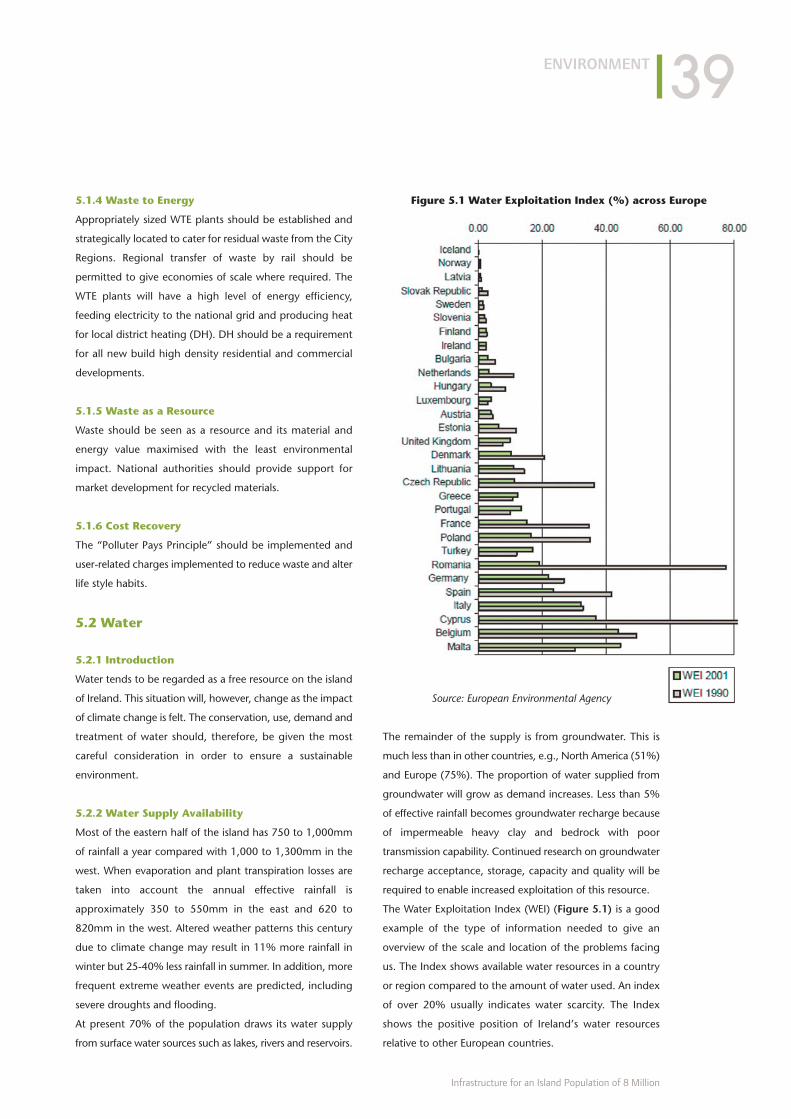
5.1.4 Waste to Energy
Appropriately sized WTE plants should be established and
strategically located to cater for residual waste from the City
Regions. Regional transfer of waste by rail should be
permitted to give economies of scale where required. The
WTE plants will have a high level of energy efficiency,
feeding electricity to the national grid and producing heat
for local district heating (DH). DH should be a requirement
for all new build high density residential and commercial
developments.
5.1.5 Waste as a Resource
Waste should be seen as a resource and its material and
energy value maximised with the least environmental
impact. National authorities should provide support for
market development for recycled materials.
5.1.6 Cost Recovery
The “Polluter Pays Principle” should be implemented and
user-related charges implemented to reduce waste and alter
life style habits.
5.2 Water
5.2.1 Introduction
Water tends to be regarded as a free resource on the island
of Ireland. This situation will, however, change as the impact
of climate change is felt. The conservation, use, demand and
treatment of water should, therefore, be given the most
careful consideration in order to ensure a sustainable
environment.
5.2.2 Water Supply Availability
Most of the eastern half of the island has 750 to 1,000mm
of rainfall a year compared with 1,000 to 1,300mm in the
west. When evaporation and plant transpiration losses are
taken into account the annual effective rainfall is
approximately 350 to 550mm in the east and 620 to
820mm in the west. Altered weather patterns this century
due to climate change may result in 11% more rainfall in
winter but 25-40% less rainfall in summer. In addition, more
frequent extreme weather events are predicted, including
severe droughts and flooding.
At present 70% of the population draws its water supply
from surface water sources such as lakes, rivers and reservoirs.
The remainder of the supply is from groundwater. This is
much less than in other countries, e.g., North America (51%)
and Europe (75%). The proportion of water supplied from
groundwater will grow as demand increases. Less than 5%
of effective rainfall becomes groundwater recharge because
of impermeable heavy clay and bedrock with poor
transmission capability. Continued research on groundwater
recharge acceptance, storage, capacity and quality will be
required to enable increased exploitation of this resource.
The Water Exploitation Index (WEI) (Figure 5.1) is a good
example of the type of information needed to give an
overview of the scale and location of the problems facing
us. The Index shows available water resources in a country
or region compared to the amount of water used. An index
of over 20% usually indicates water scarcity. The Index
shows the positive position of Ireland’s water resources
relative to other European countries.
ENVIRONMENT
Infrastructure for an Island Population of 8 Million
39
Figure 5.1 Water Exploitation Index (%) across Europe
Source: European Environmental Agency
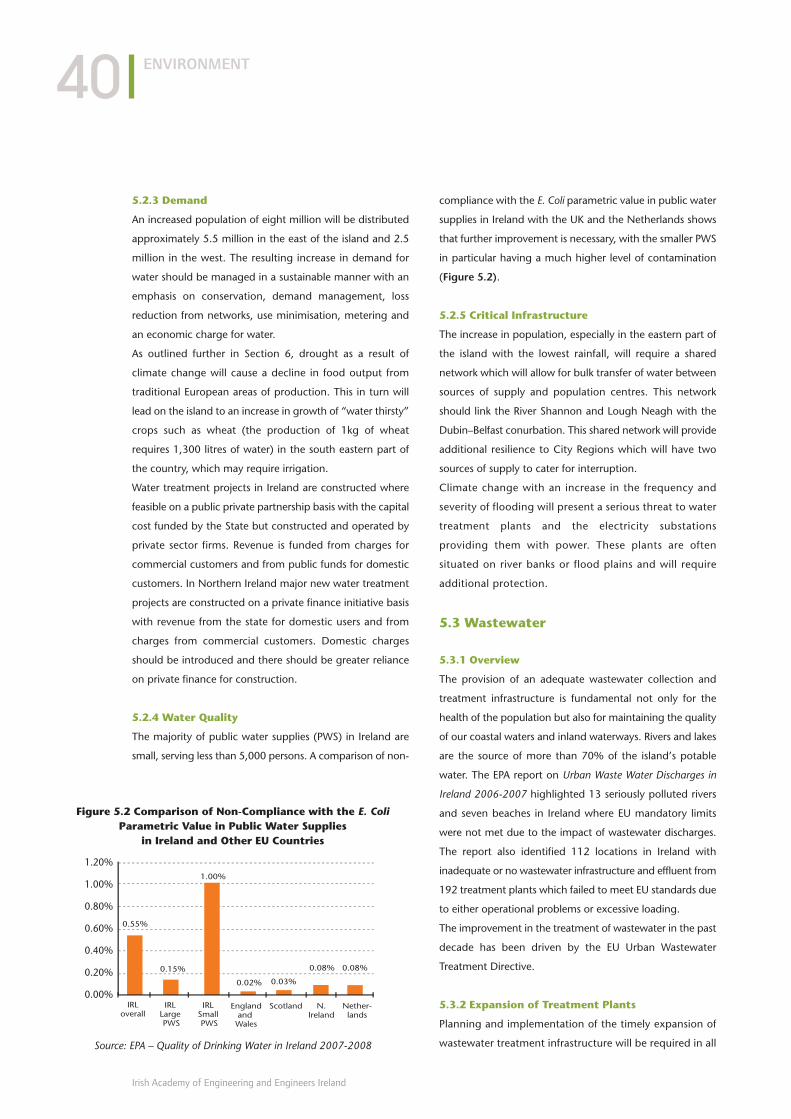
5.2.3 Demand
An increased population of eight million will be distributed
approximately 5.5 million in the east of the island and 2.5
million in the west. The resulting increase in demand for
water should be managed in a sustainable manner with an
emphasis on conservation, demand management, loss
reduction from networks, use minimisation, metering and
an economic charge for water.
As outlined further in Section 6, drought as a result of
climate change will cause a decline in food output from
traditional European areas of production. This in turn will
lead on the island to an increase in growth of “water thirsty”
crops such as wheat (the production of 1kg of wheat
requires 1,300 litres of water) in the south eastern part of
the country, which may require irrigation.
Water treatment projects in Ireland are constructed where
feasible on a public private partnership basis with the capital
cost funded by the State but constructed and operated by
private sector firms. Revenue is funded from charges for
commercial customers and from public funds for domestic
customers. In Northern Ireland major new water treatment
projects are constructed on a private finance initiative basis
with revenue from the state for domestic users and from
charges from commercial customers. Domestic charges
should be introduced and there should be greater reliance
on private finance for construction.
5.2.4 Water Quality
The majority of public water supplies (PWS) in Ireland are
small, serving less than 5,000 persons. A comparison of non-
compliance with the E. Coli parametric value in public water
supplies in Ireland with the UK and the Netherlands shows
that further improvement is necessary, with the smaller PWS
in particular having a much higher level of contamination
(Figure 5.2).
5.2.5 Critical Infrastructure
The increase in population, especially in the eastern part of
the island with the lowest rainfall, will require a shared
network which will allow for bulk transfer of water between
sources of supply and population centres. This network
should link the River Shannon and Lough Neagh with the
Dubin–Belfast conurbation. This shared network will provide
additional resilience to City Regions which will have two
sources of supply to cater for interruption.
Climate change with an increase in the frequency and
severity of flooding will present a serious threat to water
treatment plants and the electricity substations
providing them with power. These plants are often
situated on river banks or flood plains and will require
additional protection.
5.3 Wastewater
5.3.1 Overview
The provision of an adequate wastewater collection and
treatment infrastructure is fundamental not only for the
health of the population but also for maintaining the quality
of our coastal waters and inland waterways. Rivers and lakes
are the source of more than 70% of the island’s potable
water. The EPA report on Urban Waste Water Discharges in
Ireland 2006-2007 highlighted 13 seriously polluted rivers
and seven beaches in Ireland where EU mandatory limits
were not met due to the impact of wastewater discharges.
The report also identified 112 locations in Ireland with
inadequate or no wastewater infrastructure and effluent from
192 treatment plants which failed to meet EU standards due
to either operational problems or excessive loading.
The improvement in the treatment of wastewater in the past
decade has been driven by the EU Urban Wastewater
Treatment Directive.
5.3.2 Expansion of Treatment Plants
Planning and implementation of the timely expansion of
wastewater treatment infrastructure will be required in all
ENVIRONMENT
Irish Academy of Engineering and Engineers Ireland
40
Figure 5.2 Comparison of Non-Compliance with the E. ColiParametric Value in Public Water Supplies
in Ireland and Other EU Countries
Source: EPA – Quality of Drinking Water in Ireland 2007-2008
1.20%
1.00%
0.80%
0.60%
0.40%
0.20%
0.00%IRL
overall
0.55%
1.00%
0.02% 0.03%
0.08% 0.08%0.15%
Englandand Wales
Scotland N.Ireland
Nether-lands
IRL Large PWS
IRL Small PWS
City Regions to cater for both population growth and
industrial development. Many of the treatment plants
built in the past decade have been designed so that
modular expansion can be easily implemented in line with
increased loading. In instances where the potential for
such expansion is either not feasible or has been fully
exhausted it will be necessary to construct new facilities
to cater for requirements. The most notable example of
this is the limited scope for further expansion of the
treatment plant serving the Dublin urban area at
Ringsend.
5.3.3 Sewer Renewal
Climate change will bring higher intensity rainfall and more
frequent storm events. As existing urban drainage systems
have not been designed to cater for such conditions, this
will increase the occurrence of out of sewer flooding and
polluting discharges from overloaded sewers.
Excessive flows of storm water reaching wastewater
treatment facilities result in increased treatment cost and
can cause the discharge of insufficiently treated effluent. The
result of this can be the pollution of rivers and lakes which
are used for the supply of water to urban areas. Where water
treatment facilities drawing from these rivers and lakes are
vulnerable to contaminants such as cryptosporidium the
potential for interruptions to the normal water supply exist,
an extreme example of which was experienced in Galway
city during 2007.
A major programme of sewer rehabilitation and
replacement should be undertaken in urban areas and,
where practical, a key element of these works will be the
separation of foul and storm sewers.
5.3.4 Sustainable Drainage Systems (SuDS)
SuDS are designed to reduce the potential impact of new
and existing developments with respect to surface water
drainage discharges. They try to replicate natural systems
that use cost-effective solutions with low environmental
impact to drain away dirty and surface water run-off
through collection, storage and cleaning before allowing it
to be released slowly back into the environment, such as
into water courses.
This is to counter the effects of conventional drainage
systems that often allow for flooding, pollution of the
environment and contamination of groundwater sources
used to provide drinking water. The paradigm of SuDS
solutions should be that of a system that is easy to manage,
requiring little or no energy input (except from
environmental sources such as sunlight), resilient to use and
environmentally, as well as aesthetically, attractive. Examples
of this type of system are reed beds and other wetland
habitats that collect, store and filter dirty water along with
providing a habitat for wildlife. This type of sustainable
drainage should be incorporated into all future
development.
5.3.5 Funding Wastewater Infrastructure
As in the case of drinking water, waste water treatment
plants in Ireland are constructed using public funds, but
designed built and operated by private sector firms. Charges
are levied only on commercial users with the remaining
operating cost paid by the state. In Northern Ireland major
new projects are funded on a private finance initiative basis
while revenue is received only from commercial firms and
the state. In future, charges are likely to be levied on
domestic users and there is likely to be a greater reliance on
private finance for construction.
ENVIRONMENT
Infrastructure for an Island Population of 8 Million
41
“Demand for water should be managed in a
sustainable manner with an emphasis on
conservation, loss reduction, metering and an
economic charge for water.”

Key Recommendations1. Increase the energy efficiency of residential and
commercial buildings.
2. Develop new non-greenhouse gas (GHG) emitting
baseload electricity generation, coal or gas with carbon
capture and storage technology and imported nuclear
power.
3. Plan for the protection of cities in coastal areas and river
basins against flood damage and rising sea levels.
4. Establish a register of critical infrastructure vulnerable to
climate change. Carry out a flood risk assessment for
each critical infrastructure asset identifying its frequency
of exposure to a hazard, its resilience to exposure and
the consequences of its failure.
5. Focus climate research on identifying key parameters
critical for infrastructure design.
6.1 Introduction Climate change threatens the basic elements of life for
people around the world – access to water, food production,
health and use of land and the environment. Ireland, as a
member of the European Union, is party to the EU’s
commitment under the Kyoto protocol, which has the aim
of stabilising CO2 in the atmosphere at a level 450 to
550ppm by the middle of the century.
Climate change will impact on the island in two ways:
■ the requirement to reduce GHG emissions will demand
a very different approach to energy production,
transport, building design and agriculture; and,
■ increased sea level, rainfall patterns and extreme
weather events will necessitate major adaptations to the
island’s infrastructure.
6.2 GHG Abatement13
Policy targets for energy and climate change are driven by
the EU commitment known as the 20-20-20 Initiative. This
initiative aims to reduce GHG emissions by 20%, to increase
the share of renewables in energy use by 20% and to
improve energy efficiency by 20% – all to be achieved by
2020.
One of the significant features of the EU 2020 Climate
Change package is the delivery of a new Renewable Energy
Directive covering electricity, heat and transport. The new
Directive on energy from renewable sources seeks to ensure
that by 2020 renewable energy makes up at least 20% of
the EU’s total energy consumption. The Directive sets out a
target of 16% renewable energy for Ireland for 2020.
The Ireland GHG Abatement Cost Curve (Figure 6.1) has
been developed based on the proven methodology of
McKinsey’s global GHG abatement cost curve. The Ireland
specifics were created through consultations with over 80
Irish stakeholders and experts from all sectors.
The GHG Abatement Cost Curve is an approach to assess
technical abatement opportunities relative to a “business as
usual” (BAU) emissions development scenario. It examines
emission reduction potential and associated cost for each
opportunity. Realising full potential identified by 2030 will
reduce abatements relative to BAU by 42%. The top ten
abatement levers deliver over 60% of the 2030 abatement
potential. Power generation leads delivery of abatement in
2030 with 11.1MtCO2e (40% of total) but all other sectors
need to contribute to realise Ireland’s full abatement
potential. The abatement cost curve is based on oil at $120
per barrel and carbon at €80/t. The potential contribution
of nuclear power to GHG abatement is not included.
CLIMATE CHANGE
Irish Academy of Engineering and Engineers Ireland
42
Chapter 6
CLIMATE CHANGE
13 Refer also to Section 4 – Energy.
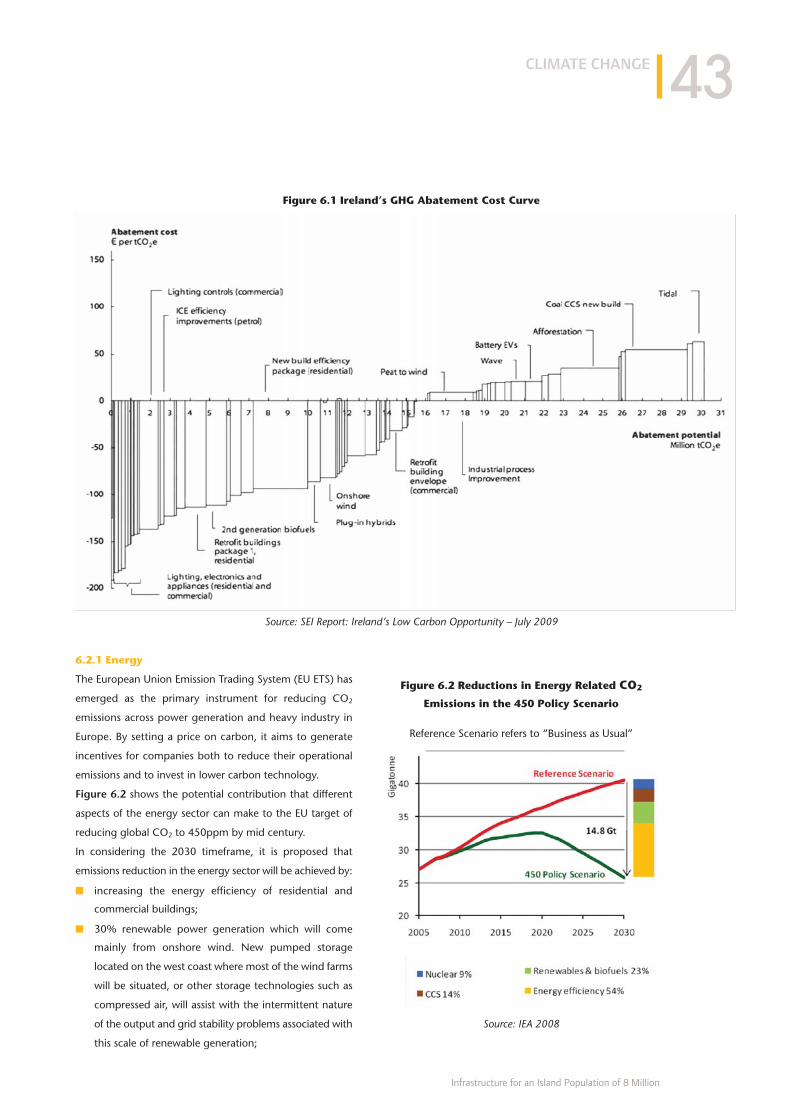
6.2.1 Energy
The European Union Emission Trading System (EU ETS) has
emerged as the primary instrument for reducing CO2
emissions across power generation and heavy industry in
Europe. By setting a price on carbon, it aims to generate
incentives for companies both to reduce their operational
emissions and to invest in lower carbon technology.
Figure 6.2 shows the potential contribution that different
aspects of the energy sector can make to the EU target of
reducing global CO2 to 450ppm by mid century.
In considering the 2030 timeframe, it is proposed that
emissions reduction in the energy sector will be achieved by:
■ increasing the energy efficiency of residential and
commercial buildings;
■ 30% renewable power generation which will come
mainly from onshore wind. New pumped storage
located on the west coast where most of the wind farms
will be situated, or other storage technologies such as
compressed air, will assist with the intermittent nature
of the output and grid stability problems associated with
this scale of renewable generation;
CLIMATE CHANGE
Infrastructure for an Island Population of 8 Million
43
Figure 6.1 Ireland’s GHG Abatement Cost Curve
Source: SEI Report: Ireland’s Low Carbon Opportunity – July 2009
Figure 6.2 Reductions in Energy Related CO2
Emissions in the 450 Policy Scenario
Reference Scenario refers to “Business as Usual”
Source: IEA 2008
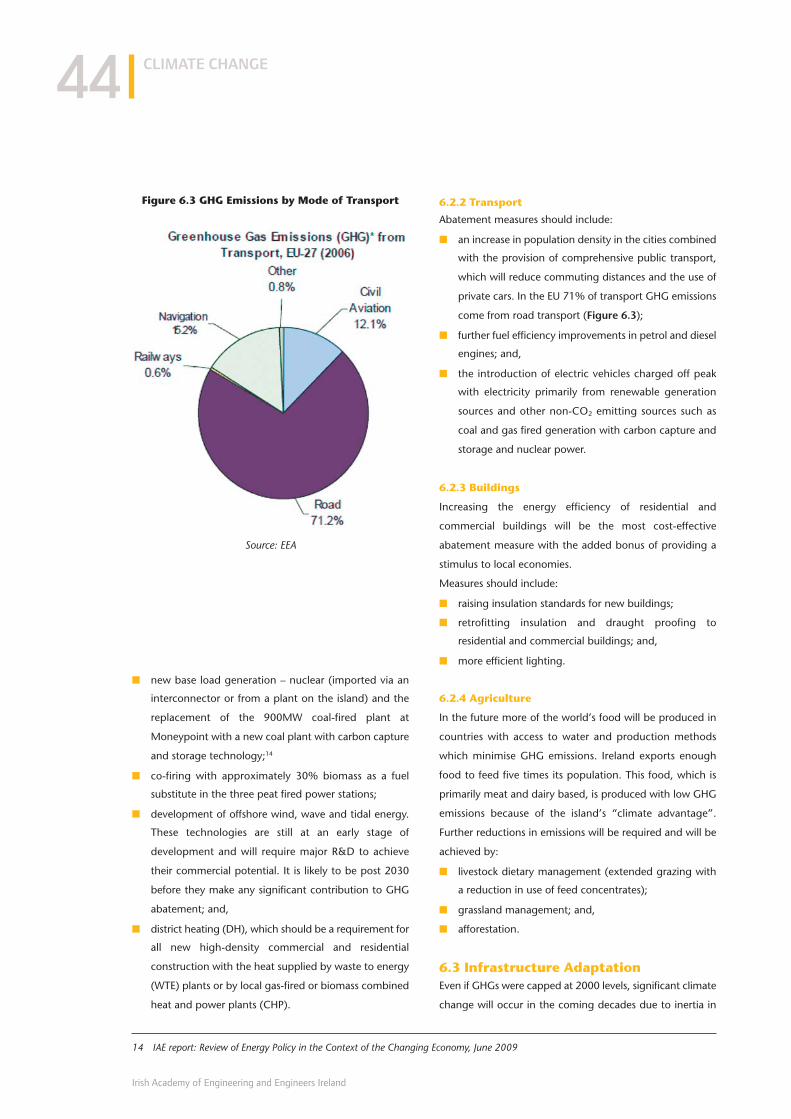
■ new base load generation – nuclear (imported via an
interconnector or from a plant on the island) and the
replacement of the 900MW coal-fired plant at
Moneypoint with a new coal plant with carbon capture
and storage technology;14
■ co-firing with approximately 30% biomass as a fuel
substitute in the three peat fired power stations;
■ development of offshore wind, wave and tidal energy.
These technologies are still at an early stage of
development and will require major R&D to achieve
their commercial potential. It is likely to be post 2030
before they make any significant contribution to GHG
abatement; and,
■ district heating (DH), which should be a requirement for
all new high-density commercial and residential
construction with the heat supplied by waste to energy
(WTE) plants or by local gas-fired or biomass combined
heat and power plants (CHP).
6.2.2 Transport
Abatement measures should include:
■ an increase in population density in the cities combined
with the provision of comprehensive public transport,
which will reduce commuting distances and the use of
private cars. In the EU 71% of transport GHG emissions
come from road transport (Figure 6.3);
■ further fuel efficiency improvements in petrol and diesel
engines; and,
■ the introduction of electric vehicles charged off peak
with electricity primarily from renewable generation
sources and other non-CO2 emitting sources such as
coal and gas fired generation with carbon capture and
storage and nuclear power.
6.2.3 Buildings
Increasing the energy efficiency of residential and
commercial buildings will be the most cost-effective
abatement measure with the added bonus of providing a
stimulus to local economies.
Measures should include:
■ raising insulation standards for new buildings;
■ retrofitting insulation and draught proofing to
residential and commercial buildings; and,
■ more efficient lighting.
6.2.4 Agriculture
In the future more of the world’s food will be produced in
countries with access to water and production methods
which minimise GHG emissions. Ireland exports enough
food to feed five times its population. This food, which is
primarily meat and dairy based, is produced with low GHG
emissions because of the island’s “climate advantage”.
Further reductions in emissions will be required and will be
achieved by:
■ livestock dietary management (extended grazing with
a reduction in use of feed concentrates);
■ grassland management; and,
■ afforestation.
6.3 Infrastructure AdaptationEven if GHGs were capped at 2000 levels, significant climate
change will occur in the coming decades due to inertia in
CLIMATE CHANGE
Irish Academy of Engineering and Engineers Ireland
44
14 IAE report: Review of Energy Policy in the Context of the Changing Economy, June 2009
Figure 6.3 GHG Emissions by Mode of Transport
Source: EEA
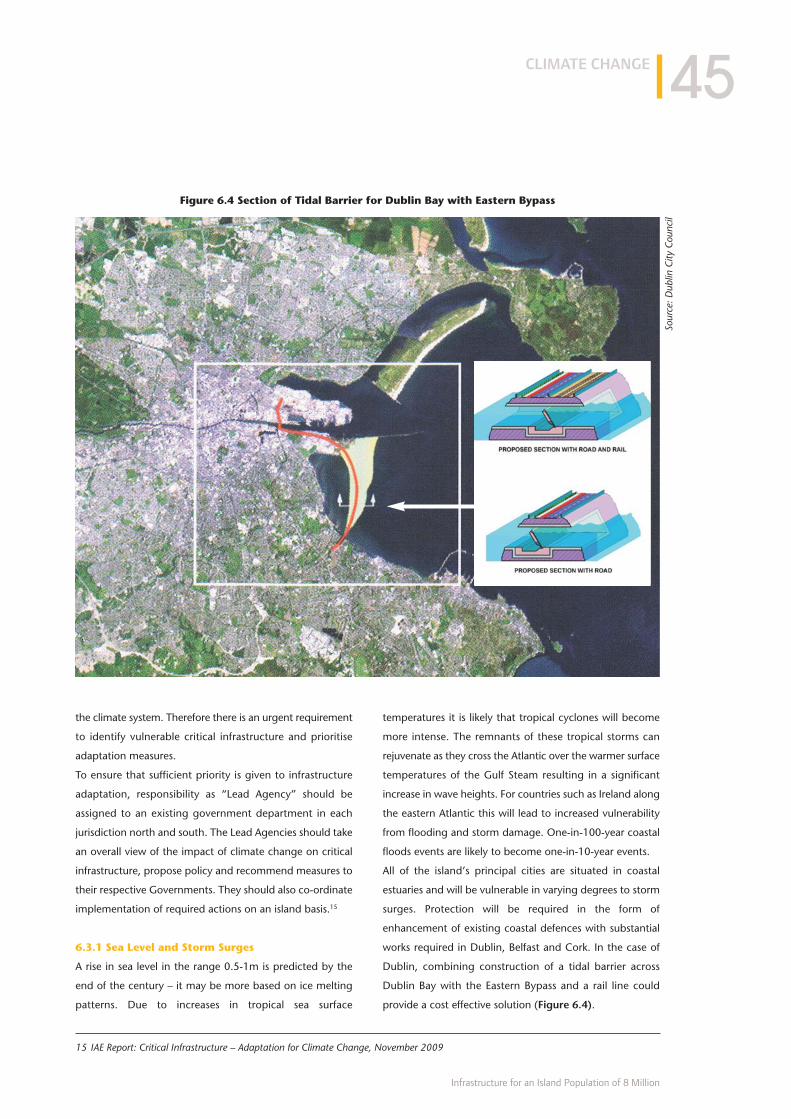
the climate system. Therefore there is an urgent requirement
to identify vulnerable critical infrastructure and prioritise
adaptation measures.
To ensure that sufficient priority is given to infrastructure
adaptation, responsibility as “Lead Agency” should be
assigned to an existing government department in each
jurisdiction north and south. The Lead Agencies should take
an overall view of the impact of climate change on critical
infrastructure, propose policy and recommend measures to
their respective Governments. They should also co-ordinate
implementation of required actions on an island basis.15
6.3.1 Sea Level and Storm Surges
A rise in sea level in the range 0.5-1m is predicted by the
end of the century – it may be more based on ice melting
patterns. Due to increases in tropical sea surface
temperatures it is likely that tropical cyclones will become
more intense. The remnants of these tropical storms can
rejuvenate as they cross the Atlantic over the warmer surface
temperatures of the Gulf Steam resulting in a significant
increase in wave heights. For countries such as Ireland along
the eastern Atlantic this will lead to increased vulnerability
from flooding and storm damage. One-in-100-year coastal
floods events are likely to become one-in-10-year events.
All of the island’s principal cities are situated in coastal
estuaries and will be vulnerable in varying degrees to storm
surges. Protection will be required in the form of
enhancement of existing coastal defences with substantial
works required in Dublin, Belfast and Cork. In the case of
Dublin, combining construction of a tidal barrier across
Dublin Bay with the Eastern Bypass and a rail line could
provide a cost effective solution (Figure 6.4).
CLIMATE CHANGE
Infrastructure for an Island Population of 8 Million
45
Figure 6.4 Section of Tidal Barrier for Dublin Bay with Eastern Bypass
15 IAE Report: Critical Infrastructure – Adaptation for Climate Change, November 2009
Sour
ce: D
ublin
City
Cou
ncil
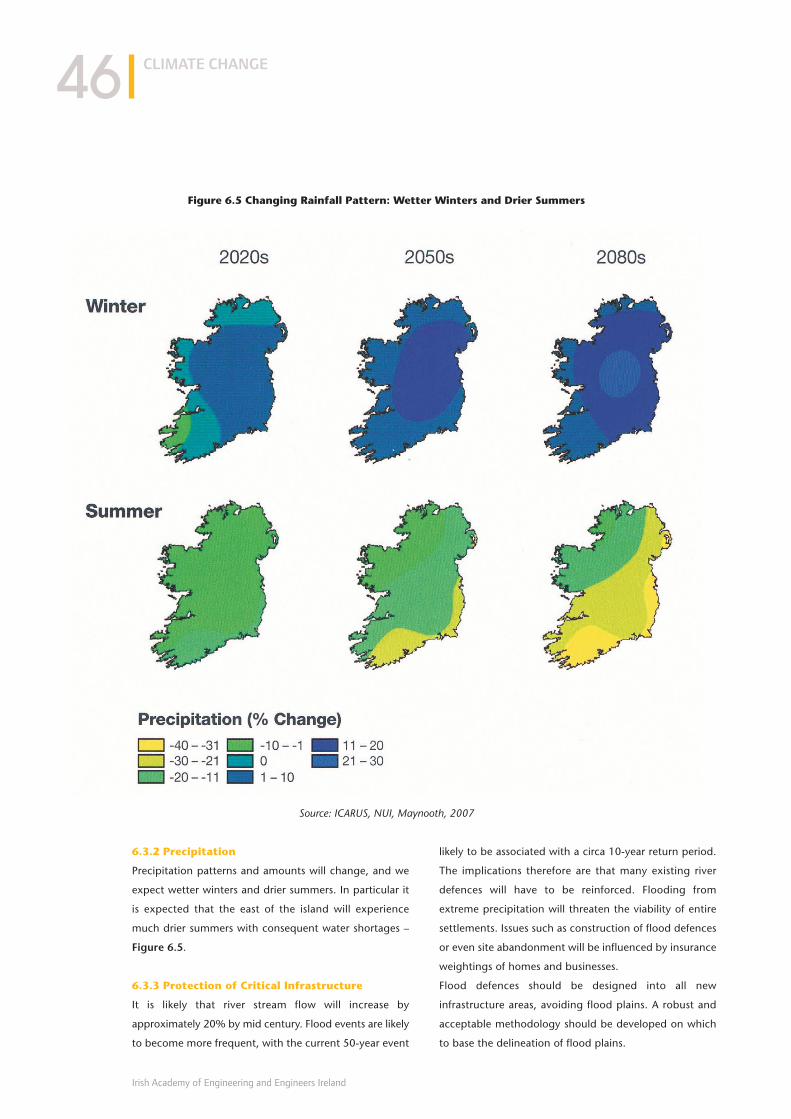
6.3.2 Precipitation
Precipitation patterns and amounts will change, and we
expect wetter winters and drier summers. In particular it
is expected that the east of the island will experience
much drier summers with consequent water shortages –
Figure 6.5.
6.3.3 Protection of Critical Infrastructure
It is likely that river stream flow will increase by
approximately 20% by mid century. Flood events are likely
to become more frequent, with the current 50-year event
likely to be associated with a circa 10-year return period.
The implications therefore are that many existing river
defences will have to be reinforced. Flooding from
extreme precipitation will threaten the viability of entire
settlements. Issues such as construction of flood defences
or even site abandonment will be influenced by insurance
weightings of homes and businesses.
Flood defences should be designed into all new
infrastructure areas, avoiding flood plains. A robust and
acceptable methodology should be developed on which
to base the delineation of flood plains.
CLIMATE CHANGE
Irish Academy of Engineering and Engineers Ireland
46
Figure 6.5 Changing Rainfall Pattern: Wetter Winters and Drier Summers
Source: ICARUS, NUI, Maynooth, 2007

Road and rail transport routes will be particularly vulnerable,
especially when following coastal and river valley routes.
Cuttings and embankments will require alterations and
improvements to cope with increased flooding.
The energy sector has critical infrastructure, including
electricity sub stations, gas installations and oil terminals,
located throughout the island, that is vulnerable to
increased possibility of flooding or other damage caused by
extreme weather events. Many of these plants have facilities
such as cable tunnels and basements, which increase the risk
of flooding. All owners of energy infrastructure should carry
out a preliminary climate change risk assessment and
prepare a climate change asset risk register. This should be
carried out using climate change parameters decided by the
Energy Regulator in both jurisdictions in consultation with
the two climate change Lead Agencies and the owners of
the energy infrastructure.
Water infrastructure which is dependent on electricity for
pumping will need both flood protection and standby
generation.
A register of critical infrastructure vulnerable to climate
change should be established. A formal flood risk assessment
should be carried out for each critical infrastructure asset
identifying its frequency of exposure to a hazard, its
resilience to exposure and the consequences of its failure.
6.3.4 Design Standards
The engineering profession and climate change researchers
should co-operate in identifying which climate change
parameters are critical to infrastructure design and what
further climate change research is required to enable the
engineering profession to amend current design standards.
In the interim, it would be prudent that new construction
should allow for a sea level rise of at least 0.5m.
CLIMATE CHANGE
Infrastructure for an Island Population of 8 Million
47
“There is an urgent requirement to identify
vulnerable critical infrastructure and prioritise
adaptation measures.”
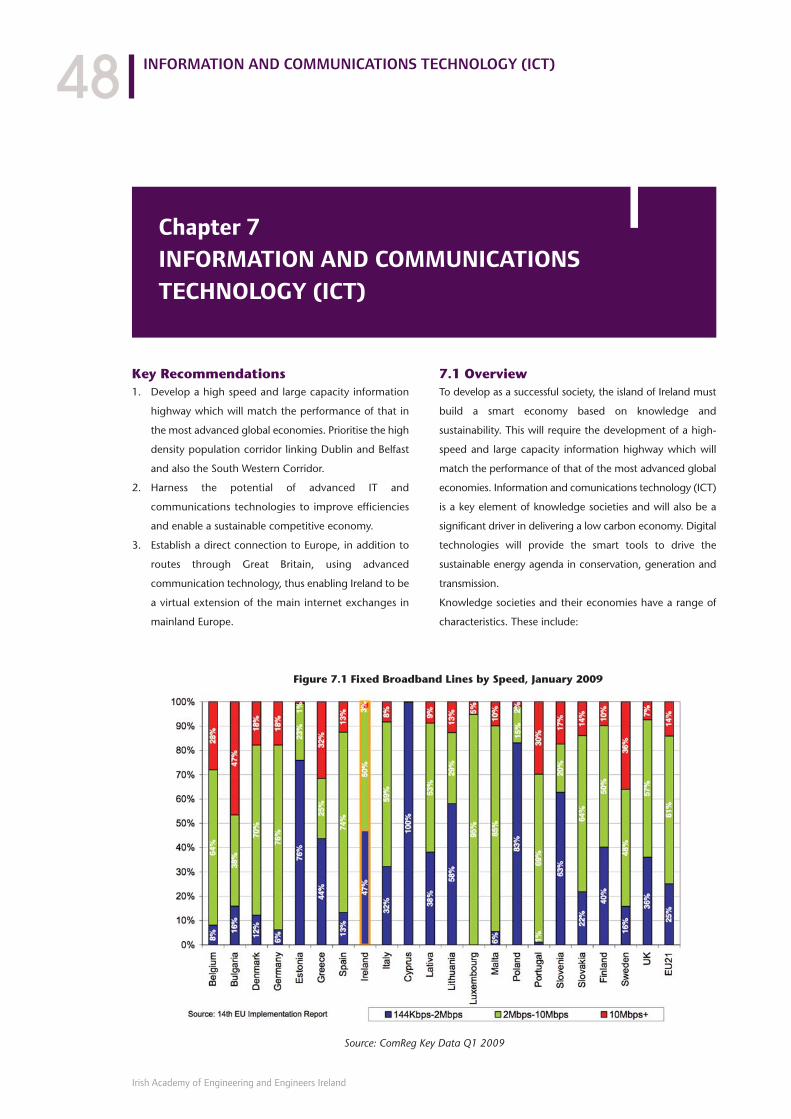
Key Recommendations1. Develop a high speed and large capacity information
highway which will match the performance of that in
the most advanced global economies. Prioritise the high
density population corridor linking Dublin and Belfast
and also the South Western Corridor.
2. Harness the potential of advanced IT and
communications technologies to improve efficiencies
and enable a sustainable competitive economy.
3. Establish a direct connection to Europe, in addition to
routes through Great Britain, using advanced
communication technology, thus enabling Ireland to be
a virtual extension of the main internet exchanges in
mainland Europe.
7.1 OverviewTo develop as a successful society, the island of Ireland must
build a smart economy based on knowledge and
sustainability. This will require the development of a high-
speed and large capacity information highway which will
match the performance of that of the most advanced global
economies. Information and comunications technology (ICT)
is a key element of knowledge societies and will also be a
significant driver in delivering a low carbon economy. Digital
technologies will provide the smart tools to drive the
sustainable energy agenda in conservation, generation and
transmission.
Knowledge societies and their economies have a range of
characteristics. These include:
INFORMATION AND COMMUNICATIONS TECHNOLOGY (ICT)
Irish Academy of Engineering and Engineers Ireland
48
Chapter 7
INFORMATION AND COMMUNICATIONS
TECHNOLOGY (ICT)
Figure 7.1 Fixed Broadband Lines by Speed, January 2009
Source: ComReg Key Data Q1 2009

■ advanced high-speed broadband – domestic and
enterprise;
■ high level of electronic transactions in public, private
and government services;
■ high speed broadband and systematic usage in schools;
■ high participation of students in advanced mathematics,
science and engineering;
■ world ranking universities with high level of
international connectivity;
■ technology-based industry producing innovative
products and services for export;
■ well-defined national ICT research programmes;
■ high ranking in IT international surveys and global
competitiveness;
■ high number of full-time researchers in industry and at
third level;
■ strength in ICT, biotechnology and pharmaceuticals with
high added-value indigenous manufacturing sectors;
and,
■ high level of international business connectivity with
strong export revenues from products and
internationally traded services.
7.2 Communications NetworksThe smart economy will require the construction of a robust
and reliable telecommunications network consisting of a low
cost, high resilience, high bandwidth and low latency fibre
backbone, throughout the island. Internet-based services
will become the lifeblood of modern life.
There is nothing that the World Wide Web does not touch
today to the point that broadband services are now
considered comparable to what landline voice services were
over the last 40 years. The next 20 years will see the World
Wide Web mature and become even more deeply embedded
into everyday life. This means that today’s technology will be
replaced with even more exciting technologies tomorrow –
most of which are being invented and developed today.
7.3 Broadband Ireland ranks well below the EU average in the availability of
high speed broadband services (Figure 7.1). Only 3% of
subscribers have download speeds in excess of 10Mbps.
Ireland ranks 25th in the OECD in terms of its readiness to
support next generation video and web services and is also
below today’s required standard.
In 2009, about 72% of broadband subscriptions were for a
fixed landline platform, and the remaining 28% for mobile
broadband. Mobile broadband applications almost doubled
over the previous year, while fixed broadband increased by
almost 14%.
INFORMATION AND COMMUNICATIONS TECHNOLOGY (ICT)
Infrastructure for an Island Population of 8 Million
49
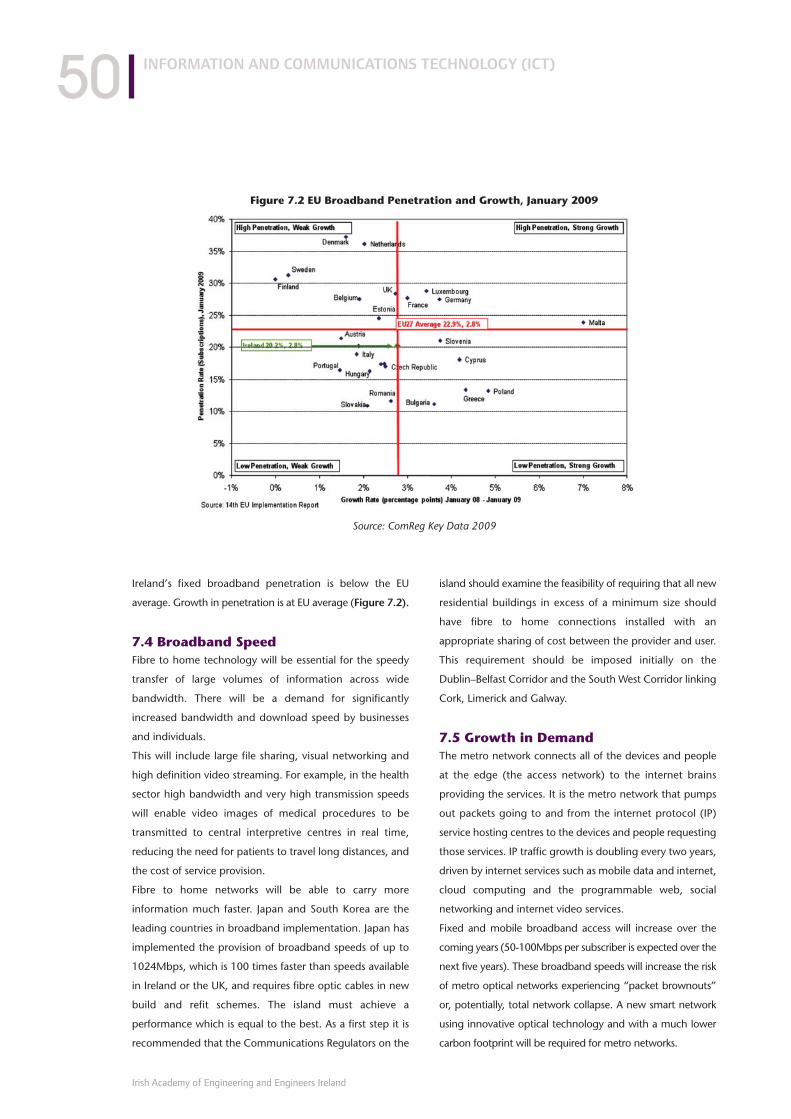
Ireland’s fixed broadband penetration is below the EU
average. Growth in penetration is at EU average (Figure 7.2).
7.4 Broadband SpeedFibre to home technology will be essential for the speedy
transfer of large volumes of information across wide
bandwidth. There will be a demand for significantly
increased bandwidth and download speed by businesses
and individuals.
This will include large file sharing, visual networking and
high definition video streaming. For example, in the health
sector high bandwidth and very high transmission speeds
will enable video images of medical procedures to be
transmitted to central interpretive centres in real time,
reducing the need for patients to travel long distances, and
the cost of service provision.
Fibre to home networks will be able to carry more
information much faster. Japan and South Korea are the
leading countries in broadband implementation. Japan has
implemented the provision of broadband speeds of up to
1024Mbps, which is 100 times faster than speeds available
in Ireland or the UK, and requires fibre optic cables in new
build and refit schemes. The island must achieve a
performance which is equal to the best. As a first step it is
recommended that the Communications Regulators on the
island should examine the feasibility of requiring that all new
residential buildings in excess of a minimum size should
have fibre to home connections installed with an
appropriate sharing of cost between the provider and user.
This requirement should be imposed initially on the
Dublin–Belfast Corridor and the South West Corridor linking
Cork, Limerick and Galway.
7.5 Growth in DemandThe metro network connects all of the devices and people
at the edge (the access network) to the internet brains
providing the services. It is the metro network that pumps
out packets going to and from the internet protocol (IP)
service hosting centres to the devices and people requesting
those services. IP traffic growth is doubling every two years,
driven by internet services such as mobile data and internet,
cloud computing and the programmable web, social
networking and internet video services.
Fixed and mobile broadband access will increase over the
coming years (50-100Mbps per subscriber is expected over the
next five years). These broadband speeds will increase the risk
of metro optical networks experiencing “packet brownouts”
or, potentially, total network collapse. A new smart network
using innovative optical technology and with a much lower
carbon footprint will be required for metro networks.
INFORMATION AND COMMUNICATIONS TECHNOLOGY (ICT)
Irish Academy of Engineering and Engineers Ireland
50
Figure 7.2 EU Broadband Penetration and Growth, January 2009
Source: ComReg Key Data 2009

7.6 International ConnectionsA direct connection to Europe should be established, in
addition to routes through Great Britain, using advanced
communications technology. This will enable Ireland to be
a virtual extension of the main internet exchanges in
mainland Europe and extend choice. Direct access to an
international backbone will be needed in the South of
Ireland similar to the Kelvin Project in Northern Ireland (this
involves connecting a new submarine cable from Co. Derry
to an existing transatlantic cable 22 miles offshore) with
Government-supported interconnection to existing
submarine cables.
7.7 Data CentresEncouraging the location of data centres should be a key
part of future ICT strategy. Data centres will attract further
companies to the island and will drive the content industry
and ancillary business. Data centres are major users of
energy, especially for cooling. Success in this area will be
dependent on the availability of competitively priced
electricity produced with low GHG emissions.
Microsoft, the world’s largest software producer, has opened
its first “Mega Data Centre” in the Dublin area to offer cloud
computer services which run customers’ software in the data
centre rather than on their own computers. This is a
significant addition to the Dublin–Belfast Corridor.
The island has a climatic advantage for the location of large
data centres due to the moderate temperatures prevailing
which favours the use of natural cooling and reduces what
would otherwise be very high energy costs.
INFORMATION AND COMMUNICATIONS TECHNOLOGY (ICT)
Infrastructure for an Island Population of 8 Million
51
“Ireland ranks well below the EU average in the
availability of high speed broadband services.”
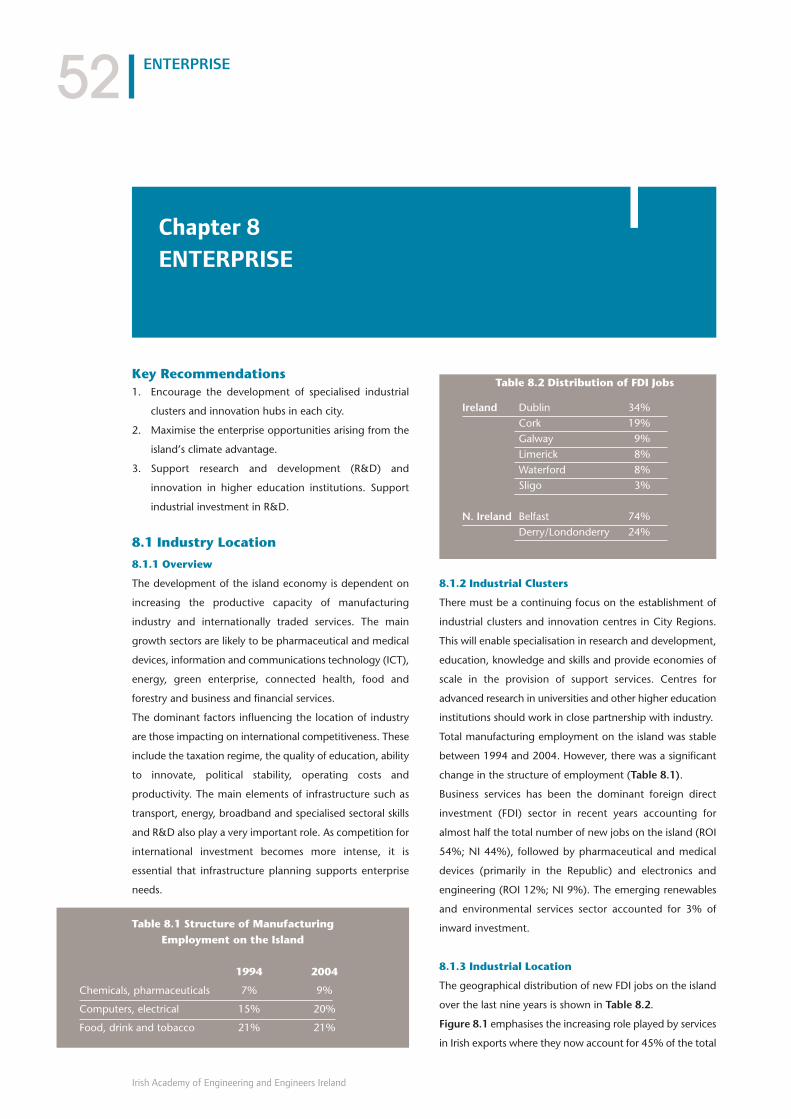
Key Recommendations1. Encourage the development of specialised industrial
clusters and innovation hubs in each city.
2. Maximise the enterprise opportunities arising from the
island’s climate advantage.
3. Support research and development (R&D) and
innovation in higher education institutions. Support
industrial investment in R&D.
8.1 Industry Location
8.1.1 Overview
The development of the island economy is dependent on
increasing the productive capacity of manufacturing
industry and internationally traded services. The main
growth sectors are likely to be pharmaceutical and medical
devices, information and communications technology (ICT),
energy, green enterprise, connected health, food and
forestry and business and financial services.
The dominant factors influencing the location of industry
are those impacting on international competitiveness. These
include the taxation regime, the quality of education, ability
to innovate, political stability, operating costs and
productivity. The main elements of infrastructure such as
transport, energy, broadband and specialised sectoral skills
and R&D also play a very important role. As competition for
international investment becomes more intense, it is
essential that infrastructure planning supports enterprise
needs.
8.1.2 Industrial Clusters
There must be a continuing focus on the establishment of
industrial clusters and innovation centres in City Regions.
This will enable specialisation in research and development,
education, knowledge and skills and provide economies of
scale in the provision of support services. Centres for
advanced research in universities and other higher education
institutions should work in close partnership with industry.
Total manufacturing employment on the island was stable
between 1994 and 2004. However, there was a significant
change in the structure of employment (Table 8.1).
Business services has been the dominant foreign direct
investment (FDI) sector in recent years accounting for
almost half the total number of new jobs on the island (ROI
54%; NI 44%), followed by pharmaceutical and medical
devices (primarily in the Republic) and electronics and
engineering (ROI 12%; NI 9%). The emerging renewables
and environmental services sector accounted for 3% of
inward investment.
8.1.3 Industrial Location
The geographical distribution of new FDI jobs on the island
over the last nine years is shown in Table 8.2.
Figure 8.1 emphasises the increasing role played by services
in Irish exports where they now account for 45% of the total
ENTERPRISE
Irish Academy of Engineering and Engineers Ireland
52
Chapter 8
ENTERPRISE
Table 8.1 Structure of Manufacturing
Employment on the Island
1994 2004
Chemicals, pharmaceuticals 7% 9%
Computers, electrical 15% 20%
Food, drink and tobacco 21% 21%
Table 8.2 Distribution of FDI Jobs
Ireland Dublin 34%Cork 19%Galway 9%Limerick 8%Waterford 8%Sligo 3%
N. Ireland Belfast 74%Derry/Londonderry 24%
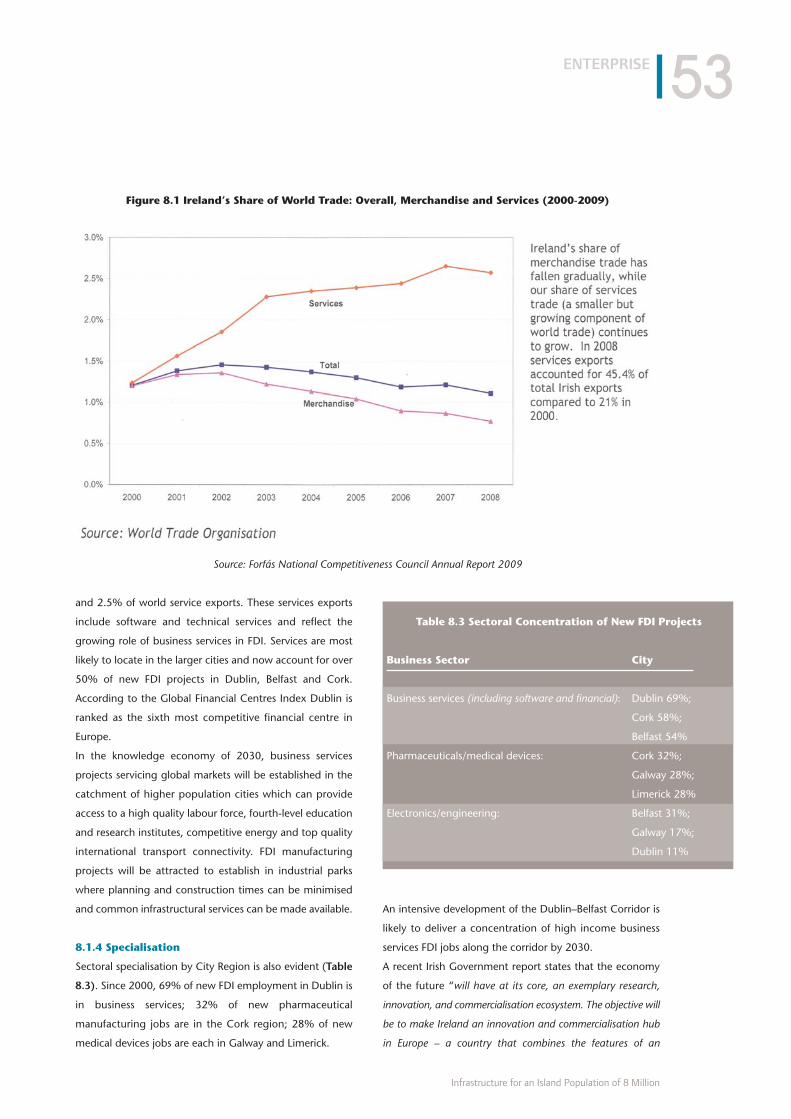
and 2.5% of world service exports. These services exports
include software and technical services and reflect the
growing role of business services in FDI. Services are most
likely to locate in the larger cities and now account for over
50% of new FDI projects in Dublin, Belfast and Cork.
According to the Global Financial Centres Index Dublin is
ranked as the sixth most competitive financial centre in
Europe.
In the knowledge economy of 2030, business services
projects servicing global markets will be established in the
catchment of higher population cities which can provide
access to a high quality labour force, fourth-level education
and research institutes, competitive energy and top quality
international transport connectivity. FDI manufacturing
projects will be attracted to establish in industrial parks
where planning and construction times can be minimised
and common infrastructural services can be made available.
8.1.4 Specialisation
Sectoral specialisation by City Region is also evident (Table
8.3). Since 2000, 69% of new FDI employment in Dublin is
in business services; 32% of new pharmaceutical
manufacturing jobs are in the Cork region; 28% of new
medical devices jobs are each in Galway and Limerick.
An intensive development of the Dublin–Belfast Corridor is
likely to deliver a concentration of high income business
services FDI jobs along the corridor by 2030.
A recent Irish Government report states that the economy
of the future “will have at its core, an exemplary research,
innovation, and commercialisation ecosystem. The objective will
be to make Ireland an innovation and commercialisation hub
in Europe – a country that combines the features of an
ENTERPRISE
Infrastructure for an Island Population of 8 Million
53
Figure 8.1 Ireland’s Share of World Trade: Overall, Merchandise and Services (2000-2009)
Source: Forfás National Competitiveness Council Annual Report 2009
Table 8.3 Sectoral Concentration of New FDI Projects
Business Sector City
Business services (including software and financial): Dublin 69%;
Cork 58%;
Belfast 54%
Pharmaceuticals/medical devices: Cork 32%;
Galway 28%;
Limerick 28%
Electronics/engineering: Belfast 31%;
Galway 17%;
Dublin 11%
attractive home for innovative R&D-intensive multinationals
while also being a highly attractive incubation environment for
the best entrepreneurs in Europe and beyond.” 16
8.1.5 Food and Forestry Sector
The food and forestry sector has a strong indigenous base
and will become even more important in the future because
of the island’s “climate advantage”. At an overall level the use
of innovation in food production should be used to increase
and further develop production of high value food products.
Climate change is predicted to lead to world food shortages
by 2030 at a time when the needs of the world population
will require 50% more food production. Water scarcity will
force more countries to import cereals, meat and food
products.
North Western Europe, including the island of Ireland and
other high latitude regions, will become main centres for
global food production. World food reserves are currently
at a 50-year low. Approximately 1,300 litres of water are
required to produce 1kg of wheat. 1kg of wheat is easier to
ship than 1,300 litres of water. By importing cereal, meat
and other food products (so called imports of “virtual
water”), countries can reduce their agricultural water use.
In addition, some countries where water is scarce have
already taken steps to buy large tracts of agricultural land in
water-rich states to ensure food supplies and conserve water
in their home countries.
There are positive implications for strong medium-term
development of Irish food production, especially cattle, milk
and grain crops. This food will be produced with further
reductions in GHG emissions and using advanced
technology. The primary centres for agricultural production
are in the regions surrounding Cork, Limerick, Dublin and
Waterford.
Similarly, the climatic advantages of the island for the
development of forestry will result in bringing the
development of this sector more into line with European
norms. The island has one of the best climates for the
growth of trees in Europe. Forestry is also a valuable carbon
sink. However, at present the percentage of land afforested
in Ireland is only 10% and in Northern Ireland is only 6%,
compared to 33% in the EU. The level of afforestation in the
EU increased by 35% over the decade to 2005, while the
increase in Ireland was 27%. The target adopted by the Irish
Government is to double the proportion of land under
forestry by 2030. The primary locations for forestry on the
island are the Limerick, Sligo, Waterford and
Derry/Londonderry City Regions.
Finally, the island must also give priority to its marine
resources. This will include supporting offshore aquaculture
R&D which will enable the island to be a main producer of
seafood in the future.
8.2 Education and R&D
8.2.1 Tertiary Education
The future of education on the island is critically dependent
on assumptions made in relation to demographic structure.
It is likely that the population growth will come primarily
from natural growth together with inward migration. Given
the current high level of participation in third-level education
and the fact that many migrants will be educated to degree
(or equivalent) level, this places the focus on the central
importance of postgraduate and continuing education.
There is also an ongoing need to continue training
technicians to sustain continuing economic development.
The 2004 OECD Examiner’s Report on Ireland stated that
“the growth in tertiary education in Ireland has been
extraordinary with the age participation rate rising from 11%
in 1965 to an estimated 57% in 2003 and in numbers from
about 21,000 in 1965 to over 137,000 by 2003” (Department
of Education and Science, Ireland). Ireland was one of the
first European countries to grasp the economic importance
of education and economists suggest that this up-skilling of
the labour force accounts for almost 1% per annum of
ENTERPRISE
Irish Academy of Engineering and Engineers Ireland
54
“In the knowledge economy of 2030, business
services projects will be established in the
catchment of higher population cities.”
16 Building Ireland’s Smart Economy – Government of Ireland 2008
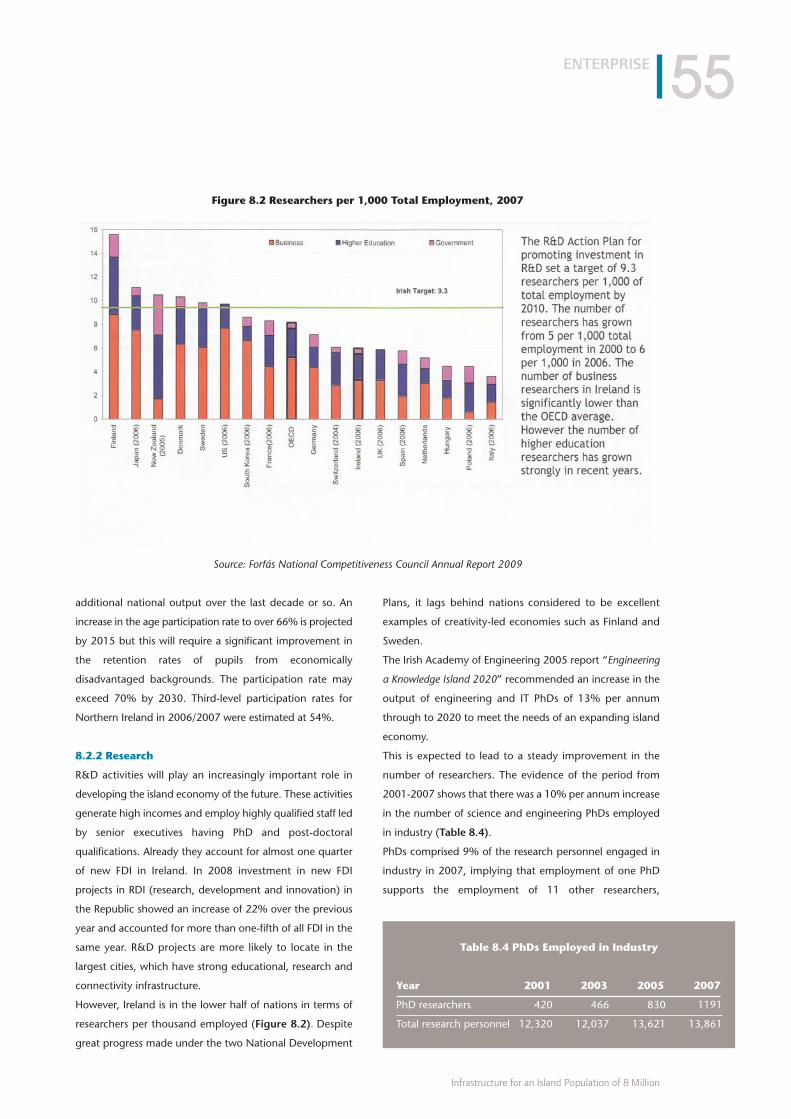
additional national output over the last decade or so. An
increase in the age participation rate to over 66% is projected
by 2015 but this will require a significant improvement in
the retention rates of pupils from economically
disadvantaged backgrounds. The participation rate may
exceed 70% by 2030. Third-level participation rates for
Northern Ireland in 2006/2007 were estimated at 54%.
8.2.2 Research
R&D activities will play an increasingly important role in
developing the island economy of the future. These activities
generate high incomes and employ highly qualified staff led
by senior executives having PhD and post-doctoral
qualifications. Already they account for almost one quarter
of new FDI in Ireland. In 2008 investment in new FDI
projects in RDI (research, development and innovation) in
the Republic showed an increase of 22% over the previous
year and accounted for more than one-fifth of all FDI in the
same year. R&D projects are more likely to locate in the
largest cities, which have strong educational, research and
connectivity infrastructure.
However, Ireland is in the lower half of nations in terms of
researchers per thousand employed (Figure 8.2). Despite
great progress made under the two National Development
Plans, it lags behind nations considered to be excellent
examples of creativity-led economies such as Finland and
Sweden.
The Irish Academy of Engineering 2005 report “Engineering
a Knowledge Island 2020” recommended an increase in the
output of engineering and IT PhDs of 13% per annum
through to 2020 to meet the needs of an expanding island
economy.
This is expected to lead to a steady improvement in the
number of researchers. The evidence of the period from
2001-2007 shows that there was a 10% per annum increase
in the number of science and engineering PhDs employed
in industry (Table 8.4).
PhDs comprised 9% of the research personnel engaged in
industry in 2007, implying that employment of one PhD
supports the employment of 11 other researchers,
ENTERPRISE
Infrastructure for an Island Population of 8 Million
55
Figure 8.2 Researchers per 1,000 Total Employment, 2007
Source: Forfás National Competitiveness Council Annual Report 2009
Table 8.4 PhDs Employed in Industry
Year 2001 2003 2005 2007
PhD researchers 420 466 830 1191
Total research personnel 12,320 12,037 13,621 13,861
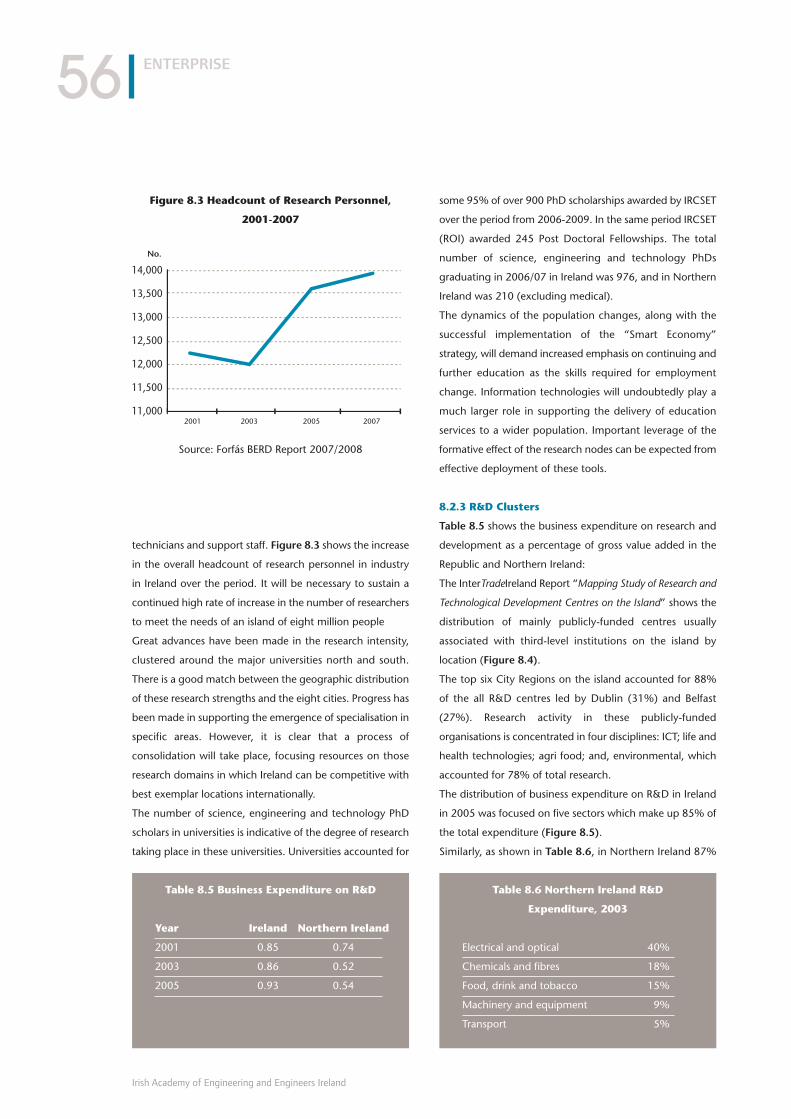
technicians and support staff. Figure 8.3 shows the increase
in the overall headcount of research personnel in industry
in Ireland over the period. It will be necessary to sustain a
continued high rate of increase in the number of researchers
to meet the needs of an island of eight million people
Great advances have been made in the research intensity,
clustered around the major universities north and south.
There is a good match between the geographic distribution
of these research strengths and the eight cities. Progress has
been made in supporting the emergence of specialisation in
specific areas. However, it is clear that a process of
consolidation will take place, focusing resources on those
research domains in which Ireland can be competitive with
best exemplar locations internationally.
The number of science, engineering and technology PhD
scholars in universities is indicative of the degree of research
taking place in these universities. Universities accounted for
some 95% of over 900 PhD scholarships awarded by IRCSET
over the period from 2006-2009. In the same period IRCSET
(ROI) awarded 245 Post Doctoral Fellowships. The total
number of science, engineering and technology PhDs
graduating in 2006/07 in Ireland was 976, and in Northern
Ireland was 210 (excluding medical).
The dynamics of the population changes, along with the
successful implementation of the “Smart Economy”
strategy, will demand increased emphasis on continuing and
further education as the skills required for employment
change. Information technologies will undoubtedly play a
much larger role in supporting the delivery of education
services to a wider population. Important leverage of the
formative effect of the research nodes can be expected from
effective deployment of these tools.
8.2.3 R&D Clusters
Table 8.5 shows the business expenditure on research and
development as a percentage of gross value added in the
Republic and Northern Ireland:
The InterTradeIreland Report “Mapping Study of Research and
Technological Development Centres on the Island” shows the
distribution of mainly publicly-funded centres usually
associated with third-level institutions on the island by
location (Figure 8.4).
The top six City Regions on the island accounted for 88%
of the all R&D centres led by Dublin (31%) and Belfast
(27%). Research activity in these publicly-funded
organisations is concentrated in four disciplines: ICT; life and
health technologies; agri food; and, environmental, which
accounted for 78% of total research.
The distribution of business expenditure on R&D in Ireland
in 2005 was focused on five sectors which make up 85% of
the total expenditure (Figure 8.5).
Similarly, as shown in Table 8.6, in Northern Ireland 87%
ENTERPRISE
Irish Academy of Engineering and Engineers Ireland
56
Figure 8.3 Headcount of Research Personnel,
2001-2007
Source: Forfás BERD Report 2007/2008
14,000
13,500
13,000
12,500
12,000
11,500
11,0002001 2003 2005 2007
No.
Table 8.5 Business Expenditure on R&D
Year Ireland Northern Ireland
2001 0.85 0.74
2003 0.86 0.52
2005 0.93 0.54
Table 8.6 Northern Ireland R&D
Expenditure, 2003
Electrical and optical 40%
Chemicals and fibres 18%
Food, drink and tobacco 15%
Machinery and equipment 9%
Transport 5%
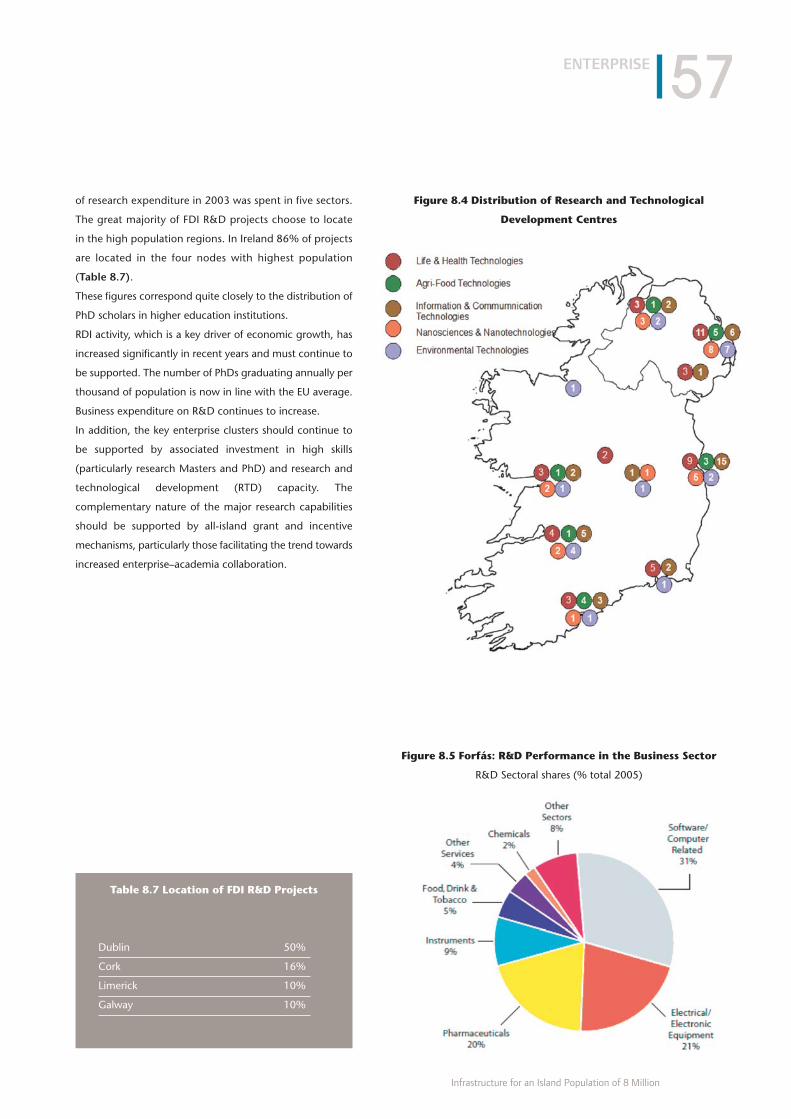
of research expenditure in 2003 was spent in five sectors.
The great majority of FDI R&D projects choose to locate
in the high population regions. In Ireland 86% of projects
are located in the four nodes with highest population
(Table 8.7).
These figures correspond quite closely to the distribution of
PhD scholars in higher education institutions.
RDI activity, which is a key driver of economic growth, has
increased significantly in recent years and must continue to
be supported. The number of PhDs graduating annually per
thousand of population is now in line with the EU average.
Business expenditure on R&D continues to increase.
In addition, the key enterprise clusters should continue to
be supported by associated investment in high skills
(particularly research Masters and PhD) and research and
technological development (RTD) capacity. The
complementary nature of the major research capabilities
should be supported by all-island grant and incentive
mechanisms, particularly those facilitating the trend towards
increased enterprise–academia collaboration.
ENTERPRISE
Infrastructure for an Island Population of 8 Million
57
Table 8.7 Location of FDI R&D Projects
Dublin 50%
Cork 16%
Limerick 10%
Galway 10%
Figure 8.4 Distribution of Research and Technological
Development Centres
Figure 8.5 Forfás: R&D Performance in the Business Sector
R&D Sectoral shares (% total 2005)

Key RecommendationBuild an advanced IT infrastructure within the healthcare
system linked to the broadband network, which will enable
the use of sophisticated personal-use diagnostic devices and
allow for early detection of life-threatening events.
9.1 Introduction Consideration of the critical elements of infrastructure
required on the island of Ireland, to cater for an increased
population of eight million and to support a world class
competitive economy, must include recommendations in
relation to an appropriate health infrastructure to support
this scenario.
9.2 Preventive Health & Safety MeasuresSome of the greatest improvements in public health have
come from social and public engineering initiatives such as
the provision of clean water in the 19th century and the
switch to smokeless fuels in the 20th century.
Good engineering design and practice will deliver improved
road safety, improved workplace safety, especially in
construction and farming, and improved air quality in towns
and cities by removing particulates and emissions from
vehicle exhausts.
9.3 Life ExpectancyLife expectancy at birth will continue to increase, probably
reaching an average of 82 years by 2030. As families
become smaller and more dispersed there will be fewer
people to care for elderly relatives. New monitoring and
sensing devices for use at home and advanced IT will be
important in this regard. The proportion of the population
over 65 will increase from 11% in 2007 to approximately
22% in 2030. This major demographic change will create
an increased demand for healthcare in all service areas
including day care, in-patient hospital care, general
practitioner care and out-patient services. There will also be
an increased demand for long-term care in residential
facilities with approximately 30,000 additional places
required.
9.4 SpecialisationThe treatment of major diseases, such as cancer and
cardiovascular disease, will be concentrated in a limited
number of specialised centres with alliances formed
between different hospitals. The location of some of these
specialised centres will be associated with medical
research and development (R&D) clusters. Access by
patients to the centres will be facilitated by high quality
road and rail transport links between cities.
9.5 OpportunitiesToday the island is a world manufacturer of pharmaceuticals
and medical devices. However, once products become
commoditised it becomes easier to manufacture them in
low cost locations. To continue to grow the economy it will
be necessary to switch from being investment driven to
being innovation driven. R&D will be crucial as we deliver
new and better products and services to the market. The
pharmaceutical, chemical, medical devices and diagnostic
sectors will provide good opportunities for growth while
also contributing to improvements in national health and
well being.
9.6 Education and TrainingAs outlined in Section 8, education will be a key factor
underpinning future success in the medical technology
sector with a need for a substantial increase in the numbers
studying science and engineering subjects at third level and
in the numbers of graduates proceeding to fourth level
(Masters and PhD).
ENGINEERING FOR HEALTH
Irish Academy of Engineering and Engineers Ireland
58
Chapter 9
ENGINEERING FOR HEALTH

9.7 ICT InfrastructureAn advanced IT infrastructure linked to the broadband
network has the capacity to bring significant benefits to the
population and to the delivery of healthcare on the island.
When harnessed, advanced IT and communications
technologies have the potential to improve efficiencies,
reduce errors, free up staff to concentrate on patient care
and reduce costs of provision. The availability of
sophisticated personal-use diagnostic devices will allow for
early detection of life-threatening events. They will also
allow chronic diseases to be controlled more effectively. This
will require an integrated patient record system, an
integrated IT system linking GPs, diagnostic laboratories,
hospitals and clinicians and community care centres using
an advanced national broadband network. This will allow
the healthcare system to become more patient centred with
more emphasis on care in the home.
The IT infrastructure will also provide more support in the
home including hand-held monitors and wearable sensors
which transmit information to central care centres. In
addition, high bandwidth and very high speeds of
transmission will enable video images of medical procedures
to be transmitted to central interpretive centres in real time,
reducing the need for patients to travel long distances and
will reduce the cost of service provision. The most skilled
medical staff will be able to concentrate on functions
appropriate to their professional expertise.
It is likely that the necessary IT facilities will be provided in the
main cities. Highly specialised centres of excellence will be
located in the larger and more densely populated cities which
deal with large numbers of patients with specific ailments.
ENGINEERING FOR HEALTH
Infrastructure for an Island Population of 8 Million
59
“Some of the greatest improvements in public
health have come from social and public
engineering initiatives.”
Key RecommendationAdopt an integrated approach to all infrastructure planning
to ensure improved efficiency and effectiveness, and
competitiveness at minimum cost.
10.1 Road and Rail IntegrationThe planning of road and rail infrastructure must be co-
ordinated so that each will play its appropriate role in
transport between the cities and in access to and within
cities. For example, there will be an optimum economic
choice between adding new lanes to a motorway and
upgrading the railway track. This will be particularly relevant
on routes having high traffic volumes.
10.2 Gas Storage, LNG, and Oil DistillateStorage at Power StationsThe island is highly dependant on natural gas for electricity
production. The three gas interconnectors to Great Britain
pass through a single distribution point in Scotland. The
island is vulnerable either to a sudden breakdown in the
supply of gas, or the depletion of supplies from the North
Sea. A liquified natural gas (LNG) terminal would diversify
supply sources and also provide storage facilities. Most of
the gas fired electricity power stations can be switched to
operate on oil distillates. There will be an optimum
economic balance between gas storage, LNG and oil
distillate storage.
10.3 Electric Cars and Wind EnergyStorageThe electricity used by electric cars can be supplied largely
through night charging of batteries. This offers the
possibility of using electric cars as a means of storing
electricity generated from wind energy at night. This will
influence the economics of using electric cars and of the
production of wind energy.
10.4 Increased City Density and DistrictHeatingMany European cities are now retrofitting district heating
(DH) schemes to reduce energy consumption and
greenhouse gas emissions. Increasing residential density in
cities will create the opportunity to introduce DH schemes
powered either by combined heat and power plants or by
waste to energy (WTE) plants. Decisions to increase city
density will incorporate the appropriate form of heating for
optimum efficiency and cost.
10.5 Increased City Density and EnergyUse in TransportThere is a strong relationship between high city density and
reduced energy use in transport. Decisions to improve the
quality, frequency, speed and reliability of public transport
will prove economically effective when combined with
regulations regarding land use.
INFRASTRUCTURE INTEGRATION
Irish Academy of Engineering and Engineers Ireland
60
Chapter 10
INFRASTRUCTURE INTEGRATION
“The planning of road and rail infrastructure
must be co-ordinated so that each will play its
appropriate role in transport.”
10.6 Tidal Barriers and TransportInfrastructureThe level of sea water and river water is expected to
increase significantly by 2030. This will require adaptation
measures in coastal cities, most of which are also located
on river estuaries.
The cost of construction of embankments and tidal barriers
should take account of the possibility of using such
embankments as a foundation for road and possibly rail
infrastructure. An integrated approach will be more cost-
effective in some cases.
10.7 R&D, Education and theDevelopment of Strategic IndustrialSectors An integrated approach to combining research and
development, education and training and the development
of the most important strategic industrial sectors will
increase the possibility for synergy between all three
activities at optimum cost.
INFRASTRUCTURE INTEGRATION
Infrastructure for an Island Population of 8 Million
61
“Decisions to improve public transport will prove
economically effective when combined with
regulations regarding land use.”

Key Recommendations1. Finance the development of infrastructure using a
combination of innovative financing sources including
the Exchequer, public private partnerships, a possible
island of Ireland infrastructure bank, capital markets and
the European Investment Bank.
2. Develop a framework which will allow the private sector
to increase its share of investment in the provision of
infrastructure.
11.1 The ContextOver the past decade the annual rate of investment in gross
fixed capital formation in Ireland has been about 25% of
gross domestic product (GDP). This comprises all
investment in productive machinery, buildings and
infrastructure and includes both public and private
investment.
The scale of total capital investment in Ireland increased
significantly as a share of GDP in the period 1985 to 2007.
From 1985 to 1995 gross domestic fixed capital formation
(GDFCF) averaged around 17% of GDP. In the following
eight years to 2003 it rose to 22%, and in the four years to
2007 it averaged 26%. The bulk of investment is carried out
by the private sector in dwellings, commercial property and
plant and equipment, which typically accounts for close to
80% of total GDFCF. The remainder, around 22%, is carried
out through the exchequer funded Public Capital
Programme.
ECONOMIC ASSESSMENT
Irish Academy of Engineering and Engineers Ireland
62
Chapter 11
ECONOMIC ASSESSMENT
Figure 11.1 General Government Gross Fixed Capital Formation as % of GDP, 2008
Source: European Commission, AMECO Database in Forfás National Competitiveness Council Annual Report 2009
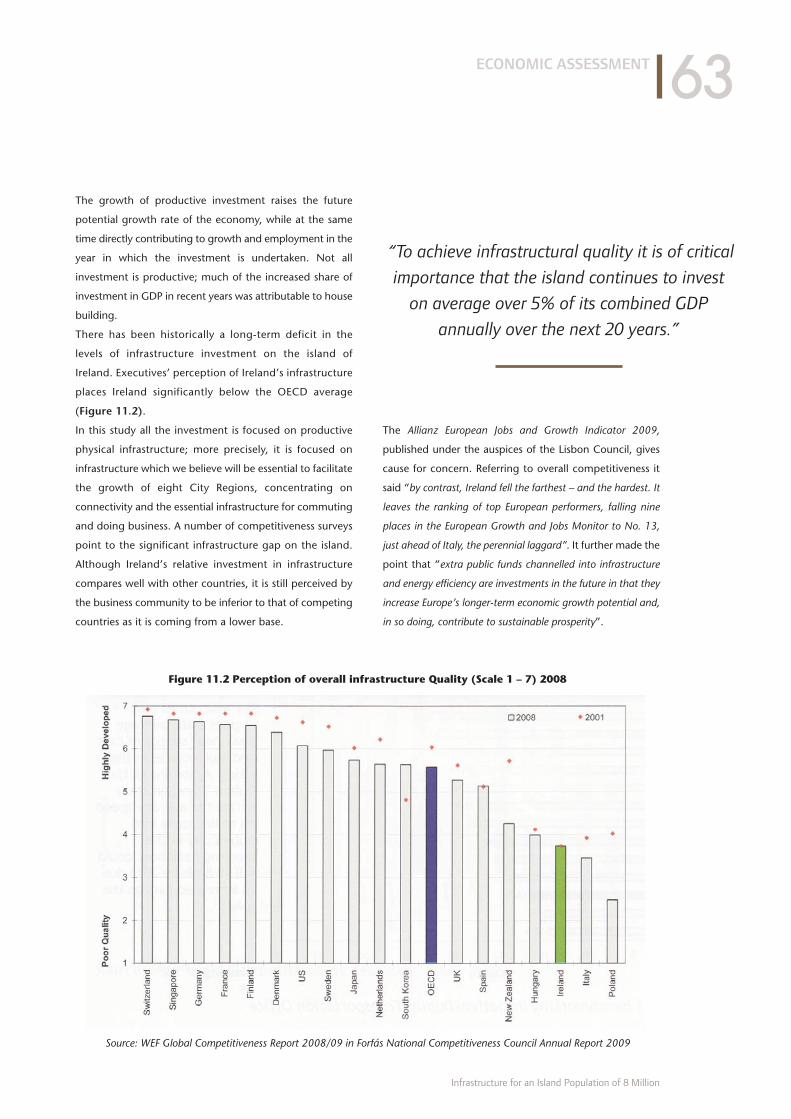
The growth of productive investment raises the future
potential growth rate of the economy, while at the same
time directly contributing to growth and employment in the
year in which the investment is undertaken. Not all
investment is productive; much of the increased share of
investment in GDP in recent years was attributable to house
building.
There has been historically a long-term deficit in the
levels of infrastructure investment on the island of
Ireland. Executives’ perception of Ireland’s infrastructure
places Ireland significantly below the OECD average
(Figure 11.2).
In this study all the investment is focused on productive
physical infrastructure; more precisely, it is focused on
infrastructure which we believe will be essential to facilitate
the growth of eight City Regions, concentrating on
connectivity and the essential infrastructure for commuting
and doing business. A number of competitiveness surveys
point to the significant infrastructure gap on the island.
Although Ireland’s relative investment in infrastructure
compares well with other countries, it is still perceived by
the business community to be inferior to that of competing
countries as it is coming from a lower base.
The Allianz European Jobs and Growth Indicator 2009,
published under the auspices of the Lisbon Council, gives
cause for concern. Referring to overall competitiveness it
said “by contrast, Ireland fell the farthest – and the hardest. It
leaves the ranking of top European performers, falling nine
places in the European Growth and Jobs Monitor to No. 13,
just ahead of Italy, the perennial laggard”. It further made the
point that “extra public funds channelled into infrastructure
and energy efficiency are investments in the future in that they
increase Europe’s longer-term economic growth potential and,
in so doing, contribute to sustainable prosperity”.
ECONOMIC ASSESSMENT
Infrastructure for an Island Population of 8 Million
63
“To achieve infrastructural quality it is of critical
importance that the island continues to invest
on average over 5% of its combined GDP
annually over the next 20 years.”
Figure 11.2 Perception of overall infrastructure Quality (Scale 1 – 7) 2008
Source: WEF Global Competitiveness Report 2008/09 in Forfás National Competitiveness Council Annual Report 2009
Over the last decade there has been a significant shift in the
public finance made available for capital investment within
both jurisdictions, rising to between 4% and 5% of GDP
annually in fixed capital investment in civil infrastructure in
Ireland and, more recently, in Northern Ireland. In addition
to this, commercial state bodies such as ESB and CIE in
Ireland may fund a further 1-2% of GDP through their own
resources or borrowings.
The total annual level of public investment in infrastructure
in 2008 on the island of Ireland was more than 5% of GDP
which was about twice the rate in the OECD, and was the
highest rate in the EU 15.
To achieve infrastructural quality comparable with the best
in the developed OECD countries it is of critical importance
that the island continues to invest on average over 5% of its
combined GDP annually over the next 20 years either
directly by means of Government funding and/or through
mechanisms such as public private partnerships and/or,
where appropriate, by direct private investment.
It is worth noting that in a study published earlier this year
the Council for Science and Technology in the UK
anticipates that 65% of UK infrastructure funding will come
from the private sector; 6% from PPPs and the balance of
29% from public funds over the next decade or longer. It is
readily apparent that this contrasts with the experience on
the island of Ireland. We believe that it would be helpful if
some research was undertaken to explore the implications
of this difference on the competitiveness of the island of
Ireland.
11.2 Additional Projects and PotentialSources of FundingThe additional projects recommended in this report would,
if financed solely from Government funds, account for
approximately one-twentieth of the public capital
programme over the 20-year period to 2030. Before
proceeding with each project a rigorous analysis of the cost
and benefits to the economy should be undertaken. Many
projects could be financed in whole or in part from the
menu of options as outlined in Annex 2.
11.3 Funding the Island’s InfrastructureInvestmentThere is now intense competition for finance across the
globe. The funding environment over the past two decades
has been remarkably conducive to funding long-term
capital investment with financial institutions able to lend
long-term whilst being funded through short-term
borrowings.
The financial crisis of the past two years has however
radically altered this business model. It will be critical
therefore to identify better “matched” funding between
long-term assets and long-term liabilities. The pension
industry in particular provides such a match and
increasingly is recognising infrastructure as a suitable asset
class. More needs to be done to explore new sources of
funding and it is recommended that consideration be given
to the development of an infrastructure bank on the island
to provide long term funding for infrastructure projects.
Such an initiative would clearly require the support of both
governments although it would be important to ensure that
state control/ownership did not result in its commitments
being classified as public expenditure. In addition, it would
also need the support of institutions including the pension
funds and the European Investment Bank, which is
increasingly supporting infrastructure investment on the
island of Ireland. Consideration could be given potentially
to some tax advantages for investors and there are a
number of international models to inform the model that
could be developed.
Because public finances on the island are likely to be
constrained for a number of years it is essential that
alternative sources of finance are investigated with some
urgency as at times, when exchequer finances are under
pressure, capital expenditure may bear the brunt of
cutbacks.
In conclusion, the magnitude of the challenge to reach and
sustain the necessary rate of infrastructure investment to
achieve a world-class competitive economy will require the
use of new and innovative approaches to funding such
public infrastructure.
ECONOMIC ASSESSMENT
Irish Academy of Engineering and Engineers Ireland
64
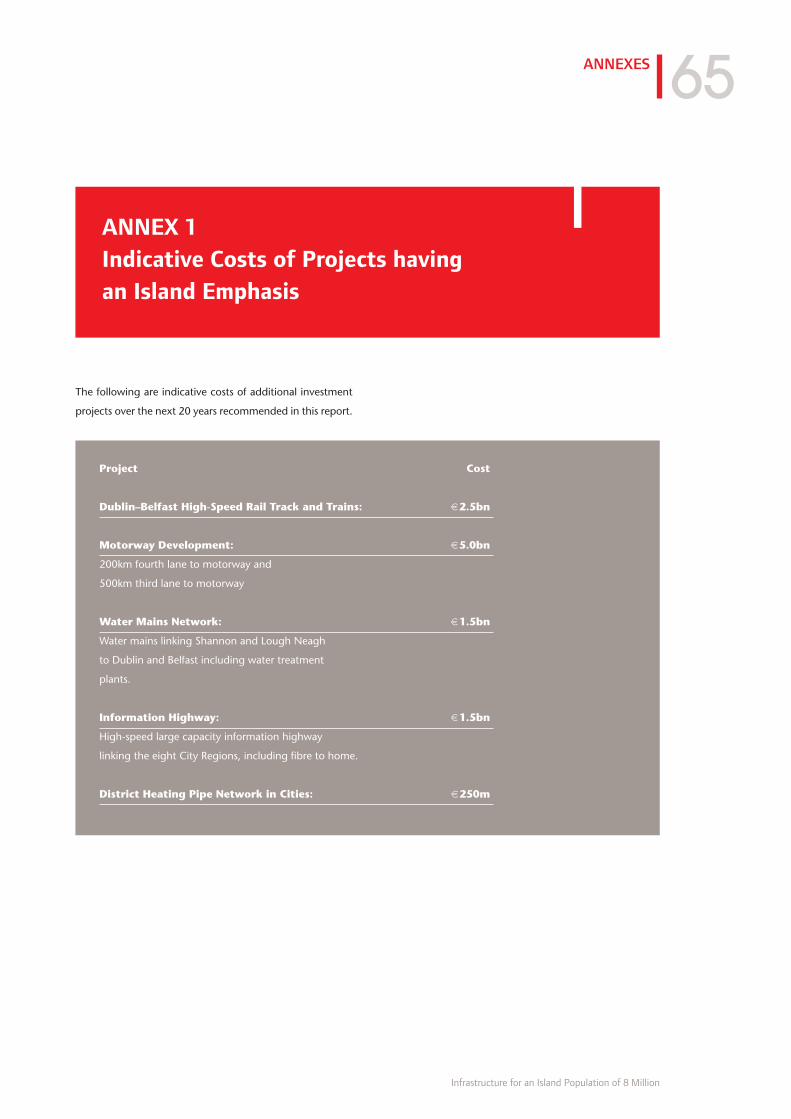
The following are indicative costs of additional investment
projects over the next 20 years recommended in this report.
ANNEXES
Infrastructure for an Island Population of 8 Million
65
Project Cost
Dublin–Belfast High-Speed Rail Track and Trains: €2.5bn
Motorway Development: €5.0bn
200km fourth lane to motorway and
500km third lane to motorway
Water Mains Network: €1.5bn
Water mains linking Shannon and Lough Neagh
to Dublin and Belfast including water treatment
plants.
Information Highway: €1.5bn
High-speed large capacity information highway
linking the eight City Regions, including fibre to home.
District Heating Pipe Network in Cities: €250m
ANNEX 1
Indicative Costs of Projects having
an Island Emphasis
Infrastructure can be funded and delivered in a variety of
ways including:
■ Commercially-driven, user-paid infrastructure, e.g.,
unregulated airport and ports where it is for the
developer to decide what and when infrastructure is
built. Any development is then paid for by consumers.
Prices are not regulated because competition exists.
■ Commercially driven, user paid but price-regulated
infrastructure such as airports, electricity generation and
transmission, and gas transmission. Price-regulated
businesses where independent regulators play a role in
determining the level and nature of investment.
■ Price-regulated business that is funded by the taxpayer
and users, e.g., toll roads, and rail, where the regulator
sets efficiency targets and prices for the business. In
recent years €2bn has been invested by the private
sector in road construction public private partnership
(PPP) programmes in Ireland without which these roads
would not have been built. This investment is
remunerated from toll charges. User charges also have
the advantage of rationing the use of scarce resources
■ Publicly-funded infrastructure such as non-tolled roads.
In this case, public authorities decide where they should
go, when they should be built and pay for them.
In many sectors the main action required to stimulate
appropriate capital expenditure will be regulatory or public
legislative measures. For example, urbanisation and the
density of residential accommodation in cities will be
determined by the need to comply with planning and land
use requirements. Developers will then ensure that the
buildings they construct will be in compliance with the
legislative requirements.
Examples of additional funding sources:
Public Private Partnerships (PPPs): Elements of
infrastructure may be designed, built, financed and operated
by the private sector but ultimate ownership of the facility
is retained by the public authorities. Remuneration may be
received through user and other annual charges over a
long period of time. This method of funding is common in
many European Union Member States.
Infrastructure Bank: An infrastructure bank would
borrow long and lend long and may be funded from
private or public resources or a combination of both. This
type of bank exists in Australia (Infrastructure Australia) and
Germany (KfW). The Nordic Investment Bank is owned by
the Governments of Denmark, Estonia, Finland, Iceland,
Latvia, Lithuania, Norway and Sweden. This type of bank
places a particular emphasis on infrastructure and uses its
position to lever further funds from private investors.
European Investment Bank (EIB): The EIB is owned by
the EU Member States. Its mission is to contribute to the
EU’s policy objectives by financing sound investment.
Though a not-for-profit organisation, it is self-financing,
raising its funds by borrowing on capital markets. The EIB
provides long-term finance for up to 50% of the cost of
infrastructure projects and has a long history of financing
PPPs. All projects benefit from at least one form of EIB
financial value added such as a low cost of funding, longer
maturity or grace period and diversification of funding. The
EIB has financed many public sector infrastructure projects
and PPPs in areas such as roads, energy, water and
sewerage and education on the whole island.
Mutual Funding Model Finance: This is suitable for a
major project which is capital intensive and which has a
protected income such as through the process of
regulation. Funding is totally by debt and can be provided
by capital markets. Interest and capital payments are made
each year. Projects have a long life, usually 25 to 50 years.
Northern Ireland Energy Holdings is an example that
currently has £350m capital and has been operating
successfully for four years.
ANNEXES
Irish Academy of Engineering and Engineers Ireland
66
ANNEX 2
Menu of Funding Options
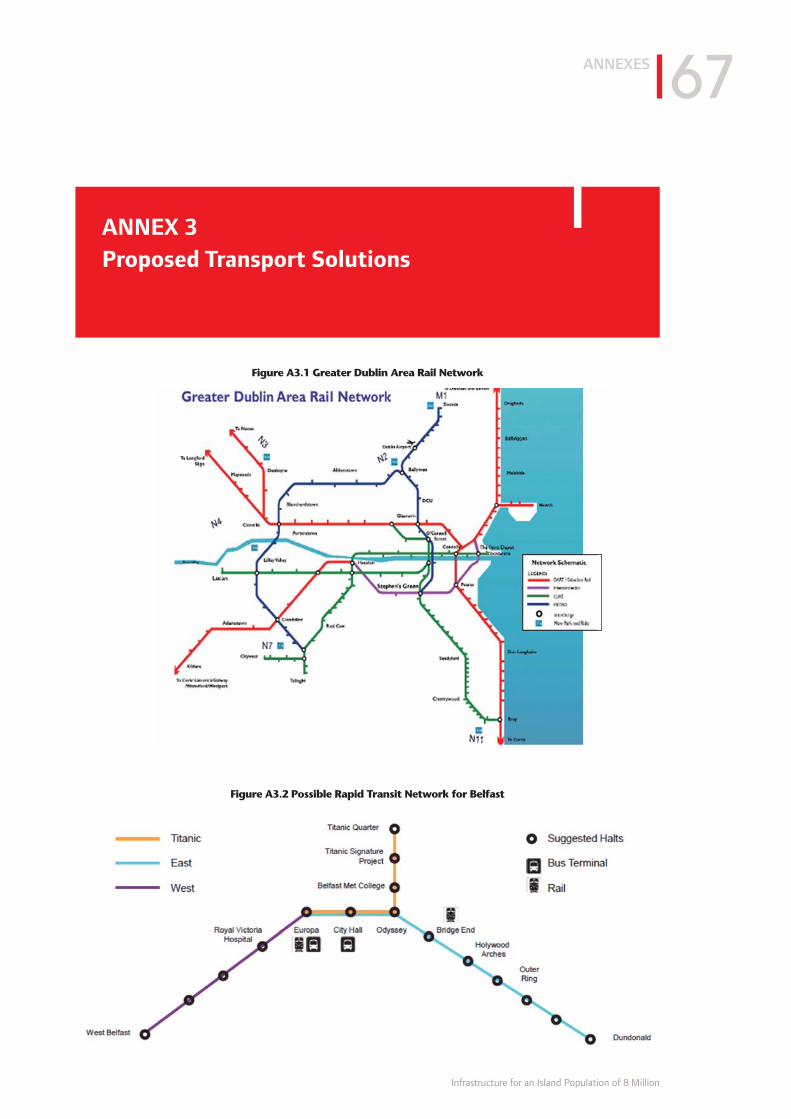
ANNEXES
Infrastructure for an Island Population of 8 Million
67
ANNEX 3
Proposed Transport Solutions
Figure A3.1 Greater Dublin Area Rail Network
Figure A3.2 Possible Rapid Transit Network for Belfast
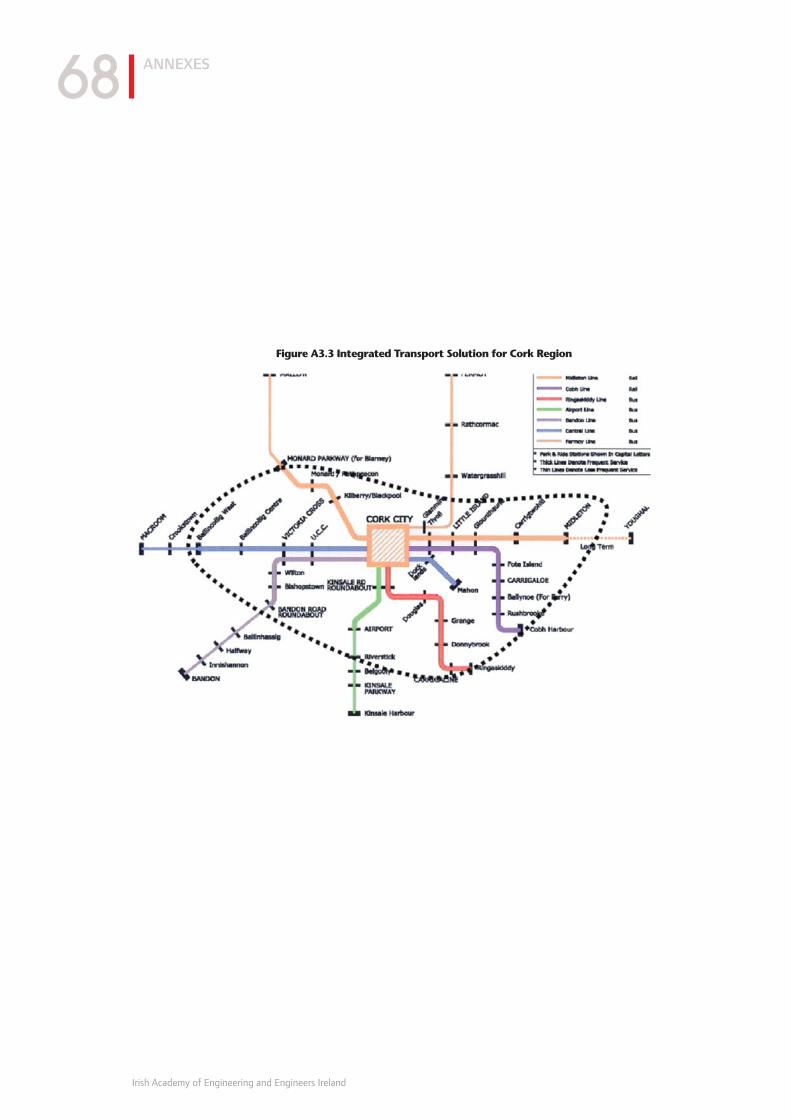
ANNEXES
Irish Academy of Engineering and Engineers Ireland
68
Figure A3.3 Integrated Transport Solution for Cork Region
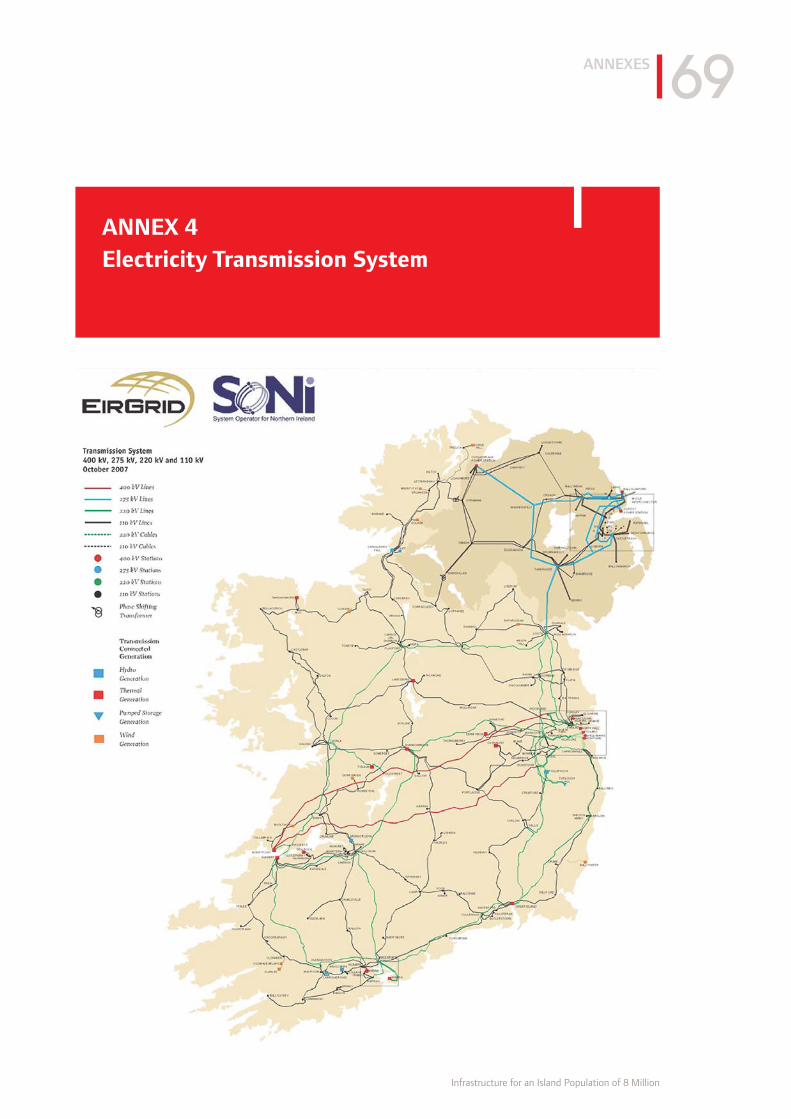
ANNEXES
Infrastructure for an Island Population of 8 Million
69
ANNEX 4
Electricity Transmission System

ANNEXES
Irish Academy of Engineering and Engineers Ireland
70
BRIC Brazil, Russia, India, China
CCGT Combined cycle gas turbine
CCS Carbon capture storage
CHP Combined heat and power
DH District heating
EU European Union
EU ETS European Union, Emission Trading System
FDI Foreign direct investment
GDFCF Gross domestic fixed capital formation
GDP Gross domestic product
GHG Greenhouse gases
GVA Gross value added
IAE Irish Academy of Engineering
ICT Information and communications technologies
IGCC Integrated gasification combined cycle
IRCSET Irish Research Council for Science, Engineering & Technology
LNG Liquified natural gas
Lo-Lo Lift on lift off
NI Northern Ireland
NSS National Spatial Strategy
PPP Public private partnership
PWS Public Water Supplies
RDI Research, Development and Innovation
RDS Regional Development Strategy
ROI Republic of Ireland
RoRo Roll on roll off
RTD Research and Technological Development
SuDS Sustainable drainage systems
WTE Waste to Energy
ANNEX 5
List of Acronyms


Th
inkM
edia
.ie
Irish Academy of Engineering22 Clyde RoadBallsbridgeDublin 4
T: +353 1 665 1337E: [email protected]
Engineers Ireland22 Clyde RoadBallsbridgeDublin 4