Embed Size (px)
Citation preview

Infrastructure meets Business Globally: What to Expect from PFI?
Nuno Gil
Manchester Business School (on sabbatical)
Global Research Awardee (Royal Academy of Engineering)
CRGP, Stanford University (visiting scholar)
© Nuno Gil Hong Kong, 2009

Infrastructure meets Business
• Infrastructure Gap is Massive (~ $53 trillion OECD07)
– population growth, migration towards cities, deteriorated infrastructure, globalization of supply chains
• Governments worldwide resort to private-sector capital due to constrained budgets and neo-liberal ideology
© Nuno Gil Hong Kong, 2009

Infrastructure meets Business– transportation (airports, railways, highways, ports)– utilities (water, electricity, gas)– social assets (hospitals, schools, prisons)
© Nuno Gil Hong Kong, 2009

• The Funding Issue
i) user chargesii) government budgetiii) hybrid scheme
© Nuno Gil Hong Kong, 2009
•
© Nuno Gil Hong Kong, 2009
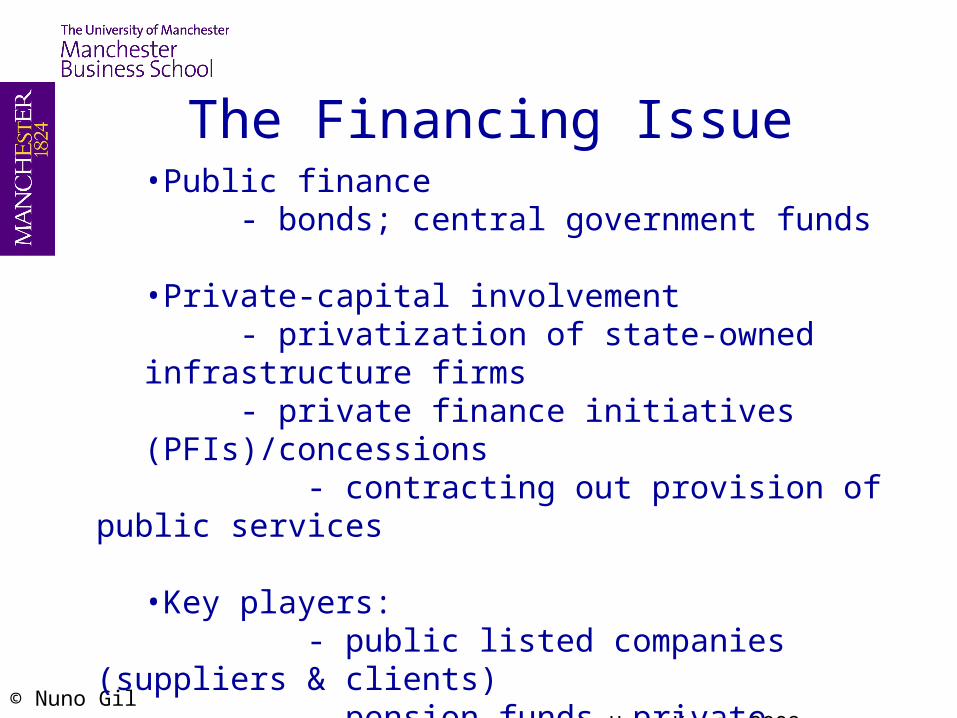
The Financing Issue•Public finance
- bonds; central government funds
•Private-capital involvement- privatization of state-owned infrastructure firms
- private finance initiatives (PFIs)/concessions - contracting out provision of public services
•Key players: - public listed companies (suppliers & clients) - pension funds, private investors, family houses; infrastructure funds; funds of infrastructure funds

Different PFI structures
PFI with Minimum Revenue Guarantee
PFI Concession
(Annual Revenue)
Am
ou
nt R
eve
nu
e
Traffic Volume
Private User Revenue Paid to Concessionaire
Revenue Cap
Am
ou
nt R
eve
nu
e
Traffic Volume
Private User Revenue Paid to Concessionaire
Government Minimum Revenue Payment
Cost to Government = 0%
Availability Finance = Possible
Cost to Government = 100%
Availability Finance = Certain
Cost to Government = ?%
Availability of Finance= Probable
PFI Concession
(Annual Revenue)
Am
ou
nt R
eve
nu
e
Traffic Volume
Government Annuity Payment to
Concessionaire
Revenue Cap
Source: Presentation from Asian Development Bank, PPPI Days, Washington D.C., December 15-18, 2008

Public Procurement alternativesDesign BuildIdea Operat
e
Public
Authority
Operator
Outsourcin
g
BOL/ BOT /
BTO/ PFI
Concession
Design & Build
Service
Contract
Finance
All In-
house
Source: Presentation by Marco Venturini, Northern Europe Veolia Water

UK Public Sector Institutions relevant to PFI
HM TreasuryPolicy
HM TreasuryPolicy
Partnerships for SchoolsPDO
Partnerships for SchoolsPDO
Partnerships UKImplementation
Partnerships UKImplementation
Sector Ministry Private Finance Units
Sector Ministry Private Finance Units
Devolved Government Policy Units
Devolved Government Policy Units
Auditing bodiese.g. National Audit Office
Auditing bodiese.g. National Audit Office
Other key support bodiese.g. 4ps
support to Local Authorities
Other key support bodiese.g. 4ps
support to Local Authorities
Source: Presentation from Ed Farquharson, Partnerships UK, PPPI Days, Washington D.C., December 15-18, 08

PUK Ownership Structure
49% 51%
Advisory Council
HMT Perm Sec ChairUK-Wide Public Sector
representation
Board
2 HMT Nomineesinc. 1 Sh. Exec.
HM Treasury (45%)
Scottish Ministers (4%)
Private Sector Institutions
PUK Investments
Partnerships for Schools
PUKPUK
DfES
Source: Presentation from Ed Farquharson, Partnerships UK, PPPI Days, Washington D.C., December 15-18, 08

UK PPP programme
893 projects, £78bn capital value, of which 687 now operational Source: Presentation from Ed Farquharson, Partnerships UK, PPPI Days, Washington D.C., December 15-18, 08

PPI Development Process
Source: Presentation from Jay-Hyung Kim , Korea Development Institute, PPPI Days, Washington D.C., December 15-18, 08
PIMAC - Public and Private Infrastructure Investment Management Center; VfM – value for Money

South Africa PPP Unit
Parpublica (Portugal)
Partnerships UK
Partnerships Victoria (AUS)
Partnerships BC
PPP Knowledge
Center (Netherlands)
UFP (Italy)
MAPPP (France)
Legend:- Dotted line – Consulted with Agency- Solid line – Modeled after Agency
Central PPP Policy Unit
(Ireland)
PPP Centrum (Czech
Republic)
PPP Central Agency (Fiji)
PMAC (Korea)
New South Wales (AUS)
PFI Promotion Office (Japan)
2000 2001 2002 2003 2004 2005 2006 2007
Flemish PPP Knowledge
Center
Partnerships S. Australia
PPP Unit (Mauritius)
National PPP Forum (AUS)
PPP Policies(Singapore)
Efficiency Unit
(Hong Kong)
PPP Unit (Slovakia)
Infrastructure Ontario
French Institute for PPP (France)
Secretariat for PPP (Greece) PPP STIP
Agency (Croatia)
Agencies Interviewed
Other Agencies
Global Diffusion of the PPP Agency Model*
Source: Presentation from Ray Orr, CRGP, Stanford, PPPI Days, Washington D.C., December 15-18, 2008

Approximate Size of Various Programs
Value of Deals ($B)
Number of Deals
UK Highways Agency $158.0 846
Infrastructure Ontario ≥$6.0 40+
MAPPP $5.8 147
Parpublica $10.2 49
Partnerships BC $4.5 23
Partnerships Victoria $5.5 17
Partnerships UK $61.7 450
South Africa PPP Unit $4.5 18
Total $256.2 1590
Source: Presentation from Ray Orr, CRGP, Stanford Univ., PPPI Days, Washington D.C., December 15-18, 2008

PPIs in Asia - a mixed picture PPIs in Asia - a mixed picture Total PPP investment in 2007 (USD million)Total PPP investment in 2007 (USD million)
7,388
China
Indonesia
1,441
Philippines
1,376
Georgia
962
India
14,232
Pakistan
1,434
Cambodia
649
Vietnam
374
Source: The World Bank & PPIAF in presentation from Michael Barrow, Asian Development Bank, PPPI Days, Washington D.C., December 15-18, 2008

0%
25%
50%
75%
100%
1992 1993 1994 1995 1996 1997 1998 1999 2000 2001 2002 2003 2004 2005 2006 2007
Latin America and the Caribbean
East Asia and Pacific
Europe and Central Asia
South Asia
Middle East and North Africa
Sub-Saharan Africa
Diversification across Regions
Percentage of PPI Investment in Each Region, 1992-2007
Percentage of total PPI investment
(moving average)
Source: World Bank and PPIAF, PPI Projects database in presentation from Jyoti Shukla, PPIAF Program Manager, PPPI Days, Washington D.C., December 15-18, 2008

PPP sectors in AsiaPPP sectors in Asia Asian PPP investment by sector in 2007 (USD million)Asian PPP investment by sector in 2007 (USD million)
Telecom, 1,324 , 3%
Water and Sewerage, 2,182 , 4%
Transport, 13,853 , 28%
Energy, 31,274 , 65%
Source: The World Bank & PPIAF in presentation from Michael Barrow, Asian Development Bank, PPPI Days, Washington D.C., December 15-18, 2008
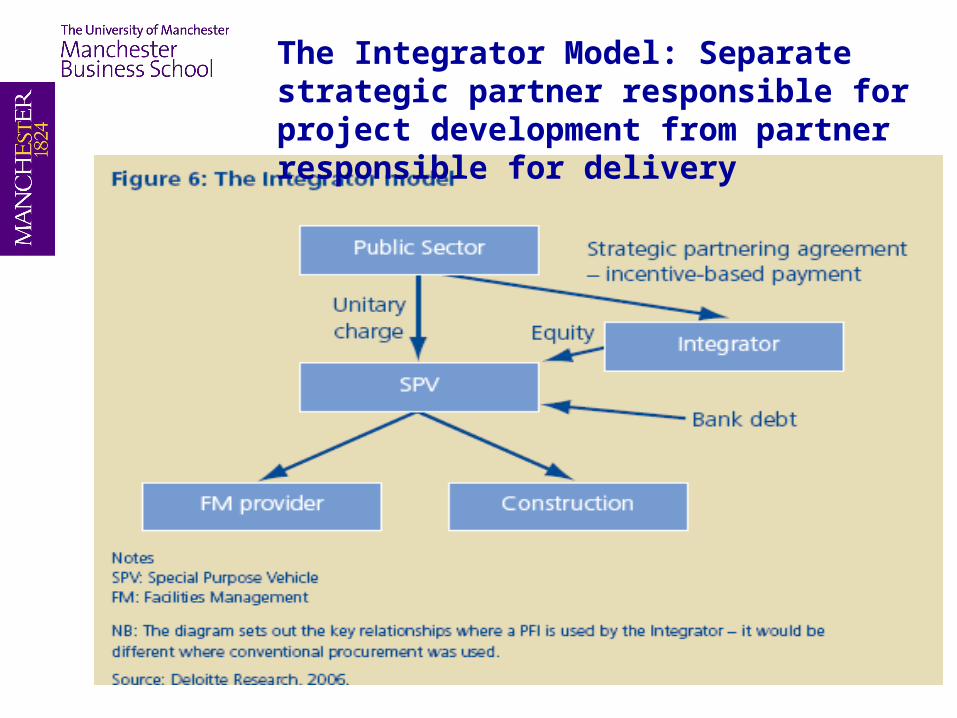
The Integrator Model: Separate strategic partner responsible for project development from partner responsible for delivery

The case of Competitive Partnership: Local Education Partnerships (LEPs)/Local Improvement Finance Trusts (LIFTs)

The case of Competitive Partnership: Local Education Parternships(LEPs)/Local Improvement Finance Trusts (LIFTs)
Source: SRCI (2005) report

The case of Competitive Partnership: Local Education Parternships(LEPs)/Local Improvement Finance Trusts (LIFTs)
Source: SRCI (2005) report
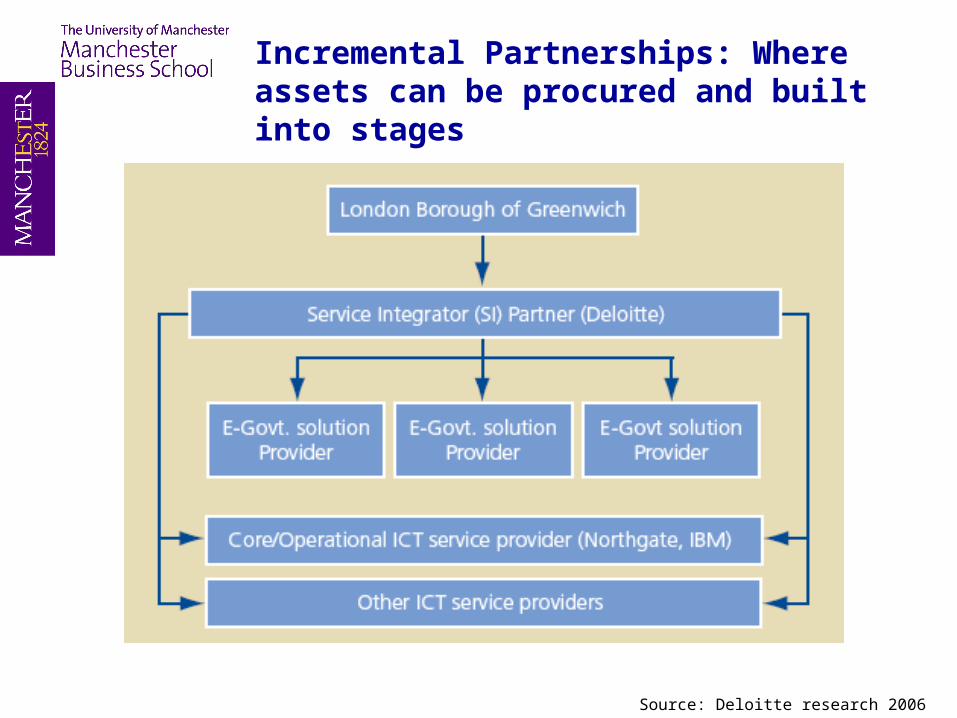
Incremental Partnerships: Where assets can be procured and built into stages
Source: Deloitte research 2006

Government
Concessionaire
IFI
Revenue Support Fund
Minimum Revenue Payments
Loan AgreementCommercial
Lenders
Performance Auditor and Panel
of Experts
Arbitrator
Arbitration
Performance monitoring and expert
opinion
Debt Repayment
Standby Loan Agreement
ProceedsContractual
and Regulatory Guarantee
Concession Agreement
Tariff Revenues
Cash Cascade:
1. O&M
2. Debt
3. CAPEX
4. Profit distribution
CAPEX = capital expenditure, IFI = International Financial Institution O&M = operations and maintenance
Resolves concerns about political risk, and it ensures necessary funding is available if
guarantee calledSource: Presentation from Asian Development Bank, PPPI Days, Washington D.C., December 15-18, 2008
Integrator Model for Large Infrastructure Projects

Infrastructure Funds - Performance
Source: The World Bank & PPIAF in presentation from Michael Barrow, Asian Development Bank, PPPI Days, Washington D.C., December 15-18, 2008

Telecom 17%
Water2%
Transport33%
General14%
Electricity34%
Ethiopia10%
Others28%
Angola20%
Sudan8%
Nigeria34%
Chinese financial investments in Sub-Saharan Africa, 2001-2007
Chinese Investment by Country,
2001-2007
Chinese Investment by Sector,
2001-2007
Source: World Bank and PPIAF, PPI Projects database in presentation from Jyoti Shukla, PPIAF Program Manager, PPPI Days, Washington D.C., December 15-18, 2008