Embed Size (px)
Citation preview
Chapter 17
Infrastructure
Mountains present a challenge to mankind. Thoughseen as obstacles to trade, they have been home toremarkable trade activities like the Silk Route in CentralAsia, routes built by the Roman Empire across theAlps, and the Incas in the Andes. Hill regions needlinkages with surrounding lands because while theyremain extremely important for hill residents, openareas for cross-region co-operation, to the mutual benefitof both societies.
Widespread and deep-rooted poverty has been thesingle biggest challenge for sustainable development ofmountain areas in the Himalayas, and India hasrecorded notable successes in this endeavour. While thehitherto-targeted improvements in agriculturalproductivity and employment are critical, the rapidlygrowing labour force in mountain areas cannot begainfully absorbed by agriculture alone, and substantialefforts are needed to diversify the mountain economyand enhance the living standards of the mountainpopulation.
In order for mountain economies and environmentsto develop in a sustainable manner, developmentdecisions concerned with their diversification must bebased on sound assessment of past experiences,existing constraints, and available opportunities.
The critical issue here is – accessibility. This is bothin terms of the local citizens, and for societies outsidethe region. For residents, infrastructure brings inproducts and services like energy and raw materials,necessary for survival and economic sustainability. Italso brings in the tourist, with possibilities of dramaticrise in societal incomes. For people outside the region,it opens up new markets.
The fundamental role of infrastructure in a hill statelike Himachal Pradesh is two fold:
I. To open up the state and improve accessibility,both for the residents and the outside world,including tourists, and
II. To ensure that the demands of energy andcommunication are put in place concurrently, tocater to sustained economic development,without environmental degradation.
Thomas Kohler et al. , have stressed that “access, commu-nication and energy are key issues in sustainable development ofmountain areas. Experience has shown that they are very power-ful agents of change, not only, but especially in mountains.Access, communication and energy in mountain regions also in-volve vital linkages between these regions and adjacent lowlands,centres of population, and industrialised and urbanised areas .”
There is a cruel twist to infrastructure provision indifficult terrains like Himachal Pradesh. While it ismore vitally required, it demands higher capitalinfusion. In a plain area, if there is absence of a road tothe district centre, there is possibility of walking to it.In a hill terrain, it would take a day to walk to the nexthilltop, where the next district centre may be, and thewalk would be through inhospitable terrain.
To overcome these natural obstacles, infrastructureprovision ends up demanding a higher cost. The develop-ment of modern transport infrastructure, especially ofroads and railways is a costly enterprise in general. Costsin mountains are even higher than in lowlands, for bothconstruction and maintenance, due to difficult topogra-phy, harsh climate, and the need for protection fromhazards, such as avalanches, landslides, and rockfalls, aswell as the need to secure road- and railside slopes.
The important sectors of infrastructure in which wepropose to concentrate in this chapter are:
1. Energy
2. Transport
DE
VELOPME NT REPO
RT
H IMACHAL PRADESH
PL
AN
NIN G CO MM
I SSI
ON
G
OVERNMENT OF INDI
A
H H

HIMACHAL PRADESH DEVELOPMENT REPORT290
In this regard, it is important to distinguishbetween the infrastructure, which is strictly local inpotential, and that which has local and regional/national implications.
Local Infrastructure
This includes transport and communication sectorswhich, when laid down, present sunk and fixed coststhat permit strictly local exploitation. While a road doesconnect place A to place B, its immediate use, by itsvery nature, is restricted. Some cross relationship isalways established – for example – if Punjab has noroad, it is difficult for road vehicles to enter HimachalPradesh, but roads in Punjab cannot substitute forroads in Himachal Pradesh. Thus, such fixedinfrastructure has a largely local context.
Regional/National Infrastructure
Energy falls in this segment. While localdistribution networks serve local needs, but thisinfrastructure can be “wheeled” out of the state, and beused elsewhere too. Thus, the development of thisinfrastructure sector in Himachal Pradesh has regional/national possibilities. While it can bring in energy fordeficient regions, it can also bring in income forHimachal Pradesh through sale.
The Electricity Act, 2003 now enacted and dulynotified since June 11, 2003, is a promising frameworkfor Himachal Pradesh to exploit its “mobile”infrastructure of electrical power.
The Tenth Plan document clearly notes the crux ofinfrastructure as “Good infrastructure raises productivityand lowers production costs”. Infrastructure is themother base for all activities. It is from the band ofservices within this domain that all other developmentalactivities draw their sustenance. Inadequatelyenvisioned, or poorly delivered, it can stunt growth fordecades. (SDR for Punjab, CRRID, 2002).
The Eleventh Finance Commission Report 2000mentions an infrastructure index, based on social andeconomic factors. This rates Goa and Punjab as thehighest, with an index of 200.57 and 187.578respectively. Himachal Pradesh is ranked 13th in India,with an index of 95.03, lowest being ArunachalPradesh with 69.71. What is worrisome is thatHimachal Pradesh is only marginally better thanMizoram (82.13), Bihar (81.33), and Orissa (81.00). TheTenth Plan has noted that the index representsinfrastructure facilities, and states with better facilities
will attract private sector investment decisions andcapital flows.
ENERGY
Current Scenario
One of the most vital inputs, energy is the primemover, literally fuelling the engine of progress anddevelopment. It is now clearly recognised that the levelof availability of affordable and reliable power supply canbe an important determinant of the overall quality oflife.
In India, from an installed capacity of only 1300MW at the time of independence, power generationhas now risen to 100000 MW, with consequentincrease in transmission and distribution (T&D)systems. Despite this seemingly impressive increase,overall power generation and availability has notgrown at the required pace, and the states have beenfacing constant shortage. The pace of growth hasfailed to reach target levels in the Ninth Plan, with acapacity addition of only 19015 MW, against a targetof 40,245 MW. For the Tenth Plan, the Working Reporton Power has laid down a target of addition of 46,939MW, but the Planning Commission has fixed thefollowing targets:
Ongoing Projects 18659 MW
Central Electricity Authority Cleared Projects 9193 MW
New schemes 13258 MW
Total 41110 MW
In this context, Himachal Pradesh with a hydropower potential of 20000 MW, can play an importantpart, with only 20 per cent of the total potentialharnessed so far.
Power can be tapped from both renewable and non-renewable resources. Let us examine the availability ofthe primary sources of energy in Himachal Pradesh.
RenewableHydro-power YesBiogas Yes, limitedSolar YesWind Negligible potentialGeo-thermal YesTidal No
Non-renewableCoal NoOil NoGas No (not economically viable)

291Chapter 17 • INFRASTRUCTURE
Nuclear energy as an energy source is notconsidered on account of it being ruled out for strategicreasons, and the government has no plans to set up anatomic power plant in the state.
Geo-thermal energy can be an important component.For India, the potential is as under:
TABLE 17.1
Potential Geothermal Provinces of India
Province Surface Reservoir Heat FlowToC ToC Thermal Gradient
Himalaya >90 260 468 100
Cambay 40-90 150-175 80-93 70
West Coast 46-72 102-137 75-129 47-59
SONATA 60-95 105-217 120-290 60-90
Godavari 50-60 175-215 93-104 60
Source: D. Chandrasekharam, Geothermal Power Asia 2000, Indian Institute ofTechnology, Mumbai, India.
Note: Heat Flow: mW/m2; Thermal Gradient: oC/km.
Source: D. Chandrasekharam, Geothermal Power Asia 2000, Indian Institute ofTechnology, Mumbai, India
Himachal Pradesh has the highest heat flow andhighest thermal gradient geothermal basin in India. Thefirst pilot binary 5 kW power plant was successfullyoperated by the Geological Survey of India atManikaran, which proved the power producingcapability of this province. Scientific data from 500metre drill-holes estimated reservoir temperatures ashigh as 260o C. Space heating experiments were alsosuccessfully conducted using thermal discharge by theGeological Survey of India.
The non-conventional sources of geo-thermal andsolar power have potential for rural and hamletelectrification schemes. However, considering thepotential and resource base, HP should concentrate onlarge hydro power projects, mini-and micro-hydelschemes in conventional power.
The major potential in HP remains in the hydroelectric sector, and in our analysis, we concentrate onthis mode of generation.
For India, the power generation scenario is shownin Table 17.2:
TABLE 17.2
Power Generation
Change over previous yearApril-November
Billion Kwh % growth
1997- 1998- 1998 1999 1998- 1999-98 99* 99 2000@
Power generation 420.6 448.4 291.6 313.8 6.5 7.5
Hydro-electric 74.5 82.7 58.3 57.2 8.8 1.9
Thermal 336.1 353.7 225.8 248.2 4.6 9.9
Nuclear 10.0 12.0 7.5 8.4 14.1 12.8
Plant load factor ofthermal plants (%) 64.7 64.6 62.0 62.1 — —
Source: http://www.ficci.com/ficci/econo-upda/power.htm
Note: *: Provisional @: April-November
It is seen that the major growth in power is beingaccounted for by the thermal sector on a national level,with 9.9 per cent growth in 1999-2000, over ageneration base of 336 billion units in 1997-98.
Himachal Pradesh Becomes NationallyImportant in This Context
It is imperative that India must have a cheaper sourceof electrical power so that the users can cut their “fuel”costs, and Indian products remain globally competitive. Itis extremely important for Himachal Pradesh to move

HIMACHAL PRADESH DEVELOPMENT REPORT292
ahead and exploit its hydro potential to the full, becausethis is internationally recognised as the cheapest source.
TABLE 17.3
Decreasing Cost of Power with Hydro Share Rising
Country % Hydro Share Selling Price (cents/Kwh)
India 24 7
Sweden 48 2
Canada 62 2
Norway 99 1
Source: Himachal Pradesh State Electricity Board (HPSEB).
The detailed power planning studies carried byCentral Electricity Authority (CEA) have suggested thatthe share of hydro-power in the overall installedgenerated capacity in the country should be at leastabout 40 per cent to ensure optimum utilisation ofnatural and financial resources for electric powergeneration. In spite of large hydro resources beingavailable in India, its share in the total installedcapacity has been declining in successive plans. Hydro-power which was 50 per cent of the total installedcapacity in 1962-63, has now declined to 25 per cent.Such a dismal share of hydro – thermal mix is adverselyaffecting optimal utilisation of natural and financialresources. Thus, accelerated hydro-power generation isan unavoidable proposition when about 75 per cent ofthe hydro potential of 84,000 MW still remains to beharnessed (Planning Power Development in India –Emphasis on Hydro Projects, R.N. Srivastava, et al.).
Hydro Power Status in Himachal Pradesh
Only 20 per cent of the total available potential ofthe hydro power in the state has been harnessed up tonow, with another 7060 MW projects under variousstages of execution. By 2012, only 55 per cent of thepotential would be utilised, if all plans go as per target.
TABLE 17.4
Hydro Power in Himachal Pradesh: The Current Status
Total Identified Potential 20376 MW
Harnessed so far 3942 MW
Under execution 7060 MW
For which Draft Project Report ready 815 MW
For which Investigations are in progress 2008 MW
For which Investigations yet to be taken up 6551 MW
Source: www.hpseb.com
Harnessed
Name of Project River/Khad Estimated InstalledCapacity (MW)
Yamuna BasinAndhra Andhra 16.95Giri Giri 60.00Yamuna Projects Share from HP Catchment 131.57Gumma SHP Gumma Khad 3.00Satluj BasinRongtong Rongtong 2.00Rukti Rukti 1.50SVP Bhaba Bhaba 120.00Nogli Stage – I Nogli 2.50Chaba Nauti 1.75Bhakra Dam Satluj 1200.00Ghanvi Ghanvi Khad 22.0Beas BasinBeas Satluj Link Beas 990.00Uhl Stage – I Uhl 110.00Uhl Stage – II Uhl 60.00Binwa Binwa 6.00Baner Baner 12.00Gaj Gaj 10.50Pong Dam Beas 360.00Malana Beas 86.00Ravi BasinGharola Gharola 0.05Bhuri Singh P/House 0.45Baira Suil Baira & Suil 198.00Chamera Stage – I Ravi 540.00Sal-II Ravi 2.00Chenab BasinSissu Sissu 0.10Billing Billing 0.20Shansha Shansha 0.20Thirot Thirot 4.50Killar Mahal 0.30Total 3942.07
Under Execution
Name of Project Estimated InstalledCapacity (MW)
Yamuna BasinSainj 5.50Dhamwari Sunda 70.00Renuka Dam 40.00Satluj BasinBhaba Aug. P/House 3.00Nathpa Jhakri 1500.00Baspa Stage – II 300.00Karchham Wangtoo 1000.00Kol Dam 800.00Keshang Stage – I 66.00Beas BasinLarji 126.00Khauli 12.00Parbati Stage – II 2051.00Neogal 15.00Allian Dhugan 192.00Patkari 16.00Fozal 6.00
Contd. ...

293Chapter 17 • INFRASTRUCTURE
Contd. ...
Name of Project Estimated InstalledCapacity (MW)
Uhl Stage – III 100.00Ravi BasinHoli 3.00Chamera Stage – II 300.00Chamera Stage – II 231.00Budhil 70.00Bharmour 45.00Harsar 60.00Kugti 45.00Mini Micro (up to 3MW) 101.59Total 7059.14
Draft Project Report Ready
Name of Project River/Khad Estimated InstalledCapacity (MW)
Yamuna BasinShalvi Pabbar River 7.00Swara Kuddu Pabbar River 144.00Satluj BasinKeshang Keshang Khad 160.00Ravi BasinKutehar Ravi 260.00Hibra Ravi 231.00Siul Siul Nallah 13.00Total 815 MW
Investigation Under Progress
Name of Project River/Khad Estimated InstalledCapacity (MW)
Yamuna BasinTangnu Romani Pabbar River 44.00Chirgaon Majhgaon Pabbar River 46.00Paudital Lassa Pabbar River 36.00Satluj BasinThopan Powari Satluj River 400.00Shongtong Karcham Satluj River 225.00Jangi Thopan Satluj River 300.00Sorang Sorang Khad 100.00Tidong Tidong Khad 100.00Baspa-I Satluj River 210.00Beas BasinSainj Sainj Nallah 100.00Tirthan Tirthan Nallah 25.00Dhaulasidh Beas River 80.00Ravi BasinBajoli Holi Ravi River 200.00Saikhoti Baira Nallah 17.00Chamba Ravi River 125.00Total 2008 MW
Current Availability in Himachal Pradesh
There are three ways in which HPSEB makes poweravailable in the state:
i. Own generation
ii. Free power from central, joint, and private sectorplants
iii. Purchase from other generators
HIMACHAL PRADESH STATEELECTRICITY BOARD (HPSEB)
Installed Capacity
The current installed capacity of HPSEB from variousschemes is 326 MW from its 20 stations of capacitiesranging from 120 MW (SVP Bhabha) to 0.05 MW(Gharola). At 60 per cent load factor, this should beable to produce about 1700 million units per year.However, the target for generation from these stationswas fixed at 1458 million units, but this has ‘not beenachieved since 1998-99 (representing a load factor of 50per cent only).
TABLE 17.5
Generation by HPSEB in Million Units
Year HPSEB Total Decline(in Million kwh)
1998-99 1480.821999-00 1198.26 282.572000-01 1150.20 330.572001-02 1146.12 334.70
Source: Himachal Pradesh State Electricity Board.
The Board has given the reasons for this shortfall asunfavourable monsoons/snowfalls, and a continuinglydeclining water flow.
Ongoing Projects
HPSEB proposes to add another 284 MW fromprojects presently under implementation. The status isshown in Table 17.6:
TABLE 17.6
HPSEB’s Proposed Ongoing Projects and Capacity (in MW)
Name of the Project Capacity Name of the Likely Date of(in MW) Basin Commissioning
Bhaba Aug. P/H 3 Satluj 2001-2Larji 126 Beas 2003-4Holi 3 Ravi 2001-2Khauli 12 Beas 2002-3UHL – III 100 Beas 2005-6Renuka 40 Yamuna 2007-8Total 284
Source: Himachal Pradesh State Electricity Board.

HIMACHAL PRADESH DEVELOPMENT REPORT294
By 2008, another 284 MW capacity will be added tothe existing 326 MW through these schemes.
Proposed HPSEB Projects
HPSEB has also proposed to put up further projectsas shown in Table 17.7:
TABLE 17.7
HPSEB’s Proposed Projects and Capacity in MW
No. Name of Installed Proposed Expected Year ofProject Capacity Developer Completion
1. Kashang 160 MW HPSEB Phase - I 2005-06Phase - II 2006-07
2. Siul 13 MW HPSEB/MNES 2004-05
3. Sorang 100 MW HPSEB 2009-10
4. Tidong 100 MW HPSEB 2010-11
5. Kerang 16/15 MW HP+SEB/MNES 2004-5
6. Ganvi - II 8 MW HPSEB/MNES 2004-05
7. Barahl 9 MW HPSEB/MNES 2004-05
8. Thirthan 25 MW HPSEB 2005-06
9. Shalvi 7 MW HPSEB/MNES 2004-05
Total 438 MW
Source: Himachal State Electricity Board.
By 2011-2012, HPSEB proposes to add another 438MW to the 326 MW already installed, and 284 MWunder implementation, and have a total installedcapacity of 1048 MW. Though current efficiency levelsare stagnating at around 40 per cent, if we assume thetargeted levels of 50 per cent load factor, this will giveabout 4300 million units of HPSEB generated power by2012.
Central Sector
Name of Capacity Status Proposed Expected YearProject (MW) Developer of Completion
Kuther 260 DPR Ready Central Sector 2007-08
Hibra 231 DPR Ready Central Sector 2006-07
Rampur 400-600 DPR Ready NJPC 2006-07
Thopan Powari 400 DPR Ready Central Sector 2011-12
Bajouli – Holi 200 DPR Ready Central Sector 2011-12
Chamba 125 Inv. in progress Central Sector 2008-09
Karcham Shongtong 225 Inv. in progress Central Sector 2011-12
Gypsa Dam 240 Inv. in progress Central Sector 2010-11
Total 2081
IPP Sector
Name of Project Installed Capacity Expected Year of(MW) Completion
Sawara-Kuddu 144 2008-09Saini 100 2006-07Malana – II 100 2006-07Dhaula-Sidh 80 2006-07Chirgaon-Majhgaon 46 2005-06Paudital-Lassa 36 2005-06Tangnu-Romai 44 2005-06Saikothi 17 2005-06Lambadug 15 2004-05Baragaon 10.5 2004-05Total 592.5
Considering the totality of projects under execution,and those for which DPR is ready or investigations arein an advanced stage, the total planned capacityaddition in MW is as under:
Short Term Medium Term Total By End(2001-07) (2007-12) of 2001-12
Under State Sector 522 200 722Under Central/Joint Sector 3260 3472 6732Under Private Sector 1245 1336 2581Total 5027 5008 10035
There have been some good developments in 2003,auguring well for the overall scenario:
• Malana H.E.P 86 MW was commissioned byIPP in a record time.
• Out of the lists drawn, recently HimachalPradesh Government has allocated RampurHEP (400-600 MW) to NJPC and Hibra HEP(231 MW) to NHPC.
• Policy of incentives/disincentives shall now beapplicable on Central Agencies also, to ensureefficiency irrespective of ownership pattern.
• It is very welcome that HP is also proposing totake some projects as Joint Venture withneighbouring States.
• Gujarat Government has also shown keen inter-est in Hydro-Power Development in the Pradesh.
• GoI has been requested to permit increasingthe capacity from 100 MW to 300 MW forallotment through MoU route, leading tofurther speed in decision making.
A major development is the likely scenario of“unbundling” being contemplated by HPSEB, which hasproposed projects for execution through HPSEB, but

295Chapter 17 • INFRASTRUCTURE
with provision of following goods and services fromPrivate Agencies as consortium/JV partner:
• Overall project management
• Engineering
• Supply of equipment
• Construction Management
• Project financing
Free Power as Royalty
Himachal Pradesh gets free power as royalty fromcentral, joint, and private sector projects set up in thestate. This is a part of the original agreement, whichlays down that:
The project developer will be required to provide freeenergy from the project to the Government of HimachalPradesh in lieu of right of use of potential site. Thefree power will be levied at 12 per cent of thedeliverable energy of the project for the period startingfrom the date of synchronisations of the firstgenerating unit and extending up to 12 years from thedate of commercial operation of the project. For thebalance agreement period of 28 years, the royalty inshape of free power will be charged at 18 per cent ofthe deliverable energy.
Himachal Pradesh Industrial Development Board hasestimated the flow of free power to Himachal Pradeshas shown in Table 17.8:
TABLE 17.8
Tentative Year-wise Detail of the Estimated Free Power Available to the Government ofHimachal Pradesh from Various Hydro-Electric Projects
No. Description 2001-02 2002-03 2003-04 2004-05 2005-06 2006-07 2007-08 2008-09 2009-10 2010-11 2011-12
1. Private Sector projects(i) Projects executed/under development 40 15 120 32 2 30 34 6 334 408 0(ii) Projects for which bids are under evaluation 0 0 0 0 0 0 0 3 60 439 346Sub Total (MU) 40 15 120 32 2 30 34 9 394 847 346
2. Central PSU Projects(i) Projects executed/under development 290 0 0 35 117 0 90 421 545 84 252(ii) Projects for which bids are under evaluation 0 0 0 0 0 0 0 110 286 0 135Sub Total (MU) 290 0 0 35 117 0 90 531 831 84 387
3. Joint Sector Projects(i) Projects executed/under development 70 0 200 604 0 0 0 0 0 0 0Total: 1+2+3 (MU) 400 15 320 671 119 30 124 540 1225 931 733
4. Year-wise free power (MU) 400 415 735 1406 1525 1555 1679 2219 3444 4375 51085. T&D losses (%) 19.346 17.636 15.355 13.662 13.099 12.539 12.539 12.539 12.539 12.539 12.5396. Units of T&D losses (MU) 77.38 73.19 112.86 192.09 199.76 194.98 210.53 278.24 431.84 548.58 640.497. Energy available for sale (MU) 322.62 341.81 622.14 1213.91 1325.24 1360.02 1468.47 1940.76 3012.00 3826.42 4467.518. Average Sale Rate in paise per unit 229.909 249.433 267.79 287.024 307.598 328.742 345.179 362.438 380.56 399.583 419.5879. Expected Revenue at current prices (Rs. in crore) 74.12 85.26 116.6 348.42 407.64 447.1 506.89 703.41 1146.32 1528.97 1874.51
No. Description 2012-13 2013-14 2014-15 2015-16 2016-17 2017-18 2018-19 2019-20 2020-21 2021-22
1. Private Sector Projects(i) Projects executed/under development 0 19 0 0 0 0 14 0 26 320(ii) Projects for which bids are under evaluation 346 346 346 346 346 346 346 346 346 447Sub Total (MU) 346 365 346 346 346 346 360 346 372 767
2. Central PSU Projects(i) Projects executed/under development 0 0 0 0 0 0 0 0 0 0(ii) Projects for which bids are under evaluation 0 0 0 0 0 0 0 0 0 0Sub Total (MU) 0 0 0 0 0 0 0 0 0 0
3. Joint Sector Projects(i) Projects executed/under development 0 0 0 0 0 0 0 0 0 0Total: 1+2+3 (MU) 346 365 346 346 346 346 360 346 372 767
4. Year-wise free power (MU) 5454 5819 6165 6511 6857 7203 7563 7909 8281 90485. T&D losses (%) 12.539 12.539 12.539 12.539 12.539 12.539 12.539 12.539 12.539 12.5396. Units of T&D losses (MU) 683.88 729.64 773.03 816.41 859.8 903.18 948.32 991.71 1038.35 1134.537. Energy available for sale (MU) 4770.12 5089.36 5391.97 5694.59 5997.2 6299.82 6614.68 6917.29 7242.65 7913.478. Average Sale Rate in paise per unit 440.545 462.572 485.700 509.985 585.484 562.258 590.371 619.89 650.884 683.439. Expected Revenue at current prices (Rs. in crore) 2101.45 2354.19 2618.88 2904.15 3511.27 3542.12 3905.11 4287.96 4714.12 5408.30

HIMACHAL PRADESH DEVELOPMENT REPORT296
180MW
2401MW
0
500
1000
1500
2000
2500
1976-77 2000-2001
Upto March 2001
Thus, in 2001-2002, Himachal Pradesh expects toreceive 322 million units of free power, going up to4467 units by 2011-2012, and finally up to 7913 millionunits by 2021-22. T&D losses have been kept at anambitious level of about 12 per cent, as against about20 per cent now.
The total availability of power in HP in 2001-02 isas under:
Own current generation 1146 million unitsFree power 322 million unitsTotal 1468 million units
The total availability of power in Himachal Pradesh(load factor realistically at 50 per cent) in 2011-12 islikely to be as under:
Own generation 4300 million units (1000 MW)Free power 4467 million units (1050 MW)Total 8767 million units (2050 MW)
Demand Scenario
Himachal Pradesh achieved 100 per centelectrification of villages by 1988, and is now almostthrough with connecting all hamlets too. Even so, ithas a low per capita consumption of electricity amongstthe northern states, excluding J&K.
TABLE 17.9
Annual Per Capita Consumption of Electricityby States 1999-2000
(KWH)
State 1980-81 1989-90 1997-97 1999-00
Haryana 209.5 367.4 508.3 530.8J&K 74.8 176.4 223.7 267.9Punjab 303.6 620.5 789.9 921.1Chandigarh 309.0 686.2 794.4 823.8Delhi 403.8 673.6 589.7 653.2Himachal Pradesh 66.4 191.9 278.5 339.1
Source: Statistical Abstract quoted in Tenth Plan papers, PlanningCommission, New Delhi
Sector-wise break-up of consumers is as under:(MUs)
Consumer Category Share (in per cent)
Agriculture 1Domestic 28Commercial 8Government irrigation and water schemes 9Small industrial power 2Medium industrial power 3Large industrial power 44Street lighting –Bulk 6Total 100
If we look at other parameters, we find that againsta growth rate of 5.6 per cent and 6.5 per cent duringthe Eight and Ninth Plan periods, Himachal Pradeshrecorded a growth rate of 6.7 per cent during 1993-94to 1998-99 (Central Statistical Organisation).
If we examine the percentage share change in netSDP from 1987-88 to 1999-2000, we find that while theprimary sector has decreased by 24.96, the secondaryand tertiary sectors have considerably increased by 48.23and 11.81 respectively.
The percentage change in employment share too hasdeclined for the primary sector by 20.03, increased forthe secondary sector by 4.29 in the secondary, and by76.71 for the tertiary sector.
Percentage of population below the poverty line hasdeclined from 28.44 in 1993-94, to 7.63 in 1999-2000.
The CAGR of urban population at three per cent istwice that of the rural population at 1.5 per cent, andthe urban population already accounts for about 10 percent at present.
These trends give a clear indication that the percapita consumption of electricity will rise in HP in thefuture. This will also be assisted by the state’sprogramme for encouraging horticulture, agro-processing, and tourism. The secondary and tertiarysector developments in these thrust areas will be powerhungry, whether it is the refrigeration needs of partly-processed fruits, or lighting and heating needs oftourist hubs.
According to HPSEB, the status of connected load isas shown in the diagram below:
According to HPSEB, the demand is in the region of3500 million units. In MW, HPSEB estimates therequirement at 600 MW, and growing to about 900MW by 2015. In the light of a rise in per capitaconsumption taking place, and the factors brought out
*
Note: * Up to March 2001

297Chapter 17 • INFRASTRUCTURE
above, this appears to be an underestimate. In fact, theconnected load has already exceeded 2500 MW now,and it is reasonable to presume that about one-third ofthe connected load can be seen as demand.
The power requirement, if the development ofHimachal Pradesh is not to be fettered, should berealistically seen to be in the region of about 800 MWtoday, and rising to about 1500 MW by 2012. This isbased on an achieved annual SDP growth rate of 6.7 percent, large shifts from primary to secondary and tertiarysector, and growing urbanisation.
Demand Forecast: 16th ElectricPower Survey (EPS) Report
The demand forecast as per 16th EPS report is asunder:
Total Consumption T&D Losses Total Requirement Peak Load(MUs) (MUs) (MUs) (MW)
2325 787 3113 610
2542 856 3399 662
2737 918 3656 708
2920 973 3894 750
3118 1034 4153 795
A comparison of this study’s forecast appears to bein consonance with the expected forecast of the 16thEPS report, which estimates current demand to beabout 800 MW.
Is Himachal Pradesh Power Surplus?
In today’s scenario, Himachal Pradesh is buyingpower from outside for its need of about 3500 millionunits. It is not power surplus today.
If all its schemes under implementation and underconsideration come on steam by 2011-2012, then it willbe self-sufficient in power by that time. This will be aworld class state, with clean and reliable power ensuredfor advanced agro processing and tourism industries.
From 2012 onwards, Himachal Pradesh will start tohave a sizeable trade in power through the nationalgrid, when the last tranche of projects are undertakento move towards a full tapping of the hydro resource.
This study would like to recommend a word of caution onthe optimism being expressed at using power as a commodityfor sale since it is felt that it needs to be used in the serviceof HP’s own development first. The forecast of sale rightnow, if implemented, would be at the cost of thestate’s own development. While farmers, processors,
and tourists would be clamouring for power (anddependent services – water, cable cars, ropeways, etc), itmight be wheeled out of the state. Himachal Pradesh’spower will facilitate as an infrastructure in some otherregions, while its own citizens’ growth will suffer.
Himachal Pradesh power policy should clearly laydown a single cut/shortage scenario as a serious event.A tourist may never come back, and prevent ten othersfrom coming in, if he had to leave his hotel without ahot bath. A 15-minute power outage may causeirreparable loss to the state, because it seeks to enter inthe future the difficult area of hospitality, wherereputations are lost quickly.
Financial Status of HPSEB
As a commercial organisation, HPSEB is in thedoldrums (Table 17.10).
TABLE 17.10
Profit and Loss Account, HPSEB
(Rs. in crore)
Sr. Year Total Total Total Profit (+) Rate ofNo. Receipt Expenditure or Loss (-) Return
1. 1997-1998 448.54 419.09 +29.45 5.31%
2. 1998-1999 499.48 505.75 -6.27 0.98%
3. 1999-2000 587.58 693.80 -106.22 0.37%
4. 2000-2001 660.84 697.72 -36.88 5.10%
5. 2001-2002 670.48 777.04 -106.56 11.29%
Source: Annual Account of HP State Electricity Board, 1997-2002.
TABLE 17.11
Revenue, Expenditure, Profit and Loss per kWh
(in Rs.)
Sr. Year (Units sold excluding Revenue Expenditure Profit/LossNo. wheeling in bracket) per kWh per kWh per kWh
1. 1997-1998 (2668 MU) 1.68 1.57 0.09
2. 1998-1999 (2797 MU) 1.79 1.81 -0.02
3. 1999-2000 (2864 MU) 2.05 2.42 -0.37
4. 2000-2001 (2821 MU) 2.34 2.47 -0.13
5. 2001-2002 (2881 MU) 2.33 2.70 -0.37
Source: Annual Account of HP State Electricity Board, 1997-2002.
Thus, since 1998-99, HPSEB has entered a financialdownturn. It is now even entering the beginnings of adebt trap, where its interest payments have doubled infive years to Rs 80 crore, and it is breaking openreserves to pay back loans.

HIMACHAL PRADESH DEVELOPMENT REPORT298
Experience of State Governments inPower Reforms, and Lessons
Faced with a deteoriating condition of the SEBs inIndia, a Common Minimum National Action Plan wasdrawn up in 1996, with input from Chief Ministers ofthe states, that called for:
(i) setting up of Central and State RegulatoryCommissions;
(ii) Rationalisation of Retail Tariffs,
(iii) unbundling of the SEBs into more manageableentities with defined functions;
(iv) private sector participation in distribution.
We will examine the case of the pioneer – AndhraPradesh – and events in two neighbouring states ofHaryana and Punjab.
Key stakeholders:
• Government – officials and political parties, bothin treasury and opposition benches
• Andhra Pradesh State Electricity Board (APSEB) –over 74,000 employees
• Farmers — the largest user group but dispersedin rural areas
• Households — also important consumers andconcentrated in urban areas
• Industry – significantly affected by energy cuts;largest firms may pursue alternative sources
The following steps were taken to address thestakeholders:
Attempt at Information Dissemination
Andhra Pradesh government appointed a high-levelcommittee in 1996 that included two former chairmen
of the APSEB. This report was generally consideredimpartial and professional. Also in 1996, the APSEBbegan circulating bulletins in English and the locallanguage, Telugu, about the urgent problems in thepower sector and the need to address them quickly. Thebulletins highlighted the growing gap between supplyand demand, the increasing price of generating powerand the rising deficits. Later bulletins discussedmetering and billing, explaining commercial losses andtheft of energy. An inexpensive, pocket-size explanationof the key issues in the power sector and the case forreform was circulated all over the state, reflecting agovernment commitment to disseminate information ona massive state-wide scale.
Given low literacy rates, particularly in rural areas,additional steps were taken to use audio-visual medium.Several films were produced and aired on the cablenetwork throughout the state. One of the movies usedthe theme of match-making discussions of an APSEBengineer who, while informing the prospective in-lawsabout his job, is asked questions about the powersector situation and reforms. In the films, a variety ofparticipants from diverse social and professionalbackgrounds participated in the discussion and exploredthe merits of reform.
The government issued two White Papers on thestate’s finances and the financial condition of theAPSEB. These were debated in the state legislativeassembly. A discussion of the power sector figuredprominently in three successive episodes of the “Dialyour C.M.”, a weekly televised programme launched bythe Chief Minister’s office.
Building Support AmongElectricity Board Employees
Rank-and-file as well as mid-level engineers andprofessionals had strong concerns about the impact of
TABLE 17.12
Statement of Fund Flow(Rs. in crore)
Source Application
Year Internal Resource Reserves Govt. Loans from Total Expenditure Other Repayment of Payment of Net change in Totalof Loans & Others Loans Financial Institutions on Works Investment Loans Interest (Net) Working Capital
1997-1998 90.80 55.70 60.70 163.30 370.50 170.90 60.20 38.30 41.90 58.20 370.50
1998-1999 58.30 79.50 88.90 118.10 344.80 212.50 359.10 41.80 43.00 -311.60 344.801999-2000 -31.70 75.10 4.20 404.30 451.90 230.00 -329.8 527.50 51.10 -26.90 451.90
2000-2001 50.20 109.50 2.50 244.70 406.90 314.80 52.50 31.30 63.40 -55.10 406.902001-2002 3.69 68.30 - 539.16 611.15 297.00 43.80 325.55 78.40 -133.60 611.15
Source: Annual Account of HP State Electricity Board, 1997-2002.

299Chapter 17 • INFRASTRUCTURE
reforms on job security and conditions of employmenteven though, in this case, overstaffing at the aggregatelevel was not an issue. The government offeredassurances to workers and entered into negotiationsover revised terms and conditions. A sub-committee forstaff matters, which included union representatives,was formed. In late 1997, all but one of the unionsrepresenting APSEB employees signed new agreementsdefining terms and conditions of service, protection ofjobs and retrenchment due to restructuring.Compensation levels are negotiated through a separatemechanism with the labour unions. One importantunion, however, still continued to oppose the reformsand went on strike in April 1998.
Reaching Out to Potential Opponents
The government convened a meeting of all politicalparties and laid out its proposal to restructure APSEBas the first step in reforming the power sector. Theopposition boycotted the meeting and the smallerparties present rejected the government plan. In themonths that followed, opposition parties launched theirown outreach efforts, contradicting government pro-reform arguments and undermining public support.Failure to secure their support or dent their oppositiondid create significant problems during implementation.
Soliciting Input on Draft Government Proposals
The commission set up had recommended that thegovernment:
(i) divide APSEB into three separate entities alongfunctional lines (power generation, distribution,and transmission);
(ii) revise the regulatory framework, includingrules for tariff-setting and policies for overallsector development;
(iii) take steps to facilitate private sector investmentin power generation and distribution. Thegovernment endorsed these objectives andstressed the importance of separating themanagement, regulatory, and policy functions.
APSEB’s role, they believed, should be limited tomanagement but given more operational autonomy tomeet its obligations. The government should limit itsrole to policy-making and keep an arm’s length fromregulatory functions.
After receiving the recommendations of the high-level commission, the AP government issued its PolicyStatement in February 1997 that outlined the proposed
reforms and initiated a dialogue with diverse groups ofstakeholders, including industrialists, agriculturists,non-governmental organisations and journalists. A largeopen meeting with about 250 representatives of NGOswas held, in which senior government officials, anddonor agencies participated.
In April 1998, after fourteen months of public debateon its initial Policy Statement and resolution of keyAPSEB concerns, the state cabinet moved forward withlegislation approving the AP Electricity Reform Act of1998. It was passed by the Legislative Assembly twoweeks later and approved by the President in October1998.
Implementing Reforms and theProposed Tariff Hike
Budget preparations for the coming year quicklyconfronted the government with the need to define thesubsidies and estimated tariff increases required foroperations of the power sector. The decision whether toapprove a tariff hike and the form it would take fell tothe newly-created and little-known APERC. Their firststep was to prepare a “philosophy paper” on tariffpolicy. Their second step was to open up the processfor debate and discussion. APERC officials organisedlarge public meetings with key stakeholders in three ofthe largest cities in November 1999.
The nature of the meetings, however, did not lead toa constructive exchange of views on the problems andhow to resolve them. Instead, an unwieldy total of over300 interested participants gathered in each city.Farmers, in particular, dominated the discussions,drowning out other voices and flatly opposing a tariffincrease. The gap in understanding here was particularlylarge since the philosophy paper itself had identifiedunmetered agricultural consumption as a significantproblem to be addressed and, in later discussions,small-scale businesses would effectively argue that theywere, in fact, subsidising agricultural users.
Despite the consultation process, there was wide-spread opposition to the reforms process, and all stake-holders did not feel fully addressed.
These experiences were seen reflected in violence inthe neighbouring states of Haryana and Punjab.
In Haryana, police and electricity officials were heldin custody by mobs for weeks, and the state highwayswere closed in the Jind district, protesting against thereforms process. Similarly, in Punjab, an agitationagainst the reforms process has been an almostcontinuous activity, and successive governments of

HIMACHAL PRADESH DEVELOPMENT REPORT300
different political parties have not been able tosatisfactorily resolve the issue.
Lessons
Other than the major issues of participation andcommunication, some additional important issues thatneed addressing are:
• One fundamental fact of the reforms process is –higher tariff after implementation.
(Tariff in Rs/unit)
Type Pre-Reform Post-Reform
HaryanaDomestic 2.14 3.06Industry LT 3.19 3.92Industry HT 3.34 4.07
Andhra PradeshDomestic <81 units 0.80 1.45<201 units 1.65 3.90<401 units 2.90 5.00>401 units 3.40 5.20
While governments and experts see the oppositionas being to the reforms process, paying consumers areonly protesting tariff hikes, and the erstwhile free ridersare protesting any payment at all. One problem hasbeen an across the board attempt to charge cost plustariffs, where the consumer is being asked to pay forinefficiencies also.
• Rather, Government must assist SERCs in layingdown a long term programme of tariffs, bydemonstrating a resolve of bringing in efficiency,lowering cost in the long run, and transferringthe advantage to the consumers. For example,unreliable power supply forces farmers to usediesel pumpsets, where the cost per unit is in theregion of Rs 10/-. If we calculate the total energycost to farmers per acre of land, and demonstratethat even with higher tariffs his total energy costwill be less, he will accept the reforms process.
• Governments must give due respect to thestatutory institutions of the power sector, andtreat the sector as a techno-commercial issue.SERCs must work as independent institutions,and there should be no treading on their domain.In AP, when the government talked of tariffincreases before the awards were announced bythe APERC, the public perceived it to be agovernment decision and reacted unfavourably.Government response towards SERC domainshould be the same as to sub judice cases and
this will build up respect for professional conductof SERCs and related bodies.
• Government must accept SERC award as astakeholder only. In case they wish to step in tosubsidise certain sectors, provision should bemade in the budgets, in accordance withElectricity Act requirements. Unless there is avery good reason to do so, appeals against SERCorders to High Courts will compromise thereforms process at the inception stage itself.
• Public consultations must not be held within a“free expectation” model, but confined to seekingsolutions to structured questions. This exerciseensures that stakeholders arrive for consultationswith a clearer mental framework, and targeteddecisions can be arrived at.
Status of Power Reforms in HP
The following steps have been taken:
• HPERC has been set up and a single memberbody has commenced work since 6 January, 2001.
• HP has achieved 100 per cent metering, billing,and collection
• HP has entered into a MoU with Ministry ofPower, Government of India on 31 March, 2001,laying down specific milestones to be achieved:
• Creation of independent centres for generation,transmission, and distribution of electricity
• Reduce surplus staff
• Reduce CPSU outstanding to two monthsbilling, and securitise earlier outstandings.
• Implement energy audit at 11 kV distributionfeeders and LT sides.
• Introduce computerised billing for urbancustomers, and all customers with connectedload of 100 kW and above.
• File Tariff Petition before HPERC by 30 April,2001
• Pay subsidy from its own budget, if required.
The basic step of unbundling generation,transmission, and distribution now needs to be takenin HP. These have been declared as separate profitcentres from April 1, 2003, and it needs to be takenfurther as three separate corporate entities.
The Ministry of Power, and Energy Watch hascompiled the following comparative status of reforms ofthe power sector by various states in India:
301Chapter 17 • INFRASTRUCTURE
Northen Region Western Region
Milestones Delhi Haryana H.P J & K Punjab Rajasthan U.P Uttranchal Chattishgarh Gujarat Goa M.P Mahatashtra
SERC Constituted ☺ ☺ ☺ ☺ ☺ ☺ ☺ ☺ ☺ ☺ ☺ ☺99-00 8/98 1/01 3/99 99-00 9/98 1/02 01-02 11/98 4/02 8/98 99-00
Operationalisation of SERC ☺ ☺ ☺ ☺ ☺ ☺ ☺ ☺ ☺ ☺
Last Tarrif Order Issued ☺ ☺ ☺ ☺ ☺ ☺ ☺ ☺ ☺5/01 12/00 01/02 10/02 3/01 10/02 10/00 9/01 5/00
Signing of MoU ☺ ☺ ☺ ☺ ☺ ☺ ☺ ☺ ☺ ☺ ☺ ☺ ☺3/03 2/01 3/01 4/02 3/01 3/01 2/00 3/01 1/01 1/01 10/01 10/02 3/01
Signing of MoA ☺ ☺ ☺ ☺ ☺ ☺ ☺ ☺ ☺ ☺ ☺ ☺ ☺3/03 12/02 12/02 2/03 8/02 7/02 9/02 12/02 10/02 6/02 11/02 9/02 6/02
Signing of TPA ☺ ☺ ☺ ☺ ☺ ☺ ☺ ☺ ☺ ☺ ☺ ☺07/02 10/02 7/02 7/02 11/02 7/02 9/02 7/02 6/02 7/02 7/02 3/03
Reform Bill Enactment ☺ ☺ ☺ ☺ ☺ ☺ ☺2000 1998 2000 1999 01/02 2000
Unbundling/ Corporatisation ☺ ☺ ☺ ☺ ☺ ☺7/02 8/99 7/00 1/00 2001 2002
Privatisation of Distribution ☺7/02
11 KV for 100% Metering ☺ ☺ 93% ☺ 99% 45% ☺ 96% 63% ☺ ☺ 91% 85%
100% Consumer Metering ☺ ☺ ☺ 40% 85% 90% 59% 87% 65% 93% 95% 63% 86%
Southern Region Eastern Region
A.P Karnataka Kerala Tamil Nadu Bihar Jharkhand Orissa West Bengal
SERC Constituted ☺ ☺ ☺ ☺ ☺ ☺ ☺ ☺7/99 9/00 11/02 3/99 4/02 8/02 5/96 1/99
Operationalisation of SERC ☺ ☺ ☺ ☺ ☺
Last Tarrif Order Issued ☺ ☺ ☺ ☺ ☺6/00 2002 3/03 4/97 2001
Signing of MoU ☺ ☺ ☺ ☺ ☺ ☺ ☺ ☺3/01 2/00 8/01 1/02 9/01 4/01 6/01 5/01
Signing of MoA ☺ ☺ ☺ ☺ ☺ ☺ ☺ ☺5/02 5/02 10/02 7/02 12/02 11/02 3/03 7/02
Signing of TPA ☺ ☺ ☺ ☺ ☺ ☺ ☺7/02 6/02 8/02 6/02 11/02 9/02 7/02
Reform Bill Enactment ☺ ☺ ☺1999 1999 1996
Unbundling/Corporatisation ☺ ☺ ☺ ☺02/99 08/99 4/96
Privatisation of Distribution ☺98
11 KV for 100% Metering ☺ ☺ ☺ ☺ 39% 27% 93%
100% Consumer Metering 85% ☺ ☺ ☺ 89% 90% 94%
North Eastern Region
A.P Assam Meghalaya Mizoram Manipur Nagaland Tripura Sikkim
SERC Constituted ☺ ☺2/99 8/01
Operationalisation of SERC ☺
Last Tarrif Order Issued
Signing of MoU ☺ ☺ ☺ ☺ ☺ ☺7/02 3/01 11/02 7/02 9/02 12/02
Signing of MoA ☺ ☺ ☺ ☺ ☺ ☺7/02 7/02 11/02 7/02 9/02 12/02
Signing of TPA ☺ ☺ ☺ ☺7/02 2/03 8/02 11/02
Reform Bill Enactment
Unbundling/CorporatisationPrivatisation of Distribution
11 KV for 100% Metering 19% 34% 30% 79% 21% 34% ☺ 24%100% Consumer Metering 54% 86% 64% 47% 82% 73% 81% 28%
Note: ☺ shows achieved.
HIMACHAL PRADESH DEVELOPMENT REPORT302
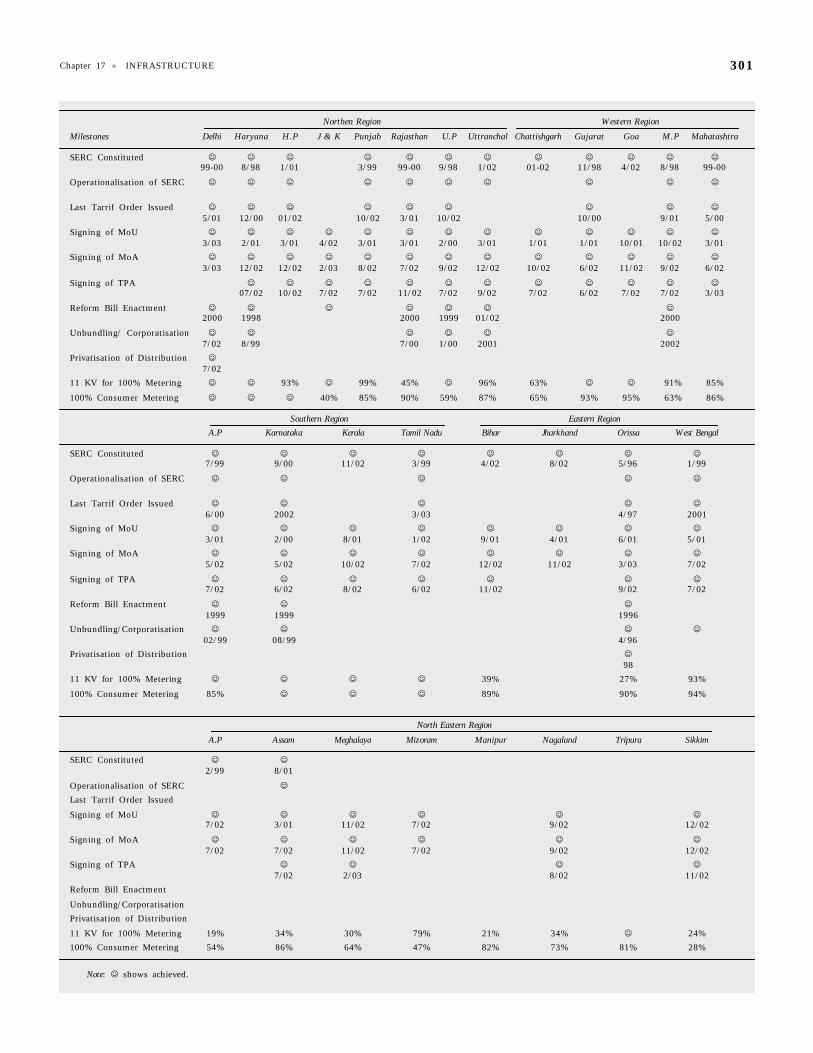
It can be seen that power reform process is ahead inwestern and southern regions, followed by the north. Itis lagging most in north east, and with exception ofOrissa, in the eastern region also. It is also worthnoting that other than Orissa and Delhi, no state hasgone in for privatisation of distribution.
Himachal Pradesh has taken some fundamental stepslike constitution of SERC, metering of 11 kV lines andcustomers, and signing of MoU with Government ofIndia. It has however, lagged in putting in place a legalframework for implementing the next phase of reform,which will take it into the area of unbundlinggeneration, transmission and distribution, and finallyinto hiving off distribution altogether.
What is Wrong with HPSEB?
Consider: As a 100 per cent hydro supplier, HimachalPradesh must have a cost of electricity comparable toNorway, at one cent (47 paise) per unit, but is actuallyselling at around five to six cents per unit, almost atthermal price. This inflated cost is also raising the costof industrial and agro-production in Himachal Pradesh.In reality, if it is to attract industry, then it should be ina position to cover the additional cost of transport of rawmaterial and finished products, through a hugely cheaperpower tariff. And this is not happening. And the ironyis, HPSEB is still making a loss on every unit sold.
• There are inefficiencies in the generation process.At 70 per cent load factor, 326 MW shouldproduce nearly 1900 million units per year.Against a target of 1480, HPSEB manages onlyabout 1150. This is raising the cost per unit,since in hydro power, fixed costs play animportant role, with no fuel cost involved. Thus,improvement of generation efficiency is vital.
• The Planning Commission has specified anindicative norm of 7.8 employees per 1000customers, whereas HPSEB has 17.
• T&D losses are higher than 20 per cent.
Suggestions
• Himachal Pradesh is ripe for taking power reformsto a logical final step of unbundling andprivatisation of distribution.
• It is a hydro state, with capability to providepower at reasonable rates. If it can movesimultaneously on increasing generationefficiency, HP can minimise post-reform tariffhikes.
• Only 2 per cent of its consumers are in theagriculture sector, thus minimising thestakeholder group that has traditionally causedmaximum opposition to power reform.
• Consumers in the agro-processing and tourismindustries will want clean, reliable power inthe future, and they are willing to pay, as itincreases their own profits.
• Nowadays, it is almost fashionable to talk ofprivatisation. This is causing a misplaced thrust,because we actually need to talk of efficiency. Thereare no conclusive studies to establish an ownershippattern as being the determinant of anorganisation’s business success or failure. HPSEBwas making profits till 1998, and was hit hard bythe rise in wages by the Pay Commission. Analysishas also revealed inefficiencies both in generationand distribution, and if these are addressed, HPSEBcan function well as a generator, and as HimachalPradesh’s State Transmission Utility (STU), bothfunctions performed as separate companies.
• Though now established as separate profit centres,Generation, Transmission and Distribution shouldbe corporatised as separate entities. With respectto the Act, the following must be takencognizance by Himachal Pradesh immediately:
• The SERC has now an expanded statutory roleto play. The Commission needs to be staffedand provided for to equip it to discharge itsobligations under the Act, otherwise eitherdecisions will be delayed, or be sub-optimal.
• Prepare a Consultation paper for seeking theCentral Government notifications on a nationalPolicy for permitting stand-alone systems,especially those based on renewable and non-conventional sources (Section 4 of the Act).
• Prepare a Consultation paper for seeking theCentral Government notifications on a nationalPolicy on rural electrification, and purchase andmanagement of local distribution by PRIs,NGOs, users’ associations etc (Section 5).
• HP should note that as per Section 7, as longas technical standards are adhered to, any com-pany can enter generation. However, as per Sec-tion 8, Hydro Electric Projects will need CEAapprovals. As per Section 8(1), this is applicablefor HEP schemes having capital expendituresbeyond a certain sum. HP government shouldimmediately begin consultations so that mini/
303Chapter 17 • INFRASTRUCTURE
micro hydel schemes are kept out of CEA pur-view, to facilitate quicker decision-making.Presently, projects upto 25 MW are out of CEApurview, and handled by the MNES, but in ac-cordance with Section 8(1), a capital expendi-ture criterion needs to be established.
• It is felt that rather than focus on a potentiallycontentious issue of reducing “manpower”, weshould attempt to reduce “manpower cost”,which is the essence of the issue. On thegeneration side, the inefficiencies highlighted,where stations are working at only 40 per centload factor, need to be examined, and the loadfactor brought up to 60-70 per cent, throughRenovation & Modernisation. This increasedefficiency will reduce the per unit generation cost.
• Distribution operations break even must be reachedimmediately, and there should be involvement ofPRIs/ULBs in this process. It is essential that thepower sector reform be made a people’s issue, tobe achieved through people’s participation, and notbe seen as a legal/bureaucratic diktat. If peoples’participation is not ensured, the reform processwill cause alienation.
Experience shows that post-reform, there is a risein power price, with withdrawal of subsidies. Ittakes time for the efficiencies to establish, andthere is potential for a public outcry in theinterim.
• It should also be kept in mind that HP is aseasonal power producer. In summer, the damsare full, and it sells power, but in winter it needsmore power, which it buys back at a higher price.This pattern will continue in the future, andwithin the framework of the Electricity Act, it isin the interest of the state to enter into longterm understanding with its neighbours of J&K,Panjab, Haryana, and the heavy consuming centreof Delhi. It is also a good market situation that itsneighbours need more power in the summer, bothfor domestic and agricultural use, and HP hassurpluses at the time. On the other hand, powersituation in the plains is easier in winter, and HPwill need to augment its own resources then.
• HP should not enter into any PPAs with IPPs.Such agreements will defeat the very purpose ofpower sector reform of bringing efficiency andlowering costs, and shift the entire risk ontoHPSEB. If there is only an attempt to shift riskrather than decrease it, there may be a situation
when the IPPs may even work to oppose powersector reform, armed as they are with guarantees,and counter-guarantees (Power Sector Reform andRegulation : The Road Ahead, Sebastian Morris,India Infrastructure Report 2001).
Target dates for adding additional capacity throughstate, central, joint, and IPP programme appear to bevery ambitious. It appears slippages will occur, and thestate needs to have a re-look to lay down a revisedrealistic forecast.
Proposed Model
• Start an initiative to begin people’s participationin the reform process. Engage GOs and NGOs inan exercise of dialogue with the people, andSERC can co-ordinate such an exercise. It mustbe precisely planned, and executed with clearblessings from the highest level. The aim is tobuild up a consensus for the reforms process byensuring good quality and assured supply ofpower at reasonable prices.
• Involve HPSEB employees in the reform-relateddecision-making process. Employees must be toldthat they will not be forced to quit their jobs.
• Incorporate a power generation utility consistingof HPSEB’s generation wing. Evolve procedures todecentralise decision-making to this generator,while retaining general policy initiative throughthe Board level, by retaining majority equitycapital share. If possible, disinvest throughemployee stock option plans and public issue toHimachal Pradesh residents, further broad basingthe success factor. Build in procedures to ensureefficiency, with minimum PLF achievement at 60-70 per cent. Do not offer employee incentives forgeneration, otherwise plants may refuse to back offwhen asked, raising grid frequency to dangerouslevels. Rather, build in disincentive for notproducing according to target. The disincentivewill not apply when generator is asked to back offby Regional Transmission Centre.
• Incorporate a power transmission utility, asenvisaged under the Electricity Act 2003. Begintalks with CEA, Power Grid, and neighbouringstates for establishing and participating in theRegional Transmission Centre/s, and enter intoagreements for power sale/purchase with them.Evaluate possibility of multilateral assistance fromnational and international bodies forstrengthening the state’s transmission backbone.

HIMACHAL PRADESH DEVELOPMENT REPORT304
The plan should envisage setting up atransmission backbone for handling theanticipated demand for year 2020.
• Handover local distribution to panchayats, zillaparishads and urban local bodies. The transmissioncompany will handover power at the local sub-stations, in a metered quantity. The followingmethodology can be considered:
• Power is metered into the local sub-station, andeffectively handed over to the local body. Thelocally available distribution infrastructure isbrought on to the books of the local body, whichbecomes a franchisee for distribution, and allowedto charge commission for collection of usercharges, to cover distribution and administrativecosts. The local body will have to be assured thattechnical hand holding will be done when needed.
• Employees of HPSEB can be offered VRS proposal,linked with a choice of a village/town in whichthey would like to be associated with the localbody in maintenance of distribution infrastructure,distribution of electricity, and collection of usercharges. After VRS, they will be working with thelocal body for a fixed lump-sum on a contractualbasis. Considering the “harvesting” absenteeismin linesmen and other staff, if the scheme isworked out thoughtfully, it is likely to succeed.
• Implement rigorous training to local bodies, andthe HPSEB staff involved to take on the new role.
• Involve private sector in upgrading distributionsystems wherever necessary. Funds for this willcome from the user charges for higher loads, etc.,and can be collated at a level sufficiently largeenough to offer economies of scale.
• The entire package should be worked out in afinancially secure manner, with no subsidy inputfrom the government.
• Continue cap on any new recruitment in HPSEB,and strictly implement the same. Special VRSoffers should be linked to the distribution schemeas mentioned earlier. Re-deployment of staff willbe required in accordance with new corporatisedstructure.
Current Status of Memorandumof Understanding
Himachal Pradesh has moved on the milestones tobe achieved as per the MoU signed with Government ofIndia.
The status of metering is as under:
H V Total No. of No. of Meters PercentageSubstation Feeders Installed Metering
33 KV 128 101 78.9
22 KV 114 80 70.17
15 KV 6 1 16.16
11 KV 597 542 90.78
2.2KV 6 6 100.00
DTRs 14600 13222 90.56
• 100 per cent metering of consumers has beenachieved.
• Energy Accounting has been started at Circlelevel, and while 70 per cent of the feeders havebeing taken up for accounting, 43 per cent arecurrently under energy audit.
The state position of metering and audit is asunder:
2000-01 2001-02 2002-03
Input Energy (MU) 2898.793 3104.79 3332.031
Metered Energy (MU) 2206.066 2332.231 2518.909
Billed Energy (MU) 2206.066 2332.231 2518.909
Realised Energy (MU) 2084.723 2120.328 2236.268
Revenue realised (Rs. in crore) 489.3 504.61 541.5
There is still a large gap between input andmetering, and metering and realisation.
Supply and sale price per unit is as under:
2000-01 2001-02 2002-03
Average cost of Supply(in Paise/Unit) 247 270 266
Average revenue realised(in Paise/Unit) 234 233 250
The differential of 16 paise per unit is proposed tobe bridged by the following strategy upto 2005-2006:
2002-03 2005-06
Increase in generation (MU) 1277 2052
Reduction in T&D Loss
a) Overall 19.35% 13%
b) Within the State 25% 20%
Increase in Revenue (Rs. in crore) 800 2003
Increase in Tariff 16%
305Chapter 17 • INFRASTRUCTURE
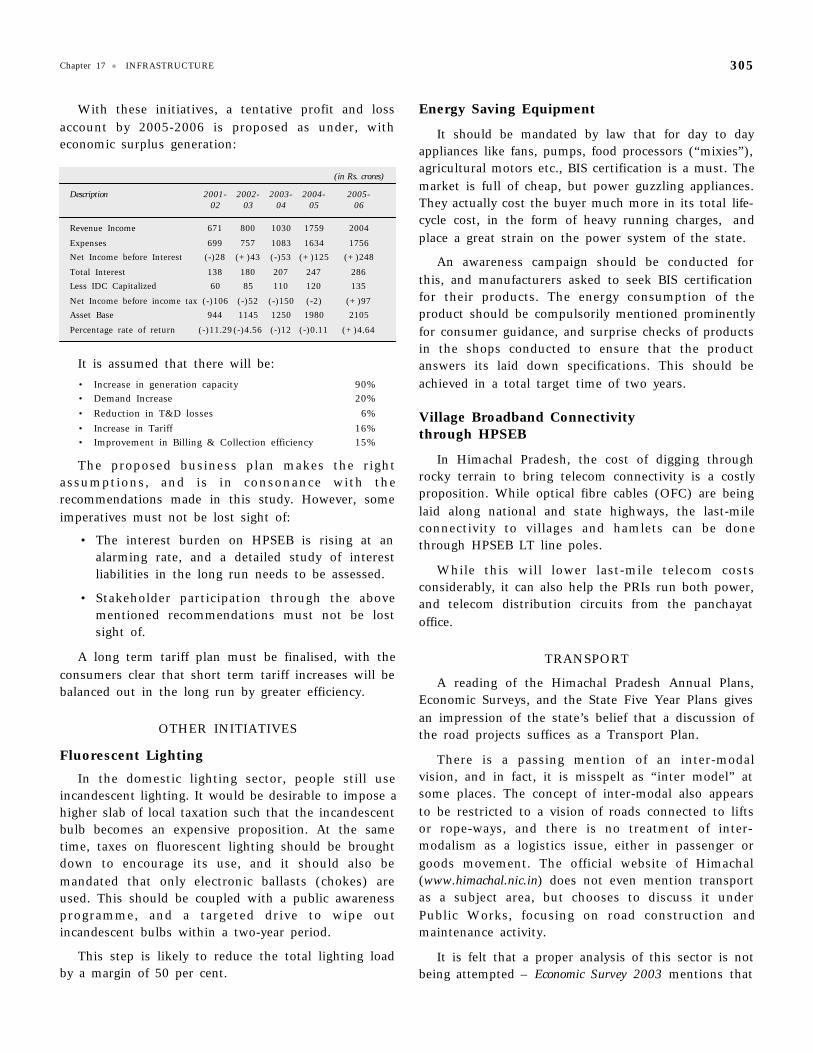
With these initiatives, a tentative profit and lossaccount by 2005-2006 is proposed as under, witheconomic surplus generation:
(in Rs. crores)
Description 2001- 2002- 2003- 2004- 2005-02 03 04 05 06
Revenue Income 671 800 1030 1759 2004
Expenses 699 757 1083 1634 1756Net Income before Interest (-)28 (+)43 (-)53 (+)125 (+)248
Total Interest 138 180 207 247 286Less IDC Capitalized 60 85 110 120 135
Net Income before income tax (-)106 (-)52 (-)150 (-2) (+)97Asset Base 944 1145 1250 1980 2105
Percentage rate of return (-)11.29(-)4.56 (-)12 (-)0.11 (+)4.64
It is assumed that there will be:• Increase in generation capacity 90%• Demand Increase 20%• Reduction in T&D losses 6%• Increase in Tariff 16%• Improvement in Billing & Collection efficiency 15%
The proposed business plan makes the rightassumptions, and is in consonance with therecommendations made in this study. However, someimperatives must not be lost sight of:
• The interest burden on HPSEB is rising at analarming rate, and a detailed study of interestliabilities in the long run needs to be assessed.
• Stakeholder participation through the abovementioned recommendations must not be lostsight of.
A long term tariff plan must be finalised, with theconsumers clear that short term tariff increases will bebalanced out in the long run by greater efficiency.
OTHER INITIATIVES
Fluorescent Lighting
In the domestic lighting sector, people still useincandescent lighting. It would be desirable to impose ahigher slab of local taxation such that the incandescentbulb becomes an expensive proposition. At the sametime, taxes on fluorescent lighting should be broughtdown to encourage its use, and it should also bemandated that only electronic ballasts (chokes) areused. This should be coupled with a public awarenessprogramme, and a targeted drive to wipe outincandescent bulbs within a two-year period.
This step is likely to reduce the total lighting loadby a margin of 50 per cent.
Energy Saving Equipment
It should be mandated by law that for day to dayappliances like fans, pumps, food processors (“mixies”),agricultural motors etc., BIS certification is a must. Themarket is full of cheap, but power guzzling appliances.They actually cost the buyer much more in its total life-cycle cost, in the form of heavy running charges, andplace a great strain on the power system of the state.
An awareness campaign should be conducted forthis, and manufacturers asked to seek BIS certificationfor their products. The energy consumption of theproduct should be compulsorily mentioned prominentlyfor consumer guidance, and surprise checks of productsin the shops conducted to ensure that the productanswers its laid down specifications. This should beachieved in a total target time of two years.
Village Broadband Connectivitythrough HPSEB
In Himachal Pradesh, the cost of digging throughrocky terrain to bring telecom connectivity is a costlyproposition. While optical fibre cables (OFC) are beinglaid along national and state highways, the last-mileconnectivity to villages and hamlets can be donethrough HPSEB LT line poles.
While this will lower last-mile telecom costsconsiderably, it can also help the PRIs run both power,and telecom distribution circuits from the panchayatoffice.
TRANSPORT
A reading of the Himachal Pradesh Annual Plans,Economic Surveys, and the State Five Year Plans givesan impression of the state’s belief that a discussion ofthe road projects suffices as a Transport Plan.
There is a passing mention of an inter-modalvision, and in fact, it is misspelt as “inter model” atsome places. The concept of inter-modal also appearsto be restricted to a vision of roads connected to liftsor rope-ways, and there is no treatment of inter-modalism as a logistics issue, either in passenger orgoods movement. The official website of Himachal(www.himachal.nic.in) does not even mention transportas a subject area, but chooses to discuss it underPublic Works, focusing on road construction andmaintenance activity.
It is felt that a proper analysis of this sector is notbeing attempted – Economic Survey 2003 mentions that

HIMACHAL PRADESH DEVELOPMENT REPORT306
“Road Transport is the mainstay of economic activity inthe Pradesh as other means of transport namely….Taxis…..are negligible.” Taxis do form an importantcomponent of road transport in the state for touristmovements, and its consideration as negligible shows ablind spot, and a rather cursory treatment of a vitalsubject.
“Road Transport” has also been made synonymouswith “HRTC” (Himachal Road TransportCorporation), and other than road construction, thisremains the only organised transport activity thatfinds serious mention. It has not been possible tofind a cogent Transport Policy of Himachal Pradesh,and whenever it has been attempted, it has againshown a road-HRTC bias. As late as March 2001,when the then Transport Minister spoke of a“Transport Policy”, he exhibited the same bias indeclaring that “The Himachal Pradesh Governmenthas decided to strongly implement transport policy inorder to provide better transport facilities topassengers travelling in the Himachal Road TransportCorporation buses in and outside the state” (TheTribune, 23 March, 2001, italics added).
The importance of transport for Himachal Pradeshcannot be overstated enough, since it addresses thecore issue of accessibility for the people. There is aspecific agenda for the infrastructure sector and thetransport sub-sector to address, in the context ofHimachal Pradesh’s development plans. Importantissues to consider are:
i. Hydro-power envisages large, medium and mini/micro schemes to be set up in the near future.This will need millions of tonnes of cement,steel, and machinery to be moved to projectsites.
ii. Himachal Pradesh has a policy to give a thrustto horticulture and agro-processing. The rawand processed stock will need quick movementsfrom farms to godowns, from cold storages toprocessing stations, and finally towards nationaland international markets.
iii. The other major thrust area of tourism needsassured and safe transport network. It needsstructuring for a tourist-friendly system, withenquiries, itinerary planning and reservations,and uniform fare systems.
iv. The network should facilitate day-to-day life ofHimachal Pradesh residents, and have aneffective linkage with a disaster management
plan. This is especially important for a statesituated in a seismically active area.
Roads
Considering the geography of Himachal Pradesh,roads are an important component. There are NationalHighways, Border Roads, State Highways, and otherarterial and rural roads.
At Independence, Himachal Pradesh started withnearly no roads, but has done well to build anestimated 27,737 km of motorable roads by 31December 2002. During 2002-2003, data uptoSeptember 2002 also shows good progress.
TABLE 17.13
Road Building Progress During 2002-2003
Item Unit Target for Achievement Up to2002-2003 September, 2002
Motorable Kms. 550 342
Cross-drainage Kms. 650 376Metalling & Tarring Kms. 650 608
Jeepable Kms. 20 25Bridges No. 30 19Villages connected No. 50 12
Source: Himachal Pradesh Economic Survey 2003.
However, the achievements are less than therequirements. The Eighth Five Year Plan for HimachalPradesh laid down the target in this regard as 26,373km, to achieve a road density of 473.5 km/thousand sq.km, as against the existence of 16883 km and 303.3km/thousand sq. km, in March 1990.
The Ninth Five Year Plan for Himachal Pradeshraised the requirement to 30,495 km, and a road densityof 547.8 km/thousand sq. km, as against achievementof 19,310 km, and a road density of 346.8 km/thousandsq. km, by March 1996.
Thus, the State Plans could not achieve theirtargets. In fact, the targets specified in the Eighth StatePlan, could be achieved only by the beginning of theTenth Plan.
Comparison of the road density of Himachal on anational scale shows that the state is below the all-India average, and placed at the 20th rank. However,this comparison would not be fruitful, since the datawould take into account geographically dissimilarstates. If we compare Himachal Pradesh with the hillstates of J&K, Uttaranchal, Arunachal Pradesh,

307Chapter 17 • INFRASTRUCTURE
Mizoram, and Sikkim, then Himachal Pradesh is thebest.
In this context, as the leader in road development inhill states, Himachal Pradesh has done well, but incomparison to its own targets and needs, the stateneeds to get its act together.
Major Road Schemes
Pradhan Mantri Gram Sadak Yojana (PMGSY)
PMGSY was launched by the Government of India in2000-01 with the primary objective of providingconnectivity by all weather roads to all habitations witha population of 500 persons (250 persons for theHimachal Pradesh) and above by the end of Tenth PlanPeriod (2007). It replaced the erstwhile Basic MinimumServices (BMS) programme. In Himachal Pradesh, thePublic Works Department is implementing this Yojanathrough its Programme Implementation Units (PIUs),which are mostly headed by Superintending Engineers,except for tribal areas where these are headed byExecutive Engineers.
The funds under this Yojana are being released everyyear by the Ministry of Rural Development, Governmentof India, for execution of eligible road works,recommended by the respective states.
For implementation of project proposals underPMGSY 2002-03, the Government of India specificallydirected all the states to ensure inclusion of only suchvillages under this Yojana, which have not been so farconnected with any road, including fair weather roads.Further, Himachal Pradesh was told to prepare a shelf
of road projects, costing about Rs.250 crore underPMGSY 2002-03. Accordingly, all the MPs/ MLAs/ZillaPradhans made available their lists of priority roadworks, which they proposed to include under PMGSY2002-03. The details received were examined by theState Level Standing Committee on PMGSY during itsmeeting held on 7 January 2003 and a shelf of 452roads were finalised covering all 75 Blocks of the state,costing Rs. 251 crores, for providing connectivity to 583villages, each having a population of 250 and above, and286 smaller villages falling en route. It is pertinent tomention that under PMGSY 2000-01 and 2001-02,except for one road belonging to Chopal Block, thesurfaces of all the approved roads were to be metalled/tarred. However, in February 2002, a policy decisionwas taken that the surface of PMGSY roads would notbe metalled/tarred in all such areas of the state, whereconnectivity is quite poor, which get lot of snowfall orwhere traffic intensity is quite low. It was decided thatin all such areas, the roads would be provided withcross-drainage works and essential soling, so that thesecould function as all weather roads. Accordingly, whilefinalising proposals under PMGSY 2002-03, the StateLevel Standing Committee decided that the roadspertaining to Kangra, Hamirpur, Una and Bilaspurdistricts and to a part of Nalagarh Block of Solandistrict, be metalled/tarred and in other areas, this neednot be done.
Status of Projects under PMGSY
The following final sanction was conveyed for theseprojects below:
District Pavement CD Works
Total No. of Total No. of Length [in Kms] Sanctioned Cost No. of CD Sanctioned Cost Other Works Total CostPackages Roads (Rs. in Lakh) Works (Rs. in Lakh) (Cost Rs. in Lakh) (Rs. in Lakh)
Bilaspur 7 16 62.88 657.67 101 117.09 41.98 816.74
Chamba 11 28 136.18 1315.49 255 199.57 69.47 1584.53
Hamirpur 13 34 110.43 1343.07 204 432.44 36.01 1811.52
Kangra 19 105 356.15 3329.42 558 441.23 200.22 3970.87
Kinnaur 6 10 41.55 586.55 80 99.87 4.30 690.72
Kullu 7 15 76.52 869.85 149 126.87 44.52 1041.24
Lahaul and Spiti 2 5 23.30 257.51 45 59.17 44.05 360.73
Mandi 16 49 221.97 1974.08 530 456.86 235.98 2666.92
Shimla 16 36 158.58 1826.65 372 328.67 56.35 2211.67
Sirmaur 8 22 70.53 925.06 149 184.65 47.86 1157.57
Solan 10 25 97.58 1087.60 227 168.23 103.25 1359.08
Una 9 28 113.39 896.14 144 157.53 168.15 1221.82
Total 124 373 1469.06 15069.09 2814 2772.18 1052.14 18893.41

HIMACHAL PRADESH DEVELOPMENT REPORT308
In the 12 districts, a total of 373 roads comprising1469.06 kilometers for Rs 150.69 crore, 2814 crossdrainage (CD) projects at a cost of Rs 27.72 crore, andother works costing Rs 10.52 crore, were sanctioned forHP under PMSGY.
The current status upto October 2003 is astabulated in the table above.
Thus, 205 out of the 373 have been completed torecord a progress of 56 per cent physical completion,and out of the total sanction of Rs. 188.93 crore,Rs. 138.66 crore have been spent.
The progress of works is thus good, consideringthat the monsoon months with conventionally slowprogress have passed, and there is likely to be fasterprogress in the remaining part of the year.
The quality of work done as assessed by theNational Quality Monitor shows the following data:
District Block Inspection Road Name GradeDate
Bilaspur Bilaspur Sadar 22-04-2002 NH.21 at R.D 125/0Kothipura to Noa. Good
-do- Gehrwin 22-04-2002 Baroha to Dahad road. Very Good
-do- Gehrwin 05-08-2002 Baroha to Dahad road. Good
-do- Gehrwin 22-04-2002 Chhad Sandyar road. Very Good
Hamirpur Bijhri 22-04-2002 Panjot Bagwara road. Good
-do- Bijhri 22-04-2002 Samirpur to Khansan Good
-do- Hamirpur 22-04-2002 Marial to Miharpura. Good
-do- Tihra Sujanpur 22-04-2002 Thalotu to Kuthrin road. Good
Out of the eight projects inspected, two were judgedas Very Good, and the remaining as Good. It is apresumption that the inspections were meaningful,since seven inspections over the districts of Bilaspurand Hamirpur are shown as having been conducted onthe same day.
Areas of Concern
• A total of 747 habitations are proposed to becovered under these sanctioned projects, stillleaving 10585 habitations unconnected.
• There is a wide variation in cost per kilometer ofthe road projects executed, ranging from Rs. 7.68lakh per km (Una) to Rs. 13.95 lakh per km(Solan). The State government is advised to getthis investigated through an independent agency.
• The quality of the roads for a tourism destinationcannot be anything but perfect. The governmentshould examine the specifications, and ensure thatthe specified quality is maintained, with constantmonitoring right through the construction phase.
NABARD
In 1995-96, the Government of India created theRural Infrastructure Development Fund (RIDF) withNABARD, which is a subsidiary of the Reserve Bank ofIndia, for providing loan funds to state governments forcreating durable assets in rural areas of the country.During the first year the emphasis was on agriculture,horticulture and minor and medium irrigation sectors.
From 1996-97 onwards, the road-and-bridge sectorwas also included in this scheme, when two roadprojects of Lal Dhank-Paonta-Rajban-Rohru-Sungri andSidhpur-Sungri-Dharanghati-Sarahan-Jeori roads, wereproposed for loan assistance.
Starting with RIDF-I, Himachal Pradesh is now inRIDF for 2002-2003. Up to February 2003, 298 schemescosting to Rs. 523 crore with Rs. 500 crore asNABARD loan and Rs. 23 crore as the state share havebeen sanctioned. Total expenditure for all tranches upto February 2003 is Rs. 286 crore only.
District Value of Proposals No. of Roadworks No. of Roadworks Per cent Roadworks Expenditure upto Oct.(Rs. in Lakh) Completed (upto Oct. 2003) Completed 2003 (Rs. in Lakh)
Bilaspur 816.74 16 10 62.50 660.89Chamba 1584.53 28 15 53.57 1128.44Hamirpur 1811.52 34 14 41.18 1377.01Kangra 3970.87 105 69 65.71 3283.14Kinnaur 690.72 10 3 30.00 414.78Kullu 1041.24 15 5 33.33 557.68Lahaul and Spiti 360.73 5 3 60.00 205.35Mandi 2666.92 49 24 48.98 1933.98Shimla 2211.67 36 21 58.33 1508.37Sirmaur 1157.57 22 9 40.91 833.00Solan 1359.08 25 10 40.00 952.47Una 1221.82 28 22 78.57 1011.80Total 18893.41 373 205 54.9598 13866.91

309Chapter 17 • INFRASTRUCTURE
The progress of works in NABARD roads needsspeeding up.
Central Road Fund
The Central Road Fund (CRF) is a non-lapsablefund. The Central Government determines accruals andallocation of funds to various states under CRF. CentralGovernment allocates the funds, out of the entitledallocation to various states and gives administrativeapprovals to the proposals of the state governments.After the accord of administrative approvals to proposalsby this Ministry, the project estimates for the proposalsare approved technically and financially by the stategovernment and works are executed by them. The
quality control and proper utilisation of funds is theresponsibility of the state government. One-third of theaccrual was released initially in November 2000.Thereafter, funds are released based on utilisation offunds by the states. Most of the states have not fullyutilised the funds released to them. State governmentsare being pursued at various levels, including at that ofChief Minister, for expediting completion of works andutilisation of funds.
The status of use of these funds is as below:
Thus, as per the report of the Ministry of RoadTransport and Highways, the CRF utilisation by HP isonly one-third of the total availability, reflecting a needto watch progress in this area.
(in Rs. Crore)
Sr. No Name of the State/UT CRF Accruals for Total Accruals Out of Total Funds Balance %age of Utilisation/the year 2001-2002 CRF from 2000-2001 Released out (col. 4-5) Release to
to 2002-2003 of CRF the Accruals
(1) (2) (3) (4) (5) (6) (7)
1. Andhra Pradesh 162.49 243.94 125.969 117.9718 52
2. Arunachal Pradesh 21.93 32.79 7.4200 25.3708 23
3. Assam 29.81 45.21 24.8300 20.3808 55
4. Bihar 51.81 85.71 16.1100 69.6008 19
5. Chhattisgarh 45.59 62.87 37.4500 25.4208 60
6. Goa 7.73 11.82 1.3100 10.5108 11
7. Gujarat 137.92 206.05 79.7900 126.2608 39
8. Haryana 63.45 99.20 31.4100 67.7908 32
9. Himachal Pradesh 20.70 31.45 10.7044 20.7464 34
10. Jammu & Kashmir 60.57 91.62 21.2502 70.3706 23
11. Jharkhand 36.07 47.32 6.0700 41.2508 13
12. Karnataka 113.00 171.13 50.0100 121.1208 29
13. Kerala 53.83 81.54 9.2300 72.3108 11
14. Madhya Pradesh 124.42 191.01 50.8205 140.1903 27
15. Maharashtra 211.98 313.39 68.3500 245.0408 22
16. Manipur 6.50 9.74 2.2200 7.5208 23
17. Meghalaya 8.81 13.10 5.7385 7.3623 44
18. Mizoram 5.92 8.88 7.9200 0.9608 89
19. Nagaland 4.97 7.44 3.3700 4.0700 45
20. Orissa 57.71 87.53 9.7000 77.8308 11
21. Punjab 84.15 124.58 35.7300 88.8508 29
22. Rajasthan 151.66 228.37 84.4400 143.9308 37
23. Sikkim 2.19 3.29 0.7400 2.5500 22
24. Tamil Nadu 133.46 200.68 82.3400 118.3408 41
25. Tripura 3.80 5.73 2.0770 3.6530 36
26. Uttaranchal 21.78 29.37 8.2000 21.1708 28
27. Uttar Pradesh 176.46 272.89 30.5568 242.3340 11
28. West Bengal 72.00 108.88 32.5605 76.3203 30

HIMACHAL PRADESH DEVELOPMENT REPORT310
National Highways in Himachal Pradesh(The 1235 km of National Highways in Himachal Pradesh, as shown below)
Name of National Highway NH No. Name of Circle Name of Division Length in Division(in Kms)
Jallandhar-Pathankot-Jammu-Srinagar Road 1-A NH Circle HPPWD Shahpur NH Division Jogindernagar 10.000
Pathnkot-Chakki-Mandi Road 20 NH Circle HPPWD Shahpur NH Division Jogindernagar 197.000
Chandigarh-Mandi-Manali Road 21 NH Circle HPPWD Shahpur NH Division Pandoh 151.250
Ambala-Kalka-Shimla-Wangtoo-Kaurik Road 22 NH Circle HPPWD Narkanda NH Division Solan 130.450NH Division Rampur 160.000
Jallandhar-Hoshiarpur-Mubarikpur-Amb-Nadaun-Hamirpur T/Devi Dharampur-Kotla Mandi Road 70 1st Circle HPPWD Mandi Dharampur Division 38.000
1st Circle HPPWD Mandi Mandi Division No. II 40.5301st Circle HPPWD Mandi Sarkaghat Division 21.8658th Circle HPPWD Hamirpur Touni Devi Division 22.0008th Circle HPPWD Hamirpur Hamirpur Division 33.2659th Circle HPPWD Nurpur Dehra Gopipur Division 17.05015th Circle HPPWD Una Bharwain Division 32.420
Pinjore-Nalagarh Swarghat Road 21-A 3rd Circle HPPWD Solan Nalagarh Division 48.875
Shimla-Barahampukhar-Ghagus Hamirpur-Nadaun-Ranital Kangra(Mataur) Road 88 3rd Circle HPPWD Solan Arki Division 35.600
4th Circle HPPWD Shimla Shimla Division No. II 25.0005th Circle HPPWD Palampur Kangra Division 21.3008th Circle HPPWD Hamirpur Hamirpur Division 31.0008th Circle HPPWD Hamirpur Barsar Division 10.0008th Circle HPPWD Hamirpur Touni Devi Division 10.0009th Circle HPPWD Nurpur Dehra Gopipur Division 29.70010th Circle HPPWD Bilaspur Bilaspur Division No. I 16.00010th Circle HPPWD Bilaspur Bilaspur Division No. II 18.40010th Circle HPPWD Bilaspur Ghumarwin Division 27.000
Ambala-Naraingarh-Kala Amb-Paunta-DehradunHaridwar Road 72 12th Circle HPPWD Nahan Nahan Division 14.000
12th Circle HPPWD Nahan Paonta Division 43.000
Chandigarh-Mandi- Manali Road 21 10th Circle HPPWD Bilaspur Bilaspur Division No. I 29.75010th Circle HPPWD Bilaspur Bilaspur Division No. II 45.000
Inadequacies in Road Network
Less All-weather Roads
The total road length was 27,737 km in the state ason 31 December 2002. However, following major issuesemerge:
The total road length mentioned is only a count ofthe total road formation in the state. Only 45 per centof this road formation is metalled and tarred, theremaining being bare road surface.
Thus, less than 50 per cent of the roads are all-weather roads. This is a startling data for a state whichseeks to move quickly on the tourism front. This is notrestricted only to remote areas, but is seen all over thestate.
Poor Village Connection
There are 16807 inhabited villages in HimachalPradesh. At the end of 2002, less than 50 per cent ofthem were connected by roads, as shown in Table 17.15:
MAJOR ROADS OF HIMACHAL PRADESH
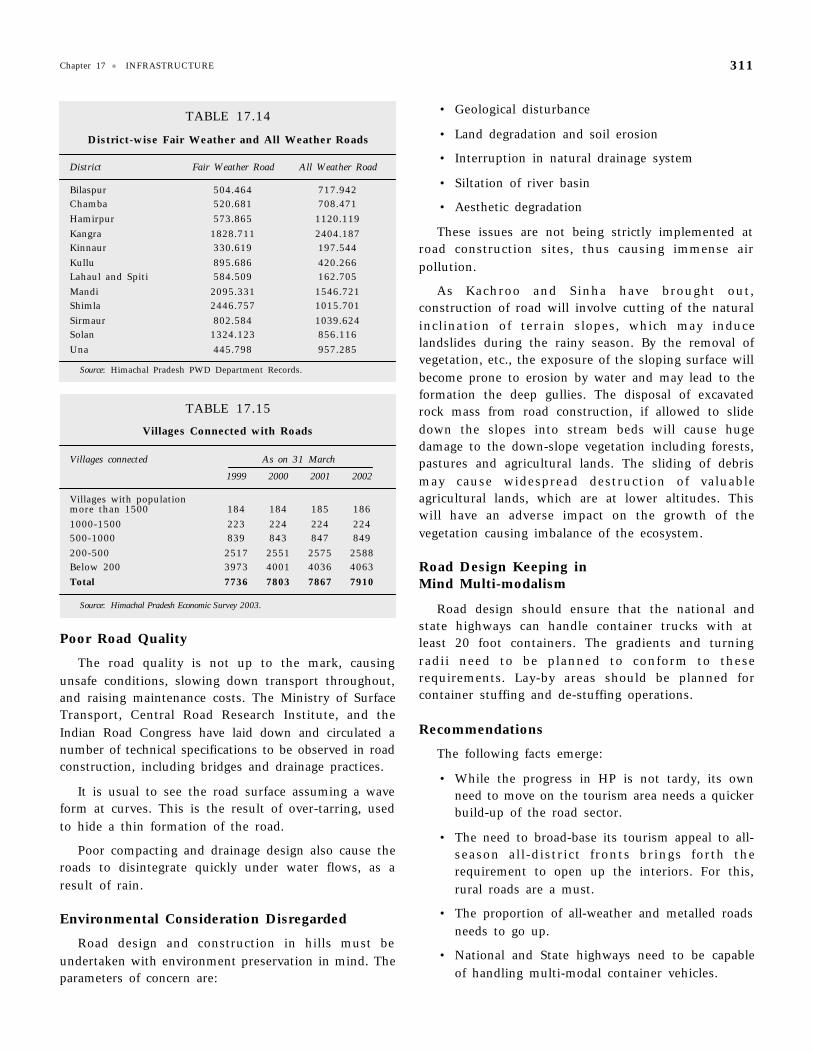
311Chapter 17 • INFRASTRUCTURE
TABLE 17.14
District-wise Fair Weather and All Weather Roads
District Fair Weather Road All Weather Road
Bilaspur 504.464 717.942Chamba 520.681 708.471Hamirpur 573.865 1120.119Kangra 1828.711 2404.187Kinnaur 330.619 197.544Kullu 895.686 420.266Lahaul and Spiti 584.509 162.705Mandi 2095.331 1546.721Shimla 2446.757 1015.701Sirmaur 802.584 1039.624Solan 1324.123 856.116Una 445.798 957.285
Source: Himachal Pradesh PWD Department Records.
TABLE 17.15
Villages Connected with Roads
Villages connected As on 31 March
1999 2000 2001 2002
Villages with populationmore than 1500 184 184 185 1861000-1500 223 224 224 224500-1000 839 843 847 849200-500 2517 2551 2575 2588Below 200 3973 4001 4036 4063Total 7736 7803 7867 7910
Source: Himachal Pradesh Economic Survey 2003.
Poor Road Quality
The road quality is not up to the mark, causingunsafe conditions, slowing down transport throughout,and raising maintenance costs. The Ministry of SurfaceTransport, Central Road Research Institute, and theIndian Road Congress have laid down and circulated anumber of technical specifications to be observed in roadconstruction, including bridges and drainage practices.
It is usual to see the road surface assuming a waveform at curves. This is the result of over-tarring, usedto hide a thin formation of the road.
Poor compacting and drainage design also cause theroads to disintegrate quickly under water flows, as aresult of rain.
Environmental Consideration Disregarded
Road design and construction in hills must beundertaken with environment preservation in mind. Theparameters of concern are:
• Geological disturbance
• Land degradation and soil erosion
• Interruption in natural drainage system
• Siltation of river basin
• Aesthetic degradation
These issues are not being strictly implemented atroad construction sites, thus causing immense airpollution.
As Kachroo and Sinha have brought out,construction of road will involve cutting of the naturalinclination of terrain slopes, which may inducelandslides during the rainy season. By the removal ofvegetation, etc., the exposure of the sloping surface willbecome prone to erosion by water and may lead to theformation the deep gullies. The disposal of excavatedrock mass from road construction, if allowed to slidedown the slopes into stream beds will cause hugedamage to the down-slope vegetation including forests,pastures and agricultural lands. The sliding of debrismay cause widespread destruction of valuableagricultural lands, which are at lower altitudes. Thiswill have an adverse impact on the growth of thevegetation causing imbalance of the ecosystem.
Road Design Keeping inMind Multi-modalism
Road design should ensure that the national andstate highways can handle container trucks with atleast 20 foot containers. The gradients and turningradii need to be planned to conform to theserequirements. Lay-by areas should be planned forcontainer stuffing and de-stuffing operations.
Recommendations
The following facts emerge:
• While the progress in HP is not tardy, its ownneed to move on the tourism area needs a quickerbuild-up of the road sector.
• The need to broad-base its tourism appeal to all-season all-district fronts brings forth therequirement to open up the interiors. For this,rural roads are a must.
• The proportion of all-weather and metalled roadsneeds to go up.
• National and State highways need to be capableof handling multi-modal container vehicles.

HIMACHAL PRADESH DEVELOPMENT REPORT312
It is necessary to put in place an institutionalarrangement to manage the road sector on aprofessional footing.
Experience of NHAI in NHDP was commenced onthe Build-Operate-Transfer model, using toll collectionas a basis. However, experience has made it clear thatthe “tolls” model can succeed in very limited area, andthe experience of earlier projects like the Coimbatorebye-pass have given clear indications (G. Raghuram &Geeta Kheskhani). A significant new factor in the BOTprogramme is the induction of annuities. Instead of, orin conjunction with concessions, the developer is paidan annuity over a fixed period, subject to a certificationof the availability of the facilities to the users, as perspecifications. This certification is done through anindependent engineer, who examines the project inaccordance with required specifications, and certifiestheir availability to the users. This has rightly shiftedthe emphasis from a mere “build” to “build andmaintain” paradigm. The real bane of Indian road sectoris the abysmal post-construction maintenance; inaddition project developers use materials that pass shortterm technical testing, but prone to long termmaintenance flaws. (The India Infrastructure Sector inIndia, 2001-02, India Infrastructure Report, 2003,Anupam B. Rastogi)
The annuity principle is ensuring that sincepayments are made on the basis of continuedmaintenance of standards, the developer must ensurerelevant specifications right from the start.
HP has commenced its private participation in roadsexercise by identifying six interstate barriers on whichwidening, four-laning, computerisation and commercialdevelopment will be undertaken on a public-privatepartnership basis. ILFS has prepared a concept note forstructuring the bidding process and attracting privateinvestment which is being finalised. These barriersinclude Parwanoo, Kala Amb, Mehatpur, Swarghat.
This should be carried further in involving privatesector in a clear endeavour to maintain state highwaysand rural roads to specifications. These roads should becontracted out for maintenance to private agencies, forat least ten year periods, to allow the entrepreneur toeffectively recover his investments. The paymentsshould be on the basis of the annuity principle, withlinkage to the continued availability of a well-maintained road. At present, construction and one timemaintenance contracts allow payments on the basis ofwork executed, but is not linked to the quality ofconstruction, and long term maintenance. As a result
HP PWD is continuously on an exercise ofdepartmental and private road repairs, with highwaysbecoming one long joining of such repaired patches.
Roads – both for new construction and formaintenance of existing ones - in HP, should be thuscontracted out over a longer length of chainage, and fora longer period of time, which allows entrepreneurs todevelop their business models, linked to annuities,subject to satisfactory maintenance. Road developmentand maintenance can also be taken up by investors inthe tourism business, who may need a right of way toopen up their proposed properties to bettercommunication.
Enact Road Fund Act
Recognising the need for mobilising greater non-budgetary resources for development and maintenanceof the PWD road network, regulatory and institutionalinitiatives were undertaken for generating more usercharges and mobilising greater private sectorinvolvement in road projects, The Kerala Road Fundwas constituted under the Kerala Road Fund Act 2001which became law on November 23, 2001. The purposeof the Road Fund is to finance.
• routine recurrent and periodic maintenance ofPWD roads.
• development of existing road network systemincluding upgrading of any road maintained bythe PWD.
• construction of new roads wherever necessary.
• such road safety projects as are found essentialfor safe and smooth traffic.
• research related to maintenance and developmentof roads.
• any cost-sharing, donor-funded project intendedfor all or any of the purposes mentioned above.
The Road Fund shall consist of:
a) all moneys received from the Central Road Fundestablished under the Central Road Fund Act,2000.
b) the contribution made by the Government.
c) all fees, fines and other amount collected by theGovernment as per the provisions of the KeralaHighway Protection Act, 1999.
d) all payments made by the concessionaire as perthe concession agreement.

313Chapter 17 • INFRASTRUCTURE
e) all amount standing to the credit of the BridgesFund established under Section 12 of the KeralaTolls Act, 1976.
f) the user fees collected by the Governmentagency or the statutory body under the KeralaRoad Fund Act.
g) grants or loans or advances made by theGovernment of India or any institution.
h) grants or loans or advances made by theGovernment.
i) all returns on investments made by the RoadFund Board directly or through a Governmentagency or statutory body.
j) any amount borrowed by the Road Fund Board.
k) any other amount authorised for credit to theFund under the provisions of Road Fund Act orrules made thereunder or any other law for thetime being in force.
The Fund is headed by the CM, with cabinetministers of finance, PWD, and transport, along withofficials and experts from transport and finance areas.
The Government shall contribute to the Fund everyyear an amount equal to ten per cent of the taxcollected by them in the previous year under theprovisions of the Kerala Motor Vehicles Taxation Act,1976, and the said amount shall be charged on theConsolidated Fund of the State.
It is recommended that HP should also enact andcreate an institutional mechanism for the Road Fund,and place the road sector on a professional basis.
It is also recommended to make the PWD into aseparate profit centre, with grants linked to specificmaintenance and construction projects. The works ofPWD will also be subject to an audit by an independentengineer, to bring transparency and professionalisminto its working. After sufficient experience of workingas an independent profit centre, PWD department couldbe corporatised as HP Construction Limited.
Note on Himachal Road Transport Corporation (HRTC)
On the advent of independence, Himachal wasformed as a “C” class state. Consequent tonationalisation of passenger and goods service,Himachal Government Transport came into existence inJuly 1949 and continued to function as such till 1October 1974. During 1958, a Corporation was floatedjointly by the Governments of Punjab and Himachal
and the Railways under the Road Transport CorporationAct., 1950 with a name and style as “Mandi-Kullu RoadTransport Corporation”, basically to operate on thejoint routes in Punjab and Himachal. With the re-organisation of Punjab in 1966, certain hilly areas ofthe state were merged in Himachal and the operationalareas of Mandi-Kullu Road Transport Corporation cameentirely within expanded Himachal. This Corporationalso continued to function as such till October 1, 1974.On October 2, 1974, Himachal Government Transportwas merged with Mandi-Kullu Road TransportCorporation and was renamed Himachal Road TransportCorporation, under the Road Transport CorporationAct, 1950.
An operational snapshot of HRTC operations can beseen as in Table 17.16.
TABLE 17.16
Operational Snapshot ofHimachal Road Transport Corporation
Indices 1974 2001 2003
Routes 379 1733 1784Buses 733 1728 1711
Coverage (in lakh km) 303.29 1409.41 1423.06Fuel consumption (km/litre) 2.90 3.54 3.56Fleet Utilisation 79% 98% 98%
Accident/lakh km 0.17 0.12 0.13Accidents/year 52 169Km/bus/day 113 223 221
Besides its operation in the entire HimachalPradesh, including the tribal districts of the State,HRTC operates its buses in the neighboring states ofPunjab, Haryana, Rajasthan, Uttar Pradesh, Jammu &Kashmir, Union Territories of Chandigarh and Delhi.Its buses cross through the three highest mountainpasses of Bara-Lacha, Kunjam and Rohtang.
Operations indices reveal a good picture on thetransport production front. While the number of busesincreased 2.5 times, routes went up five times, andtotal kilometerage increased 4.5 times.
This is reflected in km per bus per day, which hasdoubled from 113 km per day in 1974, to 221 in 2003.
Fuel consumption data have also improved, and theaverage consumption is reasonable for hill haulage.
The safety factor, however, remains an area ofconcern. HRTC has not given any data of fatalities, butits accident rate in terms of accidents per lakh kmsshows that the absolute number of accidents has

HIMACHAL PRADESH DEVELOPMENT REPORT314
tripled from 52 accidents per year in 1974 to 169 in2001. Bus-holding has gone up less than three times,indicating a higher per bus accident rate. These issuesneed close examination.
Staff Efficiency
Since the inception of Himachal Road TransportCorporation, the staff from Mandi-Kullu Transport wasabsorbed in HRTC. During 2000-2001 the staff strengthin HRTC was 9084. The Corporation has fixed thenorm for staff of each category. The details are asunder:
TABLE 17.17
Category-wise Norms for Staff
Sr. No. Description Staff per Bus
1. Drivers 1.40
2. Conductors 1.45
3. Inspectors 0.18
4. Administration 0.75
5. Workshop 1.60
6. Store 0.18
7. Others 0.24
Total 5.80
This means that that are three operations andfrontline staff (driver + conductor + inspector) perbus, and an equal number of support staff in theworkshops and offices. This teeth (frontline) to tail(support) ratio of 1:1 is unacceptable in any productionsituation.
It is the equivalent of 1 office staff (administration +store) and 2 others (workshop + others), a total ofthree staff permanently on each bus!
The trend of increase in number of buses and stafffor the last ten years is shown in Table 17.18. Thisclearly shows that bus-to-staff ratio has remainedconstant for more than a decade.
Transport technology has improved over time. Thevehicles have higher fuel averages, longer serviceintervals, are safer, and afford better ride quality, whileincreasing available engine power. All these translateinto lower operation and maintenance costs. Theseshould have a direct impact on the number of staffrequired to run and maintain a bus. These efficiencieshave not been translated within the organisation, andthe improvements in technology have not beenexploited.
TABLE 17.18
Year-wise Number of Buses and Staff Strength
Financial Year Number of Buses Staff Strength Ratio
1988-1989 1379 7530 5.46
1989-1990 1503 7986 5.31
1990-1991 1525 8256 5.41
1991-1992 1606 8643 5.38
1992-1993 1614 8659 5.36
1993-1994 1598 8561 5.35
1994-1995 1670 8647 5.17
1995-1996 1666 8810 5.28
1996-1997 1711 8917 5.21
1997-1998 1742 9270 5.32
1998-1999 1777 9229 5.19
1999-2000 1734 9282 5.35
2000-2001 1728 9084 5.26
2001-2002 1747 8964 5.13
2002-2003 1711 8494 4.96
Financial Results
The operational income of HRTC during 2002-2003was Rs. 201.53 crore. By allowing free/concessionalfacilities, the corporation is suffering financial loss tothe extent of Rs.40.57 crore yearly (as per HRTCreports). In addition to this, the corporation is alsooperating uneconomical routes in public interest.HRTC provides free and concessional travel facilities asunder:
Free Travelling Facility
The Corporation provides free travelling facility tothe following categories:
• Handicapped (35,844 persons)
• Press correspondents/MLAs/MPs/Ex-MLAs/Ex-MPs and social workers
• War widows and gallantry award winners - keepingin view the services rendered by the defencepersonnel for the nation, free travel facility tothese two categories is only a mark of honour.
• Padam Shree awardees.
• Freedom fighters.
Concessional Facilities
The Corporation provides concessional travellingfacility to the following categories:

315Chapter 17 • INFRASTRUCTURE
• Students of Government Schools/Colleges pay 10single fares a month, and those of PublicSchools, who are provided earmarked buses, pay30 single fares a month.
• Employees: state government employees fromplace of residence to offices against payment of 30single fare a month.
• Police officials/jail wardens: Presently, policepersonnel upto the rank of Inspector and jailwardens travel free within and outside the state,on payment of Rs. 50 a month, deducted fromthe salary and deposited in the governmenttreasury.
An independent study of the level of subsidiesprevalent in HRTC under the subject of SocialAccounting found that the level of subsidy enjoyed bytarget groups under orders of the government amountedto Rs. 37.12 crore in 1999-2000. The claim by HRTC ofthe current level at Rs. 40 crore therefore seemsreasonable.
The losses for 2002-2003 are Rs. 23.36 crore, andprojected to be Rs 28.03 crore in 2003-2004 byHRTC.
The data from Table 17.19 read with the profit andloss statement (Table 17.20) make it clear that if HRTCwas not forced to provide subsidised travel, there was apossibility of it breaking even.
It was surprising to note that while Himachal Pradeshdeducts Rs. 50 from the salary of each police and jail staff forfree travel by HRTC, this is not given to HRTC, but depositedin the government treasury!
TABLE 17.20
Profit and loss position of HRTC(1979-80 to 1999-2000)
(Rs. in Million)
Year Total Receipts Total Expenditure Profit/Loss
1979-80 143.14 138.61 +4.53
1983-84 254.24 296.13 -41.89
1987-88 493.72 498.69 -4.97
1991-92 708.66 924.42 -215.76
1995-96 1239.36 1367.82 -128.46
1999-00 1741.12 2226.51 -485.39
2000-01 2038.29 2385.90 -347.61
2001-02 2217.29 2505.83 -288.54
2002-03 2370.67 2669.31 -298.63
Recommendations for HRTC
It is always easy to tell the government that “it hasno business in business”, but HRTC is not poorly run.It is in a financial fix because of government policies,and if Himachal Pradesh reorients HRTC on businesslines, it can do well. The pattern of ownership is adecision that the government can take as it deems fit,but HRTC can be turned around with the followingmeasures:
• Start an aggressive technical training programme,particularly for drivers and workshop staff. Thiswill improve safety and bring down maintenanceand operations costs.
• Conduct radical BPR to reassess the staffrequirement in the maintenance and
TABLE 17.19
Losses Sustained on Account of Providing Cencessional/Free Travelling Facilities by HRTC(Rs in lakh)
Sr. No. Category 1995-96 1996-97 1997-98 1998-99 1999-00
Nos. Amount Nos. Amount Nos. Amount Nos. Amount Nos. Amount
1 Students 137088 1275.0 150000 1400.0 157500 1700.00 184000 2040.00 228800 2448.0
2 Employees 28179 152.00 31300 170.00 32850 205.00 39420 305.00 47304 366.00
3 Freedom Fighters 2520 18.00 2800 20.00 2940 24.00 3528 29.00 4233 34.00
4 War Widows 680 03.00 750 04.00 790 05.00 948 06.00 1137 07.00
5 Physical Handicapped 8620 24.00 9500 26.00 10000 31.00 12000 37.00 14400 44.00
6 Press Correspondents 135 02.00 150 03.00 160 04.00 192 05.00 230 06.00
7 Police, MP, MLAs & Others 14147 502.00 15700 550.00 17470 615.00 20964 706.00 14788 807.00
TOTAL 191369 1976.0 210200 2173.0 221710 2584.00 261052 3128.00 310892 3712.0
Source: Himachal Road Transport Corporation, Annual Accounts

HIMACHAL PRADESH DEVELOPMENT REPORT316
administrative staff. In view of improvements intechnology and induction of informationtechnology, current levels of one support staff forevery operations staff in unacceptable. Clericalstaff can be re-deployed against vacancies in othergovernment departments.
• Safety, better amenities, and punctuality areneeded to lift occupancy ratios. CAG has noted in2001 that “the actual occupancy ratio was 67 percent, 57 per cent and 59 per cent against thebreakeven occupancy ratio of 73 per cent, 76 percent and 69 per cent during the period 1998-99,1999-2000 and 2000-01 respectively.” Occupancydecreased because of large-scale privatisation,which affected the traffic potential of thecorporation on profit earning routes, while thecorporation could not withdraw buses fromuneconomical routes. There is a need torationalise the route permits in accordance withtraffic needs.
• HRTC has started a number of initiatives forbetter service and cost reduction. These includecomputerised and networked advance ticketing,group discount, return ticket incentives, smartcards, etc. These should be vigorously pursued toenhance efficiency.
• Either remove subsidies, or compensate HRTC forthe same, in accordance with the TransportCorporation Act.
• The tariff policy of HRTC is not clear, and thefare has not undergone any revision since 1999.The State government should take steps to laydown a clear tariff policy, which would apply toboth HRTC and private operators.
Response from HP tothese Recommendations
Road Safety Factor
Data has been quoted in support to emphasise that
“accident rate” has dropped. However, the data is asunder:
Accident Rate Per Lakh Kms
Source: HRTC
The data shows that the rate has decreased slowlysince 1997-98, but risen sharply in 2002-2003, andhovered at an average of about 0.15. This needs asserious analysis.
However, HRTC should adopt the additional norm of“fatality per lakh kilometers” also, to arrive at the realpassenger impact of safety improvement. Further, HRTCshould introduce a mandatory breathalyzer test at dutysign-on, by both driver and conductor, with surprisechecks on run.
Staff Ratio
As against the actual per bus staff of 5.40 in 90s,the norm has been fixed at 5.80. HRTC has said theratio of support staff per bus is 0.75, but as per thedata sent by them, it is still 1 per bus (administrative0.65 + Store 0.16 + Others 0.19). Meaningful stepsneed to be taken to bring down the staff cost.
Railways
In all its plan papers, Himachal Pradesh has givenup on railway as a transport medium. It mentions theexisting railway lines in passing, and then moves on toits familiar fixation with Road-HRTC.
The following traffic surveys were done in HimachalPradesh in the last five years by the Railways:
0
0.05
0.1
0.15
0.2
1974
-75
1992
-93
1994
-95
1996-9
7
1998-9
9
2000
-01
2002-0
3
Surveys Done During Last Five Years in Himachal Pradesh
Sr. No Name of Survey Month/year of Length in Km Project Cost Rate of ReturnReport Submission (in Rs crore)
1 Kalka-Kamli new line 11/1997 5.35 25 -26.002 Hoshiarpur-Una 3/2000 40.5044.50 143156 -24.55-23.143 Pathankot-Jogindernagar – Gauge Conversion
& BG line from Jogindernagar to Bhanupalli 3/2001 352.13 3566 -27.484 Una-Jaijon-Doaba 3/2002 40.14 269 -46.84

317Chapter 17 • INFRASTRUCTURE
Status of New Line Works
• After commissioning of Nangaldam–Una section,work on the Nangal Dam-Talwara new line wasfrozen by the Railway Board. Work was defrozenin 1997-98 and is in progress in one blocksection, i.e., for Una-Himachal to ChuraruTakarala (17 km), with a targeted date ofcompletion of December 2003. The originalestimate of cost was Rs 210 crore, but theexpenditure upto Churaru Takarala is likely to beRs 68 crore, and the estimates will need revision.
• Kalka-Parwanoo new line (4 km). Work wassanctioned in 1999 at a cost of Rs 37 crore. Therehas been no progress in this project, because ofthe prohibitive cost of land. Himachal Pradeshgovernment has now suggested that the line betaken to Tipra village, where the land cost is likelyto be less. Fresh survey work has been taken up.
Passenger Railway
Himachal Pradesh is home to two of India’s fiveheritage hill railway networks, the Kalka-Shimla line(96 km) and the Pathankot-Jogindernagar line (113 km).
Kalka-Shimla completed its century in November2003. The Railways claim that while they spend Rs. 14crore in maintaining the section, earnings are only Rs.7crore, and that they run the line primarily as a touristattraction, and as a heritage value.
Pathankot–Jogindernagar also passes through someof the most breathtaking rail journey views in theworld, and its vast tourist potential remains under-utilised.
Himachal Pradesh government should approachNorthern Railways to enter into joint tourist promotionpackages, especially for attracting foreign tourists forsteam tourism. The heritage tourist is willing to pay,provided the package is right. Steam engines areavailable both for the narrow and the metre guagesections, and time-tabled services should be announcedfor the same.
Goods Movement
This is a critical area in which Railways can help.Essentially there are two streams of traffic to cater to:
• High value or special-purpose container traffic: Inthe container segment will fall high valueindustrial produce, and agro-processing industryproduce.
• Medium or low-value bulk traffic: Thisconstitutes raw materials for Himachal Pradesh’scement plants, and movement of finishedproduce. It will also cater to increased fertilizerrequirements for horticulture. It can be a majorfacilitator in the movement of bulk cement andsteel, to as far away as economically possible, forHimachal Pradesh’s medium and large hydroprojects under construction, and under planning.
• Special Purpose Vehicles (SPVs) should bethought of, with investments from Railways, HPGovt, and the private sector, to develop a railwaynetwork that is capable of moving millions oftonnes of bulk raw materials required for hydroprojects. When this work is over, the lines willbe put to alternate passenger usage, but thebusiness model should break-even with thetargetted goods movement only, with extendedpassenger use as earning additional revenues forthe SPV.
Containerisation
HP needs to encourage containerisation of the state.In consultation with Container Corporation of India,nodal points for establishing Container Freight Stationsshould be set up. To encourage direct shipping of agro-products to international markets, possibility of settingup an ICD should be explored.
Air Transport, Ropeways, Cable Cars
With Himachal Pradesh’s vision of a high growthcurve, it must be accepted that alternative means oftransport must be developed, so that they can take thepressure off the roads. Otherwise, tourists will simply
EXISTING RAIL NETWORK OFHIMACHAL PRADESH

HIMACHAL PRADESH DEVELOPMENT REPORT318
not be able to reach, and goods delivery schedules willgo haywire.
The possibility of using ropeways, with abundantpower supplies predicted in the future, must beevaluated as a serious option for point-to-pointmovement of horticulture produce like apples.
Onward air linkages to the existing airports atJubbar Hatti, Bhuntar, and Kangra by helicopters mustalso be evaluated. They cannot be a serious option forthe average tourist, but the helicopters at Vaishno Deviand Kedarnath are booked in advance, and giving goodreturns. Circuits where paying tourists are available canbe planned for this. Cable cars are also a greatattraction, and HP needs to weave all these modes intoa plan to encourage private participation in thesesectors.
ReferencesCentral Electricity Authority, 15th, 16th Electric Power Survey of India, Ministry of
Power, New Delhi
—————. “Perspective of National Power Plan Development up to 2006-07” New Delhi,1991.
Chandrasekharam, D, “Geothermal Power Asia 2000” Paper presented at IBC,
Conference Manila, Philippines, 2000.
Government of Himachal Pradesh, Annual Plans 1998-2002, Shimla.
Government of Himachal Pradesh, Economic Survey, 1998-2003, Shimla.
Government of Himachal Pradesh, Eighth and Ninth Five Year Plans, Shimla.
Harshe Rajen, Stakeholder Participation in Andhra Pradesh Reform Process, 2001
ICRA Limited, Report on Himachal Pradesh to the Power Finance Corporation, January 2003.
Kachroo, P.N. and Ashish Sinha. Environmental Concerns in Highway Development withSpecial Reference to Road Projects in Hill Areas. 62nd Session, Indian RoadsCongress, Kochi.
Kohler, Thomas, Hans Hurni, Urs Wiesmann, and Andreas Kläy, MountainInfrastructure: Access, Communication, and Energy, Bishkek Global MountainSummit (Background Paper).
Mahajan S.K., Social Accounting and Performance of Road Passenger Transport: A Case Study,Annual Conference of IASIA, Athens (Greece) July 2001.
Ministry of Railways, Union Railway Budget Papers, 1997-2003, New Delhi.
Morris Sebastian (ed) : India Infrastructure Report 2003, 3i Network,
Northern Railway, Annual Progress Reports, Construction Office, 2001, 2002, 2003. NewDelhi.
Planning Commission, Five Year Plan 2002-2007, Vols. 1, 2, & 3, New Delhi
Srivastava, R.N. et al. “Planning Power Development in India - Emphasis on Hydro Projects”.Paper presented at World Energy Council, 17th Congress, Houston,USA - 13-18 September 1998.
World Bank, Andhra Pradesh Sector Restructuring Project, Project Appraisal Document.
www.himachal.nic.in (official website of HP government).
www.hpseb.com (website of HP State Electricity Board).
www.hrtc.nic.in (website of Himachal Road Transport Corporation).
www.morth.nic.in (website of Ministry of Road Transport & Highways)