Embed Size (px)
Citation preview
SEMAFOUR (316384) D6.6 Final report
Version 1.0 Page 1 of 106
INFSO-ICT-316384 SEMAFOUR D6.6
Final report on a unified self-management system for heterogeneous radio access networks
Contractual Date of Delivery to the EC: August 31st, 2015 Actual Date of Delivery to the EC: August 31st, 2015 Work Package WP6 – Dissemination and Exploitation Participants: Nokia-D, ATE, EAB, iMinds, FT, TNO, TUBS, Nokia-DK Authors Sören HAHN, Zwi ALTMAN, Mehdi AMIRIJOO, Hans van den
BERG, Johannes BAUMGARTEN, Nils DREYER, Dario GÖTZ, Ovidiu IACOBOAIEA, Sana Ben JEMAA, Ljupco JORGUSESKI, István Z. KOVÁCS, Thomas KÜRNER, Daniela LASELVA, Remco LITJENS, Simon LOHMÜLLER, Andres A. Mendoza MARTÍNEZ, Pradeepa RAMACHANDRA, Bart SAS, Lars Christoph SCHMELZ, Kathleen SPAEY, Abdoulaye TALL, Konstantinos TRICHIAS, Yu WANG, Colin WILLCOCK
Reviewers Chris BLONDIA, Andreas EISENBLÄTTER, Colin WILLCOCK Estimated Person Months: 24 Dissemination Level Public Nature Report Version 1.0 Total number of pages: 106 Abstract: The goal of the SEMAFOUR project was to design and develop a unified self-management system, which enables the network operators to holistically manage and operate their complex heterogeneous mobile networks. This final deliverable, building on the existing deliverables of the project, summarises the key results and achievements of the project. The findings are accompanied by an overview of the used advanced realistic network scenarios, a description of the developed demonstrator and an outlook towards SON functionality beyond the scope of the SEMAFOUR project. Keywords: Self-organisation, SON, SON Functions, Multi-RAT, Multi-layer, SON Coordination, SON Management, Realistic Network Scenarios, Demonstrations, Future Networks
Ref. Ares(2015)3569455 - 31/08/2015
SEMAFOUR (316384) D6.6 Final report
Version 1.0 Page 2 of 106
Executive Summary The SEMAFOUR (Self-Management for Unified Heterogeneous Radio Access Networks) project had the overall objective to design and develop three main components of a unified self-management system for heterogeneous radio access networks, comprising multiple RATs and multiple layers. The unified self-management system shall represent the complete radio environment as one single network towards the operator and shall take the challenges of multi-vendor environments and the complexity of the introduction of Self-Organising Network (SON) into account. At first, the project shall develop new concepts, methods and algorithms for a selected set of SON functions targeting multi-RAT and multi-layer environments. Secondly, the project shall develop an integrated SON management system to provide a high-level management interface for the instrumentation of SON functionalities while ensuring their conflict free operation in modern multi-technology networks. And thirdly, the project shall develop a decision support system that helps to improve the network upgrade planning by defining large time scale network performance predictions. In order to achieve the goals the project sought guidance in selecting use cases by asking European operators. After that a realistic scenario, the so called Hannover Scenario, has been set up that enabled the development and validations of the identified use cases. New powerful SON algorithms have been developed and validated for the following use cases: Wi-Fi / LTE traffic steering, high mobility users, Active Antenna Systems (sectorisation) and Dynamic Spectrum Allocation. This development has been accompanied by the development of an integrated SON management system which showed an improvement in terms of network performance, controllability of performance trade-offs, a reduced network management cost and simplification of the network supervision. In the end all use cases have been presented using the SEMAFOUR demonstrator. To achieve this, a common simulator platform called “SON laboratory” has been used. The demonstrator that has been developed within the SEMAFOUR project consists of multiple clients (operator-, network-, KPI-client, etc.). At last, the project has considered exemplary future networking scenarios, including further advancements of LTE, 5G systems and future deployment scenarios. These are considered in a set of studies that address challenges with respect to self-organisation in the light of future network technologies. These studies are on:
• Device-to-device communication • Nomadic Networks • Licence Assisted Access-LTE Channel Selection • Virtual Cell Sectorisation • Cognitive SON Management
Note that this final deliverable builds on the existing deliverables of the SEMAFOUR project. It covers the key results of the mentioned objectives and the associated use cases. For more information on selected use cases the reader is referred to the specific, publicly available deliverables and published scientific papers at numerous conferences and journals.
SEMAFOUR (316384) D6.6 Final report
Version 1.0 Page 3 of 106
List of Authors
Partner Name E-mail
Nokia-D Simon Lohmüller Lars Christoph Schmelz Colin Willcock
[email protected] [email protected] [email protected]
ATE Dario Götz [email protected]
EAB Mehdi Amirijoo Pradeepa Ramachandra Yu Wang
[email protected] [email protected] [email protected]
iMinds Bart Sas Kathleen Spaey
[email protected] [email protected]
FT Zwi Altman Ovidiu Iacoboaiea Sana Ben Jemaa Abdoulaye Tall
[email protected] [email protected] [email protected] [email protected]
TNO Hans van den Berg Ljupco Jorguseski Pia Kempker Remco Litjens Konstantinos Trichias Andres A. Mendoza Martínez
[email protected] [email protected] [email protected] [email protected] [email protected] [email protected]
TUBS Johannes Baumgarten Nils Dreyer Sören Hahn Thomas Kürner
[email protected] [email protected] [email protected] [email protected]
Nokia-DK István Z. Kovács Daniela Laselva
SEMAFOUR (316384) D6.6 Final report
Version 1.0 Page 4 of 106
List of Acronyms and Abbreviations 2G 2nd Generation mobile wireless communication system (GSM, GPRS, EDGE) 3G 3rd Generation mobile wireless communication system (UMTS, HSPA) 3GPP 3rd Generation Partnership Project AAS Active Antenna Systems AP Access Point BSA Best Server Area CAL Calibration CAPEX Capital Expenditures CCO Coverage and Capacity Optimisation CDS Central Demo Server CIO Cell Individual Offset CM Configuration Management CRE Cell Range Expansion CSR Cell Saturation Ratio C&O Controllability and Observability DM Domain Manager DSA Dynamic Spectrum Allocation DSS Decision Support System DTW Dynamic Time Warping D2D Device-to-Device eNB Evolved Node B FDD Frequency Division Duplex FM Fault Management FTP File Transfer Protocol feICIC further / enhanced Inter-Cell Interference Coordination GPS Global Positioning System GSM Global System for Mobile communication HM High Mobility HO Handover Optimisation ICIC Inter-Cell Interference Coordination IEEE Institute of Electrical and Electronics Engineers IHZ Indoor Hot Zone IM Interference Management ISD Inter Site Distance KPI Key Performance Indicator LAA License Assisted Access LAN Local Area Network LTE Long Term Evolution MD Monitoring and Diagnostics MIMO Multiple Input Multiple Output MLB Mobility Load Balancing MNO Mobile Network Operator MDTW Modified Dynamic Time Warping MRVAH Modified Relative Velocity Aided Handoff MRO Mobility Robustness Optimisation M2M Machine-to-Machine NBC Naïve Bayesian Classifiers NE Node Elements
SEMAFOUR (316384) D6.6 Final report
Version 1.0 Page 5 of 106
NGMN Next Generation Mobile Networks NM Network Manager OAM Operation, Administration and Maintenance OHZ Outdoor Hot Zone ONE Operational Network Evolution OSM Open Street Maps OSS Operation and Support System PBSM Policy-Based SON Management PCI Physical Cell Identity PF Proportional Fair PM Performance Management PRB Physical Resource Block ProSe Proximity Services RVAH Relative Velocity Aided Handoff QoE Quality of Experience QoS Quality of Service RAN Radio Access Network RAT Radio Access Technology RSRP Reference signal Receive Power RSS Received Signal Strength RU Resource Utilization SCV SON Function Configuration Value SLA Service Level Agreement SINR Signal-to-interference-plus-noise ratio SNM Strategic Network Migration SOM SON Objective Manager SON Self-Organising Network SONCO SON Coordination SONLAB SON laboratory SUMO Simulation of Urban MObility TDD Time Division Duplex TS Traffic Steering UE User Equipment UMTS Universal Mobile Telecommunications System VS Vertical Sectorisation ViS Virtual Sectorisation V2X Vehicular-to-X WLAN Wireless Local Area Network WG Working Group WP Work Package XML Extensible Markup Language XML-RPC Extensible Markup Language Remote Procedure Call
SEMAFOUR (316384) D6.6 Final report
Version 1.0 Page 6 of 106
Table of Contents 1 Introduction .................................................................................................. 8
1.1 The SEMAFOUR Vision ........................................................................................................ 9 1.2 The SEMAFOUR Approach ................................................................................................ 10 1.3 Overview of the consortium .................................................................................................. 12 1.4 Organisation of the Document ............................................................................................. 13
2 Simulating the “real world” ...................................................................... 15 2.1 Introducing the Hannover Scenario .................................................................................... 15
2.1.1 Networks ....................................................................................................................... 16 2.1.1.1 Reference Scenario ................................................................................................ 16 2.1.1.2 Scenario Evolutions: multi-RAT and multi-layer networks ................................... 17 2.1.1.3 SEMAFOUR use case scenarios............................................................................ 18
2.1.2 Radio Environment ........................................................................................................ 20 2.1.3 Users .............................................................................................................................. 21
2.1.3.1 Traffic intensity maps ............................................................................................ 21 2.1.3.2 Advanced mobility models ..................................................................................... 22
2.2 Simulating the Hannover Scenario ..................................................................................... 24 2.2.1 SONLAB: A Common Simulation Infrastructure ......................................................... 24
2.2.1.1 SONLAB Dashboard ............................................................................................. 24 2.2.1.2 SONLAB Simulations............................................................................................. 25 2.2.1.3 Architecture ........................................................................................................... 28 2.2.1.4 Conclusion ............................................................................................................. 29
2.2.2 Calibration ..................................................................................................................... 29
3 Individual SON Functions ......................................................................... 31 3.1 Introduction .......................................................................................................................... 31 3.2 SON Design Principles ......................................................................................................... 33
3.2.1 Introduction ................................................................................................................... 33 3.2.2 Design Principles ........................................................................................................... 33 3.2.3 SON Design Evaluation Methodology and Results ...................................................... 35 3.2.4 Conclusions ................................................................................................................... 35
3.3 Dynamic Spectrum Allocation and Interference Management .......................................... 36 3.3.1 Introduction ................................................................................................................... 36 3.3.2 Key results ..................................................................................................................... 37 3.3.3 Conclusions ................................................................................................................... 39
3.4 Multi-Layer LTE / Wi-Fi Traffic Steering .......................................................................... 40 3.4.1 Introduction ................................................................................................................... 40 3.4.2 Key Results.................................................................................................................... 41 3.4.3 Conclusions ................................................................................................................... 45
3.5 Tackling the Problem of High Mobility Users .................................................................... 45 3.5.1 Introduction ................................................................................................................... 45 3.5.2 Key results ..................................................................................................................... 45 3.5.3 Conclusions ................................................................................................................... 50
3.6 Active / Reconfigurable Antenna Systems ........................................................................... 50 3.6.1 Introduction ................................................................................................................... 50 3.6.2 Key results ..................................................................................................................... 51 3.6.3 Conclusions ................................................................................................................... 55
3.7 Conclusion ............................................................................................................................ 55
4 Integrated SON Management ................................................................... 57 4.1 Introduction .......................................................................................................................... 57 4.2 Policy-Based SON Management .......................................................................................... 59
4.2.1 Introduction ................................................................................................................... 59
SEMAFOUR (316384) D6.6 Final report
Version 1.0 Page 7 of 106
4.2.2 Key results ..................................................................................................................... 60 4.2.3 Conclusions ................................................................................................................... 64
4.3 SON Coordination ................................................................................................................ 64 4.3.1 Introduction ................................................................................................................... 64 4.3.2 Key results ..................................................................................................................... 65 4.3.3 Conclusions ................................................................................................................... 67
4.4 Decision Support System ...................................................................................................... 67 4.4.1 Introduction ................................................................................................................... 67 4.4.2 Key results ..................................................................................................................... 68 4.4.3 Conclusions ................................................................................................................... 71
4.5 Monitoring and Diagnostic .................................................................................................. 71 4.5.1 Introduction ................................................................................................................... 71 4.5.2 Key results ..................................................................................................................... 72
4.6 Conclusions .......................................................................................................................... 75
5 Demonstrator .............................................................................................. 77 5.1 Introduction .......................................................................................................................... 77 5.2 Overview of the SEMAFOUR demonstration platform ...................................................... 77
5.2.1 Central Demo Server ..................................................................................................... 78 5.2.2 Time Client .................................................................................................................... 78 5.2.3 Operator Client .............................................................................................................. 79 5.2.4 DSS Client ..................................................................................................................... 80 5.2.5 KPI Client ...................................................................................................................... 81 5.2.6 Network Client .............................................................................................................. 82 5.2.7 Cell View Client ............................................................................................................ 83 5.2.8 Proxy Client/Server/Session Terminal Client ............................................................... 84
5.3 Overview of the SEMAFOUR demonstration scenarios ..................................................... 84 5.3.1 Dynamic Spectrum Allocation and Interference Management ..................................... 84 5.3.2 Multi-layer LTE / Wi-Fi Traffic Steering...................................................................... 85 5.3.3 Tackling the Problem of High Mobility Users .............................................................. 86 5.3.4 Active / Reconfigurable Antenna Systems .................................................................... 86 5.3.5 Policy-Based SON Management & SON Coordination ................................................ 87 5.3.6 Decision Support System for Operational Network Evolution ..................................... 88
5.4 Concluding remarks ............................................................................................................. 89
6 SON beyond SEMAFOUR ........................................................................ 90 6.1 Device-to-device communication ......................................................................................... 90
6.1.1 Background ................................................................................................................... 90 6.1.2 Approach for SON in Future Networks ......................................................................... 91
6.2 Nomadic Networks................................................................................................................ 92 6.2.1 Background ................................................................................................................... 92 6.2.2 Approach for SON in Future Networks ......................................................................... 93
6.3 Licence Assisted Access-LTE Channel Selection ................................................................ 94 6.3.1 Background ................................................................................................................... 94 6.3.2 Approach for SON in Future Networks ......................................................................... 95
6.4 Virtual Cell Sectorisation ..................................................................................................... 96 6.4.1 Background ................................................................................................................... 96 6.4.2 Approach for SON in Future Networks ......................................................................... 97
6.5 Cognitive SON Management ............................................................................................... 98 6.5.1 Background ................................................................................................................... 98 6.5.2 Approach for SON in Future Networks ......................................................................... 99
6.6 Concluding remarks ........................................................................................................... 100
7 Conclusions ............................................................................................... 101
8 References ................................................................................................. 102
SEMAFOUR (316384) D6.6 Final report
Version 1.0 Page 8 of 106
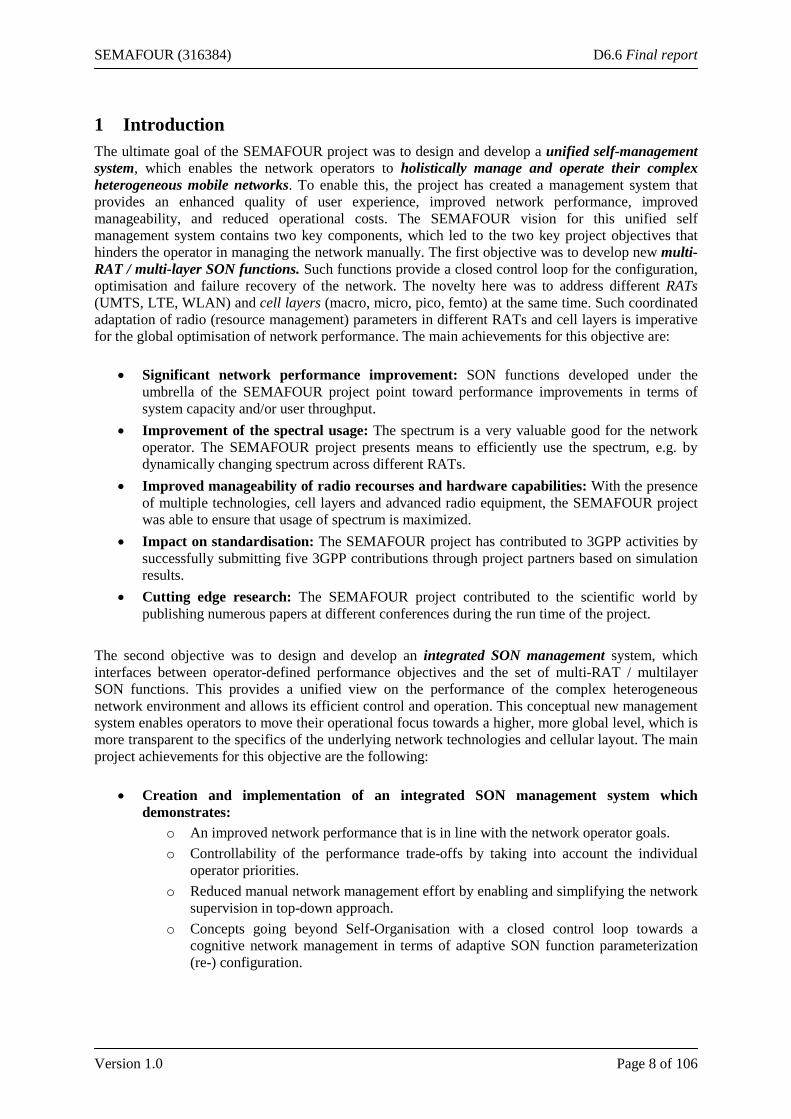
1 Introduction The ultimate goal of the SEMAFOUR project was to design and develop a unified self-management system, which enables the network operators to holistically manage and operate their complex heterogeneous mobile networks. To enable this, the project has created a management system that provides an enhanced quality of user experience, improved network performance, improved manageability, and reduced operational costs. The SEMAFOUR vision for this unified self management system contains two key components, which led to the two key project objectives that hinders the operator in managing the network manually. The first objective was to develop new multi-RAT / multi-layer SON functions. Such functions provide a closed control loop for the configuration, optimisation and failure recovery of the network. The novelty here was to address different RATs (UMTS, LTE, WLAN) and cell layers (macro, micro, pico, femto) at the same time. Such coordinated adaptation of radio (resource management) parameters in different RATs and cell layers is imperative for the global optimisation of network performance. The main achievements for this objective are:
• Significant network performance improvement: SON functions developed under the umbrella of the SEMAFOUR project point toward performance improvements in terms of system capacity and/or user throughput.
• Improvement of the spectral usage: The spectrum is a very valuable good for the network operator. The SEMAFOUR project presents means to efficiently use the spectrum, e.g. by dynamically changing spectrum across different RATs.
• Improved manageability of radio recourses and hardware capabilities: With the presence of multiple technologies, cell layers and advanced radio equipment, the SEMAFOUR project was able to ensure that usage of spectrum is maximized.
• Impact on standardisation: The SEMAFOUR project has contributed to 3GPP activities by successfully submitting five 3GPP contributions through project partners based on simulation results.
• Cutting edge research: The SEMAFOUR project contributed to the scientific world by publishing numerous papers at different conferences during the run time of the project.
The second objective was to design and develop an integrated SON management system, which interfaces between operator-defined performance objectives and the set of multi-RAT / multilayer SON functions. This provides a unified view on the performance of the complex heterogeneous network environment and allows its efficient control and operation. This conceptual new management system enables operators to move their operational focus towards a higher, more global level, which is more transparent to the specifics of the underlying network technologies and cellular layout. The main project achievements for this objective are the following:
• Creation and implementation of an integrated SON management system which demonstrates:
o An improved network performance that is in line with the network operator goals. o Controllability of the performance trade-offs by taking into account the individual
operator priorities. o Reduced manual network management effort by enabling and simplifying the network
supervision in top-down approach. o Concepts going beyond Self-Organisation with a closed control loop towards a
cognitive network management in terms of adaptive SON function parameterization (re-) configuration.
SEMAFOUR (316384) D6.6 Final report
Version 1.0 Page 9 of 106
• Improved network upgrade planning possibilities: Using large time scale network performance predictions and applying various mathematical tools to help the network operator to take decisions.
• Cutting edge research: The coordination of different SON function instances, precise insights in the behaviour of SON functions in different network environments or new concepts like the SON Objective Manager (SOM) are to mention here.
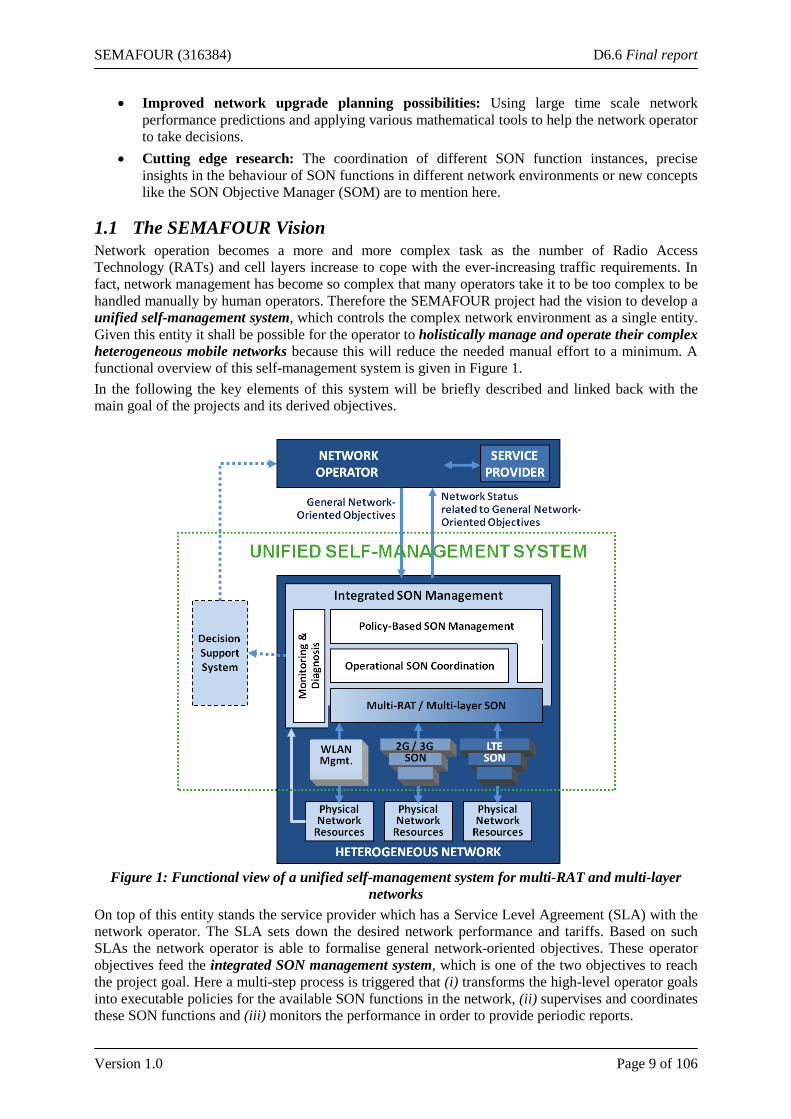
1.1 The SEMAFOUR Vision Network operation becomes a more and more complex task as the number of Radio Access Technology (RATs) and cell layers increase to cope with the ever-increasing traffic requirements. In fact, network management has become so complex that many operators take it to be too complex to be handled manually by human operators. Therefore the SEMAFOUR project had the vision to develop a unified self-management system, which controls the complex network environment as a single entity. Given this entity it shall be possible for the operator to holistically manage and operate their complex heterogeneous mobile networks because this will reduce the needed manual effort to a minimum. A functional overview of this self-management system is given in Figure 1. In the following the key elements of this system will be briefly described and linked back with the main goal of the projects and its derived objectives.
Figure 1: Functional view of a unified self-management system for multi-RAT and multi-layer
networks On top of this entity stands the service provider which has a Service Level Agreement (SLA) with the network operator. The SLA sets down the desired network performance and tariffs. Based on such SLAs the network operator is able to formalise general network-oriented objectives. These operator objectives feed the integrated SON management system, which is one of the two objectives to reach the project goal. Here a multi-step process is triggered that (i) transforms the high-level operator goals into executable policies for the available SON functions in the network, (ii) supervises and coordinates these SON functions and (iii) monitors the performance in order to provide periodic reports.
SEMAFOUR (316384) D6.6 Final report
Version 1.0 Page 10 of 106
In addition to this SON management layer, new SON functions are needed, which reside below this management layer, which is the other of the two objectives. These new SON functions are supposed to operate in a multi-RAT and/or multi-layer network environment. This is unlike numerous SON functions, which have been deployed already and which primarily focus on the configuration / optimisation of parameters in a single-RAT and/or single layer scenarios. These two key components, the SON management system which use the (new) SON functions, have the purpose to effectively use the available network recourses resources in a way that they are in line with the network operator objectives. The described unified self-management system has to deal with the current network topology and data traffic requirements, however, due to ever increasing traffic demands, the available resources, even though they are already optimised with the help of SON, might not be capable of handling the growing traffic in the near future. To solve this problem the operator has to timely trigger network upgrades in terms of deploying new sites or to substitute legacy technology (2G) with new RATs (3G, 4G, ...) that can handle the higher traffic demands efficiently. These tasks are usually very complicated. For that a third component namely a Decision Support System (DSS) is necessary that helps the operator in tacking the right decisions. This feature is seen as an add-on the self-management system to address long-term operational task that needs to be considered by the network operator constantly. These three key components, the integrated SON management system, new multi-RAT and/or multi-layer SON functions and the Decision Support System, are the envisioned unified self-management system that will be further elaborated in the course of this final Derivable of the SEMAFOUR project (see Section 1.4).
1.2 The SEMAFOUR Approach To address one of the key objectives of the SEMAFOUR project, namely the development of new concepts, methods and algorithms for a selected set of Self-Organising Network (SON) functions targeting multi-RAT and multi-layer environments, four use cases have been selected that address the mentioned goals:
• Dynamic Spectrum Allocation and Interference Management: The purpose here is to mitigate interference and to optimise the coverage, capacity and the quality of service in the network by autonomously assigning spectrum to base stations based on temporal and spatial usage and/or estimated load of spectrum.
• Multi-Layer LTE / Wi-Fi Traffic Steering: The focuses here is on the integration of multi-layer LTE networks with Wi-Fi access points. The goal is to identify requirements and technical challenges for Wi-Fi-cellular integration as well as to propose network-controlled and UE-assisted QoS based Wi-Fi traffic steering solution(s).
• Tackling the Problem of High Mobility Users: This use case focuses on steering UEs to the most suitable cell when high mobility poses a noticeable impact on the UE (reduced QoS) and network performance (signalling overhead in the core network due to high handover signalling). Also, highly mobile user terminals are unlikely to benefit from services provided by small cells before moving on to the next cell.
• Active / Reconfigurable Antenna Systems: In this use case the capabilities and potential for performance/capacity enhancement of Active Antenna Systems (AAS) are investigated, concentrating on the application of Vertical Sectorisation (VS).
In addition the use cases, SON design principles have been considered. The reason for that was that with an increasing number of SON functions being deployed in cellular radio networks, conflicts between the actions proposed by independently designed SON functions may arise. An approach to avoid conflicts at runtime is to try and prevent potential conflicts already in the design phase of a SON function.
SEMAFOUR (316384) D6.6 Final report
Version 1.0 Page 11 of 106
The second key objective aims at designing a unified self-management system, which enables network operators to manage and operate their heterogeneous network comprising multiple RATs and multiple layers. For this four areas have been identified: • Policy-Based SON Management: This use case is about the transformation of operator-defined
and network context dependent technical objectives into operational rules and policies for SON functions such that the technical objectives are met
• SON Coordination: The goal is to develop mechanisms that deal with real-time detection, analysis, and resolution of conflicts occurring between operational SON function instances.
• Decision Support System: Here the goal is to identify potential future shortcomings of the network performance and provides to provide recommendations to the operators to modify and enhance the network accordingly.
• Monitoring and Diagnostic: This function was introduced, which to take advantage of the effects of uniting the statistical processing and providing network intelligence functionalities to the three functional areas of the integrated SON management system, thus serving as an infrastructure component.
In addition use cases that go beyond the scope of SEMAFOUR in terms of future networking scenarios, including further advancements of LTE, 5G systems and future deployment scenarios have been specified and investigated, namely:
• Device-to-device communication: The study on Device-to-Device D2D communication reveals that SON functions could play an important role in the autonomous management of D2D communications while following a central management approach.
• Nomadic Networks: This study concentrates on problems that occur when nomadic nodes and users move out of each other’s vicinity. The focus is on a SON function for a bus scenario where a nomadic node is mounted on a bus to provide better coverage to users on the bus.
• Licence Assisted Access-LTE Channel Selection: This use case is investigated in order to utilize the gains of the unlicensed spectrum without the risk of losing crucial information, a technology for using unlicensed spectrum for LTE capacity enhancement while still using the licensed spectrum for any control signalling.
• Virtual Cell Sectorisation: For this study a controllability analysis is presented considering for different configurations (in terms of azimuth, downtilt and the bandwidth split between the macro-cell and the virtual cell) to which degree the created virtual cell covers and effectively serves a given traffic hot zone.
• Cognitive SON Management: This study elaborates on the potential of learning mechanisms in the context of Policy-Based SON Management and Cognitive Radio.
To cover the described use cases the SEMAFOUR project comprises three main phases, namely:
(i) Requirements phase: All use cases, except the use cases beyond the SEMAFOUR scope, have been selected in the use case requirement phase in the beginning of the project. For that 3GPP use cases, NGMN recommendations and the input from the established Advisory Board had been taken into account to identify the specific areas that should be covered within the project scope. In addition the main modelling assumptions and reference scenarios have been defined
(ii) Development phase: In this phase the development and validation of solutions for the self-management function designed in the respective use cases specified in the Requirements phase. This has been done by using advanced mobile network simulation tools that use realistic network scenarios, including e.g. realistic network topology and user mobility models, as well as inhomogeneous traffic distributions.
SEMAFOUR (316384) D6.6 Final report
Version 1.0 Page 12 of 106
(iii) Demonstration phase: The developed solutions in the different use cases have been accompanied by the development of the SEMAFOUR demonstrator and activities regarding exploitation and dissemination.
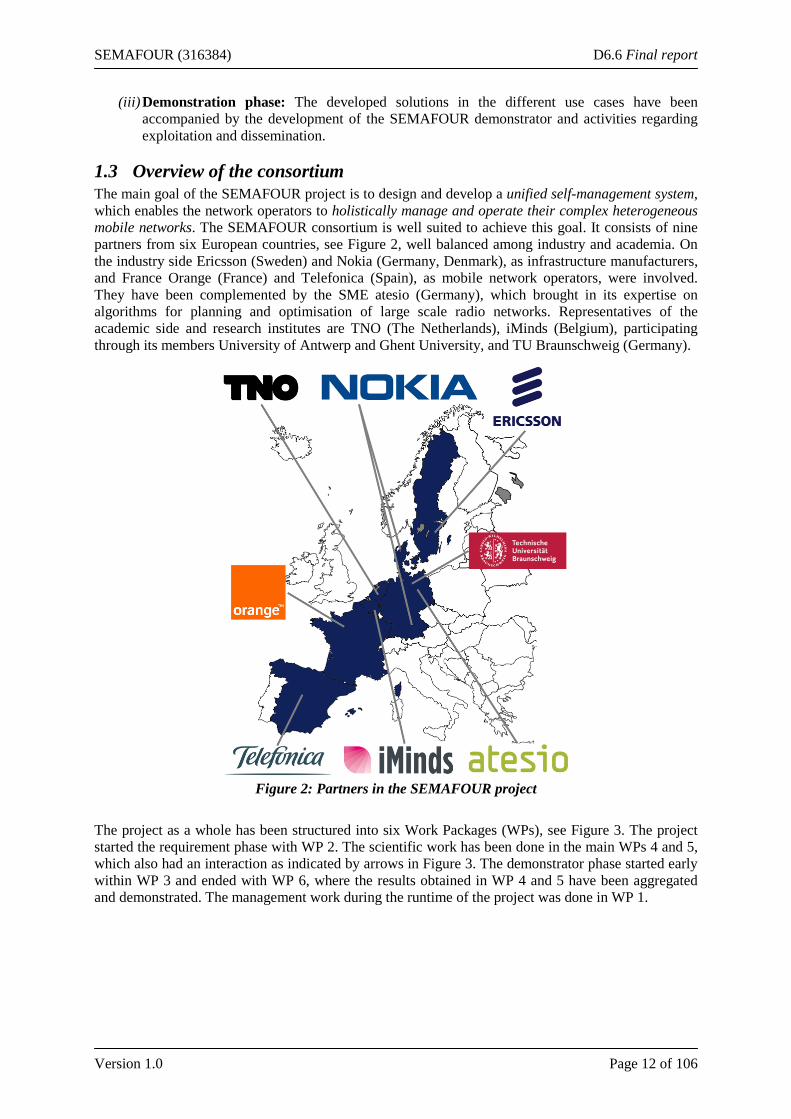
1.3 Overview of the consortium The main goal of the SEMAFOUR project is to design and develop a unified self-management system, which enables the network operators to holistically manage and operate their complex heterogeneous mobile networks. The SEMAFOUR consortium is well suited to achieve this goal. It consists of nine partners from six European countries, see Figure 2, well balanced among industry and academia. On the industry side Ericsson (Sweden) and Nokia (Germany, Denmark), as infrastructure manufacturers, and France Orange (France) and Telefonica (Spain), as mobile network operators, were involved. They have been complemented by the SME atesio (Germany), which brought in its expertise on algorithms for planning and optimisation of large scale radio networks. Representatives of the academic side and research institutes are TNO (The Netherlands), iMinds (Belgium), participating through its members University of Antwerp and Ghent University, and TU Braunschweig (Germany).
Figure 2: Partners in the SEMAFOUR project
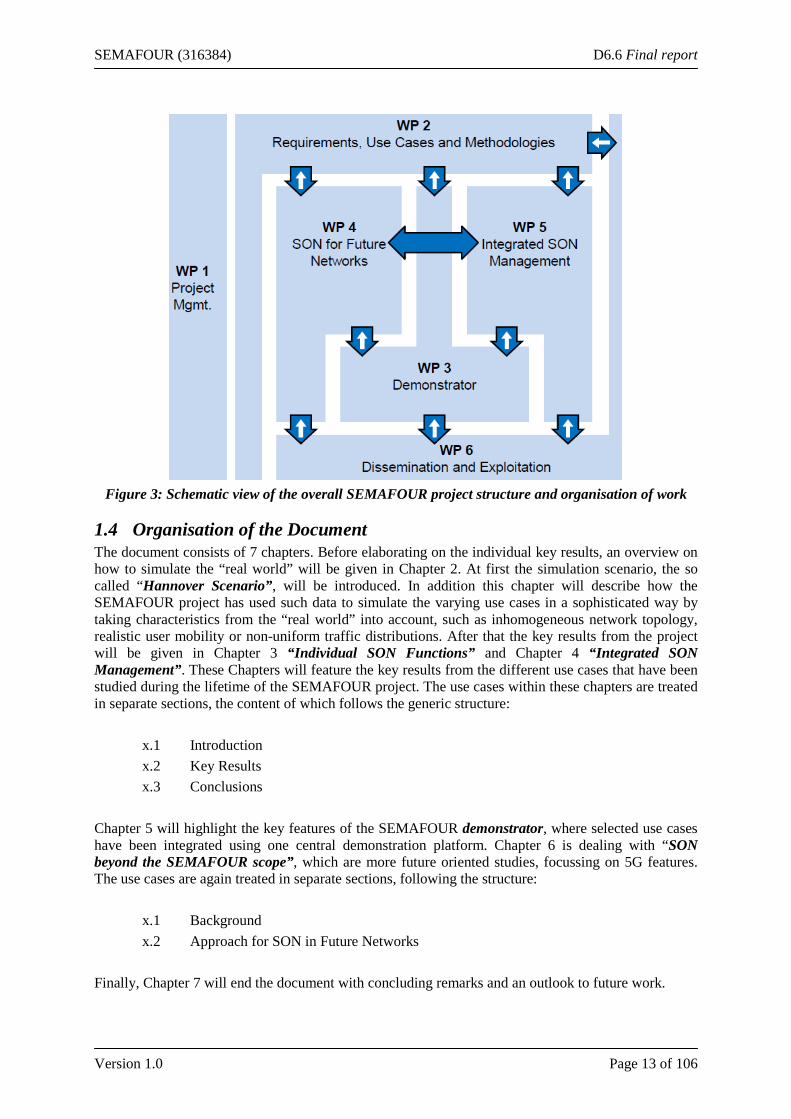
The project as a whole has been structured into six Work Packages (WPs), see Figure 3. The project started the requirement phase with WP 2. The scientific work has been done in the main WPs 4 and 5, which also had an interaction as indicated by arrows in Figure 3. The demonstrator phase started early within WP 3 and ended with WP 6, where the results obtained in WP 4 and 5 have been aggregated and demonstrated. The management work during the runtime of the project was done in WP 1.
SEMAFOUR (316384) D6.6 Final report
Version 1.0 Page 13 of 106
Figure 3: Schematic view of the overall SEMAFOUR project structure and organisation of work
1.4 Organisation of the Document The document consists of 7 chapters. Before elaborating on the individual key results, an overview on how to simulate the “real world” will be given in Chapter 2. At first the simulation scenario, the so called “Hannover Scenario”, will be introduced. In addition this chapter will describe how the SEMAFOUR project has used such data to simulate the varying use cases in a sophisticated way by taking characteristics from the “real world” into account, such as inhomogeneous network topology, realistic user mobility or non-uniform traffic distributions. After that the key results from the project will be given in Chapter 3 “Individual SON Functions” and Chapter 4 “Integrated SON Management”. These Chapters will feature the key results from the different use cases that have been studied during the lifetime of the SEMAFOUR project. The use cases within these chapters are treated in separate sections, the content of which follows the generic structure:
x.1 Introduction x.2 Key Results x.3 Conclusions
Chapter 5 will highlight the key features of the SEMAFOUR demonstrator, where selected use cases have been integrated using one central demonstration platform. Chapter 6 is dealing with “SON beyond the SEMAFOUR scope”, which are more future oriented studies, focussing on 5G features. The use cases are again treated in separate sections, following the structure:
x.1 Background x.2 Approach for SON in Future Networks
Finally, Chapter 7 will end the document with concluding remarks and an outlook to future work.
SEMAFOUR (316384) D6.6 Final report
Version 1.0 Page 14 of 106
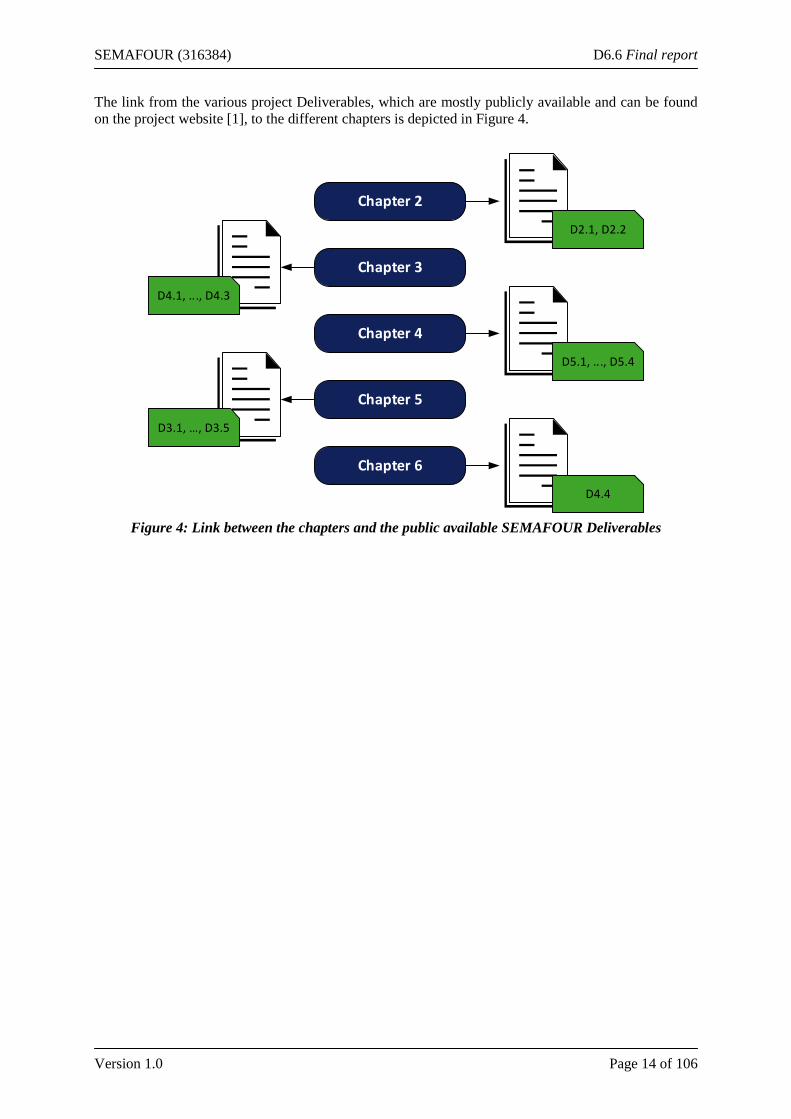
The link from the various project Deliverables, which are mostly publicly available and can be found on the project website [1], to the different chapters is depicted in Figure 4.
Chapter 2
Chapter 4
Chapter 5
Chapter 6
Chapter 3
D2.1, D2.2
D5.1, ..., D5.4
D4.4
D3.1, …, D3.5
D4.1, ..., D4.3
Figure 4: Link between the chapters and the public available SEMAFOUR Deliverables
SEMAFOUR (316384) D6.6 Final report
Version 1.0 Page 15 of 106
2 Simulating the “real world” The main goal of the SEMAFOUR project is to design and develop a unified self-management system, which enables the network operators to holistically manage and operate their complex heterogeneous mobile networks. In order to allow for realistic simulations of the behaviour of these SON functions and their coordinated optimization, the “complex heterogeneous mobile networks” need to be modelled in an accurate and realistic manner. Generally, the simulation environments proposed by 3GPP rely on regular geometries and uniform user distributions, but they cannot represent the fine shades of real or realistic, complex, heterogeneous environments [2] and [3]. Besides that, choosing realistic scenarios that are very close to the reality of an operator network to evaluate the developed SON (management) solutions comes with a greater amount of trust when it comes to interpreting the simulation results. Thus, one of the key challenges for the development of the scenarios is the realistic modelling of the simulated environment. For this purpose, a complete Multi-RAT network has been modelled for the entire city area of Hannover. Realistic pathloss predictions have been computed using 3D building data. Based on this accurate propagation modelling, a radio network planning has been performed which led to a network configuration (antenna parameters and pilot powers) close to a real operator network. In addition, sophisticated modelling approaches for macroscopic traffic and individual user mobility have been employed, in order to get a realistic baseline for the simulation of subscribers in the network. Furthermore, provisioning a common scenario ensures the comparability of simulation results, which are based on this scenario. The individual simulation tools used within the project partners’ organisations were calibrated using a dedicated calibration data set. A common simulation infrastructure SON laboratory (SONLAB) developed by atesio is used within the project for simplified data access and collaboration between multiple SON functions. This section gives an overview of the Hannover scenario and shows the different components that make this scenario very close to a real realistic network. A more detailed description of the simulation activity can be found in Deliverable D2.5 [4].
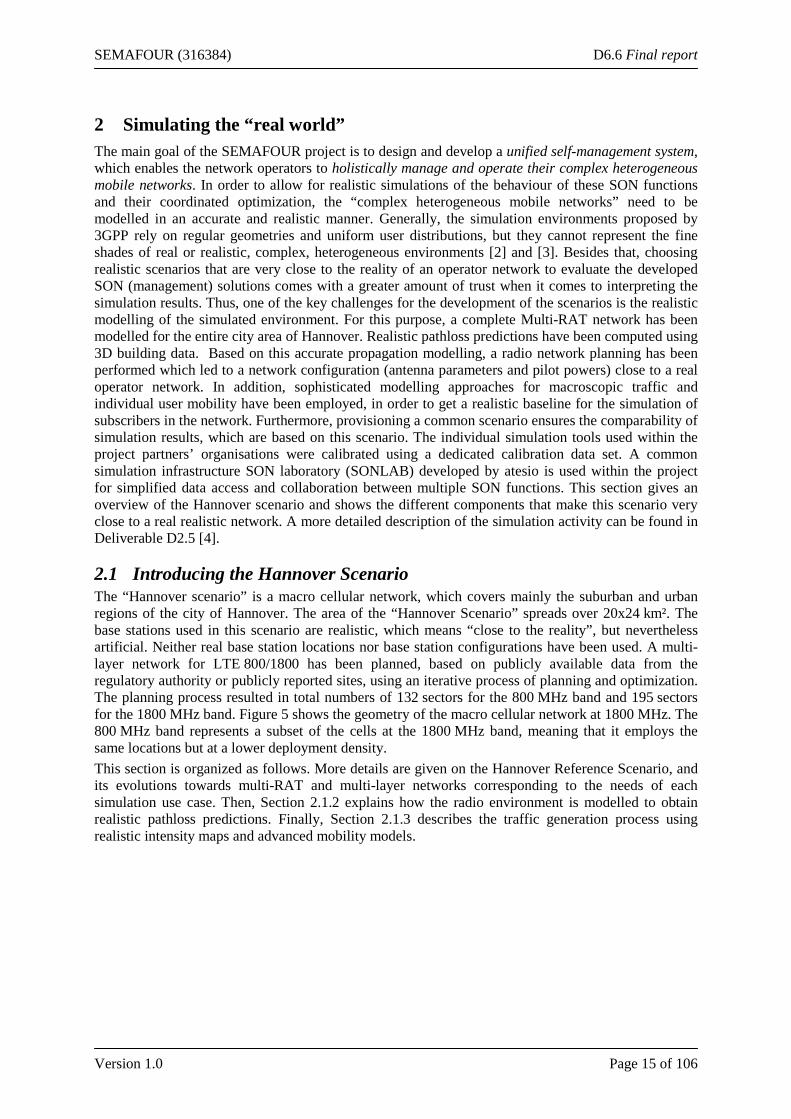
2.1 Introducing the Hannover Scenario The “Hannover scenario” is a macro cellular network, which covers mainly the suburban and urban regions of the city of Hannover. The area of the “Hannover Scenario” spreads over 20x24 km². The base stations used in this scenario are realistic, which means “close to the reality”, but nevertheless artificial. Neither real base station locations nor base station configurations have been used. A multi-layer network for LTE 800/1800 has been planned, based on publicly available data from the regulatory authority or publicly reported sites, using an iterative process of planning and optimization. The planning process resulted in total numbers of 132 sectors for the 800 MHz band and 195 sectors for the 1800 MHz band. Figure 5 shows the geometry of the macro cellular network at 1800 MHz. The 800 MHz band represents a subset of the cells at the 1800 MHz band, meaning that it employs the same locations but at a lower deployment density. This section is organized as follows. More details are given on the Hannover Reference Scenario, and its evolutions towards multi-RAT and multi-layer networks corresponding to the needs of each simulation use case. Then, Section 2.1.2 explains how the radio environment is modelled to obtain realistic pathloss predictions. Finally, Section 2.1.3 describes the traffic generation process using realistic intensity maps and advanced mobility models.
SEMAFOUR (316384) D6.6 Final report
Version 1.0 Page 16 of 106
Figure 5: Network geometry for LTE 1800
2.1.1 Networks
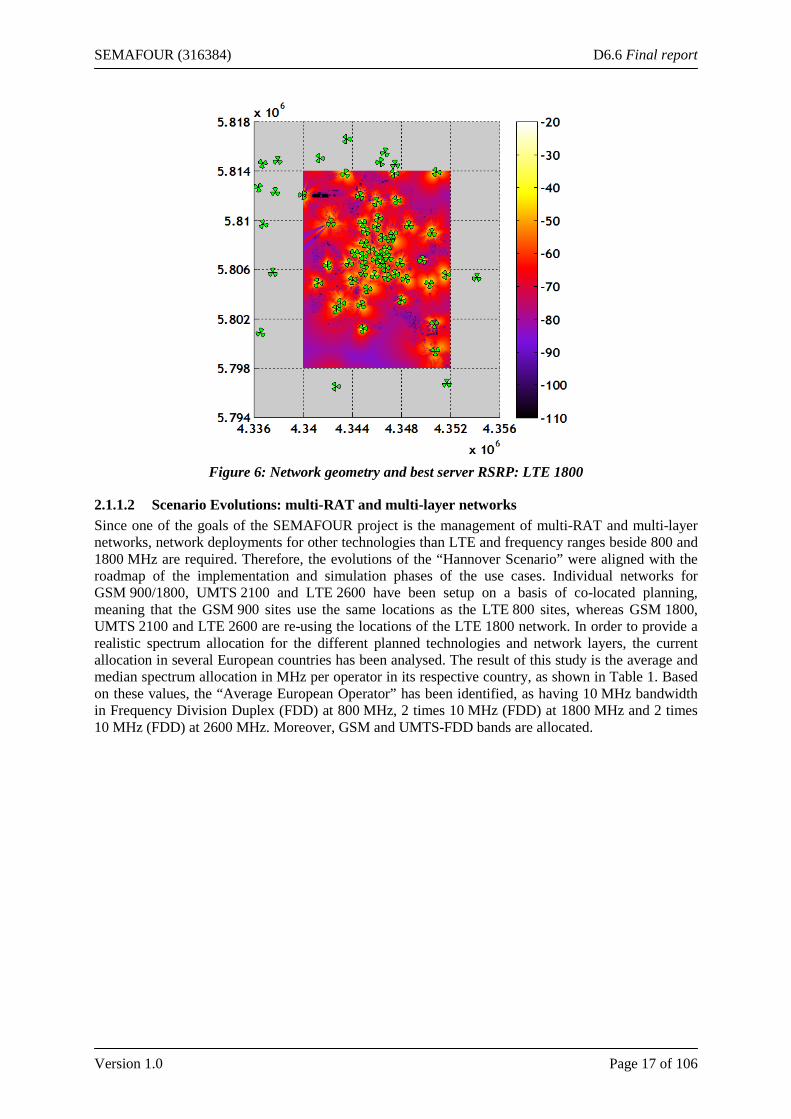
2.1.1.1 Reference Scenario The “General SEMAFOUR Hannover simulation scenario” also referred to as the “Reference scenario” or simply “LTE 1800” contains one macro cellular LTE network with one frequency layer at 1800 MHz. This basic deployment is part of all use cases scenarios, either as the only frequency layer or as a common baseline with some additional layers on top, in order to increase the coverage and/or capacity. In order to minimise border effects in actual simulations, 4 km in each direction are not considered for simulation purposes, thus only 12x16 km² will be used for the collection of user and/or cell statistics. Besides, all pathloss predictions for this scenario are for a height of 1.5 m above ground. The network geometry along with the best server Reference signal Receive Power (RSRP) for LTE 1800 is shown in Figure 6.
SEMAFOUR (316384) D6.6 Final report
Version 1.0 Page 17 of 106
Figure 6: Network geometry and best server RSRP: LTE 1800
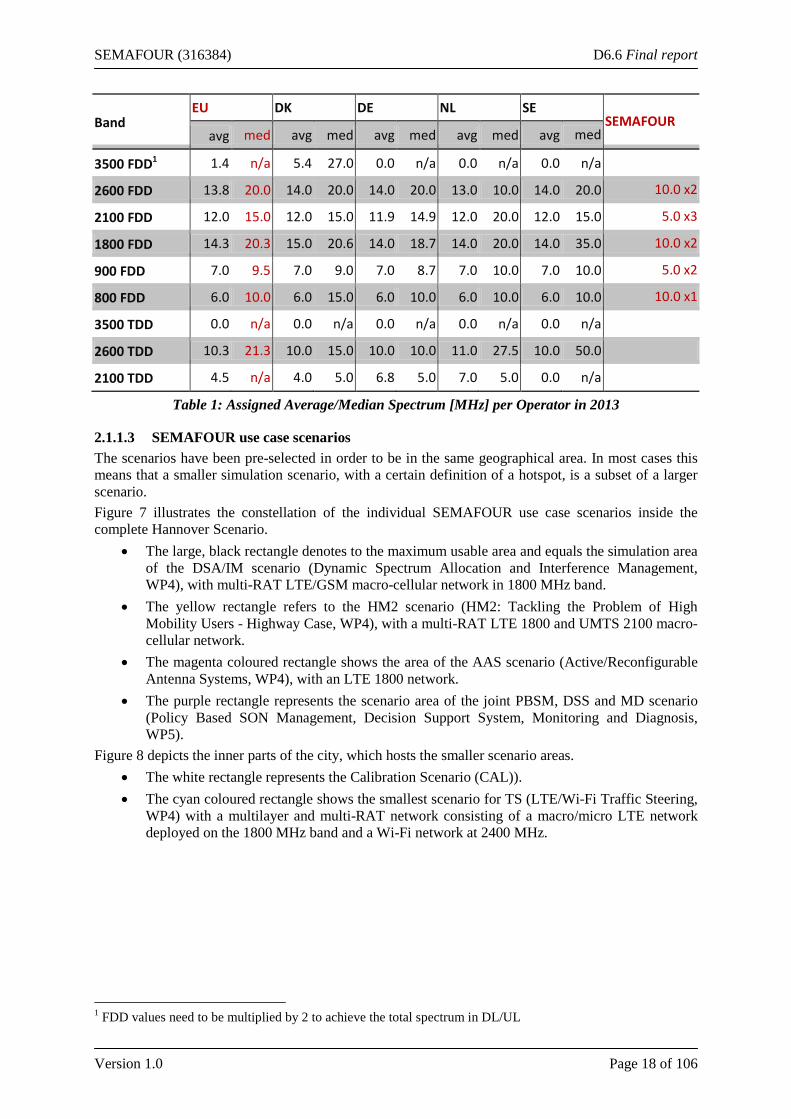
2.1.1.2 Scenario Evolutions: multi-RAT and multi-layer networks Since one of the goals of the SEMAFOUR project is the management of multi-RAT and multi-layer networks, network deployments for other technologies than LTE and frequency ranges beside 800 and 1800 MHz are required. Therefore, the evolutions of the “Hannover Scenario” were aligned with the roadmap of the implementation and simulation phases of the use cases. Individual networks for GSM 900/1800, UMTS 2100 and LTE 2600 have been setup on a basis of co-located planning, meaning that the GSM 900 sites use the same locations as the LTE 800 sites, whereas GSM 1800, UMTS 2100 and LTE 2600 are re-using the locations of the LTE 1800 network. In order to provide a realistic spectrum allocation for the different planned technologies and network layers, the current allocation in several European countries has been analysed. The result of this study is the average and median spectrum allocation in MHz per operator in its respective country, as shown in Table 1. Based on these values, the “Average European Operator” has been identified, as having 10 MHz bandwidth in Frequency Division Duplex (FDD) at 800 MHz, 2 times 10 MHz (FDD) at 1800 MHz and 2 times 10 MHz (FDD) at 2600 MHz. Moreover, GSM and UMTS-FDD bands are allocated.
SEMAFOUR (316384) D6.6 Final report
Version 1.0 Page 18 of 106
Band EU DK DE NL SE
SEMAFOUR avg med avg med avg med avg med avg med
3500 FDD1 1.4 n/a 5.4 27.0 0.0 n/a 0.0 n/a 0.0 n/a
2600 FDD 13.8 20.0 14.0 20.0 14.0 20.0 13.0 10.0 14.0 20.0 10.0 x2
2100 FDD 12.0 15.0 12.0 15.0 11.9 14.9 12.0 20.0 12.0 15.0 5.0 x3
1800 FDD 14.3 20.3 15.0 20.6 14.0 18.7 14.0 20.0 14.0 35.0 10.0 x2
900 FDD 7.0 9.5 7.0 9.0 7.0 8.7 7.0 10.0 7.0 10.0 5.0 x2
800 FDD 6.0 10.0 6.0 15.0 6.0 10.0 6.0 10.0 6.0 10.0 10.0 x1
3500 TDD 0.0 n/a 0.0 n/a 0.0 n/a 0.0 n/a 0.0 n/a
2600 TDD 10.3 21.3 10.0 15.0 10.0 10.0 11.0 27.5 10.0 50.0
2100 TDD 4.5 n/a 4.0 5.0 6.8 5.0 7.0 5.0 0.0 n/a
Table 1: Assigned Average/Median Spectrum [MHz] per Operator in 2013
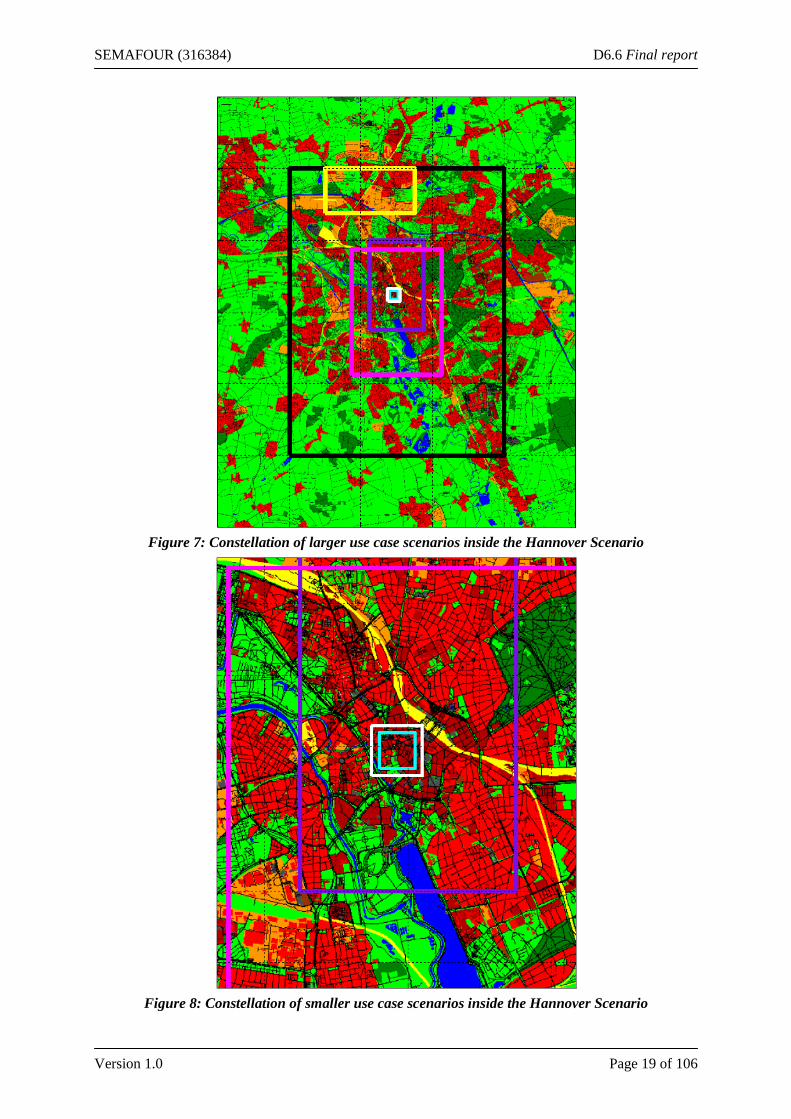
2.1.1.3 SEMAFOUR use case scenarios The scenarios have been pre-selected in order to be in the same geographical area. In most cases this means that a smaller simulation scenario, with a certain definition of a hotspot, is a subset of a larger scenario. Figure 7 illustrates the constellation of the individual SEMAFOUR use case scenarios inside the complete Hannover Scenario.
• The large, black rectangle denotes to the maximum usable area and equals the simulation area of the DSA/IM scenario (Dynamic Spectrum Allocation and Interference Management, WP4), with multi-RAT LTE/GSM macro-cellular network in 1800 MHz band.
• The yellow rectangle refers to the HM2 scenario (HM2: Tackling the Problem of High Mobility Users - Highway Case, WP4), with a multi-RAT LTE 1800 and UMTS 2100 macro-cellular network.
• The magenta coloured rectangle shows the area of the AAS scenario (Active/Reconfigurable Antenna Systems, WP4), with an LTE 1800 network.
• The purple rectangle represents the scenario area of the joint PBSM, DSS and MD scenario (Policy Based SON Management, Decision Support System, Monitoring and Diagnosis, WP5).
Figure 8 depicts the inner parts of the city, which hosts the smaller scenario areas. • The white rectangle represents the Calibration Scenario (CAL)). • The cyan coloured rectangle shows the smallest scenario for TS (LTE/Wi-Fi Traffic Steering,
WP4) with a multilayer and multi-RAT network consisting of a macro/micro LTE network deployed on the 1800 MHz band and a Wi-Fi network at 2400 MHz.
1 FDD values need to be multiplied by 2 to achieve the total spectrum in DL/UL
SEMAFOUR (316384) D6.6 Final report
Version 1.0 Page 19 of 106
Figure 7: Constellation of larger use case scenarios inside the Hannover Scenario
Figure 8: Constellation of smaller use case scenarios inside the Hannover Scenario
SEMAFOUR (316384) D6.6 Final report
Version 1.0 Page 20 of 106
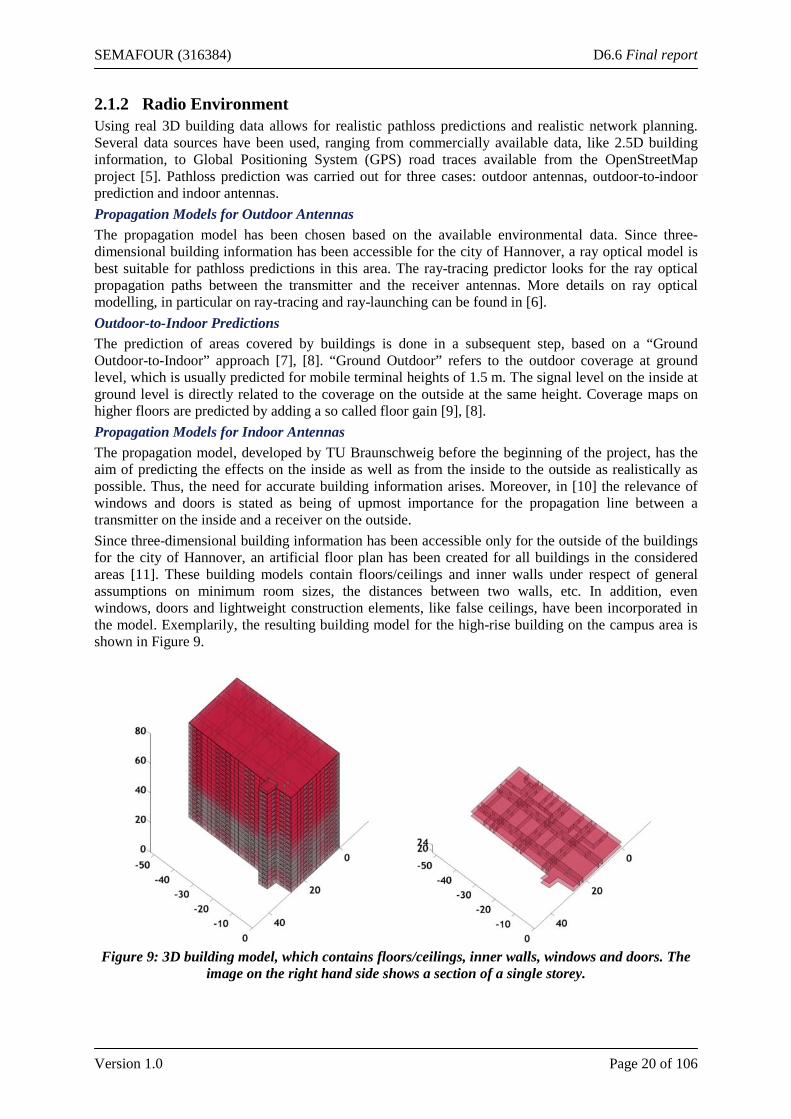
2.1.2 Radio Environment Using real 3D building data allows for realistic pathloss predictions and realistic network planning. Several data sources have been used, ranging from commercially available data, like 2.5D building information, to Global Positioning System (GPS) road traces available from the OpenStreetMap project [5]. Pathloss prediction was carried out for three cases: outdoor antennas, outdoor-to-indoor prediction and indoor antennas. Propagation Models for Outdoor Antennas The propagation model has been chosen based on the available environmental data. Since three-dimensional building information has been accessible for the city of Hannover, a ray optical model is best suitable for pathloss predictions in this area. The ray-tracing predictor looks for the ray optical propagation paths between the transmitter and the receiver antennas. More details on ray optical modelling, in particular on ray-tracing and ray-launching can be found in [6]. Outdoor-to-Indoor Predictions The prediction of areas covered by buildings is done in a subsequent step, based on a “Ground Outdoor-to-Indoor” approach [7], [8]. “Ground Outdoor” refers to the outdoor coverage at ground level, which is usually predicted for mobile terminal heights of 1.5 m. The signal level on the inside at ground level is directly related to the coverage on the outside at the same height. Coverage maps on higher floors are predicted by adding a so called floor gain [9], [8]. Propagation Models for Indoor Antennas The propagation model, developed by TU Braunschweig before the beginning of the project, has the aim of predicting the effects on the inside as well as from the inside to the outside as realistically as possible. Thus, the need for accurate building information arises. Moreover, in [10] the relevance of windows and doors is stated as being of upmost importance for the propagation line between a transmitter on the inside and a receiver on the outside. Since three-dimensional building information has been accessible only for the outside of the buildings for the city of Hannover, an artificial floor plan has been created for all buildings in the considered areas [11]. These building models contain floors/ceilings and inner walls under respect of general assumptions on minimum room sizes, the distances between two walls, etc. In addition, even windows, doors and lightweight construction elements, like false ceilings, have been incorporated in the model. Exemplarily, the resulting building model for the high-rise building on the campus area is shown in Figure 9.
Figure 9: 3D building model, which contains floors/ceilings, inner walls, windows and doors. The
image on the right hand side shows a section of a single storey.
SEMAFOUR (316384) D6.6 Final report
Version 1.0 Page 21 of 106
2.1.3 Users Two kinds of traffic and mobility are considered: First, the macroscopic traffic in forms of time-varying spatial traffic intensity maps. And second, microscopic traffic in the form of user traces are provided for several areas in the Hannover Scenario.
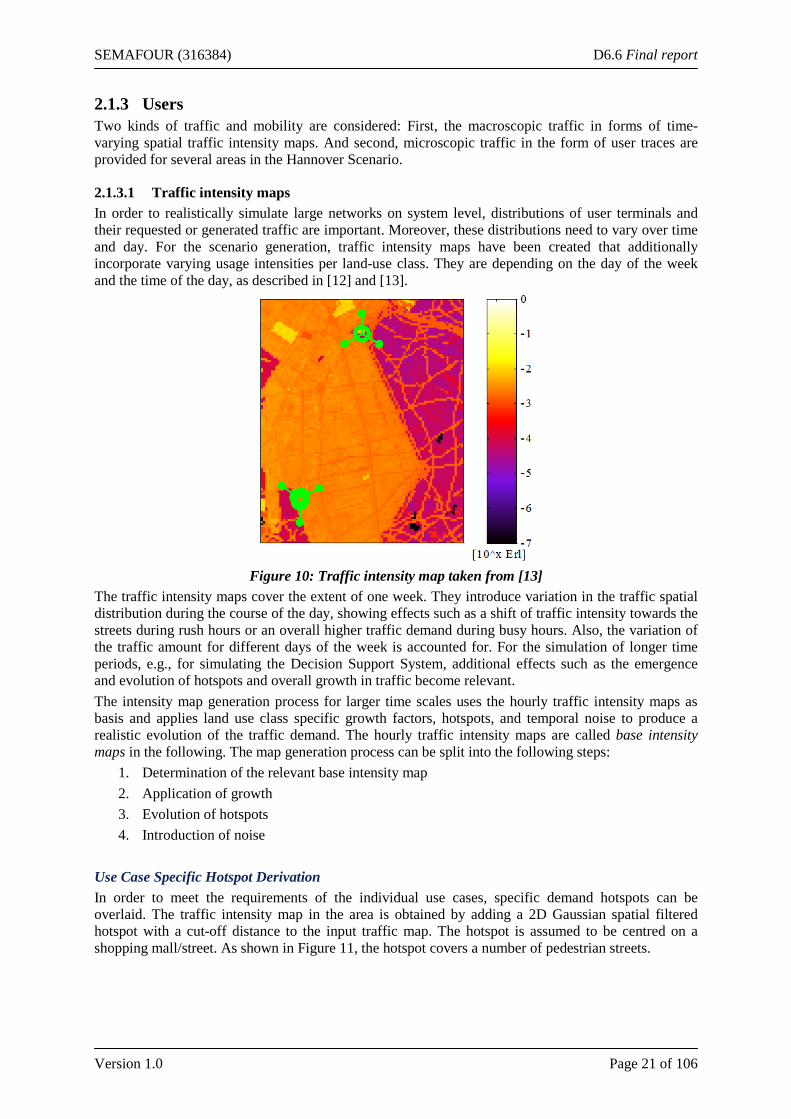
2.1.3.1 Traffic intensity maps In order to realistically simulate large networks on system level, distributions of user terminals and their requested or generated traffic are important. Moreover, these distributions need to vary over time and day. For the scenario generation, traffic intensity maps have been created that additionally incorporate varying usage intensities per land-use class. They are depending on the day of the week and the time of the day, as described in [12] and [13].
Figure 10: Traffic intensity map taken from [13]
The traffic intensity maps cover the extent of one week. They introduce variation in the traffic spatial distribution during the course of the day, showing effects such as a shift of traffic intensity towards the streets during rush hours or an overall higher traffic demand during busy hours. Also, the variation of the traffic amount for different days of the week is accounted for. For the simulation of longer time periods, e.g., for simulating the Decision Support System, additional effects such as the emergence and evolution of hotspots and overall growth in traffic become relevant. The intensity map generation process for larger time scales uses the hourly traffic intensity maps as basis and applies land use class specific growth factors, hotspots, and temporal noise to produce a realistic evolution of the traffic demand. The hourly traffic intensity maps are called base intensity maps in the following. The map generation process can be split into the following steps:
1. Determination of the relevant base intensity map 2. Application of growth 3. Evolution of hotspots 4. Introduction of noise
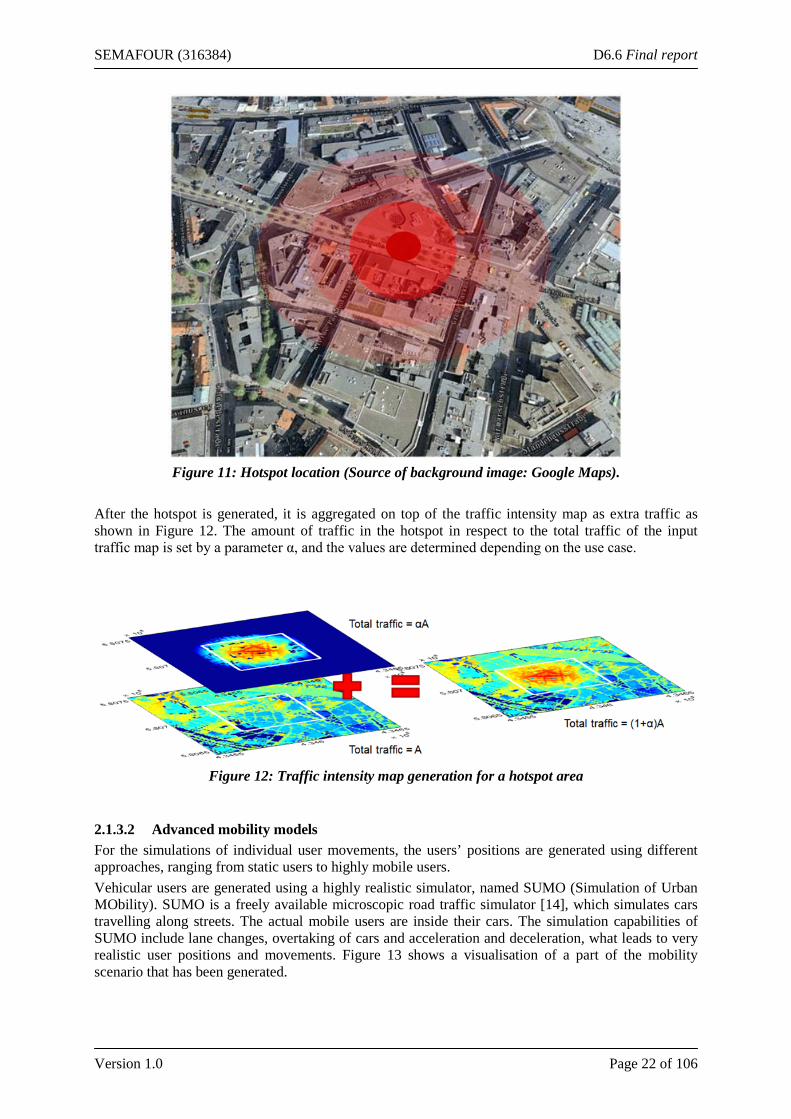
Use Case Specific Hotspot Derivation In order to meet the requirements of the individual use cases, specific demand hotspots can be overlaid. The traffic intensity map in the area is obtained by adding a 2D Gaussian spatial filtered hotspot with a cut-off distance to the input traffic map. The hotspot is assumed to be centred on a shopping mall/street. As shown in Figure 11, the hotspot covers a number of pedestrian streets.
SEMAFOUR (316384) D6.6 Final report
Version 1.0 Page 22 of 106
Figure 11: Hotspot location (Source of background image: Google Maps).
After the hotspot is generated, it is aggregated on top of the traffic intensity map as extra traffic as shown in Figure 12. The amount of traffic in the hotspot in respect to the total traffic of the input traffic map is set by a parameter α, and the values are determined depending on the use case.
Figure 12: Traffic intensity map generation for a hotspot area
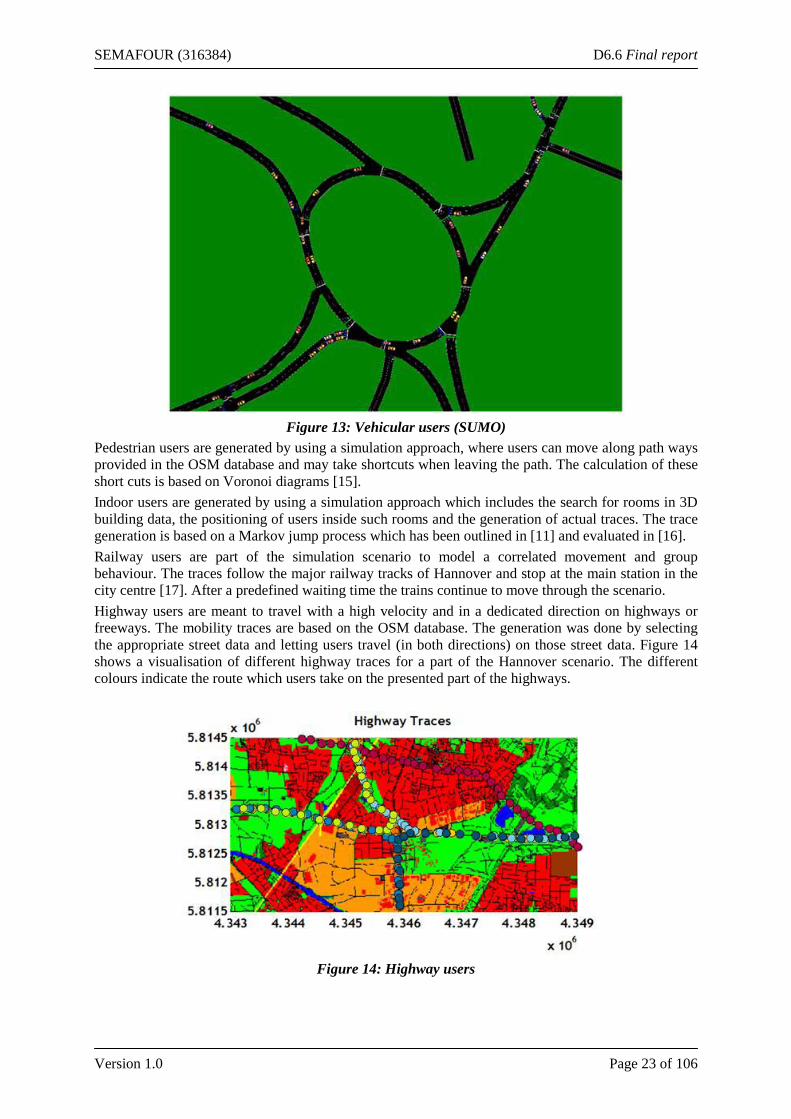
2.1.3.2 Advanced mobility models For the simulations of individual user movements, the users’ positions are generated using different approaches, ranging from static users to highly mobile users. Vehicular users are generated using a highly realistic simulator, named SUMO (Simulation of Urban MObility). SUMO is a freely available microscopic road traffic simulator [14], which simulates cars travelling along streets. The actual mobile users are inside their cars. The simulation capabilities of SUMO include lane changes, overtaking of cars and acceleration and deceleration, what leads to very realistic user positions and movements. Figure 13 shows a visualisation of a part of the mobility scenario that has been generated.
SEMAFOUR (316384) D6.6 Final report
Version 1.0 Page 23 of 106
Figure 13: Vehicular users (SUMO)
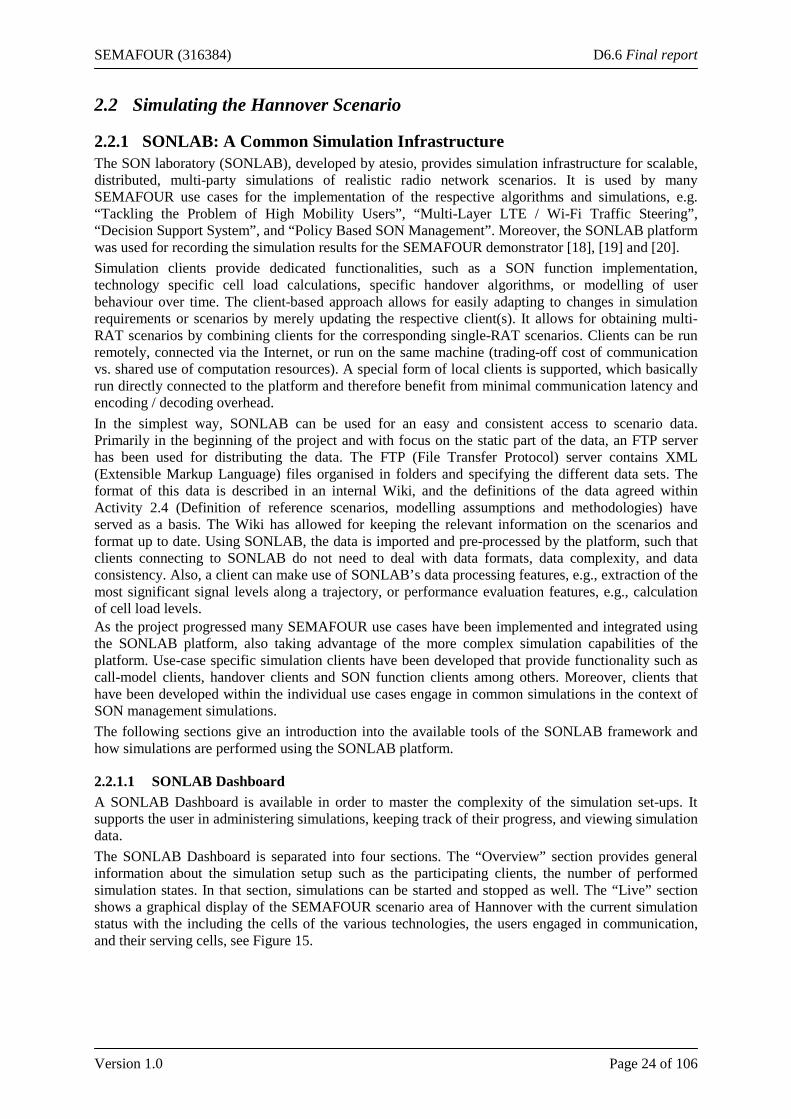
Pedestrian users are generated by using a simulation approach, where users can move along path ways provided in the OSM database and may take shortcuts when leaving the path. The calculation of these short cuts is based on Voronoi diagrams [15]. Indoor users are generated by using a simulation approach which includes the search for rooms in 3D building data, the positioning of users inside such rooms and the generation of actual traces. The trace generation is based on a Markov jump process which has been outlined in [11] and evaluated in [16]. Railway users are part of the simulation scenario to model a correlated movement and group behaviour. The traces follow the major railway tracks of Hannover and stop at the main station in the city centre [17]. After a predefined waiting time the trains continue to move through the scenario. Highway users are meant to travel with a high velocity and in a dedicated direction on highways or freeways. The mobility traces are based on the OSM database. The generation was done by selecting the appropriate street data and letting users travel (in both directions) on those street data. Figure 14 shows a visualisation of different highway traces for a part of the Hannover scenario. The different colours indicate the route which users take on the presented part of the highways.
Figure 14: Highway users
SEMAFOUR (316384) D6.6 Final report
Version 1.0 Page 24 of 106
2.2 Simulating the Hannover Scenario
2.2.1 SONLAB: A Common Simulation Infrastructure The SON laboratory (SONLAB), developed by atesio, provides simulation infrastructure for scalable, distributed, multi-party simulations of realistic radio network scenarios. It is used by many SEMAFOUR use cases for the implementation of the respective algorithms and simulations, e.g. “Tackling the Problem of High Mobility Users”, “Multi-Layer LTE / Wi-Fi Traffic Steering”, “Decision Support System”, and “Policy Based SON Management”. Moreover, the SONLAB platform was used for recording the simulation results for the SEMAFOUR demonstrator [18], [19] and [20]. Simulation clients provide dedicated functionalities, such as a SON function implementation, technology specific cell load calculations, specific handover algorithms, or modelling of user behaviour over time. The client-based approach allows for easily adapting to changes in simulation requirements or scenarios by merely updating the respective client(s). It allows for obtaining multi-RAT scenarios by combining clients for the corresponding single-RAT scenarios. Clients can be run remotely, connected via the Internet, or run on the same machine (trading-off cost of communication vs. shared use of computation resources). A special form of local clients is supported, which basically run directly connected to the platform and therefore benefit from minimal communication latency and encoding / decoding overhead. In the simplest way, SONLAB can be used for an easy and consistent access to scenario data. Primarily in the beginning of the project and with focus on the static part of the data, an FTP server has been used for distributing the data. The FTP (File Transfer Protocol) server contains XML (Extensible Markup Language) files organised in folders and specifying the different data sets. The format of this data is described in an internal Wiki, and the definitions of the data agreed within Activity 2.4 (Definition of reference scenarios, modelling assumptions and methodologies) have served as a basis. The Wiki has allowed for keeping the relevant information on the scenarios and format up to date. Using SONLAB, the data is imported and pre-processed by the platform, such that clients connecting to SONLAB do not need to deal with data formats, data complexity, and data consistency. Also, a client can make use of SONLAB’s data processing features, e.g., extraction of the most significant signal levels along a trajectory, or performance evaluation features, e.g., calculation of cell load levels. As the project progressed many SEMAFOUR use cases have been implemented and integrated using the SONLAB platform, also taking advantage of the more complex simulation capabilities of the platform. Use-case specific simulation clients have been developed that provide functionality such as call-model clients, handover clients and SON function clients among others. Moreover, clients that have been developed within the individual use cases engage in common simulations in the context of SON management simulations. The following sections give an introduction into the available tools of the SONLAB framework and how simulations are performed using the SONLAB platform.
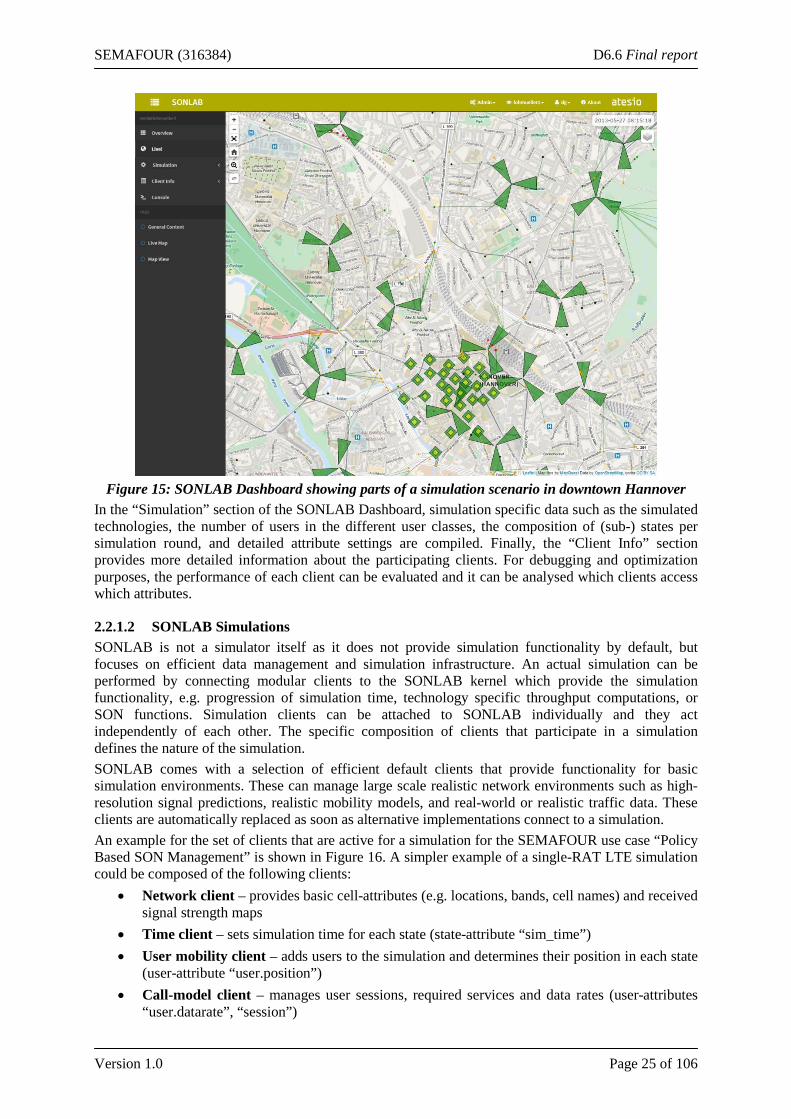
2.2.1.1 SONLAB Dashboard A SONLAB Dashboard is available in order to master the complexity of the simulation set-ups. It supports the user in administering simulations, keeping track of their progress, and viewing simulation data. The SONLAB Dashboard is separated into four sections. The “Overview” section provides general information about the simulation setup such as the participating clients, the number of performed simulation states. In that section, simulations can be started and stopped as well. The “Live” section shows a graphical display of the SEMAFOUR scenario area of Hannover with the current simulation status with the including the cells of the various technologies, the users engaged in communication, and their serving cells, see Figure 15.
SEMAFOUR (316384) D6.6 Final report
Version 1.0 Page 25 of 106
Figure 15: SONLAB Dashboard showing parts of a simulation scenario in downtown Hannover
In the “Simulation” section of the SONLAB Dashboard, simulation specific data such as the simulated technologies, the number of users in the different user classes, the composition of (sub-) states per simulation round, and detailed attribute settings are compiled. Finally, the “Client Info” section provides more detailed information about the participating clients. For debugging and optimization purposes, the performance of each client can be evaluated and it can be analysed which clients access which attributes.
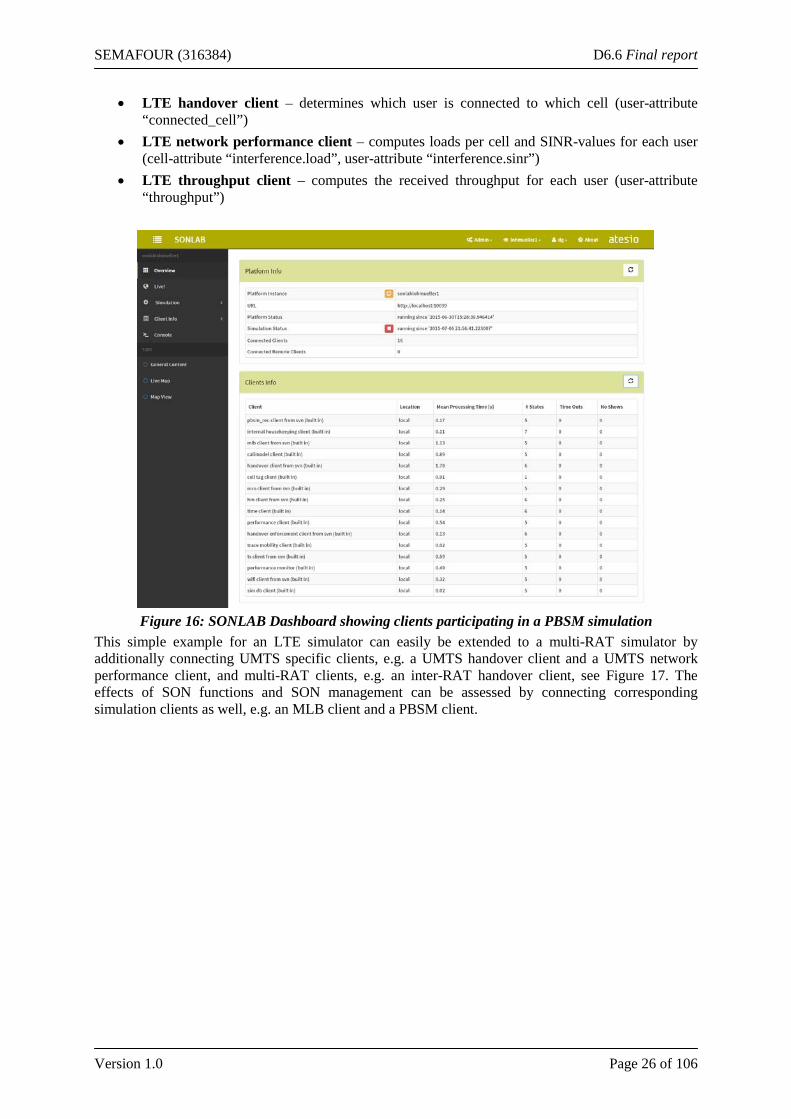
2.2.1.2 SONLAB Simulations SONLAB is not a simulator itself as it does not provide simulation functionality by default, but focuses on efficient data management and simulation infrastructure. An actual simulation can be performed by connecting modular clients to the SONLAB kernel which provide the simulation functionality, e.g. progression of simulation time, technology specific throughput computations, or SON functions. Simulation clients can be attached to SONLAB individually and they act independently of each other. The specific composition of clients that participate in a simulation defines the nature of the simulation. SONLAB comes with a selection of efficient default clients that provide functionality for basic simulation environments. These can manage large scale realistic network environments such as high-resolution signal predictions, realistic mobility models, and real-world or realistic traffic data. These clients are automatically replaced as soon as alternative implementations connect to a simulation. An example for the set of clients that are active for a simulation for the SEMAFOUR use case “Policy Based SON Management” is shown in Figure 16. A simpler example of a single-RAT LTE simulation could be composed of the following clients:
• Network client – provides basic cell-attributes (e.g. locations, bands, cell names) and received signal strength maps
• Time client – sets simulation time for each state (state-attribute “sim_time”) • User mobility client – adds users to the simulation and determines their position in each state
(user-attribute “user.position”) • Call-model client – manages user sessions, required services and data rates (user-attributes
“user.datarate”, “session”)
SEMAFOUR (316384) D6.6 Final report
Version 1.0 Page 26 of 106
• LTE handover client – determines which user is connected to which cell (user-attribute “connected_cell”)
• LTE network performance client – computes loads per cell and SINR-values for each user (cell-attribute “interference.load”, user-attribute “interference.sinr”)
• LTE throughput client – computes the received throughput for each user (user-attribute “throughput”)
Figure 16: SONLAB Dashboard showing clients participating in a PBSM simulation
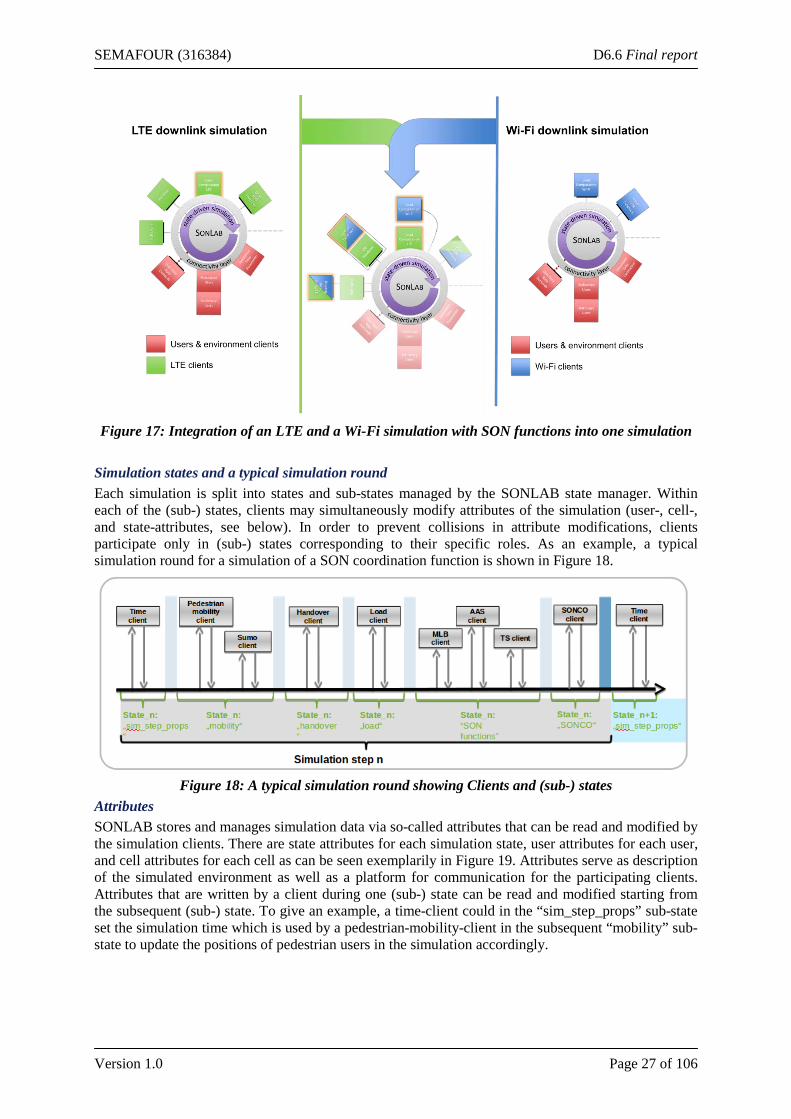
This simple example for an LTE simulator can easily be extended to a multi-RAT simulator by additionally connecting UMTS specific clients, e.g. a UMTS handover client and a UMTS network performance client, and multi-RAT clients, e.g. an inter-RAT handover client, see Figure 17. The effects of SON functions and SON management can be assessed by connecting corresponding simulation clients as well, e.g. an MLB client and a PBSM client.
SEMAFOUR (316384) D6.6 Final report
Version 1.0 Page 27 of 106
Figure 17: Integration of an LTE and a Wi-Fi simulation with SON functions into one simulation
Simulation states and a typical simulation round Each simulation is split into states and sub-states managed by the SONLAB state manager. Within each of the (sub-) states, clients may simultaneously modify attributes of the simulation (user-, cell-, and state-attributes, see below). In order to prevent collisions in attribute modifications, clients participate only in (sub-) states corresponding to their specific roles. As an example, a typical simulation round for a simulation of a SON coordination function is shown in Figure 18.
Figure 18: A typical simulation round showing Clients and (sub-) states
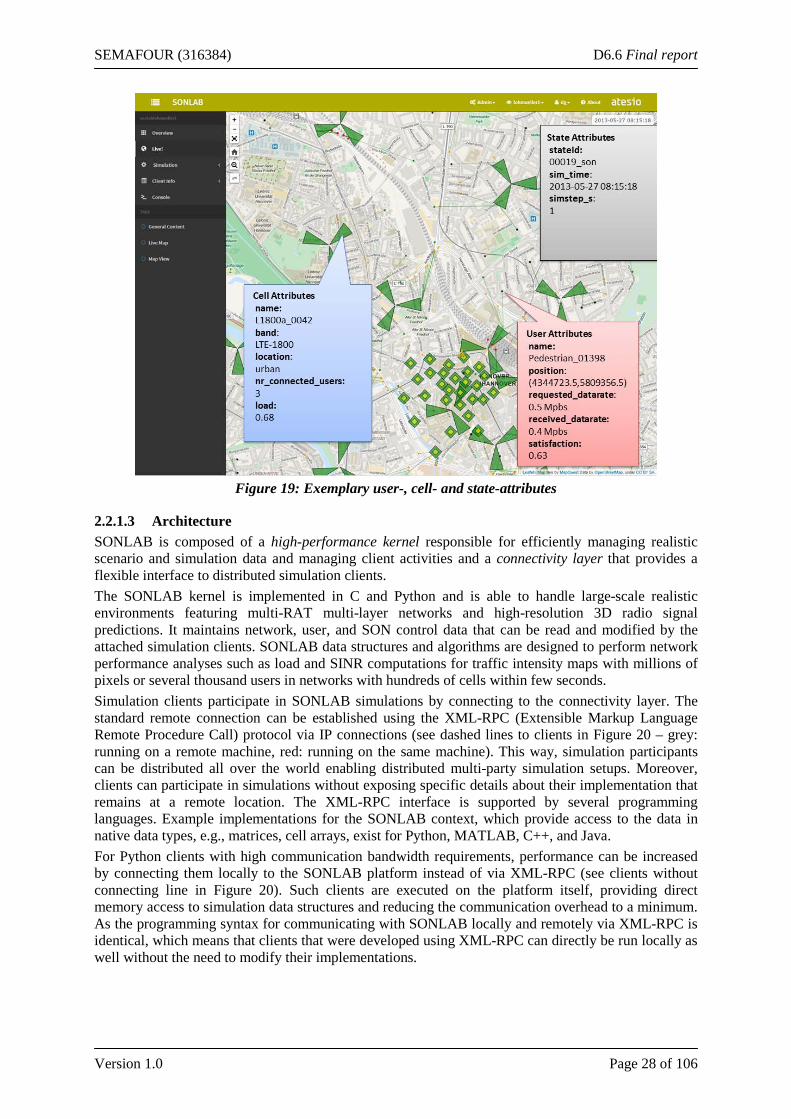
Attributes SONLAB stores and manages simulation data via so-called attributes that can be read and modified by the simulation clients. There are state attributes for each simulation state, user attributes for each user, and cell attributes for each cell as can be seen exemplarily in Figure 19. Attributes serve as description of the simulated environment as well as a platform for communication for the participating clients. Attributes that are written by a client during one (sub-) state can be read and modified starting from the subsequent (sub-) state. To give an example, a time-client could in the “sim_step_props” sub-state set the simulation time which is used by a pedestrian-mobility-client in the subsequent “mobility” sub-state to update the positions of pedestrian users in the simulation accordingly.
SEMAFOUR (316384) D6.6 Final report
Version 1.0 Page 28 of 106
Figure 19: Exemplary user-, cell- and state-attributes
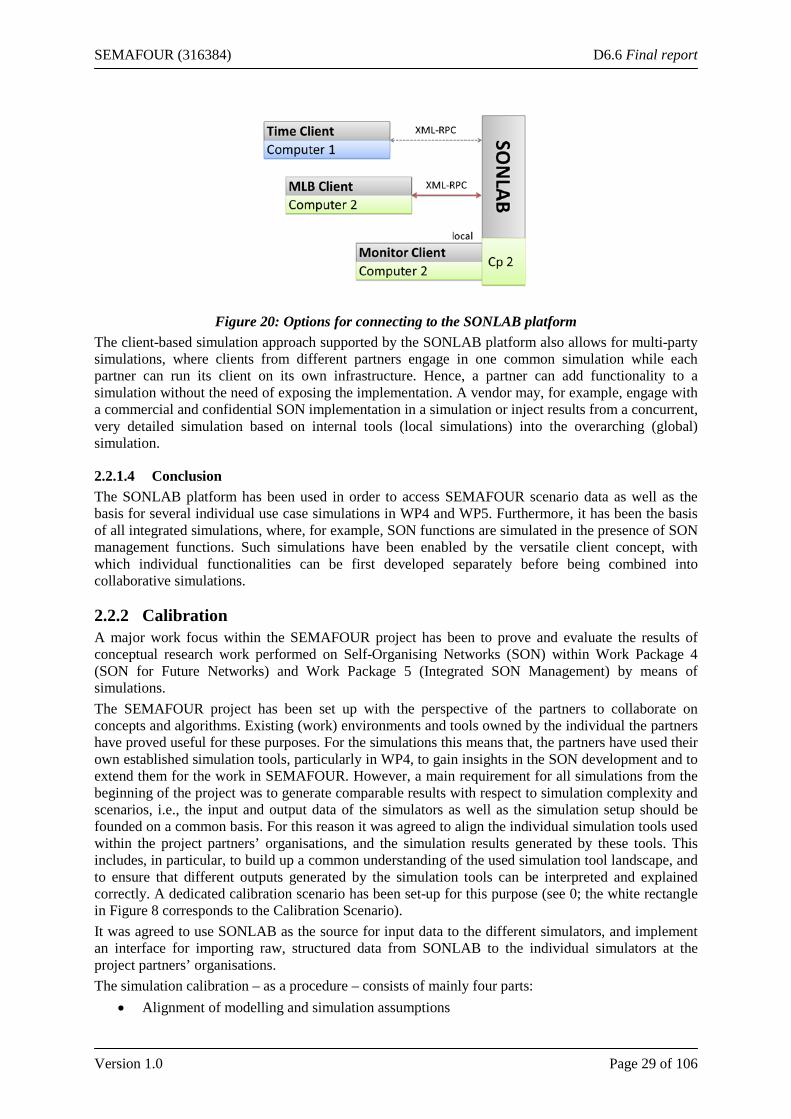
2.2.1.3 Architecture SONLAB is composed of a high-performance kernel responsible for efficiently managing realistic scenario and simulation data and managing client activities and a connectivity layer that provides a flexible interface to distributed simulation clients. The SONLAB kernel is implemented in C and Python and is able to handle large-scale realistic environments featuring multi-RAT multi-layer networks and high-resolution 3D radio signal predictions. It maintains network, user, and SON control data that can be read and modified by the attached simulation clients. SONLAB data structures and algorithms are designed to perform network performance analyses such as load and SINR computations for traffic intensity maps with millions of pixels or several thousand users in networks with hundreds of cells within few seconds. Simulation clients participate in SONLAB simulations by connecting to the connectivity layer. The standard remote connection can be established using the XML-RPC (Extensible Markup Language Remote Procedure Call) protocol via IP connections (see dashed lines to clients in Figure 20 – grey: running on a remote machine, red: running on the same machine). This way, simulation participants can be distributed all over the world enabling distributed multi-party simulation setups. Moreover, clients can participate in simulations without exposing specific details about their implementation that remains at a remote location. The XML-RPC interface is supported by several programming languages. Example implementations for the SONLAB context, which provide access to the data in native data types, e.g., matrices, cell arrays, exist for Python, MATLAB, C++, and Java. For Python clients with high communication bandwidth requirements, performance can be increased by connecting them locally to the SONLAB platform instead of via XML-RPC (see clients without connecting line in Figure 20). Such clients are executed on the platform itself, providing direct memory access to simulation data structures and reducing the communication overhead to a minimum. As the programming syntax for communicating with SONLAB locally and remotely via XML-RPC is identical, which means that clients that were developed using XML-RPC can directly be run locally as well without the need to modify their implementations.
SEMAFOUR (316384) D6.6 Final report
Version 1.0 Page 29 of 106
Figure 20: Options for connecting to the SONLAB platform
The client-based simulation approach supported by the SONLAB platform also allows for multi-party simulations, where clients from different partners engage in one common simulation while each partner can run its client on its own infrastructure. Hence, a partner can add functionality to a simulation without the need of exposing the implementation. A vendor may, for example, engage with a commercial and confidential SON implementation in a simulation or inject results from a concurrent, very detailed simulation based on internal tools (local simulations) into the overarching (global) simulation.
2.2.1.4 Conclusion The SONLAB platform has been used in order to access SEMAFOUR scenario data as well as the basis for several individual use case simulations in WP4 and WP5. Furthermore, it has been the basis of all integrated simulations, where, for example, SON functions are simulated in the presence of SON management functions. Such simulations have been enabled by the versatile client concept, with which individual functionalities can be first developed separately before being combined into collaborative simulations.
2.2.2 Calibration A major work focus within the SEMAFOUR project has been to prove and evaluate the results of conceptual research work performed on Self-Organising Networks (SON) within Work Package 4 (SON for Future Networks) and Work Package 5 (Integrated SON Management) by means of simulations. The SEMAFOUR project has been set up with the perspective of the partners to collaborate on concepts and algorithms. Existing (work) environments and tools owned by the individual the partners have proved useful for these purposes. For the simulations this means that, the partners have used their own established simulation tools, particularly in WP4, to gain insights in the SON development and to extend them for the work in SEMAFOUR. However, a main requirement for all simulations from the beginning of the project was to generate comparable results with respect to simulation complexity and scenarios, i.e., the input and output data of the simulators as well as the simulation setup should be founded on a common basis. For this reason it was agreed to align the individual simulation tools used within the project partners’ organisations, and the simulation results generated by these tools. This includes, in particular, to build up a common understanding of the used simulation tool landscape, and to ensure that different outputs generated by the simulation tools can be interpreted and explained correctly. A dedicated calibration scenario has been set-up for this purpose (see 0; the white rectangle in Figure 8 corresponds to the Calibration Scenario). It was agreed to use SONLAB as the source for input data to the different simulators, and implement an interface for importing raw, structured data from SONLAB to the individual simulators at the project partners’ organisations. The simulation calibration – as a procedure – consists of mainly four parts:
• Alignment of modelling and simulation assumptions
SEMAFOUR (316384) D6.6 Final report
Version 1.0 Page 30 of 106
• Assurance of input data • Comparison of basic system performance • Comparison of dynamic system performance
The calibration process between the simulators of the partners is documented in Deliverable D2.5 [4]. The final outcome of the calibration activity shows a very good level of comparability and integration of simulation results across the different simulators used by the partners.
SEMAFOUR (316384) D6.6 Final report
Version 1.0 Page 31 of 106
3 Individual SON Functions
3.1 Introduction SON feature will play critical roles in future radio access networks to handle the increasing operational complexity caused by multi-layer and multi-technology deployments. The SEMAFOUR project aims at designing and developing a unified self-management system, which enables the network operators to holistically manage and operate their complex heterogeneous mobile network with less effort, as introduced in Chapter 1. One of the key objectives of the SEMAFOUR project is the development of new concepts, methods and algorithms for a selected set of Self-Organising Network (SON) functions targeting multi-RAT and multi-layer environments. In this chapter we describe the SON functions developed in WP4 within the SEMAFOUR project. The overall goals are to improve network performance with minimal manual operator configuration and administration in (i) multi-layer scenarios comprising a mix of nodes at the macro, micro, pico and/or femto-layer (ii) in multi-RAT scenarios comprising a variety of access technologies, including LTE, HSPA, GSM, and WLAN, (iii) in integrated scenarios comprising multiple layers and RATs. In order to realize the vision of a unified self-management system (see Chapter 1), there is a benefit from aligning the development of SON functions in line with the integrated SON management framework elaborated in Section 4.1. To this end, the SEMAFOUR project has developed a set of SON Design Principles (see Section 3.2) to ensure that the SON functions interact correctly with the SON management framework, but also this aims at designing SON functions in order to reduce need of a SON Coordinator when needed. This is a new direction taken which has not been studied in previous work. The four SON functions developed and presented in this chapter are:
• Dynamic Spectrum Allocation and Interference Management (DSA/IM) – aiming at allocating spectrum across cells and RATs to optimize network performance and make best usage of available operator spectrum
• Multi-layer LTE – Wi-Fi Traffic Steering (TS) – aiming at steering users between LTE cells and Wi-Fi nodes to balance load and increase end user performance
• Tackling the Problem of High Mobility Users (HM) – aiming at minimising negative effects of frequent HOs, HO failures and short-stays.
• Active / Reconfigurable Antenna Systems (AAS) – aiming at utilizing advanced antennas for sectorising cells as a densification method and in addition optimising sector parameters.
This chapter will also present simulation results, quantifying the gains for the different features in realistic scenarios, see Chapter 2. In particular, a complete LTE network has been modelled for the entire city area of Hannover, Germany, featuring for example, 3D propagation models using building data and macroscopic traffic and individual user mobility. Further, a common simulation infrastructure SON laboratory (SONLAB) has been developed within SEMAFOUR in order to evaluate the different SON features. Overall achievements of WP4 are the following (see Chapter 1):
• Significant network performance improvement: All use cases point toward performance improvements in terms of system capacity and/or user throughput. In some cases improvements above 100% compared to default solutions can be observed. In general there is a trade-off between quality of experience and CAPEX and, as such, SEMAFOUR results imply either improved user experience with the same level of CAPEX or reduced CAPEX with the same level of quality of experience.
• Improvement of the spectral usage: Spectrum is a scarce resource and not only is availability limited, but is also a costly asset for the operators. To ensure that usage of spectrum is maximized is, thus, key to maximizing the return on operator’s investments.
SEMAFOUR (316384) D6.6 Final report
Version 1.0 Page 32 of 106
• Improved manageability of radio recourses resources and hardware capabilities: Finally, the SON features developed all aim at improved manageability and reducing operations cost. For example, with a SON function managing LTE-Wi-Fi Traffic Steering there is no need in manually set load balancing parameters across the different RATs. Another example is the AAS use cases, where the SON function automatically determined whether to perform vertical sectorisation depending on spatial load distribution.
• Impact on standardisation: The SEMAFOUR project has successfully submitted three 3GPP contributions through project partners based on results obtained in the “Multi-layer LTE – Wi-Fi Traffic Steering” (Section 3.4) and “Active / Reconfigurable Antenna Systems” (Section 3.6) use cases. These contributions have confirmed evaluations discussed in 3GPP and provided input on new directions to take influencing work items in 3GPP. In this way the SEMAFOUR project has had immediate impact on the standardization of improvements on the LTE standard.
• Cutting edge research: The SEMAFOUR project has delivered cutting-edge research and pushed the technology boundary beyond state of the art. For example, results from the High Mobility use case show clearly show that is it feasible to predict user mobility in complex scenarios (involving a mix of high-ways and residential areas) and that mobility prediction can be used in order to optimize handovers between cells. The same mobility prediction can be used also in other use cases, for example, when predicting user throughput. These algorithms go well beyond state of the art SON features that rather react on historic events than prediction of the future and thus mark a new milestone for smart networks.
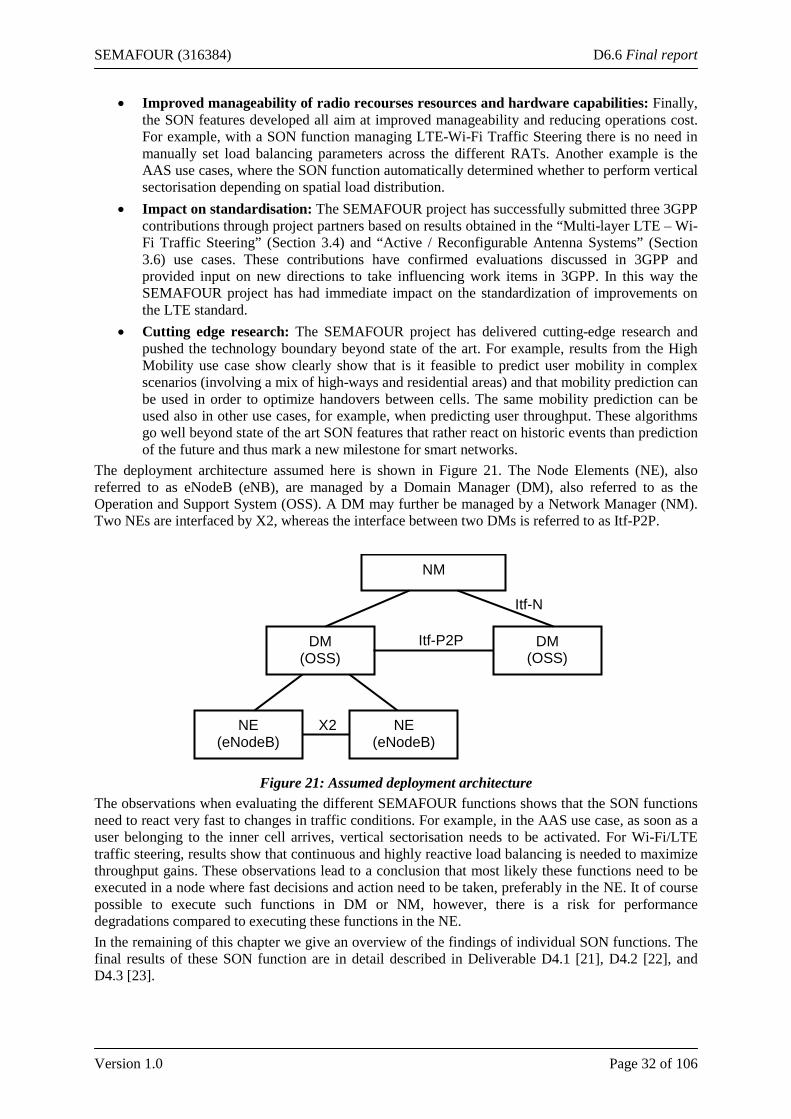
The deployment architecture assumed here is shown in Figure 21. The Node Elements (NE), also referred to as eNodeB (eNB), are managed by a Domain Manager (DM), also referred to as the Operation and Support System (OSS). A DM may further be managed by a Network Manager (NM). Two NEs are interfaced by X2, whereas the interface between two DMs is referred to as Itf-P2P.
Figure 21: Assumed deployment architecture
The observations when evaluating the different SEMAFOUR functions shows that the SON functions need to react very fast to changes in traffic conditions. For example, in the AAS use case, as soon as a user belonging to the inner cell arrives, vertical sectorisation needs to be activated. For Wi-Fi/LTE traffic steering, results show that continuous and highly reactive load balancing is needed to maximize throughput gains. These observations lead to a conclusion that most likely these functions need to be executed in a node where fast decisions and action need to be taken, preferably in the NE. It of course possible to execute such functions in DM or NM, however, there is a risk for performance degradations compared to executing these functions in the NE. In the remaining of this chapter we give an overview of the findings of individual SON functions. The final results of these SON function are in detail described in Deliverable D4.1 [21], D4.2 [22], and D4.3 [23].
NE (eNodeB)
DM (OSS)
NM
NE (eNodeB)
DM (OSS)
X2
Itf-P2P
Itf-N
SEMAFOUR (316384) D6.6 Final report
Version 1.0 Page 33 of 106
3.2 SON Design Principles
3.2.1 Introduction When designing an increasing number of SON functions to be deployed in network nodes operating at the same time, it is important to be aware of potential conflicts between the actions proposed by different SON functions. These conflicts could, for example, occur when two SON functions want to change the same parameter in a different direction, or when one SON function negatively influences the target of another SON function. Whenever there are risks that conflicts arise, such conflicts need to be handled in some manner, or at least the negative implications from the conflicts need to be under control. One approach for dealing with (potential) conflicts in a self-organising network is to resolve them at runtime by using a SON coordinator - a separate entity that monitors and moderates (i.e. accepts or rejects) the actions of the SON functions during operation (see Chapter 4). A complementary approach to SON coordination is to avoid conflicts already when designing the SON functions, by following some conflict-free SON design principles. Adhering to such principles shall avoid that undesired interactions between the different SON functions will occur. In this section we describe a set of design principles as well as an evaluation methodology to check if a number of SON functions meet the conflict-free SON design principles and, as such, the two SON functions are orthogonal. Intuitively, two SON functions are ‘orthogonal’ if they do not impact each other, in the sense of performance degradation. The evaluation methodology has been applied to the four SEMAFOUR SON functions DSA/IM (Section 3.2.1), TS (Section 3.4), HM (Section 3.5), and AAS (Section 3.6). It is concluded that there are no undesired interactions between the first three functions. Between the HM and TS SON functions, a conflict might occur when both functions take contrary steering decisions for a user. However, it is still possible to make these two SON functions orthogonal, such that it is concluded that the four SEMAFOUR WP4 SON functions comply with the conflict-free SON design principle. When introducing a new SON function in the future, we recommend that the proposed evaluation methodology is applied. If dependence is identified, conflicts might arise. In that case, the design of the SON function could be changed or a SON coordinator could be used to resolve the potential conflicts at runtime.
3.2.2 Design Principles Below we introduce the SON design principles and the evaluation methodology for targeting conflict-free operation. Design principles 1.1-1.3 aim at proper interaction with the SON management framework described in Chapter 4. Design principles 2.1-2.4 aim at avoiding conflicts at design time as a complement to the SON Coordinator described in Section 4.3. The most drastic approach that can be taken by a SON coordinator in order to resolve conflicts is to disable certain SON functions entirely. This disabling of a SON function is not considered permanent: after a certain amount of time, for instance after a situation of high load is over, the disabled SON function might be enabled again. In this case it is important that the SON function can resume its normal operation as soon as possible. Design Principle 1.1: Updating Internal State While SON functions are disabled by the SON coordinator, they should keep updating their internal state based on changes in the network such that once they are enabled again they are able to swiftly operate optimally again. A less drastic action that can be taken by the SON coordinator is to prevent or modify network parameter changes made by the SON function. SON functions must thus be aware that the network parameter changes they propose are not necessarily carried out as requested and that network parameters can be changed without them requesting it. Therefore they should be designed such that they are able to deal with this fact.
SEMAFOUR (316384) D6.6 Final report
Version 1.0 Page 34 of 106
Design Principle 1.2: Monitoring Output SON functions should monitor the values of the controlled network parameters and take the current values into account when evaluating the system performance and taking decisions. When repeated conflicts occur in the network there might be a conflict among the objectives of the individual SON functions. The SON function configuration parameters determine the policy that is pursued by the different SON functions. In the SEMAFOUR architecture these configuration parameters are, for example, set by the Policy-Based SON Management (PBSM) function (see Chapter 4). This means that the SON function cannot assume that its configuration parameters will be fixed for a very long time. Design Principle 1.3: Adaptability of Goals SON functions should be designed such that they are able to deal with changes of their configuration parameters and can quickly operate optimally again after a configuration parameter change. Now we turn to the set of design principles aiming at avoiding conflicts and malfunction already at the design time of the SON functions. The first principle concerns different SON functions affecting the same parameters, which may cause interactions. Therefore, the first design principle is to forbid the SON functions to change the same parameters. We say that two SON functions are of same type if they are instances of the same SON function and adhere to the architectural deployment of that SON function. For example, instances of the Wi-Fi/LTE traffic steering function being executed in the eNBs belong to the same SON function type. Design Principle 2.1: Separation of Control Each SON function controls and affects only those parameters associated to the same SON function type and any SON function of a different type cannot control that parameter. This means that the set of control parameters of the SON functions of a certain type are disjoint from the set of parameters controlled by other SON function types. To meet the separation of control principle, the controlled parameters of SON function types n and k not only need to be different but also independent. The outcome of one SON function cannot affect the outcome of the other SON function. One way to ensure such independence is via grouping of terminals, and the two SON functions control parameters configured for users in different groups. Even by considering separation of control, there may still be remaining interactions via the measurements if two SON functions use the same measurement. The Separation of Concern design principle avoids such interactions by restricting the use of the same or correlated measurements. Design Principle 2.2: Separation of Concern Each SON function uses only its specific measurement and any other SON function of another type cannot use that measurement. Further the measurements used by the two SON functions shall be uncorrelated. One important means to introduce the separation principles is via grouping of users, such that different SON functions operate on a different population of users. Users in a group are configured with one set of parameters, tuned by one SON function type, based on measurements associated only to users in group. There might be reasons to allow different SON functions to use correlated measurements. One such example is when the two SON functions operate on very different time scales, for example, a slow centralised SON function (e.g. operating at a time scale of an hour or more) and a much faster decentralised SON function (e.g. operating at time scale of the order of a minute or less). In such cases, the actions of the faster SON function can be seen as converged when evaluating the situation on longer time scales based on averaged measurements over long time windows. Design Principle 2.3: Separation of Time Scales Two SON functions operating at different time scales are separated by time if the actions by the faster function can be assumed to have converged within the update period of the slower one, and that measurements considered by the slower are averaged enough so that there is negligible correlation between the faster variations of the measurements.
SEMAFOUR (316384) D6.6 Final report
Version 1.0 Page 35 of 106
This separation principle implicitly means that the considered SON functions are not expected to require the same reaction time, or time granularity, to the changes to the network conditions, in terms of load, mobility, radio link failures, etc. Requirements from short to long term variations could be anticipated, where short changes are in the order of tens of seconds/few minutes up to changes in terms of several hours / days which characterise long variations.
3.2.3 SON Design Evaluation Methodology and Results In this section, we briefly present a SON design evaluation methodology to assess whether the SON design principles are met. Furthermore, the considered means to meet the SON design principles also need to be evaluated with respect to whether the means are significantly limiting the performance. If this is the case, then it is important to re-evaluate the design of the SON function types. Would a redesign be less limiting, while still fulfilling the design principles? Since this is specific case by case, we are not defining any methodology for this evaluation, and instead it is recommended to try to assess whether the design principles introduce any specific limitations for the performance. One general aspect concerns grouping of users and statistics, which is discussed in Section 3.2.2 as a means to meet the separation of control and concern principles. By grouping users, there is a risk that the availability of statistics per group becomes limited. Therefore, one general limitation to evaluate can be to assess whether user grouping reduces the statistics which may prevent the desired update rate of the SON function, acknowledging that a specific update rate requires sufficient statistics to be gathered during the interval between updates. The proposed SON design evaluation methodology is recursive and summarized as follows. It evaluates inter-SON function orthogonality between SON function type n and SON function types 1, … n-1. If all n-1 previous SON function types are mutually orthogonal, and SON function type n is mutually orthogonal with these n-1 SON function types, then all the n SON function types are mutually orthogonal. Hence, the evaluation methodology is based on pair-wise inter-SON function evaluations between SON function types n and k, where k=1,…,n-1. Applying the SON design evaluation methodology to the four SEMAFOUR WP4 SON functions showed that there are no undesired interactions between the DSA/IM function, the TS function and the AAS function as they are mutually separated by time or by control and concern. Between the HM and TS functions, the separation of control principle is not necessarily met, meaning that there might be a conflict between both functions when they take contrary steering decisions for a user. But by using the grouping concept it is still possible to make the HM SON function and the TS SON function orthogonal. As such, the four SEMAFOUR WP4 SON functions comply with the conflict-free SON design principles. The HM/TS example, however, illustrates that sometimes there can be a trade-off or cost associated with designing SON functions such that the design principles are met. In this example, this is in the sense that there will be a portion of users that cannot benefit from one of the two SON functions and the design of the SON functions will be more complex, even if applying both SON functions does not result in a conflicting decision or causes no harm in practice. It appears to be difficult to quantify the cost (for example in lost performance or added complexity) of letting SON functions meet the design principles. This is difficult on a case-by-case basis for the SON functions developed in SEMAFOUR, and is even more difficult, if not impossible, in general, as a SON function can be realised in different ways in terms of control parameters, measurements and time scales. As such we can only draw conclusions on whether it is feasible or not to apply the above mentioned SON design principles to those SON functions developed within SEMAFOUR.
3.2.4 Conclusions We have presented a set of SON design principles for conflict-free SON with an evaluation methodology for assessing whether these design principles are met or not. The methodology evaluates whether dependence between SON functions can be identified, and it has been applied to the four SON functions DSA/IM, TS, AAS and HM. It has been concluded that there are no undesired interactions between the three first functions. Between the HM and TS functions, the separation of control principle is not necessarily met, and so a conflict might occur when both functions take
SEMAFOUR (316384) D6.6 Final report
Version 1.0 Page 36 of 106
contrary steering decisions for a user. However, by using the grouping concept it is still possible to make these two SON functions orthogonal. With this qualification the four SEMAFOUR SON functions comply with the conflict-free SON design principles. When introducing a new SON function in the future, we recommend that the proposed evaluation methodology is applied. If a lack of separation is identified, conflicts might arise. In that case, the design of the SON function could be changed or a SON coordinator could be used to resolve the potential conflicts.
3.3 Dynamic Spectrum Allocation and Interference Management
3.3.1 Introduction The growing demand of mobile broadband services force Mobile Network Operators (MNOs) to evolve their LTE/LTE-A networks from coverage oriented deployments towards capacity oriented deployments. Macro cell upgrades and densification combined with small cell deployments are common techniques to boost capacity. In densely deployed networks, interference plays a major role in limiting the capacity of the cells. The classical radio capacity dimensioning approach in wireless cellular networks is based on the offered load in typical busy hour conditions. However, the traffic demand and the amount of radio resources required in a given cell of the network vary largely over time and space. Consequently, the deployed carriers are well utilised during peak traffic hours while they become less utilised for the rest of the day. At the same time the traffic demand may intensify in other areas of the network, e.g., in residential areas in the evening, located outside the busy hour high traffic areas. An important trend related to the overall spectrum usage for an MNO is the usage of legacy systems [24]. Due to the changing usage and traffic demands in legacy systems, a spectrum migration, or the so-called spectrum re-farming, takes place within and across the allocated spectrum bands for the different access technologies. This is a long term process that closely follows the migration of user devices and deployments towards the new generation wireless systems. The first objective of the SEMAFOUR Dynamic Spectrum Allocation (DSA) use case was to investigate the feasibility and impact of utilising the intra- Radio Access Technology DSA (intra-RAT DSA) for LTE in typical high-traffic urban areas under busy hour traffic conditions. By means of intra-RAT DSA the available LTE carriers are allocated according to the spatial and temporal traffic requirements by assigning spectrum to base stations based on the estimated large-scale temporal and spatial offered load. The DSA is controlled by a SON algorithm running in each LTE eNodeB. In LTE networks the intra-RAT DSA can be complemented, in a much finer time-frequency scale, by Interference Management (IM) mechanisms, such as the further / enhanced Inter-Cell Interference Coordination (feICIC). These interference management mechanisms aim at reducing or, when/where possible, completely mitigate interference via coordinated (semi-)dynamic assignment of the available time-frequency resources (also possibly including transmit power resources) between neighbouring LTE cells that utilise the same carrier frequency. In order to handle such spatially and temporally varying traffic requirements, the intra-RAT DSA approach was proposed to be used wherein the interference coming from neighbouring cells to the overloaded cell is reduced by reducing the total available bandwidth of operation of the neighbouring interfering cells. A SON mechanism is required in order to activate such a bandwidth reduction in the neighbouring interfering cells only upon the requirement from the highly loaded cell and also to revert back to the original bandwidth allocation when either the neighbour cells by themselves become heavily loaded or when the initially highly loaded cell’s load has reduced. Therefore, the DSA intra-RAT SON algorithm varies the available bandwidth of operation in the neighbouring interfering cells of a highly loaded cell in order to create a less interfered bandwidth for the said highly loaded cell. Our next focus within the SEMAFOUR DSA use case was to investigate the potential of inter-RAT GSM/LTE DSA mechanisms and to design the corresponding SON algorithm. Nowadays, in case of a global event like the world soccer cup, an LTE cell can rapidly change into an overloaded state e.g. in the case of an excessive demand for high resolution video streaming. The change of mobile applications towards data services lead to an increase of traffic demand for LTE networks whereas at
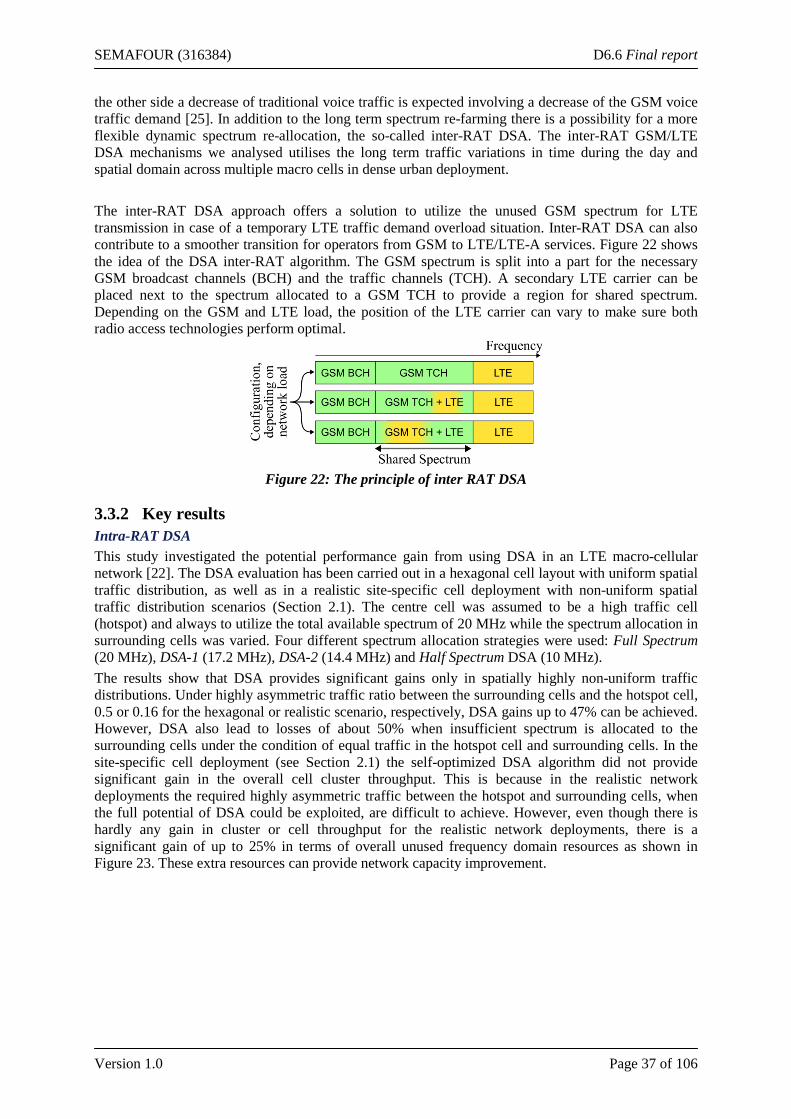
SEMAFOUR (316384) D6.6 Final report
Version 1.0 Page 37 of 106
the other side a decrease of traditional voice traffic is expected involving a decrease of the GSM voice traffic demand [25]. In addition to the long term spectrum re-farming there is a possibility for a more flexible dynamic spectrum re-allocation, the so-called inter-RAT DSA. The inter-RAT GSM/LTE DSA mechanisms we analysed utilises the long term traffic variations in time during the day and spatial domain across multiple macro cells in dense urban deployment. The inter-RAT DSA approach offers a solution to utilize the unused GSM spectrum for LTE transmission in case of a temporary LTE traffic demand overload situation. Inter-RAT DSA can also contribute to a smoother transition for operators from GSM to LTE/LTE-A services. Figure 22 shows the idea of the DSA inter-RAT algorithm. The GSM spectrum is split into a part for the necessary GSM broadcast channels (BCH) and the traffic channels (TCH). A secondary LTE carrier can be placed next to the spectrum allocated to a GSM TCH to provide a region for shared spectrum. Depending on the GSM and LTE load, the position of the LTE carrier can vary to make sure both radio access technologies perform optimal.
Figure 22: The principle of inter RAT DSA
3.3.2 Key results Intra-RAT DSA This study investigated the potential performance gain from using DSA in an LTE macro-cellular network [22]. The DSA evaluation has been carried out in a hexagonal cell layout with uniform spatial traffic distribution, as well as in a realistic site-specific cell deployment with non-uniform spatial traffic distribution scenarios (Section 2.1). The centre cell was assumed to be a high traffic cell (hotspot) and always to utilize the total available spectrum of 20 MHz while the spectrum allocation in surrounding cells was varied. Four different spectrum allocation strategies were used: Full Spectrum (20 MHz), DSA-1 (17.2 MHz), DSA-2 (14.4 MHz) and Half Spectrum DSA (10 MHz). The results show that DSA provides significant gains only in spatially highly non-uniform traffic distributions. Under highly asymmetric traffic ratio between the surrounding cells and the hotspot cell, 0.5 or 0.16 for the hexagonal or realistic scenario, respectively, DSA gains up to 47% can be achieved. However, DSA also lead to losses of about 50% when insufficient spectrum is allocated to the surrounding cells under the condition of equal traffic in the hotspot cell and surrounding cells. In the site-specific cell deployment (see Section 2.1) the self-optimized DSA algorithm did not provide significant gain in the overall cell cluster throughput. This is because in the realistic network deployments the required highly asymmetric traffic between the hotspot and surrounding cells, when the full potential of DSA could be exploited, are difficult to achieve. However, even though there is hardly any gain in cluster or cell throughput for the realistic network deployments, there is a significant gain of up to 25% in terms of overall unused frequency domain resources as shown in Figure 23. These extra resources can provide network capacity improvement.
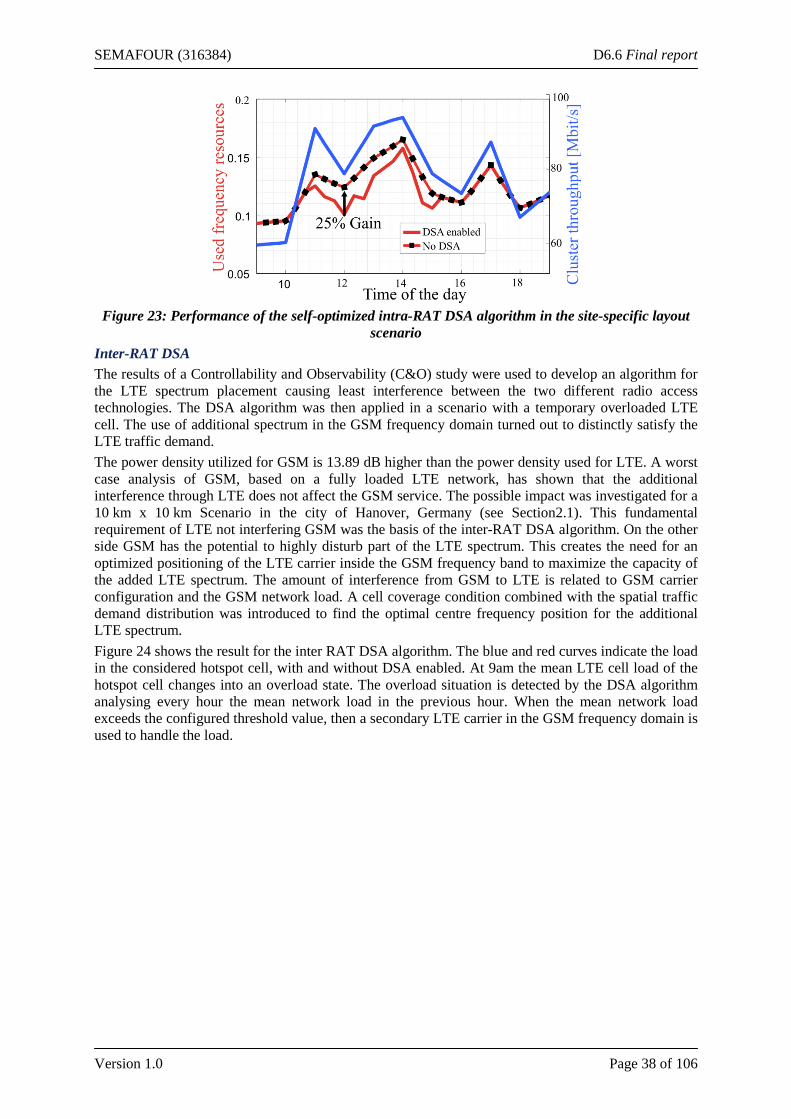
SEMAFOUR (316384) D6.6 Final report
Version 1.0 Page 38 of 106
Figure 23: Performance of the self-optimized intra-RAT DSA algorithm in the site-specific layout
scenario Inter-RAT DSA The results of a Controllability and Observability (C&O) study were used to develop an algorithm for the LTE spectrum placement causing least interference between the two different radio access technologies. The DSA algorithm was then applied in a scenario with a temporary overloaded LTE cell. The use of additional spectrum in the GSM frequency domain turned out to distinctly satisfy the LTE traffic demand. The power density utilized for GSM is 13.89 dB higher than the power density used for LTE. A worst case analysis of GSM, based on a fully loaded LTE network, has shown that the additional interference through LTE does not affect the GSM service. The possible impact was investigated for a 10 km x 10 km Scenario in the city of Hanover, Germany (see Section2.1). This fundamental requirement of LTE not interfering GSM was the basis of the inter-RAT DSA algorithm. On the other side GSM has the potential to highly disturb part of the LTE spectrum. This creates the need for an optimized positioning of the LTE carrier inside the GSM frequency band to maximize the capacity of the added LTE spectrum. The amount of interference from GSM to LTE is related to GSM carrier configuration and the GSM network load. A cell coverage condition combined with the spatial traffic demand distribution was introduced to find the optimal centre frequency position for the additional LTE spectrum. Figure 24 shows the result for the inter RAT DSA algorithm. The blue and red curves indicate the load in the considered hotspot cell, with and without DSA enabled. At 9am the mean LTE cell load of the hotspot cell changes into an overload state. The overload situation is detected by the DSA algorithm analysing every hour the mean network load in the previous hour. When the mean network load exceeds the configured threshold value, then a secondary LTE carrier in the GSM frequency domain is used to handle the load.
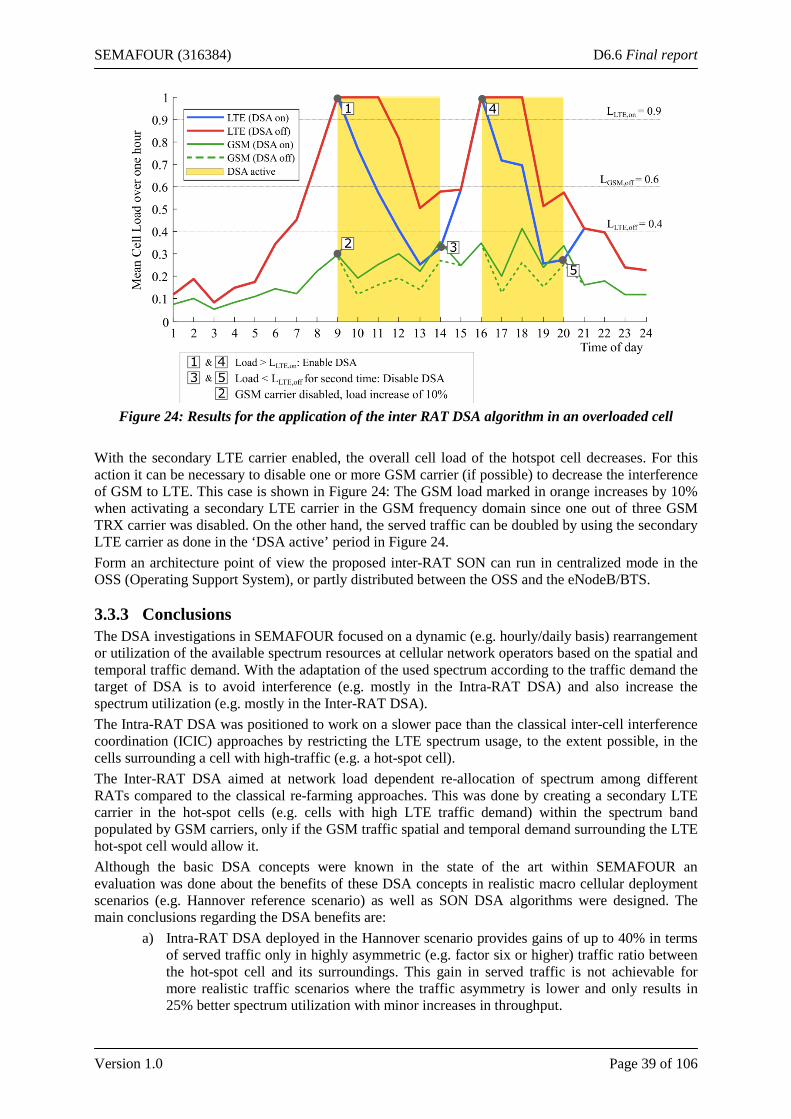
SEMAFOUR (316384) D6.6 Final report
Version 1.0 Page 39 of 106
Figure 24: Results for the application of the inter RAT DSA algorithm in an overloaded cell
With the secondary LTE carrier enabled, the overall cell load of the hotspot cell decreases. For this action it can be necessary to disable one or more GSM carrier (if possible) to decrease the interference of GSM to LTE. This case is shown in Figure 24: The GSM load marked in orange increases by 10% when activating a secondary LTE carrier in the GSM frequency domain since one out of three GSM TRX carrier was disabled. On the other hand, the served traffic can be doubled by using the secondary LTE carrier as done in the ‘DSA active’ period in Figure 24. Form an architecture point of view the proposed inter-RAT SON can run in centralized mode in the OSS (Operating Support System), or partly distributed between the OSS and the eNodeB/BTS.
3.3.3 Conclusions The DSA investigations in SEMAFOUR focused on a dynamic (e.g. hourly/daily basis) rearrangement or utilization of the available spectrum resources at cellular network operators based on the spatial and temporal traffic demand. With the adaptation of the used spectrum according to the traffic demand the target of DSA is to avoid interference (e.g. mostly in the Intra-RAT DSA) and also increase the spectrum utilization (e.g. mostly in the Inter-RAT DSA). The Intra-RAT DSA was positioned to work on a slower pace than the classical inter-cell interference coordination (ICIC) approaches by restricting the LTE spectrum usage, to the extent possible, in the cells surrounding a cell with high-traffic (e.g. a hot-spot cell). The Inter-RAT DSA aimed at network load dependent re-allocation of spectrum among different RATs compared to the classical re-farming approaches. This was done by creating a secondary LTE carrier in the hot-spot cells (e.g. cells with high LTE traffic demand) within the spectrum band populated by GSM carriers, only if the GSM traffic spatial and temporal demand surrounding the LTE hot-spot cell would allow it. Although the basic DSA concepts were known in the state of the art within SEMAFOUR an evaluation was done about the benefits of these DSA concepts in realistic macro cellular deployment scenarios (e.g. Hannover reference scenario) as well as SON DSA algorithms were designed. The main conclusions regarding the DSA benefits are:
a) Intra-RAT DSA deployed in the Hannover scenario provides gains of up to 40% in terms of served traffic only in highly asymmetric (e.g. factor six or higher) traffic ratio between the hot-spot cell and its surroundings. This gain in served traffic is not achievable for more realistic traffic scenarios where the traffic asymmetry is lower and only results in 25% better spectrum utilization with minor increases in throughput.
SEMAFOUR (316384) D6.6 Final report
Version 1.0 Page 40 of 106
b) Inter-RAT DSA deployed on a macro-cell level provides gains of roughly 100% in user throughput, and in the same time without increasing the interference to the GSM network. By utilizing the cell coverage condition, combined with the spatial traffic demand distribution, the optimal centre frequency position for the additional LTE spectrum can be found. This creates a highly flexible and efficient LTE carrier selection in the shared spectrum domain.
Based on the SEMAFOUR investigations it is less recommended to deploy intra-RAT DSA in LTE macro cellular networks with the purpose of increasing system throughputs. We recommend using Inter-RAT DSA. The Inter-RAT DSA SON algorithm requires only pre-processed data regarding the estimated inter-cell interference contribution between GSM and LTE cells without any knowledge of the traffic demand distribution in the hotspot cell or its surroundings. This makes it easy to implement the algorithm in a real network as it is sufficient to observe/measure the LTE and GSM cell traffic load of each cell along with its most interfered GSM and LTE surrounding cells while knowing the possible inter-cell interference impact based on radio-propagation and planning analysis (i.e. in the pre-processing step). There are three main links to other SEMAFOUR research activities. For AAS (Section 3.6), the interaction with the LTE/GSM DSA SON functionalities is relevant in deployment scenarios where the secondary LTE carrier (re-allocated from GSM by the DSA algorithm) uses re-configurable antenna systems, thus its performance can be further fine tuned compared to the presented LTE/GSM DSA studies. The interaction of LTE/Wi-Fi Traffic Steering (Section 3.4) with the LTE/GSM DSA is relevant when Wi-Fi access points are deployed in the coverage area of the macro cell(s) where GSM spectrum is re-allocated to LTE via DSA SON. This impacts if and where a secondary LTE carrier has to be activated and its required bandwidth. Last, DSS (Section 4) can also incorporate DSA as one of the network enhancement techniques to be deployed when LTE capacity becomes insufficient in certain areas.
3.4 Multi-Layer LTE / Wi-Fi Traffic Steering
3.4.1 Introduction Mobile Network Operators (MNOs) are deploying carrier-grade Wireless Local Area Network (WLAN) as an important complementary system to cellular networks. Access network selection between cellular and WLAN is an essential component to improve network performance and user experience via controlled loading of these systems. In the emerging heterogeneous networks characterized by different cell sizes and diverse WLAN deployments, automatic tuning of the network selection functionality plays a crucial role. To this end, the SEMAFOUR WP4 multi-layer LTE/Wi-Fi Traffic Steering use case has investigated SON functions for tuning the access network selection and traffic steering between the Long Term Evolution (LTE) and WLAN systems [26]. That is, the steering of users between LTE macro/micro base stations and Wi-Fi Access Points (APs) according to the dynamic fluctuations of e.g. network loading, radio link quality, and experienced QoS. A simplified illustration is shown in Figure 25. The targeted mechanisms aim at improving the end user experience and network performance by means of efficient utilization of both Wi-Fi as well as cellular network assets. The design, development, and assessment of LTE/Wi-Fi SON-based Traffic Steering (TS) solutions have been extensively described in SEMAFOUR WP4 Deliverables 4.1 [21], 4.2 [22], and 4.3 [23]. In this section, we present an overview of the TS SON studies, the key insights and final recommendations based on the tradeoff between the achievable performance gains and the additional network complexity required to enable those gains.
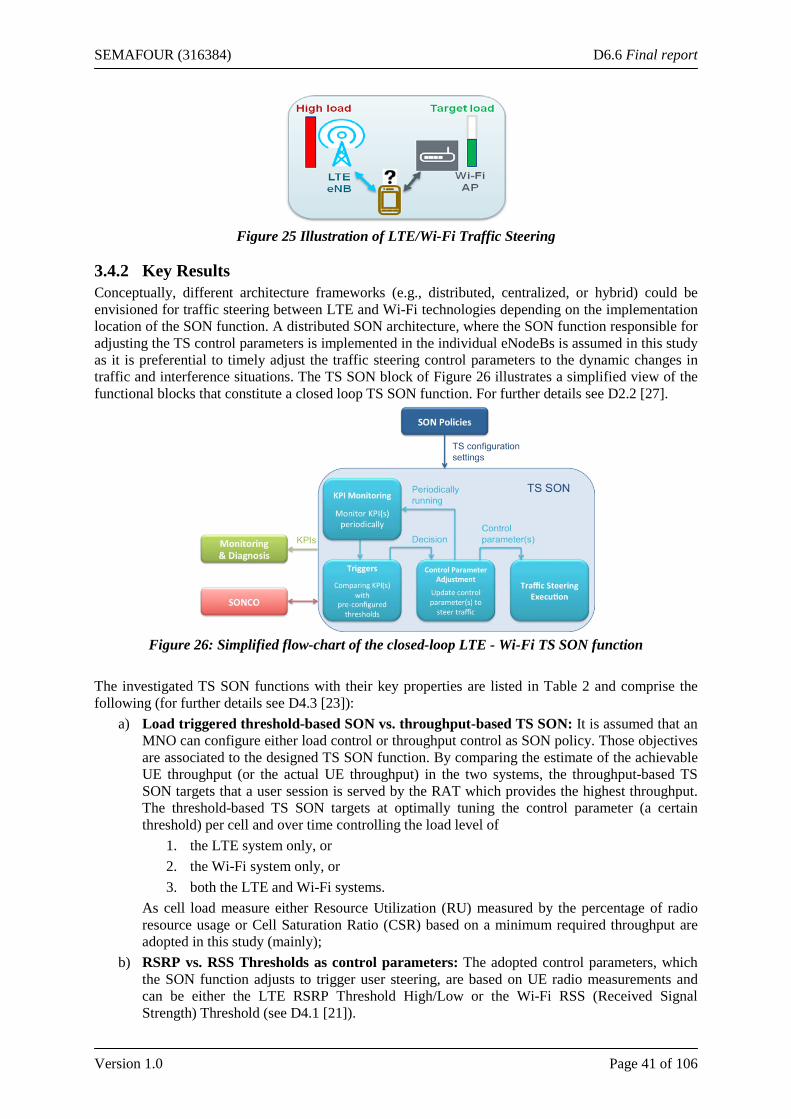
SEMAFOUR (316384) D6.6 Final report
Version 1.0 Page 41 of 106
Figure 25 Illustration of LTE/Wi-Fi Traffic Steering
3.4.2 Key Results Conceptually, different architecture frameworks (e.g., distributed, centralized, or hybrid) could be envisioned for traffic steering between LTE and Wi-Fi technologies depending on the implementation location of the SON function. A distributed SON architecture, where the SON function responsible for adjusting the TS control parameters is implemented in the individual eNodeBs is assumed in this study as it is preferential to timely adjust the traffic steering control parameters to the dynamic changes in traffic and interference situations. The TS SON block of Figure 26 illustrates a simplified view of the functional blocks that constitute a closed loop TS SON function. For further details see D2.2 [27].
Figure 26: Simplified flow-chart of the closed-loop LTE - Wi-Fi TS SON function
The investigated TS SON functions with their key properties are listed in Table 2 and comprise the following (for further details see D4.3 [23]):
a) Load triggered threshold-based SON vs. throughput-based TS SON: It is assumed that an MNO can configure either load control or throughput control as SON policy. Those objectives are associated to the designed TS SON function. By comparing the estimate of the achievable UE throughput (or the actual UE throughput) in the two systems, the throughput-based TS SON targets that a user session is served by the RAT which provides the highest throughput. The threshold-based TS SON targets at optimally tuning the control parameter (a certain threshold) per cell and over time controlling the load level of
1. the LTE system only, or 2. the Wi-Fi system only, or 3. both the LTE and Wi-Fi systems.
As cell load measure either Resource Utilization (RU) measured by the percentage of radio resource usage or Cell Saturation Ratio (CSR) based on a minimum required throughput are adopted in this study (mainly);
b) RSRP vs. RSS Thresholds as control parameters: The adopted control parameters, which the SON function adjusts to trigger user steering, are based on UE radio measurements and can be either the LTE RSRP Threshold High/Low or the Wi-Fi RSS (Received Signal Strength) Threshold (see D4.1 [21]).
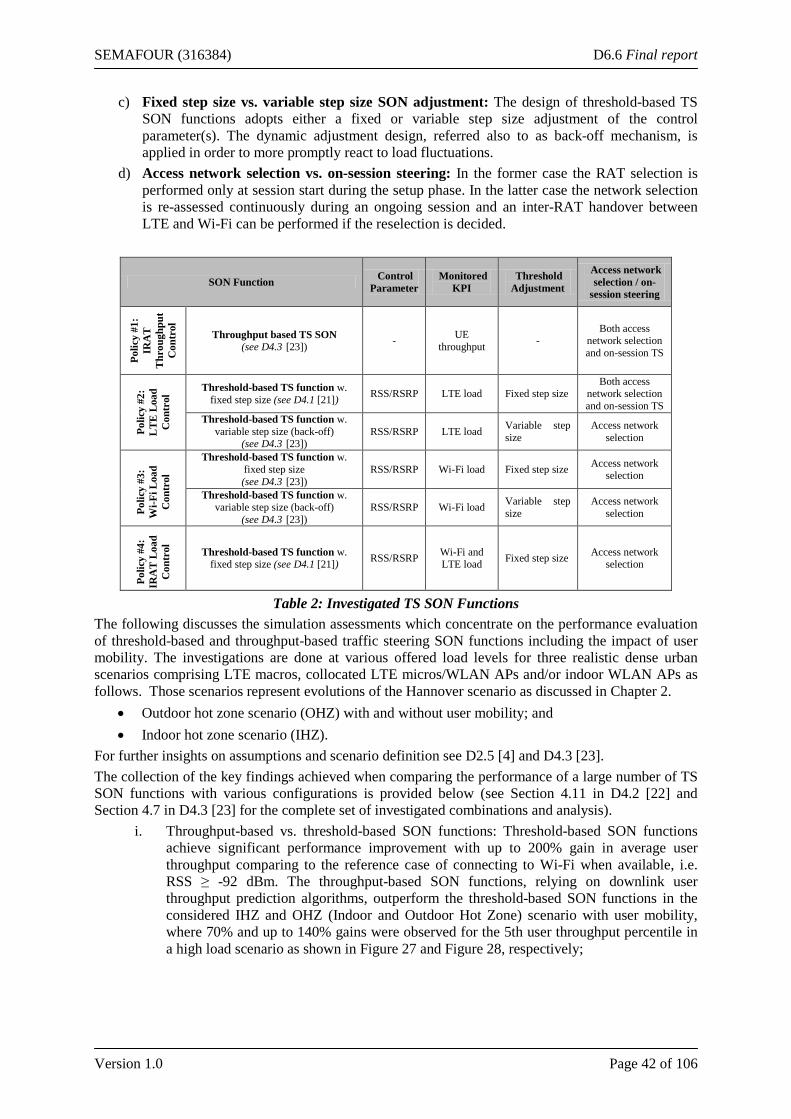
SEMAFOUR (316384) D6.6 Final report
Version 1.0 Page 42 of 106
c) Fixed step size vs. variable step size SON adjustment: The design of threshold-based TS SON functions adopts either a fixed or variable step size adjustment of the control parameter(s). The dynamic adjustment design, referred also to as back-off mechanism, is applied in order to more promptly react to load fluctuations.
d) Access network selection vs. on-session steering: In the former case the RAT selection is performed only at session start during the setup phase. In the latter case the network selection is re-assessed continuously during an ongoing session and an inter-RAT handover between LTE and Wi-Fi can be performed if the reselection is decided.
SON Function Control Parameter
Monitored KPI
Threshold Adjustment
Access network selection / on-
session steering
Polic
y #1
: IR
AT
T
hrou
ghpu
t C
ontr
ol
Throughput based TS SON (see D4.3 [23]) - UE
throughput - Both access
network selection and on-session TS
Polic
y #2
: L
TE L
oad
C
ontr
ol Threshold-based TS function w.
fixed step size (see D4.1 [21]) RSS/RSRP LTE load Fixed step size Both access
network selection and on-session TS
Threshold-based TS function w. variable step size (back-off)
(see D4.3 [23]) RSS/RSRP LTE load Variable step
size Access network
selection
Polic
y #3
: W
i-Fi L
oad
C
ontr
ol
Threshold-based TS function w. fixed step size (see D4.3 [23])
RSS/RSRP Wi-Fi load Fixed step size Access network selection
Threshold-based TS function w. variable step size (back-off)
(see D4.3 [23]) RSS/RSRP Wi-Fi load Variable step
size Access network
selection
Polic
y #4
: IR
AT
Loa
d C
ontr
ol
Threshold-based TS function w. fixed step size (see D4.1 [21]) RSS/RSRP Wi-Fi and
LTE load Fixed step size Access network selection
Table 2: Investigated TS SON Functions The following discusses the simulation assessments which concentrate on the performance evaluation of threshold-based and throughput-based traffic steering SON functions including the impact of user mobility. The investigations are done at various offered load levels for three realistic dense urban scenarios comprising LTE macros, collocated LTE micros/WLAN APs and/or indoor WLAN APs as follows. Those scenarios represent evolutions of the Hannover scenario as discussed in Chapter 2.
• Outdoor hot zone scenario (OHZ) with and without user mobility; and • Indoor hot zone scenario (IHZ).
For further insights on assumptions and scenario definition see D2.5 [4] and D4.3 [23]. The collection of the key findings achieved when comparing the performance of a large number of TS SON functions with various configurations is provided below (see Section 4.11 in D4.2 [22] and Section 4.7 in D4.3 [23] for the complete set of investigated combinations and analysis).
i. Throughput-based vs. threshold-based SON functions: Threshold-based SON functions achieve significant performance improvement with up to 200% gain in average user throughput comparing to the reference case of connecting to Wi-Fi when available, i.e. RSS ≥ -92 dBm. The throughput-based SON functions, relying on downlink user throughput prediction algorithms, outperform the threshold-based SON functions in the considered IHZ and OHZ (Indoor and Outdoor Hot Zone) scenario with user mobility, where 70% and up to 140% gains were observed for the 5th user throughput percentile in a high load scenario as shown in Figure 27 and Figure 28, respectively;
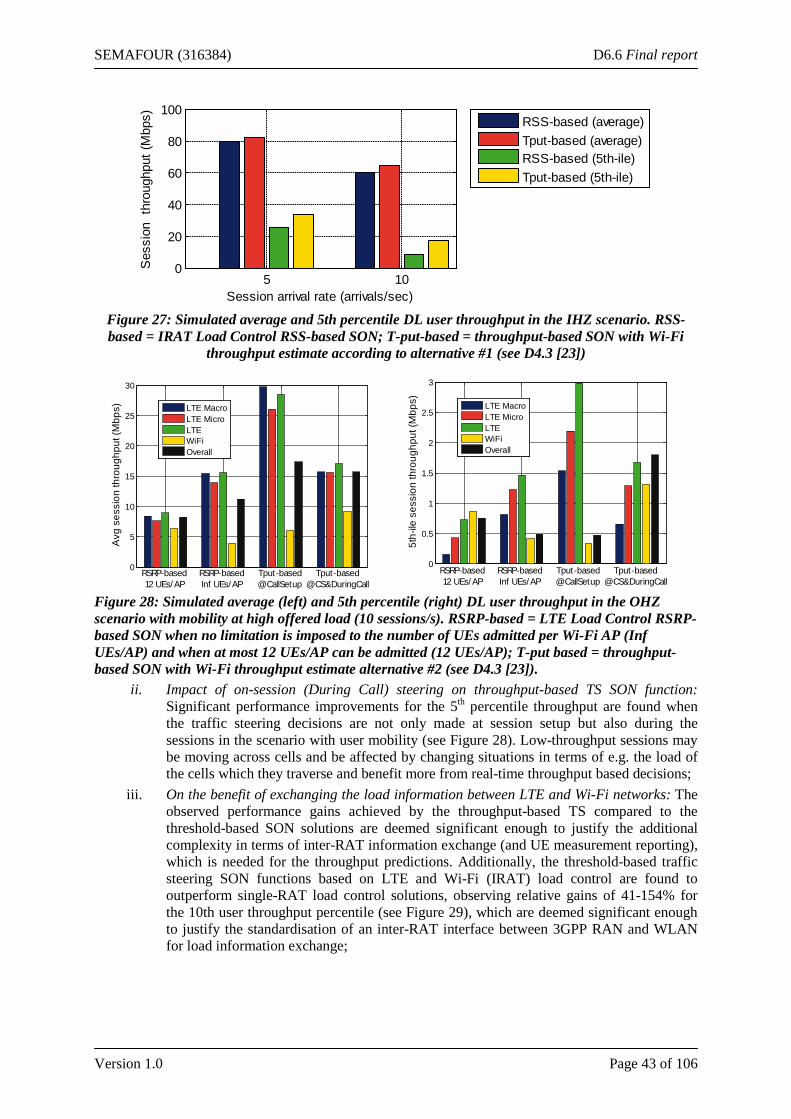
SEMAFOUR (316384) D6.6 Final report
Version 1.0 Page 43 of 106
Figure 27: Simulated average and 5th percentile DL user throughput in the IHZ scenario. RSS-based = IRAT Load Control RSS-based SON; T-put-based = throughput-based SON with Wi-Fi
throughput estimate according to alternative #1 (see D4.3 [23])
Figure 28: Simulated average (left) and 5th percentile (right) DL user throughput in the OHZ scenario with mobility at high offered load (10 sessions/s). RSRP-based = LTE Load Control RSRP-based SON when no limitation is imposed to the number of UEs admitted per Wi-Fi AP (Inf UEs/AP) and when at most 12 UEs/AP can be admitted (12 UEs/AP); T-put based = throughput-based SON with Wi-Fi throughput estimate alternative #2 (see D4.3 [23]).
ii. Impact of on-session (During Call) steering on throughput-based TS SON function: Significant performance improvements for the 5th percentile throughput are found when the traffic steering decisions are not only made at session setup but also during the sessions in the scenario with user mobility (see Figure 28). Low-throughput sessions may be moving across cells and be affected by changing situations in terms of e.g. the load of the cells which they traverse and benefit more from real-time throughput based decisions;
iii. On the benefit of exchanging the load information between LTE and Wi-Fi networks: The observed performance gains achieved by the throughput-based TS compared to the threshold-based SON solutions are deemed significant enough to justify the additional complexity in terms of inter-RAT information exchange (and UE measurement reporting), which is needed for the throughput predictions. Additionally, the threshold-based traffic steering SON functions based on LTE and Wi-Fi (IRAT) load control are found to outperform single-RAT load control solutions, observing relative gains of 41-154% for the 10th user throughput percentile (see Figure 29), which are deemed significant enough to justify the standardisation of an inter-RAT interface between 3GPP RAN and WLAN for load information exchange;
5 100
20
40
60
80
100
Session arrival rate (arrivals/sec)
Ses
sion
thr
ough
put (
Mbp
s)
RSS-based (average)Tput-based (average)RSS-based (5th-ile)Tput-based (5th-ile)
0
5
10
15
20
25
30
Avg
ses
sion
thro
ughp
ut (M
bps)
RSRP-based12 UEs/AP
RSRP-basedInf UEs/AP
Tput-based@CallSetup
Tput-based@CS&DuringCall
LTE MacroLTE MicroLTEWiFiOverall
0
0.5
1
1.5
2
2.5
3
5th-
ile s
essi
on th
roug
hput
(Mbp
s)
RSRP-based12 UEs/AP
RSRP-basedInf UEs/AP
Tput-based@CallSetup
Tput-based@CS&DuringCall
LTE MacroLTE MicroLTEWiFiOverall
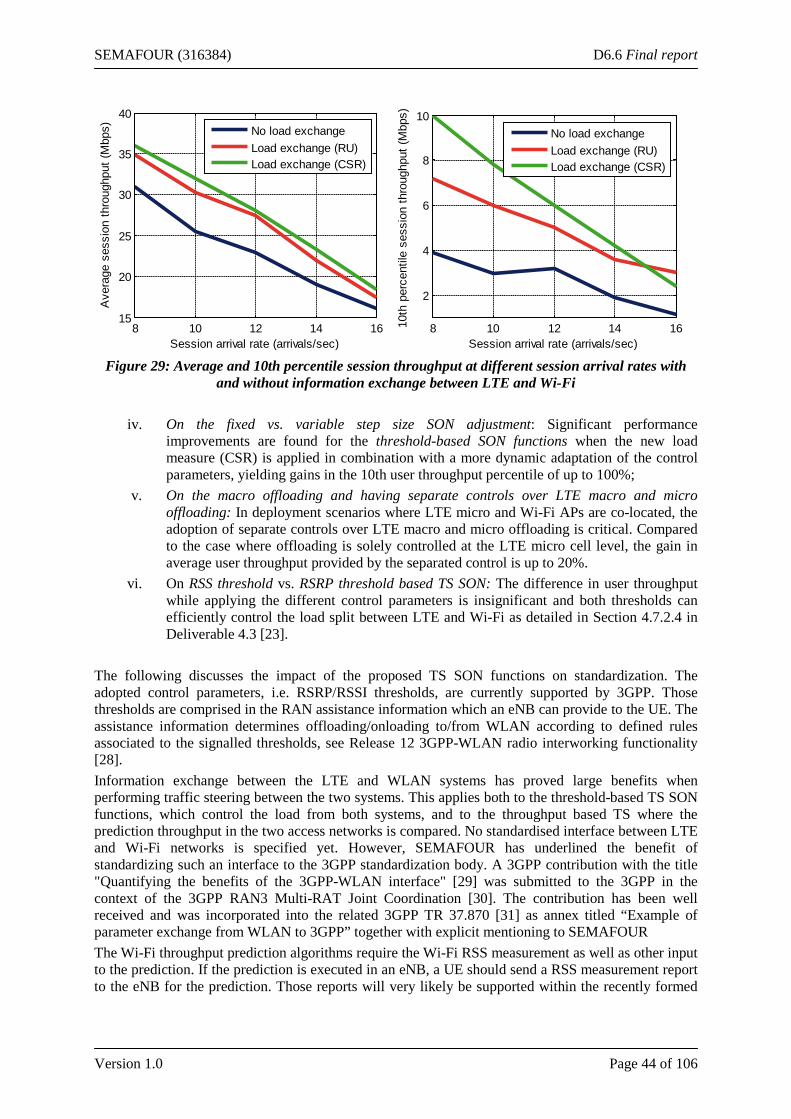
SEMAFOUR (316384) D6.6 Final report
Version 1.0 Page 44 of 106
Figure 29: Average and 10th percentile session throughput at different session arrival rates with
and without information exchange between LTE and Wi-Fi
iv. On the fixed vs. variable step size SON adjustment: Significant performance improvements are found for the threshold-based SON functions when the new load measure (CSR) is applied in combination with a more dynamic adaptation of the control parameters, yielding gains in the 10th user throughput percentile of up to 100%;
v. On the macro offloading and having separate controls over LTE macro and micro offloading: In deployment scenarios where LTE micro and Wi-Fi APs are co-located, the adoption of separate controls over LTE macro and micro offloading is critical. Compared to the case where offloading is solely controlled at the LTE micro cell level, the gain in average user throughput provided by the separated control is up to 20%.
vi. On RSS threshold vs. RSRP threshold based TS SON: The difference in user throughput while applying the different control parameters is insignificant and both thresholds can efficiently control the load split between LTE and Wi-Fi as detailed in Section 4.7.2.4 in Deliverable 4.3 [23].
The following discusses the impact of the proposed TS SON functions on standardization. The adopted control parameters, i.e. RSRP/RSSI thresholds, are currently supported by 3GPP. Those thresholds are comprised in the RAN assistance information which an eNB can provide to the UE. The assistance information determines offloading/onloading to/from WLAN according to defined rules associated to the signalled thresholds, see Release 12 3GPP-WLAN radio interworking functionality [28]. Information exchange between the LTE and WLAN systems has proved large benefits when performing traffic steering between the two systems. This applies both to the threshold-based TS SON functions, which control the load from both systems, and to the throughput based TS where the prediction throughput in the two access networks is compared. No standardised interface between LTE and Wi-Fi networks is specified yet. However, SEMAFOUR has underlined the benefit of standardizing such an interface to the 3GPP standardization body. A 3GPP contribution with the title "Quantifying the benefits of the 3GPP-WLAN interface" [29] was submitted to the 3GPP in the context of the 3GPP RAN3 Multi-RAT Joint Coordination [30]. The contribution has been well received and was incorporated into the related 3GPP TR 37.870 [31] as annex titled “Example of parameter exchange from WLAN to 3GPP” together with explicit mentioning to SEMAFOUR The Wi-Fi throughput prediction algorithms require the Wi-Fi RSS measurement as well as other input to the prediction. If the prediction is executed in an eNB, a UE should send a RSS measurement report to the eNB for the prediction. Those reports will very likely be supported within the recently formed
8 10 12 14 1615
20
25
30
35
40
Session arrival rate (arrivals/sec)
Ave
rage
ses
sion
thro
ughp
ut (M
bps)
No load exchangeLoad exchange (RU)Load exchange (CSR)
8 10 12 14 16
2
4
6
8
10
Session arrival rate (arrivals/sec)
10th
per
cent
ile s
essi
on th
roug
hput
(Mbp
s)
No load exchangeLoad exchange (RU)Load exchange (CSR)
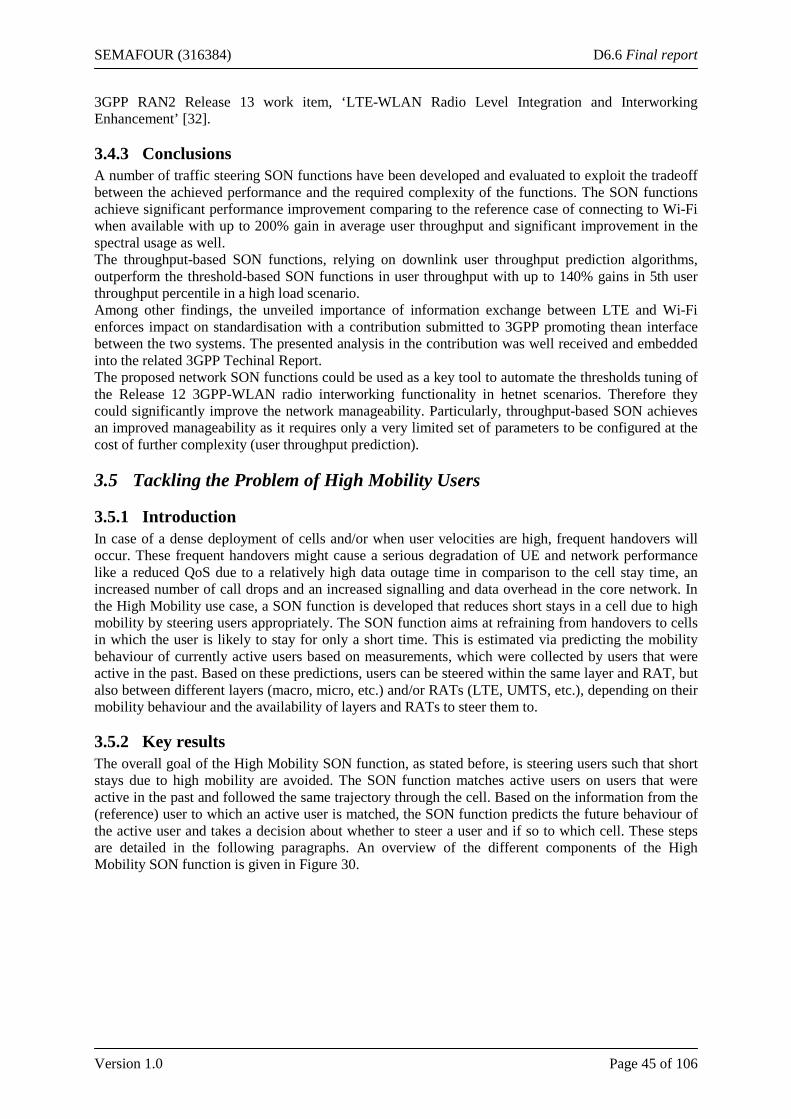
SEMAFOUR (316384) D6.6 Final report
Version 1.0 Page 45 of 106
3GPP RAN2 Release 13 work item, ‘LTE-WLAN Radio Level Integration and Interworking Enhancement’ [32].
3.4.3 Conclusions A number of traffic steering SON functions have been developed and evaluated to exploit the tradeoff between the achieved performance and the required complexity of the functions. The SON functions achieve significant performance improvement comparing to the reference case of connecting to Wi-Fi when available with up to 200% gain in average user throughput and significant improvement in the spectral usage as well. The throughput-based SON functions, relying on downlink user throughput prediction algorithms, outperform the threshold-based SON functions in user throughput with up to 140% gains in 5th user throughput percentile in a high load scenario. Among other findings, the unveiled importance of information exchange between LTE and Wi-Fi enforces impact on standardisation with a contribution submitted to 3GPP promoting thean interface between the two systems. The presented analysis in the contribution was well received and embedded into the related 3GPP Techinal Report. The proposed network SON functions could be used as a key tool to automate the thresholds tuning of the Release 12 3GPP-WLAN radio interworking functionality in hetnet scenarios. Therefore they could significantly improve the network manageability. Particularly, throughput-based SON achieves an improved manageability as it requires only a very limited set of parameters to be configured at the cost of further complexity (user throughput prediction).
3.5 Tackling the Problem of High Mobility Users
3.5.1 Introduction In case of a dense deployment of cells and/or when user velocities are high, frequent handovers will occur. These frequent handovers might cause a serious degradation of UE and network performance like a reduced QoS due to a relatively high data outage time in comparison to the cell stay time, an increased number of call drops and an increased signalling and data overhead in the core network. In the High Mobility use case, a SON function is developed that reduces short stays in a cell due to high mobility by steering users appropriately. The SON function aims at refraining from handovers to cells in which the user is likely to stay for only a short time. This is estimated via predicting the mobility behaviour of currently active users based on measurements, which were collected by users that were active in the past. Based on these predictions, users can be steered within the same layer and RAT, but also between different layers (macro, micro, etc.) and/or RATs (LTE, UMTS, etc.), depending on their mobility behaviour and the availability of layers and RATs to steer them to.
3.5.2 Key results The overall goal of the High Mobility SON function, as stated before, is steering users such that short stays due to high mobility are avoided. The SON function matches active users on users that were active in the past and followed the same trajectory through the cell. Based on the information from the (reference) user to which an active user is matched, the SON function predicts the future behaviour of the active user and takes a decision about whether to steer a user and if so to which cell. These steps are detailed in the following paragraphs. An overview of the different components of the High Mobility SON function is given in Figure 30.
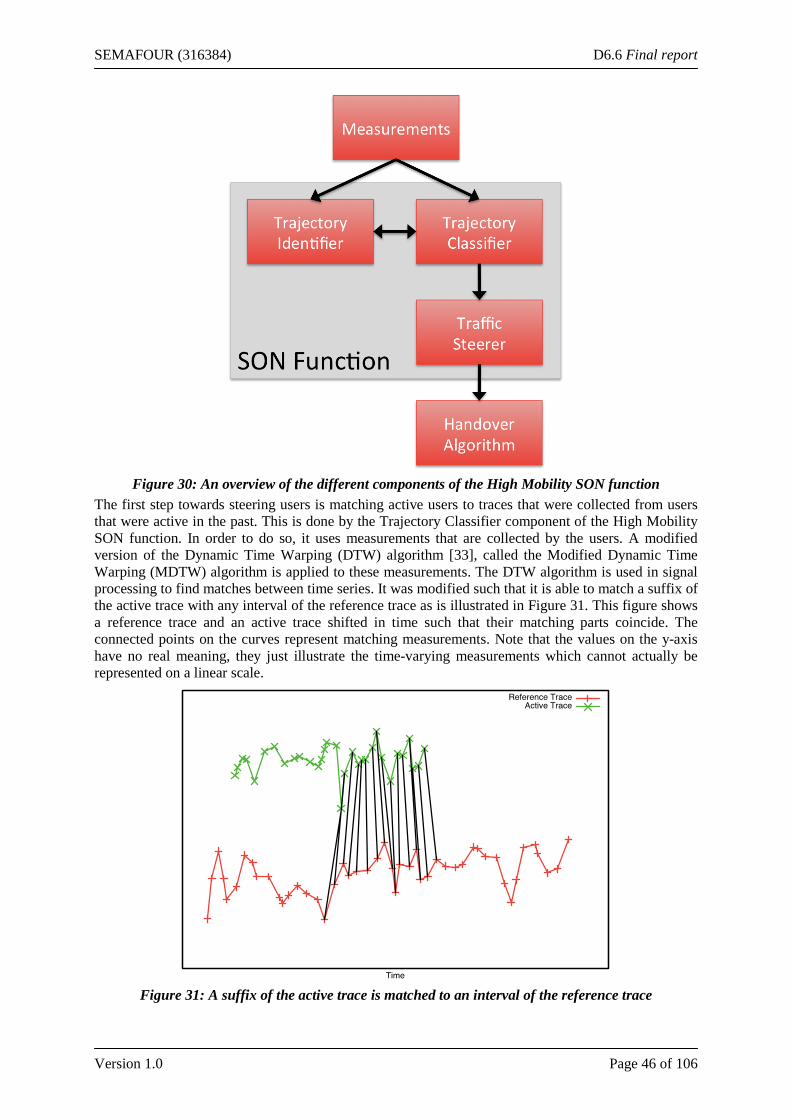
SEMAFOUR (316384) D6.6 Final report
Version 1.0 Page 46 of 106
Figure 30: An overview of the different components of the High Mobility SON function
The first step towards steering users is matching active users to traces that were collected from users that were active in the past. This is done by the Trajectory Classifier component of the High Mobility SON function. In order to do so, it uses measurements that are collected by the users. A modified version of the Dynamic Time Warping (DTW) algorithm [33], called the Modified Dynamic Time Warping (MDTW) algorithm is applied to these measurements. The DTW algorithm is used in signal processing to find matches between time series. It was modified such that it is able to match a suffix of the active trace with any interval of the reference trace as is illustrated in Figure 31. This figure shows a reference trace and an active trace shifted in time such that their matching parts coincide. The connected points on the curves represent matching measurements. Note that the values on the y-axis have no real meaning, they just illustrate the time-varying measurements which cannot actually be represented on a linear scale.
Figure 31: A suffix of the active trace is matched to an interval of the reference trace
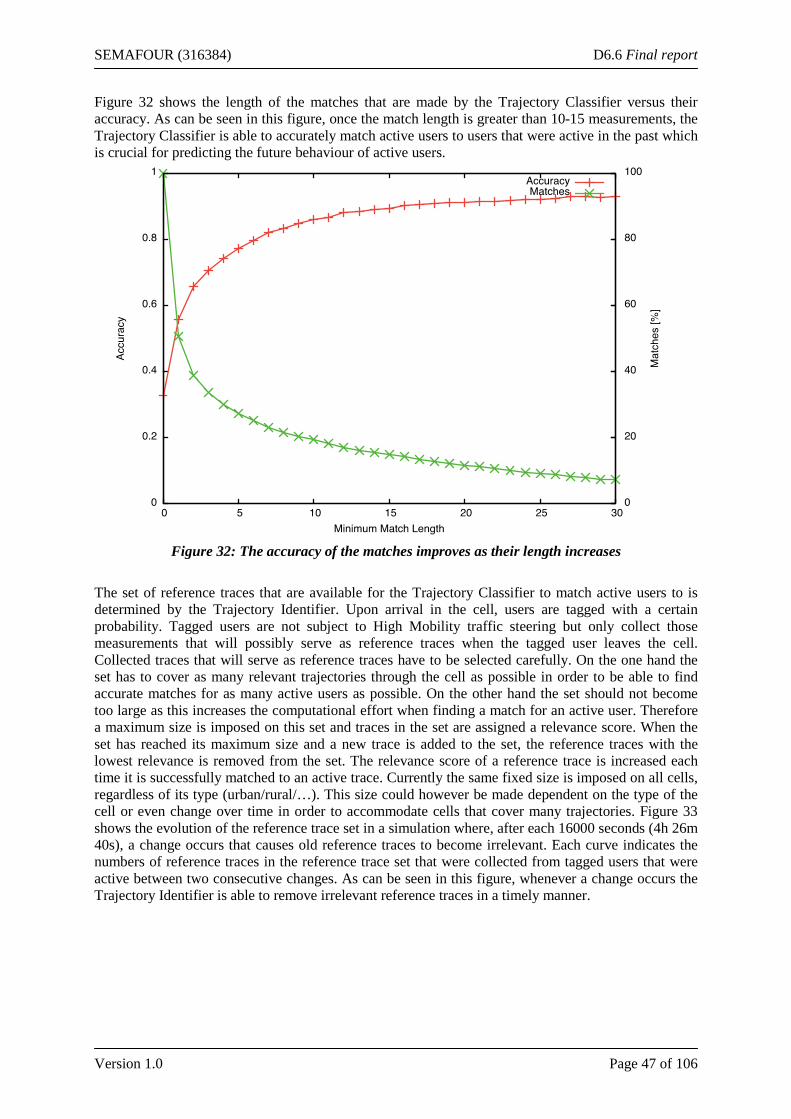
SEMAFOUR (316384) D6.6 Final report
Version 1.0 Page 47 of 106
Figure 32 shows the length of the matches that are made by the Trajectory Classifier versus their accuracy. As can be seen in this figure, once the match length is greater than 10-15 measurements, the Trajectory Classifier is able to accurately match active users to users that were active in the past which is crucial for predicting the future behaviour of active users.
Figure 32: The accuracy of the matches improves as their length increases
The set of reference traces that are available for the Trajectory Classifier to match active users to is determined by the Trajectory Identifier. Upon arrival in the cell, users are tagged with a certain probability. Tagged users are not subject to High Mobility traffic steering but only collect those measurements that will possibly serve as reference traces when the tagged user leaves the cell. Collected traces that will serve as reference traces have to be selected carefully. On the one hand the set has to cover as many relevant trajectories through the cell as possible in order to be able to find accurate matches for as many active users as possible. On the other hand the set should not become too large as this increases the computational effort when finding a match for an active user. Therefore a maximum size is imposed on this set and traces in the set are assigned a relevance score. When the set has reached its maximum size and a new trace is added to the set, the reference traces with the lowest relevance is removed from the set. The relevance score of a reference trace is increased each time it is successfully matched to an active trace. Currently the same fixed size is imposed on all cells, regardless of its type (urban/rural/…). This size could however be made dependent on the type of the cell or even change over time in order to accommodate cells that cover many trajectories. Figure 33 shows the evolution of the reference trace set in a simulation where, after each 16000 seconds (4h 26m 40s), a change occurs that causes old reference traces to become irrelevant. Each curve indicates the numbers of reference traces in the reference trace set that were collected from tagged users that were active between two consecutive changes. As can be seen in this figure, whenever a change occurs the Trajectory Identifier is able to remove irrelevant reference traces in a timely manner.
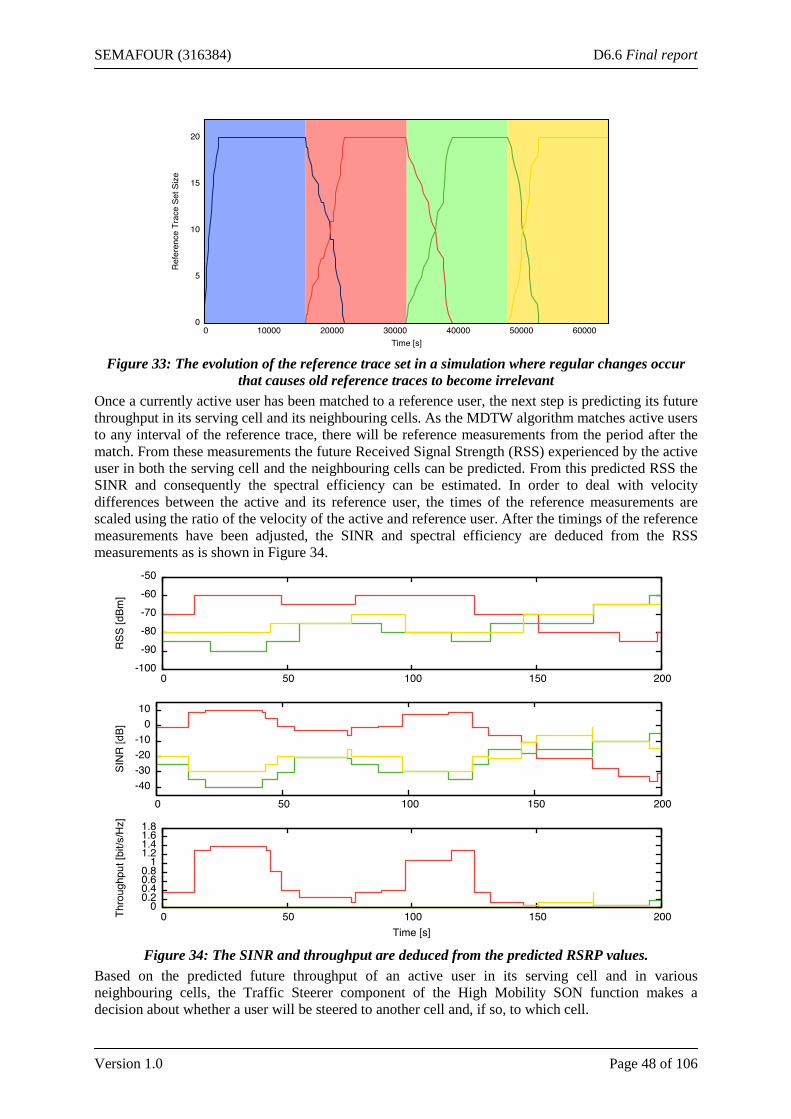
SEMAFOUR (316384) D6.6 Final report
Version 1.0 Page 48 of 106
Figure 33: The evolution of the reference trace set in a simulation where regular changes occur
that causes old reference traces to become irrelevant Once a currently active user has been matched to a reference user, the next step is predicting its future throughput in its serving cell and its neighbouring cells. As the MDTW algorithm matches active users to any interval of the reference trace, there will be reference measurements from the period after the match. From these measurements the future Received Signal Strength (RSS) experienced by the active user in both the serving cell and the neighbouring cells can be predicted. From this predicted RSS the SINR and consequently the spectral efficiency can be estimated. In order to deal with velocity differences between the active and its reference user, the times of the reference measurements are scaled using the ratio of the velocity of the active and reference user. After the timings of the reference measurements have been adjusted, the SINR and spectral efficiency are deduced from the RSS measurements as is shown in Figure 34.
Figure 34: The SINR and throughput are deduced from the predicted RSRP values.
Based on the predicted future throughput of an active user in its serving cell and in various neighbouring cells, the Traffic Steerer component of the High Mobility SON function makes a decision about whether a user will be steered to another cell and, if so, to which cell.
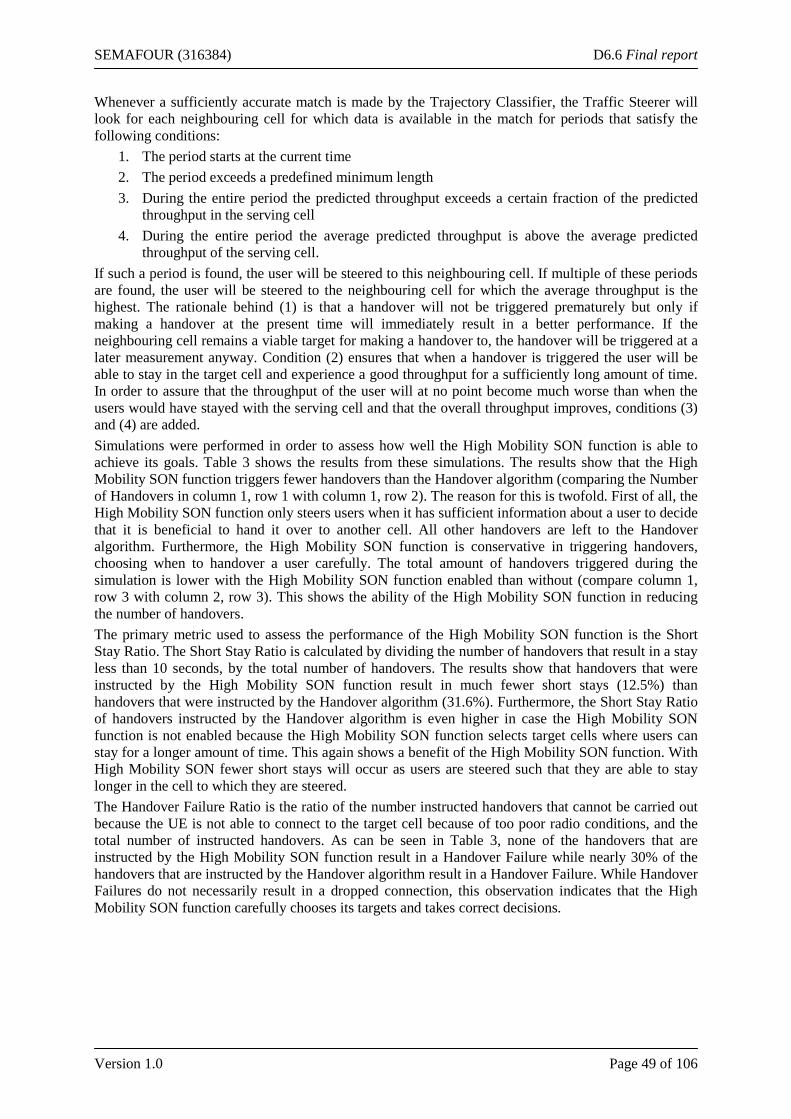
SEMAFOUR (316384) D6.6 Final report
Version 1.0 Page 49 of 106
Whenever a sufficiently accurate match is made by the Trajectory Classifier, the Traffic Steerer will look for each neighbouring cell for which data is available in the match for periods that satisfy the following conditions:
1. The period starts at the current time 2. The period exceeds a predefined minimum length 3. During the entire period the predicted throughput exceeds a certain fraction of the predicted
throughput in the serving cell 4. During the entire period the average predicted throughput is above the average predicted
throughput of the serving cell. If such a period is found, the user will be steered to this neighbouring cell. If multiple of these periods are found, the user will be steered to the neighbouring cell for which the average throughput is the highest. The rationale behind (1) is that a handover will not be triggered prematurely but only if making a handover at the present time will immediately result in a better performance. If the neighbouring cell remains a viable target for making a handover to, the handover will be triggered at a later measurement anyway. Condition (2) ensures that when a handover is triggered the user will be able to stay in the target cell and experience a good throughput for a sufficiently long amount of time. In order to assure that the throughput of the user will at no point become much worse than when the users would have stayed with the serving cell and that the overall throughput improves, conditions (3) and (4) are added. Simulations were performed in order to assess how well the High Mobility SON function is able to achieve its goals. Table 3 shows the results from these simulations. The results show that the High Mobility SON function triggers fewer handovers than the Handover algorithm (comparing the Number of Handovers in column 1, row 1 with column 1, row 2). The reason for this is twofold. First of all, the High Mobility SON function only steers users when it has sufficient information about a user to decide that it is beneficial to hand it over to another cell. All other handovers are left to the Handover algorithm. Furthermore, the High Mobility SON function is conservative in triggering handovers, choosing when to handover a user carefully. The total amount of handovers triggered during the simulation is lower with the High Mobility SON function enabled than without (compare column 1, row 3 with column 2, row 3). This shows the ability of the High Mobility SON function in reducing the number of handovers. The primary metric used to assess the performance of the High Mobility SON function is the Short Stay Ratio. The Short Stay Ratio is calculated by dividing the number of handovers that result in a stay less than 10 seconds, by the total number of handovers. The results show that handovers that were instructed by the High Mobility SON function result in much fewer short stays (12.5%) than handovers that were instructed by the Handover algorithm (31.6%). Furthermore, the Short Stay Ratio of handovers instructed by the Handover algorithm is even higher in case the High Mobility SON function is not enabled because the High Mobility SON function selects target cells where users can stay for a longer amount of time. This again shows a benefit of the High Mobility SON function. With High Mobility SON fewer short stays will occur as users are steered such that they are able to stay longer in the cell to which they are steered. The Handover Failure Ratio is the ratio of the number instructed handovers that cannot be carried out because the UE is not able to connect to the target cell because of too poor radio conditions, and the total number of instructed handovers. As can be seen in Table 3, none of the handovers that are instructed by the High Mobility SON function result in a Handover Failure while nearly 30% of the handovers that are instructed by the Handover algorithm result in a Handover Failure. While Handover Failures do not necessarily result in a dropped connection, this observation indicates that the High Mobility SON function carefully chooses its targets and takes correct decisions.
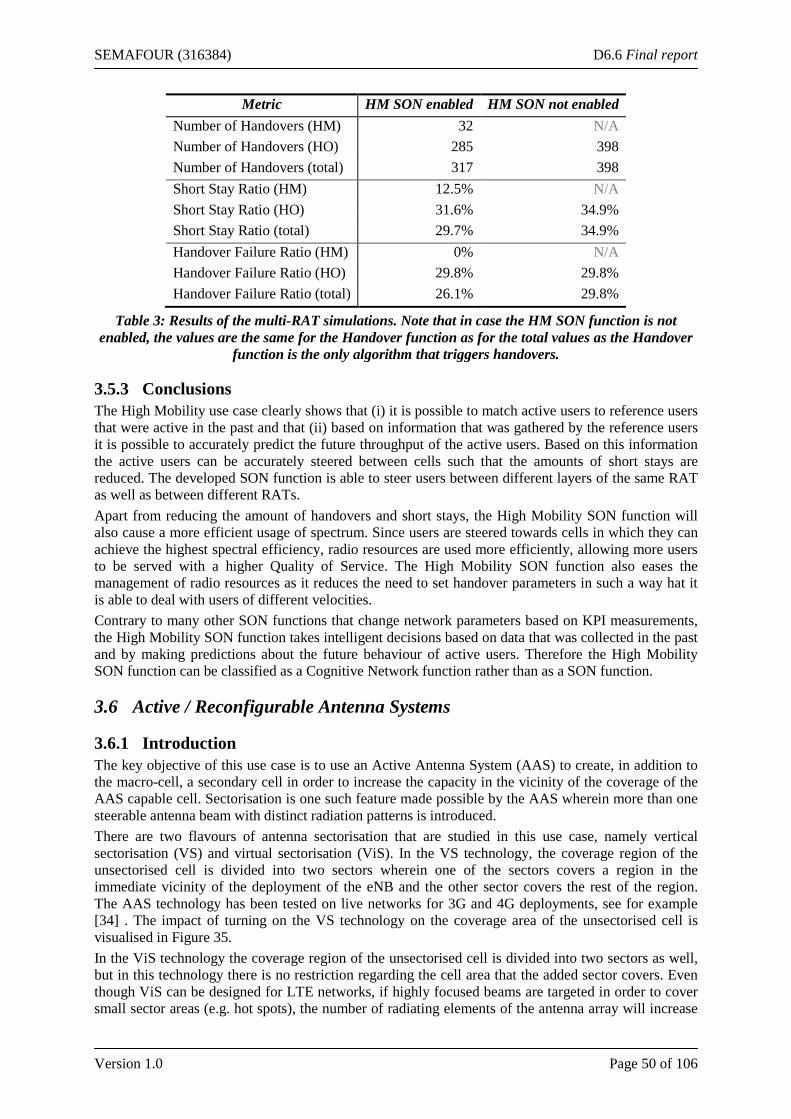
SEMAFOUR (316384) D6.6 Final report
Version 1.0 Page 50 of 106
Metric HM SON enabled HM SON not enabled Number of Handovers (HM) 32 N/A Number of Handovers (HO) 285 398 Number of Handovers (total) 317 398 Short Stay Ratio (HM) 12.5% N/A Short Stay Ratio (HO) 31.6% 34.9% Short Stay Ratio (total) 29.7% 34.9% Handover Failure Ratio (HM) 0% N/A Handover Failure Ratio (HO) 29.8% 29.8% Handover Failure Ratio (total) 26.1% 29.8%
Table 3: Results of the multi-RAT simulations. Note that in case the HM SON function is not enabled, the values are the same for the Handover function as for the total values as the Handover
function is the only algorithm that triggers handovers.
3.5.3 Conclusions The High Mobility use case clearly shows that (i) it is possible to match active users to reference users that were active in the past and that (ii) based on information that was gathered by the reference users it is possible to accurately predict the future throughput of the active users. Based on this information the active users can be accurately steered between cells such that the amounts of short stays are reduced. The developed SON function is able to steer users between different layers of the same RAT as well as between different RATs. Apart from reducing the amount of handovers and short stays, the High Mobility SON function will also cause a more efficient usage of spectrum. Since users are steered towards cells in which they can achieve the highest spectral efficiency, radio resources are used more efficiently, allowing more users to be served with a higher Quality of Service. The High Mobility SON function also eases the management of radio resources as it reduces the need to set handover parameters in such a way hat it is able to deal with users of different velocities. Contrary to many other SON functions that change network parameters based on KPI measurements, the High Mobility SON function takes intelligent decisions based on data that was collected in the past and by making predictions about the future behaviour of active users. Therefore the High Mobility SON function can be classified as a Cognitive Network function rather than as a SON function.
3.6 Active / Reconfigurable Antenna Systems
3.6.1 Introduction The key objective of this use case is to use an Active Antenna System (AAS) to create, in addition to the macro-cell, a secondary cell in order to increase the capacity in the vicinity of the coverage of the AAS capable cell. Sectorisation is one such feature made possible by the AAS wherein more than one steerable antenna beam with distinct radiation patterns is introduced. There are two flavours of antenna sectorisation that are studied in this use case, namely vertical sectorisation (VS) and virtual sectorisation (ViS). In the VS technology, the coverage region of the unsectorised cell is divided into two sectors wherein one of the sectors covers a region in the immediate vicinity of the deployment of the eNB and the other sector covers the rest of the region. The AAS technology has been tested on live networks for 3G and 4G deployments, see for example [34] . The impact of turning on the VS technology on the coverage area of the unsectorised cell is visualised in Figure 35. In the ViS technology the coverage region of the unsectorised cell is divided into two sectors as well, but in this technology there is no restriction regarding the cell area that the added sector covers. Even though ViS can be designed for LTE networks, if highly focused beams are targeted in order to cover small sector areas (e.g. hot spots), the number of radiating elements of the antenna array will increase
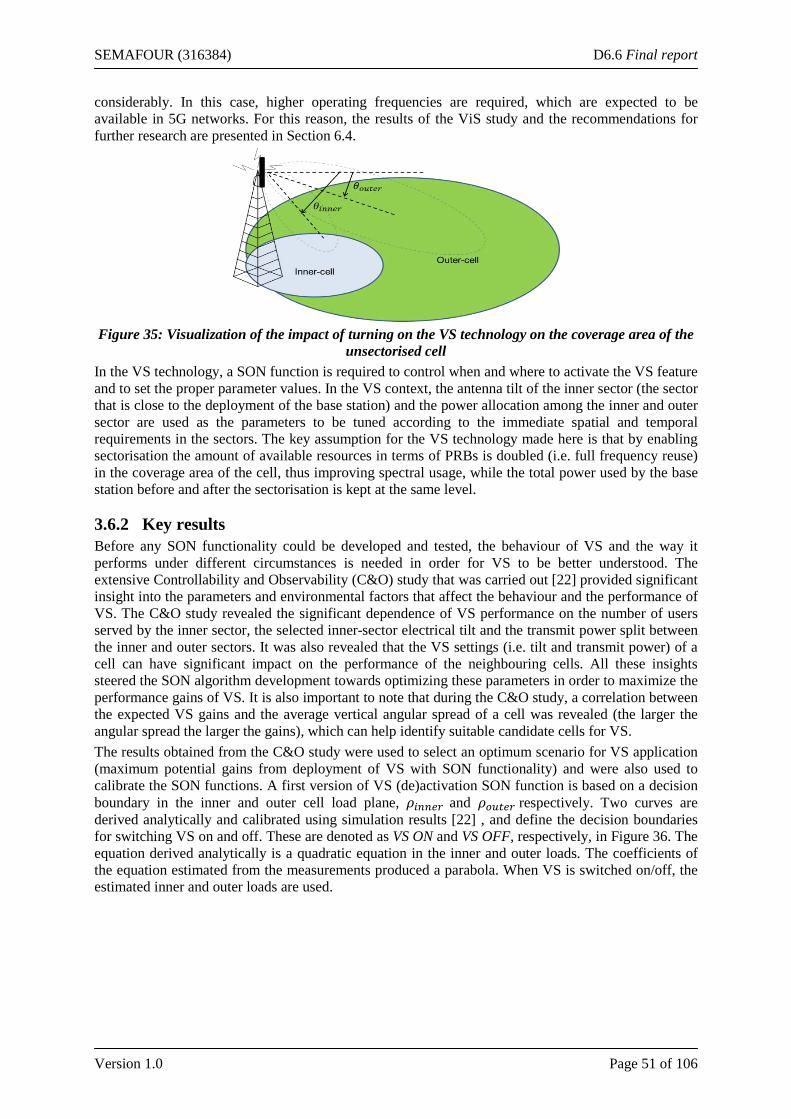
SEMAFOUR (316384) D6.6 Final report
Version 1.0 Page 51 of 106
considerably. In this case, higher operating frequencies are required, which are expected to be available in 5G networks. For this reason, the results of the ViS study and the recommendations for further research are presented in Section 6.4.
Figure 35: Visualization of the impact of turning on the VS technology on the coverage area of the
unsectorised cell In the VS technology, a SON function is required to control when and where to activate the VS feature and to set the proper parameter values. In the VS context, the antenna tilt of the inner sector (the sector that is close to the deployment of the base station) and the power allocation among the inner and outer sector are used as the parameters to be tuned according to the immediate spatial and temporal requirements in the sectors. The key assumption for the VS technology made here is that by enabling sectorisation the amount of available resources in terms of PRBs is doubled (i.e. full frequency reuse) in the coverage area of the cell, thus improving spectral usage, while the total power used by the base station before and after the sectorisation is kept at the same level.
3.6.2 Key results Before any SON functionality could be developed and tested, the behaviour of VS and the way it performs under different circumstances is needed in order for VS to be better understood. The extensive Controllability and Observability (C&O) study that was carried out [22] provided significant insight into the parameters and environmental factors that affect the behaviour and the performance of VS. The C&O study revealed the significant dependence of VS performance on the number of users served by the inner sector, the selected inner-sector electrical tilt and the transmit power split between the inner and outer sectors. It was also revealed that the VS settings (i.e. tilt and transmit power) of a cell can have significant impact on the performance of the neighbouring cells. All these insights steered the SON algorithm development towards optimizing these parameters in order to maximize the performance gains of VS. It is also important to note that during the C&O study, a correlation between the expected VS gains and the average vertical angular spread of a cell was revealed (the larger the angular spread the larger the gains), which can help identify suitable candidate cells for VS. The results obtained from the C&O study were used to select an optimum scenario for VS application (maximum potential gains from deployment of VS with SON functionality) and were also used to calibrate the SON functions. A first version of VS (de)activation SON function is based on a decision boundary in the inner and outer cell load plane, 𝜌𝑖𝑛𝑛𝑒𝑟 and 𝜌𝑜𝑢𝑡𝑒𝑟 respectively. Two curves are derived analytically and calibrated using simulation results [22] , and define the decision boundaries for switching VS on and off. These are denoted as VS ON and VS OFF, respectively, in Figure 36. The equation derived analytically is a quadratic equation in the inner and outer loads. The coefficients of the equation estimated from the measurements produced a parabola. When VS is switched on/off, the estimated inner and outer loads are used.
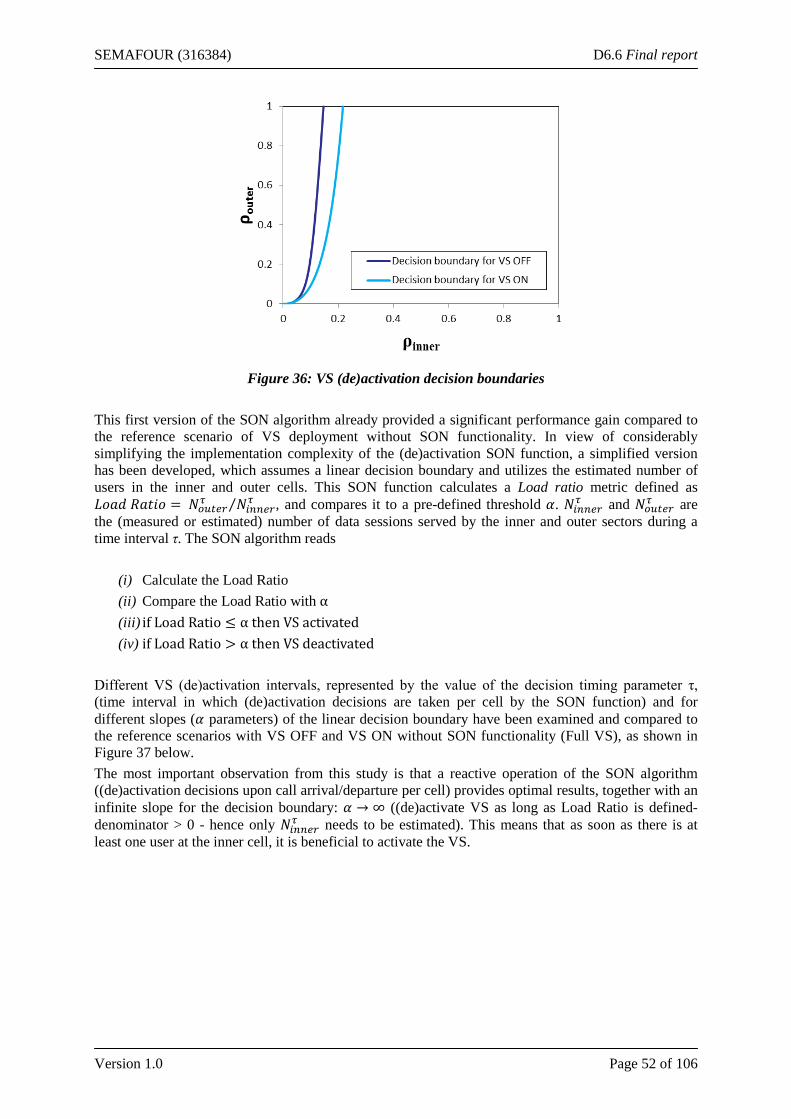
SEMAFOUR (316384) D6.6 Final report
Version 1.0 Page 52 of 106
Figure 36: VS (de)activation decision boundaries
This first version of the SON algorithm already provided a significant performance gain compared to the reference scenario of VS deployment without SON functionality. In view of considerably simplifying the implementation complexity of the (de)activation SON function, a simplified version has been developed, which assumes a linear decision boundary and utilizes the estimated number of users in the inner and outer cells. This SON function calculates a Load ratio metric defined as 𝐿𝑜𝑎𝑑 𝑅𝑎𝑡𝑖𝑜 = 𝑁𝑜𝑢𝑡𝑒𝑟𝜏 𝑁𝑖𝑛𝑛𝑒𝑟𝜏⁄ , and compares it to a pre-defined threshold 𝛼. 𝑁𝑖𝑛𝑛𝑒𝑟𝜏 and 𝑁𝑜𝑢𝑡𝑒𝑟𝜏 are the (measured or estimated) number of data sessions served by the inner and outer sectors during a time interval τ. The SON algorithm reads
(i) Calculate the Load Ratio (ii) Compare the Load Ratio with α (iii) if Load Ratio ≤ α then VS activated (iv) if Load Ratio > α then VS deactivated
Different VS (de)activation intervals, represented by the value of the decision timing parameter τ, (time interval in which (de)activation decisions are taken per cell by the SON function) and for different slopes (𝛼 parameters) of the linear decision boundary have been examined and compared to the reference scenarios with VS OFF and VS ON without SON functionality (Full VS), as shown in Figure 37 below. The most important observation from this study is that a reactive operation of the SON algorithm ((de)activation decisions upon call arrival/departure per cell) provides optimal results, together with an infinite slope for the decision boundary: 𝛼 → ∞ ((de)activate VS as long as Load Ratio is defined- denominator > 0 - hence only 𝑁𝑖𝑛𝑛𝑒𝑟𝜏 needs to be estimated). This means that as soon as there is at least one user at the inner cell, it is beneficial to activate the VS.
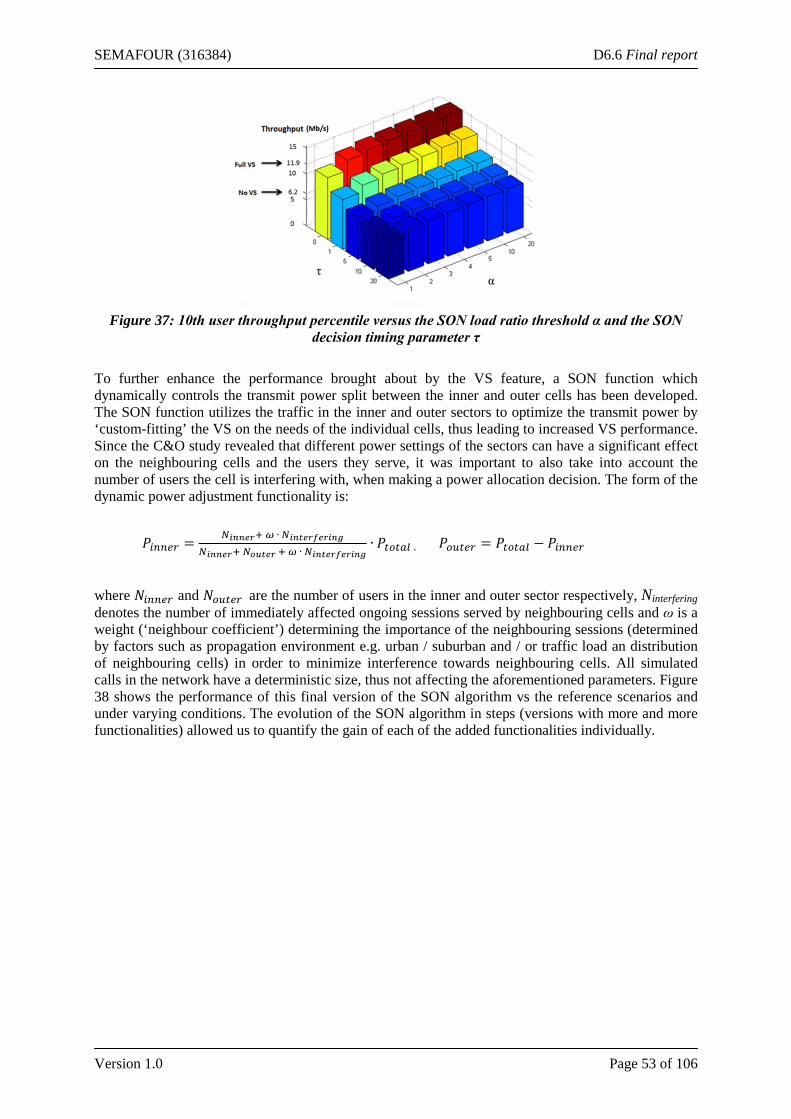
SEMAFOUR (316384) D6.6 Final report
Version 1.0 Page 53 of 106
Figure 37: 10th user throughput percentile versus the SON load ratio threshold α and the SON
decision timing parameter τ To further enhance the performance brought about by the VS feature, a SON function which dynamically controls the transmit power split between the inner and outer cells has been developed. The SON function utilizes the traffic in the inner and outer sectors to optimize the transmit power by ‘custom-fitting’ the VS on the needs of the individual cells, thus leading to increased VS performance. Since the C&O study revealed that different power settings of the sectors can have a significant effect on the neighbouring cells and the users they serve, it was important to also take into account the number of users the cell is interfering with, when making a power allocation decision. The form of the dynamic power adjustment functionality is:
𝑃𝑖𝑛𝑛𝑒𝑟 = 𝑁𝑖𝑛𝑛𝑒𝑟+ 𝜔 ∙ 𝑁𝑖𝑛𝑡𝑒𝑟𝑓𝑒𝑟𝑖𝑛𝑔𝑁𝑖𝑛𝑛𝑒𝑟+ 𝑁𝑜𝑢𝑡𝑒𝑟 + 𝜔 ∙ 𝑁𝑖𝑛𝑡𝑒𝑟𝑓𝑒𝑟𝑖𝑛𝑔
∙ 𝑃𝑡𝑜𝑡𝑎𝑙 , 𝑃𝑜𝑢𝑡𝑒𝑟 = 𝑃𝑡𝑜𝑡𝑎𝑙 − 𝑃𝑖𝑛𝑛𝑒𝑟
where 𝑁𝑖𝑛𝑛𝑒𝑟 and 𝑁𝑜𝑢𝑡𝑒𝑟 are the number of users in the inner and outer sector respectively, Ninterfering denotes the number of immediately affected ongoing sessions served by neighbouring cells and ω is a weight (‘neighbour coefficient’) determining the importance of the neighbouring sessions (determined by factors such as propagation environment e.g. urban / suburban and / or traffic load an distribution of neighbouring cells) in order to minimize interference towards neighbouring cells. All simulated calls in the network have a deterministic size, thus not affecting the aforementioned parameters. Figure 38 shows the performance of this final version of the SON algorithm vs the reference scenarios and under varying conditions. The evolution of the SON algorithm in steps (versions with more and more functionalities) allowed us to quantify the gain of each of the added functionalities individually.
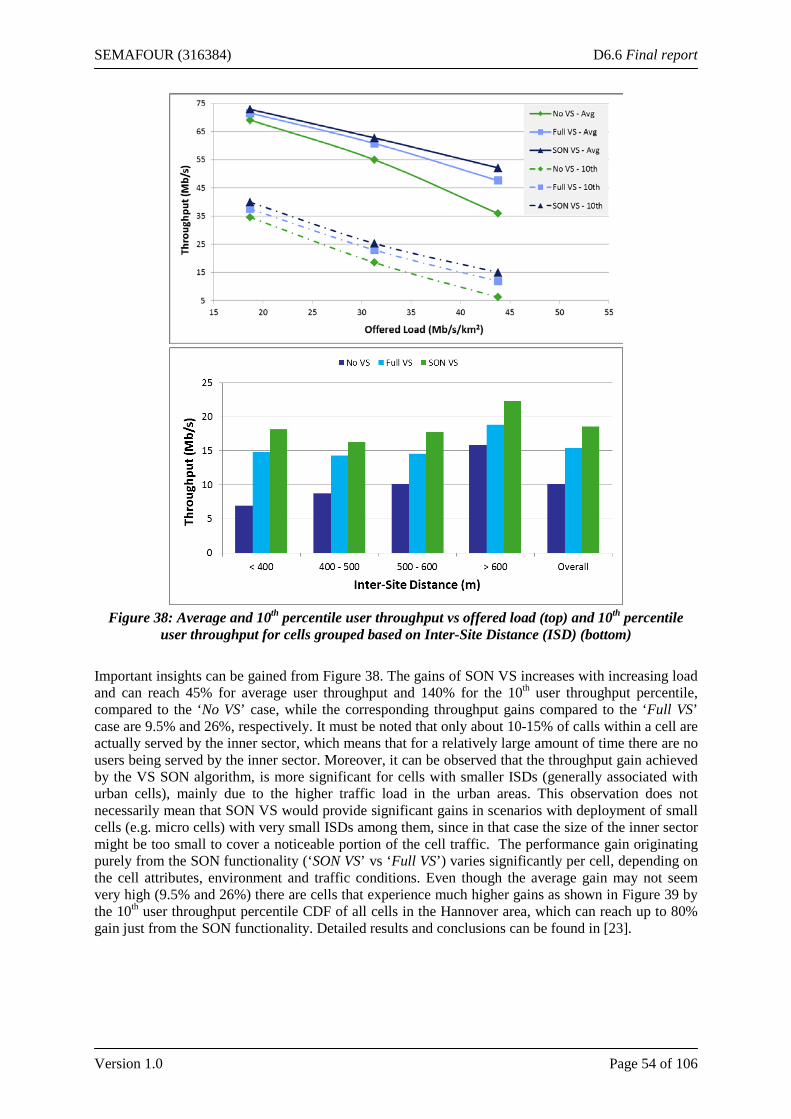
SEMAFOUR (316384) D6.6 Final report
Version 1.0 Page 54 of 106
Figure 38: Average and 10th percentile user throughput vs offered load (top) and 10th percentile
user throughput for cells grouped based on Inter-Site Distance (ISD) (bottom) Important insights can be gained from Figure 38. The gains of SON VS increases with increasing load and can reach 45% for average user throughput and 140% for the 10th user throughput percentile, compared to the ‘No VS’ case, while the corresponding throughput gains compared to the ‘Full VS’ case are 9.5% and 26%, respectively. It must be noted that only about 10-15% of calls within a cell are actually served by the inner sector, which means that for a relatively large amount of time there are no users being served by the inner sector. Moreover, it can be observed that the throughput gain achieved by the VS SON algorithm, is more significant for cells with smaller ISDs (generally associated with urban cells), mainly due to the higher traffic load in the urban areas. This observation does not necessarily mean that SON VS would provide significant gains in scenarios with deployment of small cells (e.g. micro cells) with very small ISDs among them, since in that case the size of the inner sector might be too small to cover a noticeable portion of the cell traffic. The performance gain originating purely from the SON functionality (‘SON VS’ vs ‘Full VS’) varies significantly per cell, depending on the cell attributes, environment and traffic conditions. Even though the average gain may not seem very high (9.5% and 26%) there are cells that experience much higher gains as shown in Figure 39 by the 10th user throughput percentile CDF of all cells in the Hannover area, which can reach up to 80% gain just from the SON functionality. Detailed results and conclusions can be found in [23].
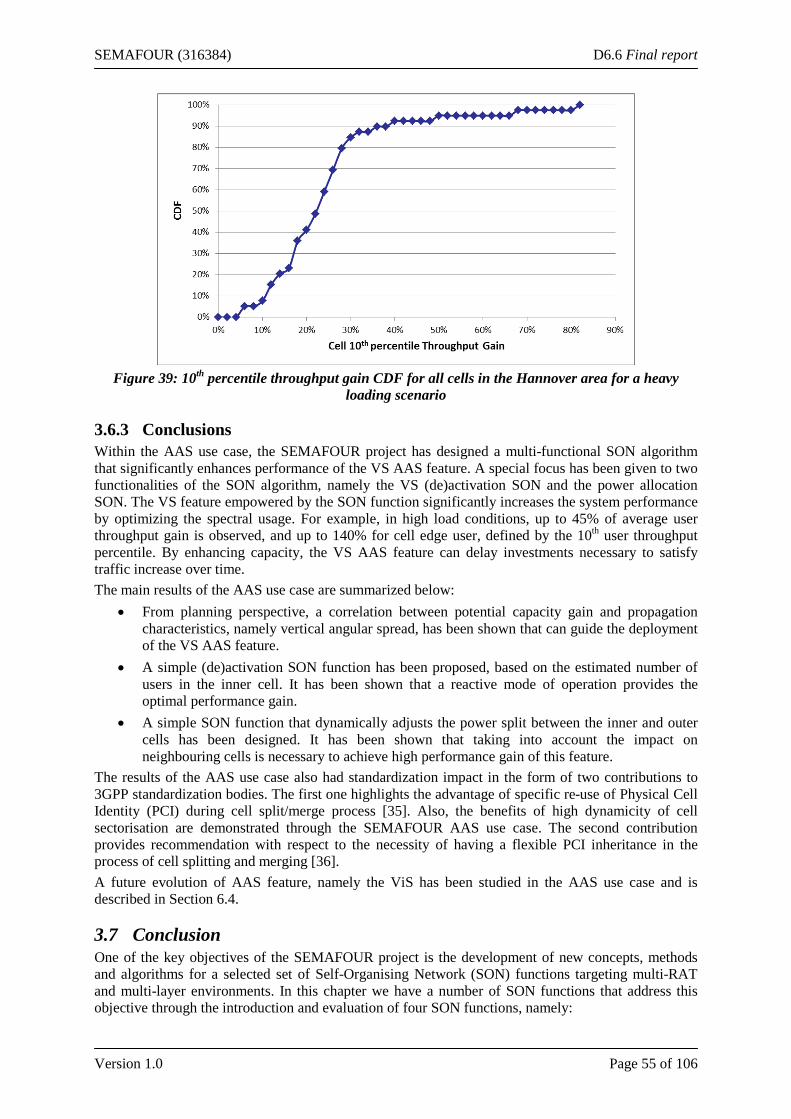
SEMAFOUR (316384) D6.6 Final report
Version 1.0 Page 55 of 106
Figure 39: 10th percentile throughput gain CDF for all cells in the Hannover area for a heavy
loading scenario
3.6.3 Conclusions Within the AAS use case, the SEMAFOUR project has designed a multi-functional SON algorithm that significantly enhances performance of the VS AAS feature. A special focus has been given to two functionalities of the SON algorithm, namely the VS (de)activation SON and the power allocation SON. The VS feature empowered by the SON function significantly increases the system performance by optimizing the spectral usage. For example, in high load conditions, up to 45% of average user throughput gain is observed, and up to 140% for cell edge user, defined by the 10th user throughput percentile. By enhancing capacity, the VS AAS feature can delay investments necessary to satisfy traffic increase over time. The main results of the AAS use case are summarized below:
• From planning perspective, a correlation between potential capacity gain and propagation characteristics, namely vertical angular spread, has been shown that can guide the deployment of the VS AAS feature.
• A simple (de)activation SON function has been proposed, based on the estimated number of users in the inner cell. It has been shown that a reactive mode of operation provides the optimal performance gain.
• A simple SON function that dynamically adjusts the power split between the inner and outer cells has been designed. It has been shown that taking into account the impact on neighbouring cells is necessary to achieve high performance gain of this feature.
The results of the AAS use case also had standardization impact in the form of two contributions to 3GPP standardization bodies. The first one highlights the advantage of specific re-use of Physical Cell Identity (PCI) during cell split/merge process [35]. Also, the benefits of high dynamicity of cell sectorisation are demonstrated through the SEMAFOUR AAS use case. The second contribution provides recommendation with respect to the necessity of having a flexible PCI inheritance in the process of cell splitting and merging [36]. A future evolution of AAS feature, namely the ViS has been studied in the AAS use case and is described in Section 6.4.
3.7 Conclusion One of the key objectives of the SEMAFOUR project is the development of new concepts, methods and algorithms for a selected set of Self-Organising Network (SON) functions targeting multi-RAT and multi-layer environments. In this chapter we have a number of SON functions that address this objective through the introduction and evaluation of four SON functions, namely:

SEMAFOUR (316384) D6.6 Final report
Version 1.0 Page 56 of 106
• Dynamic Spectrum Allocation and Interference Management (DSA/IM) – aiming at allocating spectrum across cells and RATs to optimize network performance and make best usage of available operator spectrum
• Multi-layer LTE – Wi-Fi Traffic Steering (TS) – aiming at steering users between LTE cells and Wi-Fi nodes to balance load and increase end user performance
• Tackling the Problem of High Mobility Users (HM) – aiming at minimising negative effects of frequent HOs, HO failures and short-stays.
• Active / Reconfigurable Antenna Systems (AAS) – aiming at utilizing advanced antennas for sectorising cells as a densification method and in addition optimising sector parameters.
In addition, the SEMAFOUR project has developed a set of SON Design Principles to ensure that the SON functions interact correctly with the SON management framework, but also this aims at designing SON functions in order to reduce need of a SON Coordinator when needed. The overall achievements of the work performed in SEMAFOUR are:
• Significant network performance improvement: All use cases point toward performance improvements in terms of system capacity and/or user throughput.
• Improvement of the spectral usage: Spectrum is a scarce resource and not only is availability limited, but is also a costly asset for the operators. To ensure that usage of spectrum is maximized is, thus, key to maximizing the return on operator’s investments.
• Improved manageability of radio recourses resources and hardware capabilities: Finally, the SON features developed all aim at improved manageability and reducing operations cost.
• Impact on standardisation: The SEMAFOUR project has successfully submitted 3GPP contributions through project partners based on results obtained.
• Cutting edge research: The SEMAFOUR project has delivered cutting-edge research and pushed the technology boundary beyond state of the art.
The developed SON functions, clearly take significant steps toward the overall SEMAFOUR goal to design and develop a unified self-management system, which enables the network operators to holistically manage and operate their complex heterogeneous mobile networks.
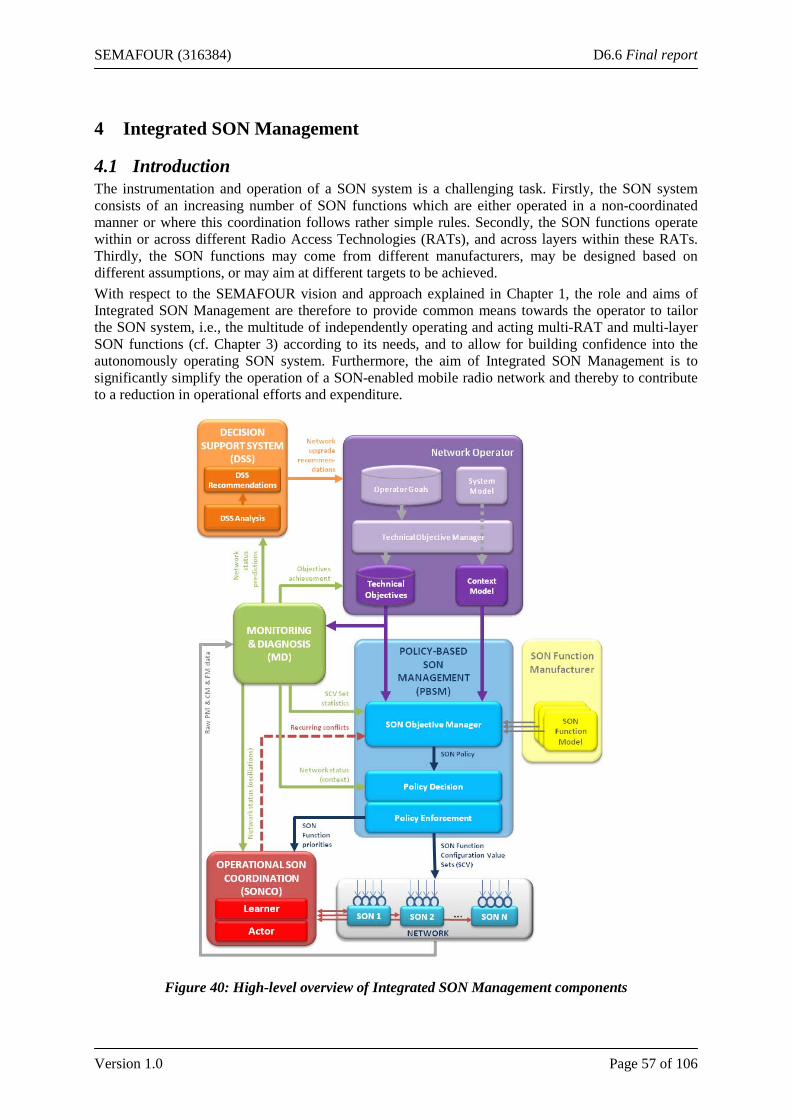
SEMAFOUR (316384) D6.6 Final report
Version 1.0 Page 57 of 106
4 Integrated SON Management
4.1 Introduction The instrumentation and operation of a SON system is a challenging task. Firstly, the SON system consists of an increasing number of SON functions which are either operated in a non-coordinated manner or where this coordination follows rather simple rules. Secondly, the SON functions operate within or across different Radio Access Technologies (RATs), and across layers within these RATs. Thirdly, the SON functions may come from different manufacturers, may be designed based on different assumptions, or may aim at different targets to be achieved. With respect to the SEMAFOUR vision and approach explained in Chapter 1, the role and aims of Integrated SON Management are therefore to provide common means towards the operator to tailor the SON system, i.e., the multitude of independently operating and acting multi-RAT and multi-layer SON functions (cf. Chapter 3) according to its needs, and to allow for building confidence into the autonomously operating SON system. Furthermore, the aim of Integrated SON Management is to significantly simplify the operation of a SON-enabled mobile radio network and thereby to contribute to a reduction in operational efforts and expenditure.
Figure 40: High-level overview of Integrated SON Management components
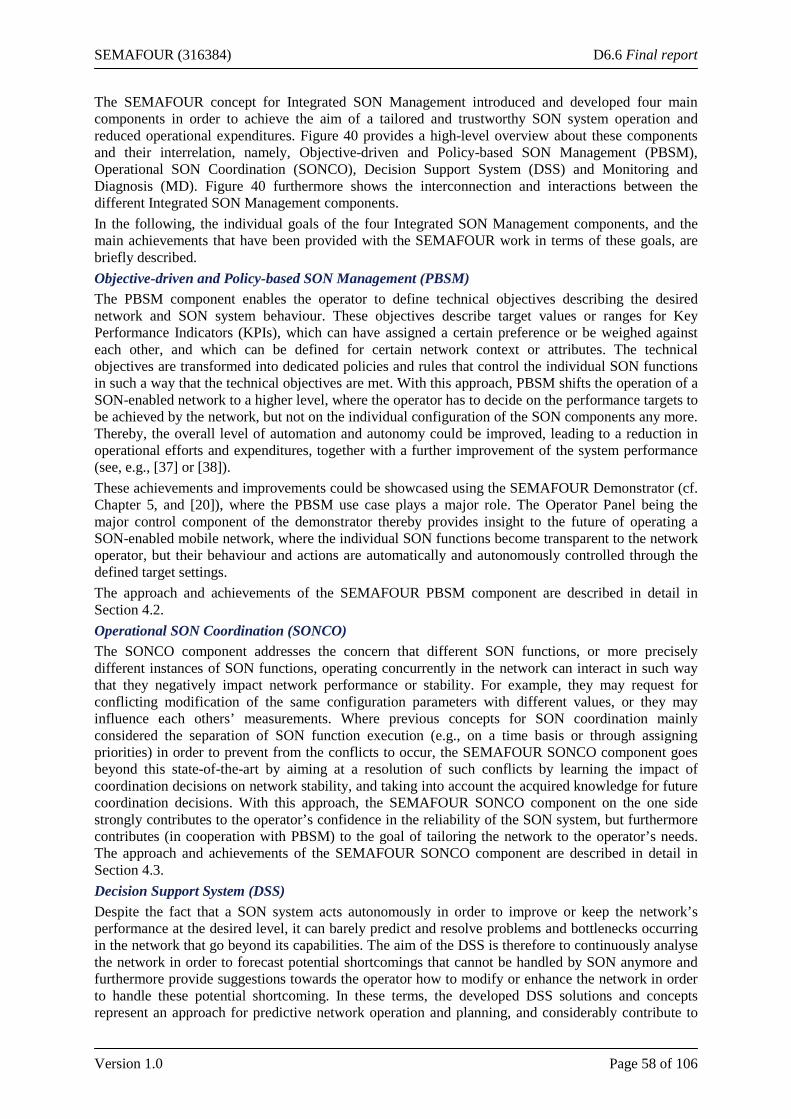
SEMAFOUR (316384) D6.6 Final report
Version 1.0 Page 58 of 106
The SEMAFOUR concept for Integrated SON Management introduced and developed four main components in order to achieve the aim of a tailored and trustworthy SON system operation and reduced operational expenditures. Figure 40 provides a high-level overview about these components and their interrelation, namely, Objective-driven and Policy-based SON Management (PBSM), Operational SON Coordination (SONCO), Decision Support System (DSS) and Monitoring and Diagnosis (MD). Figure 40 furthermore shows the interconnection and interactions between the different Integrated SON Management components. In the following, the individual goals of the four Integrated SON Management components, and the main achievements that have been provided with the SEMAFOUR work in terms of these goals, are briefly described. Objective-driven and Policy-based SON Management (PBSM) The PBSM component enables the operator to define technical objectives describing the desired network and SON system behaviour. These objectives describe target values or ranges for Key Performance Indicators (KPIs), which can have assigned a certain preference or be weighed against each other, and which can be defined for certain network context or attributes. The technical objectives are transformed into dedicated policies and rules that control the individual SON functions in such a way that the technical objectives are met. With this approach, PBSM shifts the operation of a SON-enabled network to a higher level, where the operator has to decide on the performance targets to be achieved by the network, but not on the individual configuration of the SON components any more. Thereby, the overall level of automation and autonomy could be improved, leading to a reduction in operational efforts and expenditures, together with a further improvement of the system performance (see, e.g., [37] or [38]). These achievements and improvements could be showcased using the SEMAFOUR Demonstrator (cf. Chapter 5, and [20]), where the PBSM use case plays a major role. The Operator Panel being the major control component of the demonstrator thereby provides insight to the future of operating a SON-enabled mobile network, where the individual SON functions become transparent to the network operator, but their behaviour and actions are automatically and autonomously controlled through the defined target settings. The approach and achievements of the SEMAFOUR PBSM component are described in detail in Section 4.2. Operational SON Coordination (SONCO) The SONCO component addresses the concern that different SON functions, or more precisely different instances of SON functions, operating concurrently in the network can interact in such way that they negatively impact network performance or stability. For example, they may request for conflicting modification of the same configuration parameters with different values, or they may influence each others’ measurements. Where previous concepts for SON coordination mainly considered the separation of SON function execution (e.g., on a time basis or through assigning priorities) in order to prevent from the conflicts to occur, the SEMAFOUR SONCO component goes beyond this state-of-the-art by aiming at a resolution of such conflicts by learning the impact of coordination decisions on network stability, and taking into account the acquired knowledge for future coordination decisions. With this approach, the SEMAFOUR SONCO component on the one side strongly contributes to the operator’s confidence in the reliability of the SON system, but furthermore contributes (in cooperation with PBSM) to the goal of tailoring the network to the operator’s needs. The approach and achievements of the SEMAFOUR SONCO component are described in detail in Section 4.3. Decision Support System (DSS) Despite the fact that a SON system acts autonomously in order to improve or keep the network’s performance at the desired level, it can barely predict and resolve problems and bottlenecks occurring in the network that go beyond its capabilities. The aim of the DSS is therefore to continuously analyse the network in order to forecast potential shortcomings that cannot be handled by SON anymore and furthermore provide suggestions towards the operator how to modify or enhance the network in order to handle these potential shortcoming. In these terms, the developed DSS solutions and concepts represent an approach for predictive network operation and planning, and considerably contribute to
SEMAFOUR (316384) D6.6 Final report
Version 1.0 Page 59 of 106
the goal of simplifying the operation of a mobile radio network through enabling the elimination of bottlenecks before they actually occur. The approach and achievements of the SEMAFOUR DSS component are described in detail in Section 4.4. Monitoring and Diagnosis (MD) This component is an enabler for the other Integrated SON Management components. At first, MD acquires and processes information from the network and the Operation, Administration and Maintenance (OAM) system (e.g., performance measurements, alarms, and configuration data). Secondly, MD performs an analysis of this data according to the requirements of the other Integrated SON Management components. This analysis is performed in such a way that the analysis results can directly be used as input by these components, for example, through provisioning information about the current network context required by the Policy System of PBSM in order to perform decisions on the SON function reconfigurations, or through providing the information to the bottleneck detection component of DSS. In these terms, MD represents a first stage towards cognitive network management on the path from raw network data to knowledge, where this raw data is transformed into the required information. The approach and achievements of the SEMAFOUR MD component are described in detail in Section 4.5.
4.2 Policy-Based SON Management Policy-Based SON Management (PBSM) is one major part of the SEMAFOUR integrated SON management system. The role of PBSM is to operate the SON-enabled network in such a way that it performs efficiently in line with operator defined objectives.
4.2.1 Introduction In today’s mobile radio networks the technical objectives are usually defined by the operators, for example, using templates or handbooks describing how to manually configure the network. However, technical objectives cannot be interpreted directly by the SON functions. To enable the operation of the SON-enabled mobile network through technical objectives, an automatic transformation of technical objectives to SON Function Configuration Value (SCV) sets is necessary. Furthermore, the mobile network, and thus the operational and network context, may be subject to frequent changes. This in turn requires a dynamic adaptation of the SON functions’ configuration by changing their SCV sets. For this reason the focus within the first half of the SEMAFOUR project was on a bottom-up approach, i.e., starting from analysing the SON functions’ behaviour in relation to KPI targets and to develop a solution that allows an automated instrumentation of the SON functions such that they contribute towards achieving the defined KPI targets. The advantage of this automation is that network context and weighting between KPI targets can be considered, which is barely possible at the level of individual cells in case of manual operation. The results of these developments are the SON Objective Manager and the Policy System (Policy repository, Policy decision, and Policy enforcement, see [37]). The SON Objective Manager merges models of the implemented SON functions (provided by the SON manufacturer) with a model of the technical objectives (based on the operator defined KPI targets, context and weights), and creates a SON Policy that consists of a set of rules providing for each and every defined context the appropriate SON function configuration with respect to the defined KPI targets. The SON functions in turn configure the network such that it operates towards achieving the KPI targets. The focus in the second half of the SEMAFOUR project was on elaborating and extending the previous work in order to make the PBSM approach more flexible. The results of this work are the concept of cell classes and a learning PBSM approach. By means of cell classes it is easier to handle the huge amount of different situations and different cell properties in the network. Extending the initial approach with learning capabilities makes the system more dynamic and more accurate since the PBSM is no longer dependent on simulated input models but on models that are improved over time.
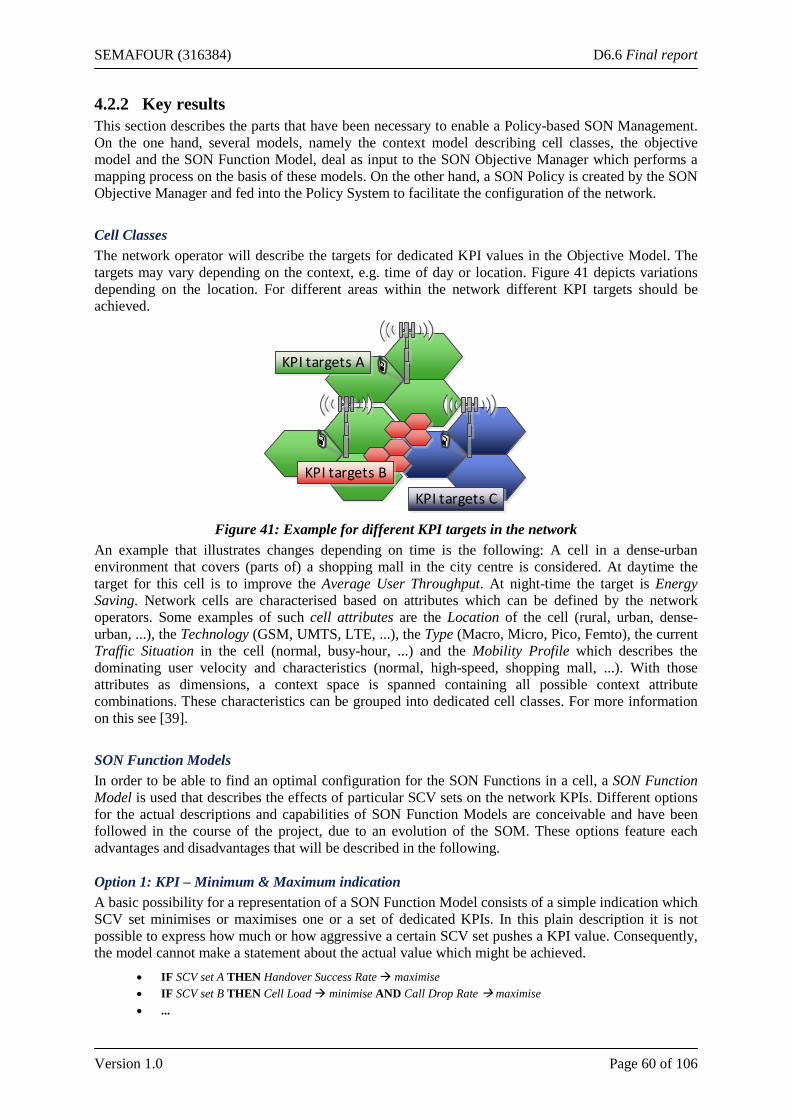
SEMAFOUR (316384) D6.6 Final report
Version 1.0 Page 60 of 106
4.2.2 Key results This section describes the parts that have been necessary to enable a Policy-based SON Management. On the one hand, several models, namely the context model describing cell classes, the objective model and the SON Function Model, deal as input to the SON Objective Manager which performs a mapping process on the basis of these models. On the other hand, a SON Policy is created by the SON Objective Manager and fed into the Policy System to facilitate the configuration of the network. Cell Classes The network operator will describe the targets for dedicated KPI values in the Objective Model. The targets may vary depending on the context, e.g. time of day or location. Figure 41 depicts variations depending on the location. For different areas within the network different KPI targets should be achieved.
KPI targets A
KPI targets B
KPI targets C
Figure 41: Example for different KPI targets in the network An example that illustrates changes depending on time is the following: A cell in a dense-urban environment that covers (parts of) a shopping mall in the city centre is considered. At daytime the target for this cell is to improve the Average User Throughput. At night-time the target is Energy Saving. Network cells are characterised based on attributes which can be defined by the network operators. Some examples of such cell attributes are the Location of the cell (rural, urban, dense-urban, ...), the Technology (GSM, UMTS, LTE, ...), the Type (Macro, Micro, Pico, Femto), the current Traffic Situation in the cell (normal, busy-hour, ...) and the Mobility Profile which describes the dominating user velocity and characteristics (normal, high-speed, shopping mall, ...). With those attributes as dimensions, a context space is spanned containing all possible context attribute combinations. These characteristics can be grouped into dedicated cell classes. For more information on this see [39]. SON Function Models In order to be able to find an optimal configuration for the SON Functions in a cell, a SON Function Model is used that describes the effects of particular SCV sets on the network KPIs. Different options for the actual descriptions and capabilities of SON Function Models are conceivable and have been followed in the course of the project, due to an evolution of the SOM. These options feature each advantages and disadvantages that will be described in the following. Option 1: KPI – Minimum & Maximum indication A basic possibility for a representation of a SON Function Model consists of a simple indication which SCV set minimises or maximises one or a set of dedicated KPIs. In this plain description it is not possible to express how much or how aggressive a certain SCV set pushes a KPI value. Consequently, the model cannot make a statement about the actual value which might be achieved.
• IF SCV set A THEN Handover Success Rate maximise • IF SCV set B THEN Cell Load minimise AND Call Drop Rate maximise • ...
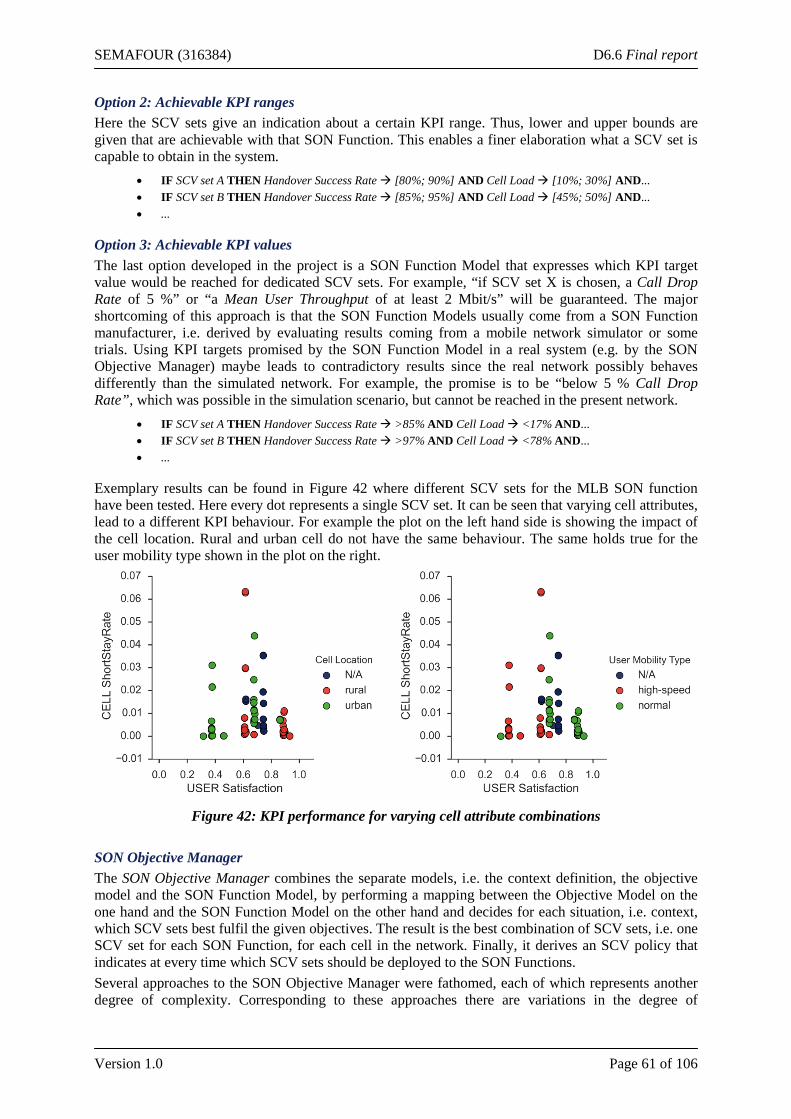
SEMAFOUR (316384) D6.6 Final report
Version 1.0 Page 61 of 106
Option 2: Achievable KPI ranges Here the SCV sets give an indication about a certain KPI range. Thus, lower and upper bounds are given that are achievable with that SON Function. This enables a finer elaboration what a SCV set is capable to obtain in the system.
• IF SCV set A THEN Handover Success Rate [80%; 90%] AND Cell Load [10%; 30%] AND... • IF SCV set B THEN Handover Success Rate [85%; 95%] AND Cell Load [45%; 50%] AND... • ...
Option 3: Achievable KPI values The last option developed in the project is a SON Function Model that expresses which KPI target value would be reached for dedicated SCV sets. For example, “if SCV set X is chosen, a Call Drop Rate of 5 %” or “a Mean User Throughput of at least 2 Mbit/s” will be guaranteed. The major shortcoming of this approach is that the SON Function Models usually come from a SON Function manufacturer, i.e. derived by evaluating results coming from a mobile network simulator or some trials. Using KPI targets promised by the SON Function Model in a real system (e.g. by the SON Objective Manager) maybe leads to contradictory results since the real network possibly behaves differently than the simulated network. For example, the promise is to be “below 5 % Call Drop Rate”, which was possible in the simulation scenario, but cannot be reached in the present network.
• IF SCV set A THEN Handover Success Rate >85% AND Cell Load <17% AND... • IF SCV set B THEN Handover Success Rate >97% AND Cell Load <78% AND... • ...
Exemplary results can be found in Figure 42 where different SCV sets for the MLB SON function have been tested. Here every dot represents a single SCV set. It can be seen that varying cell attributes, lead to a different KPI behaviour. For example the plot on the left hand side is showing the impact of the cell location. Rural and urban cell do not have the same behaviour. The same holds true for the user mobility type shown in the plot on the right.
Figure 42: KPI performance for varying cell attribute combinations
SON Objective Manager The SON Objective Manager combines the separate models, i.e. the context definition, the objective model and the SON Function Model, by performing a mapping between the Objective Model on the one hand and the SON Function Model on the other hand and decides for each situation, i.e. context, which SCV sets best fulfil the given objectives. The result is the best combination of SCV sets, i.e. one SCV set for each SON Function, for each cell in the network. Finally, it derives an SCV policy that indicates at every time which SCV sets should be deployed to the SON Functions. Several approaches to the SON Objective Manager were fathomed, each of which represents another degree of complexity. Corresponding to these approaches there are variations in the degree of
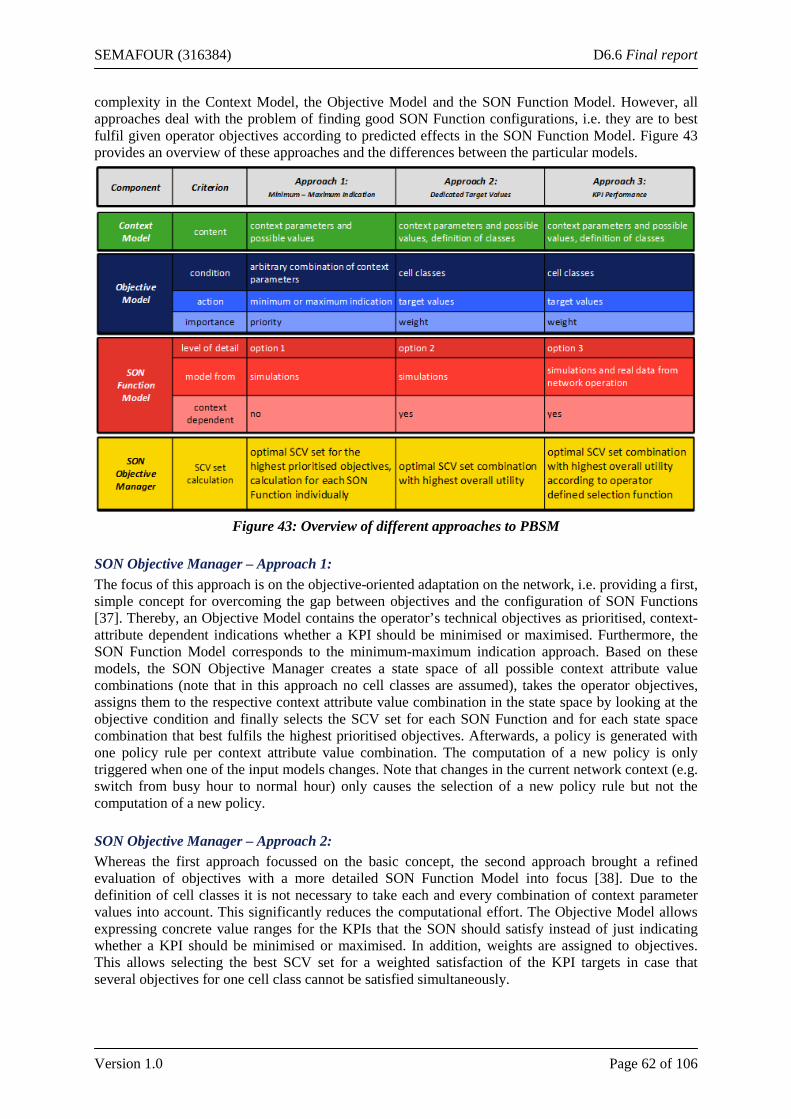
SEMAFOUR (316384) D6.6 Final report
Version 1.0 Page 62 of 106
complexity in the Context Model, the Objective Model and the SON Function Model. However, all approaches deal with the problem of finding good SON Function configurations, i.e. they are to best fulfil given operator objectives according to predicted effects in the SON Function Model. Figure 43 provides an overview of these approaches and the differences between the particular models.
Figure 43: Overview of different approaches to PBSM
SON Objective Manager – Approach 1: The focus of this approach is on the objective-oriented adaptation on the network, i.e. providing a first, simple concept for overcoming the gap between objectives and the configuration of SON Functions [37]. Thereby, an Objective Model contains the operator’s technical objectives as prioritised, context-attribute dependent indications whether a KPI should be minimised or maximised. Furthermore, the SON Function Model corresponds to the minimum-maximum indication approach. Based on these models, the SON Objective Manager creates a state space of all possible context attribute value combinations (note that in this approach no cell classes are assumed), takes the operator objectives, assigns them to the respective context attribute value combination in the state space by looking at the objective condition and finally selects the SCV set for each SON Function and for each state space combination that best fulfils the highest prioritised objectives. Afterwards, a policy is generated with one policy rule per context attribute value combination. The computation of a new policy is only triggered when one of the input models changes. Note that changes in the current network context (e.g. switch from busy hour to normal hour) only causes the selection of a new policy rule but not the computation of a new policy. SON Objective Manager – Approach 2: Whereas the first approach focussed on the basic concept, the second approach brought a refined evaluation of objectives with a more detailed SON Function Model into focus [38]. Due to the definition of cell classes it is not necessary to take each and every combination of context parameter values into account. This significantly reduces the computational effort. The Objective Model allows expressing concrete value ranges for the KPIs that the SON should satisfy instead of just indicating whether a KPI should be minimised or maximised. In addition, weights are assigned to objectives. This allows selecting the best SCV set for a weighted satisfaction of the KPI targets in case that several objectives for one cell class cannot be satisfied simultaneously.

SEMAFOUR (316384) D6.6 Final report
Version 1.0 Page 63 of 106
These advancements enable the SON Objective Manager to better adapt the SCV sets to the operator objectives and to identify conflicts between different SON Function configurations. In a first step, the SON Objective Manager merges the models of all available SON Functions into one combined SON Function Model which allows the estimation of the network performance for combinations of SCV sets. The best combined configuration is then selected by calculating the overall utility of each different SCV set combination, i.e. the configurations with the highest utility, for each and every context class can be selected [38]. SON Objective Manager – Approach 3: By taking real measured data into account, a whole new approach arises that turns PBSM into a closed control loop which aims at permanently improving the output policy according to feedback from the network in terms of KPIs. The Objective Model as well as the Context Model corresponds to those presented in the previous approach. However, the SON Function Model is more complex. It basically consists of three data pools:
1. A simulated SON Function Model that comes from the vendor of a SON Function 2. A model that comes from own simulation results 3. A model that reflects KPIs measured in the network
The latter is learned over time and cannot be used until a representative number of measurements are available. Hence, after the deployment of a new SON Function, for example, only simulated models will be taken into account as a starting point. Learned real data can be used after some iteration. When there is a sufficient (this has to be defined by the operator) number of real measurements, predominately the third pool will be considered. Considering real measured data also leads to some changes in the functioning of the SON Objective Manager. Since KPI targets in the Objective Model should be achieved independent of the current network behaviour and some SON Function Models have been generated in different environments, mapping the Objective Model and the SON Function Model is not as trivial as in the second approach. Hence, the operator has to express how the different sources have to be treated and how they are preferred. In summary, with this approach SON Function Models that are based on simulation results can be gradually updated based on real measurement results and the focus of which SON Function Model should be used in the first place can be changed over time. Policy System A Policy System is an established approach for network management [40]. The Policy System in the PBSM evaluates the SCV policy stored in the Policy Repository at run-time and dynamically configures the SON Functions. Therefore, an external component is required that triggers the execution of the Policy System. For example, a timer can trigger the Policy System at fixed time intervals such as every hour or in case the daytime changes from peak hours to off-peak hours. Basically, a Policy Repository contains an SCV policy which is a set of rules with the following general form:
IF context THEN SCV sets
The context defined in the IF-part could be represented by either a set of context parameters or a cell class. The THEN-part defines the SCV sets that should be deployed to the SON Function when a cell is part of the context specified in the IF-part. Table 4 presents an exemplary SCV policy with cell classes for three SON Functions as the SON Objective Manager could create it.
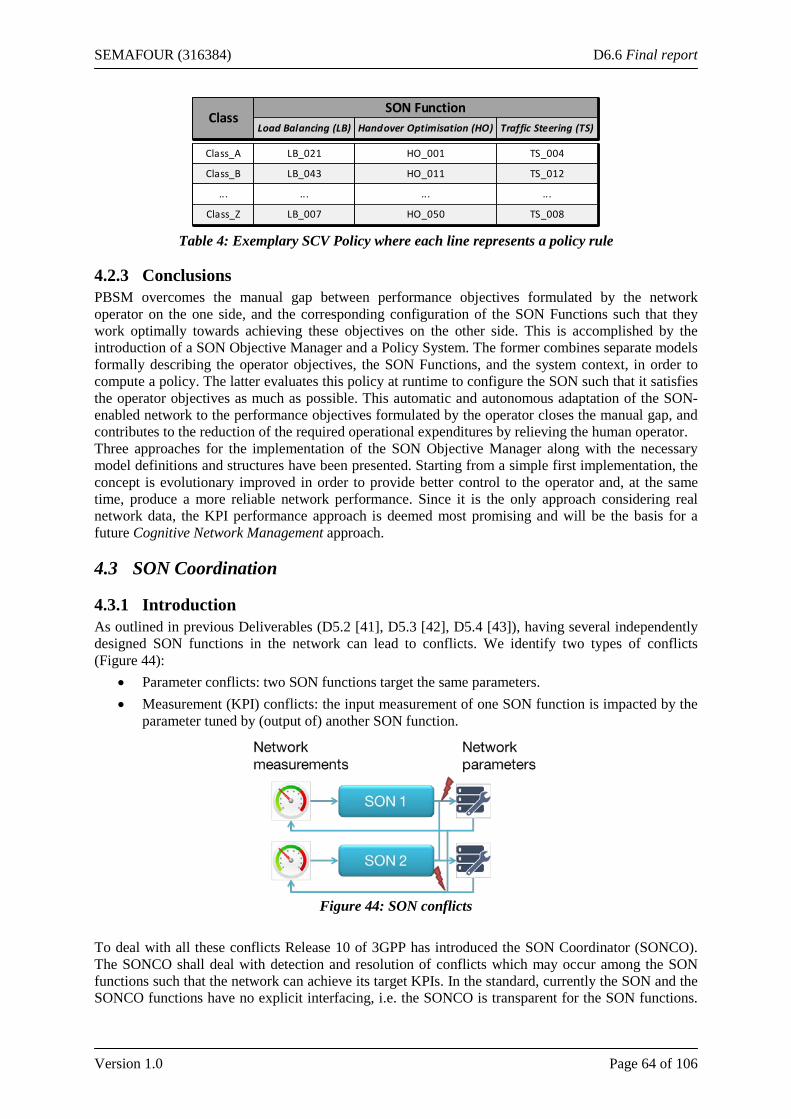
SEMAFOUR (316384) D6.6 Final report
Version 1.0 Page 64 of 106
Table 4: Exemplary SCV Policy where each line represents a policy rule
4.2.3 Conclusions PBSM overcomes the manual gap between performance objectives formulated by the network operator on the one side, and the corresponding configuration of the SON Functions such that they work optimally towards achieving these objectives on the other side. This is accomplished by the introduction of a SON Objective Manager and a Policy System. The former combines separate models formally describing the operator objectives, the SON Functions, and the system context, in order to compute a policy. The latter evaluates this policy at runtime to configure the SON such that it satisfies the operator objectives as much as possible. This automatic and autonomous adaptation of the SON-enabled network to the performance objectives formulated by the operator closes the manual gap, and contributes to the reduction of the required operational expenditures by relieving the human operator. Three approaches for the implementation of the SON Objective Manager along with the necessary model definitions and structures have been presented. Starting from a simple first implementation, the concept is evolutionary improved in order to provide better control to the operator and, at the same time, produce a more reliable network performance. Since it is the only approach considering real network data, the KPI performance approach is deemed most promising and will be the basis for a future Cognitive Network Management approach.
4.3 SON Coordination
4.3.1 Introduction As outlined in previous Deliverables (D5.2 [41], D5.3 [42], D5.4 [43]), having several independently designed SON functions in the network can lead to conflicts. We identify two types of conflicts (Figure 44):
• Parameter conflicts: two SON functions target the same parameters. • Measurement (KPI) conflicts: the input measurement of one SON function is impacted by the
parameter tuned by (output of) another SON function.
Figure 44: SON conflicts
To deal with all these conflicts Release 10 of 3GPP has introduced the SON Coordinator (SONCO). The SONCO shall deal with detection and resolution of conflicts which may occur among the SON functions such that the network can achieve its target KPIs. In the standard, currently the SON and the SONCO functions have no explicit interfacing, i.e. the SONCO is transparent for the SON functions.
ClassSON Function
Load Balancing (LB) Handover Optimisation (HO) Traffic Steering (TS)
Class_A
Class_B
...
Class_Z
LB_021
LB_043
...
LB_007
HO_001
HO_011
...
HO_050
TS_004
TS_012
...
TS_008
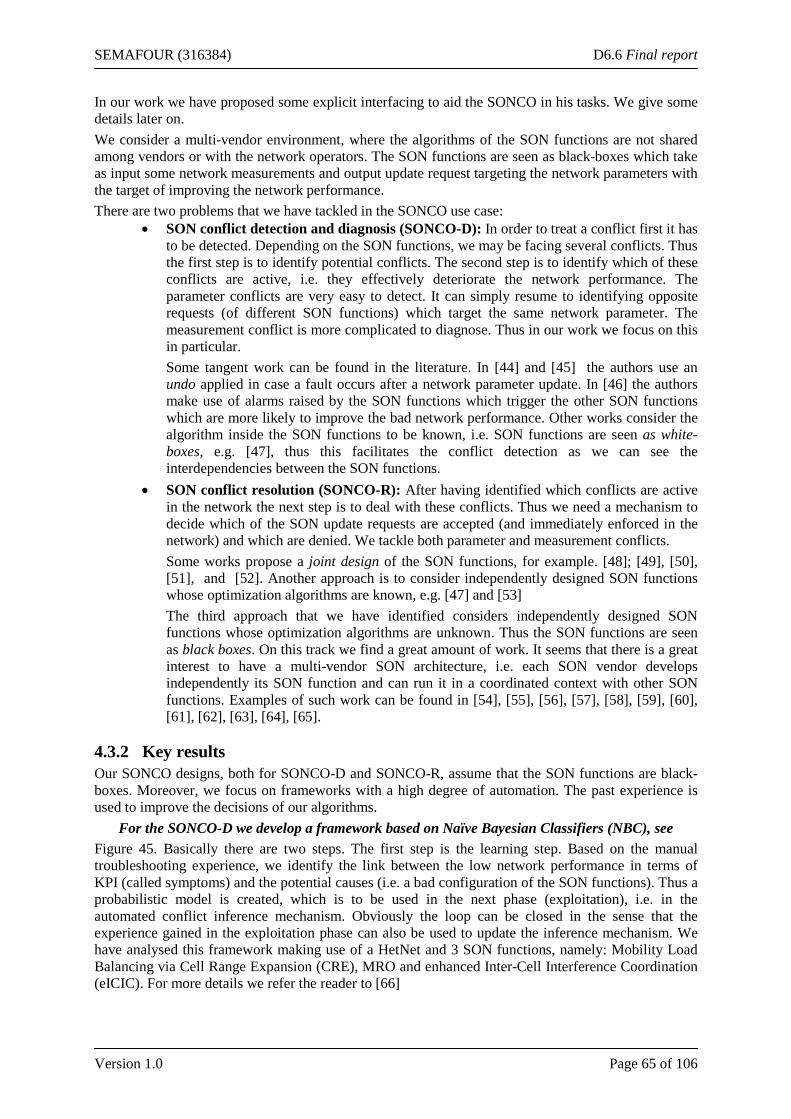
SEMAFOUR (316384) D6.6 Final report
Version 1.0 Page 65 of 106
In our work we have proposed some explicit interfacing to aid the SONCO in his tasks. We give some details later on. We consider a multi-vendor environment, where the algorithms of the SON functions are not shared among vendors or with the network operators. The SON functions are seen as black-boxes which take as input some network measurements and output update request targeting the network parameters with the target of improving the network performance. There are two problems that we have tackled in the SONCO use case:
• SON conflict detection and diagnosis (SONCO-D): In order to treat a conflict first it has to be detected. Depending on the SON functions, we may be facing several conflicts. Thus the first step is to identify potential conflicts. The second step is to identify which of these conflicts are active, i.e. they effectively deteriorate the network performance. The parameter conflicts are very easy to detect. It can simply resume to identifying opposite requests (of different SON functions) which target the same network parameter. The measurement conflict is more complicated to diagnose. Thus in our work we focus on this in particular. Some tangent work can be found in the literature. In [44] and [45] the authors use an undo applied in case a fault occurs after a network parameter update. In [46] the authors make use of alarms raised by the SON functions which trigger the other SON functions which are more likely to improve the bad network performance. Other works consider the algorithm inside the SON functions to be known, i.e. SON functions are seen as white-boxes, e.g. [47], thus this facilitates the conflict detection as we can see the interdependencies between the SON functions.
• SON conflict resolution (SONCO-R): After having identified which conflicts are active in the network the next step is to deal with these conflicts. Thus we need a mechanism to decide which of the SON update requests are accepted (and immediately enforced in the network) and which are denied. We tackle both parameter and measurement conflicts. Some works propose a joint design of the SON functions, for example. [48]; [49], [50], [51], and [52]. Another approach is to consider independently designed SON functions whose optimization algorithms are known, e.g. [47] and [53] The third approach that we have identified considers independently designed SON functions whose optimization algorithms are unknown. Thus the SON functions are seen as black boxes. On this track we find a great amount of work. It seems that there is a great interest to have a multi-vendor SON architecture, i.e. each SON vendor develops independently its SON function and can run it in a coordinated context with other SON functions. Examples of such work can be found in [54], [55], [56], [57], [58], [59], [60], [61], [62], [63], [64], [65].
4.3.2 Key results Our SONCO designs, both for SONCO-D and SONCO-R, assume that the SON functions are black-boxes. Moreover, we focus on frameworks with a high degree of automation. The past experience is used to improve the decisions of our algorithms.
For the SONCO-D we develop a framework based on Naïve Bayesian Classifiers (NBC), see Figure 45. Basically there are two steps. The first step is the learning step. Based on the manual troubleshooting experience, we identify the link between the low network performance in terms of KPI (called symptoms) and the potential causes (i.e. a bad configuration of the SON functions). Thus a probabilistic model is created, which is to be used in the next phase (exploitation), i.e. in the automated conflict inference mechanism. Obviously the loop can be closed in the sense that the experience gained in the exploitation phase can also be used to update the inference mechanism. We have analysed this framework making use of a HetNet and 3 SON functions, namely: Mobility Load Balancing via Cell Range Expansion (CRE), MRO and enhanced Inter-Cell Interference Coordination (eICIC). For more details we refer the reader to [66]
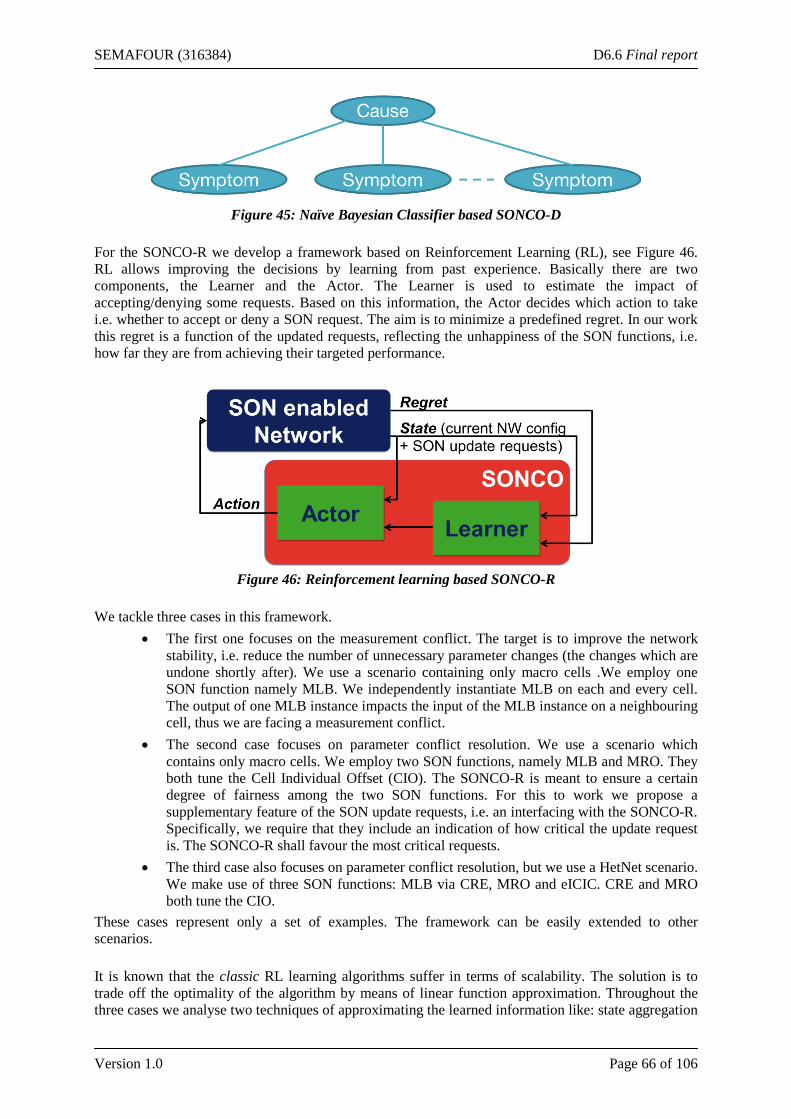
SEMAFOUR (316384) D6.6 Final report
Version 1.0 Page 66 of 106
Figure 45: Naïve Bayesian Classifier based SONCO-D
For the SONCO-R we develop a framework based on Reinforcement Learning (RL), see Figure 46. RL allows improving the decisions by learning from past experience. Basically there are two components, the Learner and the Actor. The Learner is used to estimate the impact of accepting/denying some requests. Based on this information, the Actor decides which action to take i.e. whether to accept or deny a SON request. The aim is to minimize a predefined regret. In our work this regret is a function of the updated requests, reflecting the unhappiness of the SON functions, i.e. how far they are from achieving their targeted performance.
Figure 46: Reinforcement learning based SONCO-R
We tackle three cases in this framework.
• The first one focuses on the measurement conflict. The target is to improve the network stability, i.e. reduce the number of unnecessary parameter changes (the changes which are undone shortly after). We use a scenario containing only macro cells .We employ one SON function namely MLB. We independently instantiate MLB on each and every cell. The output of one MLB instance impacts the input of the MLB instance on a neighbouring cell, thus we are facing a measurement conflict.
• The second case focuses on parameter conflict resolution. We use a scenario which contains only macro cells. We employ two SON functions, namely MLB and MRO. They both tune the Cell Individual Offset (CIO). The SONCO-R is meant to ensure a certain degree of fairness among the two SON functions. For this to work we propose a supplementary feature of the SON update requests, i.e. an interfacing with the SONCO-R. Specifically, we require that they include an indication of how critical the update request is. The SONCO-R shall favour the most critical requests.
• The third case also focuses on parameter conflict resolution, but we use a HetNet scenario. We make use of three SON functions: MLB via CRE, MRO and eICIC. CRE and MRO both tune the CIO.
These cases represent only a set of examples. The framework can be easily extended to other scenarios. It is known that the classic RL learning algorithms suffer in terms of scalability. The solution is to trade off the optimality of the algorithm by means of linear function approximation. Throughout the three cases we analyse two techniques of approximating the learned information like: state aggregation
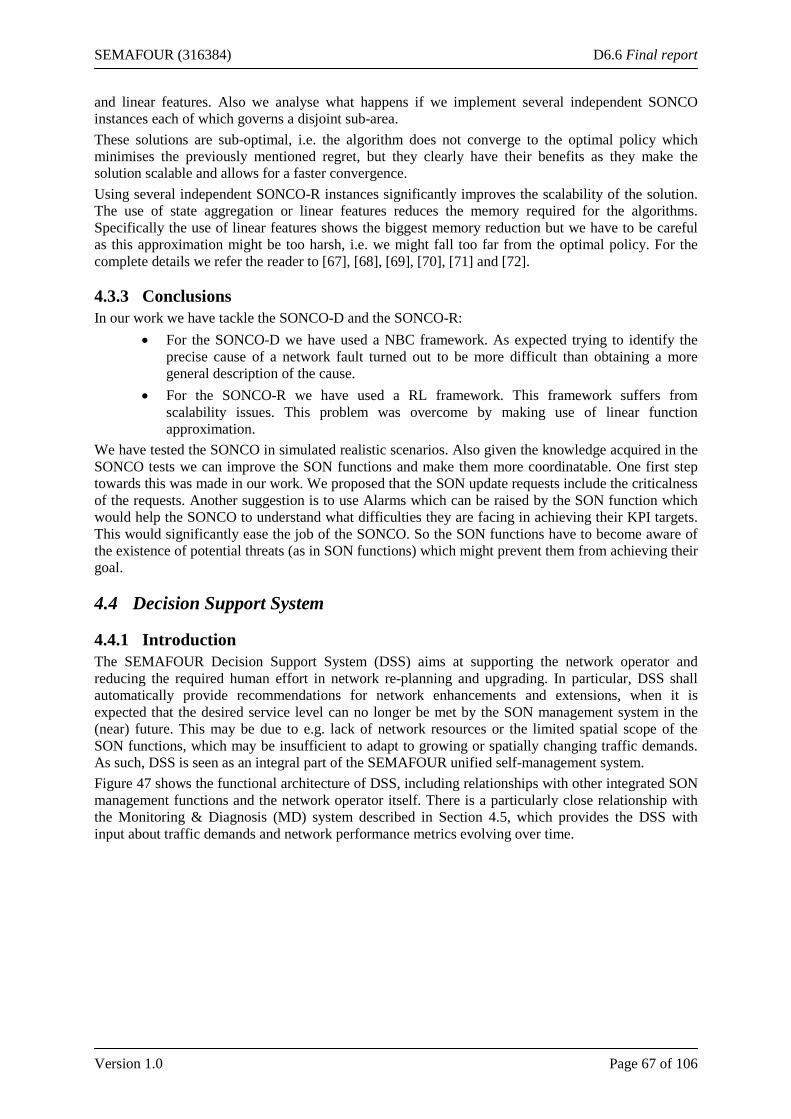
SEMAFOUR (316384) D6.6 Final report
Version 1.0 Page 67 of 106
and linear features. Also we analyse what happens if we implement several independent SONCO instances each of which governs a disjoint sub-area. These solutions are sub-optimal, i.e. the algorithm does not converge to the optimal policy which minimises the previously mentioned regret, but they clearly have their benefits as they make the solution scalable and allows for a faster convergence. Using several independent SONCO-R instances significantly improves the scalability of the solution. The use of state aggregation or linear features reduces the memory required for the algorithms. Specifically the use of linear features shows the biggest memory reduction but we have to be careful as this approximation might be too harsh, i.e. we might fall too far from the optimal policy. For the complete details we refer the reader to [67], [68], [69], [70], [71] and [72].
4.3.3 Conclusions In our work we have tackle the SONCO-D and the SONCO-R:
• For the SONCO-D we have used a NBC framework. As expected trying to identify the precise cause of a network fault turned out to be more difficult than obtaining a more general description of the cause.
• For the SONCO-R we have used a RL framework. This framework suffers from scalability issues. This problem was overcome by making use of linear function approximation.
We have tested the SONCO in simulated realistic scenarios. Also given the knowledge acquired in the SONCO tests we can improve the SON functions and make them more coordinatable. One first step towards this was made in our work. We proposed that the SON update requests include the criticalness of the requests. Another suggestion is to use Alarms which can be raised by the SON function which would help the SONCO to understand what difficulties they are facing in achieving their KPI targets. This would significantly ease the job of the SONCO. So the SON functions have to become aware of the existence of potential threats (as in SON functions) which might prevent them from achieving their goal.
4.4 Decision Support System
4.4.1 Introduction The SEMAFOUR Decision Support System (DSS) aims at supporting the network operator and reducing the required human effort in network re-planning and upgrading. In particular, DSS shall automatically provide recommendations for network enhancements and extensions, when it is expected that the desired service level can no longer be met by the SON management system in the (near) future. This may be due to e.g. lack of network resources or the limited spatial scope of the SON functions, which may be insufficient to adapt to growing or spatially changing traffic demands. As such, DSS is seen as an integral part of the SEMAFOUR unified self-management system. Figure 47 shows the functional architecture of DSS, including relationships with other integrated SON management functions and the network operator itself. There is a particularly close relationship with the Monitoring & Diagnosis (MD) system described in Section 4.5, which provides the DSS with input about traffic demands and network performance metrics evolving over time.
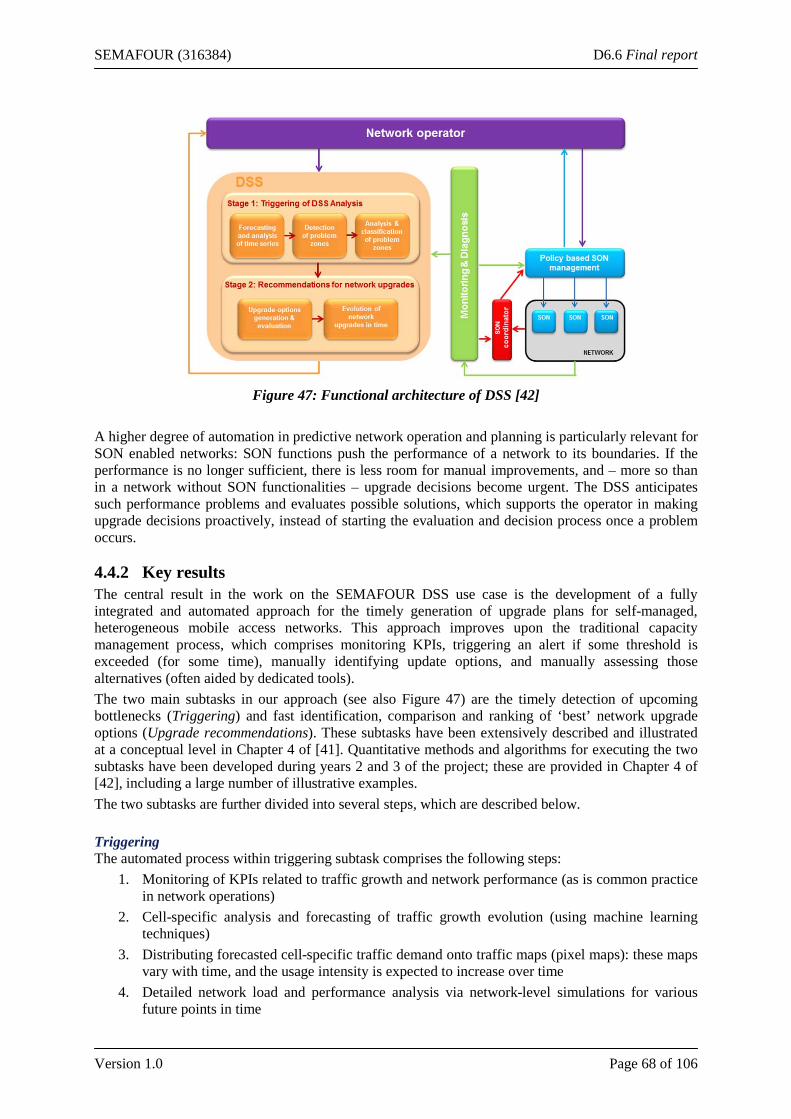
SEMAFOUR (316384) D6.6 Final report
Version 1.0 Page 68 of 106
Figure 47: Functional architecture of DSS [42]
A higher degree of automation in predictive network operation and planning is particularly relevant for SON enabled networks: SON functions push the performance of a network to its boundaries. If the performance is no longer sufficient, there is less room for manual improvements, and – more so than in a network without SON functionalities – upgrade decisions become urgent. The DSS anticipates such performance problems and evaluates possible solutions, which supports the operator in making upgrade decisions proactively, instead of starting the evaluation and decision process once a problem occurs.
4.4.2 Key results The central result in the work on the SEMAFOUR DSS use case is the development of a fully integrated and automated approach for the timely generation of upgrade plans for self-managed, heterogeneous mobile access networks. This approach improves upon the traditional capacity management process, which comprises monitoring KPIs, triggering an alert if some threshold is exceeded (for some time), manually identifying update options, and manually assessing those alternatives (often aided by dedicated tools). The two main subtasks in our approach (see also Figure 47) are the timely detection of upcoming bottlenecks (Triggering) and fast identification, comparison and ranking of ‘best’ network upgrade options (Upgrade recommendations). These subtasks have been extensively described and illustrated at a conceptual level in Chapter 4 of [41]. Quantitative methods and algorithms for executing the two subtasks have been developed during years 2 and 3 of the project; these are provided in Chapter 4 of [42], including a large number of illustrative examples. The two subtasks are further divided into several steps, which are described below. Triggering The automated process within triggering subtask comprises the following steps:
1. Monitoring of KPIs related to traffic growth and network performance (as is common practice in network operations)
2. Cell-specific analysis and forecasting of traffic growth evolution (using machine learning techniques)
3. Distributing forecasted cell-specific traffic demand onto traffic maps (pixel maps): these maps vary with time, and the usage intensity is expected to increase over time
4. Detailed network load and performance analysis via network-level simulations for various future points in time
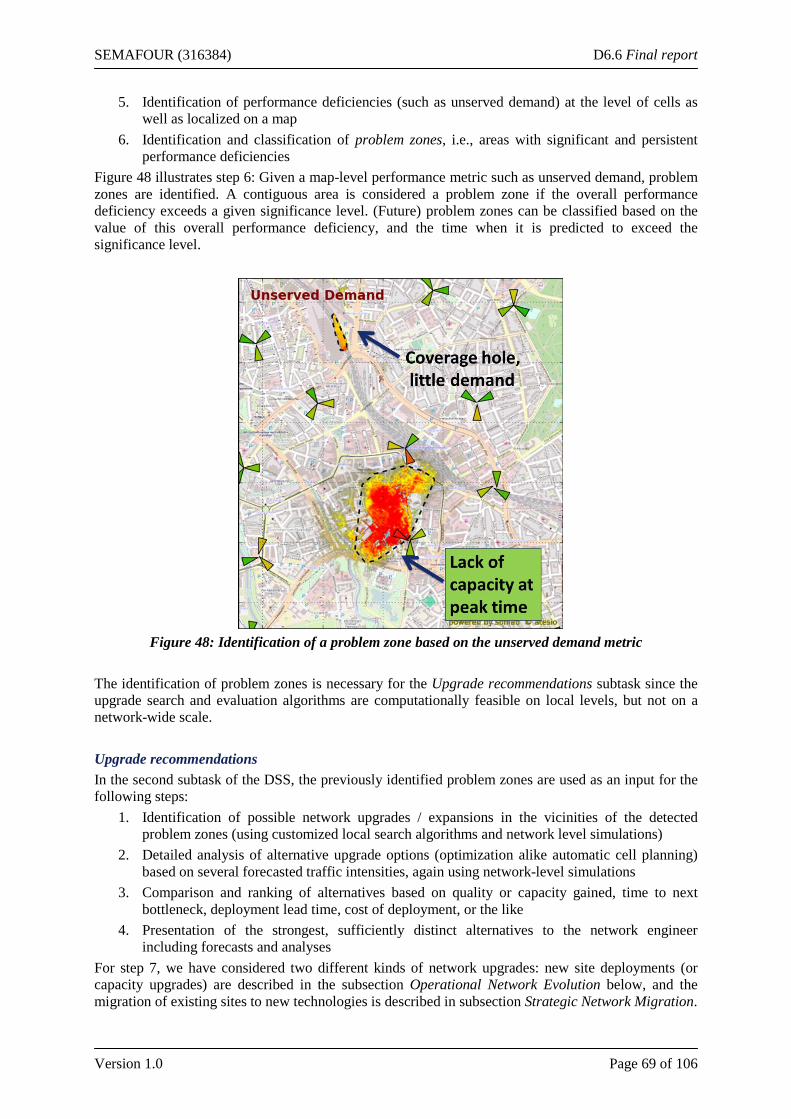
SEMAFOUR (316384) D6.6 Final report
Version 1.0 Page 69 of 106
5. Identification of performance deficiencies (such as unserved demand) at the level of cells as well as localized on a map
6. Identification and classification of problem zones, i.e., areas with significant and persistent performance deficiencies
Figure 48 illustrates step 6: Given a map-level performance metric such as unserved demand, problem zones are identified. A contiguous area is considered a problem zone if the overall performance deficiency exceeds a given significance level. (Future) problem zones can be classified based on the value of this overall performance deficiency, and the time when it is predicted to exceed the significance level.
Figure 48: Identification of a problem zone based on the unserved demand metric
The identification of problem zones is necessary for the Upgrade recommendations subtask since the upgrade search and evaluation algorithms are computationally feasible on local levels, but not on a network-wide scale. Upgrade recommendations In the second subtask of the DSS, the previously identified problem zones are used as an input for the following steps:
1. Identification of possible network upgrades / expansions in the vicinities of the detected problem zones (using customized local search algorithms and network level simulations)
2. Detailed analysis of alternative upgrade options (optimization alike automatic cell planning) based on several forecasted traffic intensities, again using network-level simulations
3. Comparison and ranking of alternatives based on quality or capacity gained, time to next bottleneck, deployment lead time, cost of deployment, or the like
4. Presentation of the strongest, sufficiently distinct alternatives to the network engineer including forecasts and analyses
For step 7, we have considered two different kinds of network upgrades: new site deployments (or capacity upgrades) are described in the subsection Operational Network Evolution below, and the migration of existing sites to new technologies is described in subsection Strategic Network Migration.
SEMAFOUR (316384) D6.6 Final report
Version 1.0 Page 70 of 106
Operational Network Evolution (ONE) Within DSS-ONE, the following network upgrades are considered and their predicted performance improvement evaluated:
• Deployment of a new macro site • Six-sectorisation of an existing macro site • Deployment of a new micro site
The search algorithm for finding possible upgrades also takes into account that these different upgrade options lead to different investment expenses, and upgrade alternatives are only considered if the corresponding performance improvements reflect this difference. The example shown in Figure 49 illustrates such a trade-off: The problem zone identified in Figure 48 can be resolved completely by deploying four micro sites. An alternative is to deploy only two micro sites, which partially resolves the problem zone at half the investment cost.
Figure 49: Two upgrade options, and their impact on the problem zone
The DSS-ONE approach has been implemented as part of the SEMAFOUR demonstrator, with a dedicated DSS Client described in Section 5.2.4, and a demonstration scenario illustrating the DSS-ONE methods and their potential benefits described in Section 5.3.6. Strategic Network Migration (SNM) The spectrum-related upgrades in the network are dealt with in the DSS-SNM use case:
• Spectrum re-farming from GSM to LTE • New carrier addition in operator’s LTE network
The spectrum re-farming aspects deal with reallocating the spectrum originally provided for one technology to another technology as the UE population distribution starts to change. One good example for such a spectrum re-farming is the allocation of GSM spectrum to another technology with higher spectral efficiency, such as LTE. In order to carry out such a migration, the operators need to have the plans in place well in advance, depending on the changes in the distribution of UEs with different capabilities in their network. On the other hand, once the operator has access to a newly acquired carrier, a detailed plan as to how to gradually integrate the new carrier into the existing operator’s network needs to be worked out. This integration process can be based on the (future) performance bottlenecks identified in the subtask Triggering, described above. The DSS-SNM use case is described in detail in [43].
SEMAFOUR (316384) D6.6 Final report
Version 1.0 Page 71 of 106
Implementation and interaction with network operators Regarding the operator’s business processes, the main implications of the implementation of the DSS into existing systems deal with feeding the system with up-to-date input and taking action based on the recommendations provided by DSS:
• The Operator needs to provide input on the current network configuration to the DSS and has to keep that information up-to-date, including upgrades already planned for the future but not yet effectuated.
• The Operator needs to provide input on costs of potential network upgrades (equipment costs, deployment costs), constraints regarding the use of potential upgrades (e.g. predefined location options for new base stations), deployment lead times, traffic growth forecasts based on market perspectives, etc. to the DSS
• DSS output (i.e. ranked alternatives for network upgrades in order to avoid future performance bottlenecks) may have to be further assessed by the operator, e.g. regarding actual costs and specific practical implications by taking into account more detailed information than available in the DSS. This may lead to changes in the ranking of the alternatives and/or slight refinement of the finally selected upgrade alternative.
During the migration from current practice (including the use of network planning tools) to a fully automated generation of network upgrade plans (ranked alternatives) by the DSS, the required actions from the operator side will diminish over time.
4.4.3 Conclusions Both the conceptual challenges posed in the DSS use and their practical implementation have been shown to be feasible: For all steps required for DSS, as described above, suitable models and algorithms were developed or found. The successful implementation of the DSS-ONE methods supports our claim of practical feasibility, with the bottleneck detection algorithms running continuously in the background, and the upgrade recommendation algorithms being triggered once a bottleneck is detected. While the models and methods used in most of the individual steps are already state-of-the-art, their combination and the degree of automation is novel (the network planner directly receives a list of preconfigured upgrade options). In addition, the fact that upgrade options are analysed with respect to several traffic forecasts instead of just a few (or just one) is important, as these results form the basis of an automated assessment, which is traditionally done manually by a network engineering expert.
4.5 Monitoring and Diagnostic
4.5.1 Introduction The Monitoring and Diagnosis (MD) function is a centralized network intelligence infrastructure component that automatically provides network intelligence for entities of the Integrated SON Management System. Its focus lies on aggregating, consolidating, and statistically analysing network status and performance data at the level of technical KPIs. The MD leverages centralisation effects for storage and computation of statistical data. The aim is to provide the basis for high-level SON management by providing statistical tools to characterise network context and behaviour. While most SON functions work within a local scope, relying on locally gathered performance data, e.g. for a single cell or site, the characterisation of a higher-level network context and performance enables SON management functions to relate SON function performance with high-level performance objectives. Based on MD intelligence, SON functions can be configured with respect to their broader network context and the role that they are supposed to play in achieving the overarching performance objectives. Using a statistical approach, network status and performance is identified, evaluated, and forecast with respect to the various requirements of the other entities of the Integrated SON Management System, e.g. PBSM and DSS.
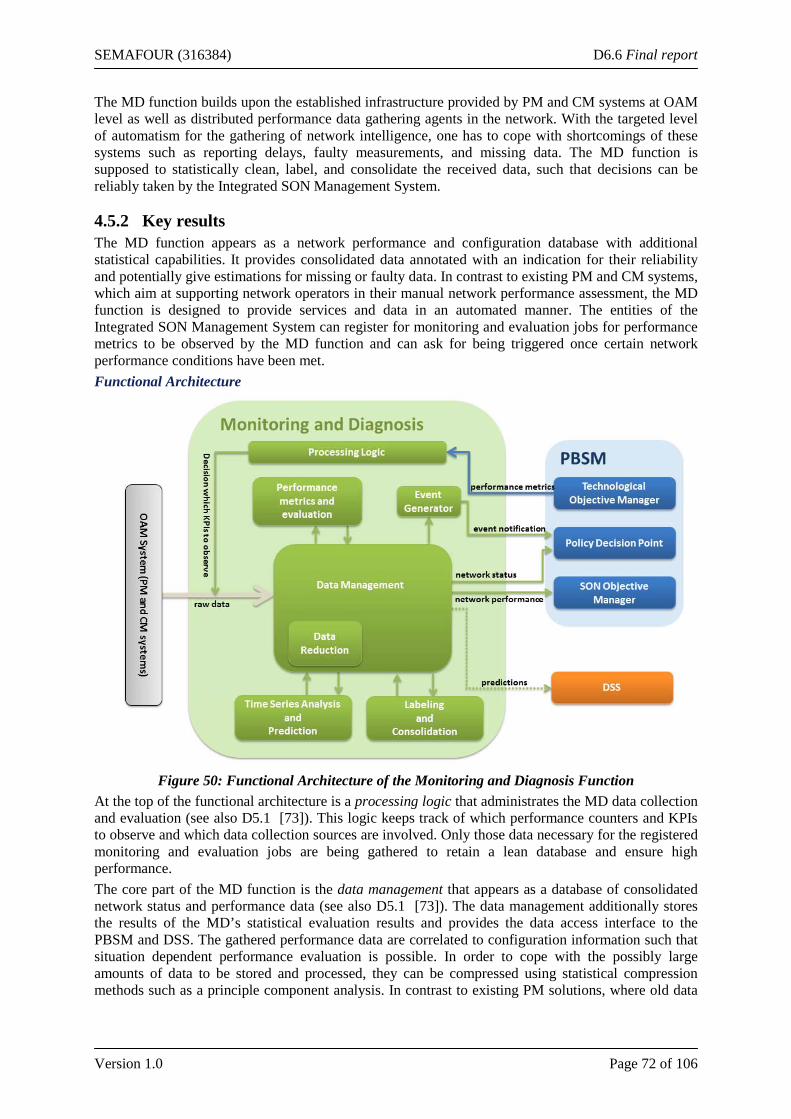
SEMAFOUR (316384) D6.6 Final report
Version 1.0 Page 72 of 106
The MD function builds upon the established infrastructure provided by PM and CM systems at OAM level as well as distributed performance data gathering agents in the network. With the targeted level of automatism for the gathering of network intelligence, one has to cope with shortcomings of these systems such as reporting delays, faulty measurements, and missing data. The MD function is supposed to statistically clean, label, and consolidate the received data, such that decisions can be reliably taken by the Integrated SON Management System.
4.5.2 Key results The MD function appears as a network performance and configuration database with additional statistical capabilities. It provides consolidated data annotated with an indication for their reliability and potentially give estimations for missing or faulty data. In contrast to existing PM and CM systems, which aim at supporting network operators in their manual network performance assessment, the MD function is designed to provide services and data in an automated manner. The entities of the Integrated SON Management System can register for monitoring and evaluation jobs for performance metrics to be observed by the MD function and can ask for being triggered once certain network performance conditions have been met. Functional Architecture
Figure 50: Functional Architecture of the Monitoring and Diagnosis Function
At the top of the functional architecture is a processing logic that administrates the MD data collection and evaluation (see also D5.1 [73]). This logic keeps track of which performance counters and KPIs to observe and which data collection sources are involved. Only those data necessary for the registered monitoring and evaluation jobs are being gathered to retain a lean database and ensure high performance. The core part of the MD function is the data management that appears as a database of consolidated network status and performance data (see also D5.1 [73]). The data management additionally stores the results of the MD’s statistical evaluation results and provides the data access interface to the PBSM and DSS. The gathered performance data are correlated to configuration information such that situation dependent performance evaluation is possible. In order to cope with the possibly large amounts of data to be stored and processed, they can be compressed using statistical compression methods such as a principle component analysis. In contrast to existing PM solutions, where old data
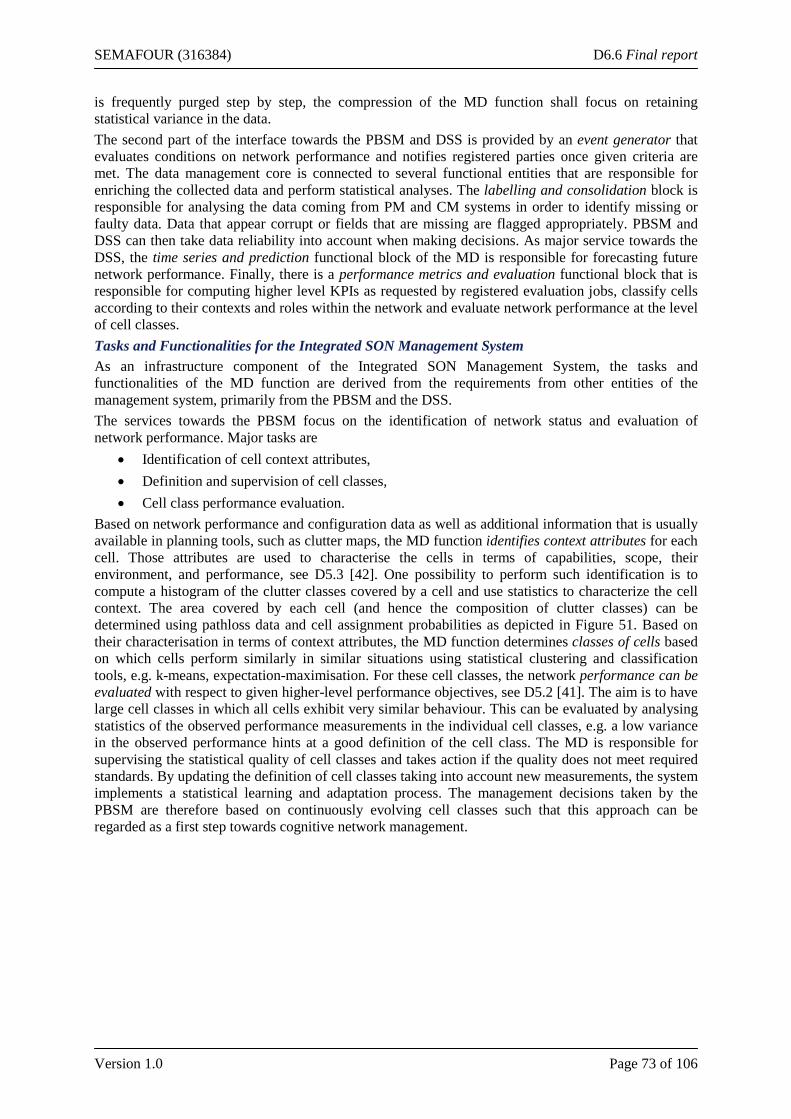
SEMAFOUR (316384) D6.6 Final report
Version 1.0 Page 73 of 106
is frequently purged step by step, the compression of the MD function shall focus on retaining statistical variance in the data. The second part of the interface towards the PBSM and DSS is provided by an event generator that evaluates conditions on network performance and notifies registered parties once given criteria are met. The data management core is connected to several functional entities that are responsible for enriching the collected data and perform statistical analyses. The labelling and consolidation block is responsible for analysing the data coming from PM and CM systems in order to identify missing or faulty data. Data that appear corrupt or fields that are missing are flagged appropriately. PBSM and DSS can then take data reliability into account when making decisions. As major service towards the DSS, the time series and prediction functional block of the MD is responsible for forecasting future network performance. Finally, there is a performance metrics and evaluation functional block that is responsible for computing higher level KPIs as requested by registered evaluation jobs, classify cells according to their contexts and roles within the network and evaluate network performance at the level of cell classes. Tasks and Functionalities for the Integrated SON Management System As an infrastructure component of the Integrated SON Management System, the tasks and functionalities of the MD function are derived from the requirements from other entities of the management system, primarily from the PBSM and the DSS. The services towards the PBSM focus on the identification of network status and evaluation of network performance. Major tasks are
• Identification of cell context attributes, • Definition and supervision of cell classes, • Cell class performance evaluation.
Based on network performance and configuration data as well as additional information that is usually available in planning tools, such as clutter maps, the MD function identifies context attributes for each cell. Those attributes are used to characterise the cells in terms of capabilities, scope, their environment, and performance, see D5.3 [42]. One possibility to perform such identification is to compute a histogram of the clutter classes covered by a cell and use statistics to characterize the cell context. The area covered by each cell (and hence the composition of clutter classes) can be determined using pathloss data and cell assignment probabilities as depicted in Figure 51. Based on their characterisation in terms of context attributes, the MD function determines classes of cells based on which cells perform similarly in similar situations using statistical clustering and classification tools, e.g. k-means, expectation-maximisation. For these cell classes, the network performance can be evaluated with respect to given higher-level performance objectives, see D5.2 [41]. The aim is to have large cell classes in which all cells exhibit very similar behaviour. This can be evaluated by analysing statistics of the observed performance measurements in the individual cell classes, e.g. a low variance in the observed performance hints at a good definition of the cell class. The MD is responsible for supervising the statistical quality of cell classes and takes action if the quality does not meet required standards. By updating the definition of cell classes taking into account new measurements, the system implements a statistical learning and adaptation process. The management decisions taken by the PBSM are therefore based on continuously evolving cell classes such that this approach can be regarded as a first step towards cognitive network management.
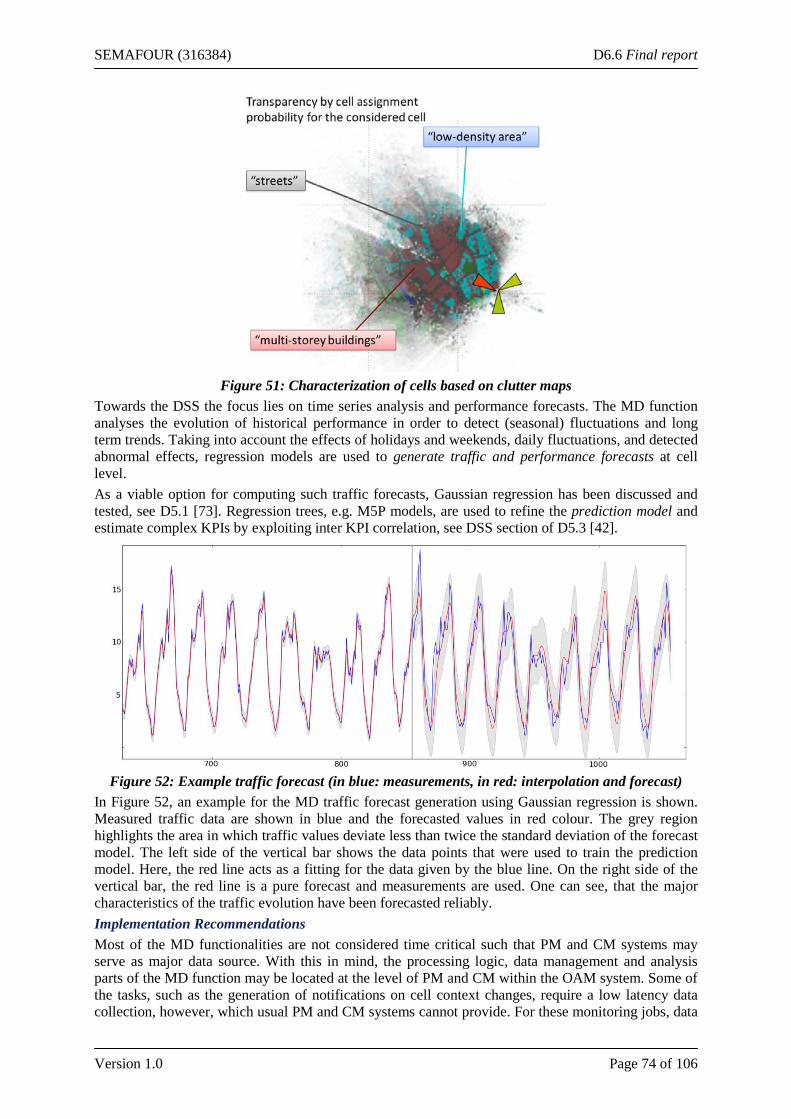
SEMAFOUR (316384) D6.6 Final report
Version 1.0 Page 74 of 106
Figure 51: Characterization of cells based on clutter maps
Towards the DSS the focus lies on time series analysis and performance forecasts. The MD function analyses the evolution of historical performance in order to detect (seasonal) fluctuations and long term trends. Taking into account the effects of holidays and weekends, daily fluctuations, and detected abnormal effects, regression models are used to generate traffic and performance forecasts at cell level. As a viable option for computing such traffic forecasts, Gaussian regression has been discussed and tested, see D5.1 [73]. Regression trees, e.g. M5P models, are used to refine the prediction model and estimate complex KPIs by exploiting inter KPI correlation, see DSS section of D5.3 [42].
Figure 52: Example traffic forecast (in blue: measurements, in red: interpolation and forecast)
In Figure 52, an example for the MD traffic forecast generation using Gaussian regression is shown. Measured traffic data are shown in blue and the forecasted values in red colour. The grey region highlights the area in which traffic values deviate less than twice the standard deviation of the forecast model. The left side of the vertical bar shows the data points that were used to train the prediction model. Here, the red line acts as a fitting for the data given by the blue line. On the right side of the vertical bar, the red line is a pure forecast and measurements are used. One can see, that the major characteristics of the traffic evolution have been forecasted reliably. Implementation Recommendations Most of the MD functionalities are not considered time critical such that PM and CM systems may serve as major data source. With this in mind, the processing logic, data management and analysis parts of the MD function may be located at the level of PM and CM within the OAM system. Some of the tasks, such as the generation of notifications on cell context changes, require a low latency data collection, however, which usual PM and CM systems cannot provide. For these monitoring jobs, data

SEMAFOUR (316384) D6.6 Final report
Version 1.0 Page 75 of 106
collection can be done by distributed monitoring agents residing at lower levels of the network hierarchy as detailed in Deliverable D5.4 [43].
4.6 Conclusions One of the key objectives of the SEMAFOUR project is the development of an Integrated SON Management system which interfaces between operator-defined performance objectives and the set of multi-RAT and multi-layer SON functions. The main goals of Integrated SON Management are thereby • To provide common means towards the operator to tailor the SON system, i.e., the multitude of
independently acting SON functions, according to its needs, • To build confidence into the autonomously operating SON system, and • To simplify the operation of a SON-enabled mobile radio network in order to contribute to a
reduction in operational efforts and expenditures. These goals have been mainly driven through the requirements, input and feedback of mobile network operators participating in the project or being members of the project Advisory Board. With this setup it could be ensured that the solutions developed for Integrated SON Management in its role as interface between the operator (or in particular, the operational personnel) and the SON system follow the requirements of the operators. This interaction between operators and the WP5 development is reflected through the activities described in D2.3 [74] and D5.4 [43]. Within Work Package 5, these main goals of Integrated SON Management have been addressed by designing, developing implementing and evaluating a set of four interconnected components for Integrated SON Management, namely: • Policy-Based SON Management, which represents the unified interface towards the operator
regarding the definition of performance targets and goals for the SON-enabled network and ensures the appropriate configuration of the (multi-vendor) SON system such that these targets and goals are met in the best possible way,
• Operational SON Coordination, which works at the level of the multitude of SON functions in order to ensure their conflict-free operation and thereby contributes to improving the operator’s trust in the SON system,
• Decision Support System, which covers the long-term perspective of the network’s performance and allows to timely identify shortcomings together with providing recommendations how they can be overcome,
• Monitoring & Diagnosis, which represents a central enabler for the other components in terms of providing the right information at the right point in time as input, but furthermore closes the information loop towards the operator through giving insight into the actual (current) performance of the network in comparison with the defined goals and targets.
In its entirety, the SEMAFOUR WP5 work on Integrated SON Management could thereby provide the following achievements: • Improved network manageability and operability: Operators don’t need to care about the
configuration of individual SON functions any more but define and supervise the overall performance targets for the complete network.
• Improved trust in network management automation: With a common tooling for SON instrumentation potential conflicts can be filtered out before the system becomes operational, and remaining conflicts are flexibly resolved according to the operator’s requirements and priorities – even in a multi-vendor environment

SEMAFOUR (316384) D6.6 Final report
Version 1.0 Page 76 of 106
• Bringing network planning to the next level: With a detailed location-specific prediction of bottlenecks and the recommendation of countermeasures, network extensions and upgrades can be implemented in those areas where they are really needful
• Reduction of operational and capital expenditures: Shifting the network operation to the next level by focusing on the reduction of operational efforts required to manage a SON-enabled network, together with supporting network planning, helps the operator to develop, maintain and manage a highly heterogeneous network infrastructure at its optimum.
The developed Integrated SON Management components clearly take significant steps toward the overall SEMAFOUR goal to design and develop a unified self-management system, which enables the network operators to holistically manage and operate their complex heterogeneous mobile networks.
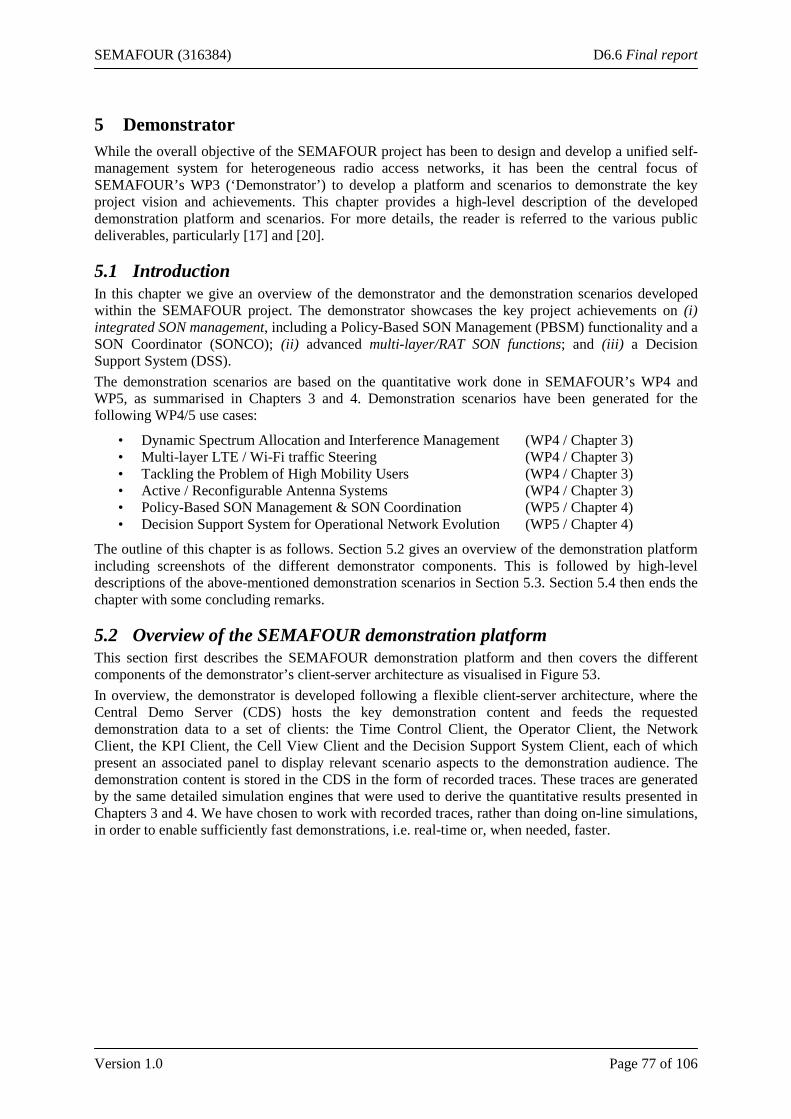
SEMAFOUR (316384) D6.6 Final report
Version 1.0 Page 77 of 106
5 Demonstrator While the overall objective of the SEMAFOUR project has been to design and develop a unified self-management system for heterogeneous radio access networks, it has been the central focus of SEMAFOUR’s WP3 (‘Demonstrator’) to develop a platform and scenarios to demonstrate the key project vision and achievements. This chapter provides a high-level description of the developed demonstration platform and scenarios. For more details, the reader is referred to the various public deliverables, particularly [17] and [20].
5.1 Introduction In this chapter we give an overview of the demonstrator and the demonstration scenarios developed within the SEMAFOUR project. The demonstrator showcases the key project achievements on (i) integrated SON management, including a Policy-Based SON Management (PBSM) functionality and a SON Coordinator (SONCO); (ii) advanced multi-layer/RAT SON functions; and (iii) a Decision Support System (DSS). The demonstration scenarios are based on the quantitative work done in SEMAFOUR’s WP4 and WP5, as summarised in Chapters 3 and 4. Demonstration scenarios have been generated for the following WP4/5 use cases:
• Dynamic Spectrum Allocation and Interference Management (WP4 / Chapter 3) • Multi-layer LTE / Wi-Fi traffic Steering (WP4 / Chapter 3) • Tackling the Problem of High Mobility Users (WP4 / Chapter 3) • Active / Reconfigurable Antenna Systems (WP4 / Chapter 3) • Policy-Based SON Management & SON Coordination (WP5 / Chapter 4) • Decision Support System for Operational Network Evolution (WP5 / Chapter 4)
The outline of this chapter is as follows. Section 5.2 gives an overview of the demonstration platform including screenshots of the different demonstrator components. This is followed by high-level descriptions of the above-mentioned demonstration scenarios in Section 5.3. Section 5.4 then ends the chapter with some concluding remarks.
5.2 Overview of the SEMAFOUR demonstration platform This section first describes the SEMAFOUR demonstration platform and then covers the different components of the demonstrator’s client-server architecture as visualised in Figure 53. In overview, the demonstrator is developed following a flexible client-server architecture, where the Central Demo Server (CDS) hosts the key demonstration content and feeds the requested demonstration data to a set of clients: the Time Control Client, the Operator Client, the Network Client, the KPI Client, the Cell View Client and the Decision Support System Client, each of which present an associated panel to display relevant scenario aspects to the demonstration audience. The demonstration content is stored in the CDS in the form of recorded traces. These traces are generated by the same detailed simulation engines that were used to derive the quantitative results presented in Chapters 3 and 4. We have chosen to work with recorded traces, rather than doing on-line simulations, in order to enable sufficiently fast demonstrations, i.e. real-time or, when needed, faster.
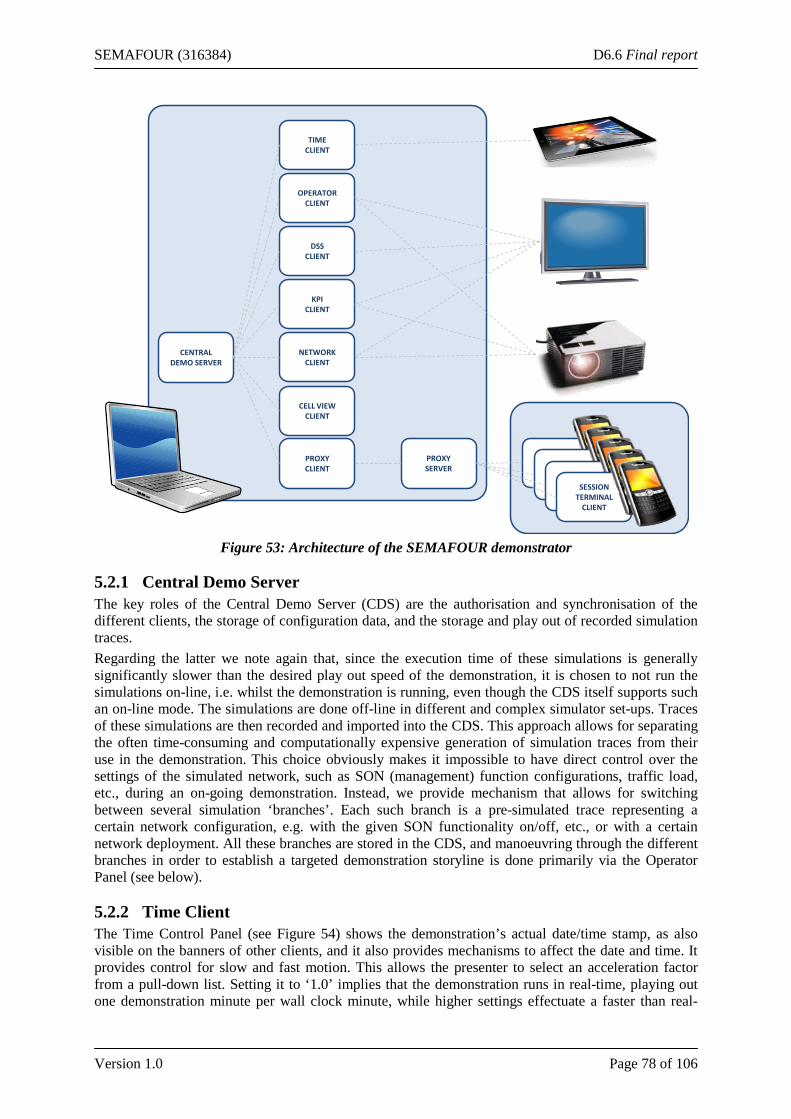
SEMAFOUR (316384) D6.6 Final report
Version 1.0 Page 78 of 106
Figure 53: Architecture of the SEMAFOUR demonstrator
5.2.1 Central Demo Server The key roles of the Central Demo Server (CDS) are the authorisation and synchronisation of the different clients, the storage of configuration data, and the storage and play out of recorded simulation traces. Regarding the latter we note again that, since the execution time of these simulations is generally significantly slower than the desired play out speed of the demonstration, it is chosen to not run the simulations on-line, i.e. whilst the demonstration is running, even though the CDS itself supports such an on-line mode. The simulations are done off-line in different and complex simulator set-ups. Traces of these simulations are then recorded and imported into the CDS. This approach allows for separating the often time-consuming and computationally expensive generation of simulation traces from their use in the demonstration. This choice obviously makes it impossible to have direct control over the settings of the simulated network, such as SON (management) function configurations, traffic load, etc., during an on-going demonstration. Instead, we provide mechanism that allows for switching between several simulation ‘branches’. Each such branch is a pre-simulated trace representing a certain network configuration, e.g. with the given SON functionality on/off, etc., or with a certain network deployment. All these branches are stored in the CDS, and manoeuvring through the different branches in order to establish a targeted demonstration storyline is done primarily via the Operator Panel (see below).
5.2.2 Time Client The Time Control Panel (see Figure 54) shows the demonstration’s actual date/time stamp, as also visible on the banners of other clients, and it also provides mechanisms to affect the date and time. It provides control for slow and fast motion. This allows the presenter to select an acceleration factor from a pull-down list. Setting it to ‘1.0’ implies that the demonstration runs in real-time, playing out one demonstration minute per wall clock minute, while higher settings effectuate a faster than real-
SESSIONTERMINAL
CLIENT
DSSCLIENT
CELL VIEWCLIENT
PROXYSERVER
NETWORKCLIENT
KPICLIENT
PROXYCLIENT SESSION
TERMINALCLIENT
SESSIONTERMINAL
CLIENTSESSION
TERMINALCLIENT
TIMECLIENT
OPERATORCLIENT
CENTRAL DEMO SERVER
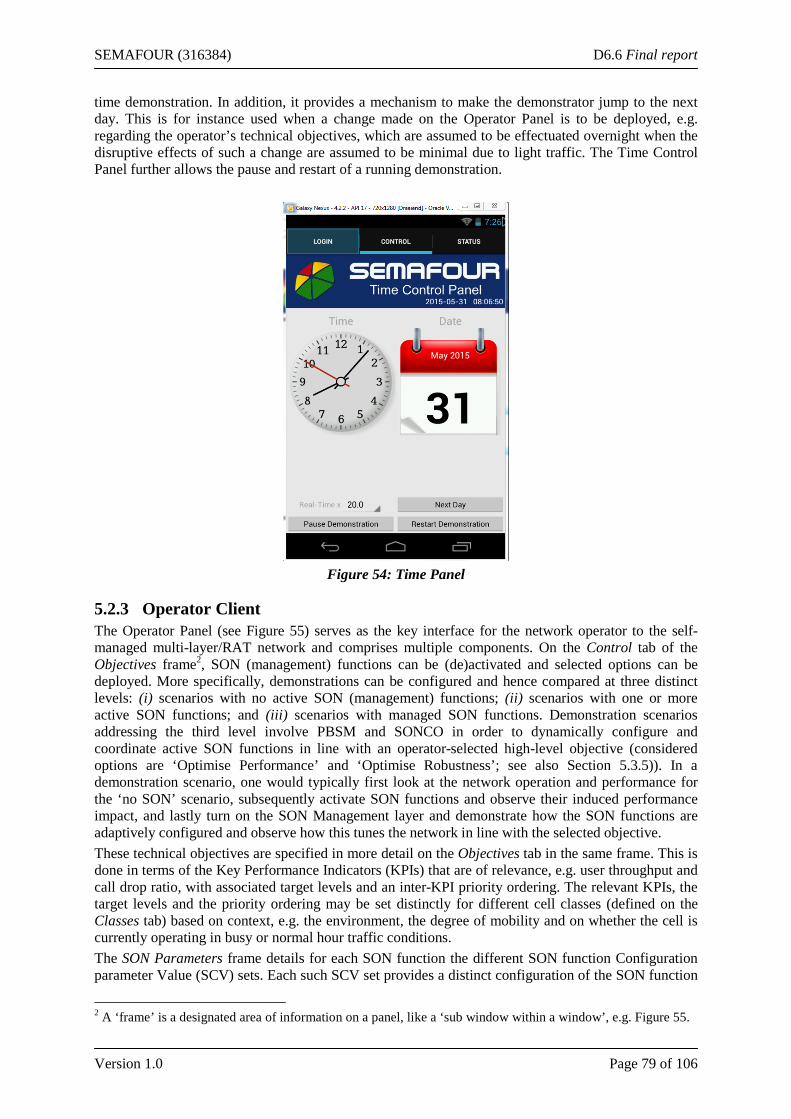
SEMAFOUR (316384) D6.6 Final report
Version 1.0 Page 79 of 106
time demonstration. In addition, it provides a mechanism to make the demonstrator jump to the next day. This is for instance used when a change made on the Operator Panel is to be deployed, e.g. regarding the operator’s technical objectives, which are assumed to be effectuated overnight when the disruptive effects of such a change are assumed to be minimal due to light traffic. The Time Control Panel further allows the pause and restart of a running demonstration.
Figure 54: Time Panel
5.2.3 Operator Client The Operator Panel (see Figure 55) serves as the key interface for the network operator to the self-managed multi-layer/RAT network and comprises multiple components. On the Control tab of the Objectives frame2, SON (management) functions can be (de)activated and selected options can be deployed. More specifically, demonstrations can be configured and hence compared at three distinct levels: (i) scenarios with no active SON (management) functions; (ii) scenarios with one or more active SON functions; and (iii) scenarios with managed SON functions. Demonstration scenarios addressing the third level involve PBSM and SONCO in order to dynamically configure and coordinate active SON functions in line with an operator-selected high-level objective (considered options are ‘Optimise Performance’ and ‘Optimise Robustness’; see also Section 5.3.5)). In a demonstration scenario, one would typically first look at the network operation and performance for the ‘no SON’ scenario, subsequently activate SON functions and observe their induced performance impact, and lastly turn on the SON Management layer and demonstrate how the SON functions are adaptively configured and observe how this tunes the network in line with the selected objective. These technical objectives are specified in more detail on the Objectives tab in the same frame. This is done in terms of the Key Performance Indicators (KPIs) that are of relevance, e.g. user throughput and call drop ratio, with associated target levels and an inter-KPI priority ordering. The relevant KPIs, the target levels and the priority ordering may be set distinctly for different cell classes (defined on the Classes tab) based on context, e.g. the environment, the degree of mobility and on whether the cell is currently operating in busy or normal hour traffic conditions. The SON Parameters frame details for each SON function the different SON function Configuration parameter Value (SCV) sets. Each such SCV set provides a distinct configuration of the SON function
2 A ‘frame’ is a designated area of information on a panel, like a ‘sub window within a window’, e.g. Figure 55.
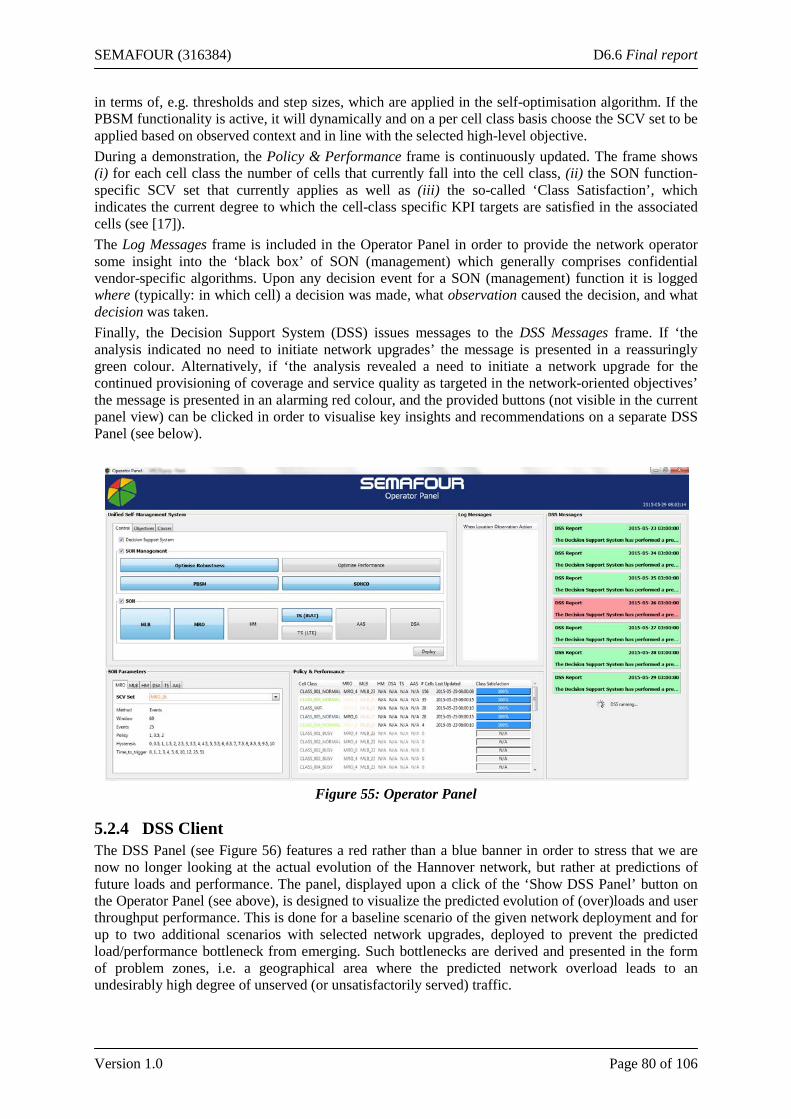
SEMAFOUR (316384) D6.6 Final report
Version 1.0 Page 80 of 106
in terms of, e.g. thresholds and step sizes, which are applied in the self-optimisation algorithm. If the PBSM functionality is active, it will dynamically and on a per cell class basis choose the SCV set to be applied based on observed context and in line with the selected high-level objective. During a demonstration, the Policy & Performance frame is continuously updated. The frame shows (i) for each cell class the number of cells that currently fall into the cell class, (ii) the SON function-specific SCV set that currently applies as well as (iii) the so-called ‘Class Satisfaction’, which indicates the current degree to which the cell-class specific KPI targets are satisfied in the associated cells (see [17]). The Log Messages frame is included in the Operator Panel in order to provide the network operator some insight into the ‘black box’ of SON (management) which generally comprises confidential vendor-specific algorithms. Upon any decision event for a SON (management) function it is logged where (typically: in which cell) a decision was made, what observation caused the decision, and what decision was taken. Finally, the Decision Support System (DSS) issues messages to the DSS Messages frame. If ‘the analysis indicated no need to initiate network upgrades’ the message is presented in a reassuringly green colour. Alternatively, if ‘the analysis revealed a need to initiate a network upgrade for the continued provisioning of coverage and service quality as targeted in the network-oriented objectives’ the message is presented in an alarming red colour, and the provided buttons (not visible in the current panel view) can be clicked in order to visualise key insights and recommendations on a separate DSS Panel (see below).
Figure 55: Operator Panel
5.2.4 DSS Client The DSS Panel (see Figure 56) features a red rather than a blue banner in order to stress that we are now no longer looking at the actual evolution of the Hannover network, but rather at predictions of future loads and performance. The panel, displayed upon a click of the ‘Show DSS Panel’ button on the Operator Panel (see above), is designed to visualize the predicted evolution of (over)loads and user throughput performance. This is done for a baseline scenario of the given network deployment and for up to two additional scenarios with selected network upgrades, deployed to prevent the predicted load/performance bottleneck from emerging. Such bottlenecks are derived and presented in the form of problem zones, i.e. a geographical area where the predicted network overload leads to an undesirably high degree of unserved (or unsatisfactorily served) traffic.
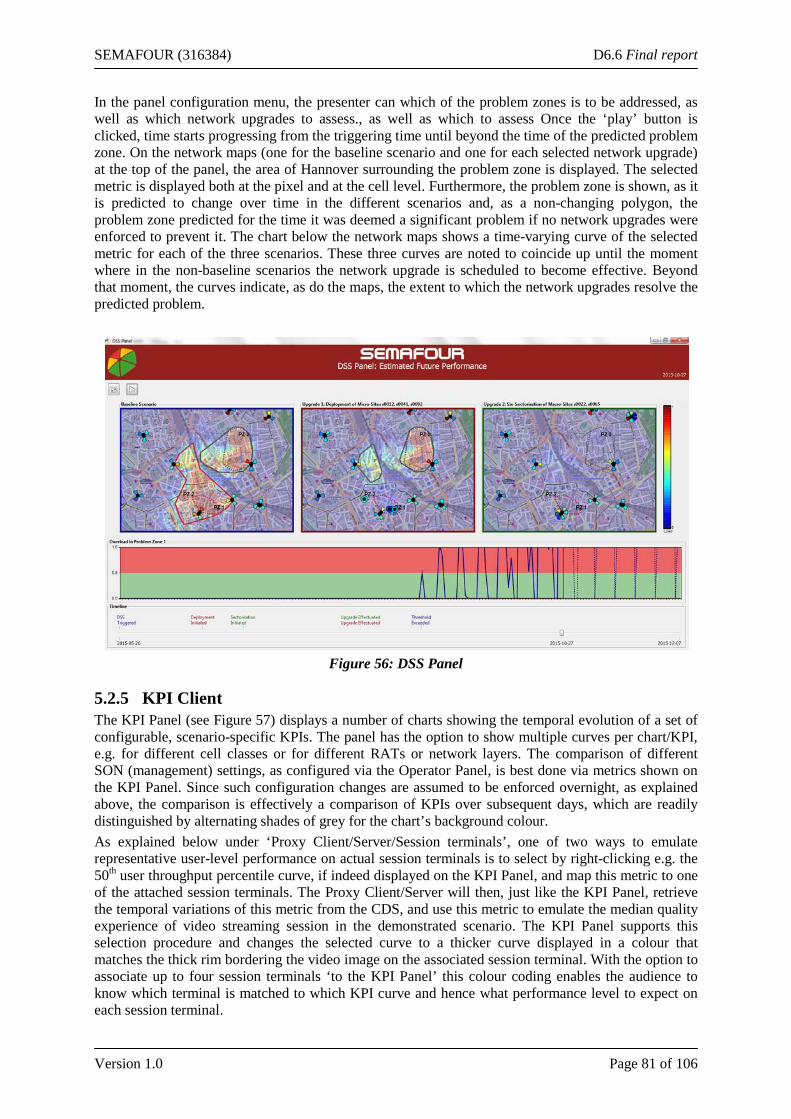
SEMAFOUR (316384) D6.6 Final report
Version 1.0 Page 81 of 106
In the panel configuration menu, the presenter can which of the problem zones is to be addressed, as well as which network upgrades to assess., as well as which to assess Once the ‘play’ button is clicked, time starts progressing from the triggering time until beyond the time of the predicted problem zone. On the network maps (one for the baseline scenario and one for each selected network upgrade) at the top of the panel, the area of Hannover surrounding the problem zone is displayed. The selected metric is displayed both at the pixel and at the cell level. Furthermore, the problem zone is shown, as it is predicted to change over time in the different scenarios and, as a non-changing polygon, the problem zone predicted for the time it was deemed a significant problem if no network upgrades were enforced to prevent it. The chart below the network maps shows a time-varying curve of the selected metric for each of the three scenarios. These three curves are noted to coincide up until the moment where in the non-baseline scenarios the network upgrade is scheduled to become effective. Beyond that moment, the curves indicate, as do the maps, the extent to which the network upgrades resolve the predicted problem.
Figure 56: DSS Panel
5.2.5 KPI Client The KPI Panel (see Figure 57) displays a number of charts showing the temporal evolution of a set of configurable, scenario-specific KPIs. The panel has the option to show multiple curves per chart/KPI, e.g. for different cell classes or for different RATs or network layers. The comparison of different SON (management) settings, as configured via the Operator Panel, is best done via metrics shown on the KPI Panel. Since such configuration changes are assumed to be enforced overnight, as explained above, the comparison is effectively a comparison of KPIs over subsequent days, which are readily distinguished by alternating shades of grey for the chart’s background colour. As explained below under ‘Proxy Client/Server/Session terminals’, one of two ways to emulate representative user-level performance on actual session terminals is to select by right-clicking e.g. the 50th user throughput percentile curve, if indeed displayed on the KPI Panel, and map this metric to one of the attached session terminals. The Proxy Client/Server will then, just like the KPI Panel, retrieve the temporal variations of this metric from the CDS, and use this metric to emulate the median quality experience of video streaming session in the demonstrated scenario. The KPI Panel supports this selection procedure and changes the selected curve to a thicker curve displayed in a colour that matches the thick rim bordering the video image on the associated session terminal. With the option to associate up to four session terminals ‘to the KPI Panel’ this colour coding enables the audience to know which terminal is matched to which KPI curve and hence what performance level to expect on each session terminal.
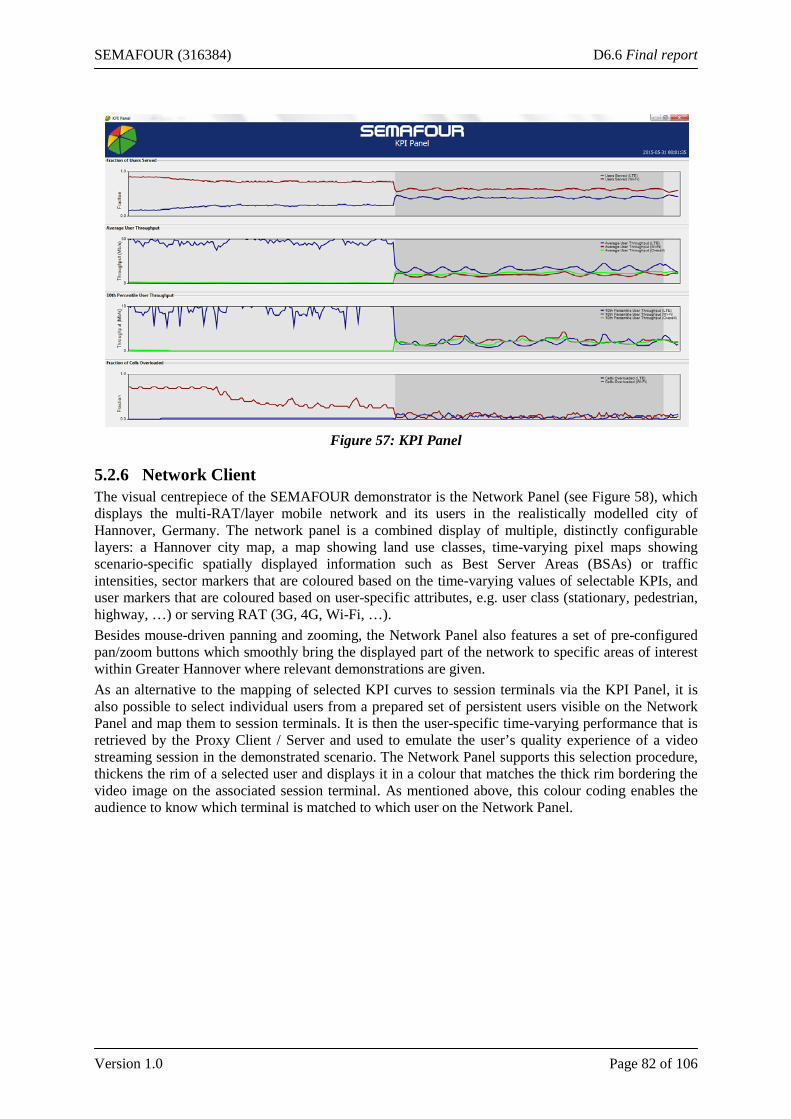
SEMAFOUR (316384) D6.6 Final report
Version 1.0 Page 82 of 106
Figure 57: KPI Panel
5.2.6 Network Client The visual centrepiece of the SEMAFOUR demonstrator is the Network Panel (see Figure 58), which displays the multi-RAT/layer mobile network and its users in the realistically modelled city of Hannover, Germany. The network panel is a combined display of multiple, distinctly configurable layers: a Hannover city map, a map showing land use classes, time-varying pixel maps showing scenario-specific spatially displayed information such as Best Server Areas (BSAs) or traffic intensities, sector markers that are coloured based on the time-varying values of selectable KPIs, and user markers that are coloured based on user-specific attributes, e.g. user class (stationary, pedestrian, highway, …) or serving RAT (3G, 4G, Wi-Fi, …). Besides mouse-driven panning and zooming, the Network Panel also features a set of pre-configured pan/zoom buttons which smoothly bring the displayed part of the network to specific areas of interest within Greater Hannover where relevant demonstrations are given. As an alternative to the mapping of selected KPI curves to session terminals via the KPI Panel, it is also possible to select individual users from a prepared set of persistent users visible on the Network Panel and map them to session terminals. It is then the user-specific time-varying performance that is retrieved by the Proxy Client / Server and used to emulate the user’s quality experience of a video streaming session in the demonstrated scenario. The Network Panel supports this selection procedure, thickens the rim of a selected user and displays it in a colour that matches the thick rim bordering the video image on the associated session terminal. As mentioned above, this colour coding enables the audience to know which terminal is matched to which user on the Network Panel.
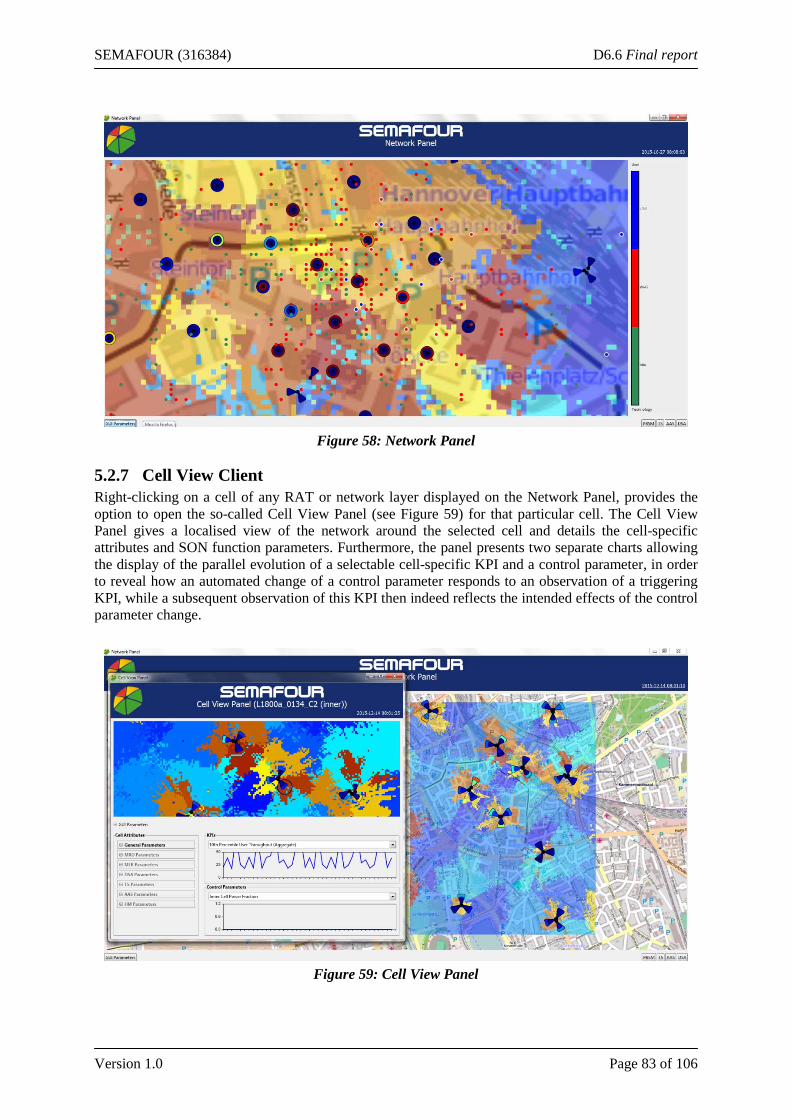
SEMAFOUR (316384) D6.6 Final report
Version 1.0 Page 83 of 106
Figure 58: Network Panel
5.2.7 Cell View Client Right-clicking on a cell of any RAT or network layer displayed on the Network Panel, provides the option to open the so-called Cell View Panel (see Figure 59) for that particular cell. The Cell View Panel gives a localised view of the network around the selected cell and details the cell-specific attributes and SON function parameters. Furthermore, the panel presents two separate charts allowing the display of the parallel evolution of a selectable cell-specific KPI and a control parameter, in order to reveal how an automated change of a control parameter responds to an observation of a triggering KPI, while a subsequent observation of this KPI then indeed reflects the intended effects of the control parameter change.
Figure 59: Cell View Panel
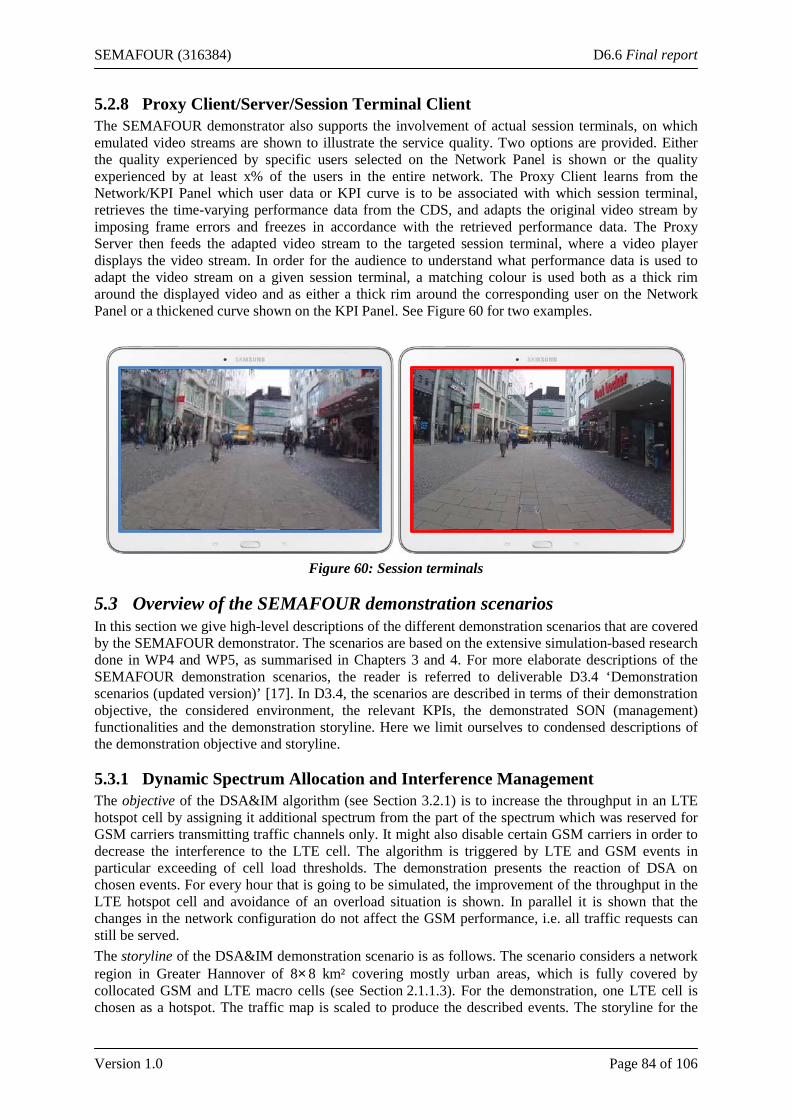
SEMAFOUR (316384) D6.6 Final report
Version 1.0 Page 84 of 106
5.2.8 Proxy Client/Server/Session Terminal Client The SEMAFOUR demonstrator also supports the involvement of actual session terminals, on which emulated video streams are shown to illustrate the service quality. Two options are provided. Either the quality experienced by specific users selected on the Network Panel is shown or the quality experienced by at least x% of the users in the entire network. The Proxy Client learns from the Network/KPI Panel which user data or KPI curve is to be associated with which session terminal, retrieves the time-varying performance data from the CDS, and adapts the original video stream by imposing frame errors and freezes in accordance with the retrieved performance data. The Proxy Server then feeds the adapted video stream to the targeted session terminal, where a video player displays the video stream. In order for the audience to understand what performance data is used to adapt the video stream on a given session terminal, a matching colour is used both as a thick rim around the displayed video and as either a thick rim around the corresponding user on the Network Panel or a thickened curve shown on the KPI Panel. See Figure 60 for two examples.
Figure 60: Session terminals
5.3 Overview of the SEMAFOUR demonstration scenarios In this section we give high-level descriptions of the different demonstration scenarios that are covered by the SEMAFOUR demonstrator. The scenarios are based on the extensive simulation-based research done in WP4 and WP5, as summarised in Chapters 3 and 4. For more elaborate descriptions of the SEMAFOUR demonstration scenarios, the reader is referred to deliverable D3.4 ‘Demonstration scenarios (updated version)’ [17]. In D3.4, the scenarios are described in terms of their demonstration objective, the considered environment, the relevant KPIs, the demonstrated SON (management) functionalities and the demonstration storyline. Here we limit ourselves to condensed descriptions of the demonstration objective and storyline.
5.3.1 Dynamic Spectrum Allocation and Interference Management The objective of the DSA&IM algorithm (see Section 3.2.1) is to increase the throughput in an LTE hotspot cell by assigning it additional spectrum from the part of the spectrum which was reserved for GSM carriers transmitting traffic channels only. It might also disable certain GSM carriers in order to decrease the interference to the LTE cell. The algorithm is triggered by LTE and GSM events in particular exceeding of cell load thresholds. The demonstration presents the reaction of DSA on chosen events. For every hour that is going to be simulated, the improvement of the throughput in the LTE hotspot cell and avoidance of an overload situation is shown. In parallel it is shown that the changes in the network configuration do not affect the GSM performance, i.e. all traffic requests can still be served. The storyline of the DSA&IM demonstration scenario is as follows. The scenario considers a network region in Greater Hannover of 8×8 km² covering mostly urban areas, which is fully covered by collocated GSM and LTE macro cells (see Section 2.1.1.3). For the demonstration, one LTE cell is chosen as a hotspot. The traffic map is scaled to produce the described events. The storyline for the
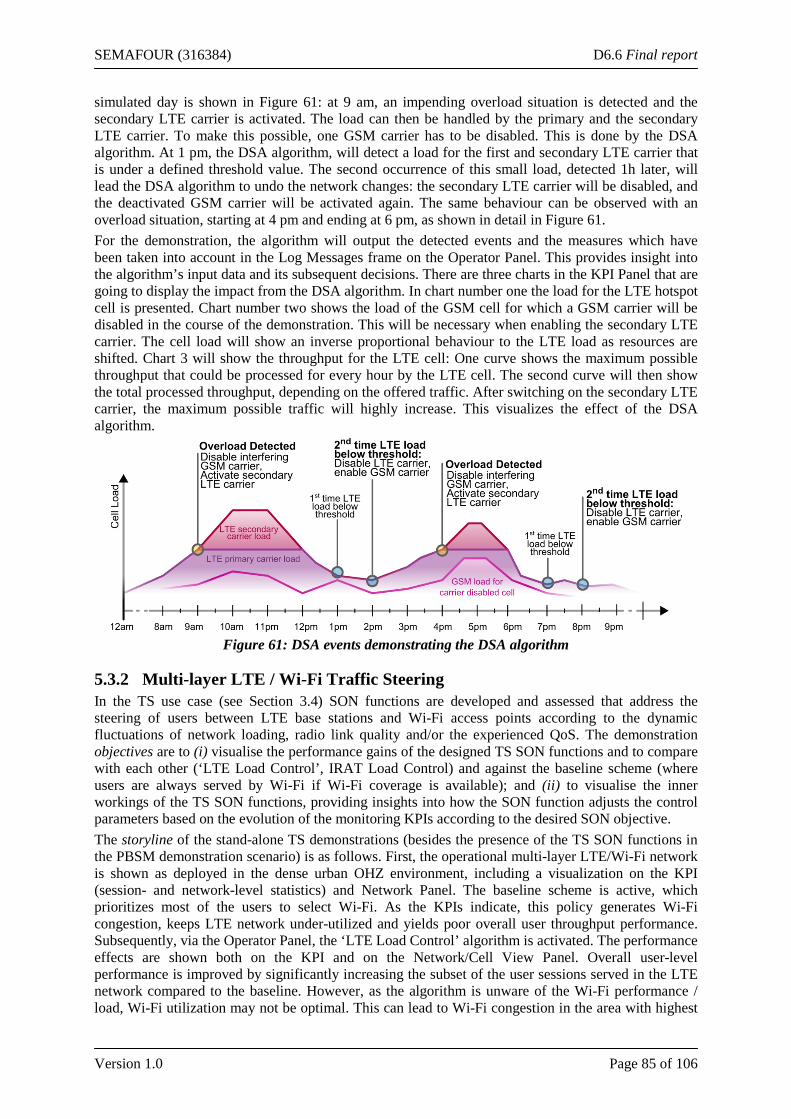
SEMAFOUR (316384) D6.6 Final report
Version 1.0 Page 85 of 106
simulated day is shown in Figure 61: at 9 am, an impending overload situation is detected and the secondary LTE carrier is activated. The load can then be handled by the primary and the secondary LTE carrier. To make this possible, one GSM carrier has to be disabled. This is done by the DSA algorithm. At 1 pm, the DSA algorithm, will detect a load for the first and secondary LTE carrier that is under a defined threshold value. The second occurrence of this small load, detected 1h later, will lead the DSA algorithm to undo the network changes: the secondary LTE carrier will be disabled, and the deactivated GSM carrier will be activated again. The same behaviour can be observed with an overload situation, starting at 4 pm and ending at 6 pm, as shown in detail in Figure 61. For the demonstration, the algorithm will output the detected events and the measures which have been taken into account in the Log Messages frame on the Operator Panel. This provides insight into the algorithm’s input data and its subsequent decisions. There are three charts in the KPI Panel that are going to display the impact from the DSA algorithm. In chart number one the load for the LTE hotspot cell is presented. Chart number two shows the load of the GSM cell for which a GSM carrier will be disabled in the course of the demonstration. This will be necessary when enabling the secondary LTE carrier. The cell load will show an inverse proportional behaviour to the LTE load as resources are shifted. Chart 3 will show the throughput for the LTE cell: One curve shows the maximum possible throughput that could be processed for every hour by the LTE cell. The second curve will then show the total processed throughput, depending on the offered traffic. After switching on the secondary LTE carrier, the maximum possible traffic will highly increase. This visualizes the effect of the DSA algorithm.
Figure 61: DSA events demonstrating the DSA algorithm
5.3.2 Multi-layer LTE / Wi-Fi Traffic Steering In the TS use case (see Section 3.4) SON functions are developed and assessed that address the steering of users between LTE base stations and Wi-Fi access points according to the dynamic fluctuations of network loading, radio link quality and/or the experienced QoS. The demonstration objectives are to (i) visualise the performance gains of the designed TS SON functions and to compare with each other (‘LTE Load Control’, IRAT Load Control) and against the baseline scheme (where users are always served by Wi-Fi if Wi-Fi coverage is available); and (ii) to visualise the inner workings of the TS SON functions, providing insights into how the SON function adjusts the control parameters based on the evolution of the monitoring KPIs according to the desired SON objective. The storyline of the stand-alone TS demonstrations (besides the presence of the TS SON functions in the PBSM demonstration scenario) is as follows. First, the operational multi-layer LTE/Wi-Fi network is shown as deployed in the dense urban OHZ environment, including a visualization on the KPI (session- and network-level statistics) and Network Panel. The baseline scheme is active, which prioritizes most of the users to select Wi-Fi. As the KPIs indicate, this policy generates Wi-Fi congestion, keeps LTE network under-utilized and yields poor overall user throughput performance. Subsequently, via the Operator Panel, the ‘LTE Load Control’ algorithm is activated. The performance effects are shown both on the KPI and on the Network/Cell View Panel. Overall user-level performance is improved by significantly increasing the subset of the user sessions served in the LTE network compared to the baseline. However, as the algorithm is unware of the Wi-Fi performance / load, Wi-Fi utilization may not be optimal. This can lead to Wi-Fi congestion in the area with highest
SEMAFOUR (316384) D6.6 Final report
Version 1.0 Page 86 of 106
traffic demand. Finally, again via the Operator Panel, the ‘IRAT Load Control algorithm is activated. As shown both on the KPI and on the Network/Cell View Panel, overall user-level performance is further improved by serving more optimally the user sessions in the LTE and Wi-Fi network. Wi-Fi congestion is limited or avoided altogether. Figure 57 (included in Section 5.2.5) is a KPI Panel snapshot taken when changing from the baseline scheme to the IRAT Load Control SON function. The transition between the two schemes can be distinguished by the alternating shades of grey for the chart’s background colour. As the depicted charts show, when enabling the SON function the user throughput performance significantly increases along with the LTE utilization. At the same time the overload in Wi-Fi (see the fraction of cells overloaded metric) significantly decreases as expected. The traffic steering demonstration scenario makes use of the demonstrator’s capability to emulate the performance experience in affected video streaming sessions, see also Section 5.2.8. Figure 60 illustrates the emulated video stream of a user mapped to the 10th user throughput percentile from the KPI Panel generated for the baseline scheme (left) and for the IRAT Load Control scheme (right). The snapshots reflect that the experienced video quality is significantly improved when enabling TS SON.
5.3.3 Tackling the Problem of High Mobility Users The High Mobility SON function (see Section 3.5) effectively reduces short stays of highly mobile users in cells. This is achieved by predicting the mobility behaviour based on measurements, and by consequently refraining from handovers to cells in which the user is likely to stay for only a small amount of time and steering the user to the most appropriate cell / cell layer. The objectives of the associated demonstration scenario are (i) to show the benefits of reducing the number of short stays in a cell and to show how the developed SON function reduces the number of short stays by giving insight in the actions that are taken by it; and (ii) to show how the High Mobility SON function can be integrated in the Policy-Based SON Management function (see also Section 5.3.5) and how its configuration parameters are dynamically adapted, depending on the high-level operator goals. It is noted that the High Mobility SON function is demonstrated as part of the ‘Policy-Based SON Management & SON Coordination’ demonstration scenario (see Section 5.3.5). The demonstration storyline of the High Mobility component of this scenario is as follows. While demonstrating the PBSM functionality at a point where the SON management function has activated and configured the High Mobility SON function, the reference trajectories drawn on the network panel are pointed out. Lines that are drawn along the trajectory of the tagged user from which the reference trace originated will indicate these. The ‘Log Messages’ frame on the Operator Panel lists the actions that have been taken by the SON function. It is then explained that the SON function matches active users to one of the available reference trajectories. When such a match is made, the RSRP that was experienced by the reference users in both the serving cell as well as in the neighbouring cells is projected on the active user by scaling the timing of the reference trace by the ratio of the durations of the active match and the reference match. From the projected RSRP the SINR and throughput in the serving cell as well as the neighbouring cells will be calculated. A user is then steered to a neighbouring cell if it finds periods in the future that satisfy certain conditions. If multiple such periods are found, the user is steered to the NeNB for which the predicted average throughput is the highest. The benefits of the High Mobility SON function are mentioned along the other results in the ‘Policy-Based SON Management & SON Coordination’ scenario, noting in particular that the short stay fraction is reduced.
5.3.4 Active / Reconfigurable Antenna Systems The AAS use case (see Section 3.6) calls for SON solutions to exploit the potential for performance/capacity enhancement of Active Antenna Systems, concentrating e.g. on the application of Vertical Sectorisation (VS). The demonstration objective is to show the cell-specific and network-wide performance enhancement that SON-based dynamic activation and configuration (inner/outer cell power split) of VS offers in a realistic network deployment, compared to a baseline scenario where VS is always active in each cell with a prefixed inner/outer cell power split.
SEMAFOUR (316384) D6.6 Final report
Version 1.0 Page 87 of 106
The AAS demonstration has the following storyline. First, the operation of the Hannover network is shown when the SON algorithm is inactive and VS is active in every cell with a 50:50 power split between the inner and outer sectors. The fixed Best Server Area maps (see Figure 59) on the Network Panel show that the inner cells are indeed always present and the cells’ service areas are fixed. The Cell View Panel (see Figure 59) for a highly loaded cell is used to show e.g. the throughput performance as aggregated over the inner and outer cell. Subsequently, the AAS SON function is activated via the Operator Panel. On the Network Panel it is now visible that the inner cells are dynamically (de)activated and the Best Server Areas change accordingly. In contrast to the first shown case without SON-optimised AAS settings, the charts on the KPI Panel showing the number of VS (de)activations and the number of handovers now actually show positive values. More importantly, the area-wide user throughput performance as displayed on the KPI Panel shows a small improvement compared to the ‘no SON’ case. Revisiting the same cell as previously in the Cell View Panel, the depicted charts now show how the cell’s (in)active status varies over time in accordance with (driven by) the relative position of the Inner/Outer Cell Load Ratio compared to the SON function’s configured threshold parameter. Furthermore, the fraction of power assigned to the inner cell is dynamically adapted to e.g. the inner and outer cell loads. The throughput performance determined over the aggregation of the (dynamically (dis)appearing) inner and outer cells is observed to be higher now that in the ‘no SON’ scenario, which exemplifies the performance gain of applying SON, particularly in highly loaded cells.
5.3.5 Policy-Based SON Management & SON Coordination The Policy-Based SON Management (PBSM) and SON Coordination (SONCO) functionalities provide means for a network operator to enable an automated and autonomous configuration and conflict-free operation of a multitude of individually operating SON functions according to a set of pre-defined network-level performance objectives (See Sections 0 and 4.3). The key objective of the PBSM/SONCO demonstration scenario is to showcase the newly developed approach of instrumenting and managing a SON-enabled radio access network from the operator’s perspective. It is shown how the operator can define cell class-specific performance objectives, deploy these objectives, monitor the consequent time-varying SON function configuration, observe occasional conflict detections and resolutions by the SON Coordinator, and monitor the impact on network performance and the degree of achievement of the objectives. The PBSM/SONCO demonstration scenario covers the ‘legacy’ SON functions of MRO and MLB as well as the SEMAFOUR-developed ‘High Mobility’ and ‘Multi-layer LTE / Wi-Fi Traffic Steering’ SON functions. The storyline of the PBSM/SONCO demonstration scenario comprises the following steps: (i) network context / cell classification; (ii) network operation with no SON; (iii) network operation with default SON; (iv) operator process to define new or select pre-defined objectives; (v) network operation with PBSM-managed SON functions. In the ‘network context / cell classification’ step, the different cell classes, as defined on the Operator Panel are introduced. The classes depend on e.g. the degree of mobility, the environment and also the time of day. On the Network Panel the colour code of each cell can be configured to indicate the cell’s (current) cell class. In the ‘network operation with no SON’ step no SON functions are activated. The demonstration scenario then shows a non-optimised operational network, which is characterised by suboptimal network performance as seen from the KPIs on the KPI Panel, where e.g. handover failures, overload situations and suboptimal resource efficiency and user satisfaction are seen. Subsequently, in the ‘network operation with default SON’ step, all above-listed SON functions available for PBSM are active with a fixed/default configuration and without any SON Coordination. This scenario shows the performance advantages of SON-based network management in comparison with the ‘no SON’ baseline scenario. Since the SON functions are not configured automatically through PBSM and no SON Coordinator is available, the observed KPIs are still suboptimal, while conflicts occurring between SON functions may even lead to or undesired KPI behaviour, for example in terms of high Call Drop Rate or high Handover Failure rate. In the ‘operator process to define new or select pre-defined objectives’ step, the actual PBSM/SONCO-driven network management scenarios are prepared. In this step the definition of
SEMAFOUR (316384) D6.6 Final report
Version 1.0 Page 88 of 106
operator objectives is shown on the Operator Panel, involving a list of selected and suitably prioritised KPIs with their target values, all of which done on a per cell class level. Two pre-defined objective sets are considered in the demonstration scenario, viz. ‘Optimise Robustness’ and ‘Optimise Performance’, which are then used in the fifth and final demonstration step. The ‘network operation with PBSM-managed SON functions’ step represents the Integrated SON Management approach in its full stage of expansion, i.e. all SON/SON Management functionality active. One of the two mentioned pre-defined objective sets is activated. The Policy System then dynamically selects for each cell class the most suitable SON Function Configuration Value (SCV) Sets and configures the SON functions accordingly. The effect can be viewed from the Operator Panel (see also Figure 55). During the runtime of the demonstration, different effects are visualised on the Network, KPI and Operator Panels. With the change from ‘normal’ to ‘busy hours’, cells undergo changes in their cell class and hence possibly also in their assigned SCV sets. Furthermore, the functioning of the SON Coordinator can be observed via the ‘Log Messages’ frame on the Operator Panel, where observed conflicts between concurrent SON functions in a cell as well as the applied resolutions are noted. The performance impact of the different Objective Sets in this final scenario step is observed from the KPI Panel, noting the improvement over the ‘default SON’ and ‘no SON’ reference cases.
5.3.6 Decision Support System for Operational Network Evolution The Decision Support System (DSS) exploits network intelligence to support the network operator in making proactive network upgrade decisions. This is achieved by using predictive assessments of future traffic growth and its consequences for network loads and/or performance, evaluating several network upgrade options to derive and present recommendations. The objective of the DSS demonstration scenario is to visualise both the functionalities developed in the DSS use case and the performance improvements achievable by implementing them. In particular, what is demonstrated is (i) the predicted deterioration of the network load/performance over time in a traffic growth scenario, assuming the baseline case where no network upgrades are deployed to cope with the traffic growth; (ii) the early detection of problem zones that are expected to arise within a period of four months based on the predicted traffic intensity maps; (iii) the load/performance improvements corresponding to a short-list of recommended network upgrade options. The storyline of the DSS demonstration scenario starts by viewing the ‘Decision Support System’ frame on the Operator Panel. Among a series of green messages effectively stating that the DSS analyses foresee no performance bottlenecks in the near future, occasionally a red message is shown, alerting the network operator by indicating that the performed ‘DSS analysis revealed a need to initiate a network upgrade for the continued provisioning of coverage and service quality as targeted in the network-oriented objectives’. A click on the ‘Show DSS Panel’ button opens the DSS Panel, as shown previously in Figure 56, which is not showing the actual evolution of the Hannover network, but rather predictions of future load/performance in the form of so-called problem zones. These are regions in the network where the predicted loads are deemed too high to allow performance targets to be satisfied. Via the panel’s configuration menu we can select the most urgent problem zone we wish to analyse, as well as select two correspondingly recommended network upgrades from a presented short-list. For the selected problem zone, this short-list contains network upgrades involving the deployment of micro-sites and/or the six-sectorisation of existing macro-sites in or near the problem zone. Upon clicking the ‘Play’ button the DSS Panel, the selected scenarios will be animated on the panel. The network view shows the immediate surroundings of the predicted problem zone, which itself is indicated with a red dashed line polygon. The time-varying background colour map shown in each of the views, gives a spatial presentation of the predicted overload, while also the cell markers themselves are coloured to indicate their cell-specific load predictions. On the timeline, distinct markers indicate key events, including the day at which the selected problem zone was predicted to emerge. From this day backwards, the DSS derives for each selected upgrade the day at which the deployment of the upgrade should be initiated. This takes typical deployment lead times into account, which depend on the nature of the upgrade. Once upgrades become active, which is scheduled to occur a week before the bottleneck is predicted to emerge, the network changes become visible in the network views. A week later, indeed, the problem zone arises on the left-most view (the baseline scenario with no upgrades), visible as a red solid line polygon which continues to
SEMAFOUR (316384) D6.6 Final report
Version 1.0 Page 89 of 106
grow over time, as the increasing traffic worsens the overload in the area and no upgrade is effectuated to resolve this. In the upgrade scenarios, the effects of the network resources that are added to the region buy the deployed network changes, are clearly visible in that the load situation is improved and, in particular, the predicted overload does not arise. The shown chart shows the same effects. Considering these predicted load effects for the different recommended upgrades as well as the different deployment costs associated with each upgrade, the network operator will then make a decision as to which upgrade to deploy in the network.
5.4 Concluding remarks In this chapter we have presented an overview of the demonstration platform and scenarios used to showcase the key SEMAFOUR project results achieved in WP4 and WP5. The use cases addressed are: ‘Dynamic Spectrum Allocation and Interference Management’, ‘Multi-layer LTE / Wi-Fi traffic Steering’, ‘Tackling the Problem of High Mobility Users’ and ‘Active / Reconfigurable Antenna Systems’ for WP4; and ‘Policy-Based SON Management & SON Coordination’ and ‘Decision Support System for Operational Network Evolution’ for WP5. The SEMAFOUR demonstrator brings together the vision and key achievements under one common platform and visually presents the overall benefit in terms of network performance and improved manageability of heterogeneous radio access networks. This is achieved by showcasing the performance of the different SON (Management) features achieved in realistic scenarios and use cases. In the demonstrator, the (de)activation and configuration of SON (Management) functions is controlled via the Operator Panel, which is the key envisioned interface from the unified self-management system to the network operator. It is also from the Operator Panel that the DSS Panel can be activated to learn about the Decision Support System’s alerts on future performance bottlenecks and the recommended network upgrades to prevent them. The demonstrator’s KPI Panel illustrate the area-wide performance metrics relevant for each particular demonstration case, while the Network and Cell View Panels visualise the network-, cell- and user-level dynamics and cell-specific metrics. Lastly, in order to indicate the performance impact of the developed (SON) Management functionalities on actual user services, either the performance of specific users or network-wide performance percentiles can be selected to emulate the effect on video streaming services on actual session terminals that are connected to the demonstration platform. Throughout the various stages of the project, whether presenting the vision or the technological achievements, the SEMAFOUR demonstrator has proven to be very instrumental in presenting the SEMAFOUR project to audiences at various conferences and workshops, as well as, via a set of video recordings, via the project website. Furthermore, the demonstration platform is considered to offer a useful basis for integrating new functionalities and demonstrating alternative use cases in e.g. follow-up projects, taking self-management of unified heterogeneous radio access networks to the next level, e.g. including 5G technology and scenarios.
SEMAFOUR (316384) D6.6 Final report
Version 1.0 Page 90 of 106
6 SON beyond SEMAFOUR Although SON and SON use cases have been subject to various research projects including SEMAFOUR and its predecessor project SOCRATES, still many open and interesting issues exist, which have been not addressed yet. Furthermore, it is already common understanding that with the introduction of 5G new challenges and opportunities for more efficient network management will arise, although it is unclear at the moment, how 5G will look in detail,. Therefore, right from the beginning one of the SEMAFOUR project goals has been to also study items, which are more future forward looking, focussing on 5G features, which are likely part of the system and provide either new opportunities are challenges with respect to SON. An own deliverable has been dedicated to this topic [75]. Four promising use cases and scenarios have been selected:
i. Device-to-Device Communications ii. Nomadic Networks
iii. Licence Assisted Access-LTE Channel Selection iv. Cognitive Policy Based SON Management
Additionally, within the development of the Adaptive / reconfigurable Antenna System Use Case (see section 3.6) a new idea on Virtual Cell Sectorisation came up, which has been conceptually investigated and complements this chapter as a fifth use cases.
For each of these five use cases, research activities and conceptual solutions targeting the simplification of the management of future networks have been identified, which are described briefly in the following.
6.1 Device-to-device communication With Device-to-Device (D2D) [76] technology, devices are able to communicate directly with each other, without the need for network infrastructure. While this is common for ad-hoc-networks such as Bluetooth, it has just recently been in introduced to the cellular domain by 3GPP Release 12 under the term Proximity Services (ProSe). While D2D is considered as an add-on of the LTE technology, it is one of the pillars of 5G systems. The combination of D2D and infrastructure networks is expected to play a major role in future networks to reach the challenging goals of very low latency, low energy consumption and increasing network capacity to cope with the expected strong growth of device density per area.
6.1.1 Background When combining D2D technology with existing cellular networks, frequency resources have to be assigned to this new, direct communication mode. Multiple alternatives are currently considered in the academic and industrial community: One alternative is the use of dedicated D2D spectrum, either as a part of the licensed spectrum or in unlicensed bands, e.g. the ISM band. Another one is the simultaneous use of licensed spectrum for D2D and cellular communication, which enables the operator to control the resource allocation and interference, as all devices are under its regime. This network-assisted control is considered a major advantage over pure ad-hoc approaches but is only applicable when the devices are in network coverage, so in scenarios with partial or no coverage, D2D requires additional autonomous control mechanisms as a fall back. Figure 62 illustrates examples of D2D modes of communication.
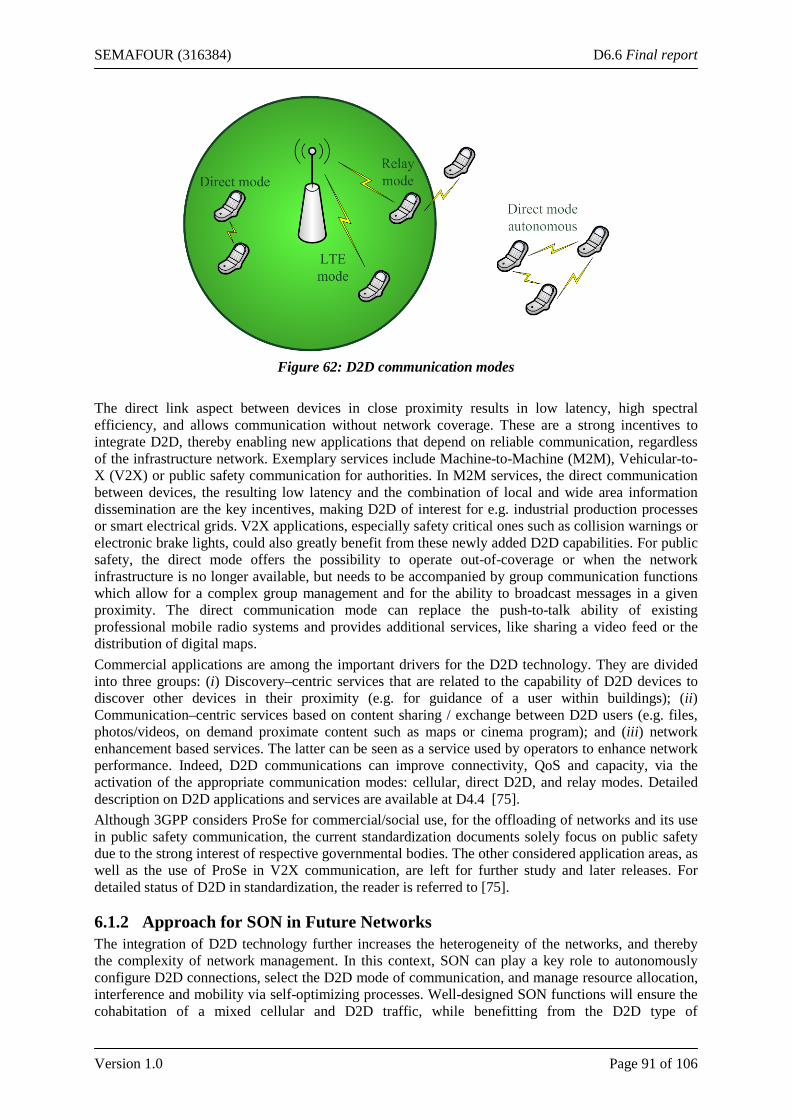
SEMAFOUR (316384) D6.6 Final report
Version 1.0 Page 91 of 106
Figure 62: D2D communication modes
The direct link aspect between devices in close proximity results in low latency, high spectral efficiency, and allows communication without network coverage. These are a strong incentives to integrate D2D, thereby enabling new applications that depend on reliable communication, regardless of the infrastructure network. Exemplary services include Machine-to-Machine (M2M), Vehicular-to-X (V2X) or public safety communication for authorities. In M2M services, the direct communication between devices, the resulting low latency and the combination of local and wide area information dissemination are the key incentives, making D2D of interest for e.g. industrial production processes or smart electrical grids. V2X applications, especially safety critical ones such as collision warnings or electronic brake lights, could also greatly benefit from these newly added D2D capabilities. For public safety, the direct mode offers the possibility to operate out-of-coverage or when the network infrastructure is no longer available, but needs to be accompanied by group communication functions which allow for a complex group management and for the ability to broadcast messages in a given proximity. The direct communication mode can replace the push-to-talk ability of existing professional mobile radio systems and provides additional services, like sharing a video feed or the distribution of digital maps. Commercial applications are among the important drivers for the D2D technology. They are divided into three groups: (i) Discovery–centric services that are related to the capability of D2D devices to discover other devices in their proximity (e.g. for guidance of a user within buildings); (ii) Communication–centric services based on content sharing / exchange between D2D users (e.g. files, photos/videos, on demand proximate content such as maps or cinema program); and (iii) network enhancement based services. The latter can be seen as a service used by operators to enhance network performance. Indeed, D2D communications can improve connectivity, QoS and capacity, via the activation of the appropriate communication modes: cellular, direct D2D, and relay modes. Detailed description on D2D applications and services are available at D4.4 [75]. Although 3GPP considers ProSe for commercial/social use, for the offloading of networks and its use in public safety communication, the current standardization documents solely focus on public safety due to the strong interest of respective governmental bodies. The other considered application areas, as well as the use of ProSe in V2X communication, are left for further study and later releases. For detailed status of D2D in standardization, the reader is referred to [75].
6.1.2 Approach for SON in Future Networks The integration of D2D technology further increases the heterogeneity of the networks, and thereby the complexity of network management. In this context, SON can play a key role to autonomously configure D2D connections, select the D2D mode of communication, and manage resource allocation, interference and mobility via self-optimizing processes. Well-designed SON functions will ensure the cohabitation of a mixed cellular and D2D traffic, while benefitting from the D2D type of
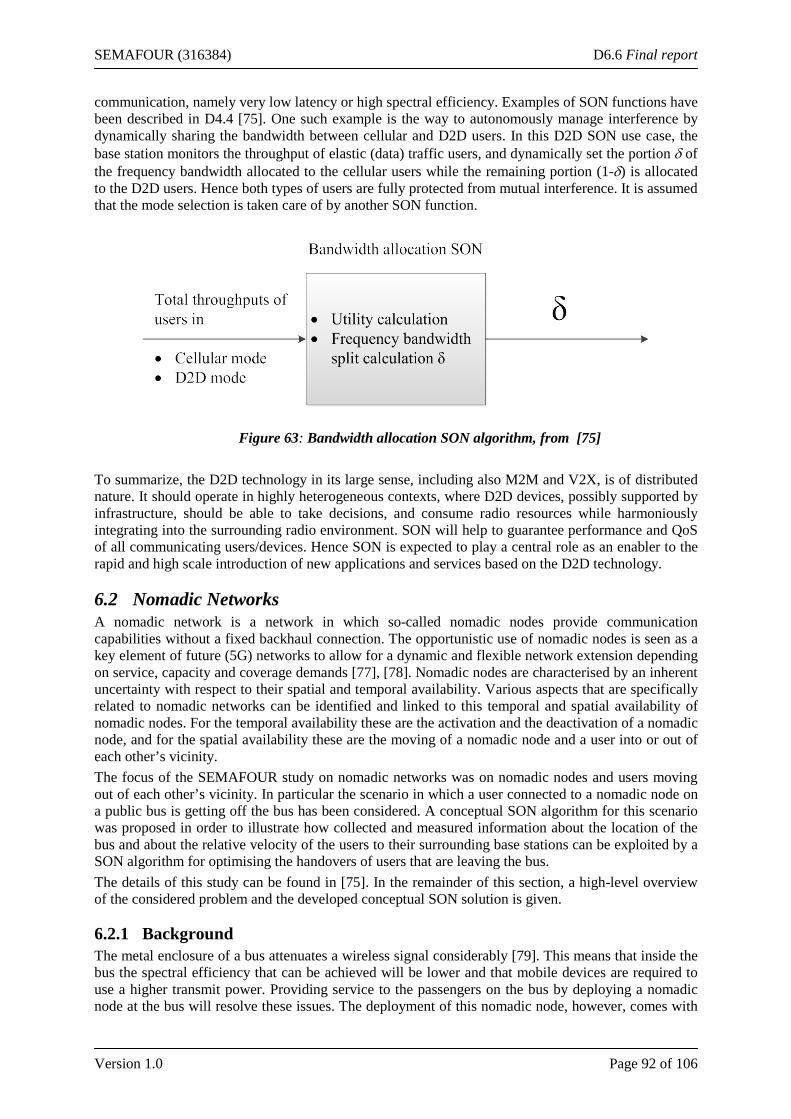
SEMAFOUR (316384) D6.6 Final report
Version 1.0 Page 92 of 106
communication, namely very low latency or high spectral efficiency. Examples of SON functions have been described in D4.4 [75]. One such example is the way to autonomously manage interference by dynamically sharing the bandwidth between cellular and D2D users. In this D2D SON use case, the base station monitors the throughput of elastic (data) traffic users, and dynamically set the portion δ of the frequency bandwidth allocated to the cellular users while the remaining portion (1-δ) is allocated to the D2D users. Hence both types of users are fully protected from mutual interference. It is assumed that the mode selection is taken care of by another SON function.
Figure 63: Bandwidth allocation SON algorithm, from [75] To summarize, the D2D technology in its large sense, including also M2M and V2X, is of distributed nature. It should operate in highly heterogeneous contexts, where D2D devices, possibly supported by infrastructure, should be able to take decisions, and consume radio resources while harmoniously integrating into the surrounding radio environment. SON will help to guarantee performance and QoS of all communicating users/devices. Hence SON is expected to play a central role as an enabler to the rapid and high scale introduction of new applications and services based on the D2D technology.
6.2 Nomadic Networks A nomadic network is a network in which so-called nomadic nodes provide communication capabilities without a fixed backhaul connection. The opportunistic use of nomadic nodes is seen as a key element of future (5G) networks to allow for a dynamic and flexible network extension depending on service, capacity and coverage demands [77], [78]. Nomadic nodes are characterised by an inherent uncertainty with respect to their spatial and temporal availability. Various aspects that are specifically related to nomadic networks can be identified and linked to this temporal and spatial availability of nomadic nodes. For the temporal availability these are the activation and the deactivation of a nomadic node, and for the spatial availability these are the moving of a nomadic node and a user into or out of each other’s vicinity. The focus of the SEMAFOUR study on nomadic networks was on nomadic nodes and users moving out of each other’s vicinity. In particular the scenario in which a user connected to a nomadic node on a public bus is getting off the bus has been considered. A conceptual SON algorithm for this scenario was proposed in order to illustrate how collected and measured information about the location of the bus and about the relative velocity of the users to their surrounding base stations can be exploited by a SON algorithm for optimising the handovers of users that are leaving the bus. The details of this study can be found in [75]. In the remainder of this section, a high-level overview of the considered problem and the developed conceptual SON solution is given.
6.2.1 Background The metal enclosure of a bus attenuates a wireless signal considerably [79]. This means that inside the bus the spectral efficiency that can be achieved will be lower and that mobile devices are required to use a higher transmit power. Providing service to the passengers on the bus by deploying a nomadic node at the bus will resolve these issues. The deployment of this nomadic node, however, comes with
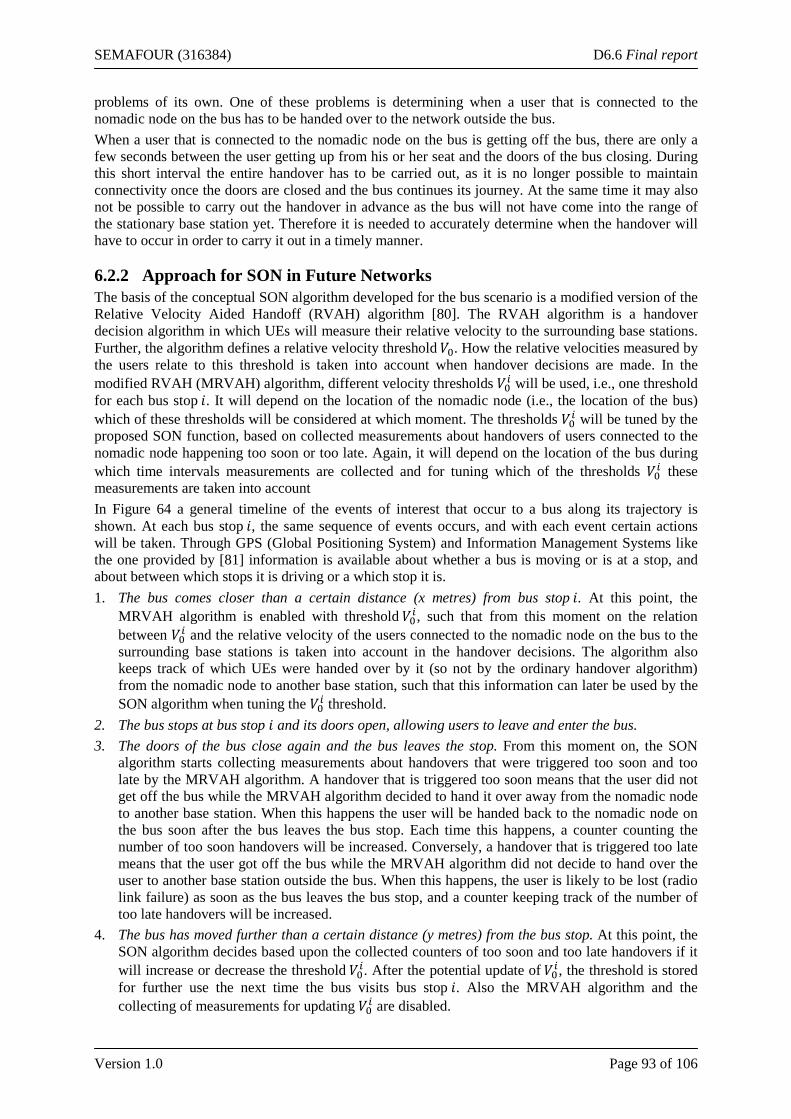
SEMAFOUR (316384) D6.6 Final report
Version 1.0 Page 93 of 106
problems of its own. One of these problems is determining when a user that is connected to the nomadic node on the bus has to be handed over to the network outside the bus. When a user that is connected to the nomadic node on the bus is getting off the bus, there are only a few seconds between the user getting up from his or her seat and the doors of the bus closing. During this short interval the entire handover has to be carried out, as it is no longer possible to maintain connectivity once the doors are closed and the bus continues its journey. At the same time it may also not be possible to carry out the handover in advance as the bus will not have come into the range of the stationary base station yet. Therefore it is needed to accurately determine when the handover will have to occur in order to carry it out in a timely manner.
6.2.2 Approach for SON in Future Networks The basis of the conceptual SON algorithm developed for the bus scenario is a modified version of the Relative Velocity Aided Handoff (RVAH) algorithm [80]. The RVAH algorithm is a handover decision algorithm in which UEs will measure their relative velocity to the surrounding base stations. Further, the algorithm defines a relative velocity threshold 𝑉0. How the relative velocities measured by the users relate to this threshold is taken into account when handover decisions are made. In the modified RVAH (MRVAH) algorithm, different velocity thresholds 𝑉0𝑖 will be used, i.e., one threshold for each bus stop 𝑖. It will depend on the location of the nomadic node (i.e., the location of the bus) which of these thresholds will be considered at which moment. The thresholds 𝑉0𝑖 will be tuned by the proposed SON function, based on collected measurements about handovers of users connected to the nomadic node happening too soon or too late. Again, it will depend on the location of the bus during which time intervals measurements are collected and for tuning which of the thresholds 𝑉0𝑖 these measurements are taken into account In Figure 64 a general timeline of the events of interest that occur to a bus along its trajectory is shown. At each bus stop 𝑖, the same sequence of events occurs, and with each event certain actions will be taken. Through GPS (Global Positioning System) and Information Management Systems like the one provided by [81] information is available about whether a bus is moving or is at a stop, and about between which stops it is driving or a which stop it is. 1. The bus comes closer than a certain distance (x metres) from bus stop 𝑖. At this point, the
MRVAH algorithm is enabled with threshold 𝑉0𝑖, such that from this moment on the relation between 𝑉0𝑖 and the relative velocity of the users connected to the nomadic node on the bus to the surrounding base stations is taken into account in the handover decisions. The algorithm also keeps track of which UEs were handed over by it (so not by the ordinary handover algorithm) from the nomadic node to another base station, such that this information can later be used by the SON algorithm when tuning the 𝑉0𝑖 threshold.
2. The bus stops at bus stop 𝑖 and its doors open, allowing users to leave and enter the bus. 3. The doors of the bus close again and the bus leaves the stop. From this moment on, the SON
algorithm starts collecting measurements about handovers that were triggered too soon and too late by the MRVAH algorithm. A handover that is triggered too soon means that the user did not get off the bus while the MRVAH algorithm decided to hand it over away from the nomadic node to another base station. When this happens the user will be handed back to the nomadic node on the bus soon after the bus leaves the bus stop. Each time this happens, a counter counting the number of too soon handovers will be increased. Conversely, a handover that is triggered too late means that the user got off the bus while the MRVAH algorithm did not decide to hand over the user to another base station outside the bus. When this happens, the user is likely to be lost (radio link failure) as soon as the bus leaves the bus stop, and a counter keeping track of the number of too late handovers will be increased.
4. The bus has moved further than a certain distance (y metres) from the bus stop. At this point, the SON algorithm decides based upon the collected counters of too soon and too late handovers if it will increase or decrease the threshold 𝑉0𝑖. After the potential update of 𝑉0𝑖, the threshold is stored for further use the next time the bus visits bus stop 𝑖. Also the MRVAH algorithm and the collecting of measurements for updating 𝑉0𝑖 are disabled.
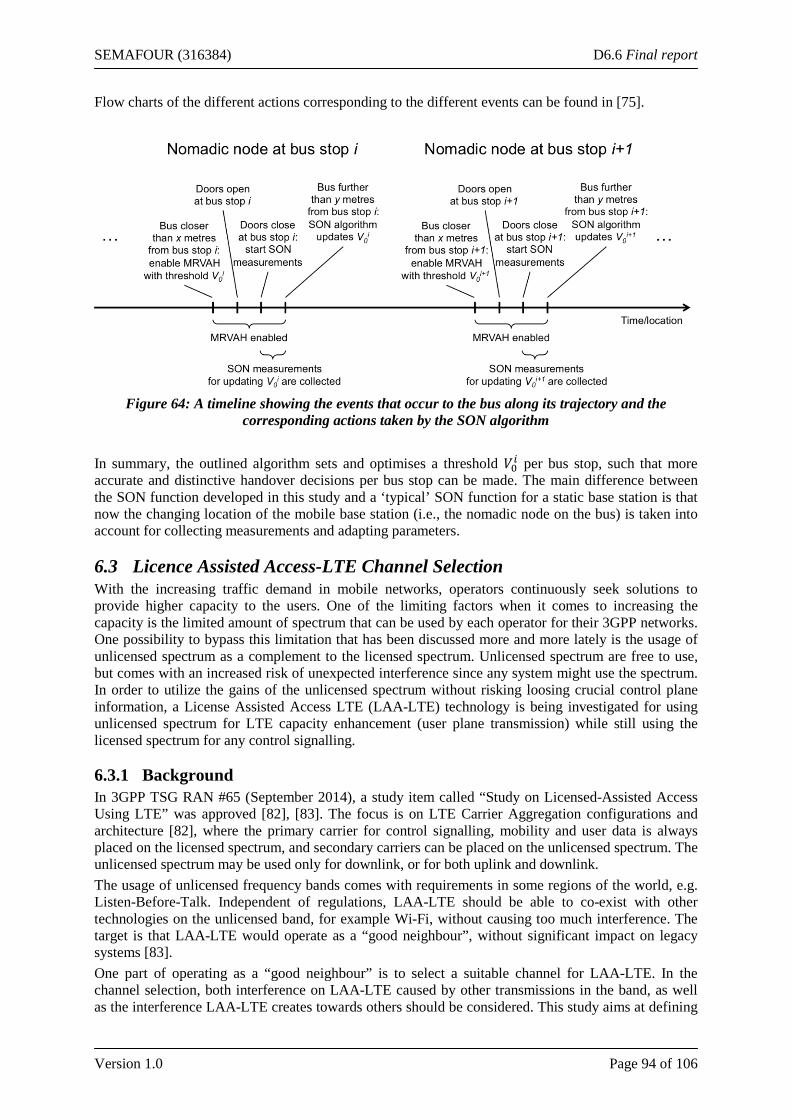
SEMAFOUR (316384) D6.6 Final report
Version 1.0 Page 94 of 106
Flow charts of the different actions corresponding to the different events can be found in [75].
Figure 64: A timeline showing the events that occur to the bus along its trajectory and the
corresponding actions taken by the SON algorithm In summary, the outlined algorithm sets and optimises a threshold 𝑉0𝑖 per bus stop, such that more accurate and distinctive handover decisions per bus stop can be made. The main difference between the SON function developed in this study and a ‘typical’ SON function for a static base station is that now the changing location of the mobile base station (i.e., the nomadic node on the bus) is taken into account for collecting measurements and adapting parameters.
6.3 Licence Assisted Access-LTE Channel Selection With the increasing traffic demand in mobile networks, operators continuously seek solutions to provide higher capacity to the users. One of the limiting factors when it comes to increasing the capacity is the limited amount of spectrum that can be used by each operator for their 3GPP networks. One possibility to bypass this limitation that has been discussed more and more lately is the usage of unlicensed spectrum as a complement to the licensed spectrum. Unlicensed spectrum are free to use, but comes with an increased risk of unexpected interference since any system might use the spectrum. In order to utilize the gains of the unlicensed spectrum without risking loosing crucial control plane information, a License Assisted Access LTE (LAA-LTE) technology is being investigated for using unlicensed spectrum for LTE capacity enhancement (user plane transmission) while still using the licensed spectrum for any control signalling.
6.3.1 Background In 3GPP TSG RAN #65 (September 2014), a study item called “Study on Licensed-Assisted Access Using LTE” was approved [82], [83]. The focus is on LTE Carrier Aggregation configurations and architecture [82], where the primary carrier for control signalling, mobility and user data is always placed on the licensed spectrum, and secondary carriers can be placed on the unlicensed spectrum. The unlicensed spectrum may be used only for downlink, or for both uplink and downlink. The usage of unlicensed frequency bands comes with requirements in some regions of the world, e.g. Listen-Before-Talk. Independent of regulations, LAA-LTE should be able to co-exist with other technologies on the unlicensed band, for example Wi-Fi, without causing too much interference. The target is that LAA-LTE would operate as a “good neighbour”, without significant impact on legacy systems [83]. One part of operating as a “good neighbour” is to select a suitable channel for LAA-LTE. In the channel selection, both interference on LAA-LTE caused by other transmissions in the band, as well as the interference LAA-LTE creates towards others should be considered. This study aims at defining
SEMAFOUR (316384) D6.6 Final report
Version 1.0 Page 95 of 106
conceptual SON solutions to automatically perform LAA-LTE channel selection, including solutions for triggering such selection in a good manner. A starting point will be to investigate existing channel selection methods used for Wi-Fi, and the possibility to use these, or similar methods as input to the development of a channel selection SON function for LAA-LTE. The usage of LTE in unlicensed frequency and the coexistence with other technologies bands has been studied and discussed in literature during the last couple of years, in both academia standardization, and regulatory fora. The literature review can be found in Deliverable D4.4 [75]. The main candidate for LAA-LTE transmissions is the 5 GHz band, which has a relatively large amount of unlicensed spectrum, of approximately 500 MHz, with global availability. This band is also commonly used by Wi-Fi, which is the most commonly access technology considered in investigations on LTE co-existence in unlicensed bands in literature. Studies show that an LTE system in co-existence with Wi-Fi in unlicensed bands is not highly affected by the interference caused by the Wi-Fi system. One major aspect of the LAA-LTE coexistence with Wi-Fi system in the 5GHz frequency is the channel selection process, which can be used to avoid most of the interference between the two systems. When analysing the potential LAA-LTE channel selection mechanisms a natural starting point is to look at the existing proposals for Wi-Fi channel selection, i.e. at intra Wi-Fi coexistence mechanism in an unlicensed band. An extensive literature review on this topic can be found in Deliverable D4.4 [75]. The LAA-LTE channel selection mechanism is considered to be implementation/vendor specific, thus this type of algorithms will very likely not be specified by 3GPP in Release 13. The UE channel measurements, which can be used in the channel selection triggering and selection algorithm, are however being addressed in 3GPPP RAN WG 1 and WG 2.
6.3.2 Approach for SON in Future Networks In the context of SON algorithms, we looked at the distributed channel selection methods, where each channel selection can be done without coordination from some central entity. This is considered a reasonable solution, as different LAA-LTE eNodeBs in the unlicensed spectrum may be operated by different operators, and these, as well as other systems operating on the band, will most likely be
troublesome to tightly coordinate centrally. By looking at the existing Wi-Fi channel selection methods, it is noted that several of them are based on the received power from the own Access Point (AP) and its associated User Equipment (UE) terminals together with the received power from other APs and their associated UEs on the considered channel. Alternative solutions use the estimated/ served bitrates to understand the interference situation on the channel. Furthermore, most existing methods use some kind of measurement of channel business, or the utilization of the considered channel in order to understand how large a part of the time the channel is busy. In addition, information on the maximum allowed transmission power can be beneficial for the channel selection. Two main mechanisms have been identified as required to be part of a generic LAA-LTE channel selection mechanism: i) a triggering mechanism, and ii) the selection mechanism. The triggering mechanism is proposed to be based on a combination of the following: channel quality/metric indicators, traffic characteristics, regulatory requirements, addition/removal of a new unlicensed carrier frequency. The channel selection
Channel selection based on maximum weight
Channel selection trigger
Mandatory mechanism: Channel scanning based on
standardized radio measurements
Optional mechanism: Channel weighting based on
interference conditions (LAA-LTE/ Wi-Fi specific)
All channels scanned?
Yes
No
Figure 65: Conceptual flow chart for LAA-LTE channel selection mechanism.
Channel selection based on maximum weight
Channel selection trigger
Mandatory mechanism: Channel scanning based on
standardized radio measurements
Optional mechanism: Channel weighting based on
interference conditions (LAA-LTE/ Wi-Fi specific)
All channels scanned?
Yes
No
SEMAFOUR (316384) D6.6 Final report
Version 1.0 Page 96 of 106
mechanism is proposed to be built as a two parts mechanism: a) mandatory – imposed by regulations, channel scanning utilizing standardized interference estimation procedures and measurements on the given unlicensed channel, and b) optional – custom interference conditions metrics, in combination with a set of assigned/ calculated channel weights, which can be used to determine the optimal channel(s) selection. For improved performance, our conceptual LAA-LTE channel selection SON algorithm proposal relies on the use of the interference conditions metrics, which can also be LAA-LTE/Wi-Fi system specific. These metrics can be derived from standardized UE and/or eNodeB measurements in the un-licensed channel(s). Thus it requires further work to investigate how improvements can actually be achieved by using the measurements to be finally adopted by 3GPP. Based on these proposals, the LAA-LTE channel selection SON functionalities such as triggering conditions, channel weights and interference conditions functions, can be pre-configured for a given deployment scenario and expected average traffic load. The SON parameters, such as interference detection thresholds and timing/periodicity of the channel (re)selection, can be adjusted by the SON function depending on the varying traffic conditions (varying channel load/utilization) and the experienced transmission performance to the served UEs. For the development of more specific LAA-LTE channel selection SON algorithms there are several interesting issues to further investigate, such as: i) performance gain potential from faster carrier selection, ii) performance gain from power control within the regulatory limits, iii) benefits of explicit coordination of the eNodeBs with LAA-LTE, iv) benefits of further LTE/Wi-Fi/ LAA-LTE interworking.
6.4 Virtual Cell Sectorisation Virtual Sectorisation (ViS) can be seen as a natural evolution of Vertical Sectorisation (VS), described in Section 3.6. Similarly to VS, ViS aims at enhancing the network performance and capacity by creating a new cell (a virtual sector) using an antenna array located at the base station. Unlike VS, the virtual sector can be located anywhere in the macro-cell coverage area. The ViS and the macro-cell will interfere with each other, and therefore an adequate SON for resource allocation or interference management is needed. It is noted that if a highly focused beam is desired to cover a small cell size, a large number or radiating elements is needed. In this case, the ViS should be considered as a 5G technology where higher frequencies are expected to be available.
6.4.1 Background Section 3.6 presents Active Antenna Systems (AAS) with a focus on VS as a solution to capacity enhancement. While the results of VS are promising, it is clear that the inner cell (or sector) has to capture enough traffic in order to bring about capacity benefits. In the case where a traffic spot is located far from the BS, e.g. near the cell edge, the deployment of small cells is a candidate solution to the capacity problem. However, the deployment of a backhaul considerably increases the overall cost of the small cell technology [84]. ViS, the alternative proposed in this section, uses a two-dimensional antenna array capable of creating a new secondary cell at any location within the macro cell by choosing an azimuth and downtilt such that the virtual cell’s footprint is as much as possible steered towards an area of relatively heavy traffic. To manage interference between the macro- and the virtual cell, it is assumed that resources are split in the spectral domain. This means that the power per bandwidth of the virtual cell is the same as that of the macro cell, while the total available bandwidth is split between the macro and the virtual cell (assigning distinct sets of PRBs to the macro cell and the virtual cell) [84]. Figure 66 presents a tri-sectorial site with one virtual cell per macro sector.
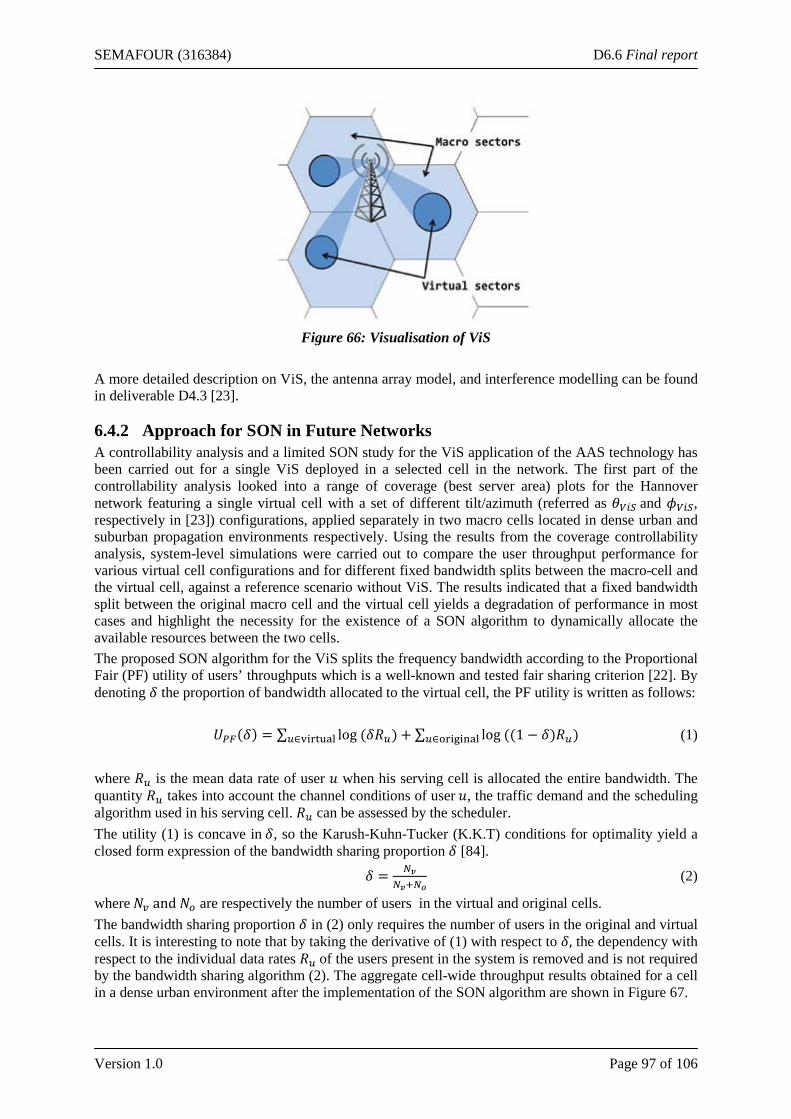
SEMAFOUR (316384) D6.6 Final report
Version 1.0 Page 97 of 106
Figure 66: Visualisation of ViS
A more detailed description on ViS, the antenna array model, and interference modelling can be found in deliverable D4.3 [23].
6.4.2 Approach for SON in Future Networks A controllability analysis and a limited SON study for the ViS application of the AAS technology has been carried out for a single ViS deployed in a selected cell in the network. The first part of the controllability analysis looked into a range of coverage (best server area) plots for the Hannover network featuring a single virtual cell with a set of different tilt/azimuth (referred as 𝜃𝑉𝑖𝑆 and 𝜙𝑉𝑖𝑆, respectively in [23]) configurations, applied separately in two macro cells located in dense urban and suburban propagation environments respectively. Using the results from the coverage controllability analysis, system-level simulations were carried out to compare the user throughput performance for various virtual cell configurations and for different fixed bandwidth splits between the macro-cell and the virtual cell, against a reference scenario without ViS. The results indicated that a fixed bandwidth split between the original macro cell and the virtual cell yields a degradation of performance in most cases and highlight the necessity for the existence of a SON algorithm to dynamically allocate the available resources between the two cells. The proposed SON algorithm for the ViS splits the frequency bandwidth according to the Proportional Fair (PF) utility of users’ throughputs which is a well-known and tested fair sharing criterion [22]. By denoting 𝛿 the proportion of bandwidth allocated to the virtual cell, the PF utility is written as follows: 𝑈𝑃𝐹(𝛿) = ∑ log (𝛿𝑅𝑢)𝑢∈virtual + ∑ log ((1 − 𝛿)𝑅𝑢)𝑢∈original (1) where 𝑅𝑢 is the mean data rate of user 𝑢 when his serving cell is allocated the entire bandwidth. The quantity 𝑅𝑢 takes into account the channel conditions of user 𝑢, the traffic demand and the scheduling algorithm used in his serving cell. 𝑅𝑢 can be assessed by the scheduler. The utility (1) is concave in 𝛿, so the Karush-Kuhn-Tucker (K.K.T) conditions for optimality yield a closed form expression of the bandwidth sharing proportion 𝛿 [84].
𝛿 = 𝑁𝑣𝑁𝑣+𝑁𝑜
(2)
where 𝑁𝑣 and 𝑁𝑜 are respectively the number of users in the virtual and original cells. The bandwidth sharing proportion 𝛿 in (2) only requires the number of users in the original and virtual cells. It is interesting to note that by taking the derivative of (1) with respect to 𝛿, the dependency with respect to the individual data rates 𝑅𝑢 of the users present in the system is removed and is not required by the bandwidth sharing algorithm (2). The aggregate cell-wide throughput results obtained for a cell in a dense urban environment after the implementation of the SON algorithm are shown in Figure 67.
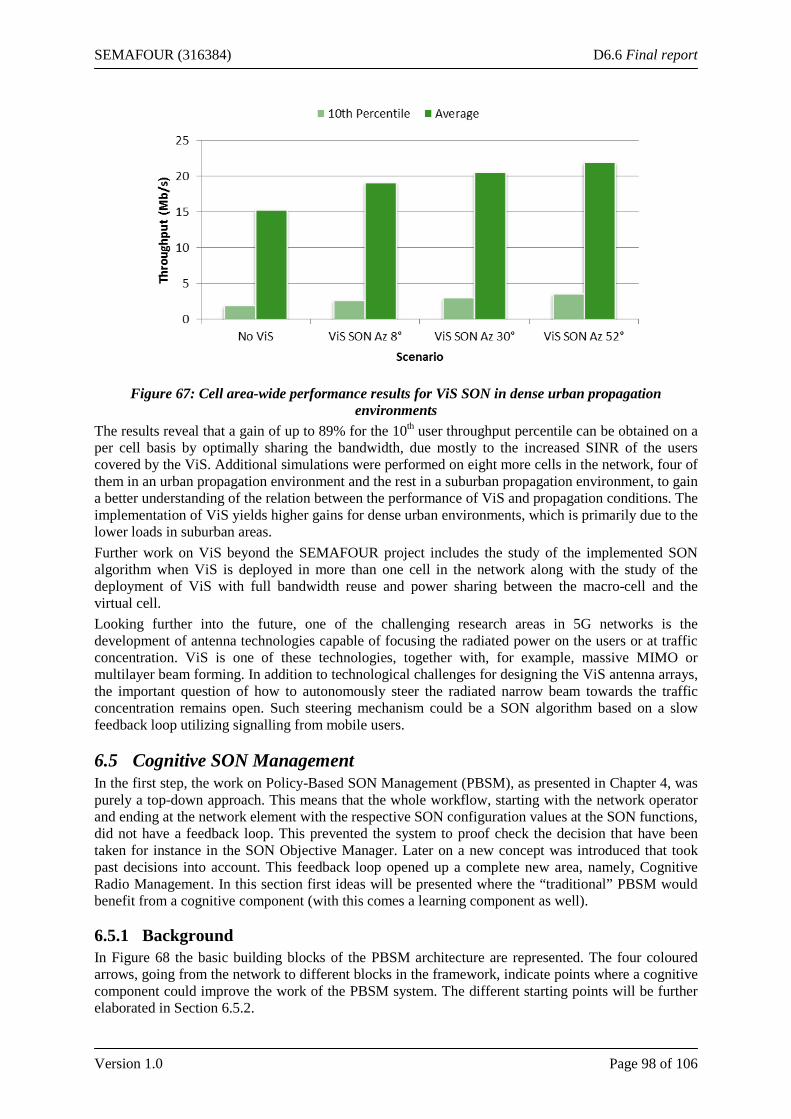
SEMAFOUR (316384) D6.6 Final report
Version 1.0 Page 98 of 106
Figure 67: Cell area-wide performance results for ViS SON in dense urban propagation
environments The results reveal that a gain of up to 89% for the 10th user throughput percentile can be obtained on a per cell basis by optimally sharing the bandwidth, due mostly to the increased SINR of the users covered by the ViS. Additional simulations were performed on eight more cells in the network, four of them in an urban propagation environment and the rest in a suburban propagation environment, to gain a better understanding of the relation between the performance of ViS and propagation conditions. The implementation of ViS yields higher gains for dense urban environments, which is primarily due to the lower loads in suburban areas. Further work on ViS beyond the SEMAFOUR project includes the study of the implemented SON algorithm when ViS is deployed in more than one cell in the network along with the study of the deployment of ViS with full bandwidth reuse and power sharing between the macro-cell and the virtual cell. Looking further into the future, one of the challenging research areas in 5G networks is the development of antenna technologies capable of focusing the radiated power on the users or at traffic concentration. ViS is one of these technologies, together with, for example, massive MIMO or multilayer beam forming. In addition to technological challenges for designing the ViS antenna arrays, the important question of how to autonomously steer the radiated narrow beam towards the traffic concentration remains open. Such steering mechanism could be a SON algorithm based on a slow feedback loop utilizing signalling from mobile users.
6.5 Cognitive SON Management In the first step, the work on Policy-Based SON Management (PBSM), as presented in Chapter 4, was purely a top-down approach. This means that the whole workflow, starting with the network operator and ending at the network element with the respective SON configuration values at the SON functions, did not have a feedback loop. This prevented the system to proof check the decision that have been taken for instance in the SON Objective Manager. Later on a new concept was introduced that took past decisions into account. This feedback loop opened up a complete new area, namely, Cognitive Radio Management. In this section first ideas will be presented where the “traditional” PBSM would benefit from a cognitive component (with this comes a learning component as well).
6.5.1 Background In Figure 68 the basic building blocks of the PBSM architecture are represented. The four coloured arrows, going from the network to different blocks in the framework, indicate points where a cognitive component could improve the work of the PBSM system. The different starting points will be further elaborated in Section 6.5.2.
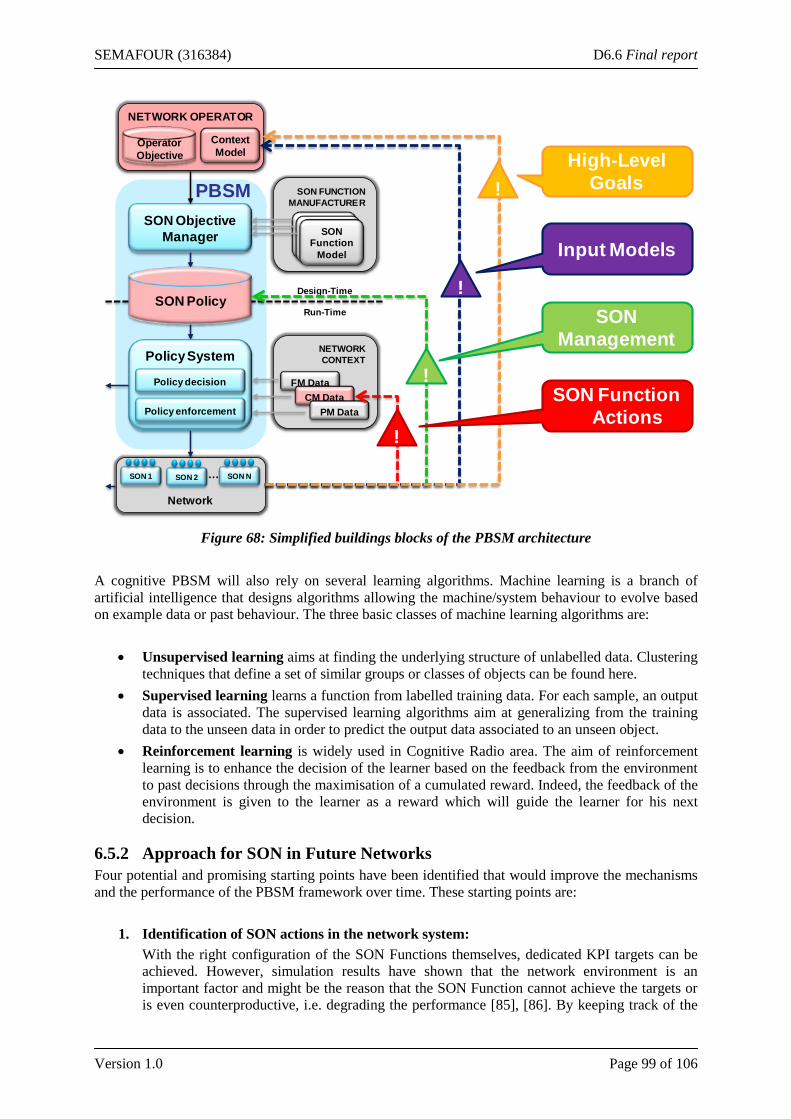
SEMAFOUR (316384) D6.6 Final report
Version 1.0 Page 99 of 106
Figure 68: Simplified buildings blocks of the PBSM architecture
A cognitive PBSM will also rely on several learning algorithms. Machine learning is a branch of artificial intelligence that designs algorithms allowing the machine/system behaviour to evolve based on example data or past behaviour. The three basic classes of machine learning algorithms are:
• Unsupervised learning aims at finding the underlying structure of unlabelled data. Clustering techniques that define a set of similar groups or classes of objects can be found here.
• Supervised learning learns a function from labelled training data. For each sample, an output data is associated. The supervised learning algorithms aim at generalizing from the training data to the unseen data in order to predict the output data associated to an unseen object.
• Reinforcement learning is widely used in Cognitive Radio area. The aim of reinforcement learning is to enhance the decision of the learner based on the feedback from the environment to past decisions through the maximisation of a cumulated reward. Indeed, the feedback of the environment is given to the learner as a reward which will guide the learner for his next decision.
6.5.2 Approach for SON in Future Networks Four potential and promising starting points have been identified that would improve the mechanisms and the performance of the PBSM framework over time. These starting points are:
1. Identification of SON actions in the network system: With the right configuration of the SON Functions themselves, dedicated KPI targets can be achieved. However, simulation results have shown that the network environment is an important factor and might be the reason that the SON Function cannot achieve the targets or is even counterproductive, i.e. degrading the performance [85], [86]. By keeping track of the
PBSMSON Objective
Manager
NETWORK OPERATOR
Operator Objective
Context Model
Network
SON FUNCTION MANUFACTURER
SON Function
Model
SON Function
Model
SON Function
Model
SON 1 SON 2 SON N…
Policy System
Policy decision
Policy enforcement
NETWORK CONTEXT
FM DataCM Data
PM Data
SON PolicyDesign-Time
Run-Time
!
!
!
!
SON Function Actions
SONManagement
Input Models
High-LevelGoals
SEMAFOUR (316384) D6.6 Final report
Version 1.0 Page 100 of 106
executed SON actions and learning the effects on the system the operation in a SON-enabled network could be improved. Examples for that could be to inform SON Coordination about the new insights or to learn “bad” SON configurations and prevent them in the future.
2. Improving the input models needed for PBSM: The PBSM system is only as good as the quality of the input to that system, i.e. the SON function models or context model. The consequence is that the input models should be accurate as possible. Hence, an improvement over time of such models would be of high importance.
3. (Re-)Defining SON management/PBSM actions: In the current implementation of PBSM the SON configurations will be changed based on the rules in the SON Policy repository. No tracking of the achievements in terms of KPI targets or the performance of SON functions with the adjusted configuration is done. Evaluating the past performance may cause a redefining of policies that lead to a better result.
4. Transformation of High-Level Operator Goals: High level operator goals can be related to operator profit augmentation, end user Quality of Experience (QoE) enhancement or operational cost reduction. The first task of PBSM is to translate these high level goals into technical objectives. Technical objectives can then be expressed in terms of radio KPIs that can be targeted by the SON functions. Machine learning could improve the transformation process itself over time.
For all four starting points, and for any form of cognitive mechanisms, it is crucial that a “decision maker” is aware of the environment which is not only limited to the radio network itself. On the one side, the environment is related to metrics defining the end-user Quality of Service (QoS) or to radio quality indicators. At the radio network level, the definition of the system state which is related, but not limited, to the classification of cells could be enhanced further using the feedback of the network. On the other side, monitoring the end-user quality of experience, which corresponds to a typical high level operator goal, is a challenging task, especially if the contribution of the radio network segment should be taken into detailed account. In both areas, the availability of huge amounts of information in the network brings the whole field of Cognitive SON Management to the “Big Data” domain. In conclusion, cognitive components will be crucial for a mobile radio system in order to cope with changing network conditions. With cognition, the mobile network will be able to adapt on these varying conditions that naturally change, not only over time, but also in space. This and the fact that the overall requirements in terms of traffic demand by the users increases as well, makes a learning component important in order to detect and react on changes that happen in the network.
6.6 Concluding remarks The insights from all study items described in this chapter clearly reveal a large potential for benefit in future mobile network performance. As such they are strong candidates for future research. Having said this, it is obvious that these topics are attractive to be addressed in future research projects and can form an excellent nucleus for potential follow-up projects to SEMAFOUR.
SEMAFOUR (316384) D6.6 Final report
Version 1.0 Page 101 of 106
7 Conclusions The SEMAFOUR project has successfully developed, documented and disseminated a clear vision for next generation SON for future mobile communication networks. This vision has found broad resonance in the community and provided the main building blocks of the industrial analysis Signals Ahead issue ‘Everything under the SON’, published in April 2013 [87]. The project started with an extensive dialogue with eight key European operators to identify the key problem domains and relevant use cases to achieve the project goals. For the selected use cases we then developed a complete definition of the system requirements together with modelling assumptions and methodologies. For this set of use cases we also developed simulation environments using the complex Hannover simulation model & data to enable realistic simulation results. The project developed and validated new powerful SON algorithms for the following use cases: Wi-Fi / LTE traffic steering, high mobility users, Active Antenna Systems (sectorisation) and Dynamic Spectrum Allocation. Using simulations we have shown significant network performance improvement, improvement of the spectral usage, improved manageability of radio resource and hardware capabilities. In addition, the project created and implemented an integrated SON management system, which has been shown: to improve network performance in line with the network operator goals; to improve controllability of the performance trade-offs taking into account the operator priorities; to reduce network management cost by enabling and simplifying the network supervision; to improve the network upgrade planning by defining large time scale network performance predictions; and indeed to provide the first step towards cognitive network management in terms of adaptive SON function parameterization (re-) configuration. All these results on new SON algorithms and on an integrated SON management system have been integrated in to a demonstrator, which demonstrates all project results in a realistic environment. This demonstrator is a powerful tool for dissemination and has been successfully shown at major events like ICT 2013, NOMS 2014, IWSON 2014, FIA 2014, and EuCNC 2015. Lastly, the SEMAFOUR project has had a noticeable impact on standardisation with multiple contributions and direct impact in several areas of 3GPP RAN standardisation. As it has been shown in this document and reiterated in this Chapter we believe that SEMAFOUR has met all the key goals of the project outlined in the first chapter. The EU funding has been instrumental for allowing key players from different domains to collaborate together and develop what we believe is the next step in SON development. This view is strengthening by the resonance of the SEMAFOUR vision in the community and specifically amongst the industry analysts, together with the already significant impact on 3GPP standardisation. Moving forward the SEMAFOUR project has already investigated future issues and areas for future ‘SON-like’ network management in D4.4. We believe these four key areas: Learning mechanisms for policy based management, Device to Device communications, Nomadic networks and SON for LAA LTE channel selection are vital areas for future projects to consider, together with the broader issue of how to manage future 5G networks.
SEMAFOUR (316384) D6.6 Final report
Version 1.0 Page 102 of 106
8 References [1] EU FP7 project SEMAFOUR (Self-management for unified heterogeneous radio access
networks), “The SEMAFOUR website,” [Online]. Available: http://fp7-semafour.eu/. [Accessed 29 July 2015].
[2] D. M. Rose, T. Jansen and T. Kürner, “Modeling of Femto Cells – Simulation of Interference and Handovers in LTE Networks,” Proceedings of the IEEE 73rd Vehicular Technology Conference (VTC-Spring 2011), Budapest, Hungary, May 15th-18th, 2011.
[3] D. M. Rose, J. Baumgarten, T. Jansen and T. Kürner, “How a Real City Fits into a Hexagonal World,” Geoinformatik 2012 - Mobilität und Umwelt, Braunschweig, Germany, March 28th-30th, 2012.
[4] EU FP7 project SEMAFOUR (Self-management for unified heterogeneous radio access networks), “Deliverable 2.5, 'Definition of Reference Scenarios, Modelling Assumptions and Methodologies (Final Results)',” [Online] available at http://www.fp7-semafour.eu, February 2015.
[5] OpenStreetMap, “OpenStreetMap,” 2013. [Online]. Available: http://www.openstreetmap.org. [6] Y. Lostanlen and T. Kürner, “Ray Tracing Modeling,” in LTE Advanced and Next Generation
Wireless Networks: Channel Modeling and Propagation, Wiley, 2012, pp. 271-291. [7] R. Gahleitner and E. Bonek, “Radio wave penetration into urban buildings in small cells and
micro cells,” Proceedings of the IEEE Vehicular Technology Conference: VTC1994, pp. 887-891, Budapest, Stockholm, May 1994.
[8] D. M. Rose and T. Kürner, “Outdoor-to-Indoor Propagation – Accurate Measuring and Modeling of Indoor Environments at 900 and 1800 MHz,” 6th European Conference on Antennas and Propagation, 2012. EuCAP 2012., Prague, Czech Republic, 2012.
[9] T. Kürner and A. Meier, “Prediction of Outdoor and Outdoor-to-Indoor Coverage in Urban Areas at 1.8 GHz,” IEEE Journal on Selected Areas in Communications, Vol. 20, No. 3, pp. 496-506, April 2002.
[10] D. M. Rose, T. Jansen and T. Kürner, “Modeling of Femto Cells – Simulation of Interference and Handovers in LTE Networks,” in Proceedings of the IEEE 73rd Vehicular Technology Conference: VTC2011-Spring, Budapest, Hungary, May 15th-18th, 2011.
[11] S. Hahn, “Entwicklung von dreidimensionalen Gebäudeinnenmodellen auf Basis realer Geodaten und Implementierung eines realistischen Indoor Mobilitätsmodells,” Masterarbeit, Technische Universität Braunschweig, Institut für Nachrichtentechnik, Dipl. 12/015 , 2012.
[12] D. M. Rose and T. Kürner, “Stochastic Models of User and Load Distribution (Deliverable D3.2),” GreenNets (Internal Document), pp. 1-54, August 31, 2012.
[13] D. M. Rose, J. Baumgarten and T. Kürner, “Spatial Traffic Distributions for Cellular Networks with Time Varying Usage Intensities per Land-Use Class,” European Cooperation in the Field of Scientific and Technical Research, COST IC1004 TD(13)07034, 2013.
[14] “SUMO - Simulation of Urban MObility,” [Online]. Available: http://sumo.sourceforge.net/. [Accessed 14 November 2011].
[15] J. Sulak, “Integration eines Fahrradfahrer- und Fußgänger-Mobilitätsmodells in einen LTE-Simulator,” Technische Universität Braunschweig, Institut für Nachrichtentechnik, Dipl. 12/014, 2012.
[16] D. M. Rose, T. Jansen, S. Hahn and T. Kürner, “Impact of Realistic Indoor Mobility Modelling in the Context of Propagation Modelling on the User and Network Experience,” 7th European Conference on Antennas and Propagation, 2013. EuCAP 2013., Gothenburg, Sweden, 2013.
[17] EU FP7 project SEMAFOUR (Self-management for unified heterogeneous radio access networks), “Deliverable 3.4, 'Demonstration Scenarios (updated version)',” [Online] available at http://www.fp7-semafour.eu, May 2015.
SEMAFOUR (316384) D6.6 Final report
Version 1.0 Page 103 of 106
[18] EU FP7 project SEMAFOUR (Self-management for unified heterogeneous radio access networks), “Deliverable 3.2, 'Demonstrator (intermediate version)',” [Online] available at http://www.fp7-semafour.eu, June 2013.
[19] EU FP7 project SEMAFOUR (Self-management for unified heterogeneous radio access networks), “Deliverable 3.3, 'Demonstration scenarios (updated version)',” [Online] available at http://www.fp7-semafour.eu, May 2014.
[20] EU FP7 project SEMAFOUR (Self-management for unified heterogeneous radio access networks), “Deliverable 3.5, 'Demonstrator (full-fledged, results-oriented version)',” [Online] available at http://www.fp7-semafour.eu, July 2015.
[21] EU FP7 project SEMAFOUR (Self-management for unified heterogeneous radio access networks), “Deliverable 4.1, ‘SON functions for multi-layer LTE and multi-RAT networks (first results)’,” [Online] available at http://www.fp7-semafour.eu, November 2013.
[22] EU FP7 project SEMAFOUR (Self-management for unified heterogeneous radio access networks), “Deliverable 4.2, ‘SON Functions for Multi-Layer LTE and Multi-RAT Networks (Final Results)’,” [Online] available at http://www.fp7-semafour.eu, August 2015.
[23] EU FP7 project SEMAFOUR (Self-management for unified heterogeneous radio access networks), “Deliverable 4.3, ‘SON functions for integrated multi-layer and multi-RAT networks’,” [Online] available at http://www.fp7-semafour.eu, June 2015.
[24] CISCO, “Cisco Visual Networking Index: Global Mobile Data Traffic Forecast Update, 2014–2019,” White Paper, February 2015.
[25] Ericsson, “Ericsson Mobility Report – On the pulse of the networked society,” 2014. [26] EU FP7 project SEMAFOUR (Self-management for unified heterogeneous radio access
networks), “Deliverable 2.1: ‘Definition of self-management use cases’,” [Online] available at http://www.fp7-semafour.eu, February 2013.
[27] EU FP7 project SEMAFOUR (Self-management for unified heterogeneous radio access networks), “Deliverable 2.2: ‘Definition of requirements for a unified self-management system’,” [Online] available at http://www.fp7-semafour.eu, June 2013.
[28] 3GPP TS 36.304 v12.3.0, “User Equipment (UE) Procedure in Idle Mode,” Jan 2015. [29] 3GPP R3-151098, Nokia Networks, TNO, Telefonica, and Orange, “Quantifying the benefits of
the 3GPP-WLAN interface,” May 2015. [30] 3GPP TR 38.870, “Study on Multi-RAT joint coordination,” Jan 2015. [31] 3GPP TR 37.870, “Evolved Universal Terrestrial Radio Access (E-UTRA); Study on Multiple
Radio Access Technology (Multi-RAT) joint coordination (Release 13),” version 9.0.0 June 2015.
[32] 3GPP RP-150510, “LTE-WLAN Radio Level Integration and Interworking Enhancement,” Mar 2015.
[33] M. Müller, Information Retrieval for Music and Motion, Springer, 2007. [34] Huawei, 09 April 2013. [Online]. Available: http://pr.huawei.com/en/news/hw-258821-
ictaas.htm. [35] R3-150172, “Analysis of SON for AAS cell splitting/combining scenarios,” in 3GPP RAN3#87,
Athens, Greece, 9-13 February 2015. [36] R3-150765, “Analysis of SON for AAS cell splitting/combining scenarios,” in 3GPP
RAN3#87bis, Tenerife, Spain, 20-24 April 2015. [37] C. Frenzel, S. Lohmüller and L. Schmelz, “Dynamic, Context-Specific SON Management Driven
by Operator Objectives,” in IEEE/IFIP Network Operations and Management Symposium (NOMS), Krakow, Poland, May 2014.
[38] C. Frenzel, S. Lohmüller and L. Schmelz, “SON Management based on Weighted Objectives and Combined SON Function Models,” Barcelona, Spain, August 2014.
[39] S. Hahn, S. Lohmüller, D. Götz and T. Kürner, “Classification of Cells Based on Mobile Network Context Information for the Management of SON Systems,” VTC-Spring, Fifth International
SEMAFOUR (316384) D6.6 Final report
Version 1.0 Page 104 of 106
Workshop on Self-Organizing Networks (IWSON 2015), 2015. [40] S. van der Meer, A. Davy, S. Davy, R. Carroll, B. Jennings and J. Strassner, “Autonomic
Networking: Prototype Implementation of the Policy Continuum,” Vancouver, Canada, 2006. [41] EU FP7 project SEMAFOUR (Self-management for unified heterogeneous radio access
networks), “Deliverable 5.2, ‘Integrated SON Management – Policy Transformation and Operational SON Coordination (first results)’,” [Online] available at http://www.fp7-semafour.eu, May 2014.
[42] EU FP7 project SEMAFOUR (Self-management for unified heterogeneous radio access networks), “Deliverable 5.3, ‘Integrated SON Management – Policy Transformation and Operational SON Coordination (final results)’,” [Online] available at http://www.fp7-semafour.eu, February 2015.
[43] EU FP7 project SEMAFOUR (Self-management for unified heterogeneous radio access networks), “Deliverable 5.4, 'Integrated SON Management - Implementation Recommendations',” [Online] available at http://www.fp7-semafour.eu, May 2015.
[44] T. Tsvetkov, S. Novaczki, H. Sanneck and G. Carle, “A configuration management assessment method for SON verification,” in 11th International Symposium on Wireless Communications Systems (ISWCS), 2014.
[45] T. Tsvetkov, S. Novaczki, H. Sanneck and G. Carle, “A Post-Action Verification Approach for Automatic Configuration Parameter Changes in Self-Organizing Networks,” in 6th International Conference on Mobile Networks and Management (MONAMI 2014), 2014.
[46] C. Frenzel, T. Tsvetkov, H. Sanneck, B. Bauer and G. Carle, “Operational Troubleshooting-enabled Coordination in Self-Organizing Networks,” in 6th International Conference on Mobile Networks and Management (MONAMI 2014), 2014.
[47] A. Tall, R. Combes, Z. Altman and E. Altman, “Distributed Coordination of Self-Organizing Mechanisms in Communication Networks,” IEEE Transactions on Control of Network Systems, pp. 328-337, 2014.
[48] A. Fehske, H. Klessig, J. Voigt and G. Fettweis, “Concurrent Load-Aware Adjustment of User Association and Antenna Tilts in Self-Organizing Radio Networks,” IEEE Transactions on Vehicular Technology, pp. 1974-1988, 2013.
[49] J. Chen, H. Zhuang, B. Andrian and Y. Li, “Difference-Based Joint Parameter Configuration for MRO and MLB,” in Vehicular Technology Conference (VTC-Spring 2012), 2012.
[50] J. Bartelt, A. Fehske, H. Klessig, G. Fettweis and J. Voigt, “Joint Bandwidth Allocation and Small Cell Switching in Heterogeneous Networks,” in IEEE 78th Vehicular Technology Conference (VTC-Fall 2013), 2013.
[51] J. Zhou, Y. Mo and B. Wang, “Joint optimization between MLB and MRO based on cell load balance for LTE networks,” in International Conference on Wireless Communications Signal Processing (WCSP), 2013.
[52] S. Berger, P. Zanier, M. Soszka, A. Fehske, I. Viering and G. Fettweis, “What is the advantage of cooperation in self-organizing networks?,” in IFIP Wireless Days (WD),, 2013 .
[53] K. Tsagkaris, N. Koutsouris, P. Demestichas, R. Combes and Z. Altman, “SON Coordination in a Unified Management Framework,” in IEEE 77th Vehicular Technology Conference (VTC-Spring 2013), 2013.
[54] L.C. Schmelz et al, “A Coordination Framework for Self-Organisation in LTE Networks,” in 12th IEEE/IFIP International Symposium on Integrated Network Management (IM 2012), Dublin, Ireland, May 23-27, 2011.
[55] T. Bandh, H. Sanneck and R. Romeikat, “An Experimental System for SON Function Coordination,” in IEEE 73rd Vehicular Technology Conference (VTC-Spring 2011), 2011.
[56] T. Bandh, R. Romeikat, H. Sanneck and H. Tang, “Policy-based Coordination and Management of SON Functions,” in 12th IEEE/IFIP International Symposium on Integrated Network Management (IM 2011), Dublin, Ireland, May 23-27, 2011.
SEMAFOUR (316384) D6.6 Final report
Version 1.0 Page 105 of 106
[57] Z. Liu, P. Hong, K. Xue and M. Peng, “Conflict Avoidance between Mobility Robustness Optimization and Mobility Load Balancing,” in IEEE Global Telecommunications Conference (GLOBECOM 2010), 2010.
[58] Y. Li, M. Li, B. Cao and W. Liu, “A conflict avoid method between Load Balancing and Mobility Robustness Optimization in LTE,” in 1st IEEE International Conference on Communications in China (ICCC), 2012.
[59] A. Lobinger, S. Stefanski, T. Jansen and I. Balan, “Coordinating Handover Parameter Optimization and Load Balancing in LTE Self-Optimizing Networks,” in IEEE 73rd Vehicular Technology Conference (VTC Spring 2011), 2011.
[60] P. Munoz, R. Barco and S. Fortes, “Conflict Resolution Between Load Balancing and Handover Optimization in LTE Networks,” IEEE Communications Letters, pp. 1795-1798, 2014.
[61] H. Y. Lateef, A. Imran and A. Abu-Dayya, “A framework for classification of Self-Organising network conflicts and coordination algorithms,” in IEEE 24th International Symposium on Personal Indoor and Mobile Radio Communications (PIMRC), 2013.
[62] R. Romeikat, H. Sanneck and T. Bandh, “Efficient, Dynamic Coordination of Request Batches in C-SON Systems,” in IEEE 77th Vehicular Technology Conference (VTC-Spring 2013), 2013 .
[63] N. Zia, S. Mwanje and A. Mitschele-Thiel, “A policy based conflict resolution mechanism for MLB and MRO in LTE self-optimizing networks,” in IEEE Symposium on Computers and Communication (ISCC), 2014.
[64] X. Gelabert, B. Sayrac and S. Ben Jemaa, “A Heuristic Coordination Framework for Self-Optimizing Mechanisms in LTE HetNets,” IEEE Transactions on Vehicular Technology, pp. 1320-1334, 2014.
[65] J. Moysen and L. Giupponi, “A Functional Architecture for Self-Coordination in LTE networks,” in Proceedings of 20th European Wireless Conference, 2014.
[66] O. Iacoboaiea, B. Sayrac, S. Ben Jemaa and P. Bianchi, “SON Conflict Diagnosis in Heterogeneous Networks,” in IEEE PIMRC 2015.
[67] O. Iacoboaiea, B. Sayrac, S. Ben Jemaa and P. Bianchi, “SON coordination for parameter conflict resolution: A reinforcement learning framework,” in IEEE WCNC 2014, SONET Workshop.
[68] O. Iacoboaiea, B. Sayrac, S. Ben Jemaa and P. Bianchi, “Coordinating SON Instances: Reinforcement Learning with Distributed Value Function,” in IEEE PIMRC2014.
[69] O. Iacoboaiea, B. Sayrac, S. Ben Jemaa and P. Bianchi, “Coordinating SON Instances: A Reinforcement Framework,” in IEEE VTC-Fall 2014.
[70] O. Iacoboaiea, B. Sayrac, S. Ben Jemaa and P. Bianchi, “SON Conflict Resolution using Reinforcement Learning with State Aggregation,” in SIGCOMM 2014, All things cellular Workshop.
[71] O. Iacoboaiea, B. Sayrac, S. Ben Jemaa and P. Bianchi, “Low Complexity SON Coordination using Reinforcement Learning,” in IEEE GLOBECOM 2014.
[72] O. Iacoboaiea, B. Sayrac, S. Ben Jemaa and P. Bianchi, “SON Coordination in Heterogeneous Networks:A Reinforcement Learning Framework,” in IEEE Transactions on Wireless Communications.
[73] EU FP7 project SEMAFOUR (Self-management for unified heterogeneous radio access networks), “Deliverable 5.1, ‘Integrated SON Management – Requirements and Basic Concepts’,” [Online] available at http://www.fp7-semafour.eu, December 2013.
[74] EU FP7 project SEMAFOUR (Self-management for unified heterogeneous radio access networks), “Deliverable 2.3, 'State-of-the-art in Radio Network Management - Feedback from the Advisory Board Members',” March 2013.
[75] EU FP7 project SEMAFOUR (Self-management for unified heterogeneous radio access networks), “Deliverable 4.4, 'SON for future networks',” [Online] available at http://www.fp7-semafour.eu, May 2015.
[76] D. Feng, L. Lu, Y. Yuan-Wu, S. Li and G. Feng, “Device-to-device communications in cellular
SEMAFOUR (316384) D6.6 Final report
Version 1.0 Page 106 of 106
networks,” IEEE Communications Magazine, vol. 52, no. 4, 2014. [77] EU FP7 METIS, “Deliverable 6.2: ‘Initial Report on Horizontal Topics, First Results and 5G
System Concepts’,” April 2014. [78] F. Schaich, B. Sayrac and Schubert, “On the Need for a New Air Interface for 5G,” IEEE
COMSOC MMTC E-Letter, vol. 9, no. 5, September 2014. [79] V. Deniau, “Analysis of the Attenuation of the WIFI Signals Inside and Outside a Railway
Vehicle,” in EC: RAILCOM, June 2009. [80] H. Zhao, R. Huang, Y. Zhang and Y. Fang, “Handoff for Wireless Networks with Mobile Relay
Stations,” in IEEE WCNC 2011, March 2011. [81] televic rail, “iCoM,” [Online]. Available: http://www.televic-rail.com/en/iCoM. [Accessed 9 July
2015]. [82] D. Flore, “3GPP News, “Initial priorities for the evolution of LTE in Release-13”,” 3GPP, 2014
September 20. [Online]. Available: http://www.3gpp.org/news-events/3gpp-news/1628-rel13. [Accessed 1 July 2015].
[83] 3. T. RP-141664, “Study on Licensed-Assisted Access using LTE”. [84] A. Tall, Z. Altman and E. Altman, “Virtual Sectorisation: Design and Self-Optimization,” in
IEEE VTC Spring 2015 Workshop IWSON, Glasgow, May 2015. [85] S. Hahn, L. Schmelz, A. Eisenblätter and T. Kürner, “SON Management Simulator -
Implementation and Findings,” Krakow, Poland, May 2014. [86] S. Hahn and T. Kürner, “Managing and Altering Mobile Radio Networks by Using SON Function
Performance Models,” ISWCS 2014 - Fourth International Workshop on Self-Organizing Networks (IWSON 2014), Spain, Barcelona, August 26th, 2014.
[87] Research And Markets, “Signals Ahead: Everything Under the SON,” [Online]. Available: http://www.researchandmarkets.com/reports/2545044/signals_ahead_everything_under_the_son. [Accessed 2015 August 31].