Embed Size (px)
Citation preview
Ingersoll-Rand Company Limited2001 Financial Report
2
Table of Contents
Selected Financial Data .............................................................................................................................. 3
Management’s Discussion and Analysis .................................................................................................... 4
Consolidated Statement of Income .......................................................................................................... 19
Consolidated Balance Sheet..................................................................................................................... 20
Consolidated Statement of Shareholders’ Equity..................................................................................... 21
Consolidated Statement of Cash Flows ................................................................................................... 22
Notes to Consolidated Financial Statements ........................................................................................... 23
Report of Management ............................................................................................................................. 52
Reports of Independent Accountants ....................................................................................................... 53
Quarterly Financial Data ........................................................................................................................... 55
Share Prices and Dividends ..................................................................................................................... 55
3
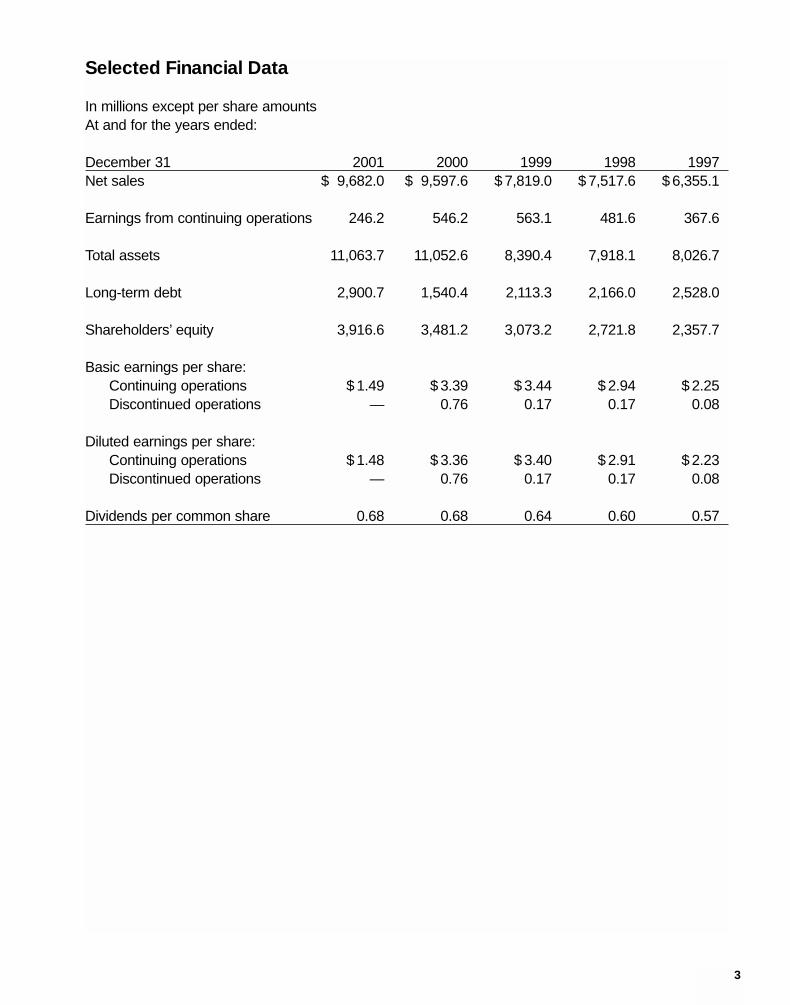
Selected Financial Data
In millions except per share amountsAt and for the years ended:
December 31 2001 2000 1999 1998 1997Net sales $ 9,682.0 $ 9,597.6 $ 7,819.0 $ 7,517.6 $ 6,355.1
Earnings from continuing operations 246.2 546.2 563.1 481.6 367.6
Total assets 11,063.7 11,052.6 8,390.4 7,918.1 8,026.7
Long-term debt 2,900.7 1,540.4 2,113.3 2,166.0 2,528.0
Shareholders’ equity 3,916.6 3,481.2 3,073.2 2,721.8 2,357.7
Basic earnings per share:Continuing operations $ 1.49 $ 3.39 $ 3.44 $ 2.94 $ 2.25Discontinued operations — 0.76 0.17 0.17 0.08
Diluted earnings per share:Continuing operations $ 1.48 $ 3.36 $ 3.40 $ 2.91 $ 2.23Discontinued operations — 0.76 0.17 0.17 0.08
Dividends per common share 0.68 0.68 0.64 0.60 0.57

4
Management’s Discussion and Analysis
During 2001, the following significant events occurred that affect year-to-year comparisons:
Effective December 31, 2001, Ingersoll-Rand Company Limited, a Bermuda company (IR-Limited orthe company) became the successor to Ingersoll-Rand Company, a New Jersey corporation (IR-NewJersey), following a corporate reorganization (the reorganization). The reorganization wasaccomplished through a merger of a newly-formed merger subsidiary into IR-New Jersey. IR-NewJersey, the surviving company, continues to exist as an indirect, wholly-owned subsidiary of IR-Limited. IR-Limited and its subsidiaries continue to conduct the businesses previously conducted byIR-New Jersey and its subsidiaries. The reorganization has been accounted for as a reorganizationof entities under common control and accordingly it did not result in any changes to the consolidatedamounts of assets, liabilities and stockholders’ equity.
During 2001, the consolidated financial statements were restated to report Dresser-Rand Company(Dresser-Rand) on a fully-consolidated basis since the February 2000 acquisition of the remaining 51%.Previously, the company reported the results and net assets of Dresser-Rand as assets held for sale.The company owned 49% of Dresser-Rand in 1999 and accounted for it under the equity method.
During 2001, the company expanded its Industrial Solutions Sector to include Dresser-Rand,renamed its Bearings and Components Segment, to Engineered Solutions and aggregated its toolsand related production equipment operations, previously reported as part of the Industrial ProductsSegment, in the Air and Productivity Solutions Segment. Club Car has been added to theInfrastructure Segment. All segment data presented reflects the new segment structure.
In 2001, the company acquired twelve entities for cash of $158.3 million and treasury stock of $15.3million. The major acquisitions by segment are as follows:
Climate Control• Grenco Transportkoeling B.V., based in the Netherlands, a transport refrigeration sales and
service business.
• National Refrigeration Services, Inc. (NRS), based in Atlanta, Georgia, a leading provider ofcommercial refrigeration products and services for food storage, distribution and displaythroughout the United States.
• Taylor Industries Inc., based in Des Moines, Iowa and an affiliated business, Taylor Refrigeration(Taylor), distributes, installs and services refrigeration equipment, food service equipment andelectric doors.
Engineered Solutions• Nadella S.A., based in France, supplies precision needle bearings for automotive and industrial
applications. Nadella was previously 50% owned by the company.
Infrastructure• Superstav spol. s.r.o., based in the Czech Republic, and Earth Force America, Inc., based in
South Carolina, both of which are manufacturers of compact tractor loader backhoes.

Security and Safety• Kryptonite Corporation, based in Massachusetts, a leading manufacturer of locks for recreational
and portable security applications.
• ITO Emniyet Kilit Sistemleri A., based in Turkey, a leading manufacturer and distributor of locks,cylinders and keys.
The company adopted Emerging Issues Task Force Issue No. 00-25 “Vendor Income StatementCharacterization of Consideration Paid to a Reseller of the Vendor’s Products” in the fourth quarter of2001. Upon adoption, financial statements for all periods presented have been restated to comply withthe income statement classification of reseller finance costs and cooperative advertising programs,which resulted in decreases to net sales of $28.6 million, $24.0 million and $23.6 million, decreases incost of goods sold of $13.1 million, $15.8 million and $17.7 million, increases in selling and administrativeexpenses of $18.5 million, $21.3 million and $13.7 million, and decreases in interest expense of $34.0million, $29.5 million and $19.6 million in 2001, 2000 and 1999, respectively.
During 2001, the company continued the restructuring program and productivity initiatives that wereinitiated in 2000, which include such actions as employee severance, plant rationalizations,organizational realignments consistent with the company’s market-based structure and the consolidationof back-office processes. In response to continued weakness in its major end markets, the companyinitiated a second phase of restructuring and productivity initiatives in the fourth quarter of 2001 focusedon reducing general and administrative expenses and is expected to cost $150 million and be completedby the end of 2002. The programs have resulted in the closure of 20 plants and a workforce reductionof more than 3,900 employees. Charges for restructuring and productivity initiatives for full-year 2001totaled $216.9 million.
Results of OperationsNet earnings for 2001 were $246.2 million, or diluted earnings per share of $1.48 as compared to $669.4million and $4.12 per share, and $591.1 million and $3.57 per share in 2000 and 1999, respectively. Alldollar amounts are in millions.
Cost of goods sold, and selling and administrative expenses in 2001 and 2000 include other charges for productivityinvestments. Productivity investments consist of costs for equipment moving, facility redesign, employee relocation andretraining, and systems enhancements. Charges for productivity investments are expensed as incurred. Productivityinvestments were incurred by all business segments. Additionally in 2001, $9.5 million was included in selling and administrativeexpenses for costs associated with the reincorporation in Bermuda.
Sales
Cost of goods sold
Selling and administrative expenses
Restructuring charges
Operating income
Operating margin
5
2001Restructure
Reported and Other AdjustedResults Charges Results
$ 9,682.0 $ — $ 9,682.0
7,611.5 85.9 7,525.6
1,454.2 47.4 1,406.8
93.1 93.1 —
$ 523.2 $ (226.4) $ 749.6
5.4% 7.7%
2000Restructure
Reported and Other AdjustedResults Charges Results
$ 9,597.6 $ — $ 9,597.6
7,141.4 25.1 7,116.3
1,279.6 29.3 1,250.3
87.2 87.2 —
$ 1,089.4 $ (141.6) $ 1,231.0
11.4% 12.8%
1999
ReportedResults
$ 7,819.0
5,673.2
1,066.1
—
$ 1,079.7
13.8%
6
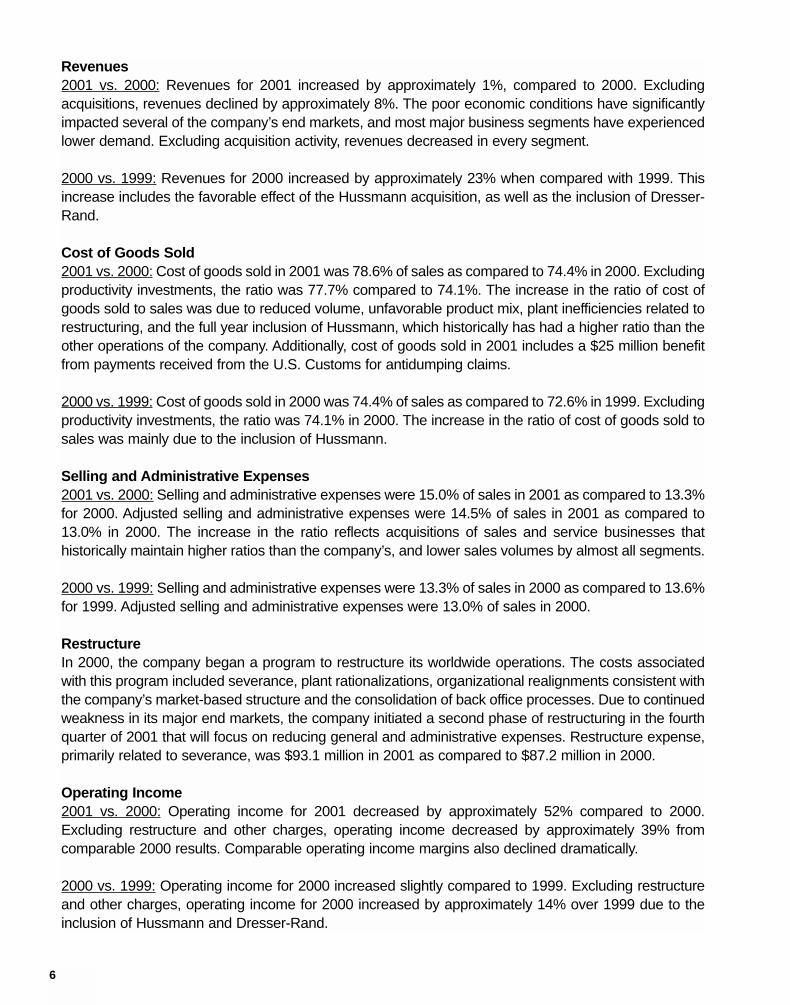
Revenues2001 vs. 2000: Revenues for 2001 increased by approximately 1%, compared to 2000. Excludingacquisitions, revenues declined by approximately 8%. The poor economic conditions have significantlyimpacted several of the company’s end markets, and most major business segments have experiencedlower demand. Excluding acquisition activity, revenues decreased in every segment.
2000 vs. 1999: Revenues for 2000 increased by approximately 23% when compared with 1999. Thisincrease includes the favorable effect of the Hussmann acquisition, as well as the inclusion of Dresser-Rand.
Cost of Goods Sold2001 vs. 2000: Cost of goods sold in 2001 was 78.6% of sales as compared to 74.4% in 2000. Excludingproductivity investments, the ratio was 77.7% compared to 74.1%. The increase in the ratio of cost ofgoods sold to sales was due to reduced volume, unfavorable product mix, plant inefficiencies related torestructuring, and the full year inclusion of Hussmann, which historically has had a higher ratio than theother operations of the company. Additionally, cost of goods sold in 2001 includes a $25 million benefitfrom payments received from the U.S. Customs for antidumping claims.
2000 vs. 1999: Cost of goods sold in 2000 was 74.4% of sales as compared to 72.6% in 1999. Excludingproductivity investments, the ratio was 74.1% in 2000. The increase in the ratio of cost of goods sold tosales was mainly due to the inclusion of Hussmann.
Selling and Administrative Expenses2001 vs. 2000: Selling and administrative expenses were 15.0% of sales in 2001 as compared to 13.3%for 2000. Adjusted selling and administrative expenses were 14.5% of sales in 2001 as compared to13.0% in 2000. The increase in the ratio reflects acquisitions of sales and service businesses thathistorically maintain higher ratios than the company’s, and lower sales volumes by almost all segments.
2000 vs. 1999: Selling and administrative expenses were 13.3% of sales in 2000 as compared to 13.6%for 1999. Adjusted selling and administrative expenses were 13.0% of sales in 2000.
RestructureIn 2000, the company began a program to restructure its worldwide operations. The costs associatedwith this program included severance, plant rationalizations, organizational realignments consistent withthe company’s market-based structure and the consolidation of back office processes. Due to continuedweakness in its major end markets, the company initiated a second phase of restructuring in the fourthquarter of 2001 that will focus on reducing general and administrative expenses. Restructure expense,primarily related to severance, was $93.1 million in 2001 as compared to $87.2 million in 2000.
Operating Income2001 vs. 2000: Operating income for 2001 decreased by approximately 52% compared to 2000.Excluding restructure and other charges, operating income decreased by approximately 39% fromcomparable 2000 results. Comparable operating income margins also declined dramatically.
2000 vs. 1999: Operating income for 2000 increased slightly compared to 1999. Excluding restructureand other charges, operating income for 2000 increased by approximately 14% over 1999 due to theinclusion of Hussmann and Dresser-Rand.

7
Interest Expense2001 vs. 2000: Interest expense for 2001 totaled $253.0 million, a decrease from 2000’s total of $255.3million. Lower average interest rates, combined with a reduction in outstanding debt were offset by a fullyear of interest associated with the debt incurred to purchase Hussmann.
2000 vs. 1999: Interest expense of $255.3 million for 2000 was significantly higher than the $183.5million in 1999 due to the impact of the debt incurred to purchase Hussmann and Dresser-Rand.
Other Income (Expense)Other income (expense), net, includes foreign exchange activities, equity in earnings of partially ownedaffiliates, and other miscellaneous income and expense items.
2001 vs. 2000: In 2001, other income (expense), net, aggregated $6.8 million of net expense, ascompared with $35.8 million of net income in 2000. Included in 2001 is $25 million in benefits frompayments from U.S. Customs for antidumping claims associated with Engineered Solutions for yearsprior to 2001, partially reduced by one-time costs related to settlements of contract disputes. Additionally,2001 includes increases in other normal miscellaneous expenses, which were partially offset by an $8.8million gain on the sale of stock received in connection with the sale of Dresser-Rand’s compressionservices business. Included in 2000 is a $50.4 million gain on the sale of Dresser-Rand’s compressionservices business, which was partially offset by foreign exchange losses.
2000 vs. 1999: In 2000, other income (expense), net, aggregated $35.8 million of net income, ascompared with $3.1 million of net income in 1999. During 2000, the $50.4 million gain on the sale of thecompression services business of Dresser-Rand, offset by higher foreign exchange losses, resulted inthe increase.
Minority InterestsThe company’s charges for minority interests are composed of two items: (1) charges associated withthe company’s equity-linked securities, and (2) interests of minority owners (less than 50%) inconsolidated subsidiaries of the company.
2001 vs. 2000: Minority interests decreased from $39.3 million in 2000, to $20.1 million in 2001, mainlyas a result of the conversion of equity-linked securities into approximately 8.3 million common shares inMay 2001. This eliminated the charges associated with the securities. Additionally, earnings fromconsolidated entities in which the company has a majority ownership declined.
2000 vs. 1999: Minority interests charges increased from $29.1 million in 1999 to $39.3 million in 2000due to higher earnings in entities in which the company has the majority ownership, while charges forequity-linked securities were comparable.
Provision for Income TaxesAs a result of the reorganization and subsequent incorporation in Bermuda, as well as other tax planningstrategies, the company had a net tax benefit of $2.9 million for the year ended December 31, 2001. Thiscompared to a provision of $284.4 million, and an effective tax rate of 34% for 2000 and a provision of$307.1 million, and an effective tax rate of 35% for 1999. As a result of the reincorporation from NewJersey to Bermuda, the company recorded a one time tax benefit of $59.8 million related to the utilizationof previously limited foreign tax credits and net operating loss carryforwards in certain non-U.S.
8
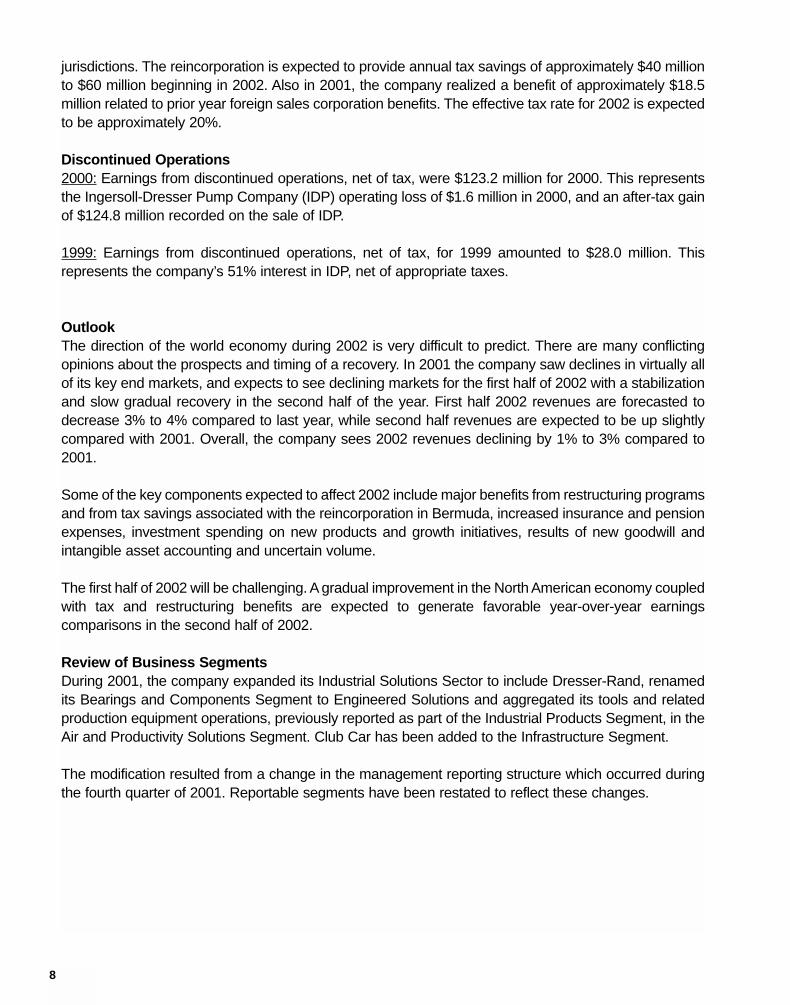
jurisdictions. The reincorporation is expected to provide annual tax savings of approximately $40 millionto $60 million beginning in 2002. Also in 2001, the company realized a benefit of approximately $18.5million related to prior year foreign sales corporation benefits. The effective tax rate for 2002 is expectedto be approximately 20%.
Discontinued Operations2000: Earnings from discontinued operations, net of tax, were $123.2 million for 2000. This representsthe Ingersoll-Dresser Pump Company (IDP) operating loss of $1.6 million in 2000, and an after-tax gainof $124.8 million recorded on the sale of IDP.
1999: Earnings from discontinued operations, net of tax, for 1999 amounted to $28.0 million. Thisrepresents the company’s 51% interest in IDP, net of appropriate taxes.
OutlookThe direction of the world economy during 2002 is very difficult to predict. There are many conflictingopinions about the prospects and timing of a recovery. In 2001 the company saw declines in virtually allof its key end markets, and expects to see declining markets for the first half of 2002 with a stabilizationand slow gradual recovery in the second half of the year. First half 2002 revenues are forecasted todecrease 3% to 4% compared to last year, while second half revenues are expected to be up slightlycompared with 2001. Overall, the company sees 2002 revenues declining by 1% to 3% compared to2001.
Some of the key components expected to affect 2002 include major benefits from restructuring programsand from tax savings associated with the reincorporation in Bermuda, increased insurance and pensionexpenses, investment spending on new products and growth initiatives, results of new goodwill andintangible asset accounting and uncertain volume.
The first half of 2002 will be challenging. A gradual improvement in the North American economy coupledwith tax and restructuring benefits are expected to generate favorable year-over-year earningscomparisons in the second half of 2002.
Review of Business SegmentsDuring 2001, the company expanded its Industrial Solutions Sector to include Dresser-Rand, renamedits Bearings and Components Segment to Engineered Solutions and aggregated its tools and relatedproduction equipment operations, previously reported as part of the Industrial Products Segment, in theAir and Productivity Solutions Segment. Club Car has been added to the Infrastructure Segment.
The modification resulted from a change in the management reporting structure which occurred duringthe fourth quarter of 2001. Reportable segments have been restated to reflect these changes.

9
The following table summarizes costs for restructure and productivity investments by segment, for 2001and 2000, in millions:
2001 2000 Productivity Productivity
Restructure Investments Restructure Investments
Climate Control $ 31.7 $ 32.1 $ 3.6 $ 6.9Industrial Solutions
Air and Productivity Solutions 16.2 21.6 16.5 6.0Dresser-Rand 2.1 7.1 11.0 4.4Engineered Solutions 19.6 15.3 11.5 1.3
Infrastructure 5.7 12.5 11.4 9.3Security and Safety 3.0 25.2 15.1 8.9Corporate 14.8 10.0 18.1 17.6Total $ 93.1 $ 123.8 $ 87.2 $ 54.4
Climate ControlClimate Control is engaged in the design, manufacture, sale and service of transport temperature controlunits, HVAC systems, refrigerated display merchandisers, beverage coolers, and walk-in storagecoolers and freezers. It includes the market leading brands of Thermo King and Hussmann. All dollaramounts are in millions.
2001 2000 1999
Sales $ 2,438.2 $ 2,002.4 $ 1,202.6Operating income, reported $ 21.7 $ 206.3 $ 166.5Operating margin, reported 0.9% 10.3% 13.8%Operating income, before restructure
and other charges $ 85.5 $ 216.8 $ 166.5Operating margin, before restructure
and other charges 3.5% 10.8% 13.8%
2001 vs. 2000: Climate Control revenues increased approximately 22% due to the full year inclusion ofHussmann as well as the 2001 acquisitions of NRS and Taylor. The increase due to acquisitions wassubstantially offset by lower Thermo King revenues, which resulted from deterioration of worldwidemarkets, especially the U.S. truck and trailer market. Operating income and margins decreased primarilydue to declining revenues in higher margin product lines, pricing pressure in the container business,lower margins on acquired businesses and reduced spending by major U.S. supermarket chains.
2000 vs. 1999: Revenues increased by approximately 67% due to the acquisition of Hussmann in June2000. Excluding Hussmann, operating income and margins decreased due to a severe decline in theNorth American truck and trailer market and continued weak truck and trailer results in Europe. However,the bus air conditioning and sea-going container business improved substantially.
Industrial SolutionsIndustrial Solutions is composed of a diverse group of businesses focused on providing solutions toenhance customers’ industrial efficiency. Industrial Solutions consists of the following three segments:Air and Productivity Solutions, Dresser-Rand, and Engineered Solutions.
10
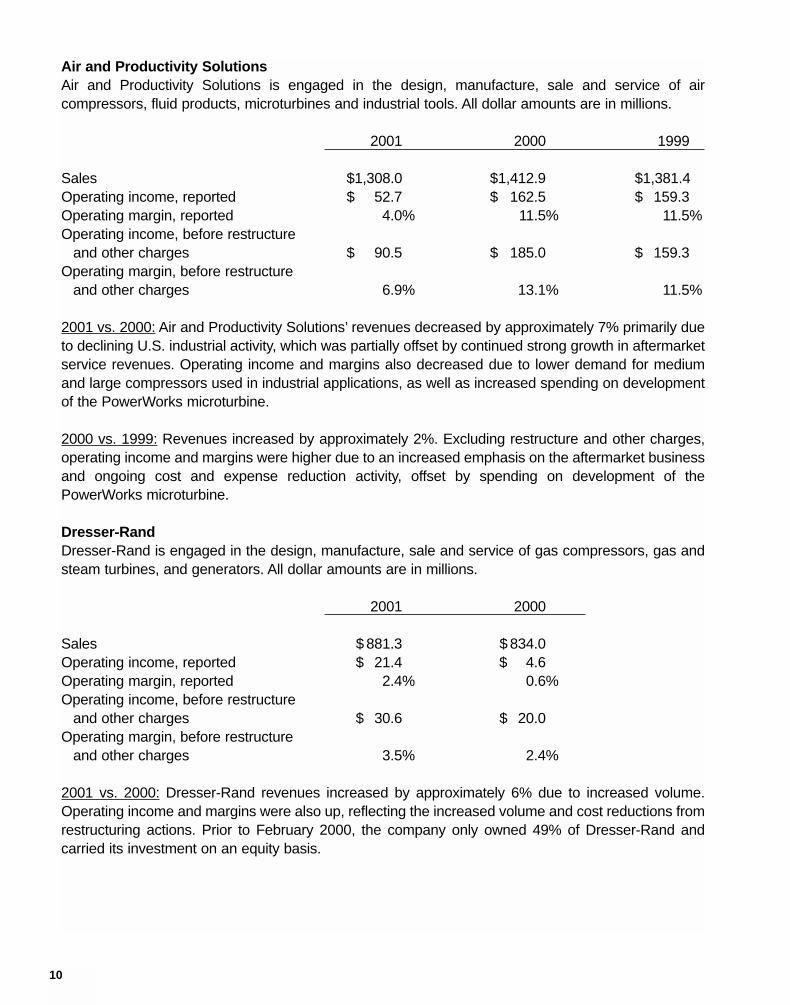
Air and Productivity SolutionsAir and Productivity Solutions is engaged in the design, manufacture, sale and service of aircompressors, fluid products, microturbines and industrial tools. All dollar amounts are in millions.
2001 2000 1999
Sales $1,308.0 $1,412.9 $1,381.4Operating income, reported $ 52.7 $ 162.5 $ 159.3Operating margin, reported 4.0% 11.5% 11.5%Operating income, before restructure
and other charges $ 90.5 $ 185.0 $ 159.3Operating margin, before restructure
and other charges 6.9% 13.1% 11.5%
2001 vs. 2000: Air and Productivity Solutions’ revenues decreased by approximately 7% primarily dueto declining U.S. industrial activity, which was partially offset by continued strong growth in aftermarketservice revenues. Operating income and margins also decreased due to lower demand for mediumand large compressors used in industrial applications, as well as increased spending on developmentof the PowerWorks microturbine.
2000 vs. 1999: Revenues increased by approximately 2%. Excluding restructure and other charges,operating income and margins were higher due to an increased emphasis on the aftermarket businessand ongoing cost and expense reduction activity, offset by spending on development of thePowerWorks microturbine.
Dresser-RandDresser-Rand is engaged in the design, manufacture, sale and service of gas compressors, gas andsteam turbines, and generators. All dollar amounts are in millions.
2001 2000
Sales $ 881.3 $ 834.0Operating income, reported $ 21.4 $ 4.6Operating margin, reported 2.4% 0.6%Operating income, before restructure
and other charges $ 30.6 $ 20.0Operating margin, before restructure
and other charges 3.5% 2.4%
2001 vs. 2000: Dresser-Rand revenues increased by approximately 6% due to increased volume.Operating income and margins were also up, reflecting the increased volume and cost reductions fromrestructuring actions. Prior to February 2000, the company only owned 49% of Dresser-Rand andcarried its investment on an equity basis.

11
Engineered SolutionsEngineered Solutions is engaged in the design, manufacture, sale and service of precision bearingproducts and motion control components and assemblies. It includes both Automotive and IndustrialEngineered Solutions. This segment was formerly known as Bearings and Components. All dollaramounts are in millions.
2001 2000 1999
Sales $ 1,077.8 $ 1,185.4 $ 1,239.5Operating income, reported $ 78.0 $ 159.8 $ 145.8Operating margin, reported 7.2% 13.5% 11.8%Operating income, before restructure
and other charges $ 112.9 $ 172.6 $ 145.8Operating margin, before restructure
and other charges 10.5% 14.6% 11.8%
2001 vs. 2000: Engineered Solutions’ revenues decreased by approximately 9% due to lower volumesin the U.S. automotive and industrial equipment markets. Operating income and margins also decreasedas a result of lower volumes. Operating income in 2001 includes a $25 million benefit from paymentsreceived from the U.S. Customs for antidumping claims.
2000 vs. 1999: Revenues decreased approximately 4% due to lower volumes in the automotive marketas a result of a downturn in the production of light trucks and sport-utility vehicles. Operating income andmargins increased due to significant ongoing cost and expense reduction activities, as well as higheraftermarket revenues.
InfrastructureInfrastructure is engaged in the design, manufacture, sale and service of skid-steer loaders, mini-excavators, electric and gasoline powered golf and utility vehicles, portable compressors and lighttowers, road construction and repair equipment, and a broad line of drills and drill accessories. It includesBobcat, Club Car, Portable Power, Road Development and Specialty Equipment. All dollar amounts arein millions.
2001 2000 1999
Sales $ 2,570.3 $ 2,752.5 $ 2,707.3Operating income, reported $ 219.7 $ 389.7 $ 416.9Operating margin, reported 8.5% 14.2% 15.4%Operating income, before restructure
and other charges $ 237.9 $ 410.4 $ 416.9Operating margin, before restructure
and other charges 9.3% 14.9% 15.4%
2001 vs. 2000: Infrastructure revenues decreased by approximately 7% along with dramatic declines inoperating income and margins, as a result of significantly reduced demand from large U.S. rentalcompanies and new equipment dealers who are aggressively managing inventory, as well as weakerNorth American Road Development. Operating margins also declined due to aggressive pricing andterms offered by competitors.
12
2000 vs. 1999: Revenues increased by approximately 2%. Bobcat’s revenue improvement due tovolume gains was offset by lower sales in the rest of Infrastructure. Portable Power revenues declinedas slowness in national rental accounts occurred, while Road Development revenues declined as aresult of U.S. market softness.
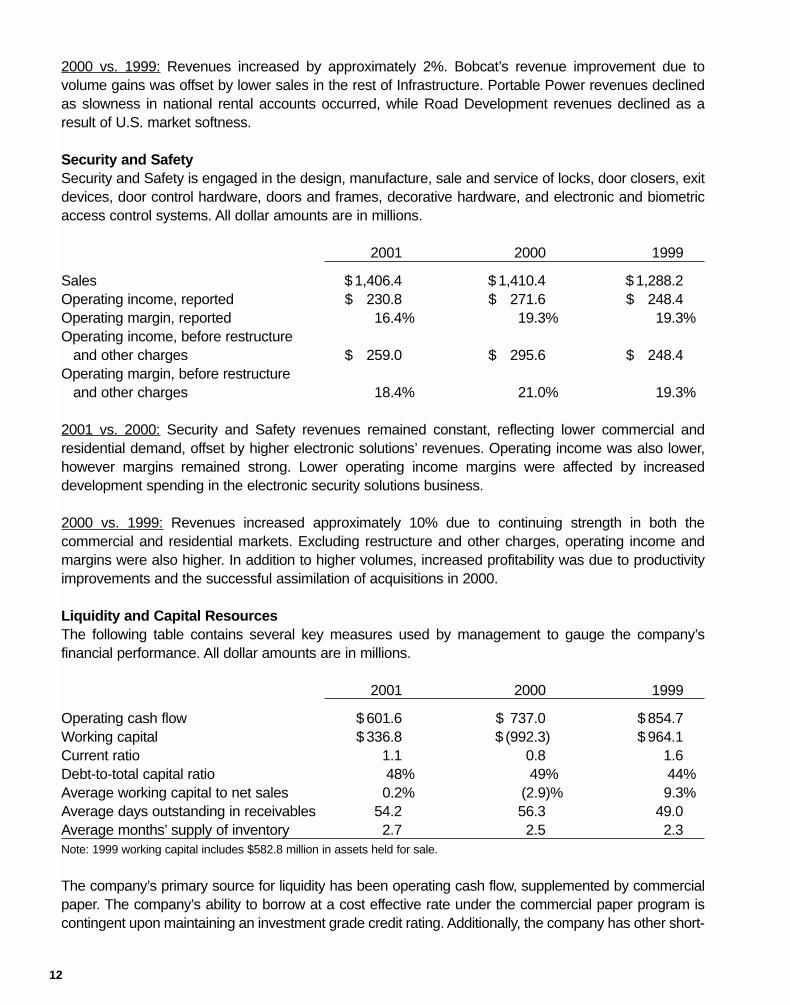
Security and SafetySecurity and Safety is engaged in the design, manufacture, sale and service of locks, door closers, exitdevices, door control hardware, doors and frames, decorative hardware, and electronic and biometricaccess control systems. All dollar amounts are in millions.
2001 2000 1999
Sales $ 1,406.4 $ 1,410.4 $ 1,288.2Operating income, reported $ 230.8 $ 271.6 $ 248.4Operating margin, reported 16.4% 19.3% 19.3%Operating income, before restructure
and other charges $ 259.0 $ 295.6 $ 248.4Operating margin, before restructure
and other charges 18.4% 21.0% 19.3%
2001 vs. 2000: Security and Safety revenues remained constant, reflecting lower commercial andresidential demand, offset by higher electronic solutions’ revenues. Operating income was also lower,however margins remained strong. Lower operating income margins were affected by increaseddevelopment spending in the electronic security solutions business.
2000 vs. 1999: Revenues increased approximately 10% due to continuing strength in both thecommercial and residential markets. Excluding restructure and other charges, operating income andmargins were also higher. In addition to higher volumes, increased profitability was due to productivityimprovements and the successful assimilation of acquisitions in 2000.
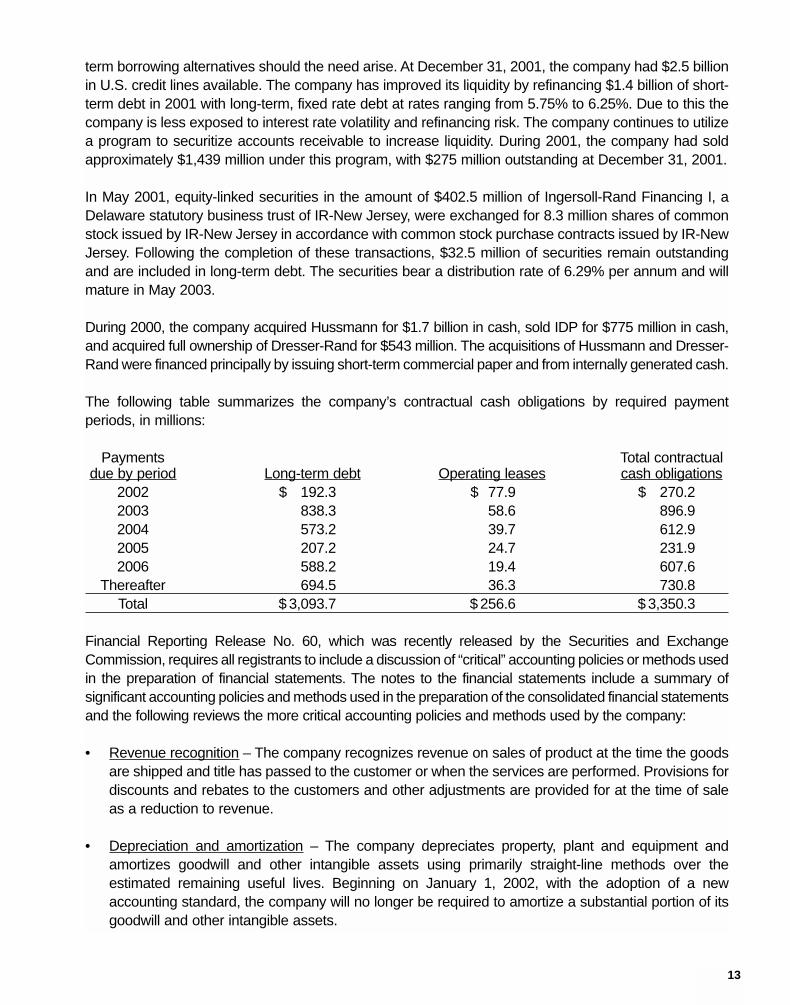
Liquidity and Capital ResourcesThe following table contains several key measures used by management to gauge the company’sfinancial performance. All dollar amounts are in millions.
2001 2000 1999
Operating cash flow $ 601.6 $ 737.0 $ 854.7Working capital $ 336.8 $ (992.3) $ 964.1Current ratio 1.1 0.8 1.6 Debt-to-total capital ratio 48% 49% 44%Average working capital to net sales 0.2% (2.9)% 9.3%Average days outstanding in receivables 54.2 56.3 49.0Average months’ supply of inventory 2.7 2.5 2.3Note: 1999 working capital includes $582.8 million in assets held for sale.
The company’s primary source for liquidity has been operating cash flow, supplemented by commercialpaper. The company’s ability to borrow at a cost effective rate under the commercial paper program iscontingent upon maintaining an investment grade credit rating. Additionally, the company has other short-
13
term borrowing alternatives should the need arise. At December 31, 2001, the company had $2.5 billionin U.S. credit lines available. The company has improved its liquidity by refinancing $1.4 billion of short-term debt in 2001 with long-term, fixed rate debt at rates ranging from 5.75% to 6.25%. Due to this thecompany is less exposed to interest rate volatility and refinancing risk. The company continues to utilizea program to securitize accounts receivable to increase liquidity. During 2001, the company had soldapproximately $1,439 million under this program, with $275 million outstanding at December 31, 2001.
In May 2001, equity-linked securities in the amount of $402.5 million of Ingersoll-Rand Financing I, aDelaware statutory business trust of IR-New Jersey, were exchanged for 8.3 million shares of commonstock issued by IR-New Jersey in accordance with common stock purchase contracts issued by IR-NewJersey. Following the completion of these transactions, $32.5 million of securities remain outstandingand are included in long-term debt. The securities bear a distribution rate of 6.29% per annum and willmature in May 2003.
During 2000, the company acquired Hussmann for $1.7 billion in cash, sold IDP for $775 million in cash,and acquired full ownership of Dresser-Rand for $543 million. The acquisitions of Hussmann and Dresser-Rand were financed principally by issuing short-term commercial paper and from internally generated cash.
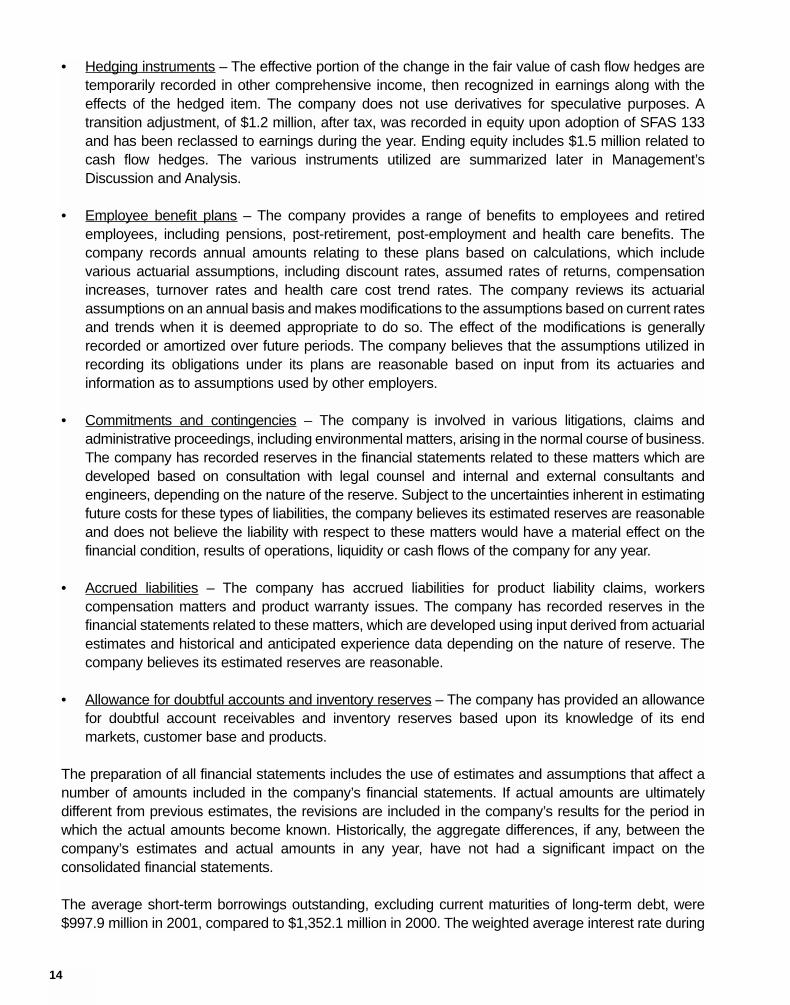
The following table summarizes the company’s contractual cash obligations by required paymentperiods, in millions:
Payments Total contractualdue by period Long-term debt Operating leases cash obligations
2002 $ 192.3 $ 77.9 $ 270.22003 838.3 58.6 896.92004 573.2 39.7 612.92005 207.2 24.7 231.92006 588.2 19.4 607.6
Thereafter 694.5 36.3 730.8Total $ 3,093.7 $ 256.6 $ 3,350.3
Financial Reporting Release No. 60, which was recently released by the Securities and ExchangeCommission, requires all registrants to include a discussion of “critical” accounting policies or methods usedin the preparation of financial statements. The notes to the financial statements include a summary ofsignificant accounting policies and methods used in the preparation of the consolidated financial statementsand the following reviews the more critical accounting policies and methods used by the company:
• Revenue recognition – The company recognizes revenue on sales of product at the time the goodsare shipped and title has passed to the customer or when the services are performed. Provisions fordiscounts and rebates to the customers and other adjustments are provided for at the time of saleas a reduction to revenue.
• Depreciation and amortization – The company depreciates property, plant and equipment andamortizes goodwill and other intangible assets using primarily straight-line methods over theestimated remaining useful lives. Beginning on January 1, 2002, with the adoption of a newaccounting standard, the company will no longer be required to amortize a substantial portion of itsgoodwill and other intangible assets.
14
• Hedging instruments – The effective portion of the change in the fair value of cash flow hedges aretemporarily recorded in other comprehensive income, then recognized in earnings along with theeffects of the hedged item. The company does not use derivatives for speculative purposes. Atransition adjustment, of $1.2 million, after tax, was recorded in equity upon adoption of SFAS 133and has been reclassed to earnings during the year. Ending equity includes $1.5 million related tocash flow hedges. The various instruments utilized are summarized later in Management’sDiscussion and Analysis.
• Employee benefit plans – The company provides a range of benefits to employees and retiredemployees, including pensions, post-retirement, post-employment and health care benefits. Thecompany records annual amounts relating to these plans based on calculations, which includevarious actuarial assumptions, including discount rates, assumed rates of returns, compensationincreases, turnover rates and health care cost trend rates. The company reviews its actuarialassumptions on an annual basis and makes modifications to the assumptions based on current ratesand trends when it is deemed appropriate to do so. The effect of the modifications is generallyrecorded or amortized over future periods. The company believes that the assumptions utilized inrecording its obligations under its plans are reasonable based on input from its actuaries andinformation as to assumptions used by other employers.
• Commitments and contingencies – The company is involved in various litigations, claims andadministrative proceedings, including environmental matters, arising in the normal course of business.The company has recorded reserves in the financial statements related to these matters which aredeveloped based on consultation with legal counsel and internal and external consultants andengineers, depending on the nature of the reserve. Subject to the uncertainties inherent in estimatingfuture costs for these types of liabilities, the company believes its estimated reserves are reasonableand does not believe the liability with respect to these matters would have a material effect on thefinancial condition, results of operations, liquidity or cash flows of the company for any year.
• Accrued liabilities – The company has accrued liabilities for product liability claims, workerscompensation matters and product warranty issues. The company has recorded reserves in thefinancial statements related to these matters, which are developed using input derived from actuarialestimates and historical and anticipated experience data depending on the nature of reserve. Thecompany believes its estimated reserves are reasonable.
• Allowance for doubtful accounts and inventory reserves – The company has provided an allowancefor doubtful account receivables and inventory reserves based upon its knowledge of its endmarkets, customer base and products.
The preparation of all financial statements includes the use of estimates and assumptions that affect anumber of amounts included in the company’s financial statements. If actual amounts are ultimatelydifferent from previous estimates, the revisions are included in the company’s results for the period inwhich the actual amounts become known. Historically, the aggregate differences, if any, between thecompany’s estimates and actual amounts in any year, have not had a significant impact on theconsolidated financial statements.
The average short-term borrowings outstanding, excluding current maturities of long-term debt, were$997.9 million in 2001, compared to $1,352.1 million in 2000. The weighted average interest rate during
15
2001 and 2000 was 5.5% and 6.6%. The maximum amounts outstanding during 2001 and 2000 were$1,505.8 million and $2,533.8 million, respectively.
The company had $1.25 billion in U.S. short-term credit lines and $1.25 billion in long-term credit linesat December 31, 2001, all of which were unused. Additionally, $1.0 billion of non-U.S. credit lines wereavailable for working capital purposes, $786.5 million of which was unused at the end of the year. Thesefacilities exceed projected requirements for 2002 and provide direct support for commercial paper andindirect support for other financial instruments, such as letters of credit and comfort letters.
In 2001 and 2000, foreign currency translation adjustments decreased shareholders’ equity by $45.9million and $90.2 million, respectively. This was due to the strengthening of the U.S. dollar against othercurrencies in countries where the company has significant operations. Currency fluctuations in the euroand the British pound accounted for nearly all of the change.
The company utilizes two wholly owned, special purpose subsidiaries to purchase accounts and notesreceivable at a discount from the company on a continuous basis. These special purpose subsidiariessimultaneously sell an undivided interest in these accounts and notes receivable to a financial institutionup to a maximum of $300.0 million in 2001 and $240.0 million in 2000. The agreements between thespecial purpose corporations and the financial institution do not have predefined expiration dates. Thecompany is retained as the servicer of the pooled receivables. At December 31, 2001 and 2000, $275.0million and $210.0 million of such receivables, respectively, remained uncollected.
Capital expenditures were $200.6 million and $201.3 million in 2001 and 2000, respectively. Thecompany continues investing to improve manufacturing productivity, reduce costs, and provideenvironmental enhancements and advanced technologies for existing facilities. The capital expenditureprogram for 2002 is estimated at approximately $200.0 million, including amounts approved in priorperiods. Many of these projects are subject to review and cancellation at the option of the companywithout incurring substantial charges. There are no planned projects, either individually or in theaggregate, that represent a material commitment for the company.
At December 31, 2001, 2000 and 1999, employment totaled 55,898, 56,688 and 46,062, respectively.The decrease from 2000 to 2001 was due to terminations from the company’s restructuring program,which were partially offset by acquisitions. The increase from 1999 to 2000 was due to acquisitionsduring the year, which were partially offset by terminations under the company’s restructuring program.
Financial Market RiskThe company is exposed to fluctuations in the price of major raw materials used in the manufacturingprocess, foreign currency fluctuations and interest rate charges. From time to time the company entersinto agreements to reduce its raw material, foreign currency and interest rate risks. Such agreementshedge only specific transactions or commitments. To minimize the risk of counter party non-performance, such agreements are made only through major financial institutions with significantexperience in such financial instruments.
The company generates foreign currency exposures in the normal course of business. To mitigate therisk from foreign currency exchange rate fluctuations, the company will generally enter into forwardcurrency exchange contracts or options for the purchase or sale of a currency in accordance with thecompany’s policies and procedures. The company applies sensitivity analysis and value at risk (VAR)

16
techniques when measuring the company’s exposure to currency fluctuations. VAR is a measurementof the estimated loss in fair value until currency positions can be neutralized, recessed or liquidated andassumes a 95% confidence level with normal market conditions. The potential one-day loss, as ofDecember 31, 2001, was $3.1 million and is considered insignificant in relation to the company’s resultsof operations and shareholders’ equity.
The company maintains significant operations in countries other than the U.S.; therefore, the movementof the U.S. dollar against foreign currencies has an impact on the company’s financial position.Generally, the functional currency of the company’s non-U.S. subsidiaries is their local currency. Thecompany manages exposure to changes in foreign currency exchange rates through its normaloperating and financing activities, as well as through the use of forward exchange contracts and options.The company attempts, through its hedging activities, to mitigate the impact on income of changes inforeign exchange rates.
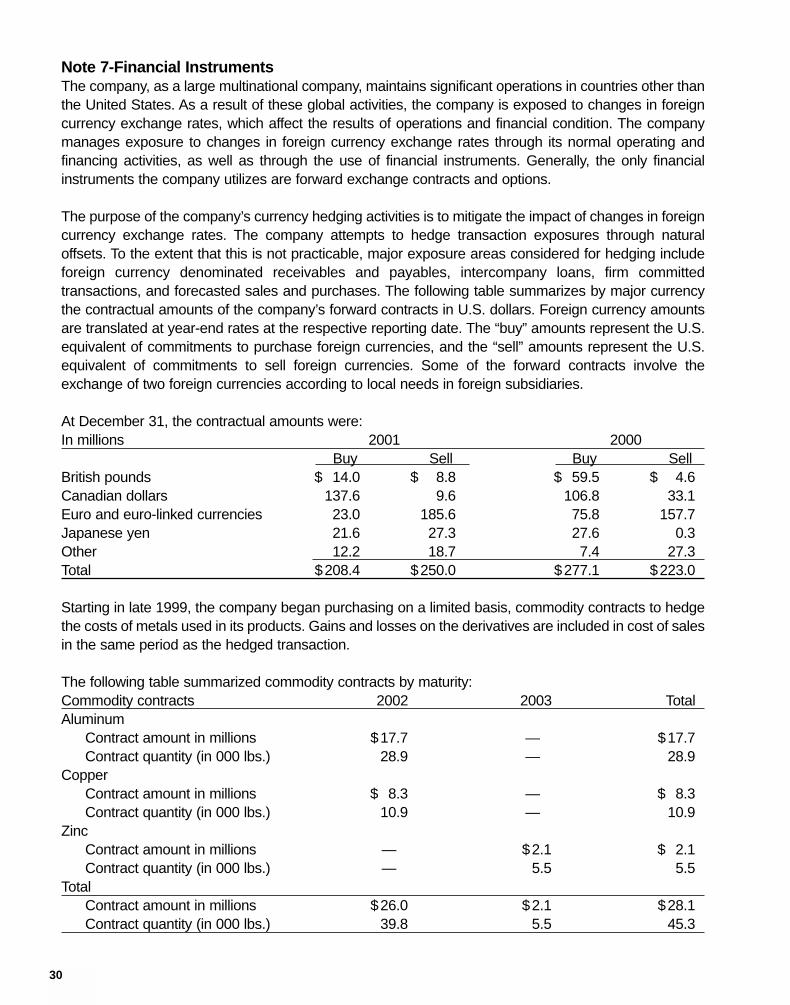
At December 31, the contractual amounts of foreign currency contracts were:
In millions 2001 2000
Buy Sell Buy SellBritish pounds $ 14.0 $ 8.8 $ 59.5 $ 4.6Canadian dollars 137.6 9.6 106.8 33.1Euro and euro-linked currencies 23.0 185.6 75.8 157.7Japanese yen 21.6 27.3 27.6 0.3Other 12.2 18.7 7.4 27.3Total $ 208.4 $ 250.0 $ 277.1 $ 223.0
Starting in late 1999, the company began purchasing on a limited basis, commodity derivatives to hedgethe variable portion in supplier contracts of the costs of metals used in its products. Gains and losses onthe derivatives are included in cost of sales in the same period as the hedged transaction.
The following table summarizes commodity contracts by maturity:
Commodity contracts 2002 2003 Total
AluminumContract amount in millions $ 17.7 — $ 17.7Contract quantity (in 000 lbs.) 28.9 — 28.9
CopperContract amount in millions $ 8.3 — $ 8.3Contract quantity (in 000 lbs.) 10.9 — 10.9
ZincContract amount in millions — $ 2.1 $ 2.1Contract quantity (in 000 lbs.) — 5.5 5.5
TotalContract amount in millions $ 26.0 $ 2.1 $ 28.1Contract quantity (in 000 lbs.) 39.8 5.5 45.3
17
With regard to interest rate risk, the effect of a hypothetical 1% increase in interest rates, across allmaturities, would decrease the estimated fair value of the company’s long-term debt at December 31,2001, from $2,996.7 million to an estimated fair value of $2,889.6 million.
Environmental MattersThe company continues to be dedicated to an environmental program to reduce the utilization andgeneration of hazardous materials during the manufacturing process and to remediate identifiedenvironmental concerns. As to the latter, the company currently is engaged in site investigations andremedial activities to address environmental cleanup from past operations at current and formermanufacturing facilities.
During 2001, the company spent approximately $2.0 million on capital projects for pollution abatementand control, and an additional $7.8 million for environmental remediation expenditures at sites presentlyor formerly owned or leased by the company. It should be noted that these amounts are difficult toestimate because environmental improvement costs are generally a part of the overall improvementcosts at a particular plant. Therefore, an accurate estimate of which portion of an improvement or acapital expenditure relates to an environmental improvement is difficult to ascertain. The companybelieves that these expenditure levels will continue and may increase over time. Given the evolvingnature of environmental laws, regulations and technology, the ultimate cost of future compliance isuncertain.
The company is a party to environmental lawsuits and claims, and has received notices of potentialviolations of environmental laws and regulations from the Environmental Protection Agency and similarstate authorities. It is identified as a potentially responsible party (PRP) for cleanup costs associated withoff-site waste disposal at federal Superfund and state remediation sites, excluding sites as to which thecompany’s records disclose no involvement or as to which the company’s liability has been fullydetermined. For all sites there are other PRPs and in most instances, the company’s site involvement isminimal.
In estimating its liability, the company has not assumed it will bear the entire cost of remediation of anysite to the exclusion of other PRPs who may be jointly and severally liable. The ability of other PRPs toparticipate has been taken into account, based generally on the parties’ financial condition and probablecontributions on a per site basis. Additional lawsuits and claims involving environmental matters arelikely to arise from time to time in the future.
Although uncertainties regarding environmental technology, U.S. federal and state laws and regulationsand individual site information make estimating the liability difficult, management believes that the totalliability for the cost of remediation and environmental lawsuits and claims will not have a material effecton the financial condition, results of operations, liquidity or cash flows of the company for any year. Itshould be noted that when the company estimates its liability for environmental matters, such estimatesare based on current technologies, and the company does not discount its liability or assume anyinsurance recoveries.
New Accounting StandardsThe FASB issued Statement of Financial Accounting Standards (“SFAS”) No. 140, “Accounting forTransfers and Servicing of Financial Assets and Extinguishments of Liabilities”, which became effectivefor the company on March 31, 2001. The statement revises the accounting standards for securitizations

18
and other transfers of financial assets and collateral and requires certain disclosures. This statement iseffective for transfers and servicing of financial assets and extinguishments of liabilities occurring afterMarch 31, 2001. Adoption of SFAS No. 140 had no effect on the company’s consolidated financialposition, consolidated results of operations, or liquidity.
For all business combinations subsequent to June 30, 2001, the company applied the provisions ofSFAS No. 141 “Business Combinations” and SFAS No. 142 “Goodwill and Other Intangible Assets.”Under the provisions of these standards, goodwill and intangible assets deemed to have indefinite livesare no longer subject to amortization, while all other intangible assets are to be amortized over theirestimated useful lives. Amortization expense related to goodwill was $135.1 million in 2001, $135.3million in 2000 and $102.3 million in 1999.
Additional provisions of SFAS No. 141 and No. 142, including annual impairment testing for goodwill andintangible assets, became effective for the company on January 1, 2002. The company is currentlydetermining the impact of adopting these provisions under the transition provisions of the statements,and anticipates that it may record an impairment charge.
In June 2001, SFAS No. 143, “Accounting for Asset Retirement Obligations” was issued. The standardrequires that legal obligations associated with the retirement of tangible long-lived assets be recorded atfair value when incurred and is effective January 1, 2003, for the company. The company is currentlyreviewing the provisions of SFAS No. 143 to determine the standard’s impact upon adoption.
In August 2001, SFAS No. 144, “Accounting for the Impairment or Disposal of Long-Lived Assets” wasissued, which provides guidance on the accounting for the impairment or disposal of long-lived assetsand was adopted January 1, 2002, by the company. Adoption of SFAS No. 144 did not have a materialeffect on the company’s consolidated financial position or results of operations.
The company adopted SFAS No. 133 “Accounting for Derivative Instruments and Hedging Activities”and its amendments as of January 1, 2001. The statement requires all derivatives to be recognized asassets or liabilities on the balance sheet and measured at fair value. Changes in the fair value ofderivatives will be recognized in earnings or other comprehensive income, depending on thedesignated purpose of the derivative. The company recorded approximately $1.2 million after taxrepresenting the cumulative effect adjustment as a decrease to accumulated other comprehensiveincome at January 1, 2001.
Forward-looking StatementsThis annual report contains not only historical information, but also forward-looking statements regardingexpectations for future company performance. Forward-looking statements involve risk and uncertainty.See the company’s 2000 Annual Report on Form 10-K for a discussion of factors which could causefuture results to differ from current expectations.

19
Consolidated Statement of IncomeIn millions except per share amounts
For the years ended December 31 2001 2000 1999Net sales $ 9,682.0 $ 9,597.6 $ 7,819.0Cost of goods sold 7,611.5 7,141.4 5,673.2Selling and administrative expenses 1,454.2 1,279.6 1,066.1Restructuring charges 93.1 87.2 —Operating income 523.2 1,089.4 1,079.7Interest expense (253.0) (255.3) (183.5)Other income (expense), net (6.8) 35.8 3.1Minority interests (20.1) (39.3) (29.1)Earnings before income taxes 243.3 830.6 870.2(Benefit)/provision for income taxes (2.9) 284.4 307.1Earnings from continuing operations 246.2 546.2 563.1Discontinued operations (net of tax) — 123.2 28.0Net earnings $ 246.2 $ 669.4 $ 591.1Basic earnings per share:
Continuing operations $ 1.49 $ 3.39 $ 3.44Discontinued operations — 0.76 0.17
$ 1.49 $ 4.15 $ 3.61Diluted earnings per share:
Continuing operations $ 1.48 $ 3.36 $ 3.40Discontinued operations — 0.76 0.17
$ 1.48 $ 4.12 $ 3.57See accompanying Notes to Consolidated Financial Statements.
20
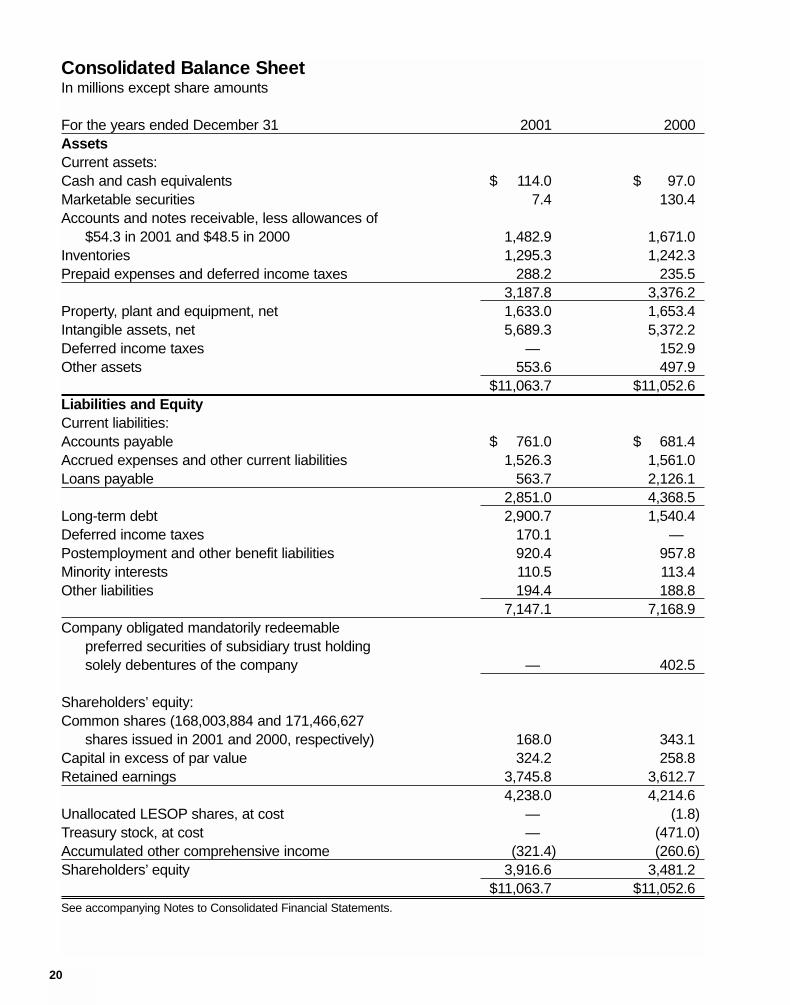
Consolidated Balance SheetIn millions except share amounts
For the years ended December 31 2001 2000AssetsCurrent assets:Cash and cash equivalents $ 114.0 $ 97.0Marketable securities 7.4 130.4Accounts and notes receivable, less allowances of
$54.3 in 2001 and $48.5 in 2000 1,482.9 1,671.0Inventories 1,295.3 1,242.3Prepaid expenses and deferred income taxes 288.2 235.5
3,187.8 3,376.2Property, plant and equipment, net 1,633.0 1,653.4Intangible assets, net 5,689.3 5,372.2Deferred income taxes — 152.9Other assets 553.6 497.9
$11,063.7 $11,052.6Liabilities and EquityCurrent liabilities:Accounts payable $ 761.0 $ 681.4Accrued expenses and other current liabilities 1,526.3 1,561.0Loans payable 563.7 2,126.1
2,851.0 4,368.5Long-term debt 2,900.7 1,540.4Deferred income taxes 170.1 —Postemployment and other benefit liabilities 920.4 957.8Minority interests 110.5 113.4Other liabilities 194.4 188.8
7,147.1 7,168.9Company obligated mandatorily redeemable
preferred securities of subsidiary trust holdingsolely debentures of the company — 402.5
Shareholders’ equity:Common shares (168,003,884 and 171,466,627
shares issued in 2001 and 2000, respectively) 168.0 343.1Capital in excess of par value 324.2 258.8Retained earnings 3,745.8 3,612.7
4,238.0 4,214.6Unallocated LESOP shares, at cost — (1.8)Treasury stock, at cost — (471.0)Accumulated other comprehensive income (321.4) (260.6)Shareholders’ equity 3,916.6 3,481.2
$11,063.7 $11,052.6See accompanying Notes to Consolidated Financial Statements.
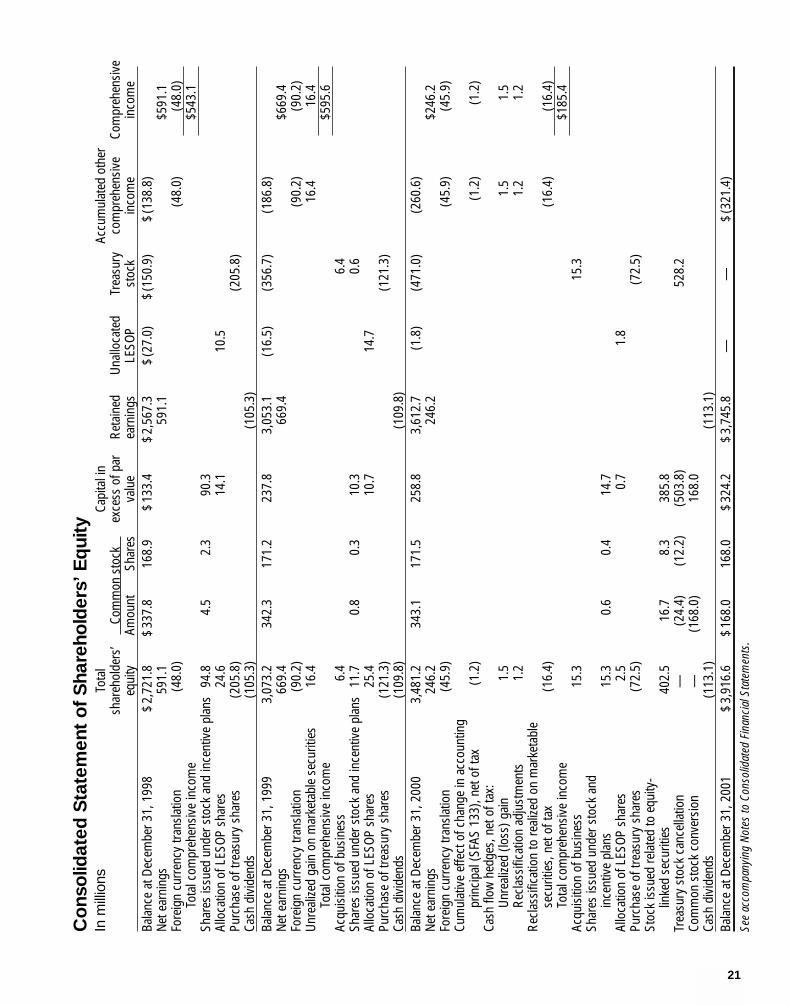
21
Con
solid
ated
Sta
tem
ent
of S
hare
hold
ers’
Equ
ityIn
mill
ions
Tota
lCa
pita
l in
Accu
mul
ated
oth
ersh
areh
olde
rs’
Co
mm
on s
tock
ex
cess
of p
arRe
tain
edUn
allo
cate
dTr
easu
ryco
mpr
ehen
sive
Com
preh
ensi
veeq
uity
Amou
nt
S
hare
sva
lue
earn
ings
LESO
Pst
ock
inco
me
inco
me
Bala
nce
at D
ecem
ber 3
1, 1
998
$2,
721.
8$
337.
816
8.9
$13
3.4
$2,
567.
3$
(27.
0)$
(150
.9)
$(1
38.8
)Ne
t ear
ning
s 59
1.1
591.
1$5
91.1
Fore
ign
curr
ency
tran
slat
ion
(48.
0)(4
8.0)
(48.
0)To
tal c
ompr
ehen
sive
inco
me
$543
.1Sh
ares
issu
ed u
nder
sto
ck a
nd in
cent
ive
plan
s94
.84.
52.
390
.3Al
loca
tion
of L
ESOP
sha
res
24.6
14.1
10.5
Purc
hase
of t
reas
ury
shar
es(2
05.8
)(2
05.8
)Ca
sh d
ivid
ends
(105
.3)
(105
.3)
Bala
nce
at D
ecem
ber 3
1, 1
999
3,07
3.2
342.
317
1.2
237.
83,
053.
1(1
6.5)
(356
.7)
(186
.8)
Net e
arni
ngs
669.
466
9.4
$669
.4Fo
reig
n cu
rren
cy tr
ansl
atio
n(9
0.2)
(90.
2)(9
0.2)
Unre
alize
d ga
in o
n m
arke
tabl
e se
curit
ies
16.4
16.4
16.4
Tota
l com
preh
ensi
ve in
com
e$5
95.6
Acqu
isiti
on o
f bus
ines
s6.
46.
4Sh
ares
issu
ed u
nder
sto
ck a
nd in
cent
ive
plan
s11
.70.
80.
310
.30.
6Al
loca
tion
of L
ESOP
sha
res
25.4
10.7
14.7
Purc
hase
of t
reas
ury
shar
es(1
21.3
)(1
21.3
)Ca
sh d
ivid
ends
(109
.8)
(109
.8)
Bala
nce
at D
ecem
ber 3
1, 2
000
3,48
1.2
343.
117
1.5
258.
83,
612.
7(1
.8)
(471
.0)
(260
.6)
Net e
arni
ngs
246.
224
6.2
$246
.2Fo
reig
n cu
rren
cy tr
ansl
atio
n(4
5.9)
(45.
9)(4
5.9)
Cum
ulat
ive
effe
ct o
f cha
nge
in a
ccou
ntin
g pr
inci
pal (
SFAS
133
), ne
t of t
ax(1
.2)
(1.2
)(1
.2)
Cash
flow
hed
ges,
net
of t
ax:
Unre
alize
d (lo
ss) g
ain
1.5
1.5
1.5
Recl
assi
ficat
ion
adju
stm
ents
1.2
1.2
1.2
Recl
assi
ficat
ion
to re
alize
d on
mar
keta
ble
secu
ritie
s, n
et o
f tax
(1
6.4)
(16.
4)(1
6.4)
Tota
l com
preh
ensi
ve in
com
e$1
85.4
Acqu
isiti
on o
f bus
ines
s15
.315
.3Sh
ares
issu
ed u
nder
sto
ck a
ndin
cent
ive
plan
s15
.30.
60.
414
.7Al
loca
tion
of L
ESOP
sha
res
2.5
0.7
1.8
Purc
hase
of t
reas
ury
shar
es(7
2.5)
(72.
5)St
ock
issu
ed re
late
d to
equ
ity-
linke
d se
curit
ies
402.
516
.78.
338
5.8
Trea
sury
sto
ck c
ance
llatio
n—
(24.
4)(1
2.2)
(503
.8)
528.
2Co
mm
on s
tock
con
vers
ion
—(1
68.0
)16
8.0
Cash
div
iden
ds(1
13.1
)(1
13.1
)Ba
lanc
e at
Dec
embe
r 31,
200
1$
3,91
6.6
$16
8.0
168.
0$
324.
2$
3,74
5.8
——
$(3
21.4
)Se
e ac
com
pany
ing
Note
s to
Con
solid
ated
Fin
anci
al S
tate
men
ts.

22
Consolidated Statement of Cash FlowsIn millions
For the years ended December 31 2001 2000 1999Cash flows from operating activities:
Income from continuing operations $ 246.2 $ 546.2 $ 563.1Adjustments to arrive at net cash provided by operating activities:
Restructure charges 93.1 87.2 —Depreciation and amortization 362.5 327.1 272.4Gain on sale of businesses — (42.9) (14.6)Loss/(gain) on sale of property, plant and equipment 1.6 (5.1) (3.4)Minority interests, net of dividends (3.4) 4.9 (0.2)Equity earnings/losses, net of dividends (1.5) 0.8 (28.5)Deferred income taxes 23.4 13.6 62.2Other items 10.6 35.7 40.9
Changes in assets and liabilities(Increase)/decrease in:
Accounts and notes receivable 229.4 (31.6) (57.7)Inventories (24.1) (160.2) 56.7Other current and noncurrent assets (172.9) 3.1 12.8
Increase/(decrease) in:Accounts payable and accruals 40.0 50.3 (55.6)Other current and noncurrent liabilities (203.3) (92.1) 6.6
Net cash provided by operating activities 601.6 737.0 854.7 Cash flows from investing activities:
Capital expenditures (200.6) (201.3) (190.5)Proceeds from sales of property, plant and equipment 41.7 28.5 30.4Acquisitions, net of cash * (158.3) (2,288.0) (161.2)Proceeds from business dispositions 17.5 977.3 84.8Decrease/(increase) in marketable securities 97.2 (6.3) 1.5Cash provided by/(invested in) or advances from/(to)
equity companies 15.7 12.2 (2.0)Net cash used in investing activities (186.8) (1,477.6) (237.0)
Cash flows from financing activities:(Decrease)/increase in short-term borrowings (1,026.1) 950.2 (36.8)Proceeds from long-term debt 1,493.8 3.1 21.5Payments of long-term debt (681.8) (80.9) (252.2)Net change in debt (214.1) 872.4 (267.5)Proceeds from exercise of stock options 9.7 8.3 70.2Dividends paid (113.1) (109.8) (105.3)Purchase of treasury stock (72.5) (121.3) (205.8)Other — — 63.3
Net cash (used in)/provided by financing activities (390.0) 649.6 (445.1)Net cash (used in)/provided by discontinued operations — (22.1) 14.6
Effect of exchange rate changes on cash and cash equivalents (7.8) (12.8) (7.8)Net increase/(decrease) in cash and cash equivalents 17.0 (125.9) 179.4Cash and cash equivalents-beginning of year 97.0 222.9 43.5
Cash and cash equivalents-end of year $ 114.0 $ 97.0 $ 222.9*Acquisitions:
Working capital, other than cash $ (5.9) $ (376.8) $ (61.0)Property, plant and equipment (41.6) (487.2) (13.0)Intangibles and other assets (126.6) (1,806.2) (101.4)Long-term debt and other liabilities 0.5 375.7 14.2Treasury stock issued 15.3 6.5 —
Net cash used to acquire businesses $ (158.3) $ (2,288.0) $ (161.2)Cash paid during the year for:
Interest, net of amounts capitalized $ 293.4 $ 346.8 $ 230.4Income taxes 154.6 175.7 217.7
In 1999, the company acquired the remaining 49% interest in Ingersoll-Dresser Pump Company in a noncash transaction by issuing a note for $377.0 million.
See accompanying Notes to Consolidated Financial Statements.

23
Notes to Consolidated Financial Statements
Note 1-Summary of Significant Accounting PoliciesA summary of significant accounting policies used in the preparation of the accompanying financialstatements follows:
Basis of Presentation: The consolidated financial statements of Ingersoll-Rand Company Limited, aBermuda company (IR-Limited or the company), have been prepared in accordance with generallyaccepted accounting principles in the United States. IR-Limited is the successor to Ingersoll-RandCompany, a New Jersey corporation (IR-New Jersey), following a corporate reorganization (thereorganization) that became effective on December 31, 2001. The reorganization was accomplishedthrough a merger of a newly-formed merger subsidiary into IR-New Jersey. IR-New Jersey, thesurviving company, continues to exist as an indirect, wholly-owned subsidiary of IR-Limited. IR-Limitedand its subsidiaries continue to conduct the businesses previously conducted by IR-New Jersey andits subsidiaries. The reorganization has been accounted for as a reorganization of entities undercommon control and accordingly it did not result in any changes to the consolidated amounts of assets,liabilities and shareholders’ equity.
Principles of Consolidation: The consolidated financial statements include all wholly owned andmajority-owned subsidiaries. Intercompany transactions and balances have been eliminated. Partiallyowned equity affiliates are accounted for under the equity method. In conformity with generallyaccepted accounting principles, management has used estimates and assumptions that affect thereported amounts of assets, liabilities, revenues and expenses, and the disclosure of contingent assetsand liabilities. Significant estimates include accounting for doubtful accounts, amortization anddepreciation, warranty, sales allowances, taxes, environmental, product liability and othercontingencies. Actual results could differ from those estimates.
Reclassifications: Reclassifications were made to prior year amounts to conform with the 2001presentation. The accompanying consolidated financial statements restate the previously presentedamounts to report Dresser-Rand Company (Dresser-Rand) on a fully consolidated basis sinceacquisition. Previously, the company reported the results and net assets of Dresser-Rand as assetsheld for sale.
The company adopted Emerging Issues Task Force Issue No. 00-25 “Vendor Income StatementCharacterization of Consideration Paid to a Reseller of the Vendor’s Products” in the fourth quarter of2001. Upon adoption, financial statements for all periods presented were restated to comply with theincome statement classification of reseller finance costs and cooperative advertising programs, whichresulted in decreases to net sales of $28.6 million, $24.0 million and $23.6 million, decreases in costof goods sold of $13.1 million, $15.8 million and $17.7 million, increases in selling and administrativeexpenses of $18.5 million, $21.3 million and $13.7 million, and decreases in interest expense of $34.0million, $29.5 million and $19.6 million in 2001, 2000 and 1999, respectively.
Cash Equivalents: The company considers all highly liquid investments, consisting primarily of timedeposits and commercial paper with maturities of three months or less when purchased, to be cashequivalents. Cash equivalents were $0.5 million and $1.0 million at December 31, 2001 and 2000,respectively.
24
Inventories: Inventories are stated at cost, which is not in excess of market. Most U.S. manufacturedinventories, excluding the Climate Control and Dresser-Rand Segments, are valued on the last-in,first-out (LIFO) method. All other inventories are valued using the first-in, first-out (FIFO) method.
Property, Plant and Equipment: Property, plant and equipment are stated at cost, less accumulateddepreciation. The company principally uses accelerated depreciation methods for assets placed inservice prior to December 31, 1994. Assets acquired subsequent to that date are depreciated usingthe straight-line method over their estimated useful lives. At December 31, 2001 and 2000, gross landand buildings totaled $761.7 million and $738.9 million, respectively, while gross machinery andequipment totaled $1,887.2 million and $1,827.7 million, respectively. Accumulated depreciation atDecember 31, 2001 and 2000 was $1,015.9 million and $913.2 million, respectively.
Intangible Assets: Goodwill, net, was $4.8 billion and $5.3 billion at December 31, 2001 and 2000,respectively. Accumulated amortization amounted to $554.4 million and $448.4 million at December31, 2001 and 2000, respectively. In accordance with Statement of Financial Accounting Standards(SFAS) No. 142, “Goodwill and Other Intangible Assets,” goodwill associated with acquisitionsconsummated after June 30, 2001 is not being amortized. All other goodwill has been amortized ona straight-line basis over periods not to exceed 40 years through December 31, 2001. Amortizationexpense for goodwill for 2001, 2000 and 1999 was $135.1 million, $135.3 million and $102.3 million,respectively.
Other intangible assets, net, were $877.7 million and $104.2 million at December 31, 2001 and 2000,respectively. These amounts include capitalized software, debt issuance costs, and costs allocated topatents, trademarks and other specifically identifiable assets arising from acquisitions, which arebeing amortized on a straight-line basis over their estimated useful lives. At December 31, 2001 and2000, accumulated amortization of other intangibles amounted to $86.0 million and $43.0 million,respectively.
During 2001, the company reclassified certain amounts from goodwill to other intangible assets as aresult of final valuations on the 2000 acquisitions and increased goodwill associated with deferred taxliabilities. The carrying value of goodwill and other intangibles is reviewed if the facts andcircumstances, such as significant decline in sales, earnings or cash flows or material adversechanges in the business climate, suggest that it may be impaired. If this review indicates that goodwillwill not be recoverable as determined based on the estimated undiscounted cash flows of the entityacquired, impairment is measured by comparing the carrying value of goodwill to fair value. Fair valueis determined based on quoted market values, discounted cash flows or appraisals.
Income Taxes: Deferred taxes are provided on temporary differences between assets and liabilitiesfor financial reporting and tax purposes as measured by enacted tax rates expected to apply whentemporary differences are settled or realized. A valuation allowance is established for deferred taxassets for which realization is not likely.
Environmental Costs: Environmental expenditures relating to current operations are expensed orcapitalized as appropriate. Expenditures relating to existing conditions caused by past operations,which do not contribute to current or future revenues, are expensed. Costs to prepare environmentalsite evaluations and feasibility studies are accrued when the company commits to perform them.Liabilities for remediation costs are recorded when they are probable and reasonably estimable,
25
generally no later than the completion of feasibility studies or the company’s commitment to a plan ofaction. The assessment of this liability, which is calculated based on existing technology, does notreflect any offset for possible recoveries from insurance companies and is not discounted.
Revenue Recognition: Revenues are recognized on sales of product at the time the goods areshipped and title has passed to the customer or when services are performed. Provisions fordiscounts and rebates to customers and other adjustments are provided for at the time of sale as areduction of revenue.
Research and Development Costs: Research and development expenditures, including qualifyingengineering costs, are expensed when incurred and amounted to $215.4 million in 2001, $198.2million in 2000 and $186.2 million in 1999.
Comprehensive Income: Comprehensive income includes net income, foreign currency translationadjustments, amounts relating to cash flow hedges, and unrealized holding gains and losses onmarketable securities.
Foreign Currency: Assets and liabilities of non-U.S. entities, where the local currency is thefunctional currency, have been translated at year-end exchange rates, and income and expenseshave been translated using weighted average-for-the-year exchange rates. Adjustments resultingfrom translation have been recorded in accumulated other comprehensive income and are includedin net earnings only upon sale or liquidation of the underlying foreign investment.
For non-U.S. entities where the U.S. dollar is the functional currency, inventory and property balancesand related income statement accounts have been translated using historical exchange rates, andresulting gains and losses have been credited or charged to net earnings.
Foreign currency transactions and translations recorded in the income statement decreased netearnings by $2.3 million and $7.6 million in 2001 and 2000 respectively, and increased net earningsby $2.5 million in 1999. Accumulated other comprehensive income decreased in 2001 and 2000 by$60.8 million and $73.8 million, respectively, primarily due to foreign currency equity adjustmentsrelated to translation.
Earnings Per Share: Basic earnings per share is based on the weighted average number of commonshares outstanding. Diluted earnings per share is based on the weighted average number of commonshares outstanding as well as potentially dilutive common shares, which in the company’s casecomprise shares issuable under stock benefit plans. The weighted average number of commonshares outstanding for basic earnings per share calculations were 165.1 million, 161.2 million and163.6 million for 2001, 2000 and 1999, respectively. For diluted earnings per share purposes, thesebalances increased by 1.2 million, 1.2 million and 2.1 million shares for 2001, 2000 and 1999,respectively. At December 31, 2001, 2000 and 1999, 5.6 million, 6.5 million and 0.2 million shares,respectively, were excluded because the effect would be anti-dilutive.
Stock-based Compensation: The company continues to apply the principles of APB No. 25“Accounting for Stock Issued to Employees,” and has provided pro forma fair value disclosures inNote 14.

26
New Accounting Standards: In August 2001, SFAS No. 144, “Accounting for the Impairment orDisposal of Long-Lived Assets” was issued, which provides guidance on the accounting for theimpairment or disposal of long-lived assets and was adopted January 1, 2002, by the company.Adoption of SFAS No. 144 did not have a material effect on the company’s consolidated financialposition or results of operations.
In June 2001, SFAS No. 143, “Accounting for Asset Retirement Obligations” was issued. The standardrequires that legal obligations associated with the retirement of tangible long-lived assets be recordedat fair value when incurred and is effective January 1, 2003 for the company. The company is currentlyreviewing the provisions of SFAS No. 143 to determine the standard’s impact upon adoption.
Also in June 2001, the Financial Accounting Standards Board (FASB) issued SFAS No. 141,“Business Combinations,” and SFAS No. 142, “Goodwill and Other Intangible Assets.” Therequirements and effects of these pronouncements are discussed in Note 4.
In September 2000, the FASB issued SFAS 140, “Accounting for Transfers and Servicing of FinancialAssets and Extinguishments of Liabilities.” This statement is effective for transfers and services offinancial assets occurring after March 31, 2001, and is discussed in Note 10.
The company adopted SFAS No. 133 “Accounting for Derivative Instruments and Hedging Activities”and its amendments as of January 1, 2001. The requirements and effects of such adoption arediscussed in Note 7.
Note 2-RestructuringDuring 2001, the company continued a restructuring program that was initiated in 2000, which includessuch actions as employee severance, plant rationalizations, organizational realignments consistentwith the company’s market-based structure and the consolidation of back-office processes. In responseto continued weakness in its major end markets, the company initiated a second phase of restructuringin the fourth quarter of 2001, which is focused on reducing general and administrative expense and isexpected to be completed by the end of 2002. The programs have resulted in the closure of 20 plantsand a workforce reduction of more than 3,900 employees. Charges for restructuring for full-year 2001totaled $93.1 million.
The company recorded pretax restructuring charges by business segment for the year endedDecember 31, as follows:
In millions 2001 2000Climate Control $ 31.7 $ 3.6Industrial Solutions
Air and Productivity Solutions 16.2 16.5Dresser-Rand 2.1 11.0Engineered Solutions 19.6 11.5
Infrastructure 5.7 11.4Security and Safety 3.0 15.1Corporate 14.8 18.1Total $ 93.1 $ 87.2
27
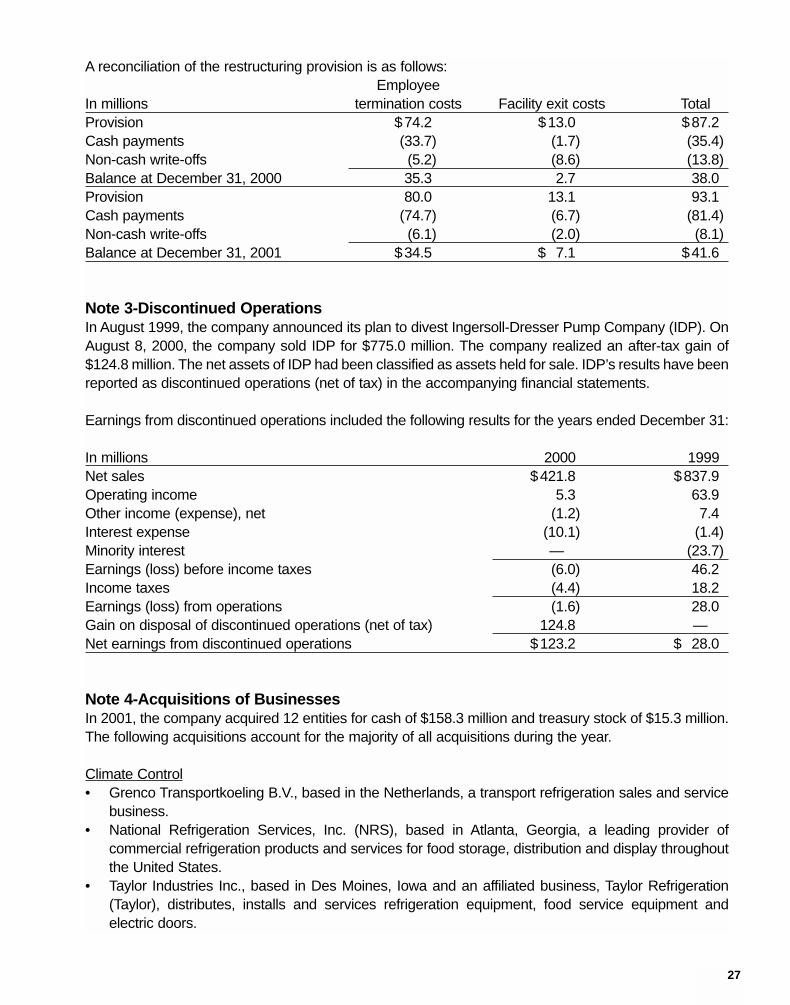
A reconciliation of the restructuring provision is as follows:Employee
In millions termination costs Facility exit costs TotalProvision $74.2 $13.0 $87.2Cash payments (33.7) (1.7) (35.4)Non-cash write-offs (5.2) (8.6) (13.8)Balance at December 31, 2000 35.3 2.7 38.0Provision 80.0 13.1 93.1Cash payments (74.7) (6.7) (81.4)Non-cash write-offs (6.1) (2.0) (8.1)Balance at December 31, 2001 $34.5 $ 7.1 $41.6
Note 3-Discontinued OperationsIn August 1999, the company announced its plan to divest Ingersoll-Dresser Pump Company (IDP). OnAugust 8, 2000, the company sold IDP for $775.0 million. The company realized an after-tax gain of$124.8 million. The net assets of IDP had been classified as assets held for sale. IDP’s results have beenreported as discontinued operations (net of tax) in the accompanying financial statements.
Earnings from discontinued operations included the following results for the years ended December 31:
In millions 2000 1999Net sales $421.8 $837.9Operating income 5.3 63.9Other income (expense), net (1.2) 7.4Interest expense (10.1) (1.4)Minority interest — (23.7)Earnings (loss) before income taxes (6.0) 46.2Income taxes (4.4) 18.2Earnings (loss) from operations (1.6) 28.0Gain on disposal of discontinued operations (net of tax) 124.8 —Net earnings from discontinued operations $123.2 $ 28.0
Note 4-Acquisitions of BusinessesIn 2001, the company acquired 12 entities for cash of $158.3 million and treasury stock of $15.3 million.The following acquisitions account for the majority of all acquisitions during the year.
Climate Control• Grenco Transportkoeling B.V., based in the Netherlands, a transport refrigeration sales and service
business.• National Refrigeration Services, Inc. (NRS), based in Atlanta, Georgia, a leading provider of
commercial refrigeration products and services for food storage, distribution and display throughoutthe United States.
• Taylor Industries Inc., based in Des Moines, Iowa and an affiliated business, Taylor Refrigeration(Taylor), distributes, installs and services refrigeration equipment, food service equipment andelectric doors.
28
Engineered Solutions• Nadella S.A., based in France, supplies precision needle bearings for automotive and industrial
applications. Nadella was previously 50% owned by the company.
Infrastructure• Superstav spol. s.r.o., based in the Czech Republic, and Earth Force America, Inc., based in South
Carolina, both of which are manufacturers of compact tractor loader backhoes.
Security and Safety• Kryptonite Corporation, based in Massachusetts, a leading manufacturer of locks for recreational
and portable security applications.• ITO Emniyet Kilit Sistemleri A., based in Turkey, a leading manufacturer and distributor of locks,
cylinders and keys.
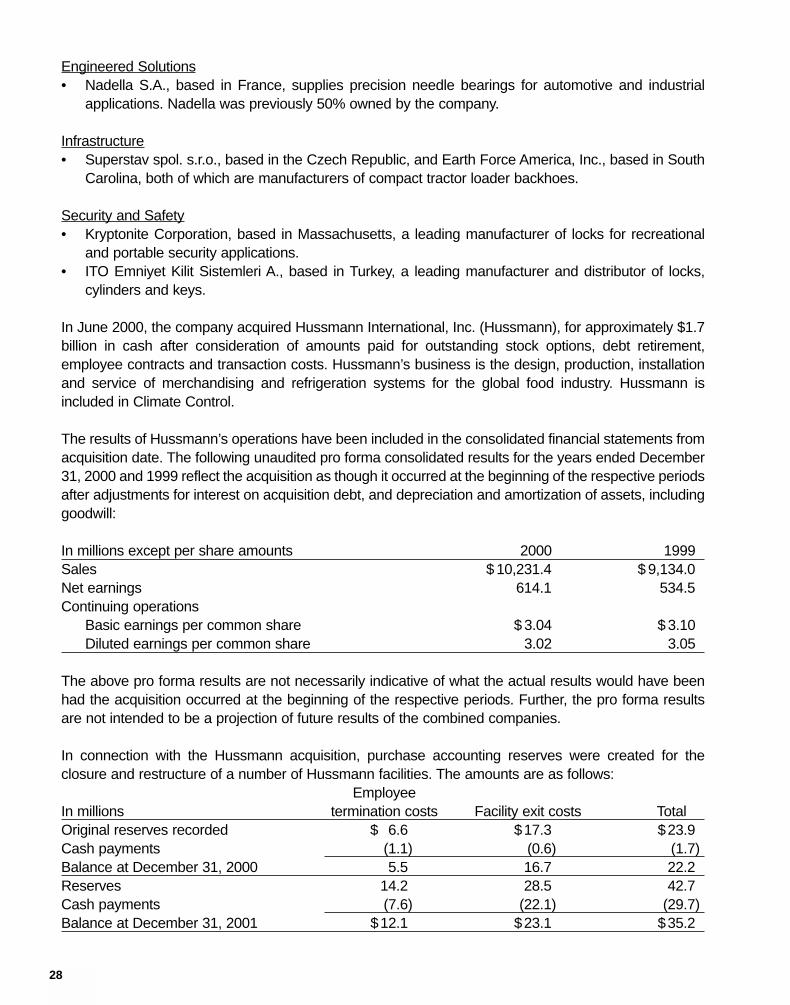
In June 2000, the company acquired Hussmann International, Inc. (Hussmann), for approximately $1.7billion in cash after consideration of amounts paid for outstanding stock options, debt retirement,employee contracts and transaction costs. Hussmann’s business is the design, production, installationand service of merchandising and refrigeration systems for the global food industry. Hussmann isincluded in Climate Control.
The results of Hussmann’s operations have been included in the consolidated financial statements fromacquisition date. The following unaudited pro forma consolidated results for the years ended December31, 2000 and 1999 reflect the acquisition as though it occurred at the beginning of the respective periodsafter adjustments for interest on acquisition debt, and depreciation and amortization of assets, includinggoodwill:
In millions except per share amounts 2000 1999Sales $ 10,231.4 $ 9,134.0Net earnings 614.1 534.5Continuing operations
Basic earnings per common share $ 3.04 $ 3.10Diluted earnings per common share 3.02 3.05
The above pro forma results are not necessarily indicative of what the actual results would have beenhad the acquisition occurred at the beginning of the respective periods. Further, the pro forma resultsare not intended to be a projection of future results of the combined companies.
In connection with the Hussmann acquisition, purchase accounting reserves were created for theclosure and restructure of a number of Hussmann facilities. The amounts are as follows:
Employee In millions termination costs Facility exit costs TotalOriginal reserves recorded $ 6.6 $17.3 $23.9Cash payments (1.1) (0.6) (1.7)Balance at December 31, 2000 5.5 16.7 22.2Reserves 14.2 28.5 42.7Cash payments (7.6) (22.1) (29.7)Balance at December 31, 2001 $12.1 $23.1 $35.2
29
In February 2000, the company completed the purchase of the 51% of Dresser-Rand not previouslyowned by acquiring the joint venture partner’s share for a net purchase price of approximately $543.0million in cash.
For all business combinations subsequent to June 30, 2001, the company applied the provisions ofSFAS No. 141 “Business Combinations” and SFAS No. 142 “Goodwill and Other Intangible Assets.”Under the provisions of these standards, goodwill and intangible assets deemed to have indefinite livesare no longer subject to amortization, while all other intangible assets are to be amortized over theirestimated useful lives. Amortization related to goodwill was $135.1 million in 2001, $135.3 million in 2000and $102.3 million in 1999.
Additional provisions of SFAS No. 141 and No. 142, including annual impairment testing for goodwill andintangible assets, became effective for the company on January 1, 2002. The company is currentlydetermining the impact of adopting these provisions under the transition provisions of the statements,and anticipates that it may record an impairment charge.
Note 5-DispositionsDuring 2000, the company sold the Compression Services business of Dresser-Rand for a gain of $50.4million, as well as the Corona Clipper business for approximately $43.0 million, which approximatedbook value. The company also sold its interests in three joint ventures relating to the manufacture of fullsteering-column assemblies for approximately $37.0 million in cash. In August 2000, the company soldIDP for $775.0 million (Note 3).
During 1999, the company received proceeds of $47.0 million, which approximated book value, onthe sale of a portion of the Harrow assets. In December 1999, the company also sold certain netassets of the Automation Division of the Air and Productivity Solutions Segment. The transactionresulted in a net gain of approximately $4.4 million. The company also made several minordispositions during 1999.
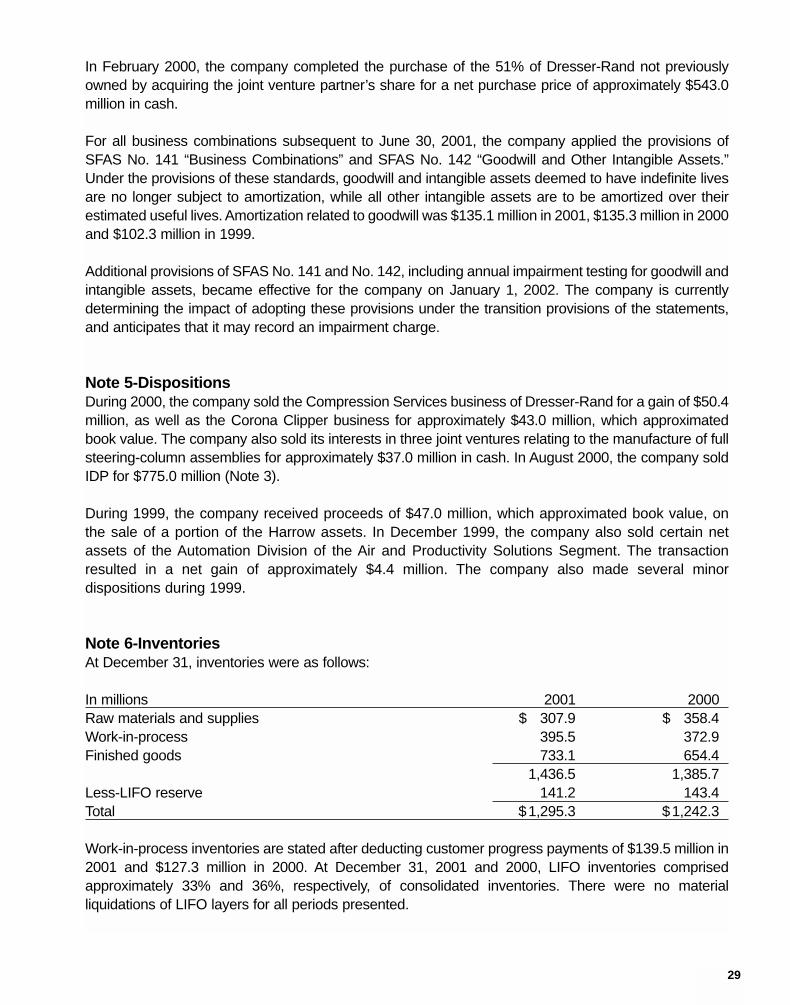
Note 6-InventoriesAt December 31, inventories were as follows:
In millions 2001 2000Raw materials and supplies $ 307.9 $ 358.4Work-in-process 395.5 372.9Finished goods 733.1 654.4
1,436.5 1,385.7Less-LIFO reserve 141.2 143.4Total $1,295.3 $1,242.3
Work-in-process inventories are stated after deducting customer progress payments of $139.5 million in2001 and $127.3 million in 2000. At December 31, 2001 and 2000, LIFO inventories comprisedapproximately 33% and 36%, respectively, of consolidated inventories. There were no materialliquidations of LIFO layers for all periods presented.
30
Note 7-Financial InstrumentsThe company, as a large multinational company, maintains significant operations in countries other thanthe United States. As a result of these global activities, the company is exposed to changes in foreigncurrency exchange rates, which affect the results of operations and financial condition. The companymanages exposure to changes in foreign currency exchange rates through its normal operating andfinancing activities, as well as through the use of financial instruments. Generally, the only financialinstruments the company utilizes are forward exchange contracts and options.
The purpose of the company’s currency hedging activities is to mitigate the impact of changes in foreigncurrency exchange rates. The company attempts to hedge transaction exposures through naturaloffsets. To the extent that this is not practicable, major exposure areas considered for hedging includeforeign currency denominated receivables and payables, intercompany loans, firm committedtransactions, and forecasted sales and purchases. The following table summarizes by major currencythe contractual amounts of the company’s forward contracts in U.S. dollars. Foreign currency amountsare translated at year-end rates at the respective reporting date. The “buy” amounts represent the U.S.equivalent of commitments to purchase foreign currencies, and the “sell” amounts represent the U.S.equivalent of commitments to sell foreign currencies. Some of the forward contracts involve theexchange of two foreign currencies according to local needs in foreign subsidiaries.
At December 31, the contractual amounts were:In millions 2001 2000
Buy Sell Buy Sell British pounds $ 14.0 $ 8.8 $ 59.5 $ 4.6Canadian dollars 137.6 9.6 106.8 33.1Euro and euro-linked currencies 23.0 185.6 75.8 157.7Japanese yen 21.6 27.3 27.6 0.3Other 12.2 18.7 7.4 27.3Total $208.4 $250.0 $277.1 $223.0
Starting in late 1999, the company began purchasing on a limited basis, commodity contracts to hedgethe costs of metals used in its products. Gains and losses on the derivatives are included in cost of salesin the same period as the hedged transaction.
The following table summarized commodity contracts by maturity:Commodity contracts 2002 2003 TotalAluminum
Contract amount in millions $17.7 — $17.7Contract quantity (in 000 lbs.) 28.9 — 28.9
CopperContract amount in millions $ 8.3 — $ 8.3Contract quantity (in 000 lbs.) 10.9 — 10.9
ZincContract amount in millions — $2.1 $ 2.1Contract quantity (in 000 lbs.) — 5.5 5.5
TotalContract amount in millions $26.0 $2.1 $28.1Contract quantity (in 000 lbs.) 39.8 5.5 45.3

31
SFAS 133, “Accounting for Derivative Instruments and Hedging Activities,” and its amendments, becameeffective for the company on January 1, 2001. The statement requires all derivatives to be recognizedas assets or liabilities on the balance sheet and measured at fair value. Changes in the fair value ofderivatives will be recognized in earnings or other comprehensive income, depending on the designatedpurpose of the derivative. If a derivative qualifies for cash flow hedge accounting the effective portion ofchanges in fair value is recorded temporarily in other comprehensive income, then recognized inearnings along with the related effects of the hedged items. If a derivative qualifies for fair value hedgeaccounting, the changes in fair value of the derivative and the hedged item are recognized currently inearnings. There was no ineffective portion of hedges reported in earnings in 2001.
The $1.2 million, after tax, recorded in equity at January 1, 2001, upon the adoption of these newstandards, was reclassified to earnings during the year. Of the $1.5 million recorded in equity atDecember 31, 2001, $0.3 million is expected to be reclassified to earnings over the twelve monthperiod ending December 31, 2002, while $1.2 million, related to an interest rate swap used as a cashflow hedge of the forecasted issuance of debt that occurred in the second quarter, will be reclassifiedto earnings over the next four years. The actual amounts that will be reclassified to earnings over thenext twelve months will vary from this amount as a result of changes in market conditions. No amountswere reclassified to earnings during the year in connection with forecasted transactions that were nolonger considered probable of occurring.
At December 31, 2001, the maximum term of derivative instruments that hedge forecasted transactions,for foreign currency hedges, was 12 months. At December 31, 2001, the maximum term of derivativeinstruments that hedge forecasted transactions, for commodity hedges, was 24 months.
Derivatives not designated as hedges primarily consist of options and forward contracts. Although theseinstruments are effective as hedges from an economic perspective, they do not qualify for hedgeaccounting under SFAS No. 133, as amended.
The counterparties to the company’s forward contracts consist of a number of major internationalfinancial institutions. The company could be exposed to loss in the event of nonperformance by thecounterparties. However, credit ratings and concentration of risk of these financial institutions aremonitored on a continuing basis and present no significant credit risk to the company.
The carrying value of cash and cash equivalents, marketable securities, accounts receivable, short-termborrowings and accounts payable are a reasonable estimate of their fair value due to the short-termnature of these instruments.

32
The following table summarizes the estimated fair value of the company’s remaining financialinstruments at December 31:
In millions 2001 2000Long-term debt:Carrying value $ 2,900.7 $ 1,540.4Estimated fair value 2,996.7 1,537.4Currency contracts:Contract (notional) amounts:
Buy contracts $ 208.4 $ 277.1Sell contracts 250.0 223.0
Fair (market) values:Buy contracts 206.7 289.7Sell contracts 247.5 242.3
Commodity contracts:Contract (notional) amounts:
Buy contracts $ 28.1 $ 34.0Fair (market) values:
Buy contracts 25.5 34.2
Fair value of long-term debt was determined by reference to the December 31, 2001 and 2000, marketvalues of comparably rated debt instruments. Fair values of forward contracts are based on dealerquotes at the respective reporting dates.
Note 8-Long-Term Debt and Credit FacilitiesAt December 31, long-term debt consisted of:
In millions 2001 20005.75% Notes Due 2003 $ 600.0 $ —6 7/8% Notes Due 2003 100.0 100.05.80% Notes Due 2004 249.8 —6.25% Notes Due 2006 574.4 —9% Debentures Due 2021 125.0 125.07.20% Debentures Due 2025 150.0 150.06.48% Debentures Due 2025 150.0 150.06.391% Debentures Due 2027 200.0 200.06.443% Debentures Due 2027 200.0 200.0Medium-term Notes Due 2003-2028,
at an average rate of 6.56% 296.7 377.06.75% Senior Notes Due 2008 124.4 124.06.29% Securities Due 2003 32.5 -Medium-term Notes Due 2023, at an average rate of 8.22% 50.2 50.2Other loans and notes, at end-of-year average
interest rates of 3.997% in 2001 and 6.248% in 2000, maturing in various amounts to 2015 47.7 64.2
$ 2,900.7 $ 1,540.4
33
Debt retirements for the next five years are as follows: $192.3 million in 2002, $838.3 million in 2003,$573.2 million in 2004, $207.2 million in 2005 and $588.2 million in 2006.
In February 2001, the company issued $600 million of 5.75% notes due February 2003. In May 2001,the company issued notes with a par value of $575 million at 6.25% per annum due May 2006, and $250million at 5.80% per annum due June 2004. The proceeds from these financings were used to refinanceshort-term borrowings related to the acquisition of Hussmann.
At December 31, 2001, the company’s committed revolving credit lines consisted of a 364-day linetotaling $1.25 billion and a five-year line totaling $1.25 billion. These lines were unused and providesupport for commercial paper and indirectly provide support for other financing instruments, such asletters of credit and comfort letters, as required in the normal course of business. The companycompensates banks for these lines with fees equal to a weighted average of 0.08% per annum. Availableforeign lines of credit were $1.0 billion, of which $786.5 million were unused at December 31, 2001. Nomajor cash balances were subject to withdrawal restrictions. At December 31, 2001 and 2000, theaverage rate of interest for loans payable, excluding the current portion of long-term debt, was 4.704%and 6.914%, respectively.
Capitalized interest on construction and other capital projects amounted to $4.0 million, $4.4 million and$4.0 million in 2001, 2000 and 1999, respectively. Interest income, included in other income (expense),net, was $9.8 million, $8.7 million and $5.4 million in 2001, 2000 and 1999, respectively.
Note 9-Commitments and ContinginciesThe company is involved in various litigations, claims and administrative proceedings, includingenvironmental matters, arising in the normal course of business. In assessing its potential environmentalliability, the company bases its estimates on current technologies and does not discount its liability orassume any insurance recoveries. Amounts recorded for identified contingent liabilities are estimates,which are reviewed periodically and adjusted to reflect additional information when it becomes available.Subject to the uncertainties inherent in estimating future costs for contingent liabilities, managementbelieves that recovery or liability with respect to these matters would not have a material effect on thefinancial condition, results of operations, liquidity or cash flows of the company for any year.
As of December 31, 2001, the company had no significant concentrations of credit risk in tradereceivables due to the large number of customers which comprised its receivables base and theirdispersion across different industries and countries. In the normal course of business, the company hasissued several direct and indirect guarantees, including performance letters of credit, totalingapproximately $239.0 million at December 31, 2001. The company sells product under variousarrangements through institutions that provide leasing and product financing alternatives to retail andwholesale customers. Under these arrangements, the company is contingently liable for loanguarantees and residual values of equipment of approximately $29.3 million after consideration ofultimate net loss provisions. The risk of loss to the company is minimal, and historically, only immateriallosses have been incurred relating to these arrangements. Management believes these guarantees willnot adversely affect the consolidated financial statements.
Certain office and warehouse facilities, transportation vehicles and data processing equipment areleased. Total rental expense was $108.8 million in 2001, $84.6 million in 2000 and $71.6 million in 1999.
34
Minimum lease payments required under noncancellable operating leases with terms in excess of oneyear for the next five years and thereafter, are as follows: $77.9 million in 2002, $58.6 million in 2003,$39.7 million in 2004, $24.7 million in 2005, $19.4 million in 2006 and $36.3 million thereafter.
Note 10-Sales of ReceivablesThe FASB issued Statement of Financial Accounting Standards (“SFAS”) No. 140, “Accounting forTransfers and Servicing of Financial Assets and Extinguishments of Liabilities”, which became effectivefor the company on March 31, 2001. The statement revises the accounting standards for securitizationsand other transfers of financial assets and collateral and requires certain disclosures. This statement iseffective for transfers and servicing of financial assets and extinguishments of liabilities occurring afterMarch 31, 2001. Adoption of SFAS No. 140 had no effect on the company’s consolidated financialposition, consolidated results of operations, or liquidity.
The company has agreements under which several of its operating subsidiaries sell a defined pool oftrade accounts receivable to two wholly owned special purpose subsidiaries of the company. Thesubsidiaries, are separate legal entities, that hold these receivables and sell undivided interests in suchaccounts receivable to financiers who, in turn, purchase and receive ownership and security interests inthose receivables. As collections reduce accounts receivable included in the pool, the operatingsubsidiaries sell new receivables to the special purpose subsidiaries. The special purpose subsidiarieshave the risk of credit loss on the receivables and, accordingly, the full amount of the allowance fordoubtful accounts has been retained in the Consolidated Balance Sheets. The operating subsidiariesretain collection and administrative responsibilities for the participating interests in the defined pool. Theavailability under the programs in 2001 is $300 million. At December 31, 2001, 2000 and 1999, $275million, $210 million and $170 million, respectively, were utilized under the program. Increases under theprogram are reflected as operating activities in the Consolidated Statement of Cash Flows. The proceedsof sale are less than the face amount of accounts receivable sold by an amount to issue commercial paperbacked by these accounts receivable. The discount from the face amount is accounted for as a loss onthe sale of receivables and has been included in other income (expense), net, in the ConsolidatedStatements of Income, and amounted to $10.6 million, $11.4 million and $10.2 million in 2001, 2000 and1999, respectively. The weighted average discount rate was 4.68%, 6.21% and 5.99% during the years2001, 2000 and 1999, respectively.
The agreements between the special purpose corporations and the financial institutions do not have apredefined expiration date. The company is retained as the servicer of the pooled receivables. During2001, 2000 and 1999, such sales of receivables amounted to $1,439.0 million, $753.0 million and $781.8million, respectively.
Receivables, excluding the designated pool of accounts and note receivable, sold during 2001 and 2000with recourse amounted to $310.7 million and $240.3 million, respectively. At December 31, 2001 and2000, $115.6 million and $108.2 million, respectively, of such receivables sold remained uncollected andon the Consolidated Balance Sheet.
Note 11-Equity-Linked SecuritiesIn March 1998, IR-New Jersey, together with Ingersoll-Rand Financing I, a Delaware statutory businesstrust of IR-New Jersey (Finance Trust), issued an aggregate of (a) 16,100,000 equity-linked securities,
35
and (b) 1,610,000 Finance Trust 6.22% capital securities, each with a $25 stated liquidation amount (thecapital securities). The equity-linked securities consisted of (a) 14,490,000 income equity-linkedsecurities (income securities), and (b) 1,610,000 growth equity-linked securities (growth securities).
In May 2001, equity-linked securities in the amount of $402.5 million of Ingersoll-Rand Financing I, aDelaware statutory business trust of IR-New Jersey, were exchanged for 8.3 million shares of commonstock issued by IR-New Jersey in accordance with common stock purchase contracts issued by IR-NewJersey. Following the completion of these transactions, $32.5 million of securities remain outstandingand are included in long-term debt. The securities bear a distribution rate of 6.29% per annum and willmature in May 2003.
Note 12-Common StockEffective December 31, 2001, IR-Limited became the successor to IR-New Jersey, following a corporatereorganization. The reorganization was accomplished through a merger of a newly-formed mergersubsidiary into IR-New Jersey. Upon consummation of the merger the shares of IR-New Jersey commonstock automatically became IR-Limited Class A common shares. As part of the reorganization, IR-NewJersey and certain of its subsidiaries, immediately prior to the merger transferred shares of certain IR-New Jersey subsidiaries and issued certain debt in exchange for which IR-Limited issued 135,250,003Class B common shares. The Class B common shares are non-voting and will pay comparabledividends to the Class A common shares.
The authorized share capital of IR-Limited is $1,175,010,000, consisting of (1) 1,175,000,000 commonshares, par value $1.00 per share, which common shares consist of (a) 600,000,000 Class A commonshares and (b) 575,000,000 Class B common shares, and (2) 10,000,000 preference shares, par value$0.001 per share, which preference shares consist of 600,000 Series A preference shares and suchother series of preference shares as may be designated from time to time with the respective rights andrestrictions determined by the board of directors. Class A common shares (and associated preferenceshare purchase rights) were issued to holders of IR-New Jersey common stock in the merger. None ofthe preference shares were outstanding at December 31, 2001.
Class A common shares issued were 168,003,884 at $1.00 par value at December 31, 2001 comparedto 171,466,627 common shares at $2.00 par value at December 31, 2000. The decrease in the par valueof common shares from, $2.00 to $1.00 is recorded as an increase to capital in excess of par value anda decrease in common stock on the Consolidated Statement of Shareholders’ Equity.
At December 31, 2001, treasury shares outstanding of 12.2 million were retired due to the reorganizationby reducing capital in excess of par by $503.8 million and common stock by $24.4 million. The companyhas adopted a shareholder rights plan to protect shareholders from attempts to acquire control of thecompany at an inadequate price. The plan will expire on December 22, 2008, unless earlier redeemedor exchanged by the company, as provided in the rights plan.
Note 13-Leveraged Employee Stock Ownership PlanThe company sponsors a Leveraged Employee Stock Ownership Plan (LESOP) for eligible employees.The LESOP was used to fund certain employee benefit plans. At December 31, 2001, the LESOP hadallocated all shares to employee accounts.
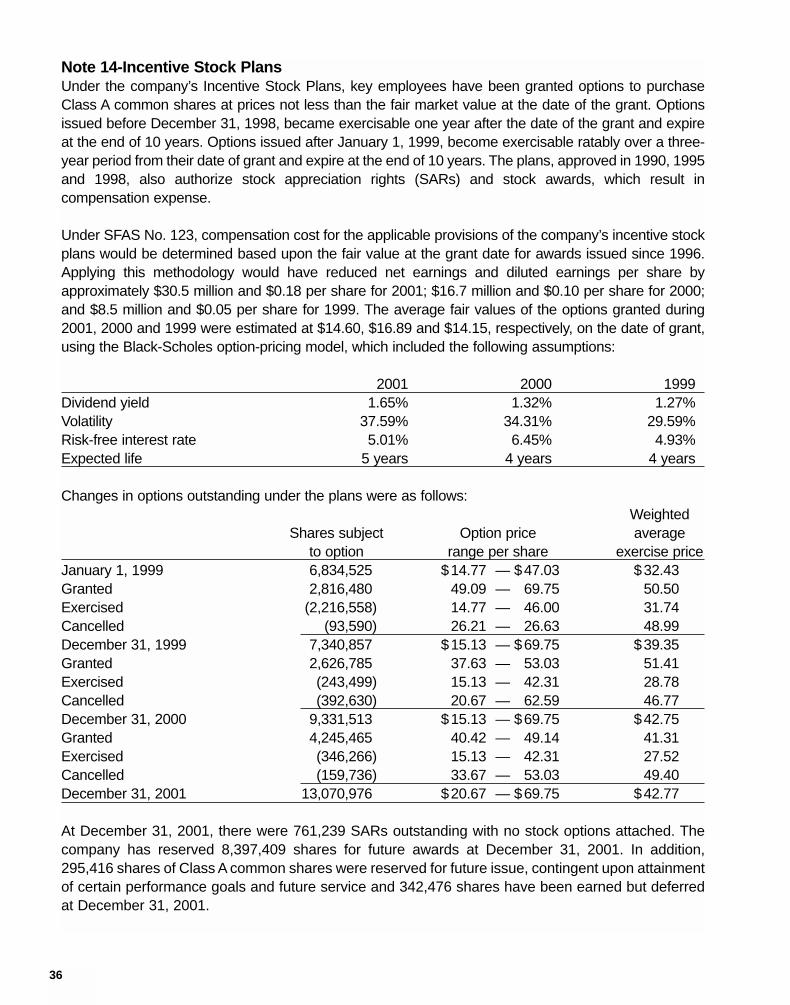
36
Note 14-Incentive Stock Plans Under the company’s Incentive Stock Plans, key employees have been granted options to purchaseClass A common shares at prices not less than the fair market value at the date of the grant. Optionsissued before December 31, 1998, became exercisable one year after the date of the grant and expireat the end of 10 years. Options issued after January 1, 1999, become exercisable ratably over a three-year period from their date of grant and expire at the end of 10 years. The plans, approved in 1990, 1995and 1998, also authorize stock appreciation rights (SARs) and stock awards, which result incompensation expense.
Under SFAS No. 123, compensation cost for the applicable provisions of the company’s incentive stockplans would be determined based upon the fair value at the grant date for awards issued since 1996.Applying this methodology would have reduced net earnings and diluted earnings per share byapproximately $30.5 million and $0.18 per share for 2001; $16.7 million and $0.10 per share for 2000;and $8.5 million and $0.05 per share for 1999. The average fair values of the options granted during2001, 2000 and 1999 were estimated at $14.60, $16.89 and $14.15, respectively, on the date of grant,using the Black-Scholes option-pricing model, which included the following assumptions:
2001 2000 1999Dividend yield 1.65% 1.32% 1.27%Volatility 37.59% 34.31% 29.59%Risk-free interest rate 5.01% 6.45% 4.93%Expected life 5 years 4 years 4 years
Changes in options outstanding under the plans were as follows:Weighted
Shares subject Option price averageto option range per share exercise price
January 1, 1999 6,834,525 $14.77 — $47.03 $32.43Granted 2,816,480 49.09 — 69.75 50.50Exercised (2,216,558) 14.77 — 46.00 31.74Cancelled (93,590) 26.21 — 26.63 48.99December 31, 1999 7,340,857 $15.13 — $69.75 $39.35Granted 2,626,785 37.63 — 53.03 51.41Exercised (243,499) 15.13 — 42.31 28.78Cancelled (392,630) 20.67 — 62.59 46.77December 31, 2000 9,331,513 $15.13 — $69.75 $42.75Granted 4,245,465 40.42 — 49.14 41.31Exercised (346,266) 15.13 — 42.31 27.52Cancelled (159,736) 33.67 — 53.03 49.40December 31, 2001 13,070,976 $20.67 — $69.75 $42.77
At December 31, 2001, there were 761,239 SARs outstanding with no stock options attached. Thecompany has reserved 8,397,409 shares for future awards at December 31, 2001. In addition,295,416 shares of Class A common shares were reserved for future issue, contingent upon attainmentof certain performance goals and future service and 342,476 shares have been earned but deferredat December 31, 2001.
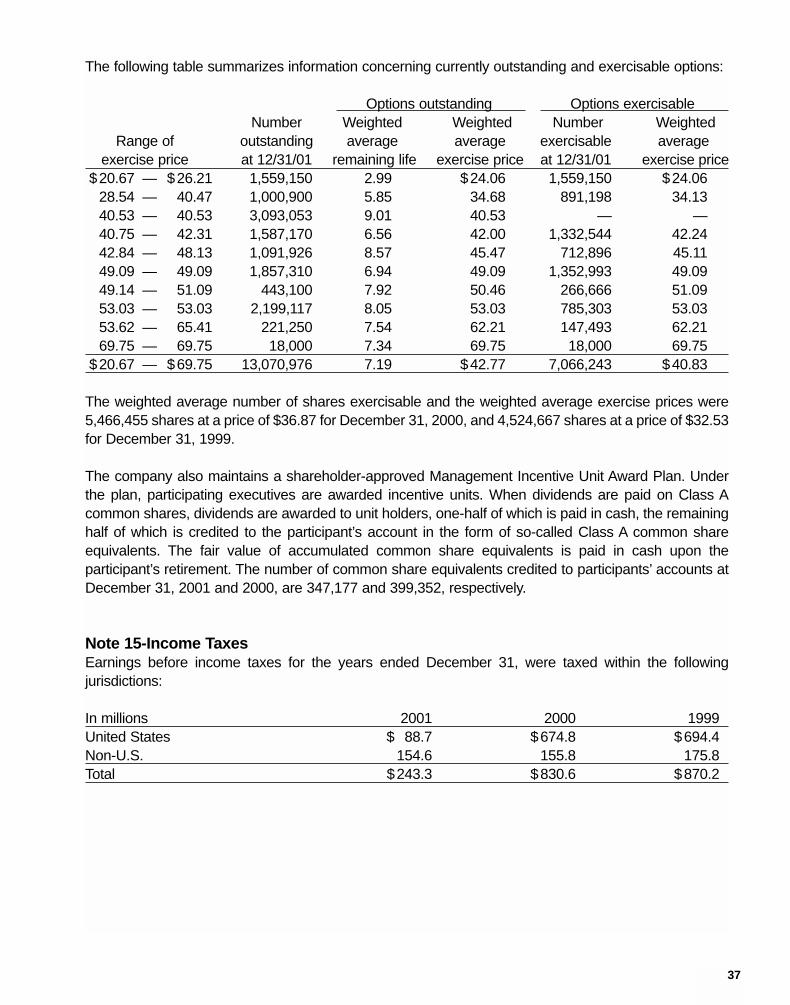
37
The following table summarizes information concerning currently outstanding and exercisable options:
Options outstanding Options exercisable Number Weighted Weighted Number Weighted
Range of outstanding average average exercisable averageexercise price at 12/31/01 remaining life exercise price at 12/31/01 exercise price
$20.67 — $26.21 1,559,150 2.99 $24.06 1,559,150 $24.0628.54 — 40.47 1,000,900 5.85 34.68 891,198 34.1340.53 — 40.53 3,093,053 9.01 40.53 — —40.75 — 42.31 1,587,170 6.56 42.00 1,332,544 42.2442.84 — 48.13 1,091,926 8.57 45.47 712,896 45.1149.09 — 49.09 1,857,310 6.94 49.09 1,352,993 49.0949.14 — 51.09 443,100 7.92 50.46 266,666 51.0953.03 — 53.03 2,199,117 8.05 53.03 785,303 53.0353.62 — 65.41 221,250 7.54 62.21 147,493 62.2169.75 — 69.75 18,000 7.34 69.75 18,000 69.75
$20.67 — $69.75 13,070,976 7.19 $42.77 7,066,243 $40.83
The weighted average number of shares exercisable and the weighted average exercise prices were5,466,455 shares at a price of $36.87 for December 31, 2000, and 4,524,667 shares at a price of $32.53for December 31, 1999.
The company also maintains a shareholder-approved Management Incentive Unit Award Plan. Underthe plan, participating executives are awarded incentive units. When dividends are paid on Class Acommon shares, dividends are awarded to unit holders, one-half of which is paid in cash, the remaininghalf of which is credited to the participant’s account in the form of so-called Class A common shareequivalents. The fair value of accumulated common share equivalents is paid in cash upon theparticipant’s retirement. The number of common share equivalents credited to participants’ accounts atDecember 31, 2001 and 2000, are 347,177 and 399,352, respectively.
Note 15-Income TaxesEarnings before income taxes for the years ended December 31, were taxed within the followingjurisdictions:
In millions 2001 2000 1999United States $ 88.7 $674.8 $694.4Non-U.S. 154.6 155.8 175.8Total $243.3 $830.6 $870.2

38
The provision for income taxes was as follows:
In millions 2001 2000 1999Current tax expense:
United States $(24.1) $228.4 $227.7Non-U.S. 46.5 43.5 37.6Total current 22.4 271.9 265.3
Deferred tax expense:United States (15.2) 17.5 26.4Non-U.S. (10.1) (5.0) 15.4Total deferred (25.3) 12.5 41.8
Total provision for income taxes $ (2.9) $284.4 $307.1
The provision for income taxes differs from the amount of income taxes determined by applying theapplicable U.S. statutory income tax rate to pretax income, as a result of the following differences:
Percent of pretax income2001 2000 1999
Statutory U.S. rate 35.0% 35.0% 35.0%Increase (decrease) in rates resulting from:
Amortization of goodwill 10.5 2.8 2.0Non-U.S. operations (31.6) (0.8) (1.0)Foreign sales corporation (9.5) (3.1) (1.7)State and local income taxes, net of U.S. tax (3.8) 2.2 2.1Puerto Rico - Sec 936 Credit (6.0) (1.7) (1.7)Other 4.2 (0.2) 0.6
Effective tax rate (1.2)% 34.2% 35.3%

39
A summary of the deferred tax accounts at December 31, follows:
In millions 2001 2000 1999Current deferred assets and (liabilities):
Differences between book and tax basesof inventories and receivables $ 34.2 $ 34.4 $ 31.0
Differences between book and tax expense for otheremployee related benefits and allowances 67.3 75.8 43.6
Other reserves and valuationallowances in excess of tax deductions 71.7 26.3 42.0
Other differences between tax and financial statement values 21.7 9.2 (11.1)
Gross current deferred net tax assets 194.9 145.7 105.5Noncurrent deferred tax assets and (liabilities):
Postretirement and postemployment benefits otherthan pensions in excess of tax deductions 300.0 312.6 287.3
Other reserves in excess of tax expense 153.3 125.9 119.2Tax depreciation/amortization in excess
of book depreciation/amortization (511.7) (166.9) (128.1)Pension contributions in excess of
book expense (41.0) (44.2) (38.5)Taxes provided for undistributed
accumulated subsidiary earnings (5.8) (22.5) (22.5)Gross noncurrent deferred net tax
assets and (liabilities) (105.2) 204.9 217.4Less: deferred tax valuation allowances (64.9) (52.0) (37.9)
Total net deferred tax assets $ 24.8 $ 298.6 $ 285.0
A total of $5.8 million of deferred taxes have been provided for a portion of the undistributed earnings ofthe company’s subsidiaries. As to the remainder, these earnings have been, and under current plans,will continue to be reinvested and it is not practicable to estimate the amount of additional taxes whichmay be payable upon distribution. During 2001, the company determined that it no longer requireddeferred taxes of $16.7 million, which had been recorded with respect to such earnings in prior yearsand accordingly reduced the deferred tax liability recording a current tax benefit for such amount.
As a result of the reincorporation from New Jersey to Bermuda, the company recorded a one time taxbenefit of $59.8 million related to the utilization of previously limited foreign tax credits and net operatingloss carryforwards in certain non-U.S. jurisdictions.
Note 16-Postretirement Benefits Other Than PensionsThe company sponsors several postretirement plans that cover most U.S. employees. These plansprovide for health care benefits and in some instances, life insurance benefits. Postretirement healthplans are contributory and are adjusted annually. Life insurance plans are noncontributory. When fulltimeemployees retire from the company between age 55 and 65, most are eligible to receive, at a cost to theretiree, certain health care benefits identical to those available to active employees. After attaining age65, an eligible retiree’s health care benefit coverage becomes coordinated with Medicare. The company
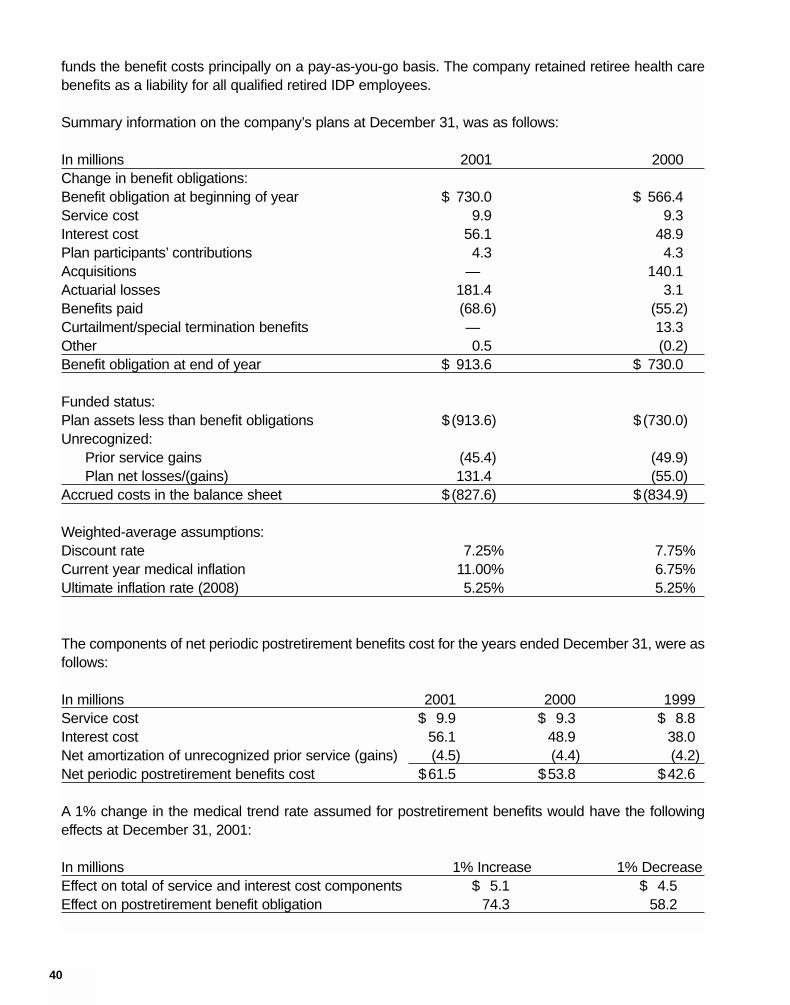
40
funds the benefit costs principally on a pay-as-you-go basis. The company retained retiree health carebenefits as a liability for all qualified retired IDP employees.
Summary information on the company’s plans at December 31, was as follows:
In millions 2001 2000Change in benefit obligations:Benefit obligation at beginning of year $ 730.0 $ 566.4Service cost 9.9 9.3Interest cost 56.1 48.9Plan participants’ contributions 4.3 4.3Acquisitions — 140.1Actuarial losses 181.4 3.1Benefits paid (68.6) (55.2)Curtailment/special termination benefits — 13.3Other 0.5 (0.2)Benefit obligation at end of year $ 913.6 $ 730.0
Funded status:Plan assets less than benefit obligations $(913.6) $(730.0)Unrecognized:
Prior service gains (45.4) (49.9)Plan net losses/(gains) 131.4 (55.0)
Accrued costs in the balance sheet $(827.6) $(834.9)
Weighted-average assumptions:Discount rate 7.25% 7.75%Current year medical inflation 11.00% 6.75%Ultimate inflation rate (2008) 5.25% 5.25%
The components of net periodic postretirement benefits cost for the years ended December 31, were asfollows:
In millions 2001 2000 1999Service cost $ 9.9 $ 9.3 $ 8.8Interest cost 56.1 48.9 38.0Net amortization of unrecognized prior service (gains) (4.5) (4.4) (4.2)Net periodic postretirement benefits cost $61.5 $53.8 $42.6
A 1% change in the medical trend rate assumed for postretirement benefits would have the followingeffects at December 31, 2001:
In millions 1% Increase 1% DecreaseEffect on total of service and interest cost components $ 5.1 $ 4.5Effect on postretirement benefit obligation 74.3 58.2

41
Note 17-Pension PlansThe company has noncontributory pension plans covering substantially all U.S. employees. In addition,certain employees in other countries are covered by pension plans. The company’s U.S. salaried plansprincipally provide benefits based on a career average earnings formula. The company’s hourly pensionplans provide benefits under flat benefit formulas. Non-U.S. plans provide benefits based on earningsand years of service. Most of the non-U.S. plans require employee contributions based on theemployee’s earnings. In addition, the company maintains other supplemental benefit plans for officersand other key employees. The company’s policy is to fund an amount which could be in excess of thepension cost expensed, subject to the limitations imposed by current statutes or tax regulations. Thecompany retained the pension plan liabilities and related plan assets for all vested IDP plan participants.
Information regarding the company’s pension plans at December 31, was as follows:
In millions 2001 2000Change in benefit obligations:Benefit obligation at beginning of year $2,372.7 $1,934.7Service cost 47.0 42.6Interest cost 170.6 151.7Employee contributions 4.4 4.7Amendments 8.1 1.3Acquisitions 10.8 386.1Expenses paid (3.6) (2.3)Actuarial losses/(gains) 99.1 (17.9)Benefits paid (201.1) (157.1)Foreign exchange impact (17.5) (44.4)IDP obligation — 65.7Curtailments and other 5.0 7.6Benefit obligation at end of year $2,495.5 $2,372.7
Change in plan assets:Fair value at beginning of year $2,640.0 $2,246.9Actual return on assets 10.8 106.4Company contributions 64.2 27.5Employee contributions 4.4 4.7Acquisitions 12.7 407.2Expenses paid (3.6) (1.9)Benefits paid (204.6) (160.8)Foreign exchange impact (14.2) (40.8)Assets from IDP — 50.8Other 0.1 —Fair value of assets at end of year $2,509.8 $2,640.0
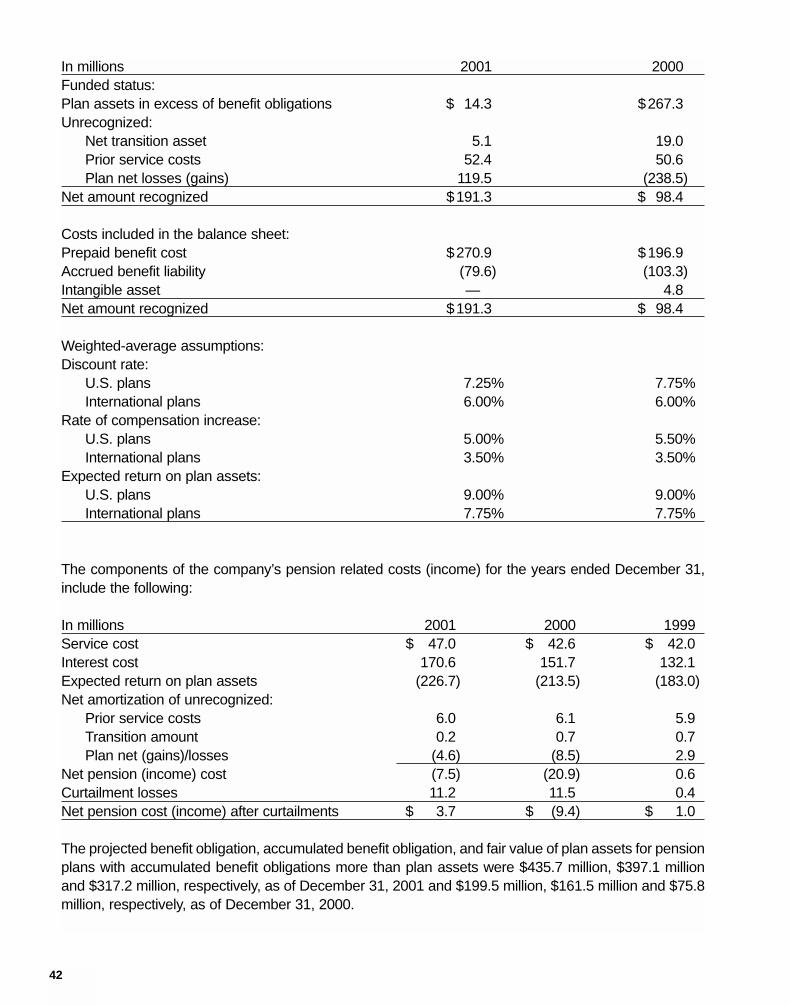
42
In millions 2001 2000Funded status:Plan assets in excess of benefit obligations $ 14.3 $267.3Unrecognized:
Net transition asset 5.1 19.0Prior service costs 52.4 50.6Plan net losses (gains) 119.5 (238.5)
Net amount recognized $191.3 $ 98.4
Costs included in the balance sheet:Prepaid benefit cost $270.9 $196.9Accrued benefit liability (79.6) (103.3)Intangible asset — 4.8Net amount recognized $191.3 $ 98.4
Weighted-average assumptions:Discount rate:
U.S. plans 7.25% 7.75%International plans 6.00% 6.00%
Rate of compensation increase:U.S. plans 5.00% 5.50%International plans 3.50% 3.50%
Expected return on plan assets:U.S. plans 9.00% 9.00%International plans 7.75% 7.75%
The components of the company’s pension related costs (income) for the years ended December 31,include the following:
In millions 2001 2000 1999Service cost $ 47.0 $ 42.6 $ 42.0Interest cost 170.6 151.7 132.1Expected return on plan assets (226.7) (213.5) (183.0)Net amortization of unrecognized:
Prior service costs 6.0 6.1 5.9Transition amount 0.2 0.7 0.7Plan net (gains)/losses (4.6) (8.5) 2.9
Net pension (income) cost (7.5) (20.9) 0.6Curtailment losses 11.2 11.5 0.4Net pension cost (income) after curtailments $ 3.7 $ (9.4) $ 1.0
The projected benefit obligation, accumulated benefit obligation, and fair value of plan assets for pensionplans with accumulated benefit obligations more than plan assets were $435.7 million, $397.1 millionand $317.2 million, respectively, as of December 31, 2001 and $199.5 million, $161.5 million and $75.8million, respectively, as of December 31, 2000.
43
Plan investment assets of U.S. plans are balanced between equity securities and cash equivalents ordebt securities. Assets of non-U.S. plans are invested principally in equity securities.
Most of the company’s U.S. employees are covered by savings and other defined contribution plans.Employer contributions and costs are determined based on criteria specific to the individual plans andamounted to approximately $44.0 million, $44.7 million and $25.1 million in 2001, 2000 and 1999,respectively. The company’s costs relating to non-U.S. defined contribution plans, insured plans andother non-U.S. benefit plans were $6.5 million, $6.7 million and $4.1 million in 2001, 2000 and 1999,respectively.
Note 18-Business Segment InformationDuring 2001, the company expanded its Industrial Solutions Sector to include Dresser-Rand, renamedits Bearings and Components Segment to Engineered Solutions and aggregated its tools and relatedproduction equipment operations, previously reported as part of the Industrial Products Segment, in theAir and Productivity Solution Segment. Club Car has been added to the Infrastructure Segment.
The accounting policies of the operating segments are the same as those described in the summary ofsignificant accounting policies except that the operating segments’ results are prepared on amanagement basis that is consistent with the manner in which the company disaggregates financialinformation for internal review and decision making. The company evaluates performance based onoperating income and operating income contribution rates. Intercompany sales transactions are entirelycontained within each segment and are eliminated at the segment level. A description of the company’sreportable segments is as follows:
Climate Control is engaged in the design, manufacture, sale and service of transport temperature controlunits, HVAC systems, refrigerated display merchandisers, beverage coolers, and walk-in storagecoolers and freezers. The segment includes Thermo King and Hussmann.
Industrial Solutions is composed of a group of businesses focused on providing solutions for customersto enhance industrial efficiency. Industrial Solutions consists of the following:
• Air and Productivity Solutions is engaged in the design, manufacture, sale and service of aircompressors, fluid products, microturbines, and industrial tools. It comprises Industrial Air Solutionsand Productivity Solutions, and has been aggregated based primarily on the nature of products andservices, and the nature of their production processes.
• Dresser-Rand is engaged in the design, manufacture, sale and service of gas compressors, gas andsteam turbines, and generators.
• Engineered Solutions is engaged in the design, manufacture, sale and service of precision bearingproducts and motion control components and assemblies. The segment includes both Automotiveand Industrial Engineered Solutions. Operating income in 2001 includes a $25 million benefit frompayments received from the U.S. Customs for antidumping claims.
Infrastructure is engaged in the design, manufacture, sale and service of skid-steer loaders, mini-excavators, electric and gasoline powered golf and utility vehicles, portable compressors and light

44
towers, road construction and repair equipment, and a broad line of drills and drill accessories. Itcomprises Bobcat, Club Car, Portable Power, Road Development, and Specialty Equipment.
Security and Safety is engaged in the design, manufacture, sale and service of locks, door closers, exitdevices, door control hardware, doors and frames, decorative hardware, and electronic and biometricaccess control systems.
Sales by destination and long-lived assets by geographic area for the years ended December 31 wereas follows:
In millions 2001 2000 1999SalesUnited States $6,124.8 $5,989.4 $4,719.3Non-U.S. 3,557.2 3,608.2 3,099.7Total $9,682.0 $9,597.6 $7,819.0
In millions 2001 2000Long-lived assetsUnited States $1,352.6 $1,432.1Non-U.S. 689.3 545.1Total $2,041.9 $1,977.2

45
A summary of operations by reportable segments for the years ended December 31, were as follows:
Dollar amounts in millions 2001 2000 1999Climate ControlSales $ 2,438.2 $ 2,002.4 $ 1,202.6Operating income 21.7 206.3 166.5Operating income as % of sales 0.9% 10.3% 13.8%Depreciation and amortization 148.5 114.5 78.9
Industrial SolutionsAir and Productivity SolutionsSales 1,308.0 1,412.9 1,381.4Operating income 52.7 162.5 159.3Operating income as % of sales 4.0% 11.5% 11.5%
Dresser-RandSales 881.3 834.0 —Operating income 21.4 4.6 —Operating income as % of sales 2.4% 0.6% —
Engineered SolutionsSales 1,077.8 1,185.4 1,239.5Operating income 78.0 159.8 145.8Operating income as % of sales 7.2% 13.5% 11.8%
Total Industrial SolutionsSales 3,267.1 3,432.3 2,620.9Operating income 152.1 326.9 305.1Operating income as % of sales 4.7% 9.5% 11.6%Depreciation and amortization 107.5 105.2 86.2
InfrastructureSales 2,570.3 2,752.5 2,707.3Operating income 219.7 389.7 416.9Operating income as % of sales 8.5% 14.2% 15.4%Depreciation and amortization 66.1 66.4 64.7
Security and SafetySales 1,406.4 1,410.4 1,288.2Operating income 230.8 271.6 248.4Operating income as % of sales 16.4% 19.3% 19.3%Depreciation and amortization 27.8 35.1 39.4
Total sales $ 9,682.0 $ 9,597.6 $ 7,819.0Operating income from reportable segments 624.3 1,194.5 1,136.9Unallocated corporate expenses (101.1) (105.1) (57.2)Total operating income $ 523.2 $ 1,089.4 $ 1,079.7Total operating income as % of sales 5.4% 11.4% 13.8%Depreciation and amortization from reportable segments 349.9 321.2 269.2Unallocated depreciation and amortization 12.6 5.9 3.2Total depreciation and amortization $ 362.5 $ 327.1 $ 272.4

46
Note 19-Ingersoll-Rand New JerseyAs part of the reorganization IR-Limited unconditionally guaranteed all of the issued public debtsecurities of IR-New Jersey. The following condensed consolidated financial information for IR-Limited(Parent), IR-New Jersey (Issuer), and all their other subsidiaries is included so that separate financialstatements of IR-New Jersey are not required to be filed with the Securities Exchange Commission. Thecondensed consolidating financial statements present the Parent and Issuer investments in theirsubsidiaries using the equity method of accounting.
Condensed Consolidating Balance SheetDecember 31, 2001
IR- IR- Other Consolidating(In millions) Limited New Jersey Subsidiaries Adjustments TotalCurrent assets:Cash and cash equivalents $ — $ 23.4 $ 90.6 $ — $ 114.0Marketable securities — — 7.4 — 7.4Accounts and notes receivable, net — 128.3 1,354.6 — 1,482.9Inventories — 134.8 1,160.5 — 1,295.3Prepaid expenses and deferred income taxes — 57.8 230.4 — 288.2Accounts and notes receivable affiliates — — 2,957.9 (2,957.9) —
Total current assets — 344.3 5,801.4 (2,957.9) 3,187.8
Investment in affiliates 5,547.5 12,825.5 8,708.2 (27,081.2) —Property, plant and equipment, net — 238.9 1,394.1 — 1,633.0Intangible assets, net — 145.0 5,544.3 — 5,689.3Note receivable affiliate 3,647.4 — — (3,647.4) —Other assets — 196.5 357.1 — 553.6
Total assets $ 9,194.9 $ 13,750.2 $21,805.1 $ (33,686.5) $ 11,063.7
Current liabilities:Accounts payable $ — $ 100.8 $ 660.2 $ — $ 761.0Accrued expenses and other current liabilities — 218.5 1,307.8 — 1,526.3Loans payable — 449.7 114.0 — 563.7Accounts and notes payable affiliates — 2,650.0 307.9 (2,957.9) —
Total current liabilities — 3,419.0 2,389.9 (2,957.9) 2,851.0
Long-term debt — 2,650.6 250.1 — 2,900.7Deferred income taxes — — 170.1 — 170.1Minority interests — — 110.5 — 110.5Note payable affiliate — 3,647.4 — (3,647.4) —Other liabilities — 116.6 998.2 — 1,114.8
— 9,833.6 3,918.8 (6,605.3) 7,147.1
Shareholders’ equity:Class A common shares 168.0 — — — 168.0Class B common shares 135.3 — — (135.3) —Common shares — — 2,362.8 (2,362.8) —Other shareholders’ equity 8,891.6 4,039.4 15,787.8 (24,648.8) 4,070.0Accumulated other comprehensive income — (122.8) (264.3) 65.7 (321.4)
Total shareholders’ equity 9,194.9 3,916.6 17,886.3 (27,081.2) 3,916.6Total liabilities and equity $ 9,194.9 $ 13,750.2 $ 21,805.1 $ (33,686.5) $ 11,063.7
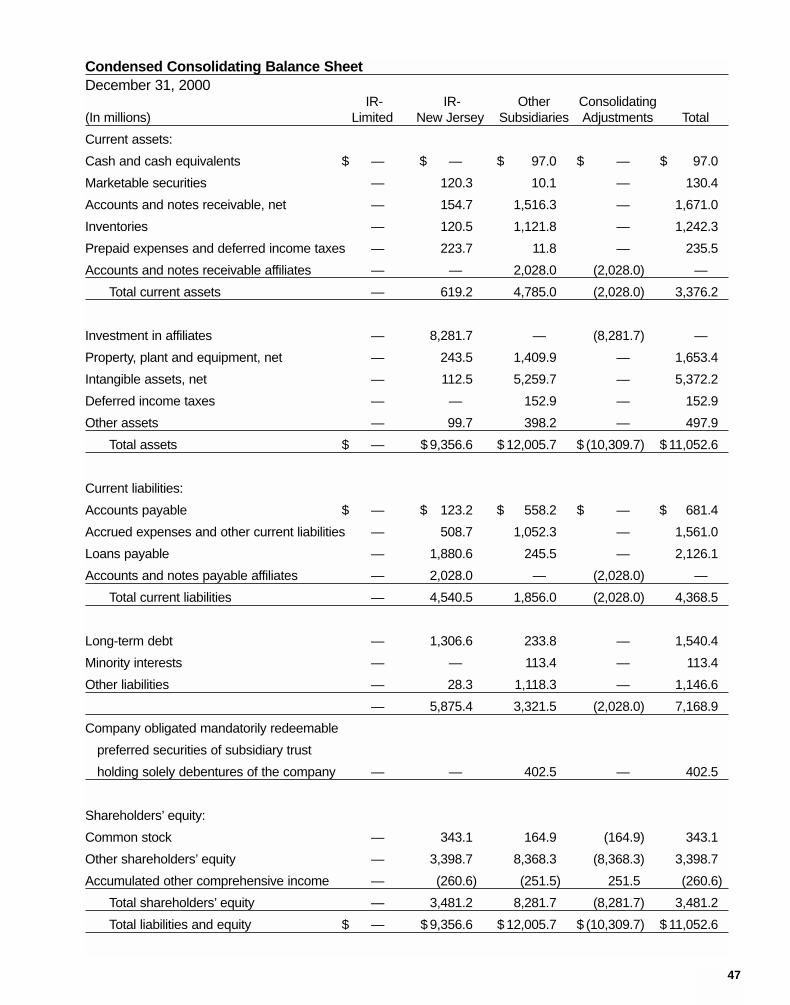
47
Condensed Consolidating Balance SheetDecember 31, 2000
IR- IR- Other Consolidating(In millions) Limited New Jersey Subsidiaries Adjustments Total
Current assets:
Cash and cash equivalents $ — $ — $ 97.0 $ — $ 97.0
Marketable securities — 120.3 10.1 — 130.4
Accounts and notes receivable, net — 154.7 1,516.3 — 1,671.0
Inventories — 120.5 1,121.8 — 1,242.3
Prepaid expenses and deferred income taxes — 223.7 11.8 — 235.5
Accounts and notes receivable affiliates — — 2,028.0 (2,028.0) —
Total current assets — 619.2 4,785.0 (2,028.0) 3,376.2
Investment in affiliates — 8,281.7 — (8,281.7) —
Property, plant and equipment, net — 243.5 1,409.9 — 1,653.4
Intangible assets, net — 112.5 5,259.7 — 5,372.2
Deferred income taxes — — 152.9 — 152.9
Other assets — 99.7 398.2 — 497.9
Total assets $ — $ 9,356.6 $ 12,005.7 $ (10,309.7) $ 11,052.6
Current liabilities:
Accounts payable $ — $ 123.2 $ 558.2 $ — $ 681.4
Accrued expenses and other current liabilities — 508.7 1,052.3 — 1,561.0
Loans payable — 1,880.6 245.5 — 2,126.1
Accounts and notes payable affiliates — 2,028.0 — (2,028.0) —
Total current liabilities — 4,540.5 1,856.0 (2,028.0) 4,368.5
Long-term debt — 1,306.6 233.8 — 1,540.4
Minority interests — — 113.4 — 113.4
Other liabilities — 28.3 1,118.3 — 1,146.6
— 5,875.4 3,321.5 (2,028.0) 7,168.9
Company obligated mandatorily redeemable
preferred securities of subsidiary trust
holding solely debentures of the company — — 402.5 — 402.5
Shareholders’ equity:
Common stock — 343.1 164.9 (164.9) 343.1
Other shareholders’ equity — 3,398.7 8,368.3 (8,368.3) 3,398.7
Accumulated other comprehensive income — (260.6) (251.5) 251.5 (260.6)
Total shareholders’ equity — 3,481.2 8,281.7 (8,281.7) 3,481.2
Total liabilities and equity $ — $ 9,356.6 $ 12,005.7 $ (10,309.7) $ 11,052.6
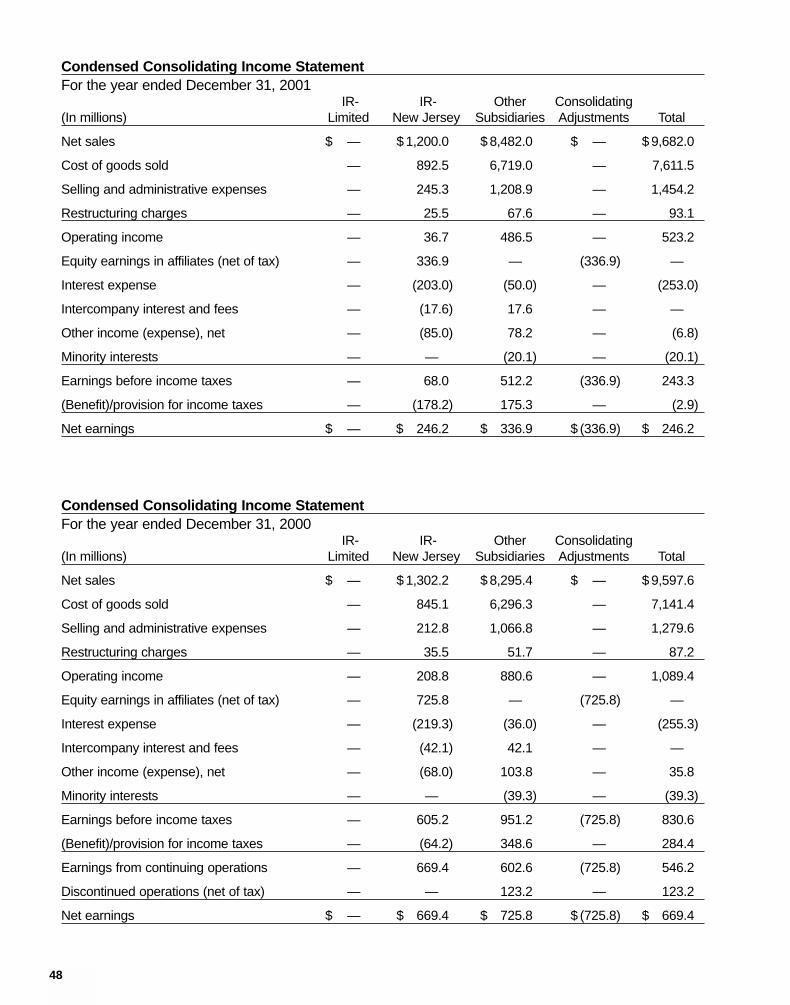
48
Condensed Consolidating Income StatementFor the year ended December 31, 2001
IR- IR- Other Consolidating(In millions) Limited New Jersey Subsidiaries Adjustments Total
Net sales $ — $ 1,200.0 $ 8,482.0 $ — $ 9,682.0
Cost of goods sold — 892.5 6,719.0 — 7,611.5
Selling and administrative expenses — 245.3 1,208.9 — 1,454.2
Restructuring charges — 25.5 67.6 — 93.1
Operating income — 36.7 486.5 — 523.2
Equity earnings in affiliates (net of tax) — 336.9 — (336.9) —
Interest expense — (203.0) (50.0) — (253.0)
Intercompany interest and fees — (17.6) 17.6 — —
Other income (expense), net — (85.0) 78.2 — (6.8)
Minority interests — — (20.1) — (20.1)
Earnings before income taxes — 68.0 512.2 (336.9) 243.3
(Benefit)/provision for income taxes — (178.2) 175.3 — (2.9)
Net earnings $ — $ 246.2 $ 336.9 $ (336.9) $ 246.2
Condensed Consolidating Income StatementFor the year ended December 31, 2000
IR- IR- Other Consolidating(In millions) Limited New Jersey Subsidiaries Adjustments Total
Net sales $ — $ 1,302.2 $ 8,295.4 $ — $ 9,597.6
Cost of goods sold — 845.1 6,296.3 — 7,141.4
Selling and administrative expenses — 212.8 1,066.8 — 1,279.6
Restructuring charges — 35.5 51.7 — 87.2
Operating income — 208.8 880.6 — 1,089.4
Equity earnings in affiliates (net of tax) — 725.8 — (725.8) —
Interest expense — (219.3) (36.0) — (255.3)
Intercompany interest and fees — (42.1) 42.1 — —
Other income (expense), net — (68.0) 103.8 — 35.8
Minority interests — — (39.3) — (39.3)
Earnings before income taxes — 605.2 951.2 (725.8) 830.6
(Benefit)/provision for income taxes — (64.2) 348.6 — 284.4
Earnings from continuing operations — 669.4 602.6 (725.8) 546.2
Discontinued operations (net of tax) — — 123.2 — 123.2
Net earnings $ — $ 669.4 $ 725.8 $ (725.8) $ 669.4

49
Condensed Consolidating Income StatementFor the year ended December 31, 1999
IR- IR- Other Consolidating(In millions) Limited New Jersey Subsidiaries Adjustments TotalNet sales $ — $ 1,340.0 $ 6,479.0 $ — $ 7,819.0Cost of goods sold — 944.9 4,728.3 — 5,673.2Selling and administrative expenses — 240.8 825.3 — 1,066.1Operating income — 154.3 925.4 — 1,079.7Equity earnings in affiliates (net of tax) — 640.4 — (640.4) —Interest expense — (153.7) (29.8) — (183.5)Intercompany interest and fees — (34.9) 34.9 — —Other income (expense), net — (26.5) 29.6 — 3.1Minority interests — — (29.1) — (29.1)Earnings before income taxes — 579.6 931.0 (640.4) 870.2(Benefit)/provision for income taxes — (11.5) 318.6 — 307.1Earnings from continuing operations — 591.1 612.4 (640.4) 563.1Discontinued operations (net of tax) — — 28.0 — 28.0Net earnings $ — $ 591.1 $ 640.4 $ (640.4) $ 591.1
Condensed Consolidating Statement of Cash FlowsFor the year ended December 31, 2001
IR- IR- Other Consolidating(In millions) Limited New Jersey Subsidiaries Adjustments TotalNet cash provided by operating activities $ — $ 213.0 $ 388.6 $ — $ 601.6
Cash flows from investing activities:Capital expenditures — (21.5) (179.1) — (200.6)Proceeds from sale of property, plant
and equipment — — 41.7 — 41.7Acquisitions, net of cash — (9.2) (149.1) — (158.3)Proceeds from business dispositions — — 17.5 — 17.5Decrease /(increase) in marketable securities — 103.9 (6.7) — 97.2Other, net — — 15.7 — 15.7Net cash provided by/(used in) investing activities — 73.2 (260.0) — (186.8)
Cash flows from financing activities:Net change in debt — (86.9) (127.2) — (214.1)Proceeds from the exercise of stock options — 9.7 — — 9.7Dividends paid — (113.1) — — (113.1)Purchase of treasury stock — (72.5) — — (72.5)Net cash (used in)/provided by financing activities — (262.8) (127.2) — (390.0)
Effect of exchange rate changes on cash and and cash equivalents — — (7.8) — (7.8)
Net increase/(decrease) in cash and cash equivalents — 23.4 (6.4) — 17.0
Cash and cash equivalents - beginning of period — — 97.0 — 97.0Cash and cash equivalents - end of period $ — $ 23.4 $ 90.6 $ — $ 114.0

50
Condensed Consolidating Statement of Cash FlowsFor the year ended December 31, 2000
IR- IR- Other Consolidating(In millions) Limited New Jersey Subsidiaries Adjustments Total
cash (used in)/provided by
operating activities $ — $ (792.4) $ 1,409.1 $ 120.3 $ 737.0
Cash flows from investing activities:
Capital expenditures — (19.5) (181.8) — (201.3)
Proceeds from sale of property, plant
and equipment — 2.7 25.8 — 28.5
Acquisitions, net of cash — — (2,288.0) — (2,288.0)
Proceeds from business dispositions — — 977.3 — 977.3
Decrease/(increase) in marketable securities — 120.3 (6.3) (120.3) (6.3)
Other, net — — 12.2 — 12.2
Net cash provided by/(used in) investing
activities — 103.5 (1,460.8) (120.3) (1,477.6)
Cash flows from financing activities:
Net change in debt — 794.1 78.3 — 872.4
Proceeds from the exercise of stock options — 8.3 — — 8.3
Dividends paid — (109.8) — — (109.8)
Purchase of treasury stock — (121.3) — — (121.3)
Net cash provided by financing activities — 571.3 78.3 — 649.6
Net cash used in discontinued operations — — (22.1) — (22.1)
Effect of exchange rate changes on cash
and cash equivalents — — (12.8) — (12.8)
Net decrease in cash and cash equivalents — (117.6) (8.3) — (125.9)
Cash and cash equivalents - beginning of period — 117.6 105.3 — 222.9
Cash and cash equivalents - end of period $ — $ — $ 97.0 $ — $ 97.0

51
Condensed Consolidating Statement of Cash FlowsFor the year ended December 31, 1999
IR- IR- Other Consolidating(In millions) Limited New Jersey Subsidiaries Adjustments Total
Net cash provided by operating activities $ — $ 663.2 $191.5 $ — $854.7
Cash flows from investing activities:
Capital expenditures — (36.1) (154.4) — (190.5)
Proceeds from sale of property, plant
and equipment — 0.3 30.1 — 30.4
Acquisitions, net of cash — — (161.2) — (161.2)
Proceeds from business dispositions — 23.8 61.0 — 84.8
Decrease in marketable securities — — 1.5 — 1.5
Other, net — — (2.0) — (2.0)
Net cash (used in) investing activities — (12.0) (225.0) — (237.0)
Cash flows from financing activities:
Net change in debt — (292.7) 25.2 — (267.5)
Proceeds from the exercise of stock options — 70.2 — — 70.2
Dividends paid — (105.3) — — (105.3)
Purchase of treasury stock — (205.8) — — (205.8)
Other, net — — 63.3 — 63.3
Net cash (used in)/provided by financing
activities — (533.6) 88.5 — (445.1)
Net cash provided by discontinued operations — — 14.6 — 14.6
Effect of exchange rate changes on cash and
and cash equivalents — — (7.8) — (7.8)
Net increase in cash and cash equivalents — 117.6 61.8 — 179.4
Cash and cash equivalents - beginning of period — — 43.5 — 43.5
Cash and cash equivalents - end of period $ — $ 117.6 $105.3 $ — $222.9
52
Report of Management
The accompanying consolidated financial statements have been prepared by the company. Theyconform with generally accepted accounting principles and reflect judgments and estimates as to theexpected effects of incomplete transactions and events being accounted for currently. The companybelieves that the accounting systems and related controls that it maintains are sufficient to providereasonable assurance that assets are safeguarded, transactions are appropriately authorized andrecorded, and the financial records are reliable for preparing such financial statements. The concept ofreasonable assurance is based on the recognition that the cost of a system of internal accountingcontrols must be related to the benefits derived. The company maintains an internal audit function thatis responsible for evaluating the adequacy and application of financial and operating controls, and fortesting compliance with company policies and procedures.
The Audit Committee of the board of directors is comprised entirely of individuals who are not employeesof the company. This committee meets periodically with the independent auditors, the internal auditorsand management to consider audit results and to discuss significant internal accounting controls,auditing and financial reporting matters. The Audit Committee recommends to the board of directors theselection of the independent auditors, who are then appointed by the shareholders.
The independent auditors are engaged to perform an audit of the consolidated financial statements inaccordance with generally accepted auditing standards. Their report follows.
Herbert L. HenkelChairman, President and Chief Executive Officer
53
Report of Independent Accountants
PricewaterhouseCoopersDorchester House
7 Church StreetHamilton HM 11
Bermuda
February 5, 2002
To the Board of Directors andShareholders of Ingersoll-Rand Company Limited:
In our opinion, the accompanying Consolidated Balance Sheet and the related Consolidated Statementsof Income, Shareholders’ Equity and Cash Flows present fairly, in all material respects, the financialposition of Ingersoll-Rand Company Limited and its subsidiaries, the successor company to Ingersoll-Rand Company, at December 31, 2001, and the results of their operations and their cash flows for theyear then ended, in conformity with accounting principles generally accepted in the United States ofAmerica. These financial statements are the responsibility of the Company’s management; ourresponsibility is to express an opinion on these financial statements based on our audit. We conductedour audit of these statements in accordance with auditing standards generally accepted in the UnitedStates of America, which require that we plan and perform the audit to obtain reasonable assuranceabout whether the financial statements are free of material misstatement. An audit includes examining,on a test basis, evidence supporting the amounts and disclosures in the financial statements, assessingthe accounting principles used and significant estimates made by management, and evaluating theoverall financial statement presentation. We believe that our audit provides a reasonable basis for ouropinion.

54
Report of Independent Accountants
PricewaterhouseCoopers LLP400 Campus Drive
Florham Park, NJ 07932U.S.A.
February 6, 2001
To the Board of Directors andShareholders of Ingersoll-Rand Company Limited:
In our opinion, the accompanying Consolidated Balance Sheet and the related Consolidated Statementsof Income, Shareholders’ Equity and Cash Flows present fairly, in all material respects, the financialposition of Ingersoll-Rand Company Limited and its subsidiaries, the successor company to Ingersoll-Rand Company, at December 31, 2000 and the results of their operations and their cash flows for eachof the two years in the period ended December 31, 2000, in conformity with accounting principlesgenerally accepted in the United States of America. These financial statements are the responsibility ofthe Company’s management; our responsibility is to express an opinion on these financial statementsbased on our audits. We conducted our audits of these statements in accordance with auditingstandards generally accepted in the United States of America, which require that we plan and performthe audit to obtain reasonable assurance about whether the financial statements are free of materialmisstatement. An audit includes examining, on a test basis, evidence supporting the amounts anddisclosures in the financial statements, assessing the accounting principles used and significantestimates made by management, and evaluating the overall financial statement presentation. Webelieve that our audits provide a reasonable basis for our opinion.

55
Quarterly Financial DataSummarized unaudited quarterly financial data for 2001 and 2000 follows:
In millions except per share amountsBasic Diluted
earnings earningsNet Cost of Operating Net per common per common
2001 sales goods sold income earnings share shareFirst quarter $ 2,291.3 $ 1,787.3 $ 138.6 $ 49.3 $ 0.31 $ 0.31Second quarter 2,459.3 1,933.3 162.4 62.9 0.38 0.38Third quarter 2,374.9 1,865.0 115.5 33.9 0.20 0.20Fourth quarter 2,556.5 2,025.9 106.7 100.1 0.60 0.59
Year 2001 $ 9,682.0 $ 7,611.5 $ 523.2 $ 246.2 $ 1.49 $ 1.48
2000First quarter $ 2,163.2 $ 1,607.0 $ 258.7 $ 136.1 $ 0.84 $ 0.83Second quarter 2,476.8 1,829.0 333.3 175.3 1.09 1.08Third quarter 2,504.6 1,883.9 235.4 251.9 1.56 1.55Fourth quarter 2,453.0 1,821.5 262.0 106.1 0.66 0.66
Year 2000 $ 9,597.6 $ 7,141.4 $ 1,089.4 $ 669.4 $ 4.15 $ 4.12
All amounts shown have been restated to reflect adoption of Emerging Issues Task Force Issue No. 00-25, “Vendor Income Statement Characterization of Consideration Paid to a Reseller of the Vendor’sProducts” in the fourth quarter of 2001.
Share Prices and DividendsQuarterly share prices and dividends for the common stock are shown in the following tabulation. Thecommon shares are listed on the New York Stock Exchange.
Common Stock2001 High Low DividendFirst quarter $ 48.84 $ 37.75 $ 0.17Second quarter 50.28 38.20 0.17Third quarter 45.20 30.41 0.17Fourth quarter $ 45.66 $ 32.50 $ 0.17
2000 High Low DividendFirst quarter $ 57.75 $ 34.13 $ 0.17Second quarter 51.38 39.38 0.17Third quarter 48.75 31.88 0.17Fourth quarter $ 44.81 $ 29.50 $ 0.17

www.irco.com