Embed Size (px)
Citation preview
Inherently Safer Design and Optimization of Intensified SeparationProcesses for Furfural ProductionG. Contreras-Zarazua,† E. Sanchez-Ramírez,† J. A. Vazquez-Castillo,‡ J. M. Ponce-Ortega,§
M. Errico,∥ A. A. Kiss,*,⊥,# and J. G. Segovia-Hernandez†
†Department of Chemical Engineering University of Guanajuato, Noria Alta S/N, Guanajuato, Gto. 36000, Mexico‡Faculty of Chemical Sciences, Autonomous University of Chihuahua, Circuito Universitario 8, Campus II, Chihuahua, Chihuahua31125, Mexico§Chemical Engineering Department, Universidad Michoacana de San Nicolas de Hidalgo, Morelia, Michoacan 58060, Mexico∥Department of Chemical Engineering, Biotechnology and Environmental Technology, University of Southern Denmark,Campusvej 55, DK-5230 Odense M, Denmark⊥School of Chemical Engineering and Analytical Science, Centre for Process Integration, The University of Manchester, SackvilleStreet, The Mill, Manchester M13 9PL, United Kingdom#Sustainable Process Technology, University of Twente, PO Box 217, 7500 AE Enschede, The Netherlands
*S Supporting Information
ABSTRACT: Currently furfural production has been thesubject of increased interest because it is a biobased chemicalable to compete with fossil-based chemicals. Furfural ischaracterized by flammability, explosion, and toxicity proper-ties. Improper handling and process design can lead tocatastrophic accidents. Hence it is of most importance to useinherent safety concepts during the design stage. This work isthe first to present several new downstream separationprocesses for furfural purification, which are designed usingan optimization approach that simultaneously considers safetycriteria in addition to the total annual cost and the eco-indicator 99. The proposed schemes include thermallycoupled configuration, thermodynamic equivalent configuration, dividing-wall column, and a heat integrated configuration.These are compared with the traditional separation process of furfural known as the Quaker Oats Process. The results show thatbecause of a large amount of water present in the feed, similar values are obtained for total annual cost and eco-indicator 99 inall cases. Moreover, the topology of the processes has an important role in the safety criteria. The thermodynamic equivalentconfiguration resulted as the safest alternative with a 40% reduction of the inherent risk with respect to the Quaker OatsProcess, and thus it is the safest option to purify furfural.
1. INTRODUCTIONThe development of chemicals from renewable resources suchas biomass attracted much research interest in recent years,with a focus on novel renewable building blocks such asfurfural.1 In fact, the U.S. Department of Energy compiled a listof Top 30 building block chemicals obtainable from biomassthat could compete with chemicals derived from petroleum.Remarkably, furfural and two of its derivatives (furandicarboxylic acid and levulinic acid) are highlighted in thetop 10 in that list.2,3 Furfural has many industrial applications,being utilized as raw material for the production of otherchemicals such as hexamethylenediamine (an intermediatecompound used for the production of nylon-6-6)4 or phenol-furfural resins.5 Bhogeswararao and Srinivas6 proved thatfurfural can be converted to added-value chemicals such asfurfuryl alcohol, tetrahydrofurfuryl alcohol, furan, tetrahydro-furan, and diols, using conventional Pt and Pd catalysts and
setting the appropriate reaction conditions and the supportacidity. Because of its high affinity with molecules with doublebonds, furfural is extensively used as an extractant.7 Forexample, Sun et al.8 and Cordeiro et al.9 have used furfural assolvent for the separation of a benzene/cyclohexane mixture inan extractive dividing-wall column arrangement.Furfural is usually produced from biomass rich in pentosane,
such as sugar cane bagasse, corncobs, oat hulls, and sunflowerhusks among others.1,7 In 1922, the Quaker Oats Company
Special Issue: Frameworks for Process Intensification and Modula-rization
Received: August 1, 2018Revised: November 14, 2018Accepted: November 19, 2018Published: November 19, 2018
Article
pubs.acs.org/IECRCite This: Ind. Eng. Chem. Res. 2019, 58, 6105−6120
© 2018 American Chemical Society 6105 DOI: 10.1021/acs.iecr.8b03646Ind. Eng. Chem. Res. 2019, 58, 6105−6120
Dow
nloa
ded
via
UN
IV D
E G
UA
NA
JUA
TO
on
Apr
il 29
, 201
9 at
19:
24:0
2 (U
TC
).
See
http
s://p
ubs.
acs.
org/
shar
ingg
uide
lines
for
opt
ions
on
how
to le
gitim
atel
y sh
are
publ
ishe
d ar
ticle
s.

created the first process to produce furfural at the industrialscale using oat hulls as raw material, along with sulfuric acidand steam.7 This process has been characterized by easyimplementation but a high purification cost and lowconversions to furfural. The Quaker Oats process has notundergone great changes, and it is now used to produce near80% of the total world production of furfural.7,10
Up to now, most of the research work has focused onidentifying cheap raw materials able to approach a sustainableand economic production of furfural. Blasi et al.11 discussedthe pyrolytic behavior of different hardwood and softwoodbiomasses with respect to the furfural yield. Mesa et al.12
presented a study in which furfural is produced by diluted acidhydrolysis of sugar cane bagasse. De Jong and Marcotullio13
presented an overview of different technologies applied invarious biorefineries where furfural is (co)produced. They alsoemphasize how diluted acid pretreatment can be beneficial forlarge-scale applications. Additionally, Martin and Grossman14
have proposed a process for the coproduction of furfural anddimethyl furfural from algae and switchgrass. Moreover, theyexplored different pretreatment technologies to improve thefurfural conversion for many raw materials. Finally, Lui et al.,15
studied the possibility of taking advantage of hydrolysates ofhardwoods to produce furfural.However, there is a gap defining separation alternatives for
product recovery leading to a strong interest in finding betterdownstream processing schemes in furfural productionprocess. Typically, the solid biomass is treated with an acidsolution at high temperature, and steam is used to maintain thereaction temperature and to remove the produced furfuralobtained as a diluted aqueous stream. Similar to the separationof other bioderived compounds, such as bioethanol andbiobutanol, the purification section represents one of the mostenergy-intensive parts of the process, and process intensifica-tion and optimization techniques are required to come up withinnovative and competitive production processes.16−19 Dis-tillation is usually the first unit operation considered forseparation at industrial level due to the high reliability reachedin modeling, simulation, design, and control, as well as theconsiderable amount of equilibrium data available.20 However,due to its low thermodynamic efficiency and high capitalinvestment it is imperative to define enhanced configurationsbased on process intensification principles,21 not considered atthe time when the original process was developed.Qian et al.22 proposed an azeotropic divided wall column to
separate a mixture of water−furfural. Using the traditional two-column azeotropic configuration as a benchmark, theazeotropic divided wall alternative proposed provided 3.8%savings in the total reboiler duty and proved the applicability oftraditional proportional- integral controllers. However, the feedchosen by the authors contained 90% mole of furfural whichdoes not match with typical bioprocesses. Nhien et al.10
proposed a hybrid process in which furfural is recovered byliquid−liquid extraction. Many solvents were screened, but thebest solution obtained was not compared against thetraditional distillation alternative and its convenience was notproven. As an alternative to distillation, the application ofpervaporation also has been proposed.23
In this context, the definition of enhanced distillationconfigurations is of paramount importance in defining afurfural separation process integrated into a biorefinery.However, there are no previous studies that include safetycriteria into the design of such a process. Medina-Herrera et
al.24,25 evaluated the inherent risk for distillation schemes withhydrocarbons mixtures and intensified extractives distillationschemes to recovery ethanol. Their results indicate that theamount of inventory in the columns and the physicalproperties of the substances have a strong impact on theinherent safety of the process. Martinez-Gomez et al.26 studieddifferent intensified distillation processes to purify biobutanoland evaluated their individual riskwhich is an index toevaluate the inherent safetywhile considering economic andenvironmental criteria. Their results demonstrate that theprocess topology can influence the inherent safety. Addition-ally Martinez- Gomez et al.27 carried out a safety analysis of aprocess to produce silane by reaction distillationone of themost popular examples of process intensification. Their resultsshows that process intensification can lead to importantimprovements in the safety aspects. On the previous studies, itis evident that process intensification can be a powerful tool toimprove not only the economical and energy aspects but alsothe process safety.This study is the first to propose four intensified distillation
sequences for furfural purification, and compare them with theseparation section included in the Quaker Oats process. Theseseparation processes were designed and optimized simulta-neously considering a multiobjective function to analyze theprocess performance. The objective function combines theindividual risk (IR) as quantification of the potential risk of theprocess, total annual cost (TAC) as key economic indicator,and Eco-indicator 99 (EI99) that quantifies the environmentalimpact. The simultaneous evaluation of economics, environ-mental impact, and inherent safety at the design stagerepresents an important improvement in selecting the optimalseparation process route. The novelty of this work isrepresented by the new configurations proposed as well asthe selection of the best alternative to purify furfuralconsidering simultaneously the safety, economic, and environ-mental criteria.
2. SIMULATION APPROACHRigorous Aspen Plus simulations of the separation process(using the RADFRAC model) are coupled with anoptimization algorithm programmed in Excel through a VisualBasic macro. To maintain the study general and extendible tothe majority of furfural plants, the average compositionreported by Zeitsch7 was considered. As Zeitsch stated: “allfurfural reactors known so far produce a vapor streamconsisting of more than 90% water, of up to 6% furfural, andof various by-products mainly methanol and acetic acid”.7 Thefeed compositions considered in this work is water 90 wt %,furfural 6 wt %, methanol 2 wt %, and acetic acid 2 wt %, atemperature of 353 K and pressure of 2 atm, these data weretaken from the out stream of reactive zone reported byZeitsch7 and Nhien et al.:28 The feed flow rate used is 105,000kg/h according to the estimated global furfural demandreported by Nhien et al.28 Note that this feed stream,represents an average flow rate according to the recentinvestments, for example the plant at Dominican Republic withan estimated production of 35 ton/year reported byMarcotullio.29 Even though the feed stream is an importantissue during the basic design, the synthesis methodology usedin this work may be used on several scaled-up scenarios. Forexample, Errico et al.30 reported economic and energy savingsby 25% with a feed stream of 100 lbmol/h as a reference feedstream. On the other hand Errico et al.,31 with a larger
Industrial & Engineering Chemistry Research Article
DOI: 10.1021/acs.iecr.8b03646Ind. Eng. Chem. Res. 2019, 58, 6105−6120
6106

production, also reported economic saving by 16%. Thevapor−liquid−liquid equilibrium of this mixture can beadequately modeled using the property model nonrandomtwo-liquids with Hayden−O’Connell equation of state(NRTL-HOC) which takes into account the two liquid phasesand the dimerization and solvation characteristics of mixtureswith carboxylic acids.10,28 The NRTL-HOC model can alsopredict properly the heterogeneous azeotrope formed by waterand furfural.10,28 The ternary diagrams for the ternary mixtures(using mass fraction as basis) are illustrated in Figure 1.
3. SYNTHESIS OF THE SEPARATION ALTERNATIVES
Figure 2 shows the classic furfural separation sectionconsidered as a benchmark. This configuration was developedaccording to the Quaker Oats Process (QOP), reported indetail by Zeitsch7 and Nhien et al.10 A similar configurationwas also examined by Steingaszner et al.32 The benchmarkconfiguration consists of three distillation columns and adecanter for the liquid−liquid separation. The first column
(C1) is commonly called an azeotropic distillation column.Within the C1 column, the mixture is concentrated untilazeotrope composition. At this point, the water works as a veryvolatile component and dragging part of the furfural to the gasphase, which is condensate. After the condensation, two phasesare formed and passed out to the decanter through the sidestream. The phase enriched with water is returned to columnC1 to promote the two liquids phases’ formation. Furthermore,the water is removed for the bottom of C1 together with theacetic acid, avoiding its probably expensive purification.8 Themethanol is recovered as a distillate product of the secondcolumn (C2), while the bottom is fed to the decanter. Theorganic phase of the decanter is fed to the column C3 used forthe final step of furfural recovery. The distillate of the columnC3 is sent back to the decanter, while the bottom stream is thefurfural product.
3.1. Thermally Coupled Separation Alternatives.Thermally coupled configurations are obtained from thecorresponding simple column sequences by substitution of a
Figure 1. Ternary diagrams for mixtures: (a) water−furfural−acetic acid, (b) water−furfural−methanol.
Figure 2. Benchmark configuration of the Quaker Oats Process.
Industrial & Engineering Chemistry Research Article
DOI: 10.1021/acs.iecr.8b03646Ind. Eng. Chem. Res. 2019, 58, 6105−6120
6107
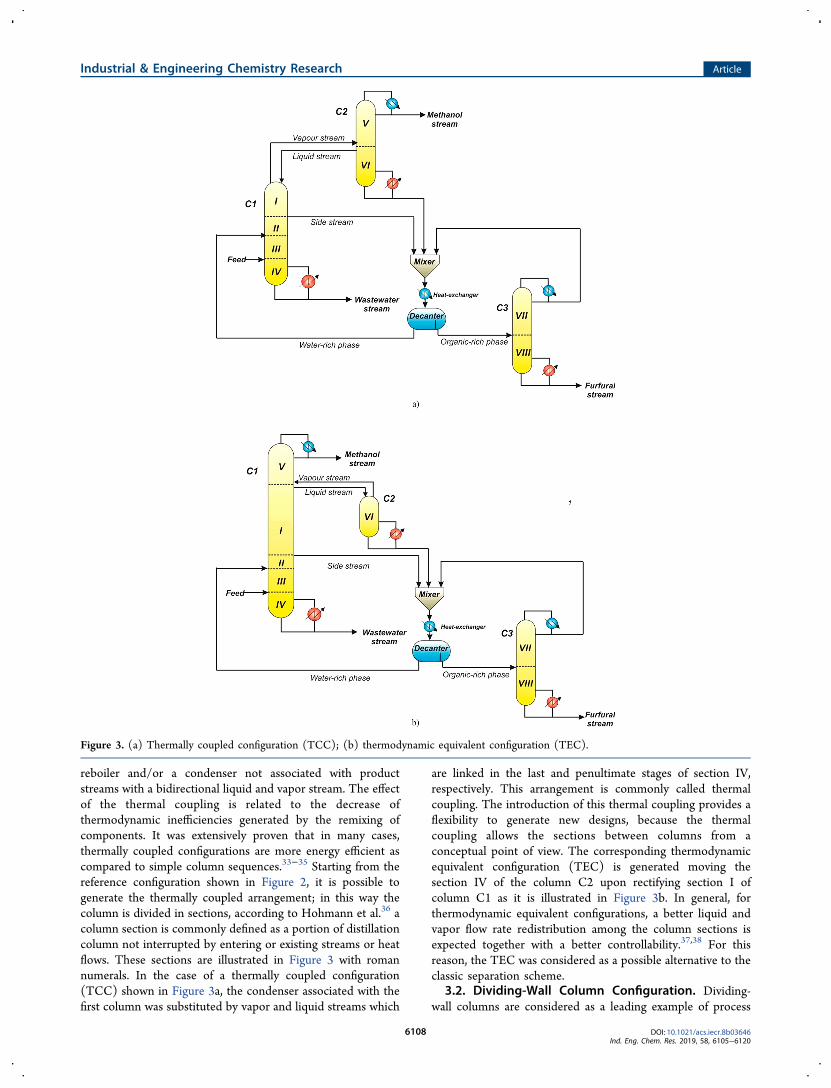
reboiler and/or a condenser not associated with productstreams with a bidirectional liquid and vapor stream. The effectof the thermal coupling is related to the decrease ofthermodynamic inefficiencies generated by the remixing ofcomponents. It was extensively proven that in many cases,thermally coupled configurations are more energy efficient ascompared to simple column sequences.33−35 Starting from thereference configuration shown in Figure 2, it is possible togenerate the thermally coupled arrangement; in this way thecolumn is divided in sections, according to Hohmann et al.36 acolumn section is commonly defined as a portion of distillationcolumn not interrupted by entering or existing streams or heatflows. These sections are illustrated in Figure 3 with romannumerals. In the case of a thermally coupled configuration(TCC) shown in Figure 3a, the condenser associated with thefirst column was substituted by vapor and liquid streams which
are linked in the last and penultimate stages of section IV,respectively. This arrangement is commonly called thermalcoupling. The introduction of this thermal coupling provides aflexibility to generate new designs, because the thermalcoupling allows the sections between columns from aconceptual point of view. The corresponding thermodynamicequivalent configuration (TEC) is generated moving thesection IV of the column C2 upon rectifying section I ofcolumn C1 as it is illustrated in Figure 3b. In general, forthermodynamic equivalent configurations, a better liquid andvapor flow rate redistribution among the column sections isexpected together with a better controllability.37,38 For thisreason, the TEC was considered as a possible alternative to theclassic separation scheme.
3.2. Dividing-Wall Column Configuration. Dividing-wall columns are considered as a leading example of process
Figure 3. (a) Thermally coupled configuration (TCC); (b) thermodynamic equivalent configuration (TEC).
Industrial & Engineering Chemistry Research Article
DOI: 10.1021/acs.iecr.8b03646Ind. Eng. Chem. Res. 2019, 58, 6105−6120
6108

intensification applied to multicomponent distillation. Thisconfiguration is an attractive alternative since it has thepotential for reducing the operating and capital costs. Previousworks explored among others the design and controllability ofthe dividing wall columns, and possible applications to theseparation of biofuels.39−44 The divided wall columnconfiguration (DWCC) considered for the furfural separationis shown in Figure 4. It was obtained merging column C1 andC2 in a single shell divided by an internal wall. From aconceptual point of view the length of the wall is determinateby the number of trays of the sections of columns C1. The wallis extended to the column bottom in order to separate twobottom streams. For this reason, the DWCC unit is equippedwith two reboilers. However, only one distillate product isobtained.3.3. Heat Integrated Configuration. The main principle
behind heat integration in distillation configurations is to usethe energy sources or sinks available in other process streamsto condense the vapor in the overhead of a column, or to
provide the reboiler duty required. As reported by Rathore etal.45 the process streams might be the reboiler or condenserstreams in the same separation sequence. Heat integratedalternatives were deeply explored in the literature, and they stillrepresent a valid alternative to reduce the energy requirementsof multicomponent distillation.45−51 The heat integratedconfiguration (HIC) considered in this work is illustrated inFigure 5. The selected heat integration strategy for the heatintegrated configuration (HIC) consists of the utilization ofthe latent heat of the vapor stream leaving the top part of thecolumn C3. The temperature of this stream is increasedthrough the use of a compressor; the main target in thisconfiguration with heat integration is to upgrade and reuse theheat of the vapor stream to mitigate the duty in the reboiler ofC2 and to condensate the vapor. After condensation, it ispartially recycled to the column C3 to ensure the liquid reflux.The function of the compressor is to increase the temperatureof the vapor stream in order to guarantee that its temperatureis higher than the temperature of the bottom of the column 2.
Figure 4. Dividing-wall column configuration (DWCC).
Figure 5. Heat integrated configuration (HIC).
Industrial & Engineering Chemistry Research Article
DOI: 10.1021/acs.iecr.8b03646Ind. Eng. Chem. Res. 2019, 58, 6105−6120
6109

The heat integration can cause important energy savings in theprocess. This strategy has gained attention in recent years, andit has been proven to achieve an efficient method for heatintegration in separation processes, for instance see the worksby Jana and Maiti;48 Luo et al;49 Contreras Zarazua et al.50 andZang et al.51
4. OBJECTIVE FUNCTION DEFINITION
The objective function is constructed by combining threedifferent and contrasting indexes representing the economy(total annual cost), the environmental impact (eco-indicator99), and the process safety (individual risk). Each index isdescribed in the following subsections.4.1. Plant Economy: Total Annual Cost (TAC). TAC is
the classical approach used to quantify the economicperformance of a chemical process alternative. The method-ology consists in calculating the annualized cost of eachprocesses equipment (capital cost) and the operating costassociated with the use of steam, cooling water, and electricity.The equation for TAC is given by
TACcapital cost
payback periodoperating cost= +
(1)
The capital cost includes the cost of condensers, reboilers,distillation columns, trays, process vessels and compressors,whereas the operating cost is associated with the cost of steam,cooling water, and electricity. The TAC was calculated usingthe Guthrie method.52 Carbon steel was considered asconstruction material. A payback period of 10 years wasused. Sieve trays and 0.61 m spacing were selected for all thecolumns. All the parameters for the equipment and the utilitycosts were taken from Turton et al.53 Five utility costs havebeen considered: high-pressure steam (42 bar, 254 °C, $17.7/GJ), medium-pressure steam (11 bar, 184 °C, $14.83/GJ),low-pressure steam (6 bar, 160 °C, $14.95/GJ), cooling water($0.72/GJ), and electricity ($16.8/GJ). The operating costswere evaluated considering 8500 h of yearly operation.4.2. Environmental Impact: Eco-Indicator 99 (EI99).
The EI99 was used to evaluate the sustainability of theprocesses and to quantify the environmental impact due to themultiple activities performed in the process. This methodologyis based on the life cycle assessment. The approach wasproposed by Goedkoop and Spriensma.54 The EI99 has provento be an important method to evaluate overall environmentalimpact related in chemical processes. Some authors, such asGuillen-Gonzalvez et al.,55 Alexander et al.,56 and Quiroz-Ramirez et al.,57 have demonstrated that applying the EI99during the design and synthesis phases can lead to importantimprovements and reductions of wastes. The index was appliedsuccessfully in screening different alternatives for biofuelspurification giving as results the optimal configuration with thelowest environmental impact and cost.19,30
The method is based on the evaluation of three majordamage categories: human health, ecosystem quality, andresources depletion. In the case of distillation columns, thefactors that have the strongest influence on EI99 are the steamused to supply the heat duty, electricity utilized for pumping ofcooling water, and the steel necessary to build the equip-ment.19,30 The EI99 can be represented mathematicallyaccording to the following equation:
c c cEI99 as asl aeli
ii
ii
i∑ ∑ ∑ω ω ω= + +(2)
where ω is a weighting factor for damage, ci is the value ofimpact for category i, “as” is the amount of steam utilized bythe process, asl is the amount of steel used to build theequipment, and ael is the electricity required by the process.For example, the amount of steam used to provide energy tothe plant is multiplied by the damage impact of each category,and subsequently the summation of all the products isperformed to obtain the eco- indicator due to steam; theprocedure is the same for steel and electricity. For theweighting factor ω, we have followed the method of EI99,separating the impact categories as damages to the humanhealth (expressed in disability adjusted life years “DALYs”),damage to the ecosystem quality (expressed as the loss ofspecies over a certain area% species m2 yr), and damage toresources (expressed as the surplus energy needed for futureextractions of minerals and fossil fuels, “MJ surplus”). Thedamage to the human health and to the ecosystem quality areconsidered to be equally important, whereas the damage to theresources is considered to be about half as important.Furthermore, in the presented approach the hierarchicalperspective was considered to balance the short- and thelong-term effects. The normalization set is based on a damagecalculation for all relevant emissions, extractions and land-uses.58 Table 1 shows the values for the impact categories (ci).
Finally, the total EI99 is obtained by the summation of eco-indicators due to steam, electricity, and steel. To compute theEI99, a hierarchical perspective is considered for the evaluationof environmental impact in order to have a balance betweenshort- and long-term effects.54,57 The values of Table 1 weretaken from the work reported by Geodkoop and Spriensma54
and are associated and corresponding with the use of steel forbuilding the equipment and with the use of energy utilizedduring the plant operation, two factors that are independent ofthe type of process.The scale of the values considered in Table 1 is chosen such
that the value of 1 point is representative for a 1000th of theyearly environmental load of one average European inhab-itant.30,54,55
4.3. Process Safety: Individual risk (IR). The individualrisk (IR) was used as index to evaluate the safety. The IR canbe defined as the risk of injury or decease to a person in the
Table 1. Values of EI99 Impact Categories Used forDistillation Columns54
impact categorysteel (points/kg)
×10−3steam
(points/kg)electricity
(points/kWh)
carcinogenic 1.29 × 10⁻³ 1.180 × 10⁻⁴ 4.360 × 10⁻⁴
climate change 1.31 × 10⁻² 1.27 × 10⁻³ 4.07 × 10⁻³
ionizingradiation
4.510 × 10⁻⁴ 1.91 × 10⁻⁶ 8.94 × 10⁻⁵
ozonedepletion
4.550 × 10⁻⁶ 7.78 × 10⁻⁷ 5.41 × 10⁻⁷
respiratoryeffects
8.010 × 10⁻² 1.56 × 10⁻³ 1.01× 10⁻⁵
acidification 2.710 × 10⁻³ 1.21 × 10⁻⁴ 9.88 × 10⁻⁴
ecotoxicity 7.450 × 10⁻² 2.85 × 10⁻⁴ 2.14 × 10⁻⁴
land occupation 3.730 × 10⁻³ 8.60 × 10⁻⁵ 4.64 × 10⁻⁴
fossil fuels 5.930 × 10⁻² 1.24 × 10⁻² 1.01 × 10⁻²
mineralextraction
7.420 × 10⁻² 8.87 × 10⁻⁶ 5.85 × 10⁻⁵
Industrial & Engineering Chemistry Research Article
DOI: 10.1021/acs.iecr.8b03646Ind. Eng. Chem. Res. 2019, 58, 6105−6120
6110

vicinity of a hazard.59 The main objective of this index is theestimation of likelihood affectation caused by the specificincident that occurs with a certain frequency. The IR does notdepend on the number of people exposed. The mathematicalexpression for calculating the individual risk is given in eq 3:
f PIR i x y,∑= (3)
Where f i is the occurrence frequency of incident i, whereas Px,yis the probability of injury or decease caused by the incident i.In this work, an irreversible injury (decease) is used, for whichmore data are recorded. The calculation of IR can be carriedout through quantitative risk analysis (QRA), which is amethodology used to identify incidents and accidents and theirconsequences. The QRA starts with the identification ofpossible incidents. Two types of incidents are identified fordistillation columns: continuous and instantaneous releases. Acontinuous release is produced mainly by a rupture in apipeline or partial rupture on process vessel causing a leak. Theinstantaneous release consists of the total loss of matter fromthe process equipment originated by a catastrophic rupture ofthe vessel. These incidents were determined through a hazardand operability study (HAZOP). The procedure is effective inidentifying hazards and it is well accepted by the chemicalindustry. The technique consists of systematically analyzing thereasons and consequences that can provoke deviations in theoperative conditions of a process that can derivate in anaccident through a series of questions such as how, where,when, etc. More information about this technique is providedby AIChE59 and Crowl and Louvar.60 The frequency values foreach incident ( f i) were taken according to those reported byAmerican Institute of Chemical Engineers (AIChE).59 Figure 6shows the event tree diagrams obtained with all probabilities ofinstantaneous and continuous incidents, along with their
respective frequencies. Accordingly, instantaneous incidentsare boiling liquid expanding vapor explosion (BLEVE),unconfined vapor cloud explosion (UVCE), flash fire, andtoxic release, whereas the continuous release incidents are jetfire, flash fire and toxic release. The complete set of equationsto calculate the IR is shown in the eqsS1−S8 of the SupportingInformation and more information about these equations isgiven by AIChE59 and Crowl and Louvar.60
Once the incidents have been identified, the probability Px,ycan be calculated through a consequence assessment, whichconsists of determining the physical variables such as thethermal radiation, the overpressure, and the concentration ofthe leak originated by incidents, and their respective damages.The calculation of the physical variables was realized accordingto the equations reported by the AIChE59 and some otherauthors such as Medina-Herrera et al.24,25 The atmosphericstability type F is used for calculating the dispersion, whichcorresponds to a wind speed of 1.5 m/s. This atmosphericcondition is the worst possible scenario because the the lowwind speed does not allow a fast dispersion of the flammableand toxic components, increasing the time of exposure and theprobability of contact with an ignition source.59,60
The quantification of the damage caused by physicalvariables of each incident is calculated through a vulnerabilitymodel commonly known as a probit model.59,60 In this work,the damage considered to people is death due to fires,explosions, and toxic releases; all calculations were carried outto a representative distance of 50 m. The probit modelsassociated with deaths by thermal radiation (teEr) andoverpressure due to explosions (p°) are given by eq 4 andeq 5:59
Figure 6. Event tree diagrams for distillation schemes59,24
Industrial & Engineering Chemistry Research Article
DOI: 10.1021/acs.iecr.8b03646Ind. Eng. Chem. Res. 2019, 58, 6105−6120
6111

i
k
jjjjjjjy
{
zzzzzzzYt E
14.9 2.56 ln10e r
34
4= − +(4)
Y p77.1 6.91 ln( )= − + ° (5)
Because toxicity probit models for components considered inthis work were not reported, the calculation of the damage totoxic releases were carried out using the LC50.59 Moreinformation about this calculation is provide in the SupportingInformation. Finally, the probability Px,y is calculatedsubstituting the probit results of eq 4 and eq 5 into thefollowing equation:
Ä
Ç
ÅÅÅÅÅÅÅÅÅikjjj
y{zzzÉ
Ö
ÑÑÑÑÑÑÑÑÑP
Y0.5 1 erf
52x y, = + −
(6)
The physical properties for each substance used for theconsequence assessment are reported in Table 2. These weretaken from the National Institute for Occupational Safety andHealth (NIOSH).61
4.4. Multiobjective Optimization Problem Formula-tion. Once the economic, environmental, and safety indexeshave been described, the mathematical optimization problemconsidering all indexes can be expressed according to
÷ ◊÷÷ ÷ ◊÷÷÷÷ ◊÷÷÷÷ ÷ ◊÷÷÷
f R k C
y x
w u
min TAC, EI99, IR(NT, Fs , , VF, LF, DC , HD , , )
Subject to:
i i i i ij
m m
m m
[ ]=
≥
≥ (7)
where NTi represents the total number of stages of column i,Fsi is the feed stages for column i, Ri is the reflux ratio ofcolumn i, VF is the interconnection vapor flow, LF is theinterconnection liquid flow, DCi is the diameter of column i,HDi is the reboiler duty for column i, k is the compressorcapacity, Ci,j is the concentration of substance j in column i.The optimization problem is restricted to satisfy the constraintvectors of purity and mass flow rate for interesting substancesin the mixture. In this work ym and wm are the vectors ofobtained purity and mass flow rate, while um and xm are thevectors of required purity and mass flow rate, respectively. Thepurity constraints for methanol and furfural were defined as99.5% and 99.2% mass fraction, whereas the mass flow rate wasset at 2000 kg/h for methanol and 6200 kg/h for furfural in themethanol and furfural streams, respectively. Note that eq 7 is ageneral equation for all sequences, some terms such asinterconnection flows, capacity of compressor, or heat duty fora specific column could be discarded depending on the studiedscheme. Table 3 shows detailed information about the decisionvariables considered for each of the separation schemes. Theletter “X” indicates that a particular process contains thediscrete variable and continuous variable; e.g., the QOPprocess contains the number of stages of C1 as discrete
variable and the reflux ratio of C1 as continuous variable, thenthe “X” points out the existence of these variables in thatprocess. On the other hand the “-” indicates the absence ofeither continuous or discrete variables in a process. Note in theQOP process the “-” indicates that this process configurationdoes not have a continuous variable called interlinking flow.The ranges of decision variables are reported in the Table S2 ofSupporting Information. The ranges for the design variablesare within the limits reported by Gorak and Olujic.62
4.5. Multiobjective Optimization Strategy. This studyuses a multiobjective optimization technique known asDifferential Evolution with Tabu List (DETL) proposed bySrinivas and Rangaiah,63 which is a stochastic globaloptimization technique. The DETL algorithm combines twovery useful optimization techniques, the differential evolution(DE) and Tabu search (TS). The differential evolutionmethod is a population-based direct search method thatimitates the biological evolutionit was designed to solveoptimization problems with nonlinear and nondifferentiableequations.64 The Tabu search is a random search method thathas the ability to remember the search spaces previouslyvisited.63 The main advantages provided by DE is its fasterconvergence to the neighborhood global optimum incomparison to other stochastic methods; this algorithm hasthe capacity to escape from local due to its nature to be amethod of global search. The main characteristic of TS is
Table 2. Physical Properties of Components
component lower flammability limit (LFL) upper flammability limit (UFL) lethal concentration (LC50) heat combustion (kJ/mol)
furfural 2 19 64 000 ppm/4 h 2344methanol 6 36 1037 ppm/1 h 726acetic acid 6 17 16 000 ppm/4 h 876.1
Table 3. Decision Variables of the Separation ProcessConfigurations
decision variables QOP TCC TEC DWCC HIC
Discrete Variablesno. of stages, C1 X X X X Xno. of stages, C2 X X X X Xno. of stages, C3 X X X X Xfeed stage recycle of C1 X X X X Xfeed stage, C1 X X X X Xstage of side stream C1 X X X X Xfeed stage C2 X X X X Xfeed stage C3 X X X X X
Continuous Variablesmass flow side stream C1 X X X X Xreflux ratio of C1 X - X - Xreflux ratio of C2 X X - X Xreflux ratio of C2 X X X X Xheat duty of C1, kW X X X X Xheat duty of C2, kW X X X X Xheat duty of C3, kW X X X X Xdiameter of C1, m X X X X Xdiameter of C2, m X X X X Xdiameter of C3, m X X X X Xdischarge pressure ofcompressor - - - - Xinterlinking flow - X X X -heat integrated E1, kW - - - - Xheat integrated E2, kW - - - - Xtotal number of variables 18 18 18 18 21
Industrial & Engineering Chemistry Research Article
DOI: 10.1021/acs.iecr.8b03646Ind. Eng. Chem. Res. 2019, 58, 6105−6120
6112
avoiding revisiting the search space through the introduction ofa so-called taboo list, leading to a reduction in thecomputational time.63 The advantage of combining the DEwith taboo list concept is a faster convergence to vicinity ofglobal optima compared with a single differential evolutionmethod and less computational time and effort.63,65 Theimplementation of the DETL method is carried out in a hybridplatform, which involves a link between Microsoft Excel andthe process simulator Aspen Plus, where the optimizationalgorithm is programmed in Excel through a Visual Basicmacro, whereas Aspen Plus is used to rigorously simulate theprocess. In general terms, all modules in the flowsheets of thecases of study were solved in Aspen by means of solving theentire set of MESH (material balances, equilibrium relation-ships, summation equations, and heat (enthalpy) balances).The DETL algorithm consists mainly of four steps which areinitialization, mutation, crossover, and evaluation-selection.63,66
In general these steps are described as follows:Initialization. In the initialization step the algorithm search
in a D-dimensional space D, where different vectors aregenerated randomly in a certain limited range of values (in thiscases feasible diameters, reflux, trays of columns, etc.) for eachdifferent generation G. All these vectors are possible solutionsfor the optimization problem and can be represented accordingto eq 8.
÷ ◊÷÷÷÷÷÷÷X X X X X, , , ...,i G G G G i G, 1, 2, 3, ,= [ ] (8)
Mutation. The mutation step can be described as a changeor disturbance occasioned by a random element (F). Startingfrom a parent vector (named target vector), this parent vectoris further muted to generate a donor vector. Finally, the mutantvector is obtained recombining both the donor and targetvector. We can write the process as eq 9
÷ ◊÷÷÷÷÷÷ ÷ ◊÷÷÷÷÷÷÷ ÷ ◊÷÷÷÷÷÷÷÷ ÷ ◊÷÷÷÷÷÷÷÷V X F X X( )i G r r r, G
rG
rG
r1, 2, 3,
= + − (9)
Where÷ ◊÷÷÷÷÷÷Vi G, is the mutant vector,
÷ ◊÷÷÷÷÷÷÷Xr G
r1,is the parent vector,
÷ ◊÷÷÷÷÷÷÷÷Xr G
r2,
and÷ ◊÷÷÷÷÷÷÷÷Xr G
r3,
are randomly vectors selected from the current
generation, and F is the mutation factor.Crossover. Following with the crossover step, the mutant
vector exchanges its components with the target vector under
this operation to form the trial vector÷ ◊÷÷÷÷÷÷÷Ui G, = ⌊u1,iG, u2,iG, u3,iG,
..., uD,iG⌋. The cross is controlled by probability factor (Cr)which has values between 0 and 1. Each uj,iG values of trialvector is generated by a randomly selection of values frommutant vector and parent vector according to eq 10.
lmooonooo
uv rand
x
if ( 0, 1 ) Cr
otherwisej i Gj i G i j
j i G, ,
, , ,
, ,
=[ ] ≤
(10)
where randi,j [0,1] is an aleatory number, and vj,i,G and xj,i,G areelements from the mutant and parent vector, respectively.Selection. Finally the evaluation-selection step is carry out
to keep the population size as a constant number, the selectionstep determines if the target or the trial vector survives fromthe generation G to the next generation G + 1. The selectionoperation is described as follows in eq 11.
÷ ◊÷÷÷÷÷÷÷÷÷÷÷÷÷ ÷ ◊÷÷÷÷÷÷÷ ÷ ◊÷÷÷÷÷÷÷ ÷ ◊÷÷÷÷÷÷÷X U f U f X
X X f U f X
if ( ) ( )
if ( ) ( )
i G i G i G i G
i G i G i G i G
, 1 , , ,
, 1 , , ,
= ≤
= >
+
+ (11)
The equation implies that if the trial vector÷ ◊÷÷÷÷÷÷÷Ui G, has a lower or
equal value of objective function f X( ) than the target vector
(÷ ◊÷÷÷÷÷÷÷÷Xi G, ), the trial vector replaces the corresponding target vector
for the next generation. Both the Tabu list concept (TL) andTaboo Search (TS) previously proposed by Glover67 avoidsrevisiting the search space by keeping a record of visited points.TL is randomly initialized at an initial population and iscontinuously updated with the newly generated trialindividuals. This taboo check is carried out in the generationstep to the trial vector, and the new trial individual is generatedrepeatedly until it is not near to any individual in the TL. Thetotal trial individuals NPs are generated by the repetition ofabove steps. The newly generated NP trial vectors arecombined with the parent population to form a combinedpopulation with total 2NP individuals.During the optimization, a vector of decision variables (this
vector can be the trial or target vector) is sent from Excel toAspen Plus using Dynamic Data Exchange (DDE) throughCOM technology. Those values are used by Aspen Plus tosimulate the process and obtain data as flow streams, purities,reboiler heat duty, etc., and these data are used for evaluate theobjective function. After simulation, Aspen Plus returns toMicrosoft Excel a resulting vector that contains the output datagenerated by Aspen. In the case that an Aspen simulationgenerated with trial vector values does not converge, the trialvector is automatically discarded. Then, Microsoft Excelanalyzes the objective function values and new vectors ofdecision variables are generated according to the DETLmethod previously explained. The values of the requiredparameters to the DETL algorithm are the following: numberof population (NP), 120 individuals; Generations Number(GenMax), 710; Tabu List size, 60 individuals; Tabu Radius,0.01; Crossover fractions (Cr), 0.8; mutation fractions (F), 0.3.These values were taken from Srinivas and Rangaiah.63,66
5. RESULTS AND DISCUSSION
This section presents the main results of the design andsimultaneous optimization considering the economic, environ-mental, and safety criteria. The results obtained satisfy theconstraints related to the purity (99.2 wt % for furfural and99.5 wt % for methanol), whereas the mass flow rate was set to6200 kg/h for furfural and 2000 kg/h for methanol. Allsequences were optimized using RADFRAC module which is arigorous model included in Aspen Plus. All optimizations werecarried out on a computer with AMD Ryzen 5-1600 @3.2GHz, and 16GB of RAM. The computing time for obtainingthe optimal pareto solutions is different for each processseparation according to the complexity: QOP required 278 h,TCC required 336 h, TEC required 328, DWCC required 350h and HIC required 345 h.The Pareto front charts are used to analyze in a simpler way
the obtained results. The objective of this section is to identifythe best option to purify furfural through the analysis of Paretofronts and performance indexes of the processes. The points ofthe Pareto fronts correspond to the 120 individuals for thegeneration 710 (last generation). After this generation thereare no more improvements in the objective functions, whichmeans that the results obtained are the optimal solutions.Figures S1−S3 shows the evolution of Pareto front through thegenerations for the TEC process as a representative case, inorder to demonstrate that the objective functions cannot be
Industrial & Engineering Chemistry Research Article
DOI: 10.1021/acs.iecr.8b03646Ind. Eng. Chem. Res. 2019, 58, 6105−6120
6113

further improved. The Pareto fronts are shown in twodimensions to simplify the analysis and the explanations ofthe results for a better understating.Figure 7 shows the Pareto chart for the eco-indicator vs total
annual cost. Each point in the plot represents a design for a
respective process separation scheme. The designs to the rightside of the graph are characterized by more stages, largerdiameters, and higher energy usage. The form of the Paretofront indicates that the eco-indicator is strongly influenced bythe steam used to supply the energy in the processes, and theelectricity necessary to pump the cooling water, whereas thesteel used for equipment exerts less influence. Previous works,as the one reported by Sanchez-Ramirez et al.,65 havedemonstrated that when steel has a strong influence in theeco-indicator, the relationship between TAC and EI99corresponds to competing objectives. As can be noticed,there are several designs for all intensified schemes that havesignificant improvements in TAC and EI99 with the exceptionof heat integrated process (HIC) that has greater eco-indicatorvalues than the benchmark configuration (Quaker OatsProcess). This increment in the EI99 index is due to theextra equipment, such as the exchangers E1, E2, and thecompressor required to integrate the heat between differentstreams.Figure 8 shows the Pareto front of IR vs TAC. These indexes
have a behavior of antagonist objectives, which means that it isnot possible to obtain a design with the lowest TAC and IR atthe same time, hence when an index improves the other one
gets worse. The individual risk depends mainly on two things,the first one is the physical properties of the substances to beseparated, for example, toxicity (LC50), flammability limits(LFL and UFL), and heat combustion, while the second one isthe amount of each component inside the columns. When thesubstances in the mixture to be separated and the topology ofthe separation schemes are analyzed, it is evident that water isthe component in the largest amount (90 wt % in the mixture)and it is removed in the first column (C1), indicating that thisequipment will have the largest size (with respect to othercolumns) and more inventory (mass inside the columns) andthus contribute more to the safety index. If the reflux andreboiler duty are large in C1, there is an increase of wateramount in the column yielding to a dilution of the organiccomponents in this equipment and thus improving the safetyindex (decreasing the risk). However, larger reflux ratios andreboiler duties involve an increment on TAC caused by theincreased use of utilities (steam and electricity). A similarbehavior occurs in the columns C2 and C3. Considering thesearguments, it should be noted that the behavior showed herebetween the individual risk and the total annual cost cannot begeneralized to all mixtures.Figure 9 shows the Pareto front of the eco-indicator and
individual risk. EI99 has the same tendency as TAC, so a
similar behavior should be expected for both indexes. Here,major reflux ratios and reboiler duty imply higher use of steamand electricity, which impacts the eco-indicator. Because of thetendencies analyzed previously, it is clear that the designschosen from the Pareto fronts should be those that have thebest equilibrium between IR vs TAC and IR vs EI99. Becausethe eco-indicator and the total annual cost have the sametendency (see Figure 7), a design should be chosen thatcompensates the individual risk with TAC, for example,automatically selects the point with the best equilibriumbetween IR and EI99.Figure 10, Figure 11, and Figure 12 show the Pareto charts
of the thermodynamic equivalent sequence (TEC) as arepresentative case. It is important to mention that all thesesequences have the same behavior for the Pareto fronts. Theblack points in these figures correspond to the design chosenfor TEC, while similar points were selected for otherseparation sequences. The black triangles were selectedaccording to the utopian point methodology. The utopicpoint corresponds to a hypothetical and ideal solution in theborder of the Pareto front where two objectives cannot
Figure 7. Pareto front between Eco-Indicator 99 and total annualcost.
Figure 8. Pareto front between individual risk and total annual cost.
Figure 9. Pareto front between individual risk and Eco-Indicator 99.
Industrial & Engineering Chemistry Research Article
DOI: 10.1021/acs.iecr.8b03646Ind. Eng. Chem. Res. 2019, 58, 6105−6120
6114

improve more and both are in equilibrium. The black trianglescorrespond to solutions closer to the utopic point according toa report by Wang and Rangaiah.68 This methodology has beenreported and implemented in several works by Contreras-Zarazua et al.,50 Sanchez-Ramirez et al.,65 Quiroz-Ramirez etal.,57 and Medina-Herrera et al.25 To demonstrate that thevalues of Pareto fronts are in the in the vicinity of the globaloptimum, the evolution of Pareto fronts through thegenerations for TEC sequences as a representative case isshown in the Figures S5−S7.The optimal design parameters and values of the objective
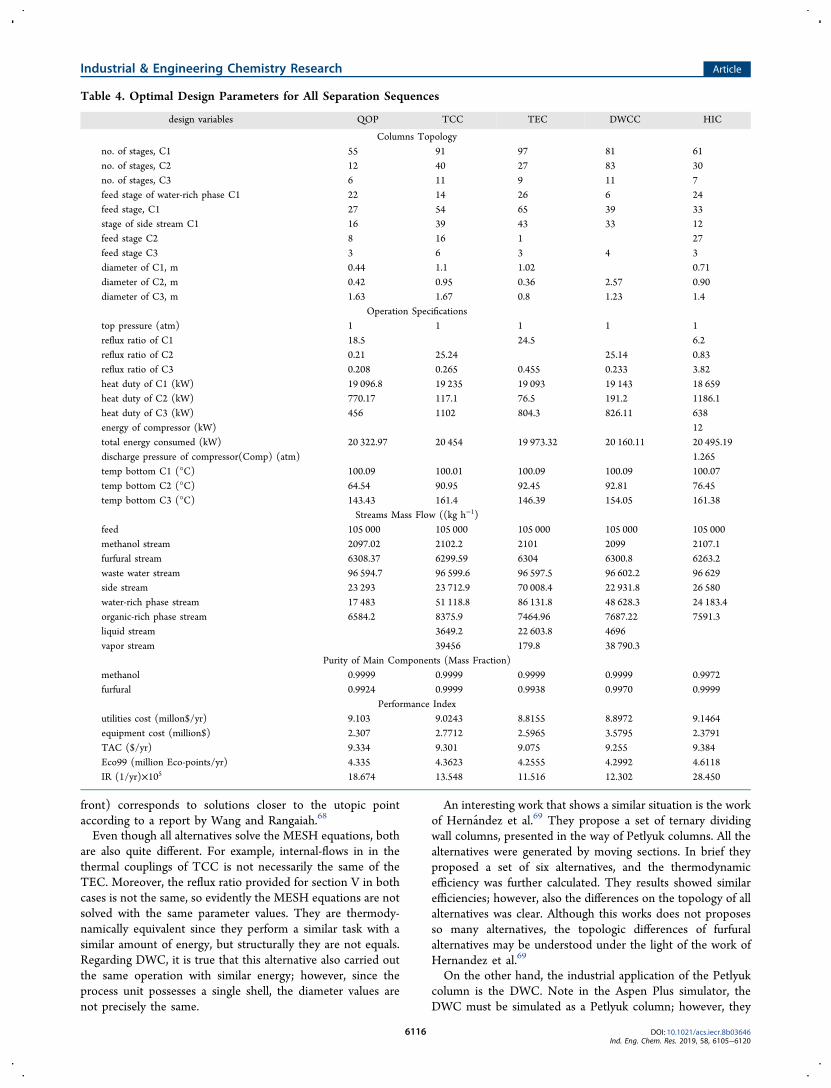
functions for all sequences are presented in Table 4. As can beobserved on Table 4, the column C1 is the largest piece of
equipment from all schemes, which confirms the explanationpreviously mentioned: C1 is the column that contributes mostto the three indexes. This column has the largest energyrequirements and size, as it separates all water from themixture. The energy required is very similar for all sequences,which leads to values of TAC and EI99 that are similar for allsequences. This can be demonstrated by observing the heatduty, the utilities cost, and the temperature of the C1 bottomgiven in Table 4.The reflux ratio on C2 and C3 are small in order to reduce
the concentration of methanol and furfural through thecolumns and thus to decrease the risk of an accident. TheQOP scheme and all alternatives (with the exception ofDWCC) show a clear tendency to reduce the number of stagesin C2 and C3 in order to abate the quantity of methanol andfurfural in the columns.Commonly, the researchers considered that dividing wall
columns offer important improvements in safety due to theseconfigurations using fewer units with respect to thermallycoupled configurations. However, this work demonstrated thatdividing wall columns do not always represent the best optionwith respect to safety. The DWC is the integration of C1 andC2 columns in a single shell, which is showed in Figure 4. Thestages and the diameter of C2 that purifies methanol need toincrease in order to integrate the two columns, which causes anincrease of the concentration and amount of methanol on theside corresponding to C2, and affecting directly the individualrisk index. This situation does not occur in thermally coupledsystems. Although DWCC is not the best alternative in termsof safety, it is an improvement compared with the QOPalternative. This improvement is caused mainly by theelimination of one condenser, and having a more dilutedconcentration of the organic substances.The TCC and TEC sequences are in theory thermodynamic
equivalents of DWC. However, the topology of the scheme hasan important role in safety. TCC and TEC have lower IR thanDWCC as the size of the C2 column is smaller than in theDWC configuration, thus reducing the inventory. TEC has thebest IR results showing a reduction of almost 40% of theinherent risk as compared with QOP. This reduction occursbecause methanol is purified in column C1 which is rich inwater, thus reducing the methanol concentration and its toxicand flammability properties, while the C2 column does notpurify methanol. The C2 column contains mainly water that ispurified and sent to the decanter to promote the two liquidphase formation. The heat integrated configuration (HIC)shows the smallest energy consumption in column C1;however, the additional units (exchangers E1, E2 andcompressor) offset the energy saving which is not reflectedin TAC and EI99. In the case of the individual risk, theseadditional units imply higher chances of a leak, affectingdirectly the safety index.According to the results it is evident that the TEC is the best
option to purify furfural, it has similar total annual cost andeco-indicator compared with the other alternatives. Never-theless, the topology of TEC process provides a greaterdilution on the organic substances which improves the safety ofprocess. Figure 13 shows a scheme of TEC process includingall mass flows and energy requirements. Table 4 summarizesthe optimal design parameters for all sequences considered.The best designs were selected according to utopian pointmethodology. The optimal design (the black triangle in Pareto
Figure 10. Pareto front between Eco-indicator 99 and total annualcost for TEC scheme.
Figure 11. Pareto front between individual risk and total annual costfor TEC scheme.
Figure 12. Pareto front between individual risk and Eco-Indicator 99for the TEC scheme.
Industrial & Engineering Chemistry Research Article
DOI: 10.1021/acs.iecr.8b03646Ind. Eng. Chem. Res. 2019, 58, 6105−6120
6115
front) corresponds to solutions closer to the utopic pointaccording to a report by Wang and Rangaiah.68
Even though all alternatives solve the MESH equations, bothare also quite different. For example, internal-flows in in thethermal couplings of TCC is not necessarily the same of theTEC. Moreover, the reflux ratio provided for section V in bothcases is not the same, so evidently the MESH equations are notsolved with the same parameter values. They are thermody-namically equivalent since they perform a similar task with asimilar amount of energy, but structurally they are not equals.Regarding DWC, it is true that this alternative also carried outthe same operation with similar energy; however, since theprocess unit possesses a single shell, the diameter values arenot precisely the same.
An interesting work that shows a similar situation is the workof Hernandez et al.69 They propose a set of ternary dividingwall columns, presented in the way of Petlyuk columns. All thealternatives were generated by moving sections. In brief theyproposed a set of six alternatives, and the thermodynamicefficiency was further calculated. They results showed similarefficiencies; however, also the differences on the topology of allalternatives was clear. Although this works does not proposesso many alternatives, the topologic differences of furfuralalternatives may be understood under the light of the work ofHernandez et al.69
On the other hand, the industrial application of the Petlyukcolumn is the DWC. Note in the Aspen Plus simulator, theDWC must be simulated as a Petlyuk column; however, they
Table 4. Optimal Design Parameters for All Separation Sequences
design variables QOP TCC TEC DWCC HIC
Columns Topologyno. of stages, C1 55 91 97 81 61no. of stages, C2 12 40 27 83 30no. of stages, C3 6 11 9 11 7feed stage of water-rich phase C1 22 14 26 6 24feed stage, C1 27 54 65 39 33stage of side stream C1 16 39 43 33 12feed stage C2 8 16 1 27feed stage C3 3 6 3 4 3diameter of C1, m 0.44 1.1 1.02 0.71diameter of C2, m 0.42 0.95 0.36 2.57 0.90diameter of C3, m 1.63 1.67 0.8 1.23 1.4
Operation Specificationstop pressure (atm) 1 1 1 1 1reflux ratio of C1 18.5 24.5 6.2reflux ratio of C2 0.21 25.24 25.14 0.83reflux ratio of C3 0.208 0.265 0.455 0.233 3.82heat duty of C1 (kW) 19 096.8 19 235 19 093 19 143 18 659heat duty of C2 (kW) 770.17 117.1 76.5 191.2 1186.1heat duty of C3 (kW) 456 1102 804.3 826.11 638energy of compressor (kW) 12total energy consumed (kW) 20 322.97 20 454 19 973.32 20 160.11 20 495.19discharge pressure of compressor(Comp) (atm) 1.265temp bottom C1 (°C) 100.09 100.01 100.09 100.09 100.07temp bottom C2 (°C) 64.54 90.95 92.45 92.81 76.45temp bottom C3 (°C) 143.43 161.4 146.39 154.05 161.38
Streams Mass Flow ((kg h−1)feed 105 000 105 000 105 000 105 000 105 000methanol stream 2097.02 2102.2 2101 2099 2107.1furfural stream 6308.37 6299.59 6304 6300.8 6263.2waste water stream 96 594.7 96 599.6 96 597.5 96 602.2 96 629side stream 23 293 23 712.9 70 008.4 22 931.8 26 580water-rich phase stream 17 483 51 118.8 86 131.8 48 628.3 24 183.4organic-rich phase stream 6584.2 8375.9 7464.96 7687.22 7591.3liquid stream 3649.2 22 603.8 4696vapor stream 39456 179.8 38 790.3
Purity of Main Components (Mass Fraction)methanol 0.9999 0.9999 0.9999 0.9999 0.9972furfural 0.9924 0.9999 0.9938 0.9970 0.9999
Performance Indexutilities cost (millon$/yr) 9.103 9.0243 8.8155 8.8972 9.1464equipment cost (million$) 2.307 2.7712 2.5965 3.5795 2.3791TAC ($/yr) 9.334 9.301 9.075 9.255 9.384Eco99 (million Eco-points/yr) 4.335 4.3623 4.2555 4.2992 4.6118IR (1/yr)×105 18.674 13.548 11.516 12.302 28.450
Industrial & Engineering Chemistry Research Article
DOI: 10.1021/acs.iecr.8b03646Ind. Eng. Chem. Res. 2019, 58, 6105−6120
6116

are different since several physical/sizing considerations mustbe taken into account. A wider explanation of the industrialimplementation is provided by Yildirim et al.70 Essentially, theyperform the same task with the same amount of energy. Inother words, they might be thermodynamically equivalent;however, they are structurally different.
6. CONCLUSIONS
The new downstream processing configurations (for furfuralpurification) proposed in this study are competitive against theQuaker Oats Process used as a benchmark. The schemesproposed in this work are azeotropic distillation systems andthey correspond to the category of heterogeneous azeotropicdistillations. These heterogeneous azeotropic schemes areformed with at least two columns. The heterogeneousazeotropic scheme can or cannot contain the use of entrainerdepending of components in the mixture to be separated andtheir respective compositions. In this case, the water has thefunction of an entrainer because it is present in highconcentration in the mixture. According to previous works(Widagdo and Seider, 1996) an azeotropic distillation column(azeotropic column) is the equipment that concentrates themixture up to the azeotrope concentration.71 Then, thedistillate or a side stream is condensed and sent to a decanterwhere one of the phases is refluxed to the column. The otherphase is sent (organic phase in this case) to a second columnwhere its purification is finalized. Finally the products in thesetwo column systems are recovered by the bottoms of thecolumns. All alternatives were optimized using a DETLalgorithm and considered the total annual cost, Eco-Indicator99, and individual risk as key performance indexes. The resultsshow that TAC and EI99 remain constant for all sequences.This occurs because column C1the unit that contributesmost to these indexesuses most of the total energy of thesequences for the separation of the bulk water present in themixture (90 wt %). This makes it difficult to improve theenergy usage, TAC, and EI99 in all cases considered. However,the optimization results show that the topology of the
intensified separation schemes has an important role on thesafety criteria which can be significantly improved by processintensification.Compared to the QOP benchmark, the intensified thermally
coupled sequences (TCC, TEC, and DWCC) exhibit majorreductions (from 27% up to 40%) of the inherent riskassociated with the lower concentration and amount of organicsubstances inside the distillation columns. For example, as theTEC process separates methanol and water in the samecolumn, this leads to a dilution of methanol in the water whichreduces their toxicity and flammability. However, the heatintegrated configuration has the worst values of the inherentrisk (52% higher IR) as this process implies the use of extraunits and a compressor, which further increases the risks.Among all sequences, the intensified TEC alternative is overallthe best option to purify furfural, being the significantly safer(about 40% lower IR) and slightly cheaper and more eco-friendly as compared with the QOP benchmark.As has been discussed, the topology of the alternatives of
this work are different. Even though the energy requirementsare similar (thermodynamic equivalents) their structure isdifferent. With this in mind, the differences associated with theIR values are understandable. However, the necessity (as futurework) to know the layout of the process for betterunderstanding of the distance among columns of the sameprocess, and the role of that distance on IR calculation, is clear.
■ ASSOCIATED CONTENT
*S Supporting InformationThe Supporting Information is available free of charge on theACS Publications website at DOI: 10.1021/acs.iecr.8b03646.
Continuous and instantaneous source models; disper-sion models; boiling liquid expanding vapor explosion(BLEVE) model; flash fire model; toxic releases;additional figures (PDF)
Figure 13. Mass flows and energy requirements for TEC process.
Industrial & Engineering Chemistry Research Article
DOI: 10.1021/acs.iecr.8b03646Ind. Eng. Chem. Res. 2019, 58, 6105−6120
6117
■ AUTHOR INFORMATIONCorresponding Author*E-mail: [email protected]. Sanchez-Ramírez: 0000-0002-4326-4837J. M. Ponce-Ortega: 0000-0002-3375-0284M. Errico: 0000-0002-2172-2921J. G. Segovia-Hernandez: 0000-0003-4175-9809NotesThe authors declare no competing financial interest.
■ ACKNOWLEDGMENTSA.A.K. gratefully acknowledges the Royal Society WolfsonResearch Merit Award.
■ NOMENCLATUREIR = individual riskTAC = total annual costEI99 = Eco-Indicator 99QOP = Quaker Oats ProcessTCC = thermally coupled configurationTEC = thermodynamic equivalent configurationDWCC = dividing-wall column configurationHIC = heat integrated configurationC1 = column 1 (azeotropic column)C2 = column 2 (methanol recovery column)C2 = column 3 (furfural recovery column)ω = weighting factor for damageci = value of impact for category ias = amount of steam utilized by the processasl = amount of steel used to build the equipmentael = amount of electricity utilized by the processf i = occurrence frequency of incident iPxy = probability of injury or decease caused by the incidentiBLEVE = boiling liquid expanding vapor explosionUVCE = unconfined vapor cloud explotionteEr = thermal radiation dosesp° = overpressure due to explosionsY = probit variableerf = error functionLC50 = lethal concentrationLFL = lower flammability limitUFL = upper flammability limitNTi = total number of stages of column iFsi = feed stages for column iRi = reflux ratio of column iVF = interconnection vapor flowLF = interconnection liquid flowDCi = diameter of column iHDi = reboiler duty for column ik = compressor capacityCij = Ci,j in the concentration of substance j in column iym = purity obtained during the simulationwm = mass obtained during the simulationum = purity requeiredxm = mass flow requieredDETL = differential evolution with Tabu listTS = Tabu searchDE = differential evolutionG = number of generations
÷ ◊÷÷÷÷÷÷Vi G, = mutant vector÷ ◊÷÷÷÷÷÷÷Xr G
ij,
, = randomly vectors from the generation G÷ ◊÷÷÷÷÷÷÷Ui G, = trial vectoruj,i,G = elements of the trial vector÷ ◊÷÷÷÷÷÷÷÷÷÷÷÷÷Xi G, 1+ = parent vector of generation G + 1NP = number of populationGenMax = maximum generation numberCr = crossover fractionF = mutation factor
■ REFERENCES(1) Steinbach, D.; Kruse, A.; Sauer, J. Pretreatment technologies oflignocellulosic biomass in water in view of furfural and 5-hydroxymethylfurfural production - A review. Biomass Convers.Biorefin. 2017, 7 (2), 247−274.(2) Top value added chemicals from biomass volume I-Results ofscreening for potential candidates from sugars and synthesis gas; U.S.Department of Energy: 2004; https://www.nrel.gov/docs/fy04osti/35523.pdf.(3) Cai, C. M.; Zhang, T.; Kumar, R.; Wyman, C. E. Integratedfurfural production as a renewable fuel and chemical platform fromlignocellulosic biomass. J. Chem. Technol. Biotechnol. 2014, 89 (1), 2−10.(4) Dros, A. B.; Larue, O.; Reimond, A.; De Campo, E.; Pera-Titus,M. Hexamethylenediamine (HDMA) from fossil- vs. bio-basedroutes: an economic and life cycle assessment comparative study.Green Chem. 2015, 17, 4760−4772.(5) Brown, L. H.; Watson, D. D. Phenol-furfural resins. Ind. Eng.Chem. 1959, 51 (5), 683−684.(6) Bhogeswararao, S.; Srinivas, D. Catalytic conversion of furfural toindustrial chemicals over supported Pt and Pd catalysts. J. Catal. 2015,327, 65−77.(7) Zeitsch, K. J.; The Chemistry and Technology of Furfural and ItsMany by-Products; Elsevier Science: Amsterdam, 2000.(8) Sun, L.; Wang, Q.; Li, L.; Zhai, J.; Liu, Y. Design and control ofextractive dividing wall column for separating benzene/cyclohexanemixtures. Ind. Eng. Chem. Res. 2014, 53, 8120−8131.(9) Cordeiro, G. M.; de Figueiredo, M. F.; Ramos, W. B.; Sales, F.A.; Brito, K. B.; Brito, R. P. Systematic strategy for ob taining adivided-wall column applied to an extractive distillation process. Ind.Eng. Chem. Res. 2017, 56, 4083−4094.(10) Nhien, L. C.; Van Duc Long, N.; Lee, M. Process design ofhybrid extraction and distillation processes through a systematicsolvent selection for furfural production. Energy Procedia 2017, 105,1084−1089.(11) Di Blasi, C.; Branca, C.; Galgano, A. Biomass screening for theproduction of furfural via thermal decomposition. Ind. Eng. Chem. Res.2010, 49, 2658−2671.(12) Mesa, L.; Morales, M.; Gonzales, E.; Cara, C.; Romero, I.;Castro, E.; Mussatto, S. I. Restructuring the process for furfural andxylose production from sugarcane bagasse in a biorefinery concept forethanol production. Chem. Eng. Process. 2014, 85, 196−202.(13) De Jong, W.; Marcotullio, G. Overview of biorefineries basedon co-production of furfural, existing concepts and novel develop-ments. Int. J. Chem. React. Eng. 2010, 8 (1), A69 DOI: 10.2202/1542-6580.2174.(14) Martín, M.; Grossmann, I. E. Optimal production of furfuraland DMF from algae and switchgrass. Ind. Eng. Chem. Res. 2016, 55(12), 3192−3202.(15) Liu, L.; Chang, H. M.; Jameel, H.; Park, S. Furfural productionfrom biomass pretreatment hydrolysate using vapor-releasing reactorsystem. Bioresour. Technol. 2018, 252, 165−171.(16) Errico, M.; Ramirez-Marquez, C.; Torres-Ortega, C. E.; Rong,B.-G.; Segovia-Hernandez, J. G. Design and control of an alternativedistillation sequence for bioethanol purification. J. Chem. Technol.Biotechnol. 2015, 90 (12), 2180−2185.
Industrial & Engineering Chemistry Research Article
DOI: 10.1021/acs.iecr.8b03646Ind. Eng. Chem. Res. 2019, 58, 6105−6120
6118

(17) Luo, H.; Bildea, C. S.; Kiss, A. A. Novel heat-pump-assistedextractive distillation for bioethanol purification. Ind. Eng. Chem. Res.2015, 54, 2208−2213.(18) Patrascu, I.; Bildea, C. S.; Kiss, A. A. Eco-efficient downstreamprocessing of biobutanol by enhanced process intensification andintegration. ACS Sustainable Chem. Eng. 2018, 6, 5452−5461.(19) Errico, M.; Sanchez-Ramirez, E.; Quiroz-Ramìrez, J. J.; Rong,B.-G.; Segovia-Hernandez, J. G. Multi objective optimal acetone-butanol-ethanol (ABE) separation systems using liquid-liquidextraction assisted divided wall columns. Ind. Eng. Chem. Res. 2017,56, 11575−11583.(20) Kiss, A. A.; Advanced distillation technologies - Design, control andapplications; Wiley: Hoboken, US, 2013.(21) Kiss, A. A. Distillation technology - Still young and full ofbreakthrough opportunities. J. Chem. Technol. Biotechnol. 2014, 89,479−498.(22) Qian, X.; Jia, S.; Skogestad, S.; Yuan, X. Design and control ofazeotropic dividing wall column for separating furfural-water mixture.Comput.-Aided Chem. Eng. 2016, 38, 409−414.(23) Ghosh, U. K.; Pradhan, N. C.; Adhikari, B. Pervaporativeseparation of furfural from aqueous solution using modifiedpolyurethaneurea membrane. Desalination 2010, 252, 1−7.(24) Medina-Herrera, N.; Jimenez-Gutierrez, A.; Mannan, M. S.Development of inherently safer distillation systems. J. Loss Prev.Process Ind. 2014, 29, 225−239.(25) Medina-Herrera, N.; Grossmann, I. E.; Mannan, M. S.;Jimenez-Gutierrez, A. An approach for solvent selection in extractivedistillation systems including safety considerations. Ind. Eng. Chem.Res. 2014, 53 (30), 12023−12031.(26) Martinez-Gomez, J.; Sanchez-Ramírez, E.; Quiroz-Ramírez, J.J.; Segovia-Hernandez, J. G.; Ponce-Ortega, J. M.; El-Halwagi, M. M.Involving economic, environmental and safety issues in the optimalpurification of biobutanol. Process Saf. Environ. Prot. 2016, 103, 365−376.(27) Martinez-Gomez, J.; Ramírez-Marquez, C.; Alcantara-Avila, J.R.; Segovia-Hernandez, J. G.; Ponce-Ortega, J. M. Intensification forthe silane production involving economic and safety objectives. Ind.Eng. Chem. Res. 2017, 56 (1), 261−269.(28) Nhien, L. C.; Van Duc Long, N.; Kim, S.; Lee, M. Design andoptimization of intensified biorefinery process for furfural productionthrough a systematic procedure. Biochem. Eng. J. 2016, 116, 166−175.(29) Marcotullio, Gianluca. The chemistry and technology of furfuralproduction in modern lignocellulose- feedstock biorefineries. Ph.D.Dissertation, TU Delft, 2011.(30) Errico, M.; Sanchez-Ramirez, E.; Quiroz-Ramírez, J. J.; Segovia-Hernandez, J. G.; Rong, B.-G. Synthesis and design of new hybridconfigurations for biobutanol purification. Comput. Chem. Eng. 2016,84, 482−492.(31) Errico, M.; Rong, B. G. Synthesis of new separation processesfor bioethanol production by extractive distillation. Sep. Purif. Technol.2012, 96, 58−67.(32) Steingaszner, P.; Balint, A.; Kojnok, M. Improvement of afurfural distillation plant. Period. Polytech. Chem. Eng. 1977, 21 (1),59−71.(33) Rong, B.-G.; Kraslawski, A.; Nystrom, L. The synthesis ofthermally coupled distillation flowsheets for separations of five-component mixtures. Comput. Chem. Eng. 2000, 24, 247−252.(34) Calzon-McConville, C. J.; Rosales-Zamora, Ma. B.; Segovia-Hernandez, J. G.; Hernandez, S.; Rico-Ramirez, V. Design andoptimization of thermally coupled distillation schemes for theseparation of multicomponent mixtures. Ind. Eng. Chem. Res. 2006,45, 724−732.(35) Errico, M.; Rong, B.-G.; Tola, G.; Turunen, I. Processintensification for the retrofit of a multicomponent distillation plant -An industrial case study. Ind. Eng. Chem. Res. 2008, 47, 1975−1980.(36) Hohmann, E. G.; Sander, M. T.; Dunford, H. 1982. A newapproach to the synthesis of multicomponent separation schemes.Chem. Eng. Commun. 1982, 17 (1−6), 273−284.
(37) Segovia-Hernandez, J. G.; Hernandez, S.; Rico-Ramırez, V.;Jimenez, A. A comparison of the feedback control behavior betweenthermally coupled and conventional distillation schemes. Comput.Chem. Eng. 2004, 28 (5), 811−819.(38) Segovia-Hernandez, J. G.; Hernandez-Vargas, E. A.; Marquez-Munoz, J. A. Control properties of thermally coupled distillationsequences for different operating conditions. Comput. Chem. Eng.2007, 31 (7), 867−87.(39) Dejanovic, I.; Matijasevic, Lj.; Olujic, Z. Dividing wall column -A breakthrough towards sustainable distilling. Chem. Eng. Process.2010, 49 (6), 559−580.(40) Gomez-Castro, F. I.; Segovia-Hernandez, J. G.; Hernandez, S.;Gutierrez-Antonio, C.; Briones-Ramírez, A. Dividing wall distillationcolumns: Optimization and control properties. Chem. Eng. Technol.2008, 31 (9), 1246−1260.(41) Kiss, A. A. Novel applications of dividing-wall columntechnology to biofuel production processes. J. Chem. Technol.Biotechnol. 2013, 88, 1387−1404.(42) Patrascu, I.; Bildea, C. S.; Kiss, A. A. Dynamics and control of aheat pump assisted extractive dividing-wall column for bioethanoldehydration. Chem. Eng. Res. Des. 2017, 119, 66−74.(43) Errico, M.; Sanchez-Ramirez, E.; Quiroz-Ramirez, J. J.; Rong,B.-G.; Segovia-Hernandez, J. G. Biobutanol purification by hybridextraction-divided wall column configurations. Comput.-Aided Chem.Eng. 2017, 40, 1027−1032.(44) Errico, M.; Rong, B.-G.; Tola, G.; Spano, M. Optimal synthesisof distillation systems for bioethanol separation. Part 2: Extractivedistillation with complex columns. Ind. Eng. Chem. Res. 2013, 52,1620−1626.(45) Rathore, R. N. S.; van Wormer, K. A.; Powers, G. J. Synthesisstrategies for multicomponent separation systems with energyintegration. AIChE J. 1974, 20 (3), 491−502.(46) Alcantara-Avila, J. R.; Gomez-Castro, F. I.; Segovia-Hernandez,J. G.; Sotowa, K. I.; Horikawa, T. Optimal design of cryogenicdistillation columns with side heat pumps for the propylene/propaneseparation. Chem. Eng. Process. 2014, 82, 112−122.(47) Shi, L.; Huang, K.; Wang, S. J.; Yu, J.; Yuan, Y.; Chen, H.;Wong, D. S. Application of vapor recompression to heterogeneousazeotropic dividing-wall distillation columns. Ind. Eng. Chem. Res.2015, 54 (46), 11592−11609.(48) Jana, A. K.; Maiti, D. Assessment of the implementation ofvapor recompression technique in batch distillation. Sep. Purif.Technol. 2013, 107, 1−10.(49) Luo, H.; Bildea, C. S.; Kiss, A. A. Novel heat-pump-assistedextractive distillation for bioethanol purification. Ind. Eng. Chem. Res.2015, 54, 2208−2213.(50) Contreras-Zarazua, G.; et al. Multi-objective optimizationinvolving cost and control properties in reactive distillation processesto produce diphenyl carbonate. Comput. Chem. Eng. 2017, 105, 185−196.(51) Zhang, Q.; Liu, M.; Zeng, A. Performance enhancement ofpressure-swing distillation process by the combined use of vaporrecompression and thermal integration. Comput. Chem. Eng. 2018,120, 30.(52) Guthrie, K. M. Capital cost estimation. Chem. Eng. 1969, 24,114−142.(53) Turton, R., Bailie, R. C., Whiting, W. B., Shaeiwitz, J. A.,Bhattacharyya, D.; Analysis, Synthesis and design of chemical processes,4th ed.; Prentice Hall: 2012.(54) Goedkoop, M.; Spriensma, R.; The Eco-Indicator 99. A DamageOriented Method for Life Cycle Impact Assessment; Methodology reportnr. 1999/36A; Pre Product Ecology Consultants: 2001.(55) Guillen-Gosalbez, G.; Caballero, J. A.; Jimenez, L. Applicationof life cycle assessment to the structural optimization of processflowsheets. Ind. Eng. Chem. Res. 2008, 47 (3), 777−789.(56) Alexander, B.; Barton, G.; Petrie, J.; Romagnoli, J. Processsynthesis and optimization tools for environmental design: method-ology and structure. Comput. Chem. Eng. 2000, 24 (2−7), 1195−1200.
Industrial & Engineering Chemistry Research Article
DOI: 10.1021/acs.iecr.8b03646Ind. Eng. Chem. Res. 2019, 58, 6105−6120
6119

(57) Quiroz-Ramírez, J. J.; Sanchez-Ramírez, E.; Hernandez-Castro,S.; Segovia-Hernandez, J. G.; Ponce- Ortega, J. M. Optimal planningof feedstock for butanol production considering economic andenvironmental aspects. ACS Sustainable Chem. Eng. 2017, 5 (5),4018−4030.(58) Mettier, T.; Der Vergleich von Schutzgitern-Ausgewihlte Resultateeiner Panelbefragung. tze zum Vergleich von Umweltsch; ETH Zurich:Switzerland, 1999.(59) American Institute of Chemical Engineers. Guidelines forchemical Process Quantitative Risk Analysis; John Wiley & Sons: NewYork, NY, USA, 2000.(60) Crowl, Daniel A.; Louvar, Joseph F. Chemical process safety:fundamentals with applications; Pearson Education: 2001.(61) National Institute for Occupational Safety and Health(NIOSH), https://www.cdc.gov/niosh/index.htm (accessed 2018).(62) Gorak, Andrzej; Zarko, Olujic, Eds. Distillation: equipment andprocesses; Academic Press: 2014.(63) Rangaiah, G. P.; Stochastic global optimization: Techniques andapplications in chemical engineering; World Scientific: 2010.(64) Storn, R.; Price, K. Differential evolution−a simple and efficientheuristic for global optimization over continuous spaces. Journal ofGlobal Optimization 1997, 11 (4), 341−359.(65) Sanchez-Ramírez, E.; Quiroz-Ramírez, J. J.; Segovia-Hernandez,J. G.; Hernandez, S.; Ponce-Ortega, J. M. Economic and environ-mental optimization of the biobutanol purification process. CleanTechnol. Environ. Policy 2016, 18 (2), 395−411.(66) Srinivas, M.; Rangaiah, G. P. Differential evolution with TL forsolving nonlinear and mixed-integer nonlinear programming prob-lems. Ind. Eng. Chem. Res. 2007, 46, 7126−7135.(67) Glover, F. Tabu searchpart I. ORSA. Journal on computing1989, 1 (3), 190−206.(68) Wang, Z.; Rangaiah, G. P. Application and analysis of methodsfor selecting an optimal solution from the Pareto-optimal frontobtained by multiobjective optimization. Ind. Eng. Chem. Res. 2017,56 (2), 560−574.(69) Hernandez, S.; Segovia-Hernandez, J. G.; Rico-Ramírez, V.Thermodynamically equivalent distillation schemes to the Petlyukcolumn for ternary mixtures. Energy 2006, 31 (12), 2176−2183.(70) Yildirim, O.; Kiss, A. A.; Kenig, E. Y. Dividing wall columns inchemical process industry: a review on current activities. Sep. Purif.Technol. 2011, 80 (3), 403−417.(71) Widagdo, S.; Seider, W. D. Azeotropic Distillation. AIChE J.1996, 42, 96−130.
Industrial & Engineering Chemistry Research Article
DOI: 10.1021/acs.iecr.8b03646Ind. Eng. Chem. Res. 2019, 58, 6105−6120
6120