Embed Size (px)
Citation preview
1insight.jci.org https://doi.org/10.1172/jci.insight.90777
R E S E A R C H A R T I C L E
Conflict of interest: The authors have declared that no conflict of interest exists.
Submitted: September 20, 2016 Accepted: February 1, 2017 Published: April 6, 2017
Reference information: JCI Insight. 2017;2(7):e90777. https://doi.org/10.1172/jci.insight.90777.
Inhibition of neuronal ferroptosis protects hemorrhagic brainQian Li,1 Xiaoning Han,1 Xi Lan,1 Yufeng Gao,1 Jieru Wan,1 Frederick Durham,1 Tian Cheng,1 Jie Yang,1 Zhongyu Wang,1 Chao Jiang,1 Mingyao Ying,2,3 Raymond C. Koehler,1 Brent R. Stockwell,4 and Jian Wang1
1Department of Anesthesiology and Critical Care Medicine, 2Department of Neurology, Johns Hopkins University, School of
Medicine, Baltimore, Maryland, USA. 3Hugo W. Moser Research Institute at Kennedy Krieger, Baltimore, Maryland, USA. 4Department of Biological Sciences and Department of Chemistry, Columbia University, New York, New York, USA.
IntroductionSpontaneous intracerebral hemorrhage (ICH) causes high mortality and morbidity, but effective therapies are lacking and research efforts lag behind those for ischemic stroke (1). ICH occurs when a weakened vessel ruptures and bleeds into the surrounding brain (2). The blood accumulates and compresses the sur-rounding brain tissue, causing tissue damage and neuronal death (3, 4). Evidence from preclinical and clini-cal studies suggests that toxins released from an intracerebral hematoma may contribute to brain damage after ICH (2, 4–8). One putative neurotoxin is hemoglobin (Hb)/heme, the most abundant protein in blood, which is released from lysed erythrocytes after ICH. Hb can be taken into microglia and metabolized into ferrous/ferric iron, which induces lethal reactive oxygen species (ROS) (8). The iron released from Hb is transported out of microglia, but rather than stimulating ROS generation inside the cells, it forms highly toxic hydroxyl radicals that attack DNA, proteins, and lipid membranes, thereby disrupting cellular func-tion and causing neuronal death (9–12). Thus, a potential therapy for treating ICH is either reducing Hb/iron–induced toxicity (2, 8, 13) or rescuing neurons directly.
Various forms of cell death have been identified after ICH, including apoptosis (14–18) and necro-sis (15, 19) in humans and experimental animals, and autophagic cell death (20, 21) in animal models. Although inhibiting apoptosis, necrosis, and autophagy can improve outcomes in animals subjected to experimental ICH (17, 19, 21), caspase inhibitors have failed to inhibit neuronal death induced by Hb (22), and no successful clinical trials using any single cell-death inhibitor have been reported. These facts suggest that multiple forms of cell death may occur after ICH and contribute collectively to neuronal death. Indeed, a recent study showed that necrosis occurs earlier than apoptosis, and that both contribute to cell demise after ICH (19). Additionally, both apoptosis and necrosis were observed in brain sections from ICH patients (15, 23). We wondered if another form of cell death occurs after ICH and if using a combination of cell death inhibitors would improve neuronal rescue after ICH.
Intracerebral hemorrhage (ICH) causes high mortality and morbidity, but our knowledge of post-ICH neuronal death and related mechanisms is limited. In this study, we first demonstrated that ferroptosis, a newly identified form of cell death, occurs in the collagenase-induced ICH model in mice. We found that administration of ferrostatin-1, a specific inhibitor of ferroptosis, prevented neuronal death and reduced iron deposition induced by hemoglobin in organotypic hippocampal slice cultures (OHSCs). Mice treated with ferrostatin-1 after ICH exhibited marked brain protection and improved neurologic function. Additionally, we found that ferrostatin-1 reduced lipid reactive oxygen species production and attenuated the increased expression level of PTGS2 and its gene product cyclooxygenase-2 ex vivo and in vivo. Moreover, ferrostatin-1 in combination with other inhibitors that target different forms of cell death prevented hemoglobin-induced cell death in OHSCs and human induced pluripotent stem cell–derived neurons better than any inhibitor alone. These results indicate that ferroptosis contributes to neuronal death after ICH, that administration of ferrostatin-1 protects hemorrhagic brain, and that cyclooxygenase-2 could be a biomarker of ferroptosis. The insights gained from this study will advance our knowledge of the post-ICH cell death cascade and be essential for future preclinical studies.
Downloaded from http://insight.jci.org on April 6, 2017. https://doi.org/10.1172/jci.insight.90777
2insight.jci.org https://doi.org/10.1172/jci.insight.90777
R E S E A R C H A R T I C L E
Recently, ferroptosis, an iron-dependent form of nonapoptotic cell death, was identified in cancer cells and mouse embryonic development (24–26). Ferroptosis is distinguishable from other forms of regulated cell death in that it does not require caspases (mediators of apoptosis and pyroptosis), ATP depletion or mitochondrial ROS generation (mediators of necroptosis), Bax/Bak (essential mediators of mitochondrial outer membrane permeabilization), or elevations in intracellular Ca2+ (26). Ferroptosis is triggered by eras-tin, RSL3, glutamate, glutamine, and transferrin (24, 26, 27); it is regulated by the lipid repair enzyme glutathione peroxidase 4 (GPx4) (24, 28, 29); it is driven by Fe2+-dependent lipid oxidation (24, 26); and it is suppressed by the lipid ROS inhibitor ferrostatin-1 (Fer-1), iron chelators (e.g., desferrioxamine), and lipophilic antioxidants (α-tocopherol, butylated hydroxytoluene, and β-carotene) (24–26). Ferroptosis is associated with shrunken mitochondria (morphologically) and requires a unique set of genes (genetically): IREB2, CS, RPL8, and ATP5G3 (26); in addition, PTGS2 is induced in cells undergoing ferroptosis (28). Notably, PTGS2 encodes cyclooxygenase-2 (COX-2), which is highly expressed in neurons after ICH, and inhibiting COX-2 reduces ICH-induced secondary brain injury (30, 31). The goal of this study was to inves-tigate whether ferroptosis occurs after ICH and whether inhibition of ferroptosis inhibits neuronal death and improves early ICH outcomes. Additionally, we examined which responding genes are associated with ICH-induced ferroptosis. The insights gained from this study will advance our knowledge of cell death sig-naling pathways after ICH and will be essential for planning future preclinical ICH studies.
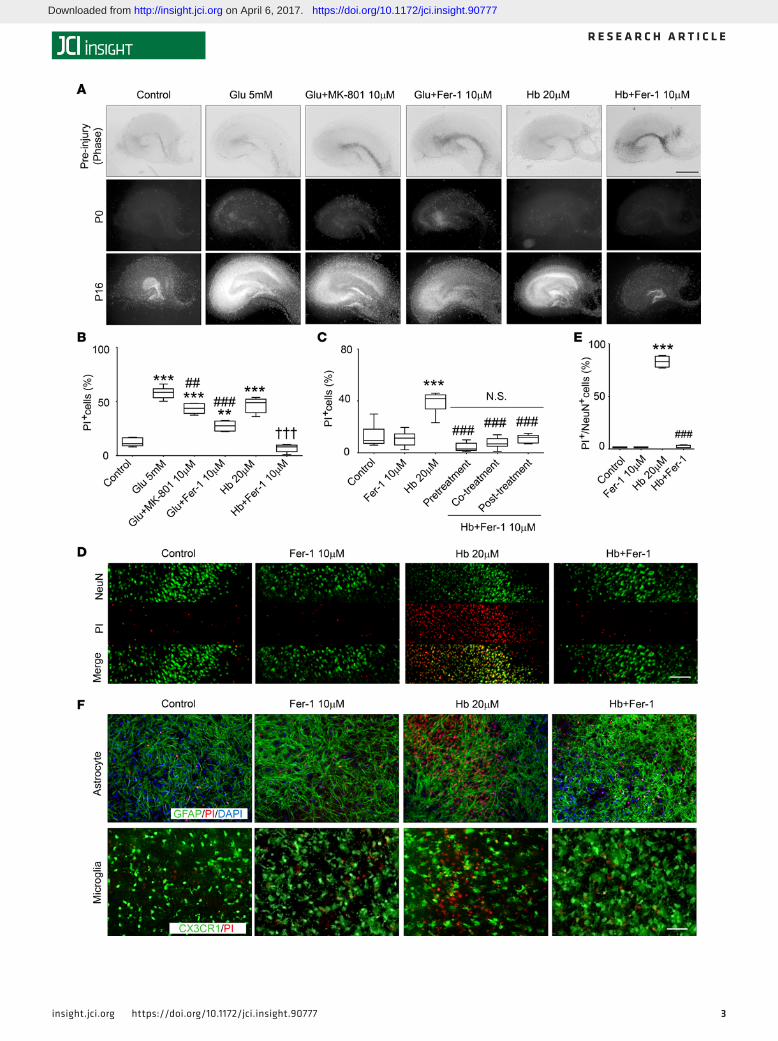
ResultsFer-1 inhibits Hb-induced neuronal death in organotypic hippocampal slice cultures. To determine whether Hb induces cell death in organotypic hippocampal slice cultures (OHSCs) and if the ferroptosis-inhibitor Fer-1 inhibits cell death induced by Hb, we exposed cultured OHSCs from C57BL/6 mouse pups to Hb and assessed cell death with propidium iodide (PI) staining. Hb induced cell death both dose- and time-dependently (Supplemental Figure 1A; supplemental material available online with this article; https://doi.org/10.1172/jci.insight.90777DS1). Hb at 20 μM caused cell death in dentate gyrus and hippocampal CA1 and CA3 regions that was comparable to that produced by 16-hour exposure to glutamate (5 mM) (control: 12.6% ± 4.0%; glutamate: 57.9% ± 5.4%; Hb: 47.3% ± 4.8%; Figure 1, A and B). We also treated OHSCs with different dosages of Fer-1 to determine an effective dose range and found the most effective dose to be 10 μM (Supplemental Figure 1B). Treatment with 10 μM Fer-1 for 30 minutes before glutamate or Hb exposure significantly prevented cell death; the glutamate antagonist MK-801 served as a positive control (Figure 1, A and B) (26). We further added Fer-1 30 minutes before (pretreatment), simultaneously with (cotreatment), or 30 minutes after Hb (posttreatment; Figure 1C). Fer-1 inhibited Hb-induced cell death effectively in all groups (Hb: 37.6% ± 9.6%; pretreatment: 4.3% ± 3.3%; cotreatment: 8.4% ± 6.2%; posttreatment: 10.8% ± 3.3%; P < 0.001; Figure 1C). No significant difference was present between the 3 Fer-1–treated groups (P > 0.05; Figure 1C), and Fer-1 exhibited no toxicity. We used cotreatment for addi-tional in vitro experiments.
Next we used immunostaining of OHSCs to examine which was the primary cell population that was injured by Hb and rescued by Fer-1. We found that NeuN (specific marker for neurons) and PI were colo-calized after Hb exposure and that Fer-1 significantly reduced Hb-induced neuronal death from 83.0% ± 5.5% to 2.0% ± 1.4% (P < 0.001; Figure 1, D and E). We did not observe colocalization of the astrocyte marker glial fibrillary acidic protein (GFAP) or CX3CR1GFP/+ (microglial marker) with PI (Figure 1F). We further tested the protective effect of Fer-1 on Hb-induced neuronal death in OHSCs by Western blotting. Hb remarkably decreased the expression of NeuN, and Fer-1 markedly rescued its expression. As a nega-tive control, we examined the expression of cleaved caspase-3, which is a biomarker for apoptosis. Fer-1 did not decrease Hb-induced cleavage of procaspase-3 to the active form (Supplemental Figure 1C; see complete unedited blots in the supplemental material), suggesting that Fer-1 at this concentration does not block the uptake of Hb into the cells and may not inhibit apoptotic cell death.
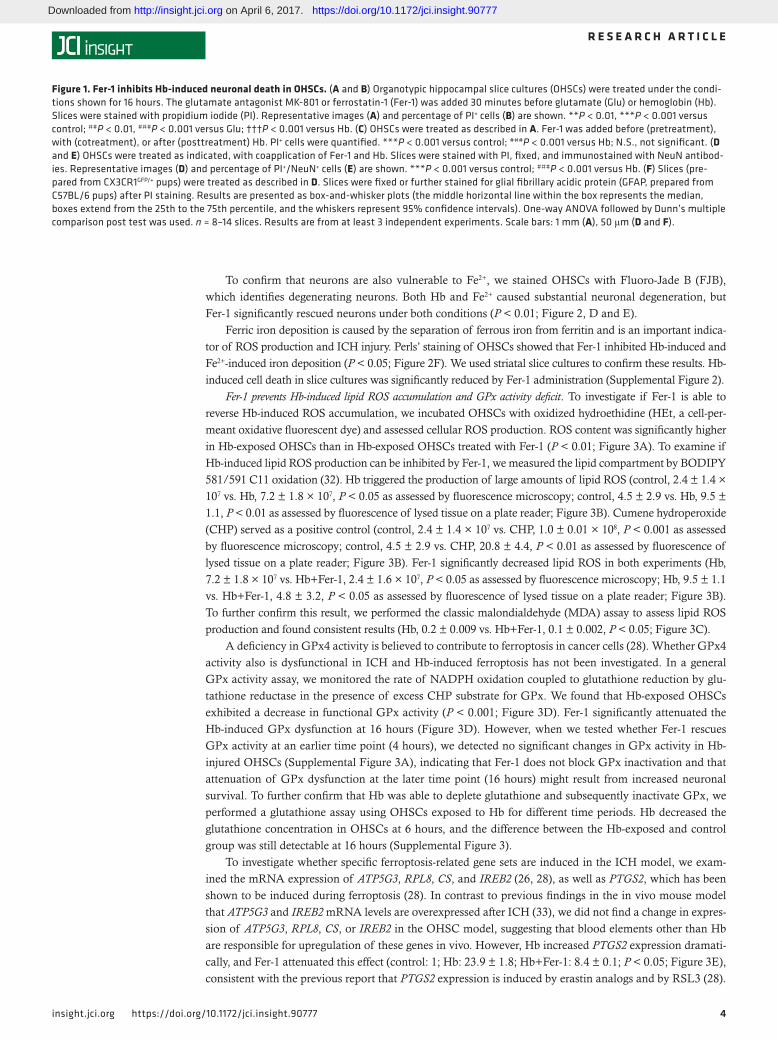
Fer-1 inhibits ferrous iron–induced neuronal death in OHSCs. Hb releases iron and induces large amounts of ROS after ICH. To further investigate if Fer-1 also reduces iron-induced cell death, we treated OHSCs with 0.2 mM Fe2+ in the presence or absence of Fer-1. As with Hb-induced cell death, Fer-1 reduced Fe2+-induced cell death from 54.8% ± 12.0% to 19.0% ± 2.6% (P < 0.05; Figure 2, A and B). In addition, we collected media from OHSCs to assess cell death with the lactate dehydrogenase (LDH) assay. The results were consistent with those of PI staining. Fer-1 significantly decreased both Hb-induced and Fe2+-induced LDH release (both P < 0.05; Figure 2C).
Downloaded from http://insight.jci.org on April 6, 2017. https://doi.org/10.1172/jci.insight.90777
3insight.jci.org https://doi.org/10.1172/jci.insight.90777
R E S E A R C H A R T I C L E
Downloaded from http://insight.jci.org on April 6, 2017. https://doi.org/10.1172/jci.insight.90777
4insight.jci.org https://doi.org/10.1172/jci.insight.90777
R E S E A R C H A R T I C L E
To confirm that neurons are also vulnerable to Fe2+, we stained OHSCs with Fluoro-Jade B (FJB), which identifies degenerating neurons. Both Hb and Fe2+ caused substantial neuronal degeneration, but Fer-1 significantly rescued neurons under both conditions (P < 0.01; Figure 2, D and E).
Ferric iron deposition is caused by the separation of ferrous iron from ferritin and is an important indica-tor of ROS production and ICH injury. Perls’ staining of OHSCs showed that Fer-1 inhibited Hb-induced and Fe2+-induced iron deposition (P < 0.05; Figure 2F). We used striatal slice cultures to confirm these results. Hb-induced cell death in slice cultures was significantly reduced by Fer-1 administration (Supplemental Figure 2).
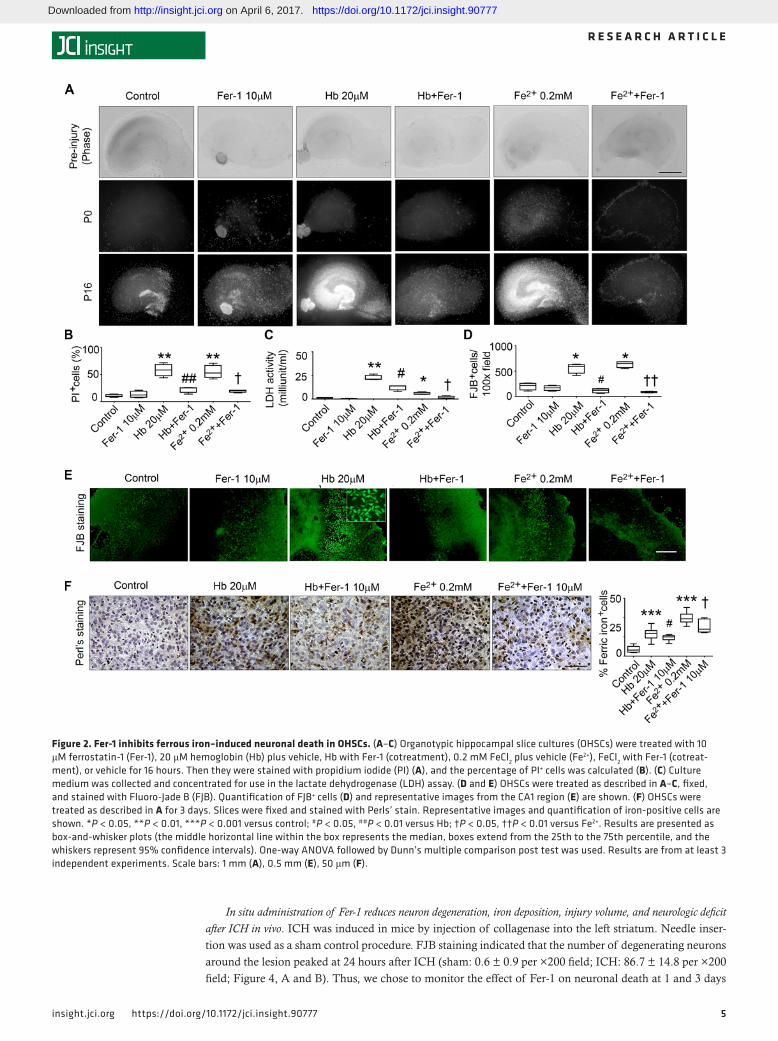
Fer-1 prevents Hb-induced lipid ROS accumulation and GPx activity deficit. To investigate if Fer-1 is able to reverse Hb-induced ROS accumulation, we incubated OHSCs with oxidized hydroethidine (HEt, a cell-per-meant oxidative fluorescent dye) and assessed cellular ROS production. ROS content was significantly higher in Hb-exposed OHSCs than in Hb-exposed OHSCs treated with Fer-1 (P < 0.01; Figure 3A). To examine if Hb-induced lipid ROS production can be inhibited by Fer-1, we measured the lipid compartment by BODIPY 581/591 C11 oxidation (32). Hb triggered the production of large amounts of lipid ROS (control, 2.4 ± 1.4 × 10⁷ vs. Hb, 7.2 ± 1.8 × 10⁷, P < 0.05 as assessed by fluorescence microscopy; control, 4.5 ± 2.9 vs. Hb, 9.5 ± 1.1, P < 0.01 as assessed by fluorescence of lysed tissue on a plate reader; Figure 3B). Cumene hydroperoxide (CHP) served as a positive control (control, 2.4 ± 1.4 × 10⁷ vs. CHP, 1.0 ± 0.01 × 10⁸, P < 0.001 as assessed by fluorescence microscopy; control, 4.5 ± 2.9 vs. CHP, 20.8 ± 4.4, P < 0.01 as assessed by fluorescence of lysed tissue on a plate reader; Figure 3B). Fer-1 significantly decreased lipid ROS in both experiments (Hb, 7.2 ± 1.8 × 10⁷ vs. Hb+Fer-1, 2.4 ± 1.6 × 10⁷, P < 0.05 as assessed by fluorescence microscopy; Hb, 9.5 ± 1.1 vs. Hb+Fer-1, 4.8 ± 3.2, P < 0.05 as assessed by fluorescence of lysed tissue on a plate reader; Figure 3B). To further confirm this result, we performed the classic malondialdehyde (MDA) assay to assess lipid ROS production and found consistent results (Hb, 0.2 ± 0.009 vs. Hb+Fer-1, 0.1 ± 0.002, P < 0.05; Figure 3C).
A deficiency in GPx4 activity is believed to contribute to ferroptosis in cancer cells (28). Whether GPx4 activity also is dysfunctional in ICH and Hb-induced ferroptosis has not been investigated. In a general GPx activity assay, we monitored the rate of NADPH oxidation coupled to glutathione reduction by glu-tathione reductase in the presence of excess CHP substrate for GPx. We found that Hb-exposed OHSCs exhibited a decrease in functional GPx activity (P < 0.001; Figure 3D). Fer-1 significantly attenuated the Hb-induced GPx dysfunction at 16 hours (Figure 3D). However, when we tested whether Fer-1 rescues GPx activity at an earlier time point (4 hours), we detected no significant changes in GPx activity in Hb-injured OHSCs (Supplemental Figure 3A), indicating that Fer-1 does not block GPx inactivation and that attenuation of GPx dysfunction at the later time point (16 hours) might result from increased neuronal survival. To further confirm that Hb was able to deplete glutathione and subsequently inactivate GPx, we performed a glutathione assay using OHSCs exposed to Hb for different time periods. Hb decreased the glutathione concentration in OHSCs at 6 hours, and the difference between the Hb-exposed and control group was still detectable at 16 hours (Supplemental Figure 3).
To investigate whether specific ferroptosis-related gene sets are induced in the ICH model, we exam-ined the mRNA expression of ATP5G3, RPL8, CS, and IREB2 (26, 28), as well as PTGS2, which has been shown to be induced during ferroptosis (28). In contrast to previous findings in the in vivo mouse model that ATP5G3 and IREB2 mRNA levels are overexpressed after ICH (33), we did not find a change in expres-sion of ATP5G3, RPL8, CS, or IREB2 in the OHSC model, suggesting that blood elements other than Hb are responsible for upregulation of these genes in vivo. However, Hb increased PTGS2 expression dramati-cally, and Fer-1 attenuated this effect (control: 1; Hb: 23.9 ± 1.8; Hb+Fer-1: 8.4 ± 0.1; P < 0.05; Figure 3E), consistent with the previous report that PTGS2 expression is induced by erastin analogs and by RSL3 (28).
Figure 1. Fer-1 inhibits Hb-induced neuronal death in OHSCs. (A and B) Organotypic hippocampal slice cultures (OHSCs) were treated under the condi-tions shown for 16 hours. The glutamate antagonist MK-801 or ferrostatin-1 (Fer-1) was added 30 minutes before glutamate (Glu) or hemoglobin (Hb). Slices were stained with propidium iodide (PI). Representative images (A) and percentage of PI+ cells (B) are shown. **P < 0.01, ***P < 0.001 versus control; ##P < 0.01, ###P < 0.001 versus Glu; †††P < 0.001 versus Hb. (C) OHSCs were treated as described in A. Fer-1 was added before (pretreatment), with (cotreatment), or after (posttreatment) Hb. PI+ cells were quantified. ***P < 0.001 versus control; ###P < 0.001 versus Hb; N.S., not significant. (D and E) OHSCs were treated as indicated, with coapplication of Fer-1 and Hb. Slices were stained with PI, fixed, and immunostained with NeuN antibod-ies. Representative images (D) and percentage of PI+/NeuN+ cells (E) are shown. ***P < 0.001 versus control; ###P < 0.001 versus Hb. (F) Slices (pre-pared from CX3CR1GFP/+ pups) were treated as described in D. Slices were fixed or further stained for glial fibrillary acidic protein (GFAP, prepared from C57BL/6 pups) after PI staining. Results are presented as box-and-whisker plots (the middle horizontal line within the box represents the median, boxes extend from the 25th to the 75th percentile, and the whiskers represent 95% confidence intervals). One-way ANOVA followed by Dunn’s multiple comparison post test was used. n = 8–14 slices. Results are from at least 3 independent experiments. Scale bars: 1 mm (A), 50 μm (D and F).
Downloaded from http://insight.jci.org on April 6, 2017. https://doi.org/10.1172/jci.insight.90777
5insight.jci.org https://doi.org/10.1172/jci.insight.90777
R E S E A R C H A R T I C L E
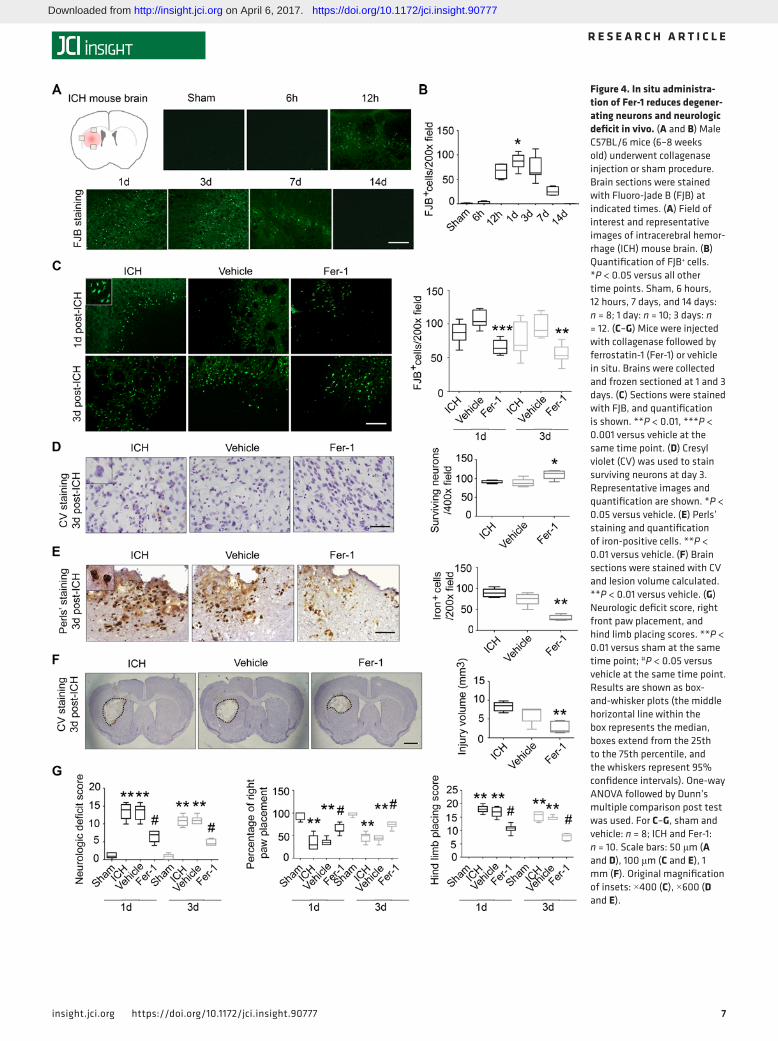
In situ administration of Fer-1 reduces neuron degeneration, iron deposition, injury volume, and neurologic deficit after ICH in vivo. ICH was induced in mice by injection of collagenase into the left striatum. Needle inser-tion was used as a sham control procedure. FJB staining indicated that the number of degenerating neurons around the lesion peaked at 24 hours after ICH (sham: 0.6 ± 0.9 per ×200 field; ICH: 86.7 ± 14.8 per ×200 field; Figure 4, A and B). Thus, we chose to monitor the effect of Fer-1 on neuronal death at 1 and 3 days
Figure 2. Fer-1 inhibits ferrous iron–induced neuronal death in OHSCs. (A–C) Organotypic hippocampal slice cultures (OHSCs) were treated with 10 μM ferrostatin-1 (Fer-1), 20 μM hemoglobin (Hb) plus vehicle, Hb with Fer-1 (cotreatment), 0.2 mM FeCl2 plus vehicle (Fe2+), FeCl2 with Fer-1 (cotreat-ment), or vehicle for 16 hours. Then they were stained with propidium iodide (PI) (A), and the percentage of PI+ cells was calculated (B). (C) Culture medium was collected and concentrated for use in the lactate dehydrogenase (LDH) assay. (D and E) OHSCs were treated as described in A–C, fixed, and stained with Fluoro-Jade B (FJB). Quantification of FJB+ cells (D) and representative images from the CA1 region (E) are shown. (F) OHSCs were treated as described in A for 3 days. Slices were fixed and stained with Perls’ stain. Representative images and quantification of iron-positive cells are shown. *P < 0.05, **P < 0.01, ***P < 0.001 versus control; #P < 0.05, ##P < 0.01 versus Hb; †P < 0.05, ††P < 0.01 versus Fe2+. Results are presented as box-and-whisker plots (the middle horizontal line within the box represents the median, boxes extend from the 25th to the 75th percentile, and the whiskers represent 95% confidence intervals). One-way ANOVA followed by Dunn’s multiple comparison post test was used. Results are from at least 3 independent experiments. Scale bars: 1 mm (A), 0.5 mm (E), 50 μm (F).
Downloaded from http://insight.jci.org on April 6, 2017. https://doi.org/10.1172/jci.insight.90777
6insight.jci.org https://doi.org/10.1172/jci.insight.90777
R E S E A R C H A R T I C L E
after ICH. To verify the efficacy of Fer-1, we injected 1 pmol of Fer-1 (in 1 μl 0.01% DMSO in saline) immediately after collagenase injection at the same site. Despite the demonstrated metabolic and plasma instability of Fer-1, we suspected that local administration would allow for a protective effect, particularly at high doses, as was reported for a kidney degeneration model (34). Vehicle (1 μl 0.01% DMSO in saline) injection was used as a control. Another 2 sets of animals received collagenase injection only (ICH) or
Figure 3. Fer-1 reduces Hb-induced lipid ROS and ameliorates glutathione peroxidase (GPx) activity reduction in OHSCs. Organotypic hippocampal slice cultures (OHSCs) were treated with 10 μM ferrostatin-1 (Fer-1) and 20 μM hemoglobin (Hb) alone or in combination for 16 hours. (A) ROS were measured by quantifying fluorescence intensity after incubation with hydroethidine (HEt). Representative images and quantification are shown. **P < 0.01 versus control; ###P < 0.001 versus Hb. (B) Lipid ROS were measured with BODIPY 581/591 C11 reagent, and images were taken under a fluorescence microscope. Slices were then lysed and fluorescence intensity measured on a microplate reader. Cumene hydroperoxide (CHP) treatment was used as a positive control. Representative images and quantification are shown. *P < 0.05, **P < 0.01, ***P < 0.001 versus control; #P < 0.05 versus Hb. (C) Lipid ROS were measured with a malondialdehyde (MDA) assay. *P < 0.05 versus control; #P < 0.05 versus Hb. (D) GPx activity was measured with a GPx assay kit. **P < 0.01, ***P < 0.001 versus control; #P < 0.05 versus Hb. (E) mRNA was extracted from the OHSCs, and reverse transcriptase real-time PCR was carried out with different primers. GAPDH was used as an internal control, and results are shown as fold change of control. *P < 0.05 versus control; #P < 0.05 versus Hb. Results are represented as box-and-whisker plots (A–C; the middle horizontal line within the box represents the median, boxes extend from the 25th to the 75th percentile, and the whiskers represent 95% confidence intervals) or mean ± SD (D and E). Statistical tests used were 1-way ANOVA followed by Dunn’s multiple comparison post test (A–C, and E) and repeated measurement followed by Tukey’s multiple comparison (D). Results are from at least 3 indepen-dent experiments. Scale bars: 1 mm (A), 100 μm (B).
Downloaded from http://insight.jci.org on April 6, 2017. https://doi.org/10.1172/jci.insight.90777
7insight.jci.org https://doi.org/10.1172/jci.insight.90777
R E S E A R C H A R T I C L E
Figure 4. In situ administra-tion of Fer-1 reduces degener-ating neurons and neurologic deficit in vivo. (A and B) Male C57BL/6 mice (6–8 weeks old) underwent collagenase injection or sham procedure. Brain sections were stained with Fluoro-Jade B (FJB) at indicated times. (A) Field of interest and representative images of intracerebral hemor-rhage (ICH) mouse brain. (B) Quantification of FJB+ cells. *P < 0.05 versus all other time points. Sham, 6 hours, 12 hours, 7 days, and 14 days: n = 8; 1 day: n = 10; 3 days: n = 12. (C–G) Mice were injected with collagenase followed by ferrostatin-1 (Fer-1) or vehicle in situ. Brains were collected and frozen sectioned at 1 and 3 days. (C) Sections were stained with FJB, and quantification is shown. **P < 0.01, ***P < 0.001 versus vehicle at the same time point. (D) Cresyl violet (CV) was used to stain surviving neurons at day 3. Representative images and quantification are shown. *P < 0.05 versus vehicle. (E) Perls’ staining and quantification of iron-positive cells. **P < 0.01 versus vehicle. (F) Brain sections were stained with CV and lesion volume calculated. **P < 0.01 versus vehicle. (G) Neurologic deficit score, right front paw placement, and hind limb placing scores. **P < 0.01 versus sham at the same time point; #P < 0.05 versus vehicle at the same time point. Results are shown as box-and-whisker plots (the middle horizontal line within the box represents the median, boxes extend from the 25th to the 75th percentile, and the whiskers represent 95% confidence intervals). One-way ANOVA followed by Dunn’s multiple comparison post test was used. For C–G, sham and vehicle: n = 8; ICH and Fer-1: n = 10. Scale bars: 50 μm (A and D), 100 μm (C and E), 1 mm (F). Original magnification of insets: ×400 (C), ×600 (D and E).
Downloaded from http://insight.jci.org on April 6, 2017. https://doi.org/10.1172/jci.insight.90777
8insight.jci.org https://doi.org/10.1172/jci.insight.90777
R E S E A R C H A R T I C L E
needle insertion only (sham). After 1 or 3 days, we stained brain sections with FJB. We found that Fer-1 decreased the number of FJB-positive cells compared with that in the vehicle group at both time points (both P < 0.01; Figure 4C). To further verify that Fer-1 reduces neuronal death after ICH, we stained sec-tions with Cresyl violet (CV) and found that Fer-1 administration significantly increased surviving neurons around the lesion at 3 days after ICH (P < 0.05; Figure 4D).
To evaluate the effects of Fer-1 on iron deposition and injury volume, we stained sections with Perls’ stain. The Fer-1–treated group had significantly less iron deposition (29.6 ± 6.4) than did the vehicle group (74.5 ± 14.8) at day 3 (P < 0.01; Figure 4E). We further stained the brain slices with CV every 120 μm throughout the entire striatum, and quantified the injury volume of each group at day 3. Injury volume was significantly smaller in the Fer-1–treated group than in the vehicle group (P < 0.01; Figure 4F).
At both 1 and 3 days after ICH, we found that, compared with vehicle-treated ICH mice, Fer-1–treated ICH mice had significantly reduced neurologic deficit (P < 0.05; Figure 4G), less right forelimb muscle weakness (P < 0.05; Figure 4G), and less hind limb muscle weakness (P < 0.05; Figure 4G); however, Fer-1 failed to correct corner turn preference (Supplemental Figure 4A).
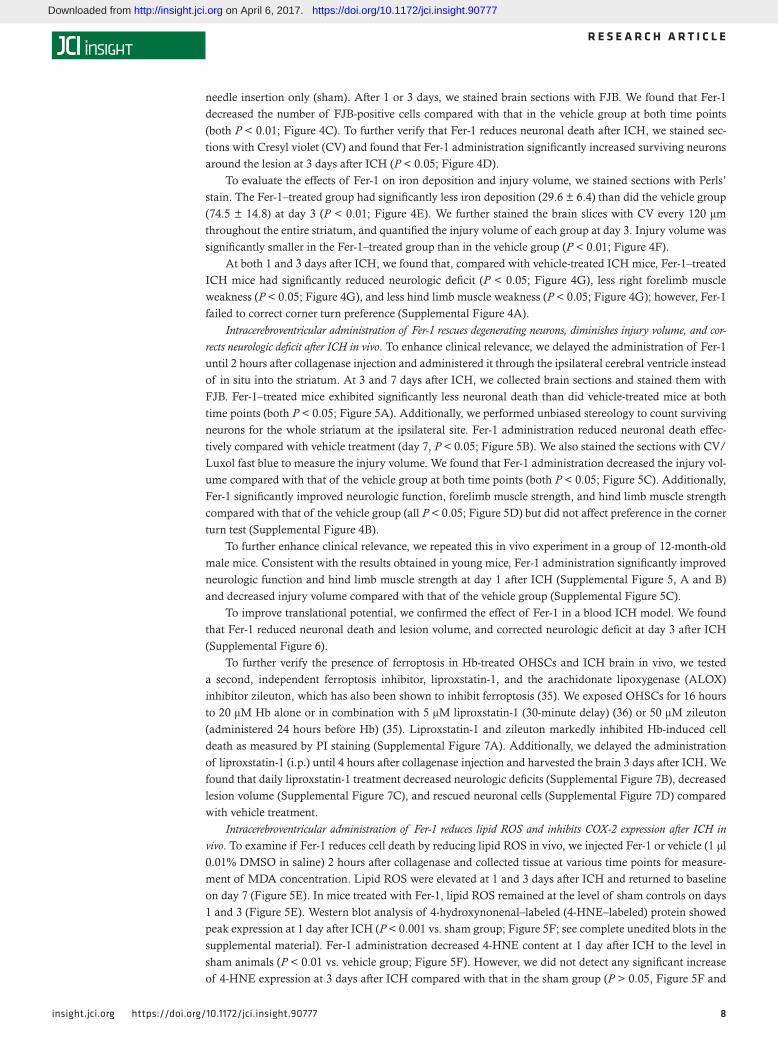
Intracerebroventricular administration of Fer-1 rescues degenerating neurons, diminishes injury volume, and cor-rects neurologic deficit after ICH in vivo. To enhance clinical relevance, we delayed the administration of Fer-1 until 2 hours after collagenase injection and administered it through the ipsilateral cerebral ventricle instead of in situ into the striatum. At 3 and 7 days after ICH, we collected brain sections and stained them with FJB. Fer-1–treated mice exhibited significantly less neuronal death than did vehicle-treated mice at both time points (both P < 0.05; Figure 5A). Additionally, we performed unbiased stereology to count surviving neurons for the whole striatum at the ipsilateral site. Fer-1 administration reduced neuronal death effec-tively compared with vehicle treatment (day 7, P < 0.05; Figure 5B). We also stained the sections with CV/Luxol fast blue to measure the injury volume. We found that Fer-1 administration decreased the injury vol-ume compared with that of the vehicle group at both time points (both P < 0.05; Figure 5C). Additionally, Fer-1 significantly improved neurologic function, forelimb muscle strength, and hind limb muscle strength compared with that of the vehicle group (all P < 0.05; Figure 5D) but did not affect preference in the corner turn test (Supplemental Figure 4B).
To further enhance clinical relevance, we repeated this in vivo experiment in a group of 12-month-old male mice. Consistent with the results obtained in young mice, Fer-1 administration significantly improved neurologic function and hind limb muscle strength at day 1 after ICH (Supplemental Figure 5, A and B) and decreased injury volume compared with that of the vehicle group (Supplemental Figure 5C).
To improve translational potential, we confirmed the effect of Fer-1 in a blood ICH model. We found that Fer-1 reduced neuronal death and lesion volume, and corrected neurologic deficit at day 3 after ICH (Supplemental Figure 6).
To further verify the presence of ferroptosis in Hb-treated OHSCs and ICH brain in vivo, we tested a second, independent ferroptosis inhibitor, liproxstatin-1, and the arachidonate lipoxygenase (ALOX) inhibitor zileuton, which has also been shown to inhibit ferroptosis (35). We exposed OHSCs for 16 hours to 20 μM Hb alone or in combination with 5 μM liproxstatin-1 (30-minute delay) (36) or 50 μM zileuton (administered 24 hours before Hb) (35). Liproxstatin-1 and zileuton markedly inhibited Hb-induced cell death as measured by PI staining (Supplemental Figure 7A). Additionally, we delayed the administration of liproxstatin-1 (i.p.) until 4 hours after collagenase injection and harvested the brain 3 days after ICH. We found that daily liproxstatin-1 treatment decreased neurologic deficits (Supplemental Figure 7B), decreased lesion volume (Supplemental Figure 7C), and rescued neuronal cells (Supplemental Figure 7D) compared with vehicle treatment.
Intracerebroventricular administration of Fer-1 reduces lipid ROS and inhibits COX-2 expression after ICH in vivo. To examine if Fer-1 reduces cell death by reducing lipid ROS in vivo, we injected Fer-1 or vehicle (1 μl 0.01% DMSO in saline) 2 hours after collagenase and collected tissue at various time points for measure-ment of MDA concentration. Lipid ROS were elevated at 1 and 3 days after ICH and returned to baseline on day 7 (Figure 5E). In mice treated with Fer-1, lipid ROS remained at the level of sham controls on days 1 and 3 (Figure 5E). Western blot analysis of 4-hydroxynonenal–labeled (4-HNE–labeled) protein showed peak expression at 1 day after ICH (P < 0.001 vs. sham group; Figure 5F; see complete unedited blots in the supplemental material). Fer-1 administration decreased 4-HNE content at 1 day after ICH to the level in sham animals (P < 0.01 vs. vehicle group; Figure 5F). However, we did not detect any significant increase of 4-HNE expression at 3 days after ICH compared with that in the sham group (P > 0.05, Figure 5F and
Downloaded from http://insight.jci.org on April 6, 2017. https://doi.org/10.1172/jci.insight.90777
9insight.jci.org https://doi.org/10.1172/jci.insight.90777
R E S E A R C H A R T I C L E
Figure 5. Intracerebroventricular administration of Fer-1 reduces degenerating neurons, neurologic deficit, and lipid ROS and inhibits COX-2 expression in vivo. Male C57BL/6 mice (6–8 weeks old) underwent collagenase injection or sham procedure. Ferrostatin-1 (Fer-1) or vehicle was injected through the left ventricle 2 hours after collagenase. (A) Brain slices were stained with Fluoro-Jade B (FJB), and quantification is shown. *P < 0.05, **P < 0.01 versus cor-responding vehicle. (B) Brain slices were stained with Cresyl violet (CV), and stereological quantification of the surviving neurons in the ipsilateral striatum is shown. ***P < 0.001 versus sham; #P < 0.05 versus vehicle. (C) Lesion volume was calculated after CV/Luxol fast blue staining. *P < 0.05 versus correspond-ing vehicle. Scale bar: 1 mm. (D) Neurologic deficit score, right front paw placement, and hind limb placing scores. *P < 0.05, **P < 0.01, ***P < 0.001 versus corresponding sham; #P < 0.05 versus corresponding vehicle. (E–G) Four-millimeter tissue slices were collected from the hematoma core and perihematoma region of intracerebral hemorrhage (ICH) and sham animals. Tissue was homogenized for the malondialdehyde (MDA) assay (E) and Western blotting (F and G). β-Actin served as a loading control. Protein expression was normalized to β-actin and expressed as fold change of sham. *P < 0.05, ***P < 0.001 versus sham; #P < 0.05, ##P < 0.01, ###P < 0.001 versus corresponding vehicle. Results are shown as box-and-whisker plots (the middle horizontal line within the box represents the median, boxes extend from the 25th to the 75th percentile, and the whiskers represent 95% confidence intervals). Statistical tests used were 1-way ANOVA followed by Dunn’s multiple comparison post test (A–D) and 1-way ANOVA followed by Bonferroni post hoc analysis (D–F). For A–D, sham and vehicle: n = 8; ICH and Fer-1: n = 10. For E–G, sham, vehicle, and Fer-1: n = 5.
Downloaded from http://insight.jci.org on April 6, 2017. https://doi.org/10.1172/jci.insight.90777
1 0insight.jci.org https://doi.org/10.1172/jci.insight.90777
R E S E A R C H A R T I C L E
Supplemental Figure 8A; see complete unedited blots in the supplemental material). To further confirm the result, we performed a 4-HNE ELISA assay and found similar results (Supplemental Figure 8B).
COX-2 is induced early after ICH (30) and encoded by PTGS-2, which is downstream of ferroptosis in cancer cells (28). We found that the protein level of COX-2 was increased significantly on days 1 and 3 after ICH (P < 0.001 vs. sham group; Figure 5G; see complete unedited blots in the supplemental material) and that Fer-1 decreased COX-2 expression on both days compared with that in the vehicle group (day 1: P < 0.001; day 3: P < 0.05; Figure 5G).
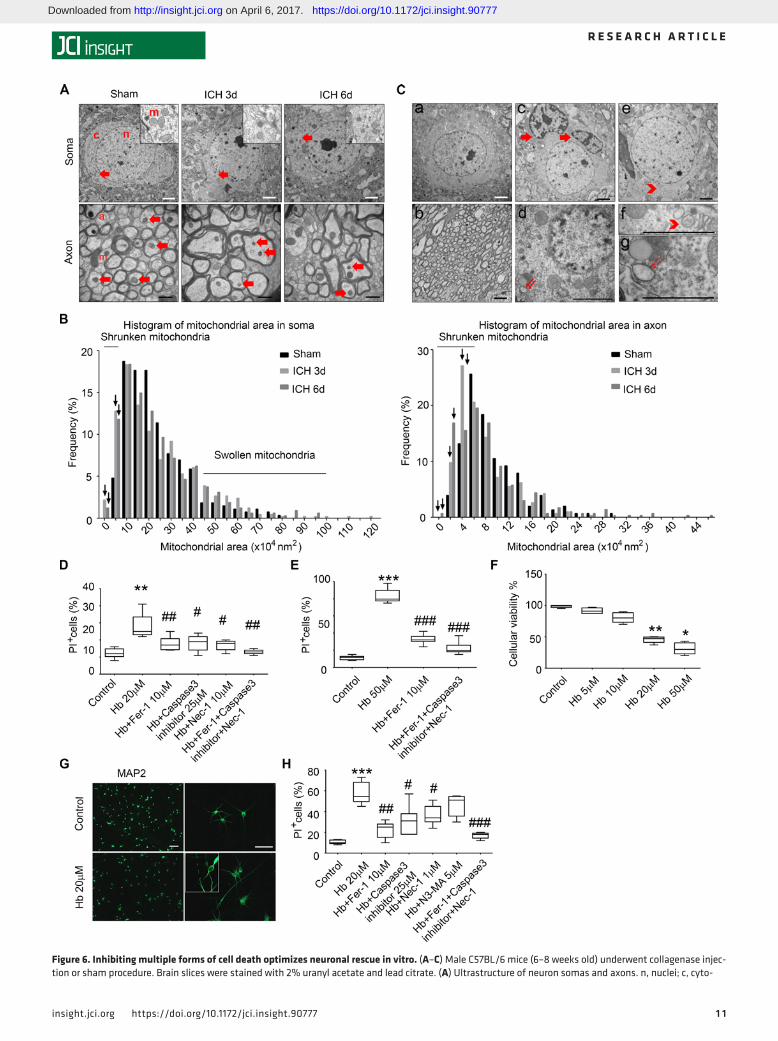
Ferroptosis is mixed with other forms of cell death after ICH in vivo. We used transmission electron micros-copy (TEM) to examine the ultrastructure of cells after ICH. Unlike other forms of cell death, ferroptosis is associated with shrunken mitochondria (26, 28). We prepared TEM slices from mice at 3 and 6 days after collagenase-induced ICH or the sham procedure. We chose 3 regions to perform uranyl acetate and lead staining: margin of the hematoma, contralateral hemisphere with corresponding location, and cor-responding location in sham mice. We observed shrunken mitochondria in soma (where cells were not undergoing obvious necrosis, apoptosis, or autophagy) and axons (surrounded by myelin) at the margin of the hematoma at both 3 and 6 days (Figure 6A). The quantitative data showed that the frequency of smaller mitochondrial area increased in both the cytoplasm and axons (Figure 6B); swollen mitochondria were observed in the cytoplasm but not axons at both time points (Figure 6B). Interestingly, shrunken mito-chondria were also present on the contralateral side on days 3 and 6 (Supplemental Figure 9). In addition to ferroptosis, we also observed classical ultrastructure of necrosis (cytoplasmic and organelle swelling and plasma membrane rupture), apoptosis (chromatin condensation), and autophagy (formation of double-membrane vesicles) after ICH at these time points (Figure 6C).
Inhibiting multiple forms of cell death optimized neuronal rescue in vitro. Because we observed ferroptosis, apoptosis, necrosis, and autophagy after ICH in vivo, and inhibiting individual types of cell death has offered little improvement in outcome in past preclinical studies, we investigated whether a combination of inhibitors could reduce neuronal death more than a single inhibitor. We exposed OHSCs to vehicle, Hb alone, or Hb with different inhibitors. PI staining showed that 20 μM Hb induced significant cell death, and that Fer-1, caspase 3 inhibitor (apoptosis inhibitor), and necrostatin-1 (Nec-1, necrosis inhibi-tor), each rescued cell death; a combination of Fer-1, caspase 3 inhibitor, and Nec-1 decreased cell death more than any individual inhibitor alone (Figure 6D). Even when we exposed OHSCs to a lethal dose and time period of Hb (50 μM, 48 hours), Fer-1 and a combination of inhibitors were able to significantly reduce the cell death (Figure 6E).
We also cultured cortical neurons differentiated from human induced pluripotent stem cell–derived (iPSC-derived) neuronal cells and treated them with vehicle or different doses of Hb to mimic human ICH in vitro. MTT assay results showed that Hb induced dose-dependent neuronal death. A dose of 20 μM Hb significantly decreased cell viability (by 57%) compared with that in vehicle-treated control neurons (Fig-ure 6, F and G). Next, we treated the Hb-exposed iPSC-derived neurons with Fer-1, caspase 3 inhibitor, Nec-1, and 3-methyladenine (3-MA, autophagy inhibitor), individually. Because high concentrations of Nec-1 (30–50 μM) can inhibit ferroptosis (36), we used a low concentration (1 μM) to avoid this potential effect, and measured cell death using PI staining. Fer-1, caspase 3 inhibitor, and Nec-1 each offered a small improvement in cell viability; 3-MA showed no effect (Figure 6H). Therefore, we next treated cells with a combination of Fer-1, caspase 3 inhibitor, and Nec-1. This combination improved viability of Hb-exposed neurons more than any individual inhibitor alone (Figure 6H). We found similar results with the MTT assay (Supplemental Figure 10).
Glutaminolysis also contributes to post-ICH ferroptosis in vivo. To determine whether glutaminolysis con-tributes to Hb-induced ferroptosis, we exposed OHSCs to Hb or vehicle, and then measured glutamate concentration. No difference was detected between Hb- and vehicle-treated slices (P > 0.05; Supplemen-tal Figure 11A).
Next, we collected brain tissue from the hematoma core and perihematoma of ICH animals, and from the corresponding brain regions of sham animals. We found that the concentration of glutamate in the hemorrhagic striatum was significantly higher than that in the striatum of sham animals but did not differ significantly between days 1 and 3 after ICH (P < 0.05 vs. sham group; P > 0.05, ICH 1 day vs. ICH 3 days; Supplemental Figure 11B). Furthermore, i.p. administration of the glutaminase inhibitor compound 968 significantly decreased the number of degenerating neurons in the perihematoma region compared with vehicle treatment (P < 0.05; Supplemental Figure 11C).
Downloaded from http://insight.jci.org on April 6, 2017. https://doi.org/10.1172/jci.insight.90777
1 1insight.jci.org https://doi.org/10.1172/jci.insight.90777
R E S E A R C H A R T I C L E
Figure 6. Inhibiting multiple forms of cell death optimizes neuronal rescue in vitro. (A–C) Male C57BL/6 mice (6–8 weeks old) underwent collagenase injec-tion or sham procedure. Brain slices were stained with 2% uranyl acetate and lead citrate. (A) Ultrastructure of neuron somas and axons. n, nuclei; c, cyto-
Downloaded from http://insight.jci.org on April 6, 2017. https://doi.org/10.1172/jci.insight.90777
1 2insight.jci.org https://doi.org/10.1172/jci.insight.90777
R E S E A R C H A R T I C L E
DiscussionFerroptosis is a recently reported form of cell death that plays a major role in tumor development and embryonic development (25, 26). To date, ferroptosis has been reported in one model of Parkinson’s dis-ease, but it has not been shown in an in vivo stroke model (37). In the present study, we showed that fer-roptosis occurs in a mouse model of ICH, that it contributes to neuronal death, and that COX-2 might be a biomarker. Additionally, Fer-1 and liproxstatin-1 protected the hemorrhagic brain, and a combination of agents that inhibit different forms of cell death offered more neuronal protection than any one inhibitor alone in an in vitro model. Taken together, these findings provide evidence that inhibition of ferroptosis protects hemorrhagic brain and could be developed into a potential clinical therapy for ICH patients.
Hemoglobin is a major component of blood, and Hb/heme/iron plays an essential role in ROS and lipid ROS production after ICH (38, 39). Although Hb and iron have been used to study ICH (40, 41), to the best of our knowledge we are the first group to use Hb and iron to mimic ICH in OHSCs ex vivo. Like prolonged glutamate exposure (26), prolonged Hb and Fe2+ exposure induced ferroptosis in OHSCs. Hb inhibited GPx activity and caused accumulation of lipid ROS. IREB2, CS, RPL8, and ATP5G3 also have been identified as essential ferroptosis genes in several cancer cell lines (26). In particular, IREB2 encodes a master regulator of iron metabolism. Neurons lacking IREB2 are highly resistant to Hb toxicity (42), and IREB2 knockout increases perihematomal ferritin expression and cell viability after ICH (43). Our group also showed that the mRNA expression levels of IREB2 and ATP5G3 were upregulated after ICH in vivo (33). These data suggest that ferroptosis may contribute to ICH-induced secondary neuronal death. However, we failed to detect any significant changes in IREB2, CS, RPL8, or ATP5G3 mRNA level when we used Hb to stimulate OHSCs; only PTGS2 was upregulated by Hb and inhibited by Fer-1. Combined with the results of our in vivo experiment, it appears that PTGS2 may be the direct downstream gene that responds to Hb-induced ferroptosis. Other ferroptosis-related genes may be regulated by other blood metabolites (like thrombin) after ICH. COX-2 is highly expressed after ICH. In vivo, it is expressed on neurons and astrocytes on day 1, but only on astrocytes on day 3 (30). Our data show that Hb regulated PTGS2 in OHSCs, which contain a mixed cell population of neurons and astrocytes. Additionally, Hb induced ferroptosis in human iPSC-derived neu-ronal cultures. These data suggest that COX-2 activity increases in neurons in a ferroptosis-related manner, but whether astrocyte-expressed COX-2 also contributes to this cell death progress is unknown. Additional studies with primary astrocyte cultures or neuron-astrocyte cocultures are needed.
Three mechanisms that lead to ferroptosis have been reported in cancer cells: (a) depletion of glutathi-one and subsequent inactivation of GPx4, (b) transferrin import or iron overload, and (c) glutamine metab-olism/glutaminolysis (26–28). Intracellular iron overload is clearly one of the major mechanisms in Hb- and Fe2+-induced neuronal ferroptosis. When a cell becomes injured, it accumulates intracellular iron from hemoproteins and releases inflammatory mediators. Based on the size and morphology of iron-positive cells, most are microglia, not neurons. Decreased iron accumulation in microglia might attenuate neuronal death. Evidence indicates that iron and TNF-α can change the polarization of microglia (44), and that the phagocytic capacity of microglia can be affected by their polarization state (45). When activated microglia accumulate less iron, they release fewer inflammatory mediators and less intracellular free iron. As a result, adjacent neurons are protected. We also showed that Hb decreased glutathione concentration and inacti-vated GPx in OHSCs. Indeed, studies have shown that Hb depletes glutathione in endothelial cells (46), and that hemin (an Hb degradation product) causes cytotoxicity through depletion of glutathione in astrocytes (47). However, we failed to detect glutamate accumulation in Hb-treated OHSCs. Hence, glutaminolysis
plasm; m, mitochondria. Red arrows show representative mitochondria in somas and axons. ICH, intracerebral hemorrhage. (B) Mitochondrial area frequency in somas and axons. Arrows indicate increased frequency of shrunken mitochondria in ICH groups. (C) Ultrastructure of (a) a healthy neuronal soma and (b) normal axon in sham group; (c) arrows indicate chromatin condensation in 2 cells undergoing apoptosis; (d, g) double arrows indicate organelle swelling in a cell undergoing necrosis with classical nuclear membrane rupture; (e, f) arrowhead indicates formation of double-membrane vesicles in a cell undergoing autophagy. n = 3 per time point. Number of soma mitochondria, sham: n = 272; ICH 3 days: n = 414; ICH 6 days: n = 312. Number of axon mitochondria, sham: n = 152; ICH 3 days: n = 306; ICH 6 days: n = 296. (D and E) Organotypic hippocampal slice cultures were treated as indicated for 16 hours (D) or 48 hours (E) before cell death was measured by propidium iodide (PI) staining. **P < 0.01, ***P < 0.001 versus control; #P < 0.05, ##P < 0.01, ###P < 0.001 versus hemo-globin (Hb). (F–H) Human induced pluripotent stem cell–derived neurons were treated as indicated for 16 hours before cell viability/death was measured with the MTT assay (F) or PI staining (H). MAP2 staining shows the morphology of Hb-injured neurons (G). *P < 0.05, **P < 0.01, ***P < 0.001 versus control; #P < 0.05, ##P < 0.01, ###P < 0.001 versus Hb. Results are shown as bar graphs or box-and-whisker plots (the middle horizontal line within the box represents the median, boxes extend from the 25th to the 75th percentile, and the whiskers represent 95% confidence intervals). n = 3 independent experiments; 1-way ANOVA with Bonferroni post hoc analysis. Scale bars: (A) upper panel, 2 μm and bottom panel, 500 nm; (C) 2 μm; (G) left panel, 100 μm and right panel, 50 μm. Original magnification for insets (A and G), ×600.
Downloaded from http://insight.jci.org on April 6, 2017. https://doi.org/10.1172/jci.insight.90777
1 3insight.jci.org https://doi.org/10.1172/jci.insight.90777
R E S E A R C H A R T I C L E
may not contribute to Hb-induced ferroptosis in vitro. Interestingly, studies have shown that glutamate level increases in the perihematomal region of a rabbit ICH model and in blood of ICH patients (48, 49). In our mouse model, perihematomal glutamate was greater in ICH mice than in sham mice, and treatment with glutaminase inhibitor compound 968 significantly decreased the number of degenerating neurons in the perihematomal region. These results suggest that glutaminolysis contributes to neuronal death after ICH in vivo, but not to Hb-induced toxicity in vitro.
Fer-1 is a cell-permeant compound with an EC50 of 60 nM in cancer cells; it requires a higher effective concentration in OHSCs because of the thickness of the slices; Fer-1 specifically inhibits erastin-induced or RSL3-induced ferroptosis in cancer cells and glutamate-induced ferroptosis in brain slice cultures by inhibit-ing lipid ROS production (24, 26); it was also shown to inhibit embryo development–related ferroptosis and kidney degeneration (25). In our study, Fer-1 dramatically reduced neuronal death induced by Hb and iron ex vivo and in vitro. Moreover, the basal level of cell death was even lower than that of the control group in some brain slice culture samples. We speculate that ferroptosis may contribute to the cell death that occurs during culturing of brain slices ex vivo and may promote the thinning of OHSCs. Thus, adding Fer-1 itself may also inhibit this process. Importantly, we showed that Fer-1 is neuroprotective whether it is applied before, during, or after Hb exposure ex vivo, suggesting that it can be used not only to prevent lipid ROS production, but also as a potential treatment of ICH-induced ferroptosis. Furthermore, we administered Fer-1 to ICH animals in situ immediately after collagenase injection or into the cerebral ventricle after a 2-hour delay and found that just 1 dose was able to inhibit neuronal death, decrease iron deposition, reduce injury volume, and correct neurologic deficits effectively up to 7 days after ICH. Results were confirmed in a collagenase model using middle-aged mice and in a blood model using young mice. It has been shown that lipid ROS accumulate as early as 1 hour after ICH (38). Therefore, the efficacy of Fer-1 after a 2-hour delay in administration offers proof of principle that it may have therapeutic potential for ICH. To enhance the potential clinical applications, the structure of Fer-1 needs to be modified such that it can be formulated in a suitable solvent, such as saline or β-cyclodextrin rather than DMSO. Additionally, the therapeutic window for Fer-1 needs to be determined. More clinically feasible drug-delivery methods, such as intranasal or intra-venous delivery, need to be tested when new brain-permeant and metabolically stable drug-like Fer-1 analogs are available. We also tested the neuroprotective effect of other ferroptosis inhibitors — liproxstatin-1 and ALOX inhibitor zileuton in OHSCs, and liproxstatin-1 in vivo. Liproxstatin-1 and zileuton each effectively reduced neuronal death ex vivo, and liproxstatin-1 improved acute ICH outcomes in vivo. These findings provide more evidence that ferroptosis indeed occurs in Hb-exposed OHSCs and in the ICH brain.
Using TEM, we observed shrunken mitochondria in the brains of ICH animals, providing powerful evidence of ferroptosis after ICH. To our knowledge, this is the first solid evidence of shrunken mitochon-dria in vivo (25, 26). Importantly, we also observed shrunken mitochondria in the contralateral striatum after ICH. We believe that this contralateral effect is due to the presence of extensive interhemispheric connections. Inflammation in the diseased hemisphere may signal to the contralateral hemisphere after ICH (50, 51), which can damage mitochondria and lead to whole brain dysfunction. Interestingly, a previous study detected abnormal MRI signals in the homologous contralateral brain regions that cor-related with hematoma volume in patients with ICH (52). Similarly, in ischemic stroke models, activated astrocytes (53) and apoptotic/necrotic cell death (54, 55) were observed in the contralateral hemisphere. These findings suggest that we cannot use the contralateral brain tissue as an internal control for some experiments after stroke/ICH, especially for cell death–related research. In addition to ferroptosis, we found that other forms of cell death occurred simultaneously in the hemorrhagic brain. In fact, shrunken and swollen mitochondria sometimes coexisted in the same neuronal soma. Thus, different forms of cell death may be triggered in the same cell. Recently, Hou et al. (56) found that autophagy promotes ferrop-tosis by degradation of ferritin in cancer cells. It remains to be determined how a cell triggers different cell death pathways under the same stimulation and what crosstalk/regulation occurs between apoptosis, necrosis, autophagy, and ferroptosis.
We found that using a combination of inhibitors for different forms of cell death was more effective at reducing Hb-induced neuronal death than using just one. However, whether a combination of different inhibitors could improve ICH outcomes better than one drug, or whether this strategy can be effective in clinical trials is still unknown.
In this study, we only tested male mice, and sex is an important factor that affects ICH outcome, especially early outcomes (57). Studies have shown that sex influences neuronal death by affecting poly
Downloaded from http://insight.jci.org on April 6, 2017. https://doi.org/10.1172/jci.insight.90777
1 4insight.jci.org https://doi.org/10.1172/jci.insight.90777
R E S E A R C H A R T I C L E
(ADP-ribose) polymerase–dependent cell death and estrogen receptor activation (58), and possibly by affecting lipid metabolism and peroxidation (59–61). Whether ferroptosis is affected by sex in the ICH model is not clear and needs to be addressed. We examined only early outcomes in the first 7 days after ICH. The long-term effects of Fer-1 on motor function, learning, and memory need to be addressed. Furthermore, studies are still needed to determine the therapeutic window of Fer-1 and whether Fer-1 can protect mitochondria.
In conclusion, we demonstrated the presence of ferroptosis after ICH and found that administration of 1 dose of Fer-1 at 2 hours after ICH reduced neuronal death and improved neurologic function up to 7 days. This protection was associated with inhibition of lipid ROS and COX-2 expression. We believe that our potentially novel findings fill an important gap in knowledge of cell death after ICH and provide a vital foundation for cell death–based ICH treatment in the future.
MethodsStudy design. A power analysis based on our previous studies (62) and pilot data indicated that 8 mice/group would provide at least 80% power for detecting a 20% decrease in lesion volume at α = 0.05 (2-sided). To account for potential animal death, we used 10 mice/group. Animals that had a neurologic deficit score higher than 20 at 24 hours after surgery were euthanized under deep anesthesia. Animals that died or were euthanized were excluded from the sample size. Outlying data points were defined with statistical software assuming a normal distribution (threshold was set as 2.0-fold of SD from the mean) and were excluded from the dataset. Three or more independent experiments were performed for all ex vivo and in vitro experiments. Animals, slice cultures, and cell cultures for each group were randomized with the website www.randomization.com. Treatment, data collection, and data analyses were blinded by using different investigators or by masking sample labels.
Animals. All treatment strategies followed ARRIVE and RIGOR guidelines (63). Six- and 12-week-old C57BL/6 male mice were obtained from Charles River Laboratories. Six-week-old male CX3CR1GFP/+ mice (on C57BL/6 background), which express enhanced GFP in monocytes, dendritic cells, NK cells, and microglia under control of the endogenous Cx3cr1 locus (64) were obtained from Jonathan Bromberg (Uni-versity of Maryland, Baltimore, Maryland, USA) and used to visualize microglia. All efforts were made to minimize the number of animals used and ensure minimal suffering. Body weight, rectal temperature, and survival rate were recorded for each mouse before and after surgery until the endpoint of experiments (Supplemental Figures 12 and 13).
ICH model. Mice were anesthetized by 1%–3% isoflurane inhalation and ventilated with oxygen-enriched air (20%:80%). They were injected in the left striatum with 0.5 μl of 0.075 U collagenase VII-S (Sigma-Aldrich) at 0.1 μl/minute (collagenase model) or with 8 μl of autologous blood at 0.5 μl/minute (3 μl followed by a 5-minute pause and then 7 μl followed by a 10-minute pause). Injections were administered at 0.8 mm anterior and 2.1 mm lateral of the bregma, and 3.1 mm in depth, as previously described (65, 66). The craniotomy was sealed with Super Glue (Loctite). Rectal temperature was maintained at 37.0 ± 0.5°C throughout the experimental and recovery periods. Sham-operated mice received the same treat-ment, including needle insertion, but were not injected with collagenase or blood. Mice that died before the end of the study were excluded; otherwise, all animals proceeded into the final analysis.
OHSCs. OHSCs were cultured as previously described (67–69). Briefly, mouse pups (P7–P9) from C57BL/6 or CX3CR1GFP/+ mice on C57BL/6 background were rapidly decapitated and the hippocampus placed in ice-cold Hanks’ balanced salt solution (HBSS, with Ca2+ and Mg2+; Life Technologies) supple-mented with 25 mM HEPES (Life Technologies). A McIlwain tissue chopper was used to cut 350-μm-thick sections that were immediately plated on a hydrophilic PTFE cell culture insert (pore size: 0.4 μm; Milli-cell-CM, Millipore) in 50% DMEM (Life Technologies), 25% heat-inactivated horse serum (Invitrogen), 25% HBSS, 35 mM glucose (Sigma-Aldrich), and 25 mM HEPES. The sections were incubated at 37°C in a 5% CO2 atmosphere. After 1 day in vitro, the medium was changed to 70% DMEM and 5% heat-inactivated horse serum. Medium was changed every 2 to 3 days. After 10 to 14 days of culture in vitro, the sections were placed in serum-free medium (75% DMEM).
Human iPSC-derived neurons. The iPSC differentiation protocol was modified from the strategy reported by Zhang et al. (70). The normal human iPSC line iPS (IMR90)-1 (WiCell Research Institute) was infected by lentiviruses harboring doxycycline-inducible neurogenin 2. After doxycycline treatment for 6 days, neu-ronal precursors (3 × 10⁵ cells/cm2) were seeded on dishes precoated with poly-D-lysine (1 μg/ml) and
Downloaded from http://insight.jci.org on April 6, 2017. https://doi.org/10.1172/jci.insight.90777
1 5insight.jci.org https://doi.org/10.1172/jci.insight.90777
R E S E A R C H A R T I C L E
laminin (1 μg/ml; Sigma-Aldrich) in neuron culture medium (Neurobasal medium with B27 supplement, brain-derived neurotrophic factor [20 ng/ml; PeproTech], glial cell line–derived neurotrophic factor [20 ng/ml; PeproTech], L-ascorbic acid [0.2 mM; Sigma-Aldrich], dibutyryl cAMP [0.5 mM; Sigma-Aldrich], and γ-secretase inhibitor DAPT [10 μM; Stemgent]) (71). Neurons were matured for 20 days before Hb treat-ment. Medium was changed every 3 days.
Drug administration. For OHSC experiments, we added 10 μM MK-801 (Sigma-Aldrich) or 10 μM Fer-1 (Xcessbio) 30 minutes before 5 μM glutamate (Sigma-Aldrich), 20 μM Hb (Sigma-Aldrich), or 0.2 mM FeCl2 (Sigma-Aldrich). We tested different dosages of Fer-1 (2, 10, or 50 μM) and Hb (5, 10, 20, or 50 μM). We added 5 μM liproxstatin-1 (Sigma-Aldrich) 30 minutes after 20 μM Hb and 50 μM zileuton (Sigma-Aldrich) 24 hours before 20 μM Hb.
For in vivo experiments, we injected 1 pmol of Fer-1 (10 μM Fer-1 in 1 μl 0.01% DMSO in saline) (25) into the striatum immediately after collagenase injection or into the cerebral ventricle 2 hours after collage-nase injection. The coordinates for cerebral ventricle injection were: 1.0 mm lateral, 0.5 mm posterior, and 2.5 mm in depth relative to the bregma. For liproxstatin-1 experiments, liproxstatin-1 (0.2 mg/20 g body weight; Sigma-Aldrich) (36) or vehicle (200 μl saline containing 10% DMSO) was administered i.p. once daily for 3 days beginning 4 hours after collagenase injection. For compound 968 experiments, compound 968 (0.2 mg/20 g body weight; Millipore) (72) or vehicle (200 μl saline containing 10% DMSO) was admin-istered i.p. once daily for 3 days beginning 4 hours after collagenase injection.
For experiments with human iPSC-derived neuron cultures, we tested different dosages of Hb (5, 10, 20, or 50 μM). Fer-1 (10 μM), caspase-3 inhibitor VII (25 μM [see ref. 73]; Millipore), necrostatin-1 (10 μM [see ref. 74] or 1 μM; Millipore), 3-methyladenine (5 mM [see ref. 75], Sigma-Aldrich), or a combination of these drugs was added at the same time as 20 μM Hb.
PI staining. OHSCs were incubated with 5 μg/ml PI (Sigma-Aldrich) for 30 minutes, and pictures were taken under a fluorescence microscope (Nikon TE 2000-E) at 200 ms exposure time (P0). The structure of the slices was examined under bright field. After treatment, the slices were incubated with PI for 30 min-utes, and images were captured (P16). Slices were then incubated for another 24 hours to reach maximum death (Pmax). Percentage cell death was expressed as the number of pixels in the region of interest (ROI) above a threshold in the PI fluorescent image divided by the total number of pixels in the ROI (26). The fluorescence intensity was measured with ImageJ software (NIH) and the PI+ cells were calculated as (P16 – P0)/(Pmax – P0) × 100%. For human iPSC-derived neuron cultures, PI and DAPI were added 30 min-utes before images were taken. Percentage cell death is expressed as PI+ cells/DAPI+ cells per ×200 field.
Immunostaining. Treated and PI-stained OHSCs were cut from the inserts, fixed in 4% paraformaldehyde for 2 hours, and then blocked in 10% goat serum (Invitrogen) for 1 hour at room temperature. Next, the slices were incubated overnight at 4°C with anti-NeuN (Cell Signaling Technology, catalog 12943S; 1:500) or anti-GFAP (Life Technologies, catalog 13-0300; 1:500) primary antibody. After the sections were washed 3 times, they were incubated for 2 hours in Alexa Fluor 488–conjugated secondary antibody (Invitrogen, catalog A11001 and A11006; 1:1,000) at room temperature. To investigate microglial cell death, we prepared OHSCs from CX3CR1GFP/+ mice. After being stained with PI, the slices were cut from inserts and fixed and mounted. All slices were observed and photographed under a fluorescence microscope (Nikon Eclipse 90i) and a confocal microscope (Leica SPE). The NeuN/PI double-positive cells were counted double blinded by using ImageJ software. Treated iPSC-derived neurons were fixed in 4% paraformaldehyde for 30 minutes, and then blocked as for OHSCs. Cells were stained with MAP2 (Abcam, catalog ab5392; 1:500) primary antibody.
Lipid ROS production measurement. Lipid peroxidation was measured by using a live cell analysis kit: Image-iT Lipid Peroxidation Kit (Life Technologies). This kit enables the detection of lipid ROS through oxidation of BODIPY 581/591 C11 reagent. This reagent localizes to membranes throughout live cells, and upon oxidation by lipid hydroperoxides, it displays a shift in peak fluorescence emission from ~590 nm to ~510 nm. One set of OHSCs was incubated with CHX (5.4 μM, included in the kit) for 2 hours at 37°C and 5% CO2 for use as a positive control. All treated slices were incubated with BODIPY 581/591 C11 reagent for an additional 30 minutes in the incubator, and images were taken under the fluorescence micro-scope. An investigator blinded to treatment group calculated the green fluorescence intensity with ImageJ. Another set of slices was lysed in RIPA buffer (Thermo Fisher Scientific) on ice, and the fluorescence emis-sion was read at 590 and 510 nm on a microplate reader.
An MDA assay kit (Biovision) was also used. Briefly, the MDA in the treated slices or brain tissue (1, 3, or 7 days after ICH or sham; 4-mm coronal section from the major hemorrhagic territory) was reacted
Downloaded from http://insight.jci.org on April 6, 2017. https://doi.org/10.1172/jci.insight.90777
1 6insight.jci.org https://doi.org/10.1172/jci.insight.90777
R E S E A R C H A R T I C L E
with thiobarbituric acid (TBA) to generate the MDA-TBA adduct; the MDA-TBA adduct was quantified fluorometrically (excitation/emission = 532/553 nm) on a microplate reader.
We assessed the relative expression of 4-HNE in 4-mm coronal sections from the major hemorrhagic territory 1 or 3 days after ICH or sham procedure by using Western blot analysis with 4-HNE antibody (Millipore, catalog 393207) or a 4-HNE competitive ELISA kit (Cell Biolabs, Inc.).
GPx activity measurement. Total GPx activity was measured with a GPx assay kit (Abcam) accord-ing to the manufacturer’s instructions. Briefly, treated slices were removed from the insert membrane in assay buffer and centrifuged at 10,000 g for 15 minutes at 4°C. The supernatant was collected for use in the assay. NADPH, glutathione reductase, and glutathione solutions were added to samples for 15 minutes to deplete all glutathione disulfide. Optical density for NADPH was measured at 340 nm before addition of cumene hydroperoxide (substrate for GPx) and then every 5 minutes for 60 minutes after the addition.
FJB/FJC staining. FJB or FJC was used to identify degenerating neurons during acute neuronal distress as previously described (76, 77). Treated OHSCs or brain sections were observed and photographed under a fluorescence microscope at an excitation wavelength of 450–490 nm.
Perls’ staining. 3,3′-Diaminobenzidine (DAB; Vector Laboratories)-enhanced Perls’ staining was used to detect iron accumulation as previously described (62, 78) with slight modification. Briefly, sections of brain tissue were washed with PBS and incubated in freshly prepared Perls’ solution (5% potassium ferrocyanide [Sigma-Aldrich]/10% hydrochloric acid) for 1 hour, followed by 5 PBS washes. After DAB incubation for 3 minutes and hematoxylin (Sigma-Aldrich) counterstaining, iron deposition was digitized and analyzed with ImageJ software.
Hemorrhagic injury analysis. Mice were euthanized by deep anesthesia, and coronal brain sections were stained with CV alone (for neurons, Sigma-Aldrich) or with Luxol fast blue (for myelin) at 20 rostral-caudal levels that were spaced 120 μm apart. Sections were digitized and analyzed with a 10× objective and ImageJ software. The injury volume in cubic millimeters was computed by summation of the damaged areas multiplied by the interslice distance (120 μm). Surviving neurons around the lesion that were stained by CV were counted under a 40× objective microscope and further identified by morphology (33).
Neurologic function evaluations. An experimenter blinded to treatment group evaluated mice for neuro-logic function on different recovery days after ICH. In the neurologic deficit scoring system, mice were evaluated for body symmetry, gait, climbing, circling behavior, front limb symmetry, and compulsory cir-cling. Each test was graded from 0 to 4, establishing a maximum deficit score of 24 (76, 77). Forelimb placing was assessed with a vibrissae-elicited forelimb placing test. The mouse was placed on the edge of a tabletop, and the vibrissae on one side were brushed. Intact animals placed the contralateral forelimb quickly on the tabletop. Placing was quantified as the percentage of successful responses in 10 trials (33). For the corner turn test, the mouse was allowed to proceed into a 30° corner. The mouse could freely turn either left or right to exit the corner. The choice of direction during 10 repeats was recorded, and the per-centage of left turns was calculated (33). For the hind limb placing test, the mouse was placed on the edge of a tabletop and the contralateral hind limb was pulled down. The test was scored as follows: immediate pullback of limb = 0, delayed pullback = 1, inability to pull back = 2. Placing was quantified in 10 success-ful trials; trials were excluded when the animal attempted to turn around or walk away (79). Results are shown as a total score for each mouse.
TEM. Sham and ICH mice at 3 or 6 days of recovery were perfused with 2% paraformaldehyde and 2% glutaraldehyde in 0.1 M sodium cacodylate buffer, followed by postfixation in 2% osmium tetroxide with 1.6% potassium ferrocyanide in 0.1 M sodium cacodylate. Samples (at the margin of the hematoma or corresponding location) were then cut and stained en bloc with 2% uranyl acetate (UA), dehydrated in ethanol, and embedded in eponate. Then the sections (70–90 nm) were placed on copper slot grids and stained with 2% UA and lead citrate. TEM images were captured with a Hitachi 7600 TEM in the micro-scope core of Johns Hopkins University.
Western blot analysis. Mice were anesthetized and decapitated at 1 or 3 days after ICH (n = 5/group). A 4-mm coronal section from the major hemorrhagic territory was collected into ice-cold PBS with a mouse brain slicer matrix (Zivic Instruments) as previously described (33). We homogenized tissues in ice-cold protein extraction reagent (T-PER Reagent; Pierce) with a complete mini protease inhibitor cocktail (Roche Molecular Biochemicals). Total protein was quantified by BCA protein assay
Downloaded from http://insight.jci.org on April 6, 2017. https://doi.org/10.1172/jci.insight.90777
1 7insight.jci.org https://doi.org/10.1172/jci.insight.90777
R E S E A R C H A R T I C L E
(Bio-Rad). Equal amounts of protein were separated by sodium dodecyl sulfate-polyacrylamide gel electrophoresis and transferred to Immobilon-P membranes (Millipore). Membranes were blocked with 5% nonfat milk in Tris-buffered saline containing 0.1% Tween-20 and probed with primary antibodies against 4-HNE (Millipore, catalog 393207; 1:1,000), COX-2 (Abcam, catalog ab6665; 1:500), NeuN (Millipore, catalog MAB377; 1:500), cleaved caspase-3 (Cell Signaling Technology, catalog 9661L; 1:500), and β-actin (Santa Cruz Biotechnology, catalog sc-47778; 1:5,000) at 4°C overnight. The mem-branes were washed and incubated with horseradish peroxidase–linked anti-rabbit or anti-mouse sec-ondary antibodies (Santa Cruz Biotechnology; 1:1,000) for 1 hour. The relative intensity of protein signals was normalized to the corresponding loading control intensity and quantified by densitometric analysis with ImageJ software.
Statistics. Data are presented as mean ± SD, dot plot, or box-and-whisker plots (95% confidence inter-vals). We made 2-group comparisons with a 2-tailed Student’s t test followed by Welch’s correction. We evaluated all behavioral tests by Kruskal-Wallis analysis of ranks followed by Dunn’s multiple comparison post test to detect significant differences among groups. In anatomical and biochemical studies, 1-way or 2-way ANOVA was used for comparisons among multiple groups. Bonferroni or Dunn’s post hoc analy-sis was used to determine where those differences occurred. We evaluated survival data using a log-rank (Mantel-Cox) test. Frequency of distribution of the area of mitochondria was calculated. For comparison of GPx activity, we used repeated measurements with Bonferroni’s multiple comparison test where the P value between the 2 groups has been corrected. All analyses were carried out with GraphPad Prism 5.0 Software. The criterion for statistical significance was P less than 0.05.
Study approval. All experimental protocols were conducted in accordance with the NIH guidelines and were approved by the Johns Hopkins University Animal Care and Use Committee.
Author contributionsQL and JW designed the experiments and wrote the manuscript. QL, MY, RCK, BRS, and JW revised the manuscript. MY provided human iPSC-derived neuronal cells. QL, XH, XL, YG, JW, FD, TC, ZW, CJ, JY, and JW collected and analyzed the data.
AcknowledgmentsWe thank Jonathan Bromberg from the University of Maryland for the gift of the CX3CR1GFP/+ mice. We thank Claire Levine for assistance with manuscript preparation. This research was supported by the NIH (R01 NS078026 and R01 AT007317 to JW), the American Heart Association (Grant-in-Aid, 13GRNT15730001 to JW; Postdoctoral Fellowship Awards, 16POST29640010 to QL, 15POST25090114 to XL, and 14POST20140003 to XH), the Maryland Stem Cell Research Fund (to MY), and a “Stimulat-ing and Advancing ACCM Research (StAAR)” grant from the Department of Anesthesiology and Critical Care Medicine, Johns Hopkins University.
Address correspondence to: Jian Wang, Department of Anesthesiology and Critical Care Medicine, The Johns Hopkins University School of Medicine, 720 Rutland Avenue, Ross Building 370B, Baltimore, Mary-land 21205, USA. Phone: 443.287.5490; E-mail: [email protected].
1. Donnan GA, Hankey GJ, Davis SM. Intracerebral haemorrhage: a need for more data and new research directions. Lancet Neu-rol. 2010;9(2):133–134.
2. Wang J. Preclinical and clinical research on inflammation after intracerebral hemorrhage. Prog Neurobiol. 2010;92(4):463–477. 3. Wang J, Dore S. Inflammation after intracerebral hemorrhage. J Cereb Blood Flow Metab. 2007;27(5):894–908. 4. Wasserman JK, Schlichter LC. Neuron death and inflammation in a rat model of intracerebral hemorrhage: effects of delayed
minocycline treatment. Brain Res. 2007;1136(1):208–218. 5. Xi G, Keep RF, Hoff JT. Mechanisms of brain injury after intracerebral haemorrhage. Lancet Neurol. 2006;5(1):53–63. 6. Lou M, Lieb K, Selim M. The relationship between hematoma iron content and perihematoma edema: an MRI study. Cerebro-
vasc Dis. 2009;27(3):266–271. 7. Xi G, Strahle J, Hua Y, Keep RF. Progress in translational research on intracerebral hemorrhage: is there an end in sight? Prog
Neurobiol. 2014;115:45–63. 8. Xiong XY, Wang J, Qian ZM, Yang QW. Iron and intracerebral hemorrhage: from mechanism to translation. Transl Stroke Res.
2014;5(4):429–441. 9. Zecca L, Youdim MB, Riederer P, Connor JR, Crichton RR. Iron, brain ageing and neurodegenerative disorders. Nat Rev Neuro-
sci. 2004;5(11):863–873.
Downloaded from http://insight.jci.org on April 6, 2017. https://doi.org/10.1172/jci.insight.90777
1 8insight.jci.org https://doi.org/10.1172/jci.insight.90777
R E S E A R C H A R T I C L E
10. Salvador GA. Iron in neuronal function and dysfunction. Biofactors. 2010;36(2):103–110. 11. Stankiewicz JM, Brass SD. Role of iron in neurotoxicity: a cause for concern in the elderly? Curr Opin Clin Nutr Metab Care.
2009;12(1):22–29. 12. Gaasch JA, Lockman PR, Geldenhuys WJ, Allen DD, Van der Schyf CJ. Brain iron toxicity: differential responses of astro-
cytes, neurons, and endothelial cells. Neurochem Res. 2007;32(7):1196–1208. 13. Selim M. Deferoxamine mesylate: a new hope for intracerebral hemorrhage: from bench to clinical trials. Stroke. 2009;40(3
Suppl):S90–S91. 14. Matsushita K, et al. Evidence for apoptosis after intercerebral hemorrhage in rat striatum. J Cereb Blood Flow Metab.
2000;20(2):396–404. 15. Qureshi AI, et al. Apoptosis as a form of cell death in intracerebral hemorrhage. Neurosurgery. 2003;52(5):1041–1047; discussion
1047–1048. 16. Gong C, Boulis N, Qian J, Turner DE, Hoff JT, Keep RF. Intracerebral hemorrhage-induced neuronal death. Neurosurgery.
2001;48(4):875–882; discussion 882. 17. Grossetete M, Rosenberg GA. Matrix metalloproteinase inhibition facilitates cell death in intracerebral hemorrhage in mouse.
J Cereb Blood Flow Metab. 2008;28(4):752–763. 18. Serrano L, et al. The tumor suppressor SirT2 regulates cell cycle progression and genome stability by modulating the mitotic
deposition of H4K20 methylation. Genes Dev. 2013;27(6):639–653. 19. Zhu X, et al. Plasmalemma permeability and necrotic cell death phenotypes after intracerebral hemorrhage in mice. Stroke.
2012;43(2):524–531. 20. He Y, Wan S, Hua Y, Keep RF, Xi G. Autophagy after experimental intracerebral hemorrhage. J Cereb Blood Flow Metab.
2008;28(5):897–905. 21. Chen CW, et al. Inhibition of autophagy as a therapeutic strategy of iron-induced brain injury after hemorrhage. Autophagy.
2012;8(10):1510–1520. 22. Wang X, Mori T, Sumii T, Lo EH. Hemoglobin-induced cytotoxicity in rat cerebral cortical neurons: caspase activation and
oxidative stress. Stroke. 2002;33(7):1882–1888. 23. Zhang XQ, Zhang ZM, Yin XL, Zhang K, Cai H, Ling F. Exploring the optimal operation time for patients with hypertensive
intracerebral hemorrhage: tracking the expression and progress of cell apoptosis of prehematomal brain tissues. Chin Med J (Engl). 2010;123(10):1246–1250.
24. Yang WS, Stockwell BR. Ferroptosis: Death by lipid peroxidation. Trends Cell Biol. 2016;26(3):165–176. 25. Jiang L, et al. Ferroptosis as a p53-mediated activity during tumour suppression. Nature. 2015;520(7545):57–62. 26. Dixon SJ, et al. Ferroptosis: an iron-dependent form of nonapoptotic cell death. Cell. 2012;149(5):1060–1072. 27. Gao M, Monian P, Quadri N, Ramasamy R, Jiang X. Glutaminolysis and transferrin regulate ferroptosis. Mol Cell.
2015;59(2):298–308. 28. Yang WS, et al. Regulation of ferroptotic cancer cell death by GPX4. Cell. 2014;156(1–2):317–331. 29. Conrad M, Friedmann Angeli JP. Glutathione peroxidase 4 (Gpx4) and ferroptosis: what’s so special about it? Mol Cell Oncol.
2015;2(3):e995047. 30. Wu T, Wu H, Wang J, Wang J. Expression and cellular localization of cyclooxygenases and prostaglandin E synthases in the
hemorrhagic brain. J Neuroinflammation. 2011;8:22. 31. Chu K, et al. Celecoxib induces functional recovery after intracerebral hemorrhage with reduction of brain edema and perihe-
matomal cell death. J Cereb Blood Flow Metab. 2004;24(8):926–933. 32. Conrad M, et al. 12/15-lipoxygenase-derived lipid peroxides control receptor tyrosine kinase signaling through oxidation of pro-
tein tyrosine phosphatases. Proc Natl Acad Sci U S A. 2010;107(36):15774–15779. 33. Chang CF, Cho S, Wang J. (-)-Epicatechin protects hemorrhagic brain via synergistic Nrf2 pathways. Ann Clin Transl Neurol.
2014;1(4):258–271. 34. Linkermann A, et al. Synchronized renal tubular cell death involves ferroptosis. Proc Natl Acad Sci U S A. 2014;111(47):16836–
16841. 35. Yang WS, Kim KJ, Gaschler MM, Patel M, Shchepinov MS, Stockwell BR. Peroxidation of polyunsaturated fatty acids by
lipoxygenases drives ferroptosis. Proc Natl Acad Sci U S A. 2016;113(34):E4966–E4975. 36. Friedmann Angeli JP, et al. Inactivation of the ferroptosis regulator Gpx4 triggers acute renal failure in mice. Nat Cell Biol.
2014;16(12):1180–1191. 37. Do Van B, et al. Ferroptosis, a newly characterized form of cell death in Parkinson’s disease that is regulated by PKC. Neurobiol
Dis. 2016;94:169–178. 38. Katsu M, Niizuma K, Yoshioka H, Okami N, Sakata H, Chan PH. Hemoglobin-induced oxidative stress contributes to matrix
metalloproteinase activation and blood-brain barrier dysfunction in vivo. J Cereb Blood Flow Metab. 2010;30(12):1939–1950. 39. Hu X, Tao C, Gan Q, Zheng J, Li H, You C. Oxidative stress in intracerebral hemorrhage: sources, mechanisms, and therapeu-
tic targets. Oxid Med Cell Longev. 2016;2016:3215391. 40. Ding R, et al. Blood-brain barrier disruption induced by hemoglobin in vivo: Involvement of up-regulation of nitric oxide syn-
thase and peroxynitrite formation. Brain Res. 2014;1571:25–38. 41. Dong M, Xi G, Keep RF, Hua Y. Role of iron in brain lipocalin 2 upregulation after intracerebral hemorrhage in rats. Brain Res.
2013;1505:86–92. 42. Regan RF, Chen M, Li Z, Zhang X, Benvenisti-Zarom L, Chen-Roetling J. Neurons lacking iron regulatory protein-2 are highly
resistant to the toxicity of hemoglobin. Neurobiol Dis. 2008;31(2):242–249. 43. Chen M, Awe OO, Chen-Roetling J, Regan RF. Iron regulatory protein-2 knockout increases perihematomal ferritin expression
and cell viability after intracerebral hemorrhage. Brain Res. 2010;1337:95–103. 44. Kroner A, Greenhalgh AD, Zarruk JG, Passos Dos Santos R, Gaestel M, David S. TNF and increased intracellular iron alter
macrophage polarization to a detrimental M1 phenotype in the injured spinal cord. Neuron. 2014;83(5):1098–1116. 45. Hu X, et al. Microglial and macrophage polarization-new prospects for brain repair. Nat Rev Neurol. 2015;11(1):56–64. 46. D’Agnillo F, Wood F, Porras C, Macdonald VW, Alayash AI. Effects of hypoxia and glutathione depletion on hemoglobin- and
Downloaded from http://insight.jci.org on April 6, 2017. https://doi.org/10.1172/jci.insight.90777
1 9insight.jci.org https://doi.org/10.1172/jci.insight.90777
R E S E A R C H A R T I C L E
myoglobin-mediated oxidative stress toward endothelium. Biochim Biophys Acta. 2000;1495(2):150–159. 47. Laird MD, Wakade C, Alleyne CH, Dhandapani KM. Hemin-induced necroptosis involves glutathione depletion in mouse
astrocytes. Free Radic Biol Med. 2008;45(8):1103–1114. 48. Wu G, Sun S, Sheng F, Wang L, Wang F. Perihematomal glutamate level is associated with the blood-brain barrier disruption in
a rabbit model of intracerebral hemorrhage. Springerplus. 2013;2:358. 49. Castillo J, et al. Molecular signatures of brain injury after intracerebral hemorrhage. Neurology. 2002;58(4):624–629. 50. Liesz A, Middelhoff M, Zhou W, Karcher S, Illanes S, Veltkamp R. Comparison of humoral neuroinflammation and adhesion
molecule expression in two models of experimental intracerebral hemorrhage. Exp Transl Stroke Med. 2011;3(1):11. 51. Lively S, Schlichter LC. Age-related comparisons of evolution of the inflammatory response after intracerebral hemorrhage in
rats. Transl Stroke Res. 2012;3(Suppl 1):132–146. 52. Carhuapoma JR, Barker PB, Hanley DF, Wang P, Beauchamp NJ. Human brain hemorrhage: quantification of perihematoma
edema by use of diffusion-weighted MR imaging. AJNR Am J Neuroradiol. 2002;23(8):1322–1326. 53. Li H, et al. Histological, cellular and behavioral assessments of stroke outcomes after photothrombosis-induced ischemia in
adult mice. BMC Neurosci. 2014;15:58. 54. Sairanen T, Karjalainen-Lindsberg ML, Paetau A, Ijas P, Lindsberg PJ. Apoptosis dominant in the periinfarct area of human
ischaemic stroke--a possible target of antiapoptotic treatments. Brain. 2006;129(Pt 1):189–199. 55. Dief AEE, Jirikowski GF, Ragab KES, Ibrahim HS. Ipsilateral and contralateral cortical apoptosis in rats after unilateral middle
cerebral artery occlusion. Anatomy. 2008;2:39–48. 56. Hou W, et al. Autophagy promotes ferroptosis by degradation of ferritin. Autophagy. 2016;12(8):1425–1428. 57. Umeano O, et al. Gender and age interact to affect early outcome after intracerebral hemorrhage. PLoS One. 2013;8(11):e81664. 58. Jog NR, Caricchio R. Differential regulation of cell death programs in males and females by poly (ADP-ribose) polymerase-1
and 17beta estradiol. Cell Death Dis. 2013;4:e758. 59. Kolesnikova LI, Darenskaya MA, Grebenkina LA, Dolgikh MI, Astakhova TA, Semenova NV. [Gender differences in param-
eters of lipid metabolism and of level of antioxidants in groups of juveniles--the Evenks and the europeans]. Zh Evol Biokhim Fiziol. 2014;50(1):31–37.
60. Salehzadeh F, Rune A, Osler M, Al-Khalili L. Testosterone or 17{beta}-estradiol exposure reveals sex-specific effects on glucose and lipid metabolism in human myotubes. J Endocrinol. 2011;210(2):219–229.
61. Hall ED, Pazara KE, Linseman KL. Sex differences in postischemic neuronal necrosis in gerbils. J Cereb Blood Flow Metab. 1991;11(2):292–298.
62. Wu H, Wu T, Xu X, Wang J, Wang J. Iron toxicity in mice with collagenase-induced intracerebral hemorrhage. J Cereb Blood Flow Metab. 2011;31(5):1243–1250.
63. Lapchak PA, Zhang JH, Noble-Haeusslein LJ. RIGOR guidelines: escalating STAIR and STEPS for effective translational research. Transl Stroke Res. 2013;4(3):279–285.
64. Jung S, et al. Analysis of fractalkine receptor CX(3)CR1 function by targeted deletion and green fluorescent protein reporter gene insertion. Mol Cell Biol. 2000;20(11):4106–4114.
65. Wang J, Fields J, Dore S. The development of an improved preclinical mouse model of intracerebral hemorrhage using double infusion of autologous whole blood. Brain Res. 2008;1222:214–221.
66. Zhao X, et al. Toxic role of prostaglandin E2 receptor EP1 after intracerebral hemorrhage in mice. Brain Behav Immun. 2015;46:293–310.
67. Morrison B, et al. L-arginyl-3,4-spermidine is neuroprotective in several in vitro models of neurodegeneration and in vivo isch-aemia without suppressing synaptic transmission. Br J Pharmacol. 2002;137(8):1255–1268.
68. Li Q, Han X, Wang J. Organotypic hippocampal slices as models for stroke and traumatic brain injury. Mol Neurobiol. 2016;53(6):4226–4237.
69. Han X, et al. Inhibition of prostaglandin E2 receptor EP3 mitigates thrombin-induced brain injury. J Cereb Blood Flow Metab. 2016;36(6):1059–1074.
70. Zhang Y, et al. Rapid single-step induction of functional neurons from human pluripotent stem cells. Neuron. 2013;78(5):785–798.
71. Sagal J, et al. Proneural transcription factor Atoh1 drives highly efficient differentiation of human pluripotent stem cells into dopaminergic neurons. Stem Cells Transl Med. 2014;3(8):888–898.
72. Wang JB, et al. Targeting mitochondrial glutaminase activity inhibits oncogenic transformation. Cancer Cell. 2010;18(3):207–219.
73. Kravchenko DV, et al. Synthesis and structure-activity relationship of 4-substituted 2-(2-acetyloxyethyl)-8-(morpholine-4-sulfo-nyl)pyrrolo[3,4-c]quinoline-1,3-diones as potent caspase-3 inhibitors. J Med Chem. 2005;48(11):3680–3683.
74. Wu XN, et al. Distinct roles of RIP1-RIP3 hetero- and RIP3-RIP3 homo-interaction in mediating necroptosis. Cell Death Differ. 2014;21(11):1709–1720.
75. Seglen PO, Gordon PB. 3-Methyladenine: specific inhibitor of autophagic/lysosomal protein degradation in isolated rat hepato-cytes. Proc Natl Acad Sci U S A. 1982;79(6):1889–1892.
76. Wu H, et al. Cerebroprotection by the neuronal PGE2 receptor EP2 after intracerebral hemorrhage in middle-aged mice. J Cereb Blood Flow Metab. 2017;37(1):39–51.
77. Wu H, et al. PGE2 receptor agonist misoprostol protects brain against intracerebral hemorrhage in mice. Neurobiol Aging. 2015;36(3):1439–1450.
78. Chen J, et al. Iron accumulates in Huntington’s disease neurons: protection by deferoxamine. PLoS One. 2013;8(10):e77023. 79. Zhou J, et al. Long-term post-stroke changes include myelin loss, specific deficits in sensory and motor behaviors and complex
cognitive impairment detected using active place avoidance. PLoS One. 2013;8(3):e57503.
Downloaded from http://insight.jci.org on April 6, 2017. https://doi.org/10.1172/jci.insight.90777