Embed Size (px)
Citation preview
Inhibitory Control in Mind and Brain: An Interactive Race Model ofCountermanding Saccades
Leanne Boucher, Thomas J. Palmeri, Gordon D. Logan, and Jeffrey D. SchallVanderbilt University
The stop-signal task has been used to study normal cognitive control and clinical dysfunction. Its utilityis derived from a race model that accounts for performance and provides an estimate of the time it takesto stop a movement. This model posits a race between go and stop processes with stochasticallyindependent finish times. However, neurophysiological studies demonstrate that the neural correlates ofthe go and stop processes produce movements through a network of interacting neurons. The juxtapo-sition of the computational model with the neural data exposes a paradox—how can a network ofinteracting units produce behavior that appears to be the outcome of an independent race? The authorsreport how a simple, competitive network can solve this paradox and provide an account of what ismeasured by stop-signal reaction time.
Keywords: stop-signal task, cognitive control, frontal eye field, cognitive modeling, stochastic decisionmodels
The task of cognitive neuroscience is to bring behavioral andphysiological data together to explain how mental computationsare implemented in the brain. This task is difficult when behavioraland physiological data appear to contradict each other. In thesesituations, a new theory is required to resolve the contradiction.This article reports results from an endeavor to resolve a paradoxin the behavioral and physiological analyses of the stop-signaltask. For over 20 years, behavioral data have been modeled suc-cessfully in terms of a race between two independent processesthat respond to the stop signal and the go signal (Logan & Cowan,1984). However, the neural systems that control movements com-prise layers of inhibitory interactions between neurons that imple-ment movement inhibition and movement initiation (reviewed byMunoz & Schall, 2003). These two facts present a paradox: Howcan interacting neurons produce behavior that appears to be theoutcome of independent processes? We present a new theory of
performance in the stop-signal task—the interactive race model—which assumes that the stop and go processes are independent formost of their latent periods. After this latent period, a second stageoccurs in which the stop process interacts strongly and briefly tointerrupt the go process. The theory resolves the paradox andunifies behavioral and physiological perspectives on stop-signaltask performance. More generally, our work illustrates a novelapproach to bringing neurophysiological data to bear on quantita-tive computational model testing.
The Stop-Signal Task
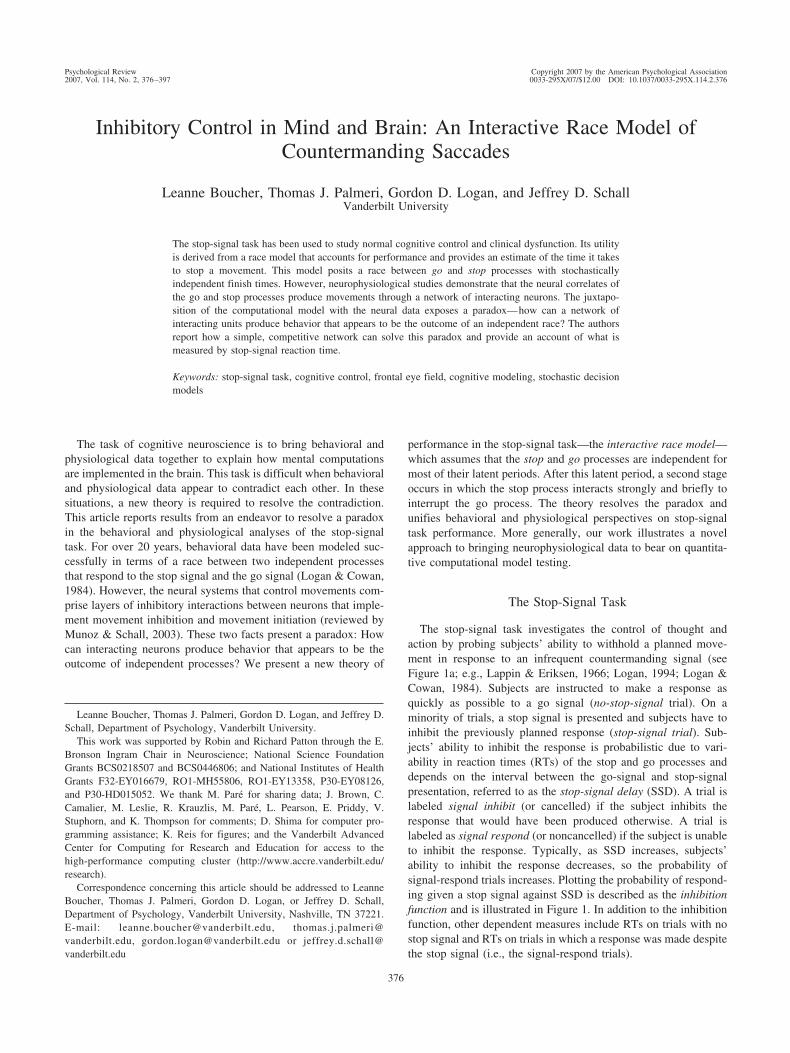
The stop-signal task investigates the control of thought andaction by probing subjects’ ability to withhold a planned move-ment in response to an infrequent countermanding signal (seeFigure 1a; e.g., Lappin & Eriksen, 1966; Logan, 1994; Logan &Cowan, 1984). Subjects are instructed to make a response asquickly as possible to a go signal (no-stop-signal trial). On aminority of trials, a stop signal is presented and subjects have toinhibit the previously planned response (stop-signal trial). Sub-jects’ ability to inhibit the response is probabilistic due to vari-ability in reaction times (RTs) of the stop and go processes anddepends on the interval between the go-signal and stop-signalpresentation, referred to as the stop-signal delay (SSD). A trial islabeled signal inhibit (or cancelled) if the subject inhibits theresponse that would have been produced otherwise. A trial islabeled as signal respond (or noncancelled) if the subject is unableto inhibit the response. Typically, as SSD increases, subjects’ability to inhibit the response decreases, so the probability ofsignal-respond trials increases. Plotting the probability of respond-ing given a stop signal against SSD is described as the inhibitionfunction and is illustrated in Figure 1. In addition to the inhibitionfunction, other dependent measures include RTs on trials with nostop signal and RTs on trials in which a response was made despitethe stop signal (i.e., the signal-respond trials).
Leanne Boucher, Thomas J. Palmeri, Gordon D. Logan, and Jeffrey D.Schall, Department of Psychology, Vanderbilt University.
This work was supported by Robin and Richard Patton through the E.Bronson Ingram Chair in Neuroscience; National Science FoundationGrants BCS0218507 and BCS0446806; and National Institutes of HealthGrants F32-EY016679, RO1-MH55806, RO1-EY13358, P30-EY08126,and P30-HD015052. We thank M. Pare for sharing data; J. Brown, C.Camalier, M. Leslie, R. Krauzlis, M. Pare, L. Pearson, E. Priddy, V.Stuphorn, and K. Thompson for comments; D. Shima for computer pro-gramming assistance; K. Reis for figures; and the Vanderbilt AdvancedCenter for Computing for Research and Education for access to thehigh-performance computing cluster (http://www.accre.vanderbilt.edu/research).
Correspondence concerning this article should be addressed to LeanneBoucher, Thomas J. Palmeri, Gordon D. Logan, or Jeffrey D. Schall,Department of Psychology, Vanderbilt University, Nashville, TN 37221.E-mail: [email protected], [email protected], [email protected] or [email protected]
Psychological Review Copyright 2007 by the American Psychological Association2007, Vol. 114, No. 2, 376–397 0033-295X/07/$12.00 DOI: 10.1037/0033-295X.114.2.376
376
This task has been used extensively to study executive con-trol and flexibility in behavior. Numerous experimental manip-ulations of the stop-signal task have yielded very similar re-sults, demonstrating the generality of the task as an empiricalmodel of self-control. For example, stop signals have rangedfrom visual (e.g., Lappin & Eriksen, 1966) to auditory (e.g.,Logan, 1981; Logan, Cowan, & Davis, 1984; Osman, Korn-blum, & Meyer, 1986, 1990) to tactile (e.g., Akerfelt, Colonius,& Diederich, 2005). Visual stop signals have been presentedcentrally or peripherally (e.g., Asrress & Carpenter, 2001; Ca-bel, Armstrong, Reingold, & Munoz, 2000). Responses haveincluded key presses (e.g., Logan et al., 1984; Osman et al.,
1986, 1990), typing responses (e.g., Logan, 1982), speech out-put (e.g., Ladefoged, Silverstein, & Papcun, 1973), arm move-ments (e.g., McGarry, Chua, & Franks, 2003; Slater-Hammel,1960), hand squeezes (e.g., De Jong, Coles, & Logan, 1995; DeJong, Coles, Logan, & Gratton, 1990), hand movements (e.g.,Boucher, Stuphorn, Logan, Schall, & Palmeri, in press), eyemovements (e.g., Hanes & Carpenter, 1999; Logan & Irwin,2000), and eye– head gaze shifts (e.g., Corneil & Elsley, 2005).Performance in this task has been investigated also in macaquemonkeys (e.g., Hanes & Schall, 1995; Kornylo, Dill, Saenz, &Krauzlis, 2003) and rats (e.g., Eagle & Robbins, 2003; Feola, deWit, & Richards, 2000).
Figure 1. Saccade countermanding task. a: On no-stop-signal trials, monkeys were rewarded for shifting gazeto an eccentric visual target that appeared when the fixation point disappeared. On stop-signal trials, the fixationpoint reappeared after a variable delay following target presentation. Monkeys were positively reinforced if theyinhibited the saccade when the stop signal appeared, but they produced signal-respond errors especially afterlonger stop-signal delays (SSDs). b: Race model outcome when rtgo � rtstop � SSD, resulting in a signal-inhibittrial (top panel), and when rtgo � rtstop � SSD, resulting in a signal-respond trial (bottom panel). Above eachgraph is a timeline marking the onset and offset of the fixation (F) and target (T). c: An idealized inhibitionfunction plotting the proportion of signal-respond trials as a function of SSD. D� and D� indicate the proportionof signal-respond trials at SSDs of 100 ms and 150 ms, respectively. d: Schematic illustrating how stop-signalreaction time (SSRT) is calculated at two different SSDs by the integration method. See the text for details.
377INTERACTIVE MODEL OF COUNTERMANDING
Performance on the stop-signal task is qualitatively indistin-guishable across all these stimulus modalities, effectors, and spe-cies. This generality implies that a unified account is possible.Such an account is provided by a race model, which assumes thatperformance is the outcome of a race between a go processresponsible for initiating the movement and a stop process respon-sible for inhibiting the movement (Logan & Cowan, 1984; see alsoBecker & Jurgens, 1979; Lisberger, Fuchs, King, & Evinger, 1975;Logan, 1981; Olman, 1973). Since its mathematically explicitformulation over 20 years ago, this model has been tested exten-sively (e.g., Band, van der Molen, & Logan, 2003; Colonius, 1990;Colonius, Ozyurt, & Arndt, 2001; De Jong et al., 1990), and nomajor alternative theory has been proposed.
According to the race model, behavior is governed by the finishtimes of the go and stop processes on a given trial, indicated by rtgo
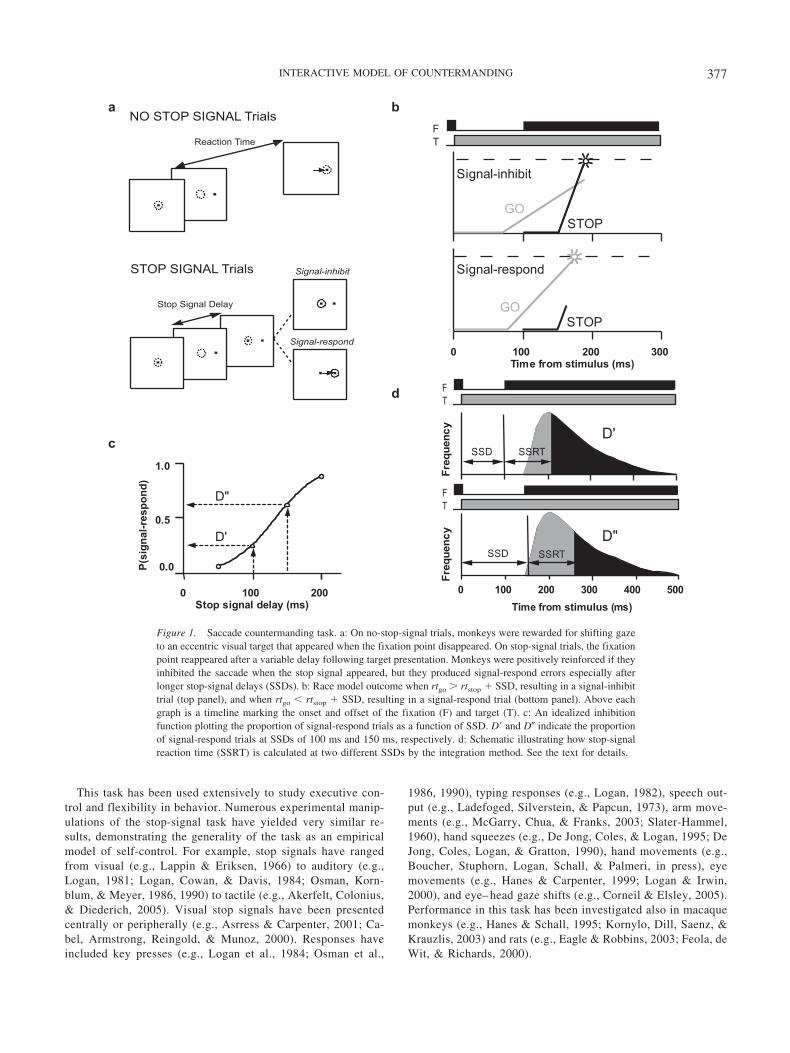
and rtstop, respectively. A response is initiated if rtgo � rtstop �SSD; a response is inhibited if rtgo � rtstop � SSD (see Figure 1b).Because the finish times for the go and stop processes are randomvariables (RTgo and RTstop, respectively), inhibition is probabilis-tic, which gives rise to the inhibition function (see Figure 1c).(Note that we use the lowercase rt to refer to an RT on a particulartrial and the uppercase RT to refer to the distribution of RTs.) Thisrace model formulation can account for the distribution of signal-respond RTs by relating the proportion of signal-respond trials ateach SSD (inhibition function) to the distribution of RT on trialswith no stop signal in the following manner. When no stop signalis presented, the full RTgo distribution is produced. When a stopsignal occurs, only a fraction of the RTgo distribution is producedbecause only the fastest RTs can escape inhibition. Said anotherway, only trials with a fast rtgo can finish before rtstop � SSD. AsSSD increases, the proportion of longer latency trials that canescape inhibition increases because more time can elapse beforethe stop process finishes (see Figure 1d). The RTs of signal-respond trials share a common minimum, because the fastestsamples from the RTgo distribution will always be produced re-gardless of SSD. However, the RTs of signal-respond trials willexhibit increasing maxima as SSD increases because the slowestsamples from the RTgo distribution will be produced only at the
longer SSDs. Figure 2b plots signal-respond RT distributions froma saccade stop-signal task as cumulative distribution functions.One can see how the signal-respond RT distributions exhibit adiverging pattern with the rightmost (i.e., slowest) distributionrepresenting the no-stop-signal RTs and the leftmost (i.e., fastest)distribution representing the signal-respond RTs at the shortestSSD.
Beyond articulating an account of the functional mechanismresponsible for performance, the race model provides a means forestimating the time needed to inhibit a response, referred to as thestop-signal reaction time (SSRT; Logan & Cowan, 1984). This isimportant because the response to the stop signal is not directlyobservable. If rtstop � SSD � rtgo, there is no overt response forwhich latency can be measured. If rtstop � SSD � rtgo, a responseoccurs, and we know that rtstop � SSD must have been longer thanthe latency of that response—however, we do not know how muchlonger. The race model provides several methods for estimatingSSRT from the inhibition function and the no-stop-signal RTdistribution (Colonius, 1990; De Jong et al, 1990; Logan &Cowan, 1984). The simplest method of estimating SSRT assumesthat SSRT is a constant. The method is illustrated in Figure 1d. Thefinishing time of the stop process divides the no-stop-signal RTdistribution into two parts, one in which rtgo is less than SSD �SSRT and one in which rtgo is greater than SSD � SSRT. The areaunder the no-stop-signal RT distribution corresponding to the firstpart equals the proportion of signal-respond trials at that SSD, andthe area under the no-stop-signal RT distribution corresponding tothe second part equals the proportion of signal-inhibit trials at thatSSD. Thus, SSRT is estimated by finding the point that divides theno-stop-signal RT distribution into these two parts and subtractingSSD. Other methods of estimating SSRT do not assume that SSRTis constant (Colonius, 1990; De Jong et al., 1990; Logan & Cowan,1984), but mathematical analysis (Logan & Cowan, 1984) andcomputer simulation (Band et al., 2003; De Jong et al. 1990) haveshown that the assumption of constant SSRT does not bias theestimation substantially.
Measures of SSRT have been used extensively as indices ofself-control across a variety of domains including human devel-
Figure 2. Observed behavioral data. a: Proportion of signal-respond trials as a function of stop-signal delay(SSD), that is, the inhibition function. b: Cumulative distribution of response times from no-stop-signal (blackline) and signal-respond trials at different SSDs (lighter gray lines for progressively earlier SSDs).
378 BOUCHER, PALMERI, LOGAN, AND SCHALL
opment (e.g., Bedard et al., 2002; Ridderinkhof, Band, & Logan,1999; Williams, Ponesse, Schachar, Logan, & Tannock, 1999),aging (e.g., Kramer, Humphrey, Larish, Logan, & Strayer, 1994),and individual differences (e.g., Logan, Schachar, & Tannock,1997; Miyake et al., 2000). Psychiatrists and clinical psychologistshave used SSRT to assess deficits in cognitive control due to braindamage (Dimitrov et al., 2003), diseases of the brain such asParkinson’s disease (Gauggel, Rieger, & Feghoff, 2004), andpsychopathologies such as schizophrenia (Badcock, Michie, John-son, & Combrinck, 2002; Carter et al., 2003). SSRT measures havebeen particularly useful in understanding attention-deficit/hyperactivity disorder (ADHD; see Nigg, 2001, for review). Manystudies have shown that SSRT is slower in children with ADHDthan in psychiatric and nonpsychiatric control children (Armstrong& Munoz, 2003; Oosterlaan, Logan, & Sergeant, 1998; Schachar& Logan, 1990; Schachar, Mota, Logan, Tannock, & Klim, 2000;Schachar, Tannock, & Logan, 1993). Indeed, some researchershave suggested inhibitory control as the core deficit in ADHD; theother deficits being a consequence of a fundamental deficiency ininhibitory control (Barkley, 1997). SSRT is useful in clinicalapplications because it is a single datum that measures the inhib-itory ability of a subject. SSRT can be correlated with measures ofother abilities or used to distinguish the abilities of one group fromthose of another. All of this research rests on the validity of SSRTas a measure of inhibitory processing, which, in turn, relies on thevalidity of the race model. The race model’s assumption that thestop and go processes are independent is critical. As documentedbelow, certain forms of neural interaction may challenge the in-dependence assumption in ways that could invalidate SSRT as ameasure of inhibitory control. Thus, a major purpose of this articleis to assess the validity of the race model and measures of SSRTthat are derived from it.
Neural Correlates of Stopping
To make progress in linking cognitive processes with neuro-physiology, researchers must identify the population of neuronsthat carry out a particular cognitive process. This mapping hasbeen referred to as a linking proposition, and the population ofneurons instantiating the linking proposition has been referred toas a bridge locus (Brindley, 1970; Schall, 2004; Teller, 1984;Teller & Pugh, 1983). Recent research using a saccade stop-signaltask has identified a plausible bridge locus for the go and stopprocesses of the race model in particular neurons in the frontal eyefields (Hanes, Patterson, & Schall, 1998) and superior colliculus(Pare & Hanes, 2003), two structures responsible for saccadicpreparation and generation. We identify the stop process withfixation cells and the go process with movement cells in frontaleye fields and superior colliculus.
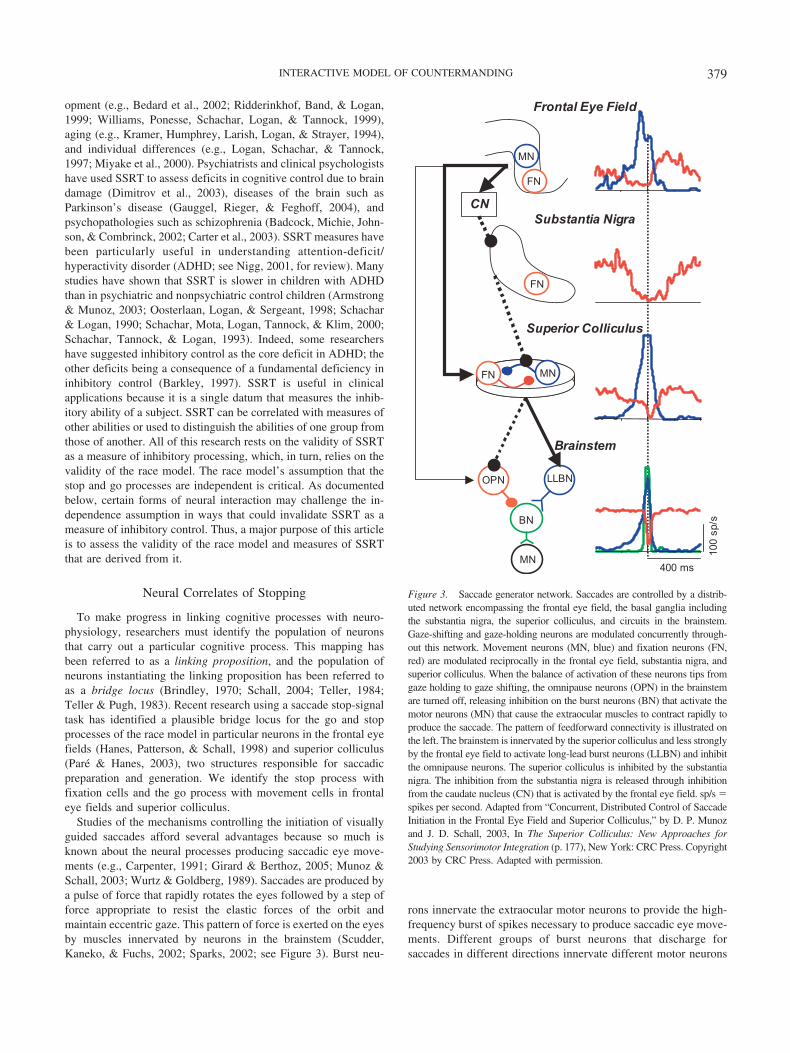
Studies of the mechanisms controlling the initiation of visuallyguided saccades afford several advantages because so much isknown about the neural processes producing saccadic eye move-ments (e.g., Carpenter, 1991; Girard & Berthoz, 2005; Munoz &Schall, 2003; Wurtz & Goldberg, 1989). Saccades are produced bya pulse of force that rapidly rotates the eyes followed by a step offorce appropriate to resist the elastic forces of the orbit andmaintain eccentric gaze. This pattern of force is exerted on the eyesby muscles innervated by neurons in the brainstem (Scudder,Kaneko, & Fuchs, 2002; Sparks, 2002; see Figure 3). Burst neu-
rons innervate the extraocular motor neurons to provide the high-frequency burst of spikes necessary to produce saccadic eye move-ments. Different groups of burst neurons that discharge forsaccades in different directions innervate different motor neurons
Figure 3. Saccade generator network. Saccades are controlled by a distrib-uted network encompassing the frontal eye field, the basal ganglia includingthe substantia nigra, the superior colliculus, and circuits in the brainstem.Gaze-shifting and gaze-holding neurons are modulated concurrently through-out this network. Movement neurons (MN, blue) and fixation neurons (FN,red) are modulated reciprocally in the frontal eye field, substantia nigra, andsuperior colliculus. When the balance of activation of these neurons tips fromgaze holding to gaze shifting, the omnipause neurons (OPN) in the brainstemare turned off, releasing inhibition on the burst neurons (BN) that activate themotor neurons (MN) that cause the extraocular muscles to contract rapidly toproduce the saccade. The pattern of feedforward connectivity is illustrated onthe left. The brainstem is innervated by the superior colliculus and less stronglyby the frontal eye field to activate long-lead burst neurons (LLBN) and inhibitthe omnipause neurons. The superior colliculus is inhibited by the substantianigra. The inhibition from the substantia nigra is released through inhibitionfrom the caudate nucleus (CN) that is activated by the frontal eye field. sp/s �spikes per second. Adapted from “Concurrent, Distributed Control of SaccadeInitiation in the Frontal Eye Field and Superior Colliculus,” by D. P. Munozand J. D. Schall, 2003, In The Superior Colliculus: New Approaches forStudying Sensorimotor Integration (p. 177), New York: CRC Press. Copyright2003 by CRC Press. Adapted with permission.
379INTERACTIVE MODEL OF COUNTERMANDING
that in turn innervate different muscles. The burst neurons aresubject to potent monosynaptic inhibition from omnipause neu-rons. Omnipause neurons discharge tonically during fixation. Im-mediately prior to initiation of a saccade in any direction, omni-pause neurons cease discharging, releasing the inhibition on theappropriate pools of burst neurons to produce the burst in themotor neurons necessary to shift gaze in the desired direction.Upon completion of the saccade, omnipause neurons reactivate toreinstate inhibition on the burst neurons. Omnipause neurons arenot modulated during the �100-ms period before saccade initia-tion when preparatory processes that affect RTs occur (Everling,Pare, Dorris, & Munoz, 1998).
The neural events preceding activation of the brainstem saccadegenerator occur in a circuit distributed through particular areas ofthe frontal lobe (e.g., Bruce & Goldberg 1985; reviewed by Schall,1997), the basal ganglia (e.g., Hikosaka & Wurtz, 1983a, 1983b,1983c; reviewed by Hikosaka, Takikawa, & Kawagoe, 2000),cerebellum (e.g., Kase, Miller, & Noda, 1980; reviewed by Thier,Dicke, Haas, Thielert, & Catz, 2002), and superior colliculus(Schiller & Korner, 1971; Sparks, 1975; Wurtz & Goldberg, 1972;reviewed by Munoz, Dorris, Pare, & Everling, 2000; Munoz &Schall, 2003; see Figure 3). This circuit conveys to the brainstemsaccade generator signals controlling where and when to shiftgaze. The superior colliculus is organized in a topographic map ofsaccade direction and amplitude. The frontal eye field has arougher map of saccade amplitude, and the frontal eye field andsuperior colliculus are connected topographically. Thus, the direc-tion and amplitude of the saccade produced is dictated by thelocation in the map of the active population of neurons. However,neurons in frontal eye field and superior colliculus have broadmovement fields, so many neurons contribute to the generation ofany saccade by pooling activity through vector averaging.
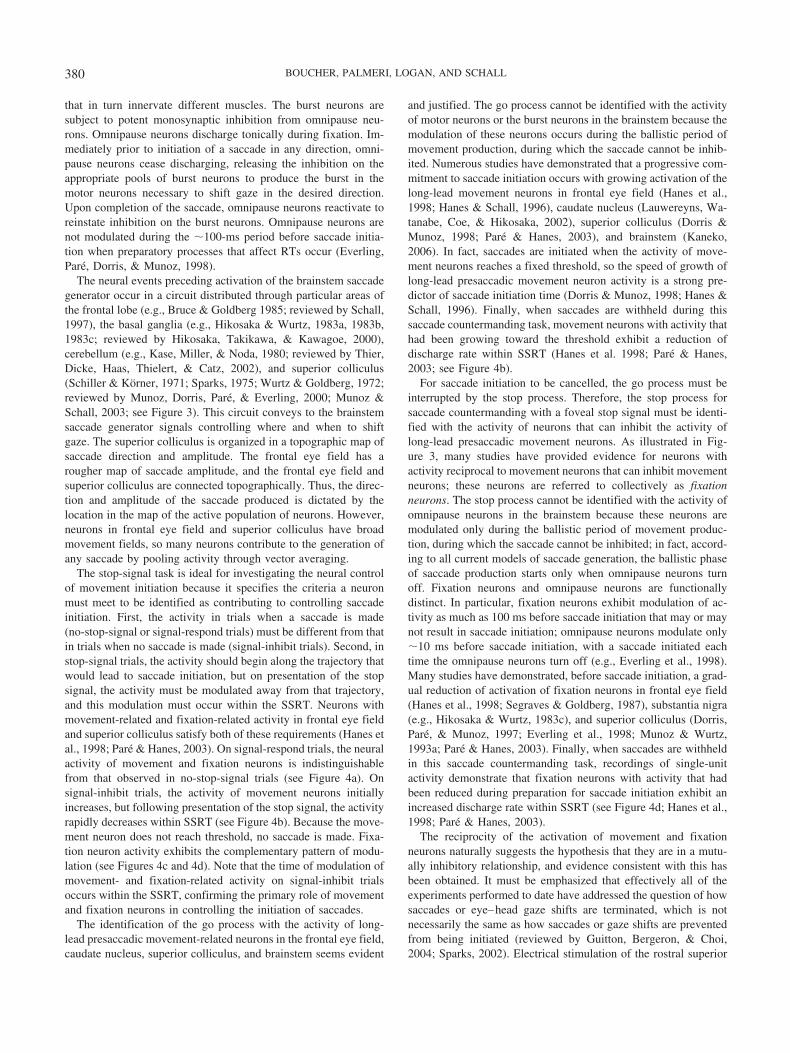
The stop-signal task is ideal for investigating the neural controlof movement initiation because it specifies the criteria a neuronmust meet to be identified as contributing to controlling saccadeinitiation. First, the activity in trials when a saccade is made(no-stop-signal or signal-respond trials) must be different from thatin trials when no saccade is made (signal-inhibit trials). Second, instop-signal trials, the activity should begin along the trajectory thatwould lead to saccade initiation, but on presentation of the stopsignal, the activity must be modulated away from that trajectory,and this modulation must occur within the SSRT. Neurons withmovement-related and fixation-related activity in frontal eye fieldand superior colliculus satisfy both of these requirements (Hanes etal., 1998; Pare & Hanes, 2003). On signal-respond trials, the neuralactivity of movement and fixation neurons is indistinguishablefrom that observed in no-stop-signal trials (see Figure 4a). Onsignal-inhibit trials, the activity of movement neurons initiallyincreases, but following presentation of the stop signal, the activityrapidly decreases within SSRT (see Figure 4b). Because the move-ment neuron does not reach threshold, no saccade is made. Fixa-tion neuron activity exhibits the complementary pattern of modu-lation (see Figures 4c and 4d). Note that the time of modulation ofmovement- and fixation-related activity on signal-inhibit trialsoccurs within the SSRT, confirming the primary role of movementand fixation neurons in controlling the initiation of saccades.
The identification of the go process with the activity of long-lead presaccadic movement-related neurons in the frontal eye field,caudate nucleus, superior colliculus, and brainstem seems evident
and justified. The go process cannot be identified with the activityof motor neurons or the burst neurons in the brainstem because themodulation of these neurons occurs during the ballistic period ofmovement production, during which the saccade cannot be inhib-ited. Numerous studies have demonstrated that a progressive com-mitment to saccade initiation occurs with growing activation of thelong-lead movement neurons in frontal eye field (Hanes et al.,1998; Hanes & Schall, 1996), caudate nucleus (Lauwereyns, Wa-tanabe, Coe, & Hikosaka, 2002), superior colliculus (Dorris &Munoz, 1998; Pare & Hanes, 2003), and brainstem (Kaneko,2006). In fact, saccades are initiated when the activity of move-ment neurons reaches a fixed threshold, so the speed of growth oflong-lead presaccadic movement neuron activity is a strong pre-dictor of saccade initiation time (Dorris & Munoz, 1998; Hanes &Schall, 1996). Finally, when saccades are withheld during thissaccade countermanding task, movement neurons with activity thathad been growing toward the threshold exhibit a reduction ofdischarge rate within SSRT (Hanes et al. 1998; Pare & Hanes,2003; see Figure 4b).
For saccade initiation to be cancelled, the go process must beinterrupted by the stop process. Therefore, the stop process forsaccade countermanding with a foveal stop signal must be identi-fied with the activity of neurons that can inhibit the activity oflong-lead presaccadic movement neurons. As illustrated in Fig-ure 3, many studies have provided evidence for neurons withactivity reciprocal to movement neurons that can inhibit movementneurons; these neurons are referred to collectively as fixationneurons. The stop process cannot be identified with the activity ofomnipause neurons in the brainstem because these neurons aremodulated only during the ballistic period of movement produc-tion, during which the saccade cannot be inhibited; in fact, accord-ing to all current models of saccade generation, the ballistic phaseof saccade production starts only when omnipause neurons turnoff. Fixation neurons and omnipause neurons are functionallydistinct. In particular, fixation neurons exhibit modulation of ac-tivity as much as 100 ms before saccade initiation that may or maynot result in saccade initiation; omnipause neurons modulate only�10 ms before saccade initiation, with a saccade initiated eachtime the omnipause neurons turn off (e.g., Everling et al., 1998).Many studies have demonstrated, before saccade initiation, a grad-ual reduction of activation of fixation neurons in frontal eye field(Hanes et al., 1998; Segraves & Goldberg, 1987), substantia nigra(e.g., Hikosaka & Wurtz, 1983c), and superior colliculus (Dorris,Pare, & Munoz, 1997; Everling et al., 1998; Munoz & Wurtz,1993a; Pare & Hanes, 2003). Finally, when saccades are withheldin this saccade countermanding task, recordings of single-unitactivity demonstrate that fixation neurons with activity that hadbeen reduced during preparation for saccade initiation exhibit anincreased discharge rate within SSRT (see Figure 4d; Hanes et al.,1998; Pare & Hanes, 2003).
The reciprocity of the activation of movement and fixationneurons naturally suggests the hypothesis that they are in a mutu-ally inhibitory relationship, and evidence consistent with this hasbeen obtained. It must be emphasized that effectively all of theexperiments performed to date have addressed the question of howsaccades or eye–head gaze shifts are terminated, which is notnecessarily the same as how saccades or gaze shifts are preventedfrom being initiated (reviewed by Guitton, Bergeron, & Choi,2004; Sparks, 2002). Electrical stimulation of the rostral superior
380 BOUCHER, PALMERI, LOGAN, AND SCHALL
colliculus, where fixation cells are concentrated, stops eye–headgaze shifts in cats (Pare & Guitton, 1998) and saccades in monkeys(Gandhi & Keller, 1999). This influence could be exerted throughmore than one circuit. First, fixation neurons could prevent gazesaccades through projections to omnipause neurons that inhibit thesaccade generator (e.g., Buttner-Ennever, Horn, Henn, & Cohen,1999; Takahashi, Sugiuchi, Izawa, & Shinoda, 2005; Yoshida,Iwamoto, Chimoto, & Shimazu, 2001). Second, fixation neuronscould inhibit movement neurons elsewhere in the superior collicu-lus (Munoz & Istvan, 1998; Takahashi et al., 2005). However, it
must be acknowledged that the evidence is not decisive in supportof the hypothesis that the movement neurons in the superiorcolliculus are gated by fixation neurons. For example, the move-ment neuron bursts tend to end just before or at the end of gazeshifts (Freedman & Sparks, 1997; Waitzman, Ma, Optican, &Wurtz, 1991), but fixation neurons exhibit peak activity �50 msafter gaze shifts (Choi & Guitton, 2006; Everling et al., 1998;Munoz & Wurtz, 1993a). Furthermore, experimental deactivationof the rostral superior colliculus results in excessive saccade ini-tiation, but the saccades do stop (Munoz & Wurtz, 1993b). The
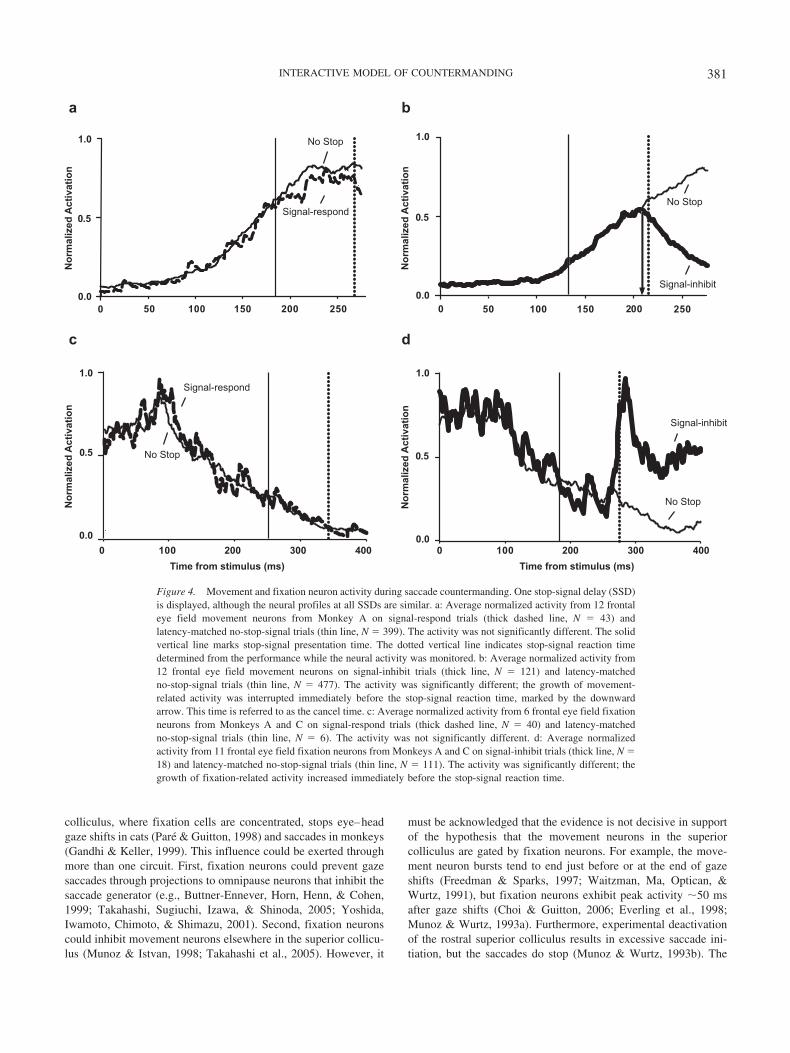
Figure 4. Movement and fixation neuron activity during saccade countermanding. One stop-signal delay (SSD)is displayed, although the neural profiles at all SSDs are similar. a: Average normalized activity from 12 frontaleye field movement neurons from Monkey A on signal-respond trials (thick dashed line, N � 43) andlatency-matched no-stop-signal trials (thin line, N � 399). The activity was not significantly different. The solidvertical line marks stop-signal presentation time. The dotted vertical line indicates stop-signal reaction timedetermined from the performance while the neural activity was monitored. b: Average normalized activity from12 frontal eye field movement neurons on signal-inhibit trials (thick line, N � 121) and latency-matchedno-stop-signal trials (thin line, N � 477). The activity was significantly different; the growth of movement-related activity was interrupted immediately before the stop-signal reaction time, marked by the downwardarrow. This time is referred to as the cancel time. c: Average normalized activity from 6 frontal eye field fixationneurons from Monkeys A and C on signal-respond trials (thick dashed line, N � 40) and latency-matchedno-stop-signal trials (thin line, N � 6). The activity was not significantly different. d: Average normalizedactivity from 11 frontal eye field fixation neurons from Monkeys A and C on signal-inhibit trials (thick line, N �18) and latency-matched no-stop-signal trials (thin line, N � 111). The activity was significantly different; thegrowth of fixation-related activity increased immediately before the stop-signal reaction time.
381INTERACTIVE MODEL OF COUNTERMANDING
body of evidence suggests that fixation neurons may not contributeto controlling saccade execution, but they are necessary for con-trolling saccade initiation, which is, by definition, just what thestop process is supposed to do. The evidentiary and conceptualgaps that prevent a more definite conclusion that the stop processcorresponds to the activity of gaze-holding fixation neurons high-light the need for and guide the focus of further neuroanatomicaland neurophysiological research to map these circuits.
Models of Saccade Production and RT
Sophisticated models of saccade generation have been formu-lated (for a review, see Girard & Berthoz, 2005). Models of thebrainstem circuits that generate saccades include a trigger signalthat releases the inhibition of omnipause neurons on burst neuronsto initiate saccades, but these models do not specify any charac-teristics of the trigger signal. The input to the brainstem arrivesfrom the superior colliculus and frontal eye field. Models ofsuperior colliculus contribution to saccade preparation and gener-ation have also been formulated that address several issues beyondthe scope of this article (reviewed by Girard & Berthoz, 2005). Forour purposes, we note that lateral inhibition is a central character-istic of many models of saccade production (Arai, Keller, &Edelman, 1994; Bozis & Moschovakis, 1998; Das, Gandhi, &Keller, 1995; van Opstal & van Gisbergen, 1989). The model ofTrappenberg, Dorris, Klein, and Munoz (2001) implemented short-range excitation and long-range inhibition across the map of sac-cades in the superior colliculus to account for the systematicvariation of saccade initiation times in different conditions. Sac-cade initiation time is influenced in this model by the balance ofinhibition between fixation and movement neurons. For example,the model produces the reduction of saccade latency consequent toremoval of a fixation point (gap effect) by reduced activation offixation neurons leading to reduced inhibition of movement neu-rons, allowing them to trigger the saccade sooner. However, arecent comprehensive review of saccade models concluded that thedynamics of these lateral interactions required more study toresolve the diverse and in some cases contradictory results (Girard& Berthoz, 2005).
Models that include cortical and basal ganglia circuits imple-ment gating of saccade initiation by selective disinhibition of thesuperior colliculus. This disinhibition has been conceived ofmainly in terms of target selection or working memory (e.g., J. W.Brown, Bullock, & Grossberg, 2004; Dominey & Arbib, 1992;Dominey, Arbib, & Joseph, 1995). In the model of J. W. Brown etal. (2004), the indirect pathway through the basal ganglia imple-ments a trainable stopping process used when a delay intervenesbefore a saccade. This stopping process operates by increasing theactivity in the subthalamic nucleus that produces additional acti-vation of the substantia nigra pars reticulata, thus increasing theinhibition on the saccade production circuit. Only a few models ofsaccade production have incorporated elements of frontal eye fieldfunctional organization (J. W. Brown et al., 2004; Mitchell &Zipser, 2003). These models use a fixation signal to specify thetiming of saccade initiation.
A significant shortcoming of all of these models is the lack ofstochastic elements capable of accounting for the range of saccadelatencies. Without stochastic elements, none of the aforementionedmodels can account for performance in the stop-signal task. This is
the central concern of our work, which seeks to build a bridgebetween neural network models of saccade generation formulatedat a circuit level and cognitive models of decision making formu-lated at a computational level (e.g., S. Brown & Heathcote, 2005;Carpenter & Williams, 1995; Link, 1975; Nosofsky & Palmeri,1997; Ratcliff, 1978; Usher & McClelland, 2001). Properly for-mulated, such a model can help translate more concretely betweenneural circuit level models of saccade production and higher levelmodels of eye movement production during tasks such as reading(e.g., Engbert, Nuthmann, Richter, & Kliegl, 2005; McDonald,Carpenter, & Shillcock, 2005; Reichle, Rayner, & Pollatsek,2003).
A Paradox Motivating the Interactive Race Model
The identification of the go and stop processes with movementand fixation neurons exposes a paradox. Given the overwhelmingevidence indicating that saccades are produced by a network ofmutually inhibitory gaze-shifting and gaze-holding neurons, howcan such interacting neural units produce behavior that appears tobe the outcome of a race between processes with independentfinishing times? This paradox must be resolved because the valid-ity of SSRT as a measure of cognitive control derives entirely fromthe validity of the independent race model.
The independent race model is almost universally accepted inthe literature on stop-signal studies. If the basic assumption ofindependence is false, then this entire body of work may requirereinterpretation. In particular, the validity of estimates of SSRTrelies on the assumption that the stop process has a specificduration that can be measured through application of the racemodel to behavior. The duration of the stop process is the SSRT.If the activity of movement-related and fixation-related neuronsinstantiates the go and stop processes and these neurons interactover an extended period of time, then the stop process would nothave a definite finishing time and so could not be described validlyin terms of an RT measure like SSRT. If SSRT is not a validmeasure of inhibitory control, then the utility of the stop-signalparadigm in studying clinical disorders and development, as wellas normal movement preparation and control, would be called intoquestion. Thus, an important outcome of this work is to establisha solid foundation for the measurement and interpretation of SSRTby obtaining a more secure understanding of how movementpreparation is interrupted.
It is critical to note that the independent race model is concernedexclusively with the finish times of the go and stop processes. Therace model makes no assumptions about the processes by whichthe RTs are generated beyond assuming they are stochasticallyindependent. This has been regarded as a virtue because it makesthe race model applicable to any distribution of stop and go times,provided they are stochastically independent (Logan & Cowan,1984). This study is concerned with only how the finish times ofthe go and stop processes can be generated in the neural circuitproducing saccadic eye movements.
We created a simple network consisting of two noisy accumu-lators identified as a go unit and a stop unit. We contrasted theperformance of an independent race model in which the go andstop units raced to a fixed threshold (see Figure 5a) with theperformance of an interactive race model in which the go and stopunits interacted through inhibitory connections (see Figure 6a). We
382 BOUCHER, PALMERI, LOGAN, AND SCHALL
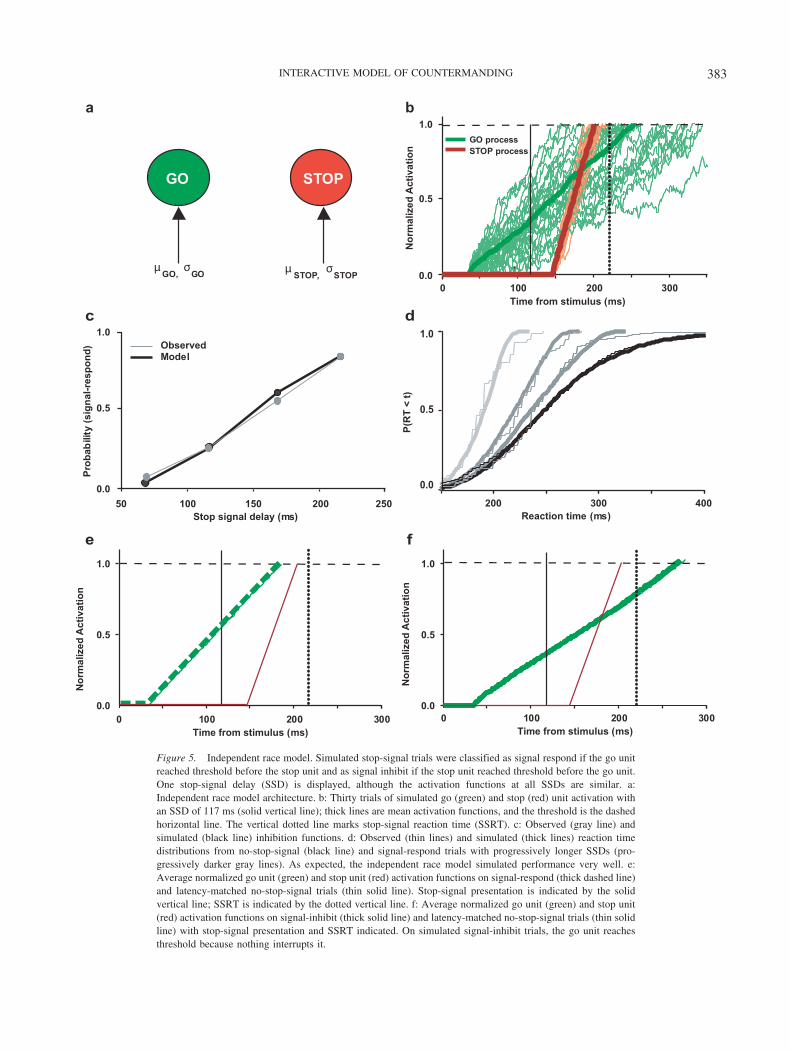
Figure 5. Independent race model. Simulated stop-signal trials were classified as signal respond if the go unitreached threshold before the stop unit and as signal inhibit if the stop unit reached threshold before the go unit.One stop-signal delay (SSD) is displayed, although the activation functions at all SSDs are similar. a:Independent race model architecture. b: Thirty trials of simulated go (green) and stop (red) unit activation withan SSD of 117 ms (solid vertical line); thick lines are mean activation functions, and the threshold is the dashedhorizontal line. The vertical dotted line marks stop-signal reaction time (SSRT). c: Observed (gray line) andsimulated (black line) inhibition functions. d: Observed (thin lines) and simulated (thick lines) reaction timedistributions from no-stop-signal (black line) and signal-respond trials with progressively longer SSDs (pro-gressively darker gray lines). As expected, the independent race model simulated performance very well. e:Average normalized go unit (green) and stop unit (red) activation functions on signal-respond (thick dashed line)and latency-matched no-stop-signal trials (thin solid line). Stop-signal presentation is indicated by the solidvertical line; SSRT is indicated by the dotted vertical line. f: Average normalized go unit (green) and stop unit(red) activation functions on signal-inhibit (thick solid line) and latency-matched no-stop-signal trials (thin solidline) with stop-signal presentation and SSRT indicated. On simulated signal-inhibit trials, the go unit reachesthreshold because nothing interrupts it.
383INTERACTIVE MODEL OF COUNTERMANDING
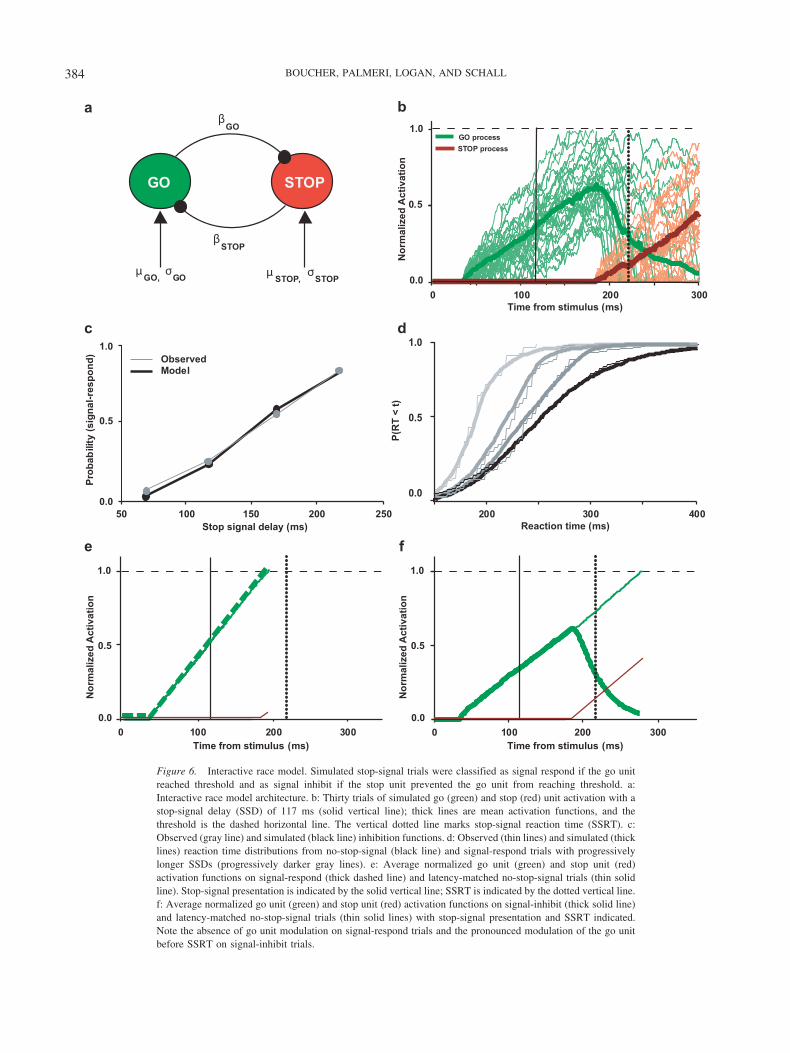
Figure 6. Interactive race model. Simulated stop-signal trials were classified as signal respond if the go unitreached threshold and as signal inhibit if the stop unit prevented the go unit from reaching threshold. a:Interactive race model architecture. b: Thirty trials of simulated go (green) and stop (red) unit activation with astop-signal delay (SSD) of 117 ms (solid vertical line); thick lines are mean activation functions, and thethreshold is the dashed horizontal line. The vertical dotted line marks stop-signal reaction time (SSRT). c:Observed (gray line) and simulated (black line) inhibition functions. d: Observed (thin lines) and simulated (thicklines) reaction time distributions from no-stop-signal (black line) and signal-respond trials with progressivelylonger SSDs (progressively darker gray lines). e: Average normalized go unit (green) and stop unit (red)activation functions on signal-respond (thick dashed line) and latency-matched no-stop-signal trials (thin solidline). Stop-signal presentation is indicated by the solid vertical line; SSRT is indicated by the dotted vertical line.f: Average normalized go unit (green) and stop unit (red) activation functions on signal-inhibit (thick solid line)and latency-matched no-stop-signal trials (thin solid lines) with stop-signal presentation and SSRT indicated.Note the absence of go unit modulation on signal-respond trials and the pronounced modulation of the go unitbefore SSRT on signal-inhibit trials.
384 BOUCHER, PALMERI, LOGAN, AND SCHALL
first found the best quantitative fit of the alternative model archi-tectures to behavioral data; these data were collected from ma-caque monkeys performing a saccade stop-signal task while neu-rophysiological data were collected from the frontal eye field(Hanes et al., 1998). We then assessed the correspondence of thego unit activation in the models with the pattern of movement-related neural activation; these neurophysiological recordings weremade at the same time as the behavioral data were collected onwhich the models were optimized. We also assessed the corre-spondence of the stop unit activation in the models with the patternof fixation-related activation. However, for this comparison weincluded fixation-related neurons recorded in the superior collicu-lus during a saccade stop-signal task (Pare & Hanes, 2003) be-cause, being rare, the number of fixation-related neurons in thefrontal eye fields was too small for meaningful analysis. In otherwords, the models were fit to the behavioral data, and then theactivation of the go and stop model units was compared with thepatterns of activity of movement and fixation neurons. The activityof purely visually responsive neurons was not incorporated intothis model analysis because those neurons in frontal eye field andsuperior colliculus do not influence saccade initiation (Hanes et al.,1998; Pare & Hanes, 2003).
This approach was taken for two reasons. First, prior researchhas shown that the race model provides excellent quantitativeaccounts of behavioral data. Any new model motivated by neuro-physiology must fit the behavioral data as well as the race modelirrespective of its account of neural data. Second, fitting themodels to only the behavioral data allowed us to assess how wellthey predict important aspects of the underlying neurophysiologyrather than simply fitting the neurophysiology with additional freeparameters. Thus, the activity of movement and fixation neuronsserved as logically converging evidence for selecting among com-peting models.
To satisfy the behavioral constraints, a viable network architec-ture must account for the RT distributions in no-stop-signal andsignal-respond trials and for the proportion of signal-respond trialsat each SSD (see Figures 2a and 2b). Consequently, a successfularchitecture must produce simulated data yielding an SSRT that isindistinguishable from that derived from the observed data. Tosatisfy the neural constraint, the average activation of the units inthe network must correspond qualitatively and quantitatively to thepattern of activity of neurons that were recorded as the behavioraldata were being collected (see Figure 4). Qualitatively, a success-ful model must produce go unit activation accumulating to reachthreshold on trials in which a saccade is made in no-stop-signal orsignal-respond trials and a decrease in activation after an initialaccumulation when saccades are inhibited on signal-inhibit trials.Conversely, stop unit activation must remain off when saccadesare made in no-stop-signal trials or signal-respond trials and be-come activated when saccades are withheld on signal-inhibit trials.Quantitatively, the time of this modulation relative to SSRT,referred to as cancel time, must fall within the range of such timesobtained from neurons in the frontal eye field and superior col-liculus. For movement-related neurons, the average cancel timemeasured was 8.5 ms before SSRT in the frontal eye field (Haneset al., 1998) and 10 ms before SSRT in the superior colliculus(Pare & Hanes, 2003). For fixation-related neurons, the averagecancel time was 0.2 ms after SSRT (not significantly different
from 0) in the frontal eye field (Hanes et al., 1998) and 13 msbefore SSRT in the superior colliculus (Pare & Hanes, 2003).
Behavior, Neurophysiology, and Computational Modeling
Behavioral Measures
The data fit by the model were collected in the first neurophys-iological study using the stop-signal task (Hanes et al., 1998).These data were collected from the frontal eye field, but qualita-tively and in important respects quantitatively identical data havebeen obtained in a subsequent study of the superior colliculus(Pare & Hanes, 2003). Two monkeys were trained in a saccadestop-signal task for the frontal eye field study. Each trial beganwith the presentation of a central fixation spot. After a variabledelay, the fixation point was extinguished and a target appearedeither within a neuron’s receptive field or opposite that location.Monkeys were rewarded if they shifted gaze to the target location.On a fraction of trials (average of 29% for Monkey C and 25% forMonkey A), the fixation point reilluminated, and monkeys wererewarded for maintaining fixation. The interval between fixationpoint disappearance and reappearance was the SSD.
The behavioral data fit by the model constitute a select subset ofall the data reported in Hanes et al. (1998). The following inclusioncriteria were applied: (a) The behavioral data were collected whilea clear movement-related neuron was recorded, (b) the inhibitionfunction included at least three SSDs and spanned from less than0.2 at the shortest SSD to more than 0.7 at the longest SSD, and (c)more than 100 trials were collected at each SSD. Adopting thesestrict criteria ensured the consistency but reduced the quantity ofdata, so we combined neural and behavioral data across sessionsand neurons to obtain a sufficiently large data set to evaluatecompeting models. The activity of fixation cells recorded in thefrontal eye field and superior colliculus during other sessions withcomparable performance was also compared with the model unitactivation.
On the basis of these criteria, we culled 1,976 trials from 5movement neurons for Monkey C and 2,075 trials from 12 move-ment neurons for Monkey A. Although the number of neurons mayseem small, the number of trials is more important because modelparameters are optimized on the basis of the behavioral data andnot the neural data. SSDs were 69, 117, 169, and 217 ms forMonkey C and 84, 101, 134, 184, 201, and 234 ms for Monkey A.The data fit by the models were the RT distributions for no-stop-signal trials, the RT distributions for signal-respond trials at eachSSD, and the inhibition function (i.e., the proportion of signal-respond trials at each SSD; see Figure 2).
We calculated the SSRT for each monkey separately using theintegration method (Logan, 1994; Logan & Cowan, 1984). Foreach SSD, SSRT was defined as the RT at which the integral of theno-stop-signal RT distribution equaled the proportion of signal-respond trials at that SSD minus the SSD. SSRT was then averagedover SSD for each monkey. In the data set fit by the model, SSRTswere 71 ms and 94 ms for Monkeys A and C, respectively.
Neurophysiological Measures
Neural activation functions were derived from spike trains thatwere converted to spike density functions as described previously
385INTERACTIVE MODEL OF COUNTERMANDING
(Hanes et al., 1998). It is important to note that we are not fittingthe fine-scale fluctuations of neural activity; rather, we are assess-ing qualitatively the pattern of modulation and quantitatively thetime of the major modulations in the different types of trials. Thisapproach is based on the premise that a population of neurons witha specific function respond in generally the same way, but eachneuron in that population has idiosyncrasies probably derived fromincidental variation in local circuit connectivity (e.g., Marder &Goaillard, 2006). For example, all movement-related neurons in-crease their activity before a movement, but one neuron may havea stronger burst while another may grow at a steady rate. Toaverage across neurons, we first normalized the spike densityfunction of each neuron by dividing its activity by the peak firingrate in the interval from 20 ms before to 50 ms after saccadeinitiation on no-stop-signal trials. Go unit activation was comparedwith movement neuron activity. Stop unit activation was comparedwith fixation neuron activity.
For both neurons and model units, activation on signal-inhibit orsignal-respond trials was compared with the activity of a subset oflatency-matched no-stop-signal trials. No-stop-signal trials withrt � SSD � SSRT were compared with signal-inhibit trials,because according to the race model, the saccade would have beeninhibited had the stop signal been presented. No-stop-signal trialswith rt � SSD � SSRT were compared with signal-respond trials,because according to the race model, the saccade would have beeninitiated even if the stop signal had occurred.
For the go unit, as for movement neurons, cancel time wasdefined as the time at which activation on signal-inhibit trialssignificantly diverged from the activation on no-stop-signal trialsrelative to SSRT. This required measuring the difference betweenthe time-varying activation in these two trial types. In the originalneurophysiological study, a particular measurement procedure andcriterion were used that afforded the necessary balance betweensensitivity and robustness (Hanes et al., 1998; see also Pare &Hanes, 2003). To provide comparable measurements for this study,we used the same procedure and criterion. Specifically, canceltime was defined as the instant the difference in the activation onsignal-inhibit and latency-matched no-stop-signal trials becamesignificant, that is, exceeded the largest difference expected bychance. The baseline distribution of differences expected bychance was measured in the period before any modulation waspossible, that is, from 600 ms before target onset to SSD for theneural data and the time between the start of the go unit activationand the start of the stop unit activation for the model. The criterionfor a significant departure from random variation was when thedifference first surpassed 2 SD of the baseline difference providedthe difference surpassed 6 SD within the next 50 ms.
Analyses of neural data show an effect of noise on estimates ofcancel time: the noisier the activation functions, the later the timeof the difference measured by the statistical criteria (Hanes et al.,1998). The model unit activation functions have considerably lessvariability than neural spike density functions because of thetremendously large number of trials that are simulated to generatestable model predictions. Consequently, we subsampled the acti-vation of the go and stop units in a manner comparable to thesampling of neural activity in the physiology experiments via thefollowing procedure. We simulated the model with 20–50 trials ateach SSD to mimic the number of trials typically obtained in thephysiology experiments. We then calculated the average activation
functions of the simulated trials and determined the time of mod-ulation at each SSD for the go unit (see Figure 7a). Cancel timewas the difference between the time of modulation of the go unitand SSRT, with negative and positive differences measuring timesbefore or after SSRT, respectively. We repeated this procedure 500times and calculated the average cancel time at each SSD as themeasure of the go unit cancel time; this was then statisticallycomparable to the physiological data.
Because activation in the stop unit remained at zero until SSD �Dstop (the stop unit delay), the criteria used for determining thecancel time of the go unit were not appropriate because there wasno noise in the activation.1 Therefore, we calculated the time atwhich the t value of the stop unit activation became significantlygreater than zero. To do this, we successively entered the stop unitactivation into a t test with df � N � 1, where N was equal to thenumber of units entered into the t test. Cancel time was determinedby the time at which it became significant at the p � .05 level,provided the difference remained significant for at least 50 ms.
Model Specifics
The independent race model is concerned with the finish timesof the go and stop processes and does not specify the way in whichthe finish times are achieved. Here, we extend the race model byformally describing the processes by which the finish times arise.Our approach was to analyze the performance of a family ofsimple networks consisting of a go unit and a stop unit that areeach noisy accumulators. These accumulators race toward a com-mon threshold. Depending on the network architecture, rules aboutwhich unit reached its threshold first determine whether a stop-signal trial is signal inhibit or signal respond. Our main compar-ison was between models with independent versus interactivenetwork architectures. In the independent model, the activation ofone unit has no effect on the activation of the second unit. Thismodel architecture is one particular instantiation of the indepen-dent race model of Logan and Cowan (1984; see also Hanes &Carpenter, 1999). We chose this instantiation because it allows adirect comparison with the interactive race model in which the goand stop units are mutually inhibitory.
1 Gaze-holding neurons are characterized by higher discharge ratesduring periods of visual fixation, hence the name fixation neurons. Thisattribute was not included in our modeling efforts, which focused onunderstanding how a stop process can interrupt a go process. Every modelhas boundaries, and we are confident that these efforts could be extendedto account for the activity of fixation neurons during fixation given priorwork demonstrating conditions for stability of mutual inhibitory networks(e.g., Machens, Romo, & Brody, 2005; Wong & Wang, 2006). In order todirectly compare the interactive race model with the independent model,we attempted to keep everything about those two models as equivalent aspossible. Indeed, this is a recommended practice in computational modelcomparison. If the competing models differ along a large number ofdimensions, it is difficult to determine which aspects of competing modelsare responsible for the success or failure of a model. By keeping thecompetitors as comparable as possible, we are able to explain why theinteractive race model provides a better account of both neurophysiologyand behavior than the independent race model. A more thoroughly fleshedout neural instantiation of the interactive race model would need to includea number of details that we did not include in our modeling efforts.
386 BOUCHER, PALMERI, LOGAN, AND SCHALL
Formally, the go and stop units accumulate activation accordingto the following stochastic differential equations (Usher & Mc-Clelland, 2001):
dago(t) �dt
[go � k � ago(t)��stop � astop(t)] � �dt
�go; (1)
dastop(t) �dt
[stop � k � astop(t) � �go � ago(t)] � �dt
�stop. (2)
These equations specify the change in unit activation (dago anddastop) within a time step dt (note that dt/ was set equal to 1). Themean growth rates of the go and stop units are given by the go andstop parameters, respectively. � is a Gaussian noise term with amean of zero and a variance of go
2 or stop2 . The leakage param-
eter, k, prevents the activation from increasing without bound. Ourinitial investigation determined that the leakage term could be setto zero. However, we discuss a version of the model with leakagebut with no inhibition below.
The key element of the interactive race model was the amountof inhibition between the go and stop units specified by the �parameters. �go specifies the inhibition of the go unit on the stopunit, and �stop specifies the inhibition of the stop unit on the gounit. The amounts of inhibition depend on the instantaneous acti-vation levels (ago or astop), causing a unit with a low activation tohave a small inhibitory effect on the other unit. Together, theseparameters specify the increment of activation on each time steptoward a response threshold. The response threshold was fixed at1,000 for both units, but other values produce the same resultsbecause the other parameters scale accordingly. The activationswere rectified to be greater than zero as specified in the model ofUsher and McClelland (2001).
Other parameters in the models capture the times for otherstages of processing. Stimulus encoding that occurs before go unitand stop unit activation was instantiated as a constant delay be-tween stimulus presentation and activation in the go unit andbetween stop-signal presentation and activation in the stop unit.
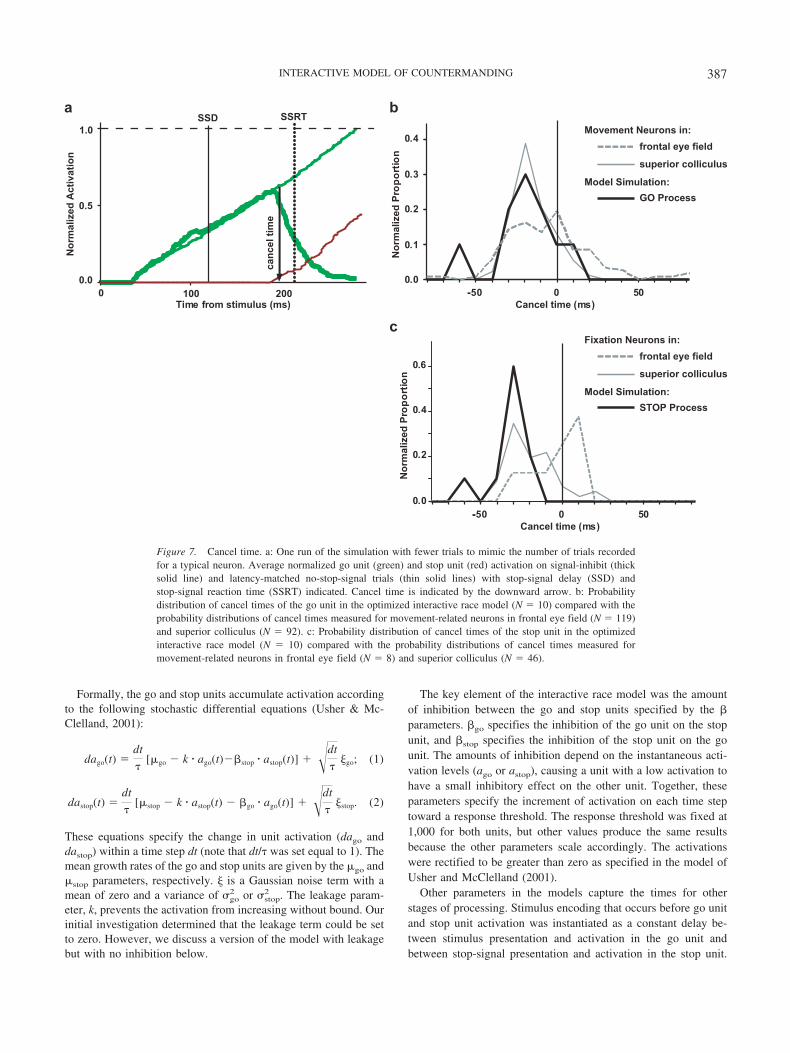
Figure 7. Cancel time. a: One run of the simulation with fewer trials to mimic the number of trials recordedfor a typical neuron. Average normalized go unit (green) and stop unit (red) activation on signal-inhibit (thicksolid line) and latency-matched no-stop-signal trials (thin solid lines) with stop-signal delay (SSD) andstop-signal reaction time (SSRT) indicated. Cancel time is indicated by the downward arrow. b: Probabilitydistribution of cancel times of the go unit in the optimized interactive race model (N � 10) compared with theprobability distributions of cancel times measured for movement-related neurons in frontal eye field (N � 119)and superior colliculus (N � 92). c: Probability distribution of cancel times of the stop unit in the optimizedinteractive race model (N � 10) compared with the probability distributions of cancel times measured formovement-related neurons in frontal eye field (N � 8) and superior colliculus (N � 46).
387INTERACTIVE MODEL OF COUNTERMANDING
Thus, each model unit activation is set to zero until stimulusencoding is complete. The stop unit delay (Dstop) is a free param-eter of the model. We chose to constrain the go unit delay (Dgo)separately for each monkey on the basis of the average time atwhich the sample of movement neurons began to increase dis-charge rate in response to target presentation. We wanted tocompare go unit activity with movement neuron activity to eval-uate the neural predictions of the models, so it was necessary forthe activation to start at times that were constrained by the neuraldata. The average was derived from the activity of 10 trials, sortedby RT to control for RT-dependent differences in activationgrowth, aligned on target presentation (Hanes & Schall, 1996). Forthis study, the beginning of activation was the latest time meetingthe following criteria: (a) Spike density values increased signifi-cantly according to a Spearman correlation over an interval rang-ing from �20 ms to 20 ms, (b) the spike density at that time wasless than the midpoint between the baseline and the thresholdmeasured in the interval 200 ms before target onset, and (c) thecorrelation remained nonsignificant for 200 ms before the time. Inthis way, Dgo values were set to 80 ms and 35 ms for Monkeys Aand C, respectively. Finally, we assumed a ballistic interval of 10ms preceding the eye movement after the go unit accumulatedactivation to its threshold (goballistic). This estimate corresponds tothe time prior to a saccade during which the omnipause neuronscease firing and thus allows the eyes to move (e.g., Everling et al.,1998; Scudder et al., 2002). The time between the onset of acti-vation of the go unit and that activation hitting threshold is definedas goRT. Consequently, the simulated go unit finish time for eachtrial (rtgo) is equal to Dgo � goRT � goballistic.
We formulated independent and interactive models within theabove general architecture. By constraining particular parameters,we defined special cases that could be compared quantitativelywith a more general model using hierarchical model testing tech-niques. In particular, the presence or absence of inhibition betweenthe go and stop units created models with two distinct architec-tures. In the independent race architecture (see Figure 5a), inhibi-tion between the go and stop units was absent (�go � �stop � 0),so the outcome of a trial was dictated by a simple race of the goand stop units to their respective thresholds. If the go unit reachedthreshold first so that rtgo � rtstop � SSD, then a signal-respondtrial was produced; if the stop unit reached threshold first so thatrtstop � SSD � rtgo, then a signal-inhibit trial occurred.
In the interactive race architecture (see Figure 6a), the stop andgo units were mutually inhibitory, so a signal-respond trial oc-curred if the go unit reached threshold, and a signal-inhibit trialoccurred if the stop unit prevented the go unit from reachingthreshold. Models with alternative architectures were assessed ontheir ability to satisfy the converging constraints of accounting forthe essential characteristics of both behavioral and neural dataobtained from monkeys performing the saccade stop-signal task(Hanes et al., 1998; Pare & Hanes, 2003).2
Models were fit quantitatively to the behavioral data with asearch routine that found parameters that optimized the fit betweenmodel predictions and observed data. Following recommendationsby Ratcliff and Tuerlinckx (2002), we optimized the fit of eachmodel to the behavioral data by minimizing a Pearson chi-squarestatistic,
�2 � �i
�j
(oij � pij)2
pij. (3)
The first summation over i indexes the various SSD conditions andthe no-stop-signal condition. Within each condition, a particularobservation or prediction can fall into one of several bins. The oij
and pij tally the number of observations and predictions that fall ineach bin, respectively, where each bin is indexed by j. On no-stop-signal trials, an observation could fall into one of five RT bins(quintiles) in the RT distribution; a model prediction could also fallinto one of those same bins. On stop-signal trials, for each SSD, anobservation could fall either into one of five RT bins on signal-respond trials or into an inhibition bin on signal-inhibit trials;similarly, a model prediction could also fall into one of those samebins. If there were fewer than 40 RTs observed in a distribution ata particular SSD, then the entire distribution was considered asingle bin, which effectively counted only the number of signal-respond versus signal-inhibit trials. We chose this particular fitstatistic because it allowed us to fit quantitatively and simulta-neously both the RT distributions on no-stop-signal and signal-respond trials and the proportion of signal-inhibit trials that makeup the inhibition function.
The use of a chi-square statistic allowed us to evaluate statisti-cally the fits of special cases of models with particular parametersconstrained using the logic of hierarchical model testing. Testingspecial cases allowed us to evaluate rigorously what aspects of amodel are necessary to account for the observations and howdifferent parameter settings trade off against one another. Forexample, we could set a parameter to zero or set a parameter equalto another parameter. In both cases, we have constrained oneparameter of the more general model. If �general
2 is the fit of thegeneral model with N parameters and �special
2 is the fit of a specialcase with N � M parameters (where M is the number of con-strained parameters), then the special case is judged to fit signif-icantly worse than the general model if the difference in chi-squares (�general
2 � �special2 ) is greater than the critical chi-square
with M degrees of freedom at a .05 alpha level. Statistical modelcomparison techniques such as this are now regularly used toevaluate cognitive models (Ratcliff & Tuerlinckx, 2002).
Model parameters were optimized by minimizing chi-squareusing the subplex algorithm (Rowan, 1990), a more efficientvariant of the Nelder–Mead simplex method (Nelder & Mead,1965) that is well suited for optimizing stochastic models (Bogacz& Cohen, 2002). With stochastic simulation models, hill-climbingalgorithms such as subplex can often settle in a local minimumrather than the global minimum. This was mitigated by starting thehill-climbing algorithm at a minimum of 40 different startingpoints for each model fit conducted.3
2 Working simulations of the independent race model and the interactiverace model can be found at http://www.psy.vanderbilt.edu/faculty/palmeri/psyrev07_model/model.m
3 Given the time-intensive nature of these parameter optimizations, thesimulations were run on a near-supercomputer computing cluster supportedby the Vanderbilt Advanced Center for Computing for Research andEducation.
388 BOUCHER, PALMERI, LOGAN, AND SCHALL
Modeling Results
We first evaluate the ability of the independent race architectureto account for the observed data. It is necessary to establish thebaseline performance of this architecture to relate our findings tothe large literature applying the abstract independent race model tobehavior obtained in the stop-signal task (Band et al., 2003; Logan,1994). Furthermore, viable alternative model architectures mustaccount for the behavioral data at least as well as the independentrace model because this race model has been tested extensivelyand has demonstrated consistent success in describing counter-manding behavior for over 20 years.
The independent race architecture predicted very well the inhi-bition function and the RT distributions on no-stop-signal andsignal-respond trials (see Figures 5c and 5d). The SSRT, best-fitting parameters, and chi-square goodness of fit for the indepen-dent architecture are given in Table 1. In particular, note how eachpredicted RT distribution shares a common minimum and how themaximum RT increases with increasing SSD, as was observed inthe behavioral data. This fanning pattern of RT distributions is acharacteristic feature of RT data in the stop-signal task (e.g.,Osman et al., 1986). In addition, the independent race model was
able to account for the SSRT. Although this model accounted forthe behavioral data quite well, it failed altogether in accounting forthe neural data. This architecture cannot account for the modula-tion of movement-related neurons because nothing interrupts thego unit on stop-signal trials in which the stop unit reaches thresh-old first, that is, signal-inhibit trials (see Figures 5b and 5f). Insignal-inhibit trials, the go unit reaches the threshold, albeit afterthe stop process. Mechanistically, if the go unit reaches its thresh-old, a saccade must be initiated, but neither human nor monkeysubjects make such erroneous saccades on signal-inhibit trials. Ofcourse, in its original formulation, the race model stated that if thestop process finished first, the trial was classified as signal inhibitbecause the go process was not permitted to finish, but thisformalism did not specify a mechanism. The goal of our modelingeffort was to determine a mechanism that could shut off the goprocess so that it does not reach threshold on signal-inhibit trialsbut preserve the essential characteristics of stop-signal task per-formance.
One way to turn off the go process is to make the stop unitinhibit the go unit. Thus, the interactive race architecture is definedby mutual inhibition between the go and stop units that allows the
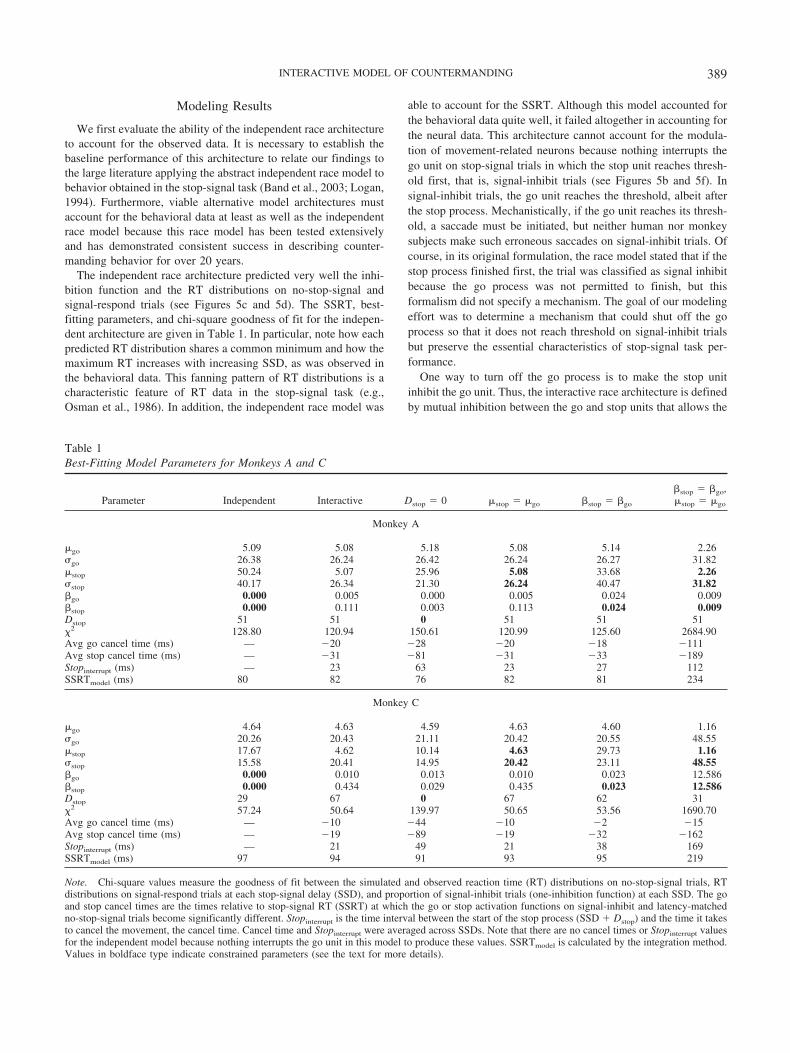
Table 1Best-Fitting Model Parameters for Monkeys A and C
Parameter Independent Interactive Dstop � 0 stop � go �stop � �go
�stop � �go,stop � go
Monkey A
go 5.09 5.08 5.18 5.08 5.14 2.26 go 26.38 26.24 26.42 26.24 26.27 31.82stop 50.24 5.07 25.96 5.08 33.68 2.26 stop 40.17 26.34 21.30 26.24 40.47 31.82�go 0.000 0.005 0.000 0.005 0.024 0.009�stop 0.000 0.111 0.003 0.113 0.024 0.009Dstop 51 51 0 51 51 51�2 128.80 120.94 150.61 120.99 125.60 2684.90Avg go cancel time (ms) — �20 �28 �20 �18 �111Avg stop cancel time (ms) — �31 �81 �31 �33 �189Stopinterrupt (ms) — 23 63 23 27 112SSRTmodel (ms) 80 82 76 82 81 234
Monkey C
go 4.64 4.63 4.59 4.63 4.60 1.16 go 20.26 20.43 21.11 20.42 20.55 48.55stop 17.67 4.62 10.14 4.63 29.73 1.16 stop 15.58 20.41 14.95 20.42 23.11 48.55�go 0.000 0.010 0.013 0.010 0.023 12.586�stop 0.000 0.434 0.029 0.435 0.023 12.586Dstop 29 67 0 67 62 31�2 57.24 50.64 139.97 50.65 53.56 1690.70Avg go cancel time (ms) — �10 �44 �10 �2 �15Avg stop cancel time (ms) — �19 �89 �19 �32 �162Stopinterrupt (ms) — 21 49 21 38 169SSRTmodel (ms) 97 94 91 93 95 219
Note. Chi-square values measure the goodness of fit between the simulated and observed reaction time (RT) distributions on no-stop-signal trials, RTdistributions on signal-respond trials at each stop-signal delay (SSD), and proportion of signal-inhibit trials (one-inhibition function) at each SSD. The goand stop cancel times are the times relative to stop-signal RT (SSRT) at which the go or stop activation functions on signal-inhibit and latency-matchedno-stop-signal trials become significantly different. Stopinterrupt is the time interval between the start of the stop process (SSD � Dstop) and the time it takesto cancel the movement, the cancel time. Cancel time and Stopinterrupt were averaged across SSDs. Note that there are no cancel times or Stopinterrupt valuesfor the independent model because nothing interrupts the go unit in this model to produce these values. SSRTmodel is calculated by the integration method.Values in boldface type indicate constrained parameters (see the text for more details).
389INTERACTIVE MODEL OF COUNTERMANDING
inhibition from the stop unit to prevent the go unit from reachingthreshold and triggering a movement on signal-inhibit trials. Wefound that with suitable parameters, the interactive race architec-ture could account for the behavioral data just as well as theindependent race architecture (see Figure 6 and Table 1). As withthe independent architecture, the inhibition function, the fanning ofthe RT distributions on no-stop-signal and signal-respond trials,and the SSRTs are all well predicted. In contrast to the independentrace architecture, this interactive race architecture can account forthe pattern and timing of neural modulation. Specifically, go unitactivation reaches threshold on no-stop-signal trials and signal-respond trials, but it is reduced substantially on signal-inhibit trialsbefore the behavioral measure of SSRT (see Figures 6e and 6f).Thus, the activation of the go unit corresponds precisely to thepattern of activation of movement neurons in frontal eye field(Hanes et al., 1998) and superior colliculus (Pare & Hanes, 2003)during this task (see Figure 4).
The reduction of activation in the go unit resulted from inhibi-tion from the stop unit on the go unit (�stop). On these signal-inhibit trials, the stop unit became active just before SSRT hadelapsed. The reduction of activation of the go unit did not happenon signal-respond trials because the stop unit failed to becomeactive before the SSRT. This modulation of the stop unit beforeSSRT on signal-inhibit trials, but not signal-respond trials, corre-sponds to the modulation of fixation neurons in frontal eye field(Hanes et al., 1998) and superior colliculus (Pare & Hanes, 2003;see Figure 4). Thus, the interactive race architecture parameterizedto fit the performance accomplishes this with go and stop unitactivation having the presence and timing of modulation corre-sponding to what has been observed in movement neurons andfixation neurons.
This qualitative conclusion can be evaluated quantitatively byexamining the cancel time of the go and stop units—the time atwhich modulation occurred on signal-inhibit trials. Analyses ofneural data show an effect of noise on estimates of cancel time: thenoisier the activation functions, the later the time of the differencemeasured by the statistical criteria (Hanes et al., 1998). The modelunit activation functions have considerably less variability thanneural spike density functions owing to the tremendously largenumber of trials that are simulated in order to generate stablemodel predictions. This fact has implications for the calculation ofcancel time, so we first needed to subsample the activation of thego and stop units in a manner comparable to the original samplingof neural activity in the physiology experiments. We did so usingthe following procedure: We simulated the model with a range of20–50 trials at each SSD to mimic the number of trials typicallyobtained in the single-cell physiology experiments that providedour data. We then calculated the average activation functions of thesimulated trials and determined the time of modulation at eachSSD for the go and stop units (see Figure 7a). We calculated canceltime as the difference between the time of modulation in the goand stop units and SSRT; negative and positive cancel times areinstances in which the modulation occurred before or after SSRT,respectively. We repeated this procedure 500 times and took theaverage cancel time at each SSD to obtain an estimate of the gounit and stop unit cancel time that was statistically comparable tothe physiological data. We found that the distribution of go unitand stop unit cancel times derived from the interactive race archi-tecture overlaps with the distribution of cancel times measured
from neurons in frontal eye field (Hanes et al., 1998) and superiorcolliculus (Pare & Hanes, 2003; see Figures 7b and 7c). Thus,quantitatively, the interactive race model yields a predicted distri-bution of cancel times that are very similar to the observed distri-bution of neural cancel times. The data from fixation neurons inthe superior colliculus are more reliable than those obtained fromfrontal eye field.
Model Exploration
The interactive race architecture prevails over the independentrace architecture in that it can account for both the behavioral andthe neural data. We wanted to test the boundary conditions of theinteractive model to understand better which aspects of the modelare necessary to account for the behavior and neurophysiology.Hierarchical model testing showed that two features of the inter-active architecture were necessary to account for both behavioraland neural data. First, the interaction between the stop and go unitsmust occur well after presentation of the stop signal (Dstop ��0).Second, the inhibition of the stop process on the go process mustbe very potent. These requirements of the interactive race archi-tecture are considered in turn.
First, to investigate the necessity of a delayed interaction, we setDstop � 0, activating the stop unit immediately with stop-signalpresentation, and allowed all other parameters to vary freely. WithDstop � 0, the fit to the behavioral data was significantly worsethan that of the general interactive model for both monkeys ( ps �.001; see Table 1). This occurred because, without a delay, the stopunit interacts with the go unit for a prolonged period of time,producing longer than observed simulated RTs on signal-respondtrials and a premature cancel time. Thus, in order for the interac-tive race model to account for stop-signal performance, activationof the stop unit must be delayed for a substantial amount of timeafter the stop signal occurs (i.e., Dstop ��0).
The prolonged RTs are characteristic of violations of the inde-pendence assumption of the race model (Band et al., 2003). Note,however, that these violations appear uniformly across all SSDs,whereas violations of the race model from observable data occur atthe shortest SSDs (Boucher et al., in press; Hanes & Carpenter,1999; Ozyurt, Colonius, & Arndt, 2003). Only a small number oftrials contribute to the mean RT at these short SSDs, and theseoutlier signal-respond RTs are often much longer than an averagesaccadic RT. We believe these responses occur on rare trials whensubjects successfully inhibit the movement and then after a typicalRT produce the movement anyway, so they are outside the racemodel framework.
Second, to investigate the necessity of potent inhibition of the gounit by the stop unit, we constrained either the growth rate suchthat stop � go and stop � go or the inhibition such that �stop ��go. We found a clear trade-off between stop, go and �stop, �go
(see Table 1). If stop � go, then the optimized � values werealways �stop ���go. If �stop � �go, then the optimized valueswere always stop ��go. These results occurred because thepotency of the stop unit is a function of both the magnitude of theinhibition of the stop unit on the go unit (�stop) and the rate ofgrowth of the stop unit (stop, stop). To explore this trade-off, weequated simultaneously the growth rate (stop � go and stop � go) and the inhibition (�stop � �go). This architecture fit theobserved data significantly worse than the general interactive
390 BOUCHER, PALMERI, LOGAN, AND SCHALL
model ( ps � .001). It failed because the trade-off between stop
and �stop could not occur. For example, if and � were too high,the go unit reached threshold too early before the stop unit,resulting in premature RTs, and the inhibition of the go unit on thestop unit was too potent for the stop unit to accumulate suffi-ciently, resulting in a lack of sensitivity to SSD. Conversely, if and � were too low, the go unit reached threshold too late toaccount for the RT data, and the stop unit was too weak to interruptthe go unit sufficiently often enough. Thus, for the interactive racemodel to account for stop-signal performance, the stop unit mustinhibit the go unit much more than vice versa.
General Discussion
This theoretical investigation furnishes a deeper understandingof SSRT that justifies its use in clinical and developmental studies,reveals a previously unappreciated characteristic of the neuralcircuitry responsible for gaze control, and makes new predictionsabout the stages of processing making up SSRT, which are ame-nable to experimental manipulation. More generally, our workexemplifies an approach to mapping cognitive processes ontoneural process through quantitative testing of stochastic models ofbehavior constrained by the characteristics of the neural mecha-nisms instantiating the cognitive process. This approach canreadily be used in other domains to assess competing models. Weconsider each of these points in turn.
What Does SSRT Measure?
Using hierarchical model testing, we determined that the inter-active race model alone could satisfy both behavioral and physi-ological constraints if and only if stop unit inhibition was potentand delayed. This result solves the paradox: Interacting neuralunits can produce behavior that appears to be the outcome of a racebetween independent processes because the processes remain in-dependent for most of their duration. The stop process interactswith the go process only for a very brief period of time. Thus, animplication of the interactive race model is that stopping is amultistage process consisting of an encoding stage during whichno interaction with response preparation occurs and a brief inter-ruption stage during which response preparation is inhibited.
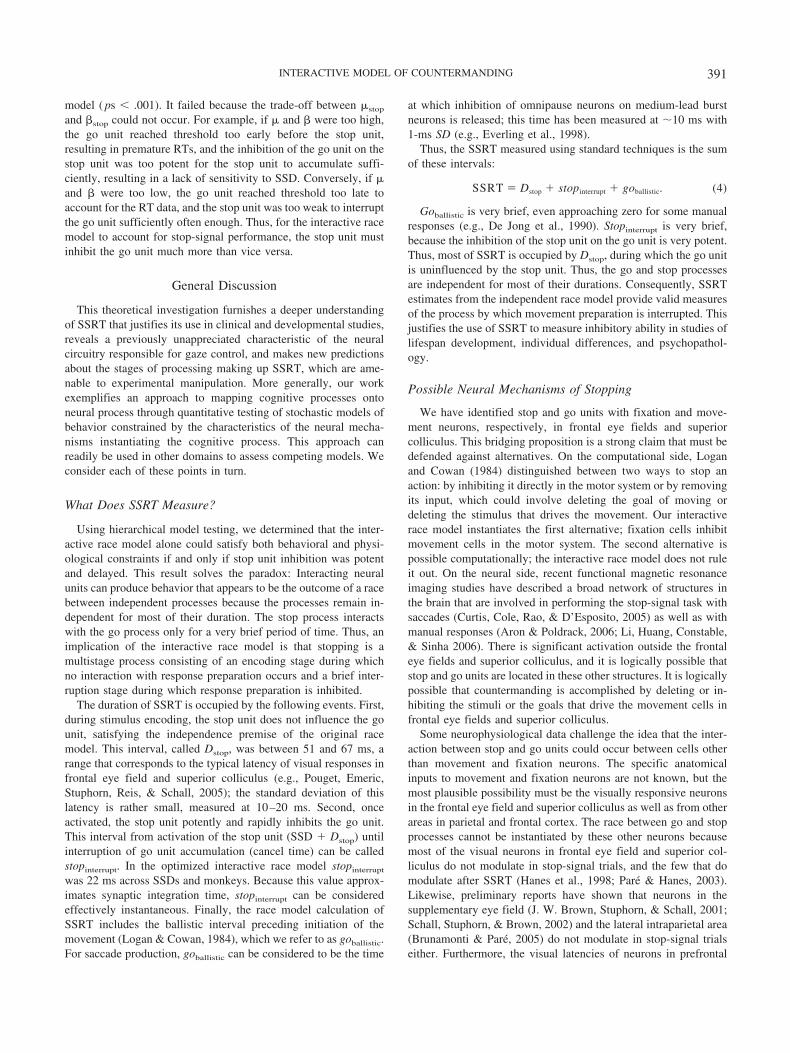
The duration of SSRT is occupied by the following events. First,during stimulus encoding, the stop unit does not influence the gounit, satisfying the independence premise of the original racemodel. This interval, called Dstop, was between 51 and 67 ms, arange that corresponds to the typical latency of visual responses infrontal eye field and superior colliculus (e.g., Pouget, Emeric,Stuphorn, Reis, & Schall, 2005); the standard deviation of thislatency is rather small, measured at 10–20 ms. Second, onceactivated, the stop unit potently and rapidly inhibits the go unit.This interval from activation of the stop unit (SSD � Dstop) untilinterruption of go unit accumulation (cancel time) can be calledstopinterrupt. In the optimized interactive race model stopinterrupt
was 22 ms across SSDs and monkeys. Because this value approx-imates synaptic integration time, stopinterrupt can be consideredeffectively instantaneous. Finally, the race model calculation ofSSRT includes the ballistic interval preceding initiation of themovement (Logan & Cowan, 1984), which we refer to as goballistic.For saccade production, goballistic can be considered to be the time
at which inhibition of omnipause neurons on medium-lead burstneurons is released; this time has been measured at �10 ms with1-ms SD (e.g., Everling et al., 1998).
Thus, the SSRT measured using standard techniques is the sumof these intervals:
SSRT � Dstop � stopinterrupt � goballistic. (4)
Goballistic is very brief, even approaching zero for some manualresponses (e.g., De Jong et al., 1990). Stopinterrupt is very brief,because the inhibition of the stop unit on the go unit is very potent.Thus, most of SSRT is occupied by Dstop, during which the go unitis uninfluenced by the stop unit. Thus, the go and stop processesare independent for most of their durations. Consequently, SSRTestimates from the independent race model provide valid measuresof the process by which movement preparation is interrupted. Thisjustifies the use of SSRT to measure inhibitory ability in studies oflifespan development, individual differences, and psychopathol-ogy.
Possible Neural Mechanisms of Stopping
We have identified stop and go units with fixation and move-ment neurons, respectively, in frontal eye fields and superiorcolliculus. This bridging proposition is a strong claim that must bedefended against alternatives. On the computational side, Loganand Cowan (1984) distinguished between two ways to stop anaction: by inhibiting it directly in the motor system or by removingits input, which could involve deleting the goal of moving ordeleting the stimulus that drives the movement. Our interactiverace model instantiates the first alternative; fixation cells inhibitmovement cells in the motor system. The second alternative ispossible computationally; the interactive race model does not ruleit out. On the neural side, recent functional magnetic resonanceimaging studies have described a broad network of structures inthe brain that are involved in performing the stop-signal task withsaccades (Curtis, Cole, Rao, & D’Esposito, 2005) as well as withmanual responses (Aron & Poldrack, 2006; Li, Huang, Constable,& Sinha 2006). There is significant activation outside the frontaleye fields and superior colliculus, and it is logically possible thatstop and go units are located in these other structures. It is logicallypossible that countermanding is accomplished by deleting or in-hibiting the stimuli or the goals that drive the movement cells infrontal eye fields and superior colliculus.
Some neurophysiological data challenge the idea that the inter-action between stop and go units could occur between cells otherthan movement and fixation neurons. The specific anatomicalinputs to movement and fixation neurons are not known, but themost plausible possibility must be the visually responsive neuronsin the frontal eye field and superior colliculus as well as from otherareas in parietal and frontal cortex. The race between go and stopprocesses cannot be instantiated by these other neurons becausemost of the visual neurons in frontal eye field and superior col-liculus do not modulate in stop-signal trials, and the few that domodulate after SSRT (Hanes et al., 1998; Pare & Hanes, 2003).Likewise, preliminary reports have shown that neurons in thesupplementary eye field (J. W. Brown, Stuphorn, & Schall, 2001;Schall, Stuphorn, & Brown, 2002) and the lateral intraparietal area(Brunamonti & Pare, 2005) do not modulate in stop-signal trialseither. Furthermore, the visual latencies of neurons in prefrontal
391INTERACTIVE MODEL OF COUNTERMANDING
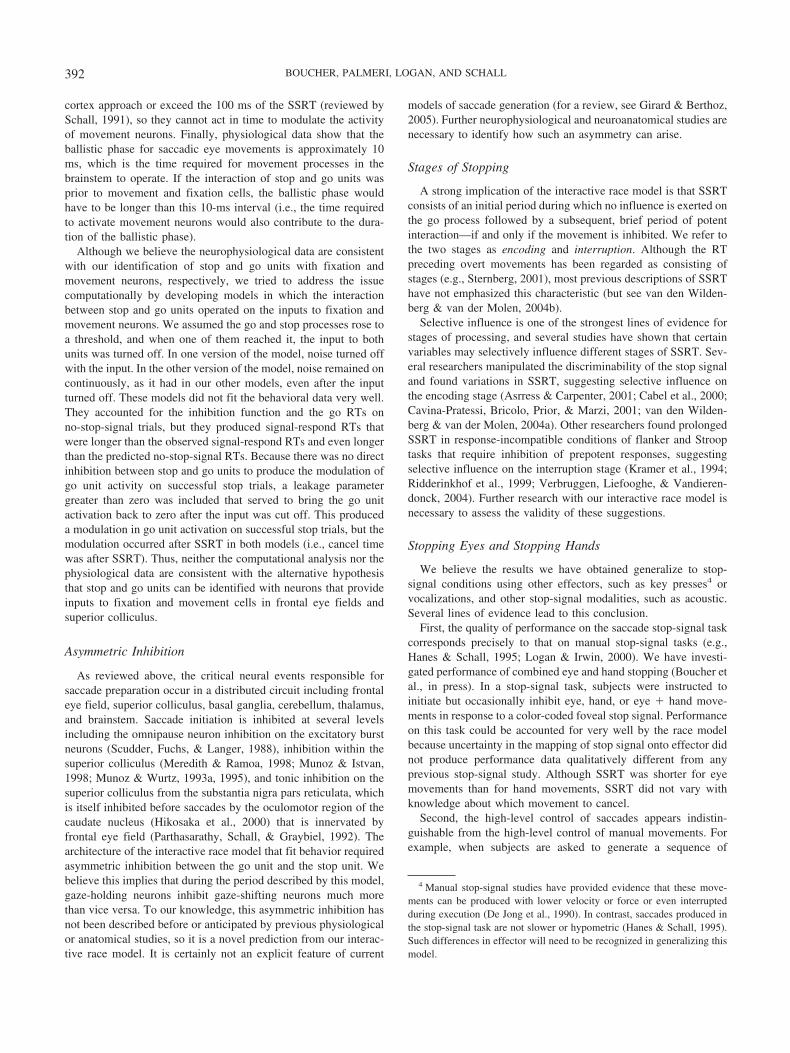
cortex approach or exceed the 100 ms of the SSRT (reviewed bySchall, 1991), so they cannot act in time to modulate the activityof movement neurons. Finally, physiological data show that theballistic phase for saccadic eye movements is approximately 10ms, which is the time required for movement processes in thebrainstem to operate. If the interaction of stop and go units wasprior to movement and fixation cells, the ballistic phase wouldhave to be longer than this 10-ms interval (i.e., the time requiredto activate movement neurons would also contribute to the dura-tion of the ballistic phase).
Although we believe the neurophysiological data are consistentwith our identification of stop and go units with fixation andmovement neurons, respectively, we tried to address the issuecomputationally by developing models in which the interactionbetween stop and go units operated on the inputs to fixation andmovement neurons. We assumed the go and stop processes rose toa threshold, and when one of them reached it, the input to bothunits was turned off. In one version of the model, noise turned offwith the input. In the other version of the model, noise remained oncontinuously, as it had in our other models, even after the inputturned off. These models did not fit the behavioral data very well.They accounted for the inhibition function and the go RTs onno-stop-signal trials, but they produced signal-respond RTs thatwere longer than the observed signal-respond RTs and even longerthan the predicted no-stop-signal RTs. Because there was no directinhibition between stop and go units to produce the modulation ofgo unit activity on successful stop trials, a leakage parametergreater than zero was included that served to bring the go unitactivation back to zero after the input was cut off. This produceda modulation in go unit activation on successful stop trials, but themodulation occurred after SSRT in both models (i.e., cancel timewas after SSRT). Thus, neither the computational analysis nor thephysiological data are consistent with the alternative hypothesisthat stop and go units can be identified with neurons that provideinputs to fixation and movement cells in frontal eye fields andsuperior colliculus.
Asymmetric Inhibition
As reviewed above, the critical neural events responsible forsaccade preparation occur in a distributed circuit including frontaleye field, superior colliculus, basal ganglia, cerebellum, thalamus,and brainstem. Saccade initiation is inhibited at several levelsincluding the omnipause neuron inhibition on the excitatory burstneurons (Scudder, Fuchs, & Langer, 1988), inhibition within thesuperior colliculus (Meredith & Ramoa, 1998; Munoz & Istvan,1998; Munoz & Wurtz, 1993a, 1995), and tonic inhibition on thesuperior colliculus from the substantia nigra pars reticulata, whichis itself inhibited before saccades by the oculomotor region of thecaudate nucleus (Hikosaka et al., 2000) that is innervated byfrontal eye field (Parthasarathy, Schall, & Graybiel, 1992). Thearchitecture of the interactive race model that fit behavior requiredasymmetric inhibition between the go unit and the stop unit. Webelieve this implies that during the period described by this model,gaze-holding neurons inhibit gaze-shifting neurons much morethan vice versa. To our knowledge, this asymmetric inhibition hasnot been described before or anticipated by previous physiologicalor anatomical studies, so it is a novel prediction from our interac-tive race model. It is certainly not an explicit feature of current
models of saccade generation (for a review, see Girard & Berthoz,2005). Further neurophysiological and neuroanatomical studies arenecessary to identify how such an asymmetry can arise.
Stages of Stopping
A strong implication of the interactive race model is that SSRTconsists of an initial period during which no influence is exerted onthe go process followed by a subsequent, brief period of potentinteraction—if and only if the movement is inhibited. We refer tothe two stages as encoding and interruption. Although the RTpreceding overt movements has been regarded as consisting ofstages (e.g., Sternberg, 2001), most previous descriptions of SSRThave not emphasized this characteristic (but see van den Wilden-berg & van der Molen, 2004b).
Selective influence is one of the strongest lines of evidence forstages of processing, and several studies have shown that certainvariables may selectively influence different stages of SSRT. Sev-eral researchers manipulated the discriminability of the stop signaland found variations in SSRT, suggesting selective influence onthe encoding stage (Asrress & Carpenter, 2001; Cabel et al., 2000;Cavina-Pratessi, Bricolo, Prior, & Marzi, 2001; van den Wilden-berg & van der Molen, 2004a). Other researchers found prolongedSSRT in response-incompatible conditions of flanker and Strooptasks that require inhibition of prepotent responses, suggestingselective influence on the interruption stage (Kramer et al., 1994;Ridderinkhof et al., 1999; Verbruggen, Liefooghe, & Vandieren-donck, 2004). Further research with our interactive race model isnecessary to assess the validity of these suggestions.
Stopping Eyes and Stopping Hands
We believe the results we have obtained generalize to stop-signal conditions using other effectors, such as key presses4 orvocalizations, and other stop-signal modalities, such as acoustic.Several lines of evidence lead to this conclusion.
First, the quality of performance on the saccade stop-signal taskcorresponds precisely to that on manual stop-signal tasks (e.g.,Hanes & Schall, 1995; Logan & Irwin, 2000). We have investi-gated performance of combined eye and hand stopping (Boucher etal., in press). In a stop-signal task, subjects were instructed toinitiate but occasionally inhibit eye, hand, or eye � hand move-ments in response to a color-coded foveal stop signal. Performanceon this task could be accounted for very well by the race modelbecause uncertainty in the mapping of stop signal onto effector didnot produce performance data qualitatively different from anyprevious stop-signal study. Although SSRT was shorter for eyemovements than for hand movements, SSRT did not vary withknowledge about which movement to cancel.
Second, the high-level control of saccades appears indistin-guishable from the high-level control of manual movements. Forexample, when subjects are asked to generate a sequence of
4 Manual stop-signal studies have provided evidence that these move-ments can be produced with lower velocity or force or even interruptedduring execution (De Jong et al., 1990). In contrast, saccades produced inthe stop-signal task are not slower or hypometric (Hanes & Schall, 1995).Such differences in effector will need to be recognized in generalizing thismodel.
392 BOUCHER, PALMERI, LOGAN, AND SCHALL
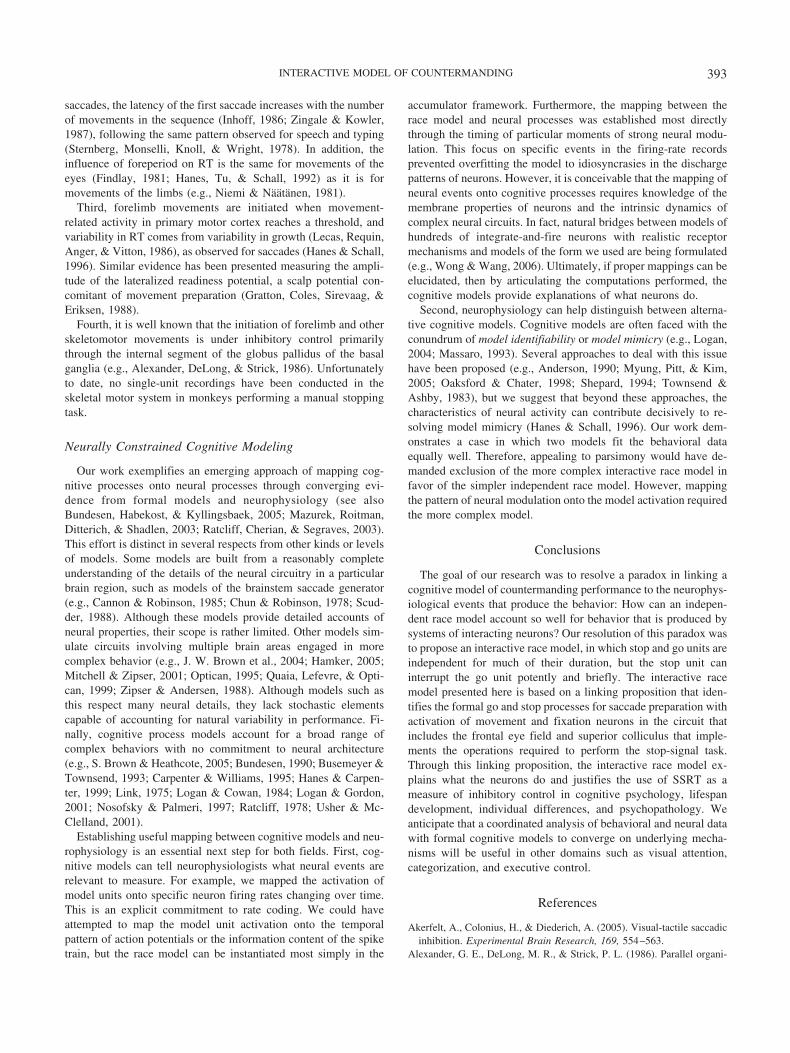
saccades, the latency of the first saccade increases with the numberof movements in the sequence (Inhoff, 1986; Zingale & Kowler,1987), following the same pattern observed for speech and typing(Sternberg, Monselli, Knoll, & Wright, 1978). In addition, theinfluence of foreperiod on RT is the same for movements of theeyes (Findlay, 1981; Hanes, Tu, & Schall, 1992) as it is formovements of the limbs (e.g., Niemi & Naatanen, 1981).
Third, forelimb movements are initiated when movement-related activity in primary motor cortex reaches a threshold, andvariability in RT comes from variability in growth (Lecas, Requin,Anger, & Vitton, 1986), as observed for saccades (Hanes & Schall,1996). Similar evidence has been presented measuring the ampli-tude of the lateralized readiness potential, a scalp potential con-comitant of movement preparation (Gratton, Coles, Sirevaag, &Eriksen, 1988).
Fourth, it is well known that the initiation of forelimb and otherskeletomotor movements is under inhibitory control primarilythrough the internal segment of the globus pallidus of the basalganglia (e.g., Alexander, DeLong, & Strick, 1986). Unfortunatelyto date, no single-unit recordings have been conducted in theskeletal motor system in monkeys performing a manual stoppingtask.
Neurally Constrained Cognitive Modeling
Our work exemplifies an emerging approach of mapping cog-nitive processes onto neural processes through converging evi-dence from formal models and neurophysiology (see alsoBundesen, Habekost, & Kyllingsbaek, 2005; Mazurek, Roitman,Ditterich, & Shadlen, 2003; Ratcliff, Cherian, & Segraves, 2003).This effort is distinct in several respects from other kinds or levelsof models. Some models are built from a reasonably completeunderstanding of the details of the neural circuitry in a particularbrain region, such as models of the brainstem saccade generator(e.g., Cannon & Robinson, 1985; Chun & Robinson, 1978; Scud-der, 1988). Although these models provide detailed accounts ofneural properties, their scope is rather limited. Other models sim-ulate circuits involving multiple brain areas engaged in morecomplex behavior (e.g., J. W. Brown et al., 2004; Hamker, 2005;Mitchell & Zipser, 2001; Optican, 1995; Quaia, Lefevre, & Opti-can, 1999; Zipser & Andersen, 1988). Although models such asthis respect many neural details, they lack stochastic elementscapable of accounting for natural variability in performance. Fi-nally, cognitive process models account for a broad range ofcomplex behaviors with no commitment to neural architecture(e.g., S. Brown & Heathcote, 2005; Bundesen, 1990; Busemeyer &Townsend, 1993; Carpenter & Williams, 1995; Hanes & Carpen-ter, 1999; Link, 1975; Logan & Cowan, 1984; Logan & Gordon,2001; Nosofsky & Palmeri, 1997; Ratcliff, 1978; Usher & Mc-Clelland, 2001).
Establishing useful mapping between cognitive models and neu-rophysiology is an essential next step for both fields. First, cog-nitive models can tell neurophysiologists what neural events arerelevant to measure. For example, we mapped the activation ofmodel units onto specific neuron firing rates changing over time.This is an explicit commitment to rate coding. We could haveattempted to map the model unit activation onto the temporalpattern of action potentials or the information content of the spiketrain, but the race model can be instantiated most simply in the
accumulator framework. Furthermore, the mapping between therace model and neural processes was established most directlythrough the timing of particular moments of strong neural modu-lation. This focus on specific events in the firing-rate recordsprevented overfitting the model to idiosyncrasies in the dischargepatterns of neurons. However, it is conceivable that the mapping ofneural events onto cognitive processes requires knowledge of themembrane properties of neurons and the intrinsic dynamics ofcomplex neural circuits. In fact, natural bridges between models ofhundreds of integrate-and-fire neurons with realistic receptormechanisms and models of the form we used are being formulated(e.g., Wong & Wang, 2006). Ultimately, if proper mappings can beelucidated, then by articulating the computations performed, thecognitive models provide explanations of what neurons do.
Second, neurophysiology can help distinguish between alterna-tive cognitive models. Cognitive models are often faced with theconundrum of model identifiability or model mimicry (e.g., Logan,2004; Massaro, 1993). Several approaches to deal with this issuehave been proposed (e.g., Anderson, 1990; Myung, Pitt, & Kim,2005; Oaksford & Chater, 1998; Shepard, 1994; Townsend &Ashby, 1983), but we suggest that beyond these approaches, thecharacteristics of neural activity can contribute decisively to re-solving model mimicry (Hanes & Schall, 1996). Our work dem-onstrates a case in which two models fit the behavioral dataequally well. Therefore, appealing to parsimony would have de-manded exclusion of the more complex interactive race model infavor of the simpler independent race model. However, mappingthe pattern of neural modulation onto the model activation requiredthe more complex model.
Conclusions
The goal of our research was to resolve a paradox in linking acognitive model of countermanding performance to the neurophys-iological events that produce the behavior: How can an indepen-dent race model account so well for behavior that is produced bysystems of interacting neurons? Our resolution of this paradox wasto propose an interactive race model, in which stop and go units areindependent for much of their duration, but the stop unit caninterrupt the go unit potently and briefly. The interactive racemodel presented here is based on a linking proposition that iden-tifies the formal go and stop processes for saccade preparation withactivation of movement and fixation neurons in the circuit thatincludes the frontal eye field and superior colliculus that imple-ments the operations required to perform the stop-signal task.Through this linking proposition, the interactive race model ex-plains what the neurons do and justifies the use of SSRT as ameasure of inhibitory control in cognitive psychology, lifespandevelopment, individual differences, and psychopathology. Weanticipate that a coordinated analysis of behavioral and neural datawith formal cognitive models to converge on underlying mecha-nisms will be useful in other domains such as visual attention,categorization, and executive control.
References
Akerfelt, A., Colonius, H., & Diederich, A. (2005). Visual-tactile saccadicinhibition. Experimental Brain Research, 169, 554–563.
Alexander, G. E., DeLong, M. R., & Strick, P. L. (1986). Parallel organi-
393INTERACTIVE MODEL OF COUNTERMANDING
zation of functionally segregated circuits linking basal ganglia andcortex. Annual Review of Neuroscience, 9, 357–381.
Anderson, J. R. (1990). The adaptive character of thought. Hillsdale, NJ:Erlbaum.
Arai, K., Keller, E. L., & Edelman, J. A. (1994). Two-dimensional neuralnetwork model of the primate saccadic system. Neural Networks, 7,1115–1135.
Armstrong, I. T., & Munoz, D. P. (2003). Inhibitory control of eyemovements during oculomotor countermanding in adults with attention-deficit hyperactivity disorder. Experimental Brain Research, 152, 444–452.
Aron, A. R., & Poldrack, R. A. (2006). Cortical and subcortical contribu-tions to stop signal response inhibition: Role of the subthalamic nucleus.Journal of Neuroscience, 26, 2424–2433.
Asrress, K. N., & Carpenter, R. H. (2001). Saccadic countermanding: Acomparison of central and peripheral stop signals. Vision Research, 41,2645–2651.
Badcock, J. C., Michie, P. T., Johnson, L., & Combrinck, J. (2002). Actsof control in schizophrenia: Dissociating the components of inhibition.Psychological Medicine, 32, 287–297.
Band, G. P. H., van der Molen, M. W., & Logan, G. D. (2003). Horse-racemodel simulations of the stop-signal procedure. Acta Psychologia(Amst), 112, 105–142.
Barkley, R. A. (1997). Behavioral inhibition, sustained attention, andexecutive functions: Constructing a unifying theory of ADHD. Psycho-logical Bulletin, 121, 65–94.
Becker, W., & Jurgens, R. (1979). An analysis of the saccadic system bymeans of double step stimuli. Vision Research, 19, 976–983.
Bedard, A. C., Nichols, S., Barbosa, J. A., Schachar, R., Logan, G. D., &Tannock, R. (2002). The development of selective inhibitory controlacross the lifespan. Developmental Neuropsychology, 21, 93–111.
Bogacz, R., & Cohen, J. D. (2002). Parameterization of connectionistmodels (Tech. Rep. No. 1). Princeton, NJ: Princeton University, Centerfor the Study of Brain, Mind, and Behavior.
Boucher, L., Stuphorn, V., Logan, G. D., Schall, J. D., & Palmeri, T.(inpress). Dissecting the stop process: Eye-hand coordination in a stop task.Perception & Psychophysics.
Bozis, A., & Moschovakis, A. (1998). Neural network simulations of theprimate oculomotor system III. A one-dimensional, one-directionalmodel of the superior colliculus. Biological Cybernetics, 79, 215–230.
Brindley, G. S. (1970). Physiology of retina and visual pathways (2nd ed.).Baltimore: Williams & Wilkins.
Brown, J. W., Bullock, D., & Grossberg, S. (2004). How laminar frontalcortex and basal ganglia circuits interact to control planned and reactivesaccades. Neural Networks, 17, 471–510.
Brown, J. W., Stuphorn, V., & Schall, J. D. (2001). Reliability of macaqueFEF but not SEF movement neurons predicting saccade initiation. [Ab-stract]. Society for Neuroscience Abstracts Online, 575.9. Retrievedfrom http://sfn.scholarone.com/itin2001/.
Brown, S., & Heathcote, A. (2005). A ballistic model of choice responsetime. Psychological Review, 112, 117–128.
Bruce, C. J., & Goldberg, M. E. (1985). Primate frontal eye fields. I. Singleneurons discharging before saccades. Journal of Neurophysiology, 53,603–635.
Brunamonti, E., & Pare M. (2005). Neural control of saccade productionstudied with the countermanding paradigm: Parietal cortex area LIP.[Abstract]. Society for Neuroscience Abstracts Online, 166.18. Retrievedfrom http://sfn.scholarone.com/itin2005/
Bundesen, C. (1990). A theory of visual attention. Psychological Review,97, 523–547.
Bundesen, C., Habekost, T., & Kyllingsbaek, S. (2005). A neural theory ofvisual attention: Bridging cognition and neurophysiology. PsychologicalReview, 112, 291–328.
Busemeyer, J. R., & Townsend, J. T. (1993). Decision field theory: A
dynamic-cognitive approach to decision making in an uncertain envi-ronment. Psychological Review, 100, 432–459.
Buttner-Ennever, J. A., Horn, A. K., Henn, V., & Cohen, B. (1999).Projections from the superior colliculus motor map to omnipause neu-rons in monkey. Journal of Comparative Neurology, 413, 55–67.
Cabel, D. W., Armstrong, I. T., Reingold, E., & Munoz, D. P. (2000).Control of saccade initiation in a countermanding task using visual andauditory stop signals. Experimental Brain Research, 133, 431–441.
Cannon, S. C., & Robinson, D. A. (1985). An improved neural-networkmodel for the neural integrator of the oculomotor system: More realisticneuron behavior. Biological Cybernetics, 53, 93–108.
Carpenter, R. H. S. (1991). The visual origins of ocular motility. In J. R.Cronly-Dillon (Ed.), Vision and visual function. Eye movements (Vol. 8,pp. 1–10). London: Macmillan.
Carpenter, R. H. S., & Williams, M. L. (1995, September 7). Neuralcomputation of log likelihood in control of saccadic eye movements.Nature, 377, 59–62.
Carter, J. D., Farrow, M., Silberstein, R. B., Stough, C., Tucker, A., &Pipingas, A. (2003). Assessing inhibitory control: A revised approach tothe stop signal task. Journal of Attention Disorders, 6, 153–161.
Cavina-Pratessi, C., Bricolo, E., Prior, M., & Marzi, C. A. (2001). Redun-dancy gain in the stop-signal paradigm: Implications for the locus ofcoactivation in simple reaction time. Journal of Experimental Psychol-ogy: Human Perception and Performance, 27, 932–941.
Choi, W. Y., & Guitton, D. (2006). Responses of collicular fixationneurons to gaze shift perturbations in head-unrestrained monkey revealgaze feedback control. Neuron, 50, 491–505.
Chun, K. S., & Robinson, D. A. (1978). A model of quick phase generationin the vestibuloocular reflex. Biological Cybernetics, 28, 209–221.
Colonius, H. (1990). A note on the stop-signal paradigm, or how to observethe unobservable. Psychological Review, 97, 309–312.
Colonius, H., Ozyurt, J., & Arndt, P. A. (2001). Countermanding saccadeswith auditory stop signals: Testing the race model. Vision Research, 41,1951–1968.
Corneil, B. D., & Elsley, J. K. (2005). Countermanding eye-head gazeshifts in humans: Marching orders are delivered to the head first. Journalof Neurophysiology, 94, 883–895.
Curtis, C. E., Cole, M. W., Rao, V. Y., & D’Esposito, M. (2005). Cancelingplanned action: An FMRI study of countermanding saccades. CerebralCortex, 15, 1281–1289.
Das, S., Gandhi, N. J., & Keller, E. L. (1995). Open-loop simulations of theprimate saccadic system using burst cell discharge from the superiorcolliculus. Biological Cybernetics, 73, 509–518.
De Jong, R., Coles, M. G. H., & Logan, G. D. (1995). Strategies andmechanisms in nonselective and selective inhibitory motor control.Journal of Experimental Psychology: Human Perception and Perfor-mance, 21, 498–511.
De Jong, R., Coles, M. G. H., Logan, G. D., & Gratton, G. (1990). In searchof the point of no return: The control of response processes. Journal ofExperimental Psychology: Human Perception and Performance, 16,164–182.
Dimitrov, M., Nakic, M., Elpern-Waxman, J., Granetz, J., O’Grady, J.,Phipps, M., et al. (2003). Inhibitory attentional control in patients withfrontal lobe damage. Brain and Cognition, 52, 258–270.
Dominey, P., & Arbib, M. (1992). A cortico-subcortical model for gener-ation of spatially accurate sequential saccades. Cerebral Cortex, 2,153–175.
Dominey, P., Arbib, M., & Joseph, J. P. (1995). A model of corticostriatalplasticity for learning oculomotor associations and sequences. Journal ofCognitive Neuroscience, 7, 311–336.
Dorris, M. C., & Munoz, D. P. (1998). Saccadic probability influencesmotor preparation signals and time to saccadic initiation. Journal ofNeuroscience, 18, 7015–7026.
Dorris, M. C., Pare, M., & Munoz, D. P. (1997). Neuronal activity in
394 BOUCHER, PALMERI, LOGAN, AND SCHALL
monkey superior colliculus related to the initiation of saccadic eyemovements. Journal of Neuroscience, 17, 8566–8579.
Eagle, D. M., & Robbins, T. W. (2003). Lesions of the medial prefrontalcortex or nucleus accumbens core do not impair inhibitory control in ratsperforming a stop-signal reaction time task. Behavioural Brain Re-search, 146, 131–144.
Engbert, R., Nuthmann, A., Richter, E. M., & Kliegl, R. (2005). SWIFT:A dynamical model of saccade generation during reading. PsychologicalReview, 112, 777–813.
Everling, S., Pare, M., Dorris, M. C., & Munoz, D. P. (1998). Comparisonof the discharge characteristics of brain stem omnipause neurons andsuperior colliculus fixation neurons in monkey: Implications for controlof fixation and saccade behavior. Journal of Neurophysiology, 79, 511–528.
Feola, T. W., de Wit, H., & Richards, J. B. (2000). Effects ofd-amphetamine and alcohol on a measure of behavioral inhibition in rats.Behavioral Neuroscience, 114, 838–848.
Findlay, J. M. (1981). Spatial and temporal factors in the predictivegeneration of saccadic eye movements. Vision Research, 21, 347–354.
Freedman, E. G., & Sparks, D. L. (1997). Activity of cells in the deeperlayers of the superior colliculus of the rhesus monkey: Evidence for agaze displacement command. Journal of Neurophysiology, 78, 1669–1690.
Gandhi, N. J., & Keller, E. L. (1999). Comparison of saccades perturbed bystimulation of the rostral superior colliculus, the caudal superior collicu-lus, and the omnipause neuron region. Journal of Neurophysiology, 82,3236–3253.
Gauggel, S., Rieger, M., & Feghoff, T. A. (2004). Inhibition of ongoingresponses in patients with Parkinson’s disease. Journal of Neurology,Neurosurgery & Psychiatry, 75, 539–544.
Girard, B., & Berthoz, A. (2005). From brainstem to cortex: Computationalmodels of saccade generation circuitry. Progress in Neurobiology, 77,215–251.
Gratton, G., Coles, M. G. H., Sirevaag, E. J., & Eriksen, C. W. (1988). Pre-and poststimulus activation of response channels: A psychophysiologi-cal analysis. Journal of Experimental Psychology: Human Perceptionand Performance, 14, 331–344.
Guitton, D., Bergeron, A., & Choi, W. Y. (2004). On the role of subcorticalfeedback mechanisms in the control of head-unrestrained gaze saccades.In W. C. Hall & A. Moschovakis (Eds.), The superior colliculus: Newapproaches for studying sensorimotor integration (pp. 241–275). BocaRaton, FL: CRC Press.
Hamker, F. H. (2005). The reentry hypothesis: The putative interaction ofthe frontal eye field, ventrolateral prefrontal cortex, and areas V4, IT forattention and eye movement. Cerebral Cortex, 15, 431–447.
Hanes, D. P., & Carpenter, R. H. S. (1999). Countermanding saccades inhumans. Vision Research, 39, 2777–2791.
Hanes, D. P., Patterson, W. F., II, & Schall, J. D. (1998). Role of frontaleye fields in countermanding saccades: Visual, movement, and fixationactivity. Journal of Neurophysiology, 79, 817–834.
Hanes, D. P., & Schall, J. D. (1995). Countermanding saccades in ma-caques. Visual Neuroscience, 12, 929–937.
Hanes, D. P., & Schall, J. D. (1996, October 18). Neural control ofvoluntary movement initiation. Science, 274, 427–430.
Hanes, D. H., Tu, F. F., & Schall, J. D. (1992). Effects of temporal context(conditional probability) on saccade latency in macaque. Society forNeuroscience Abstracts, 18, 698.
Hikosaka, O., Takikawa, Y., & Kawagoe, R. (2000). Role of the basalganglia in the control of purposive saccadic eye movements. Physiolog-ical Review, 80, 953–978.
Hikosaka, O., & Wurtz, R. H. (1983a). Visual and oculomotor functions ofmonkey substantia nigra pars reticulata. I. Relation of visual and audi-tory responses to saccades. Journal of Neurophysiology, 49, 1230–1253.
Hikosaka, O., & Wurtz, R. H. (1983b). Visual and oculomotor functions of
monkey substantia nigra pars reticulata. II. Visual responses related tofixation of gaze. Journal of Neurophysiology, 49, 1254–1267.
Hikosaka, O., & Wurtz, R. H. (1983c). Visual and oculomotor functions ofmonkey substantia nigra pars reticulata. III. Memory-contingent visualand saccade responses. Journal of Neurophysiology, 49, 1268–1284.
Inhoff, A. W. (1986). Preparing sequences of saccades under choicereaction conditions: Effects of sequence length and context. Acta Psy-chologia, 61, 211–228.
Kaneko, C. R. (2006). Saccade-related, long-lead burst neurons in themonkey rostral pons. Journal of Neurophysiology, 95, 979–994.
Kase, M., Miller, D. C., & Noda, H. (1980). Discharges of Purkinje cellsand mossy fibers in the cerebellar vermis of the monkey during saccadiceye movements and fixation. Journal of Physiology (London), 300,539–555.
Kornylo, K., Dill, N., Saenz, M., & Krauzlis, R. J. (2003). Cancelling ofpursuit and saccadic eye movements in humans and monkeys. Journal ofNeurophysiology, 89, 2984–2999.
Kramer, A. F., Humphrey, D. G., Larish, J. F., Logan, G. D., & Strayer,D. L. (1994). Aging and inhibition: Beyond a unitary view of inhibitoryprocessing in attention. Psychology and Aging, 9, 491–512.
Ladefoged, P., Silverstein, R., & Papcun, G. (1973). Interruptability ofspeech. Journal of the Acoustical Society of America, 54, 1105–1108.
Lappin, J. S., & Eriksen, C. W. (1966). Use of a delayed signal to stop avisual reaction-time response. Journal of Experimental Psychology, 72,803–811.
Lauwereyns, J., Watanabe, K., Coe, B., & Hikosaka, O. (2002, July 25). Aneural correlate of response bias in monkey caudate nucleus. Nature,418, 413–417.
Lecas, J. C., Requin, J., Anger, C., & Vitton, N. (1986). Changes inneuronal activity of the monkey precentral cortex during preparation formovement. Journal of Neurophysiology, 56, 1680–1702.
Li, C. S., Huang, C., Constable, R. T., & Sinha, R. (2006). Imagingresponse inhibition in a stop-signal task: Neural correlates independentof signal monitoring and post-response processing. Journal of Neuro-science, 26, 186–192.
Link, S. W. (1975). The relative judgment theory of two choice responsetime. Journal of Mathematical Psychology, 12, 114–135.
Lisberger, S. G., Fuchs, A. F., King, W. M., & Evinger, L. C. (1975).Effect of mean reaction time on saccadic responses to two-step stimuliwith horizontal and vertical components. Vision Research, 15, 1021–1025.
Logan, G. D. (1981). Attention, automaticity, and the ability to stop aspeeded choice response. In J. Long & A. Baddeley (Eds.), Attention andperformance IX (pp. 205–222). Hillsdale, NJ: Erlbaum.
Logan, G. D. (1982). On the ability to inhibit complex movements: Astop-signal study of typewriting. Journal of Experimental Psychology:Human Perception and Performance, 8, 778–792.
Logan, G. D. (1994). On the ability to inhibit thought and action: A users’guide to the stop signal paradigm. In D. Dagenbach & T. H. Carr (Eds.),Inhibitory processes in attention, memory, and language (pp. 189–239).San Diego, CA: Academic Press.
Logan, G. D. (2004). Cumulative progress in formal theories of attention.Annual Review of Psychology, 55, 207–234.
Logan, G. D., & Cowan, W. B. (1984). On the ability to inhibit thought andaction: A theory of an act of control. Psychological Review, 91, 295–327.
Logan, G. D., Cowan, W. B., & Davis, K. A. (1984). On the ability toinhibit simple and choice reaction time responses: A model and amethod. Journal of Experimental Psychology: Human Perception andPerformance, 10, 276–291.
Logan, G. D., & Gordon, R. D. (2001). Executive control of visualattention in dual-task situations. Psychological Review, 108, 393–434.
Logan, G. D., & Irwin, D. E. (2000). Don’t look! Don’t touch! Inhibitory
395INTERACTIVE MODEL OF COUNTERMANDING
control of eye and hand movements. Psychonomic Bulletin & Review, 7,107–112.
Logan, G. D., Schachar, R. J., & Tannock, R. (1997). Impulsivity andinhibitory control. Psychological Science, 8, 60–64.
Machens, C. K., Romo, R., & Brody, C. D. (2005, February 18). Flexiblecontrol of mutual inhibition: A neural model of two-interval discrimi-nation. Science, 307, 1121–1124.
Marder, E., & Goaillard, J. M. (2006). Variability, compensation andhomeostasis in neuron and network function. Nature Reviews Neuro-science, 7, 563–574.
Massaro, D. W. (1993). Information processing models: Microscopes ofthe mind. Annual Review of Psychology, 44, 383–425.
Mazurek, M. E., Roitman, J. D., Ditterich, J., & Shadlen, M. N. (2003). Arole for neural integrators in perceptual decision making. CerebralCortex, 13, 257–269.
McDonald, S. A., Carpenter, R. H. S., & Shillcock, R. C. (2005). Ananatomically constrained, stochastic model of eye movement control inreading. Psychological Review, 112, 814–840.
McGarry, T., Chua, R., & Franks, I. M. (2003). Stopping and restarting anunfolding action at various times. Quarterly Journal of ExperimentalPsychology, 56, 601–620.
Meredith, M. A., & Ramoa, A. S. (1998). Intrinsic circuitry of the superiorcolliculus: Pharmacophysiological identification of horizontally orientedinhibitory interneurons. Journal of Neurophysiology, 79, 1597–1602.
Mitchell, J., & Zipser, D. (2001). A model of visual-spatial memory acrosssaccades. Vision Research, 41, 1575–1592.
Mitchell, J., & Zipser, D. (2003). Sequential memory-guided saccades andtarget selection: A neural model of the frontal eye fields. Vision Re-search, 43, 2669–2695.
Miyake, A., Friedman, N. P., Emerson, M. J., Witzki, A. H., Howerter, A.,& Wagner, T. (2000). The unity and diversity of executive functions andtheir contributions to complex “frontal lobe” tasks: A latent variableanalysis. Cognitive Psychology, 41, 49–100.
Munoz, D. P., Dorris, M. C., Pare, M., & Everling, S. (2000). On yourmark, get set: Brainstem circuitry underlying saccadic initiation. Cana-dian Journal of Physiological Pharmacology, 78, 934–944.
Munoz, D. P., & Istvan, P. J. (1998). Lateral inhibitory interactions in theintermediate layers of the monkey superior colliculus. Journal of Neu-rophysiology, 79, 1193–1209.
Munoz, D. P., & Schall, J. D. (2003). Concurrent, distributed control ofsaccade initiation in the frontal eye field and superior colliculus. In W. T.Hall & A. Moschovakis (Eds.), The superior colliculus: New approachesfor studying sensorimotor integration (pp. 55–82). New York: CRCPress.
Munoz, D. P., & Wurtz, R. (1993a). Fixation cells in monkey superiorcolliculus. I. Characteristics of cell discharge. Journal of Neurophysiol-ogy, 70, 559–575.
Munoz, D. P., & Wurtz, R. H. (1993b). Fixation cells in monkey superiorcolliculus. II. Reversible activation and deactivation. Journal of Neuro-physiology, 70, 576–589.
Munoz, D. P., & Wurtz, R. H. (1995). Saccade-related activity in monkeysuperior colliculus. II. Spread of activity during saccades. Journal ofNeurophysiology, 73, 2334–2348.
Myung, I. J., Pitt, M. A., & Kim, K. (2005). Model evaluation, testing andselection. In K. Lambert & R. Goldstone (Eds.), Handbook of cognition(pp. 422–436). Thousand Oaks, CA: Sage.
Nelder, J. A., & Mead, R. (1965). A simple method for function minimi-zation. Computer Journal, 7, 308–313.
Niemi, P., & Naatanen, R. (1981). Foreperiod and simple reaction time.Psychological Bulletin, 89, 133–162.
Nigg, J. T. (2001). Is ADHD a disinhibitory disorder? PsychologicalBulletin, 127, 571–598.
Nosofsky, R. M., & Palmeri, T. J. (1997). An exemplar-based random walkmodel of speeded classification. Psychological Review, 104, 266–300.
Oaksford, M., & Chater, N. (1998). Rational models of cognition. Oxford,England: Oxford University Press.
Olman, R. T. (1973). Simple reactions with random countermanding of the“go” signal. In S. Kornblum (Ed.), Attention and performance IV (pp.571–581). New York: Academic Press.
Oosterlaan, J., Logan, G. D., & Sergeant, J. A. (1998). Response inhibitionin AD/HD, CD, comorbid AD/HD � CD, anxious, and control children:A meta-analysis of studies with the stop task. Journal of Child Psychol-ogy & Psychiatry, 39, 411–425.
Optican, L. M. (1995). A field theory of saccade generation: Temporal-to-spatial transform in the superior colliculus. Vision Research, 35, 3313–3320.
Osman, A., Kornblum, S., & Meyer, D. E. (1986). The point of no returnin choice reaction time: Controlled and ballistic stages of responsepreparation. Journal of Experimental Psychology: Human Perceptionand Performance, 12, 243–258.
Osman, A., Kornblum, S., & Meyer, D. E. (1990). Does motor program-ming necessitate response execution? Journal of Experimental Psychol-ogy: Human Perception and Performance, 16, 183–198.
Ozyurt, J., Colonius, H., & Arndt, P. A. (2003). Countermanding saccades:Evidence against independent processing of go and stop signals. Per-ception & Psychophysics, 65, 420–428.
Pare, M. & Guitton, D. (1998). Brain stem omnipause neurons and thecontrol of combined eye-head gaze saccades in the alert cat. Journal ofNeurophysiology, 79, 3060–3076.
Pare, M., & Hanes, D. P. (2003). Controlled movement processing: Supe-rior colliculus activity associated with countermanded saccades. Journalof Neuroscience, 23, 6480–6489.
Parthasarathy, H. B., Schall, J. D., & Graybiel, A. M. (1992). Distributedbut convergent ordering of corticostriatal projections: Analysis of thefrontal eye field and the supplementary eye field in the macaque mon-key. Journal of Neuroscience, 12, 4468–4488.
Pouget, P., Emeric, E. E., Stuphorn, V., Reis, K., & Schall, J. D. (2005).Chronometry of visual responses in frontal eye field, supplementary eyefield, and anterior cingulate cortex. Journal of Neurophysiology, 94,2086–2092.
Quaia, C., Lefevre, P., & Optican, L. M. (1999). Model of the control ofsaccades by superior colliculus and cerebellum. Journal of Neurophys-iology, 82, 999–1018.
Ratcliff, R. (1978). A theory of memory retrieval. Psychological Review,85, 59–108.
Ratcliff, R., Cherian, A., & Segraves, M. (2003). A comparison of macaquebehavior and superior colliculus neuronal activity to predictions frommodels of two-choice decisions. Journal of Neurophysiology, 90, 1392–1407.
Ratcliff, R., & Tuerlinckx, F. (2002). Estimating parameters of the diffu-sion model: Approaches to dealing with contaminant reaction times andparameter variability. Psychonomic Bulletin & Review, 9, 438–481.
Reichle, E. D., Rayner, K., & Pollatsek, A. (2003). The E-Z reader modelof eye-movement control in reading: Comparisons to other models.Behavioral Brain Science, 26, 446–526.
Ridderinkhof, K. R., Band, G. P. H., & Logan, G. D. (1999). A study ofadaptive behavior: Effects of age and irrelevant information on theability to inhibit one’s actions. Acta Psychologica, 101, 315–337.
Rowan, T. (1990). Functional stability analysis of numerical algorithms.Unpublished doctoral thesis, University of Texas at Austin.
Schachar, R. J., & Logan, G. D. (1990). Impulsivity and inhibitory controlin normal development and childhood psychopathology. DevelopmentalPsychology, 26, 710–720.
Schachar, R. J., Mota, V., Logan, G. D., Tannock, R., & Klim, P. (2000).Confirmation of an inhibitory control deficit in attention-deficit/hyperactivity disorder. Journal of Abnormal Child Psychology, 28, 227–235.
Schachar, R. J., Tannock, R., & Logan, G. D. (1993). Inhibitory control,
396 BOUCHER, PALMERI, LOGAN, AND SCHALL
impulsiveness, and attention deficit hyperactivity disorder. Clinical Psy-chology Review, 13, 721–739.
Schall, J. D. (1991). Neuronal activity related to visually guided saccadesin the frontal eye fields of rhesus monkeys: Comparison with supple-mentary eye fields. Journal of Neurophysiology, 66, 559–579.
Schall, J. D. (1997). Visuomotor areas of the frontal lobe. In K. Rockland& J. H. Kaas (Eds.), Cerebral cortex (pp. 527–638). New York: Plenum.
Schall, J. D. (2004). On building a bridge between brain and behavior.Annual Review of Psychology, 55, 23–50.
Schall, J. D., Stuphorn, V., & Brown, J. W. (2002). Monitoring and controlof action by the frontal lobes. Neuron, 36, 309–322.
Schiller, P. H., & Korner, F. (1971). Discharge characteristics of singleunits in superior colliculus of the alert rhesus monkey. Journal ofNeurophysiology, 34, 920–936.
Scudder, C. A. (1988). A new local feedback model of the saccadic burstgenerator. Journal of Neurophysiology, 59, 1455–1475.
Scudder, C. A., Fuchs, A. F., & Langer, T. P. (1988). Characteristics andfunctional identification of saccadic inhibitory burst neurons in the alertmonkey. Journal of Neurophysiology, 59, 1430–1454.
Scudder, C. A., Kaneko, C. S., & Fuchs, A. F. (2002). The brainstem burstgenerator for saccadic eye movements: A modern synthesis. Experimen-tal Brain Research, 142, 439–462.
Segraves, M. A., & Goldberg, M. E. (1987). Functional properties ofcorticotectal neurons in the monkey’s frontal eye field. Journal ofNeurophysiology, 58, 1387–1419.
Shepard, R. N. (1994). Perceptual-cognitive universals as reflections of theworld. Psychonomic Bulletin & Review, 1, 2–28.
Slater-Hammel, A. T. (1960). Reliability, accuracy, and refractoriness of atransit reaction. Research Quarterly, 31, 217–228.
Sparks, D. L. (1975). Response properties of eye movement-related neu-rons in the monkey superior colliculus. Brain Research, 6, 147–152.
Sparks, D. L. (2002). The brainstem control of saccadic eye movements.Nature Reviews Neuroscience, 3, 952–964.
Sternberg, S. (2001). Separate modifiability, mental modules, and the useof pure and composite measures to reveal them. Acta Psychologica, 106,147–246.
Sternberg, S., Monselli, S., Knoll, R. L., & Wright, C. E. (1978). Thelatency and duration of rapid movement sequences: Comparisons ofspeech and typewriting. In G. E. Stelmach (Ed.), Information processingin motor control and learning (pp. 117–152). New York: Academic.
Takahashi, M., Sugiuchi, Y., Izawa, Y., & Shinoda, Y. (2005). Commis-sural excitation and inhibition by the superior colliculus in tectoreticularneurons projecting to omnipause neuron and inhibitory burst neuronregions. Journal of Neurophysiology, 94, 1707–1726.
Teller, D. Y. (1984). Linking propositions. Vision Research, 24, 1233–1246.
Teller, D. Y., & Pugh, E. (1983). Linking propositions in color vision. InJ. D. Mollon & L. T. Sharpe (Eds.), Colour vision: Physiology andpsychophysics (pp. 11–21). London: Academic Press.
Thier, P., Dicke, P. W., Haas, R., Thielert, C. D., & Catz, N. (2002). Therole of the oculomotor vermis in the control of saccadic eye movements.Annals of the New York Academy of Science, 978, 50–62.
Townsend, J. T., & Ashby, F. G. (1983). The stochastic modeling ofelementary psychological processes. Cambridge, England: CambridgeUniversity Press.
Trappenberg, T. P., Dorris, M., Klein, R. M., & Munoz, D. P. (2001). Amodel of saccade initiation based on the competitive integration ofexogenous and endogenous signals in the superior colliculus. Journal ofCognitive Neuroscience, 13, 256–271.
Usher, M., & McClelland, J. L. (2001). The time course of perceptualchoice: The leaky, competing accumulator model. Psychological Re-view, 108, 550–592.
van den Wildenberg, W. P. M., & van der Molen, M. W. (2004a). Additivefactors analysis of inhibitory processing in the stop-signal paradigm.Brain and Cognition, 56, 253–266.
van den Wildenberg, W. P. M., & van der Molen, M. W. (2004b).Developmental trends in simple and selective inhibition of compatibleand incompatible responses. Journal of Experimental Child Psychology,87, 201–220.
van Opstal, A. J., & van Gisbergen, J. A. M. (1989). A model for collicularefferent mechanisms underlying the generation of saccades. Brain, Be-havior and Evolution, 33, 90–94.
Verbruggen, F., Liefooghe, B., & Vandierendonck, A. (2004). The inter-action between stop-signal inhibition and distractor interference in theflanker and Stroop task. Acta Psychologica, 116, 21–37.
Waitzman, D., Ma, T., Optican, L., & Wurtz, R. (1991). Superior colliculusneurons mediate the dynamic characteristics of saccades. Journal ofNeurophysiology, 66, 1716–1737.
Williams, B. R., Ponesse, J. S., Schachar, R. J., Logan, G. D., & Tannock,R. (1999). Development of inhibitory control across the life span.Developmental Psychology, 35, 205–213.
Wong, K.-F. & Wang, X.-J. (2006). A recurrent network mechanism oftime integration in perceptual decisions. Journal of Neuroscience, 26,1314–1328.
Wurtz, R. H., & Goldberg, M. E. (1972). Activity of superior colliculus inbehaving monkey: III. Cells discharging before eye movements. Journalof Neurophysiology, 35, 575–586.
Wurtz, R. H., & Goldberg, M. E. (1989). The neurobiology of saccadic eyemovements. Amsterdam: Elsevier.
Yoshida, K., Iwamoto, Y., Chimoto, S., & Shimazu, H. (2001). Disynapticinhibition of omnipause neurons following electrical stimulation of thesuperior colliculus in alert cats, Journal of Neurophysiology, 85, 2639–2642.
Zingale, C. M., & Kowler, E. (1987). Planning sequences of saccades.Vision Research, 27, 1327–1341.
Zipser, D., & Andersen, R. A. (1988, February 25). A back-propagationprogrammed network that simulates response properties of a subset ofposterior parietal neurons. Nature, 331, 679–684.
Received March 13, 2006Revision received November 7, 2006
Accepted November 9, 2006 �
397INTERACTIVE MODEL OF COUNTERMANDING