Embed Size (px)
Citation preview
Metroparks Deer Management: Initial Findings and Ecological Implications
Timothy A. Schetter, Ph.D. and Timothy D. Gallaher
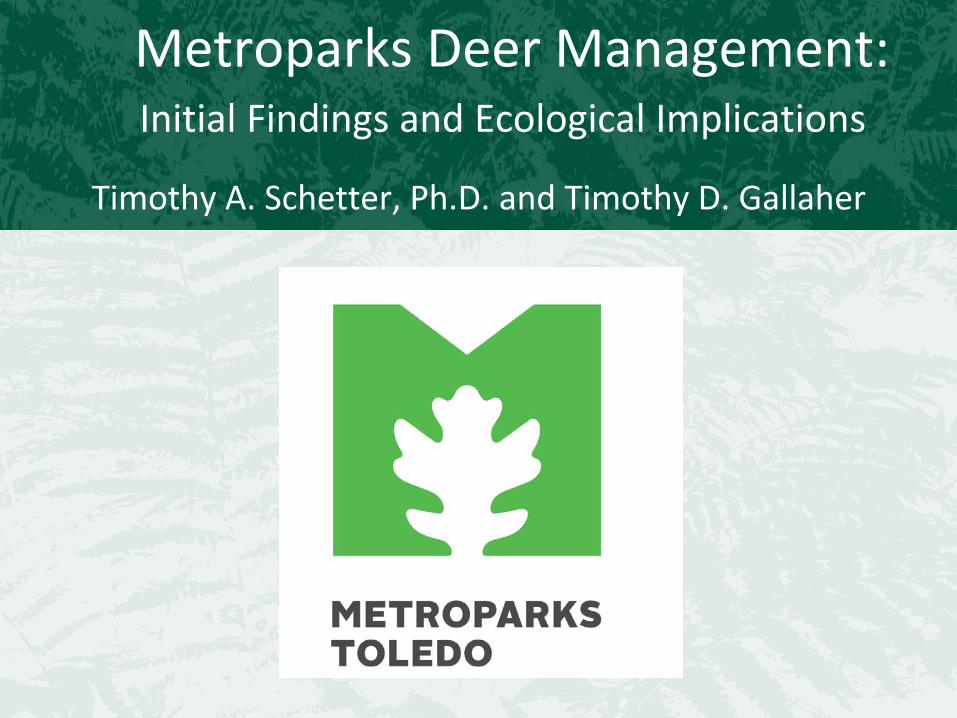
White-tailed Deer Ecology
• A generalist herbivore: - Preferred habitat: forest edges
- Highly adaptable & selective
- Dietary preference varies by season & habitat
• Lack of predators
• High reproductive potential
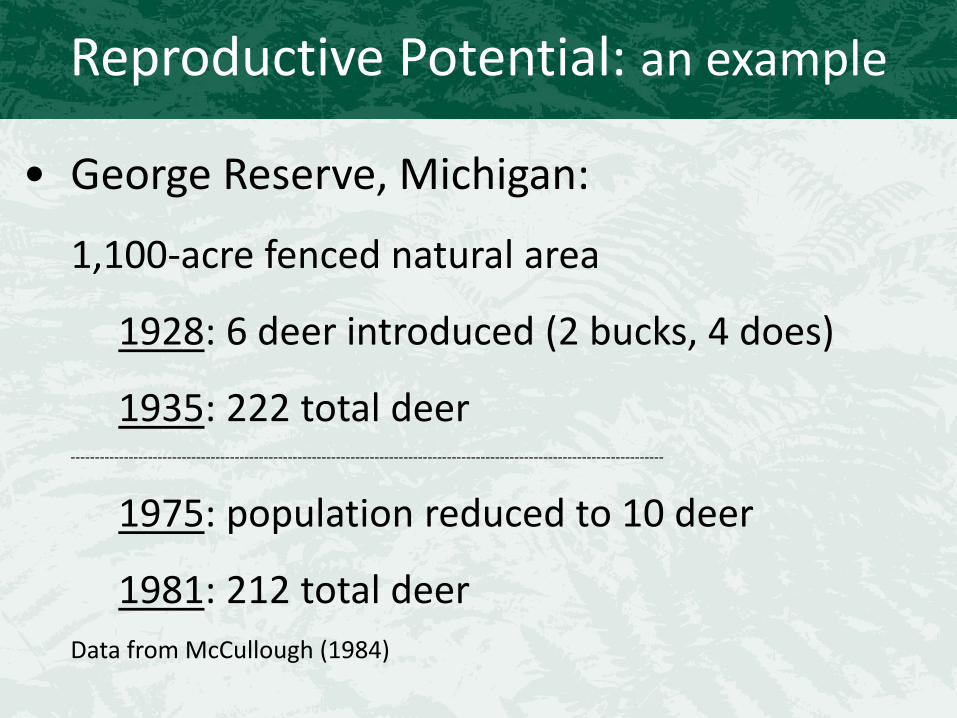
Reproductive Potential: an example
• George Reserve, Michigan:
1,100-acre fenced natural area
1928: 6 deer introduced (2 bucks, 4 does)
1935: 222 total deer ---------------------------------------------------------------------------------------------------------------------------
1975: population reduced to 10 deer
1981: 212 total deer Data from McCullough (1984)
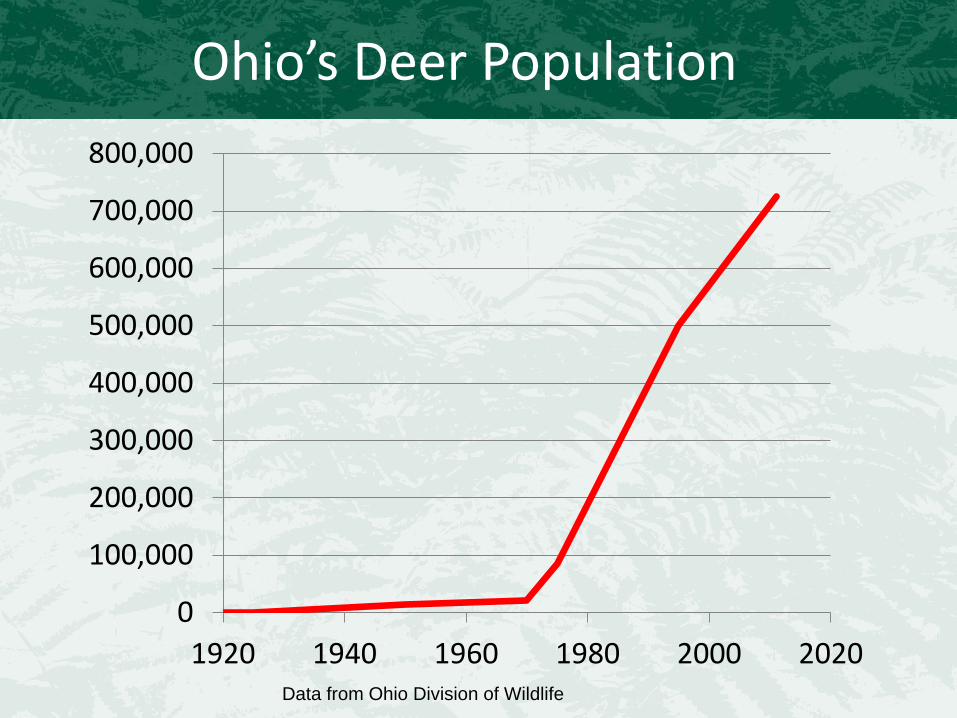
Ohio’s Deer Population
Data from Ohio Division of Wildlife
0
100,000
200,000
300,000
400,000
500,000
600,000
700,000
800,000
1920 1940 1960 1980 2000 2020
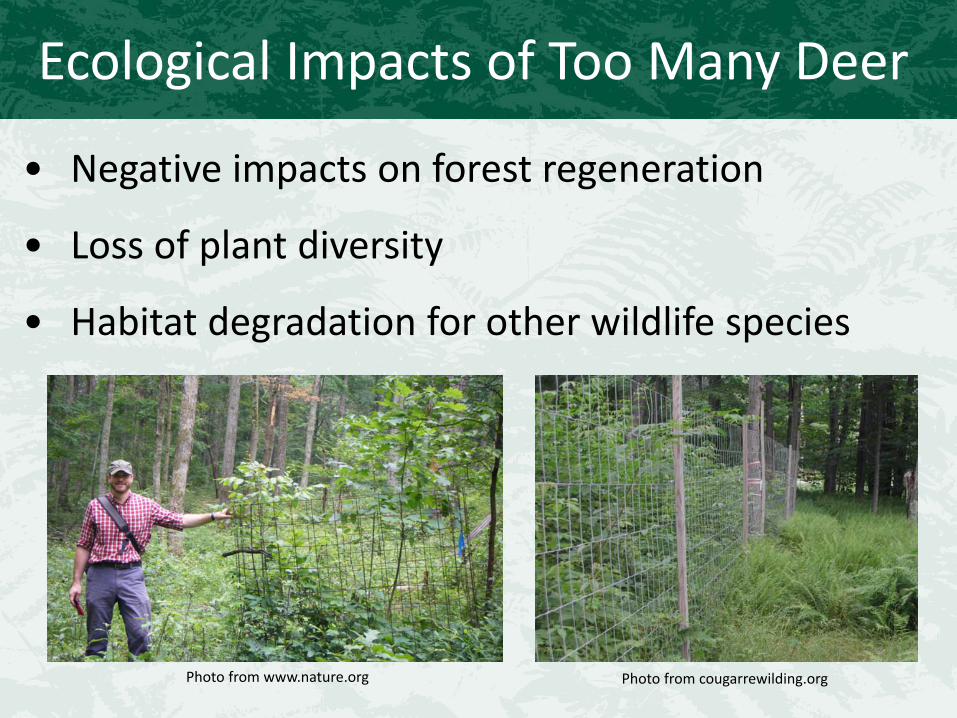
Ecological Impacts of Too Many Deer
• Negative impacts on forest regeneration
• Loss of plant diversity
• Habitat degradation for other wildlife species
Photo from www.nature.org Photo from cougarrewilding.org
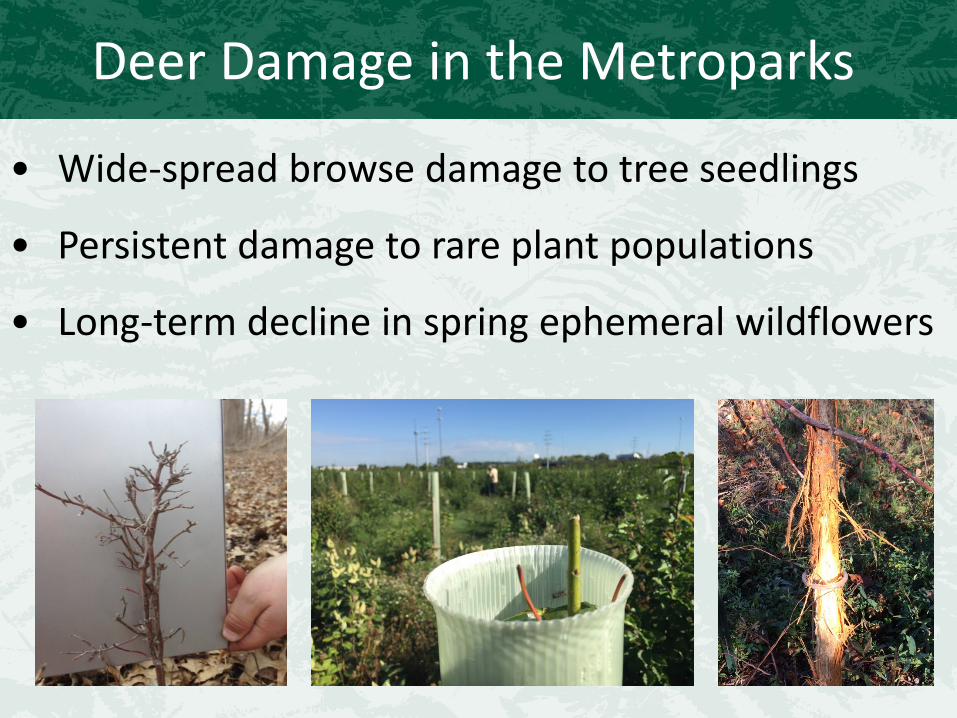
Deer Damage in the Metroparks
• Wide-spread browse damage to tree seedlings
• Persistent damage to rare plant populations
• Long-term decline in spring ephemeral wildflowers
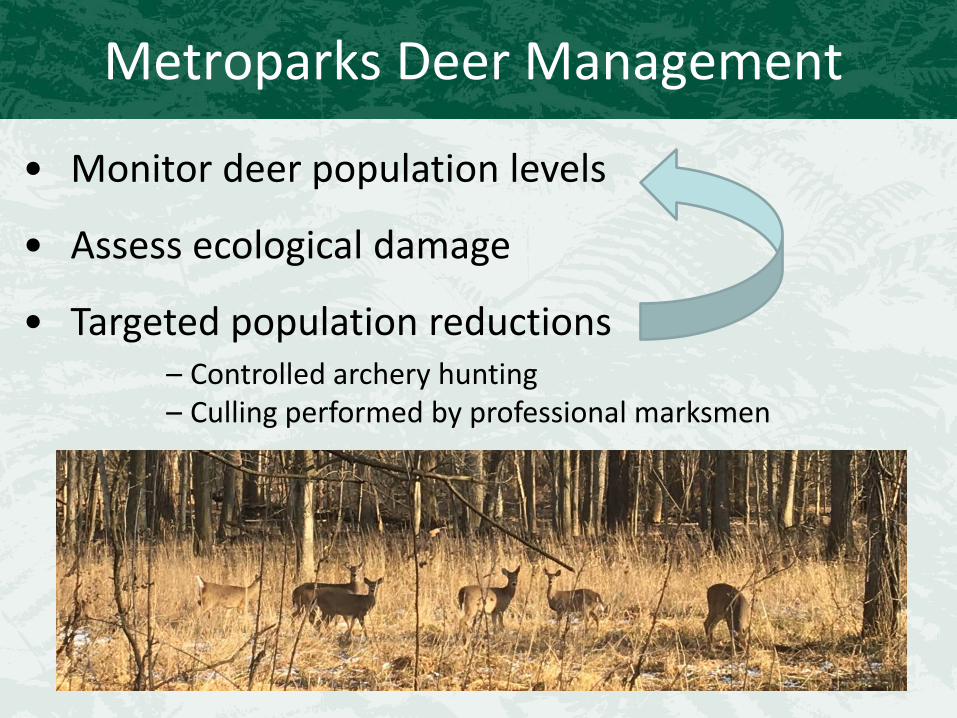
Metroparks Deer Management
• Monitor deer population levels
• Assess ecological damage
• Targeted population reductions – Controlled archery hunting – Culling performed by professional marksmen
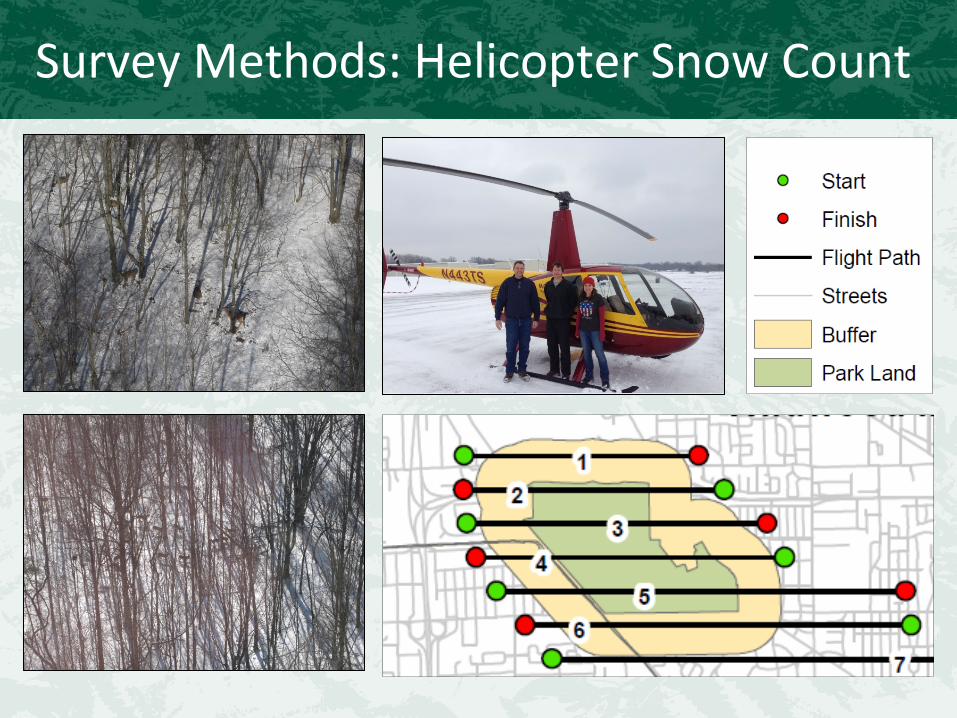
Survey Methods: Helicopter Snow Count
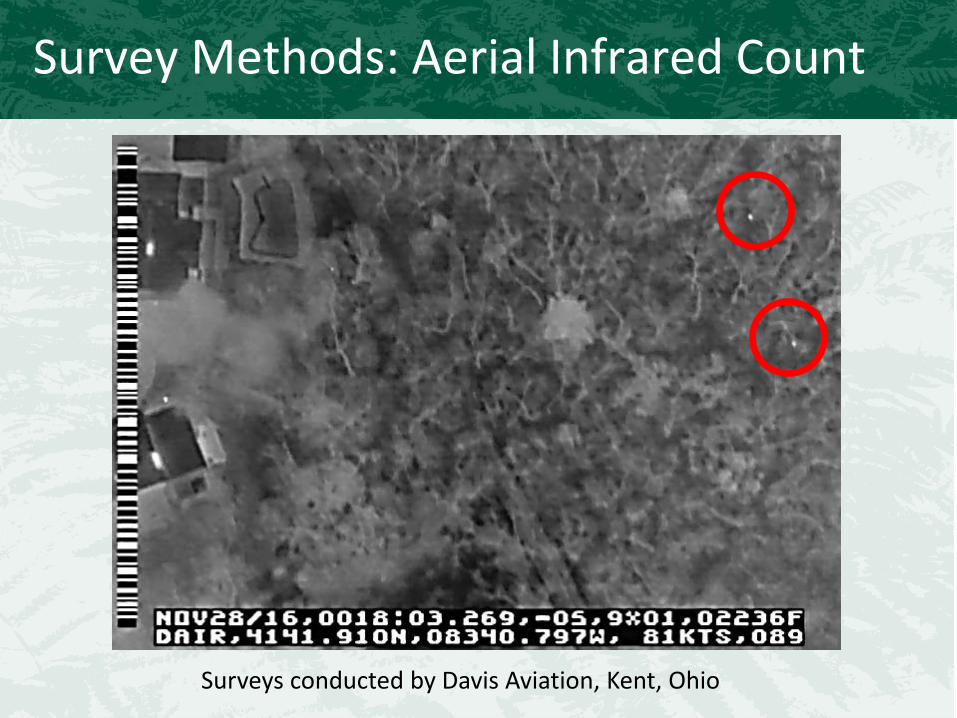
Survey Methods: Aerial Infrared Count
Surveys conducted by Davis Aviation, Kent, Ohio
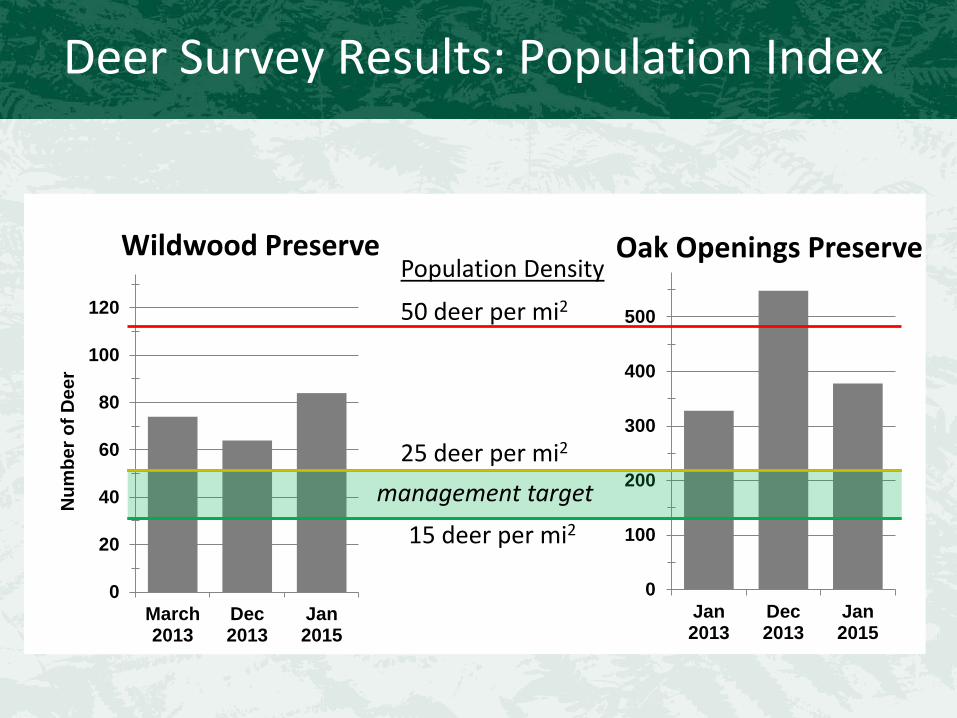
Deer Survey Results: Population Index
0
20
40
60
80
100
120
March2013
Dec2013
Jan2015
Num
ber o
f Dee
r
0
100
200
300
400
500
Jan2013
Dec2013
Jan2015
Wildwood Preserve Oak Openings Preserve
15 deer per mi2
25 deer per mi2
Population Density
50 deer per mi2
management target
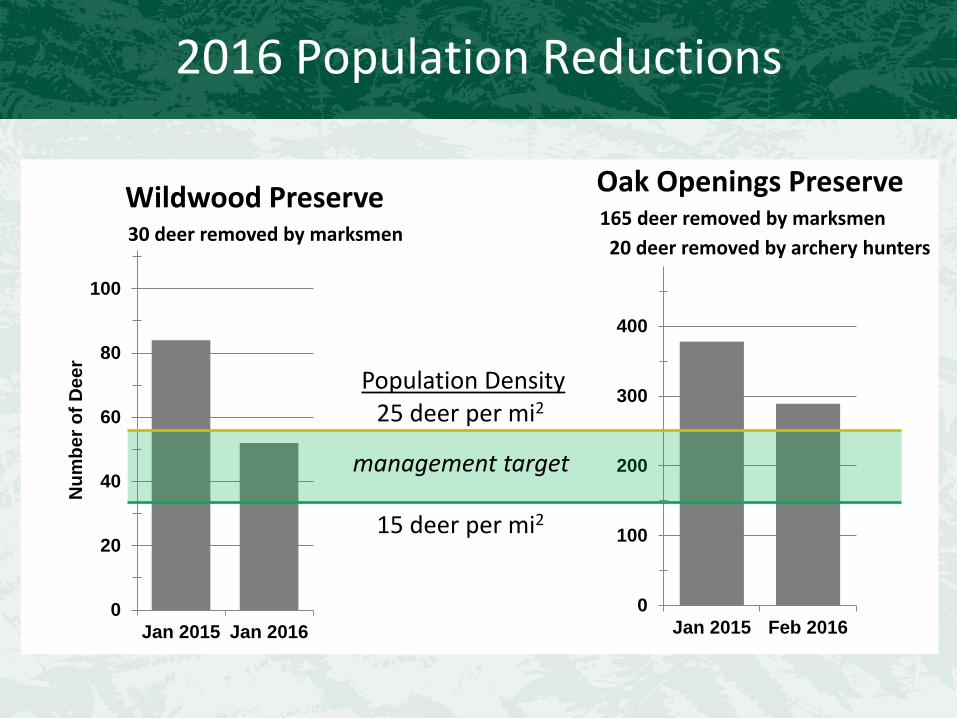
2016 Population Reductions
0
20
40
60
80
100
Jan 2015 Jan 2016
Num
ber o
f Dee
r
0
100
200
300
400
Jan 2015 Feb 2016
15 deer per mi2
25 deer per mi2
Wildwood Preserve 30 deer removed by marksmen
Oak Openings Preserve 165 deer removed by marksmen 20 deer removed by archery hunters
management target
Population Density
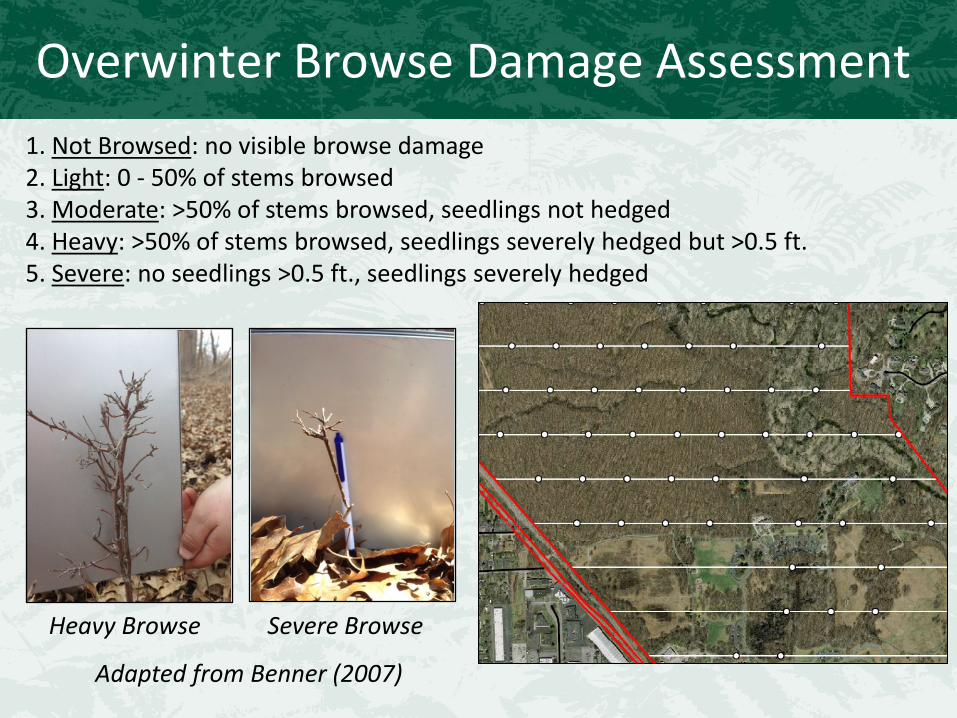
Overwinter Browse Damage Assessment 1. Not Browsed: no visible browse damage 2. Light: 0 - 50% of stems browsed 3. Moderate: >50% of stems browsed, seedlings not hedged 4. Heavy: >50% of stems browsed, seedlings severely hedged but >0.5 ft. 5. Severe: no seedlings >0.5 ft., seedlings severely hedged
Heavy Browse Severe Browse
Adapted from Benner (2007)
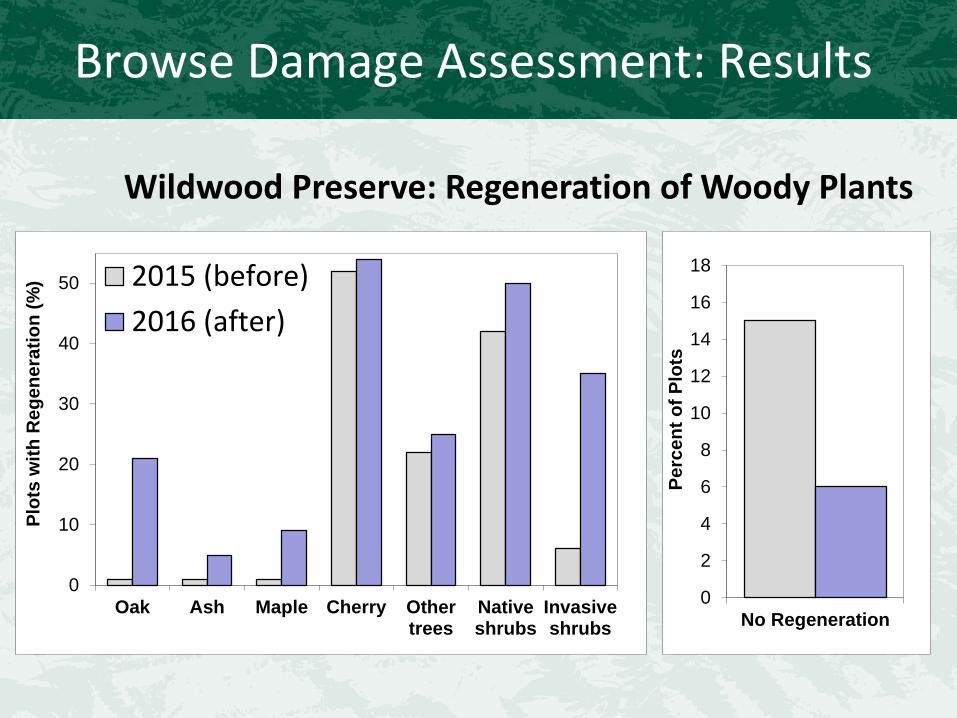
Browse Damage Assessment: Results
0
2
4
6
8
10
12
14
16
18
No Regeneration
Perc
ent o
f Plo
ts
0
10
20
30
40
50
Oak Ash Maple Cherry Othertrees
Nativeshrubs
Invasiveshrubs
Plot
s w
ith R
egen
erat
ion
(%) 2015 (before)
2016 (after)
Wildwood Preserve: Regeneration of Woody Plants
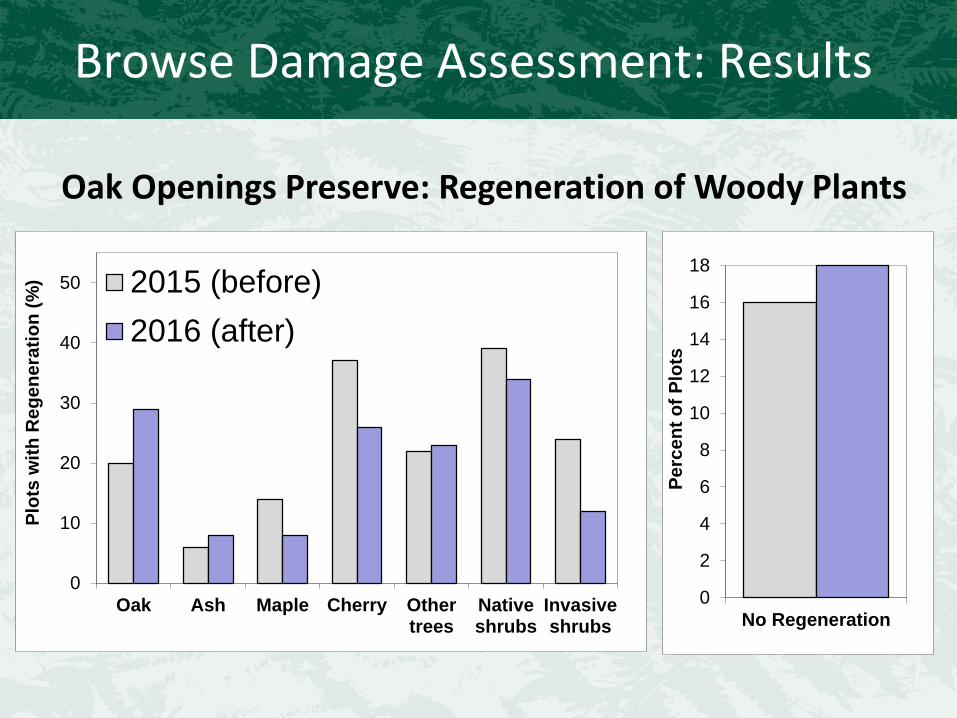
Browse Damage Assessment: Results
Oak Openings Preserve: Regeneration of Woody Plants
0
10
20
30
40
50
Oak Ash Maple Cherry Othertrees
Nativeshrubs
Invasiveshrubs
Plot
s w
ith R
egen
erat
ion
(%) 2015 (before)
2016 (after)
0
2
4
6
8
10
12
14
16
18
No Regeneration
Perc
ent o
f Plo
ts
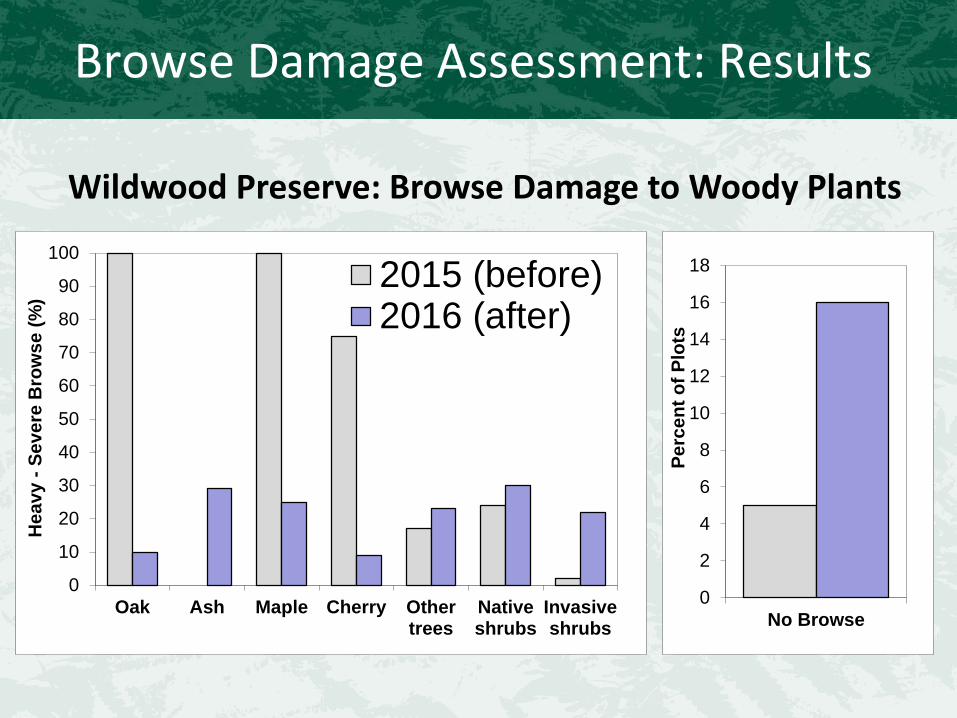
Browse Damage Assessment: Results
0
10
20
30
40
50
60
70
80
90
100
Oak Ash Maple Cherry Othertrees
Nativeshrubs
Invasiveshrubs
Hea
vy -
Seve
re B
row
se (%
)
2015 (before)2016 (after)
0
2
4
6
8
10
12
14
16
18
No Browse
Perc
ent o
f Plo
ts
Wildwood Preserve: Browse Damage to Woody Plants
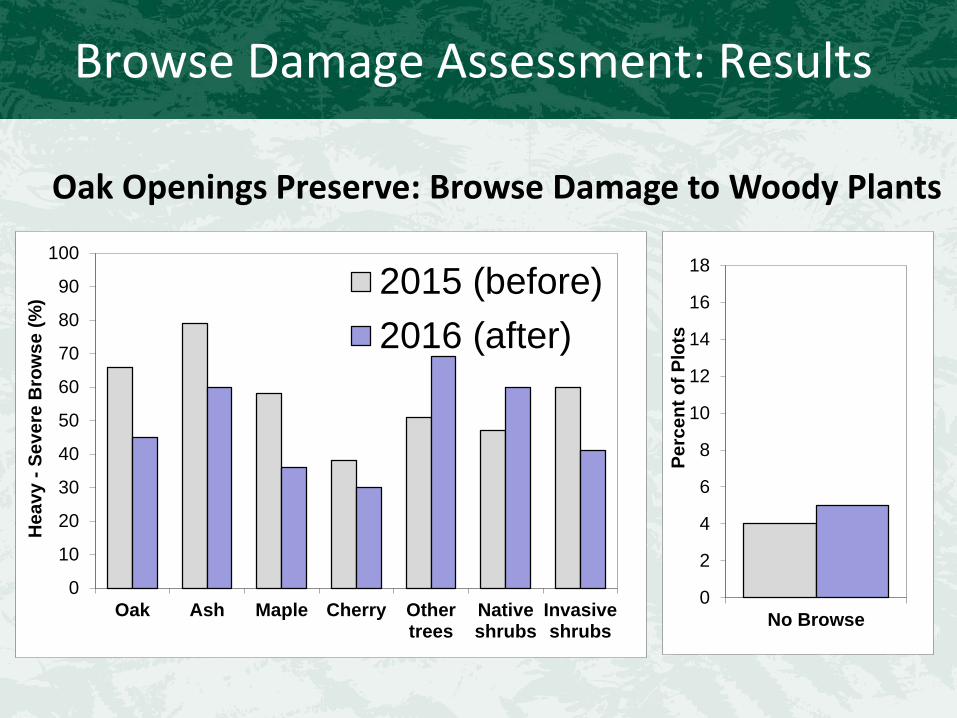
Browse Damage Assessment: Results
Oak Openings Preserve: Browse Damage to Woody Plants
0
10
20
30
40
50
60
70
80
90
100
Oak Ash Maple Cherry Othertrees
Nativeshrubs
Invasiveshrubs
Hea
vy -
Seve
re B
row
se (%
) 2015 (before)2016 (after)
0
2
4
6
8
10
12
14
16
18
No Browse
Perc
ent o
f Plo
ts
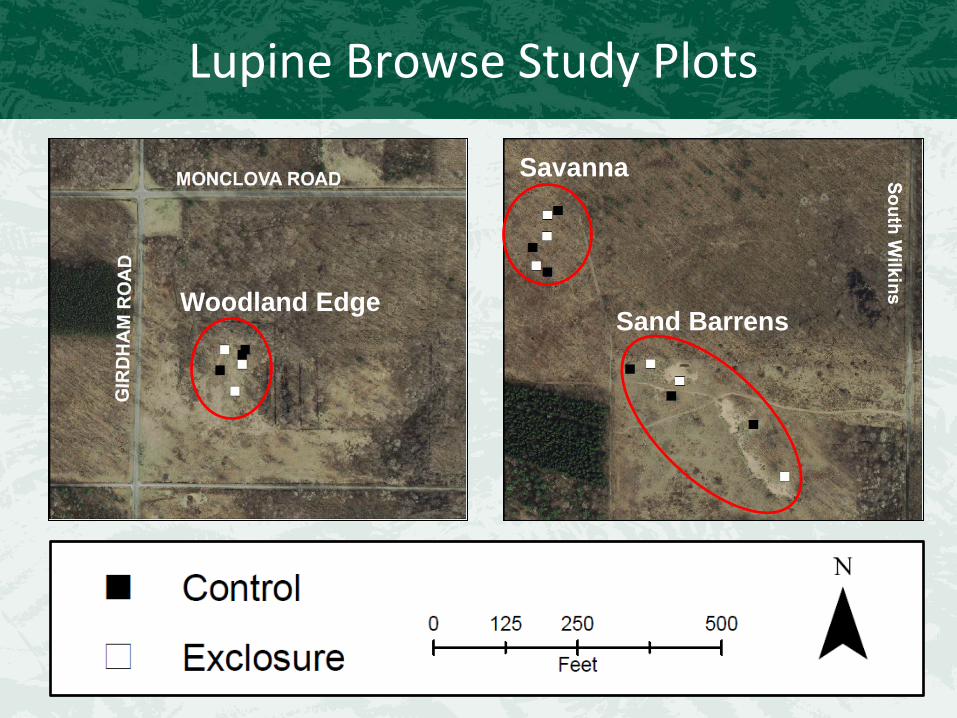
Lupine Browse Study Plots
Woodland Edge
Savanna
Sand Barrens
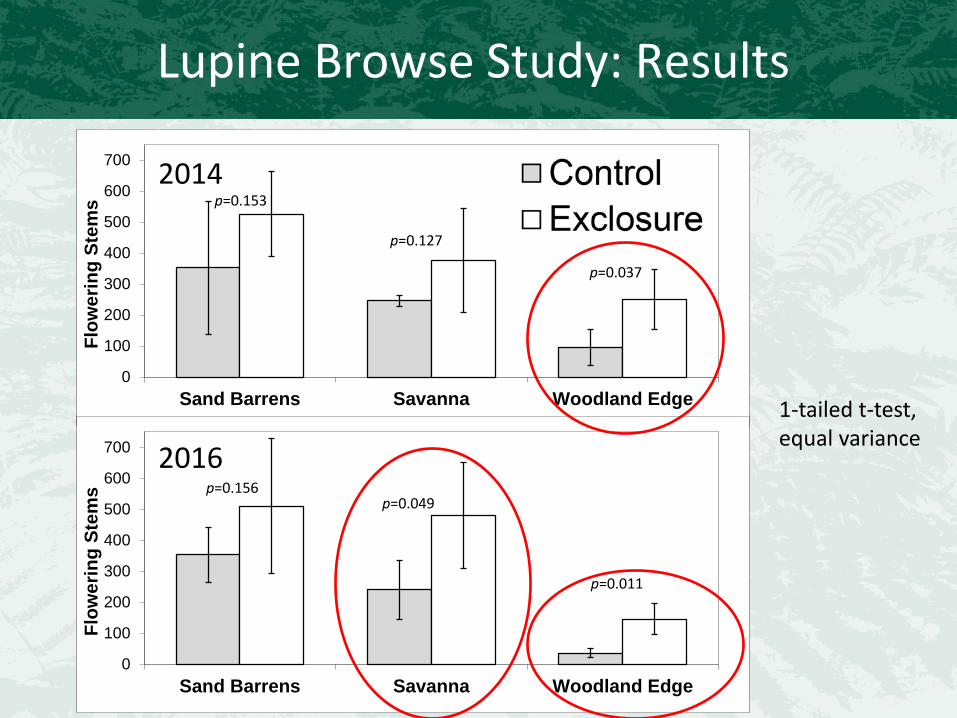
Lupine Browse Study: Results
0
100
200
300
400
500
600
700
Sand Barrens Savanna Woodland Edge
Flow
erin
g St
ems
0
100
200
300
400
500
600
700
Sand Barrens Savanna Woodland Edge
Flow
erin
g St
ems
2014
2016
p=0.153
p=0.127
p=0.037
p=0.049 p=0.156
p=0.011
1-tailed t-test, equal variance
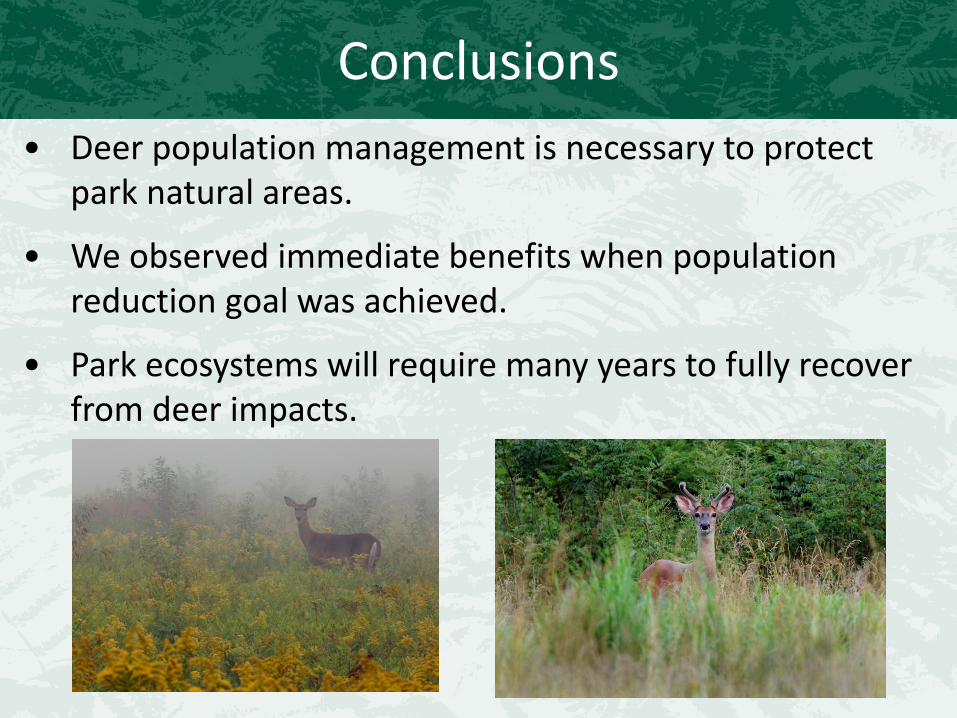
Conclusions • Deer population management is necessary to protect
park natural areas.
• We observed immediate benefits when population reduction goal was achieved.
• Park ecosystems will require many years to fully recover from deer impacts.
Acknowledgements We thank the following people for their help with browse surveys and data collection: Karen Menard Samantha Neuman Penny Niday LaRae Sprow Derrick Unverferth Alexa Vogel


![psychology2logs.files.wordpress.com · Web viewOutline 2 correlational findings from the Levine study [4] Outline one way in which the study can be said to have high ecological](https://img.pdfslide.net/doc/110x75/5ce1225d88c993f1668c0c4d/-web-viewoutline-2-correlational-findings-from-the-levine-study-4-outline-one.jpg)