Embed Size (px)
Citation preview

INITIAL LIDAR and GEOPHYSICSINTERPRETATION and INTEGRATION REPORT
on the
EL TORO PROJECTTelkwa, British Columbia
NTS: 93L/5, 6 and 11
Latitude 54o30’N Longitude 127o15’W
Omineca Mining Division, British Columbia
Claims: Howson, Loljuh, El Toro 1 to 4, Princess 1 to 2, Howson N
(Tenure Numbers: 1020386, 1028254-60, 1032685)
Work performed between November 5 and 18, 2014
Owner/Operator:Lions Gate Energy Inc.
Suite 610 - 1100 Melville StreetVancouver, British Columbia
Canada V6E 4A6
By:Jean Pautler, P.Geo.JP Exploration Services Inc.#103-108 Elliott StreetWhitehorse, YukonY1A 6C4
June 8, 2015
1
ASSESSMENT REPORT TITLE PAGE AND SUMMARY
TITLE OF REPORT Initial LIDAR and geophysics interpretation and integration report on the El Toro Project
TOTAL COST $8,250.00 + 3,261.21 PAC = $11,511.21
AUTHOR(S) Jean Pautler
SIGNATURE(S) “jean pautler”
NOTICE OF WORK PERMIT NUMBER(S)/DATE(S)
STATEMENT OF WORK EVENT NUMBER(S)/DATE(S) 5531168 November 18, 2014
YEAR OF WORK 2014
PROPERTY NAME El Toro Project
CLAIM NAME(S) (on which work was done) Howson, Loljuh, El Toro 1 to 4, Princess 1 to 2, Howson N
(tenure numbers 1020386, 1028254-60, 1032685)
COMMODITIES SOUGHT Cu, Ag, Au, and Cu, Mo (Ag) porphyry
MINERAL INVENTORY MINFILE NUMBER(S),IF KNOWN 093L 033-047, 049-050, 062, 064-069, 080,166, 168, 185, 189, 194, 227-228, 241, 255, 299, 304, 320
MINING DIVISION Omineca
NTS / BCGS 93L/5,6,11 / 93L/ 0
LATITUDE ____54______º ____30______’__00________"
LONGITUDE ______127____º ___15_______’_____00_____" (at centre of work)
UTM Zone 9 EASTING 615000m NORTHING 6040000m
OWNER(S) Lions Gate Energy Inc.MAILING ADDRESS Suite 610 - 1100 Melville St., Vancouver, BC., V6E 4A6OPERATOR(S) [who paid for the work] Lions Gate Energy Inc.MAILING ADDRESS Suite 610 - 1100 Melville St., Vancouver, BC., V6E 4A6REPORT KEYWORDS (lithology, age, stratigraphy, structure, alteration, mineralization, size and attitudedo not use abbreviations or codes)The El Toro Project is primarily underlain by the Telkwa Formation of the subaerial to locally submarine Lower JurassicHazelton Group, dominated by bedded maroon and green subaerial andesitic to dacitic crystal and lithic tuffs, lesserbreccia, minor flow interbeds, and local rhyolite flows and tuffs. The Hazelton Group is intruded by small bosses,stocks and related dykes and sills of the Late Cretaceous Bulkley plutonic suite, with the largest (2 by 3 km) stockexposed in Sunsets Basin. The area is characterized by extensional basin and range type block faulting. The El ToroProject covers a well-mineralized area southwest of Telkwa that includes 38 Minfile occurrences, including 3 pastproducers and 1 developed prospect in Hunter Basin, 6 prospects and 28 showings. The principal deposit type issubvolcanic copper-gold-silver which occurs in permeable horizons within andesite tuffs, veins, fracture fillings andstockwork-breccia zones. For example in Hankin Basin mineralization has been intermittently traced for 5 km alongstrike and 2 km along dip. The northerly trending Friendly Vein in Dominion Basin returned 9.52 g/t Au, 180 g/t Ag,1.68% Cu, 15.7% Zn and 0.95% Pb across 1.0m. Four stocks of the Bulkley plutonic suite with calc-alkaline porphyrycoppermolybdenumgold(silver) potential were identified, the Sunsets, MSJ, War Eagle and Loljuh stocks. Values of24.0 and 9.43 g/t Au were intersected in the only drill hole on the War Eagle Stock.REFERENCES TO PREVIOUS ASSESSMENT WORK AND ASSESSMENT REPORT NUMBERS
#01880 (Brown, 1968) #01922 (Woolverton, 1969) #03485 (Sharp, 1970) #03583 Ashton, 1972
#04831, 04811 (McAndrew, et al, 1973) #07070 (Allen, 1981) #08444 (Kenyon, 1980)
#10043 (Kikuchi, 1981) #12135 (Price, 1983) #13191 (Kikuchi, 1985) #17407 (Helgason, 1987)
#19555 (Ethier, 1989) #20741 (Hanson, 1990) #21765 (Jamieson, 1991a) #21925 (Hanson, 1991)
#22053 (Pauwels, 1988) #29456 (Mallen, 2007) #30188 (Yin, 2008) #30731 (Pautler, 2009a)
#30982 (Pautler, 2009c) #33275 (Mark, 2012) #34445 (Mark, 2014) #34451 (Justason & Mark, 2014)
#35000 (Mark, 2014)

Mineral Titles Online
Mineral Claim Exploration and Development Work/Expiry Date Change Confirmation
Recorder: JUSTASON, ANGELIQUE SAMANTHA-LYNNE (133276)
Recorded: 2014/NOV/18D/E Date: 2014/NOV/18
Submitter: JUSTASON, ANGELIQUE SAMANTHA-LYNNE (133276)
Effective: 2014/NOV/18
Confirmation
If you have not yet submitted your report for this work program, your technical work reportis due in 90 days. The Exploration and Development Work/Expiry Date Change eventnumber is required with your report submission. Please attach a copy of thisconfirmation page to your report. Contact Mineral Titles Branch for more information.
Event Number: 5531168
Work Type: Technical WorkTechnical Items: Geophysical, PAC Withdrawal (up to 30% of technical work required)
Work Start Date: 2014/NOV/05Work Stop Date: 2014/NOV/18Total Value ofWork: $8250.00Mine Permit No:
Summary of the work value:
TenureNumber
ClaimName/Property
IssueDate
GoodTo
Date
NewGood
ToDate
# ofDaysFor-ward
Areainha
AppliedWorkValue
Sub-mission
Fee
1020386 HOWSON 2013/jun/18 2014/nov/18 2014/dec/12 24 656.78 $ 215.93 $ 0.00
1028254 LOLJUH 2014/may/12 2014/nov/18 2014/dec/12 24 790.80 $ 259.99 $ 0.00
1028255 EL TORO 1 2014/may/12 2014/nov/18 2014/dec/12 24 7728.35 $ 2540.83 $ 0.00
1028256 EL TORO 2 2014/may/12 2014/nov/18 2014/dec/12 24 1883.10 $ 619.10 $ 0.00
1028257 EL TORO 3 2014/may/12 2014/nov/18 2014/dec/12 24 10294.98 $ 3384.65 $ 0.00
1028258 EL TORO 4 2014/may/12 2014/nov/18 2014/dec/12 24 12003.97 $ 3946.51 $ 0.00
1028259 PRINCESS 2014/may/12 2014/nov/18 2014/dec/12 24 921.47 $ 302.95 $ 0.00
1028260 PRINCESS 2014/may/12 2014/nov/18 2014/dec/12 24 733.79 $ 241.25 $ 0.00
Financial Summary:
Total applied work value: $ 11511.21
PAC name: David MarkDebited PAC amount: $ 3261.21Credited PAC amount: $ 0
Total Submission Fees: $ 0.0
Total Paid: $ 0.0
Please print this page for your records.
The event was successfully saved. Click here to return to the Main Menu.

i
1.0 EXECUTIVE SUMMARY
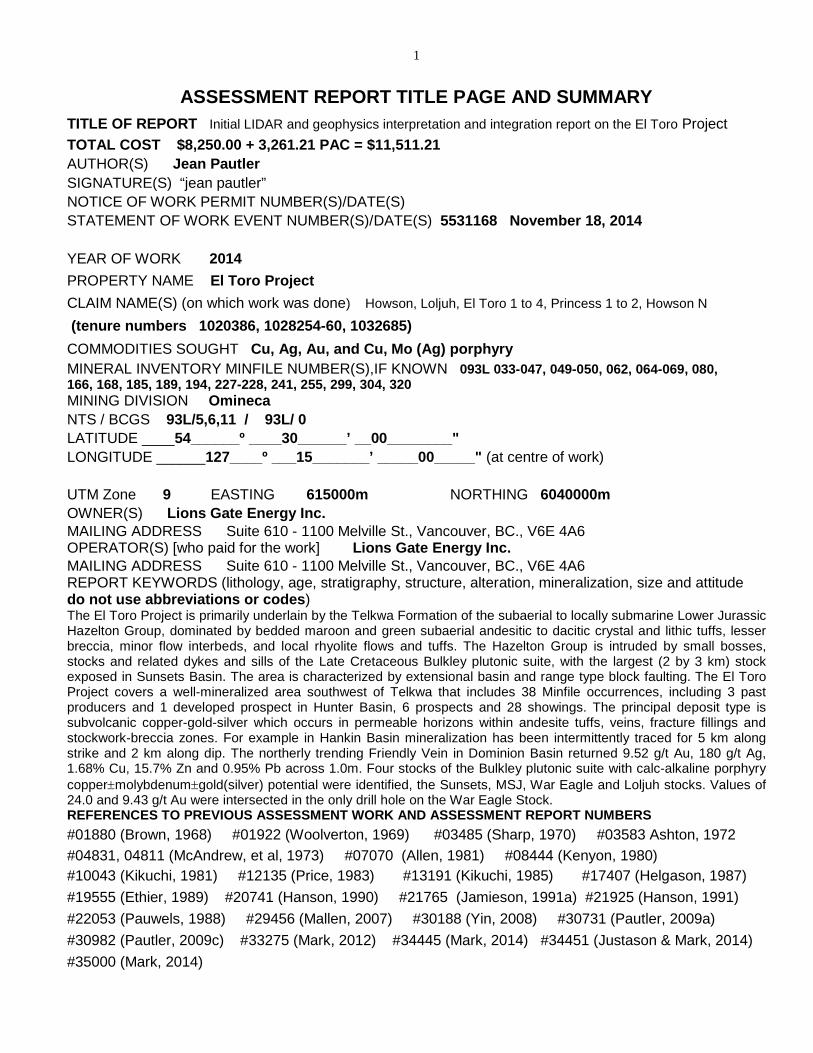
The 36,682 hectare El Toro Project area, NTS map sheets 93L/5, 6 and 11 is located inthe Omineca Mining Division, 30 km southwest of Telkwa, which is 11 km southeast ofSmithers in central British Columbia at a latitude of 5430’N and longitude of 12715’W.The property, 100% owned by Lions Gate Energy Inc., lies within the Telkwa Range ofthe Hazelton Mountains.
The El Toro Project is primarily underlain by the Telkwa Formation of the subaerial tolocally submarine Lower Jurassic Hazelton Group, dominated by bedded maroon andgreen subaerial andesitic to dacitic crystal and lithic tuffs, lesser breccia, minor flowinterbeds, and local rhyolite flows and tuffs. The Hazelton Group is intruded by smallbosses, stocks and related dykes and sills of the Late Cretaceous Bulkley plutonic suite,primarily of quartz monzonite, monzonite and granodiorite compositions, with the largest(2 by 3 km) stock exposed in Sunsets Basin. The area is characterized by extensionalbasin and range type block faulting and a prominent north trending fault divides theproperty along Mooseskin Johnny Valley.
The principal deposit type present on the El Toro Project is the subvolcanic copper-gold-silver (arsenic, antimony) type, also referred to as transitional or intrusion relatedpolymetallic stockwork and vein types. The Equity Silver past producing mine, 60 kmsoutheast of El Toro, is an example of this type of deposit and produced 33.8 milliontonnes of 0.4% copper, 64.9 g/t Ag, and 0.46 g/t Au. The calc-alkaline porphyrycoppermolybdenumgold(silver) deposit type, commonly related to the subvolcanictype, is also present, associated with the Bulkley plutonic suite which occur as stocksand dykes across the property. The Huckleberry Mine, 70 km south of the El ToroProject, is an example of this deposit type and is associated with a stock of the LateCretaceous Bulkley plutonic suite. Gold-silvercopper epithermal veins, and stockworks,commonly associated with the above deposit types also occur in the project area.
The El Toro Project covers a well-mineralized area southwest of Telkwa that includes38 Minfile occurrences, including 3 past producers and 1 developed prospect in HunterBasin, 6 prospects and 28 showings, as documented by the British Columbia GeologicalSurvey Branch. In Hunter Basin the combined production from the King and Rainbowmines between 1914 and 1962 totaled 293.5 tonnes producing 8,533g Au, 294,905g Ag,and 44,357 kg copper, and in 1914 38 tonnes of ore was shipped from the Colorado minerecovering 155,515 g Ag and 2722 kg Cu.
Previous exploration on the El Toro Project, undertaken from 1898 to 2007, has onlyinvolved approximately 3800 metres of diamond drilling in 60 holes, with earlyunderground exploration, excavator and hand trenching, mapping, rock geochemistryand reconnaissance and grid soil geochemistry. Most of the showings were discoveredand worked on from the turn of the century to 1941. A resurgence in activity was seen inthe 1960’s, with sporadic work in the 1970’s, resulting in the discovery of the porphyryshowings. Sporadic work continued until 1991. The Project area was initially 100%acquired by Lions Gate Energy Inc. in 2007. Work by Lions Gate Energy Inc. from 2007

ii
to 2014 has involved prospecting, mapping, rock and soil geochemical sampling, MMIsoil and biogeochemical surveys, GPS surveying of previous diamond drill hole collarsand old workings, 2194 line km of airborne magnetic-electromagnetic geophysics in twoblocks, limited ground VLF-EM, self potential and induced polarization and resistivitygeophysical surveys, and a 12,770 ha LiDAR survey.
This report documents an interpretation of the 2013 LiDAR and 2007-8 airbornegeophysical surveys completed on the company’s El Toro property, to integrate with theknown geology and geophysics, and to make recommendations for the next phase ofexploration work in order to test the economic potential of the property.
The interpretation delineated additional potential in the El Toro Project area andaugments the potential of known targets. The Sunsets, MSJ, and War Eagle stocks aredefined by significant magnetic low features, suggestive of altered intrusions, with thelatter two anomalies larger than the mapped surface extent of the intrusions. In additiona significant magnetic low anomaly was delineated along Starr Creek (Starr Mag) andanother just south of the central property area. Intrusions have been found or reportedin these areas. In addition the Starr Mag anomaly and War Eagle stock appear to bepart of a much larger magnetic low anomaly that underlies the Howson Basin area.Small intrusions have been mapped in the area and quartz-pyrite alteration at JokerRidge is suggestive of a near surface buried intrusion. It should be noted that a previousDDH record was uncovered from the War Eagle Pyrite showing indicating results of24.0 and 9.43 g/t Au, each over 3.05m, which have not been followed up.
The MSJ porphyry showing, which covers anomalous copper, gold, molybdenum ±silverMMI soil geochemistry associated with a chargeability high anomaly in an altered intrusionwith associated chalcopyrite mineralization, appears to occur at the intersection of fivefaults. Other significant multiple fault intersections occur near the War Eagle Pyrite zoneand at the junction of Starr Creek with the Thautil River.
The Hankin Basin area has potential for possible bulk tonnage and local high gradecopper-silver-gold mineralization with significant similarities to the past producing EquitySilver mine. Mineralization, traced for 5 by 2 km and 350-400m in elevation, occurs inrelatively flat lying permeable horizons within andesite tuffs and in cross fractures andstockwork-breccia zones. A northerly trending fault extends for at least 13 km along LoringCreek (Loring fault) and further south. A 7 km long northwest trending fault extendsthrough the Hunter Basin showings (Hunter fault), through the Loring showing, andbeyond. The Loring showing occurs near the junction of the Loring and Hunter faults.
At Hunter Basin previous production records and 2008 sampling (6.51% Cu, 4.65 g/t Auand 202 g/t Ag over 0.5m from the King Vein with 36.5% Cu, 155 g/t Au and 2306 g/t Agfrom a grab sample) indicate high grade copper-gold-silver vein type mineralization fromthe south side of Hunter Basin. Geophysical surveys and observed lineaments and agossan, suggest continuity to the hosting structure of the King Vein. There does notappear to have been significant drilling to test the structures. The Rainbow and KingVeins have potential to host similar mineralization along strike and down dip. In addition

iii
strataform mineralization has been reported from the Hunter developed prospectsuggesting similarities to the mineralization in Hankin Basin.
In Dominion Basin a significant quartz sulphide vein is exposed for 15m in the FriendlyTrench returning 9.52 g/t Au, 180 g/t Ag, 1.68% Cu, 15.7% Zn and 0.95% Pb across1.0m in 2008. There does not appear to have been extensive work in this area to tracethe vein and additional veins are suggested by the discovery of gold-bearing quartzcarbonate float in upper Hankin Basin.
Although mineralization was locally restricted at the Duchess prospect due to late faults,there is significant potential along strike of the persistent, 5 km long Princess-Duchess-Countess-Silver Heels structure, which is clearly evident in Google Earth images.
Previous porphyry coppermolybdenumgold(silver) exploration in the Sunsets stockfocussed on the phyllic alteration zones, but previous soil sampling and continuedexploration in 2008 has indicated better grades peripheral to these zones. At the WarEagle stock copper-silver mineralization occurs peripheral to the intrusion as is the caseat the Huckleberry Mine. High grade copper-silver mineralization is associated withfelsic dykes peripheral to the poorly exposed MSJ stock and similar mineralization isassociated with felsic dykes at the Joker Ridge quartz-pyrite zone and possibly relatedhigh grade Duchess copper-silver vein prospect in the Howson Basin area. The dykesmay be related to mineralized stocks, the MSJ stock in the former case and a nearsurface buried intrusion at Joker Ridge. A mineralized dyke is also documented at thePete showing in the Houston Tommy Creek area, outboard of the Loljuh stock.
An initial Phase 1 exploration program consisting of additional mapping, detailedprospecting and sampling (south Hunter, Hankin, Sunsets, Dominion and HowsonBasins, the MSJ, Loljuh and War Eagle stocks), with select conventional and MMI gridsoil (Sunsets, Loljuh and possibly War Eagle stocks) and induced polarization surveys(MSJ, Sunsets, and possibly War Eagle stocks), horizontal loop electromagneticgeophysical surveys (south Hunter Basin and Duchess structure), examination of theHunter developed prospect in north Hunter Basin, the southern magnetic low anomaly, thejunction of Starr Creek with the Thautil River (multiple fault intersections), and follow up ofthe high grade gold results from the War Eagle Pyrite zone is recommended on the ElToro Project at a cost of $250,000 in order to delineate drill targets.

Table of Contents
Page
1.0 Executive Summary.............................................................................................................i2.0 Introduction And Terms of Reference ............................................................................. 1
2.1 Introduction, Qualified Person and Participating Personnel...................................... 12.2 Terms, Definitions and Units ..................................................................................... 12.3 Source Documents.................................................................................................... 2
3.0 Reliance On Other Experts. .............................................................................................. 24.0 Property Description And Location ................................................................................. 3
4.1 Location..................................................................................................................... 34.2 Land Tenure .............................................................................................................. 4
5.0 Accessibility, Climate, Local Resources, Infrastructure & Physiography ................... 85.1 Access, Local Resources and Infrastructure............................................................. 85.2 Physiography and Climate ........................................................................................ 9
6.0 History................................................................................................................................. 97.0 Geological Setting............................................................................................................ 15
7.1 Regional Geology.................................................................................................... 157.2 Property Geology .................................................................................................... 197.3 Mineralization.......................................................................................................... 20
7.3.1 Hunter Basin ................................................................................................ 207.3.2 Hankin Basin ............................................................................................... 217.3.3 Sunsets Basin .............................................................................................. 227.3.4 Dominion Basin............................................................................................ 227.3.5 Houston Tommy Creek .............................................................................. 237.3.6 Howson Basin ............................................................................................ 237.3.7 Starr Creek .................................................................................................. 24
8.0 Deposit Types .................................................................................................................. 379.0 Geophysics ...................................................................................................................... 4110.0 LiDAR Interpretation and Integration............................................................................. 4411.0 Drilling............................................................................................................................... 4812.0 Interpretation And Conclusions ..................................................................................... 5113.0 Recommendations........................................................................................................... 5214.0 References........................................................................................................................ 5415.0 Certification, Date And Signature................................................................................... 6016.0 Appendices....................................................................................................................... 61

List of IllustrationsPage
Figure 1: Location Map ............................................................................................................ 3
Figure 2: Claim and Index Map................................................................................................ 5
Figure 3: Access Map .............................................................................................................. 7
Figure 4: Regional Geology Map ........................................................................................... 17
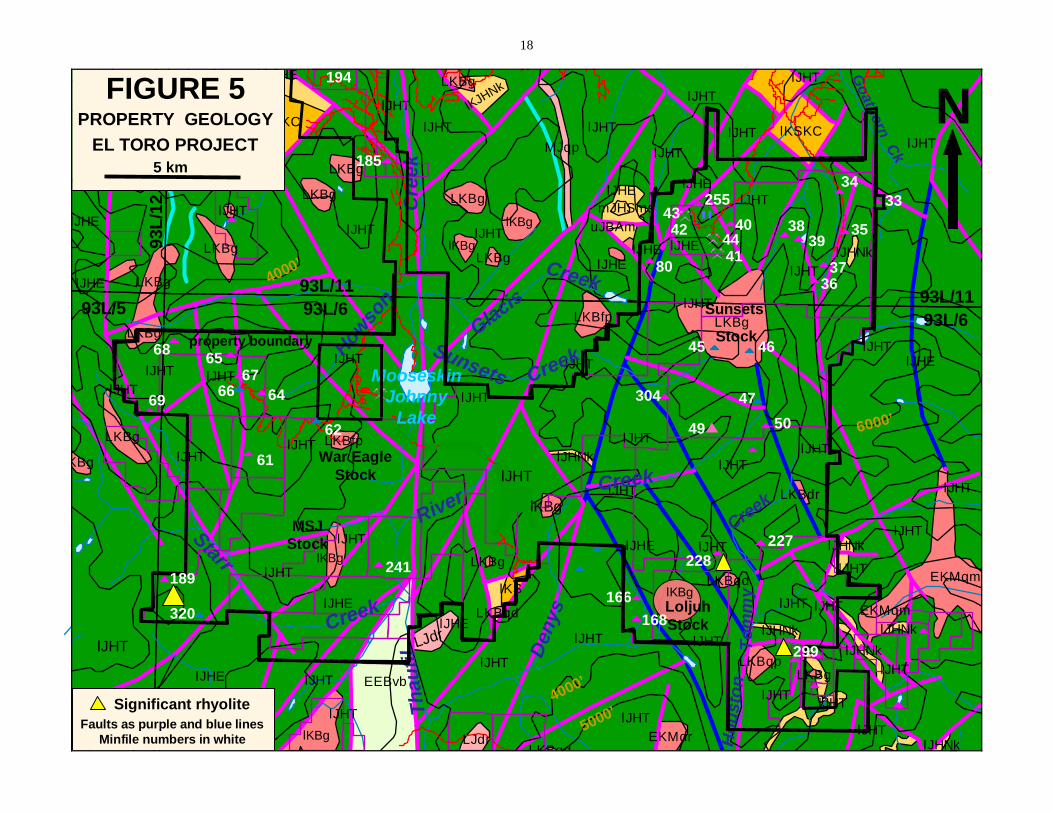
Figure 5: Property Geology Map............................................................................................ 18
Figure 6: Hunter Basin ........................................................................................................... 25
Figure 7a: Hankin Basin - North Loring Creek ........................................................................ 26
Figure 7b: Hankin Basin - South Loring Creek......................................................................... 27
Figure 8: Sunsets Basin ......................................................................................................... 28
Figure 9: Dominion Basin....................................................................................................... 29
Figure 10: Houston Tommy Creek........................................................................................... 30
Figure 10a: Loljuh Detail ............................................................................................................ 31
Figure 11: Howson Basin - Evening Area ................................................................................ 32
Figure 12: Howson Basin - War Eagle Area ............................................................................ 33
Figure 13: Starr Creek - MSJ & Princess................................................................................. 34
Figure 14: MSJ - Cu MMI......................................................................................................... 35
Figure 15: Starr Creek - Ant, Lefty & Wolverine....................................................................... 36
Figure 16: Total Field Magnetic Map........................................................................................ 42
Figure 17: Quest Magnetic Map, reduced to pole.................................................................... 43
Figure 18: Digital Elevation Model ........................................................................................... 46
Figure 19: Bare Earth Image.................................................................................................... 47
Tables
Table 1: Claim data................................................................................................................. 4
Table 2: Minfile Occurrences .................................................................................................. 6
Table 3: Drill programs.......................................................................................................... 48
Table 4: Drill hole specifications............................................................................................ 49
Table 5: Drill hole results....................................................................................................... 50
Appendices
Appendix I: Statement of Expenditures

2.0 INTRODUCTION AND TERMS OF REFERENCE
2.1 Introduction, Qualified Person and Participating Personnel
Ms. Jean M. Pautler, P.Geo. was commissioned by Lions Gate Energy Inc. ofVancouver, British Columbia (owner/operator) to interpret the 12,770 ha LiDAR and2194 line km airborne geophysical surveys completed on the company’s El Toroproperty, to integrate with the known geology and geophysics, and to makerecommendations for the next phase of exploration work in order to test the economicpotential of the property. An estimate of costs has been made based on current rates fordrilling, geochemistry and geophysical surveys, and professional fees in BritishColumbia. The LiDAR survey was completed in September, 2013 by Eagle MappingServices Ltd. of Port Coquitlam, British Columbia with the initialinterpretation andintegration completed by the author from November 14 to 18, 2014. The airbornemagnetic-electromagnetic geophysical surveys were completed by Aeroquest Limited in2007-2008. The property was examined and evaluated by the author from August 17 to28, 2009 and August 26 to September 6, 2008 and the author reviewed the entire 2007to 2014 programs by Lions Gate Energy Inc.
The El Toro Project is located within the Telkwa Range of the Hazelton Mountains incentral British Columbia, 30 km southwest of Telkwa, which is 11 km southeast ofSmithers. The Project is partly road accessible via the Coal Mine road, and local loggingroads and ATV trails, from Telkwa, with the higher portions of the property accessible byhelicopter from Smithers.
The El Toro Project covers 38 Minfile occurrences (including 3 past producers and 1developed prospect in Hunter Basin), 6 prospects and 28 showings, as documented bythe British Columbia Geological Survey Branch. Previous exploration, undertaken from1898 to 2007, has only involved approximately 3800 metres of diamond drilling in 60holes, with early underground exploration, excavator and hand trenching, mapping, rockgeochemistry and reconnaissance and grid soil geochemistry. There is excellentpotential on the El Toro Project for the discovery of calc-alkaline porphyry coppermolybdenumgold(silver) (e.g. Huckleberry Mine), subvolcanic copper-gold-silver (e.g.Equity Silver), and, commonly associated, gold-silvercopper epithermal vein andstockwork deposit types.
2.2 Terms, Definitions and Units
All costs contained in this report are denominated in Canadian dollars. Distances areprimarily reported in metres (m) and kilometres (km) and in feet (ft) when reportinghistorical data. The annotation 020º/55ºE refers to an azimuth of 020º, dipping 55º to theeast. GPS refers to global positioning system. DDH refers to diamond drill hole. VLF-EMrefers to a very low frequency type and HLEM a horizontal loop type of electromagneticgeophysical survey and IP refers to an induced polarization type of geophysical survey.MMI sampling is an analytical process that measures mobile metal ions reported to beuseful in detecting mineralization beneath younger cover rocks and thick glacial till.

2
Minfile showing refers to documented mineral occurrences on file with the BritishColumbia Geological Survey. LiDAR (Light Detection and Ranging) is a remote sensingtechnique.
The term ppm refers to parts per million, which is equivalent to grams per metric tonne(g/t) and ppb refers to parts per billion. The abbreviations oz/ton and oz/t refers to troyounces per imperial short ton. The symbol % refers to weight percent unless otherwisestated.
Elemental abbreviations used in this report include: gold (Au), silver (Ag), copper (Cu),iron (Fe), lead (Pb), zinc (Zn), molybdenum (Mo), arsenic (As), antimony (Sb), bismuth(Bi) and sulphide (S). Minerals found on the El Toro property include pyrite (ironsulphide), chalcopyrite, chalcocite and bornite (copper sulphides), tetrahedrite group(copper iron silver arsenic antimony sulphide), galena (lead sulphide), sphalerite (zincsulphide), molybdenite (molybdenum sulphide) and arsenopyrite (iron, arsenicsulphide).
2.3 Source Documents
Sources of information are detailed below and include available public domaininformation and personally acquired data.
Research of Minfile data at http://www.em.gov.bc.ca/Mining/Geolsurv/Minfile/default.htm onJune 1, 2015.
Research of mineral titles at http://www.em.gov.bc.ca/Mining/Geolsurv/MapPlace andhttp://www.mtonline.gov.bc.ca on June 1, 2015.
Review of annual assessment and company reports filed with the Ministry of Energy andMines.
Review of other proprietary company data. Review of geological maps and reports completed by the British Columbia Geological
Survey or its predecessors and the Geological Survey of Canada. Published scientific papers on the geology and mineral deposits of the region and on
mineral deposit types. Work conducted on the property by the author from August 17 and 28, 2009 and August 26
to September 6, 2008 and a review of the entire 2007 to 2014 programs. A review of pertinent news releases of Lions Gate Energy Inc. and of other companies
conducting work in the regional area.
3.0 RELIANCE ON OTHER EXPERTS
The author has relied in part upon work and reports completed by others in previousyears in the preparation of this report. Checks to confirm the results of such prior workand reports has not been done. The author has no reason to doubt the correctness ofsuch work and reports. Unless otherwise stated the author has not independentlyconfirmed the accuracy of the data.
In regards to section 4.2, “Land Tenure”, mineral title ownership was identified by theauthor at http://www.mtonline.gov.bc.ca as indicated in section 2.3, “Source
3
Documents”. Further, while title documents were reviewed for this study, they do notconstitute nor is it intended to represent a legal, or any other, opinion as to the validity ofthe title.
4.0 PROPERTY DESCRIPTION AND LOCATION
4.1 Location (Figures 1 to 3)
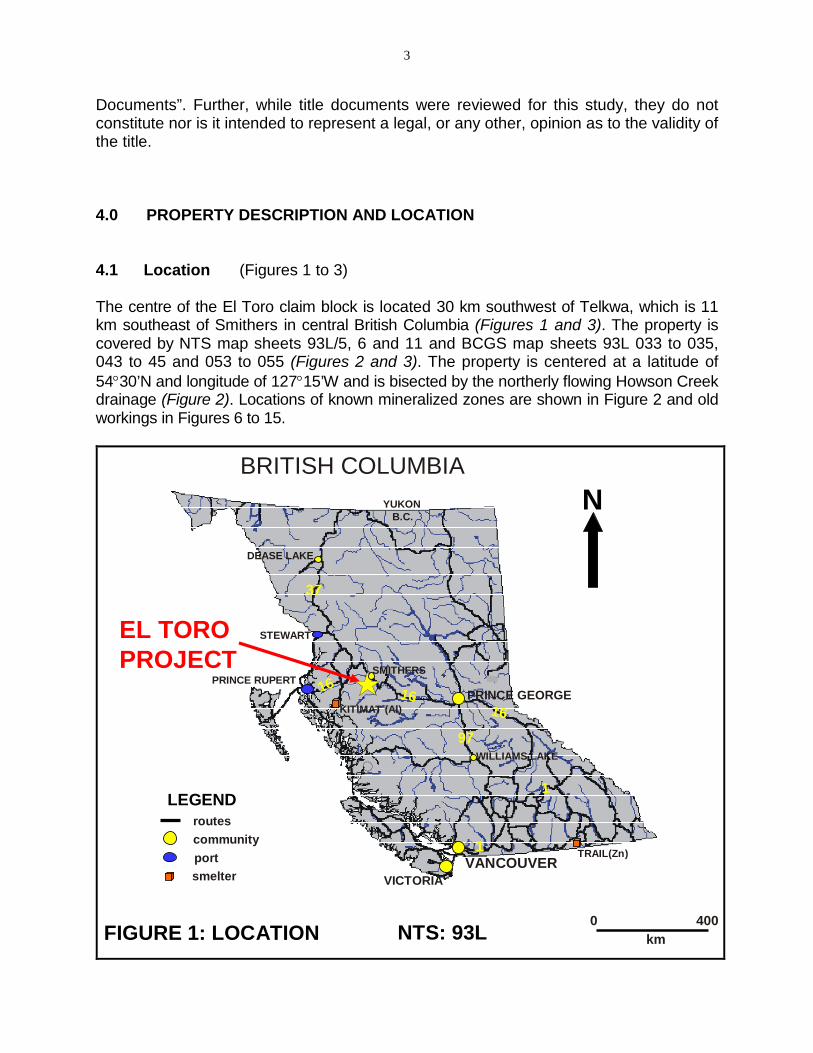
The centre of the El Toro claim block is located 30 km southwest of Telkwa, which is 11km southeast of Smithers in central British Columbia (Figures 1 and 3). The property iscovered by NTS map sheets 93L/5, 6 and 11 and BCGS map sheets 93L 033 to 035,043 to 45 and 053 to 055 (Figures 2 and 3). The property is centered at a latitude of5430’N and longitude of 12715’W and is bisected by the northerly flowing Howson Creekdrainage (Figure 2). Locations of known mineralized zones are shown in Figure 2 and oldworkings in Figures 6 to 15.
BRITISH COLUMBIA
VICTORIA
VANCOUVER
PRINCE GEORGE
DEASE LAKE
YUKON
EL TOROPROJECT
N
STEWART
FIGURE 1: LOCATION NTS: 93L0 400
km
B.C.
SMITHERS
WILLIAMS LAKE
PRINCE RUPERT
LEGENDroutes
community
port
smelter
TRAIL(Zn)
KITIMAT (Al)
16
37
97
1
16
16
1

4
4.2 Land Tenure (Figure 2)
The El Toro Project consists of 9 contiguous Mineral Tenure Online (MTO) claimscovering an area of 36,681.781 hectares in the Omineca Mining Division, BritishColumbia (Figure 2). All claims were acquired in accordance with Mineral Titles Onlineon NTS map sheets 93L/5, 6 and 11, available for viewing athttp://www.mtonline.gov.bc.ca and have not been legally surveyed.
The claims are registered in the name of and 100% owned by Lions Gate Energy Inc.,Client Number 144284. A table summarizing pertinent claim data is shown below.
TABLE 1: Claim data
Claim Name Title No. Area (ha) Issue Date Expiry Date*
HOWSON 1020386 656.7845 2013/jun/18 2015/aug/14
LOLJUH 1028254 790.7968 2014/may/12 2015/aug/14
EL TORO 1 1028255 7728.3489 2014/may/12 2015/aug/14
EL TORO 2 1028256 1883.0994 2014/may/12 2015/aug/14
EL TORO 3 1028257 10294.9781 2014/may/12 2015/aug/14
EL TORO 4 1028258 12003.965 2014/may/12 2015/aug/14
PRINCESS 1 1028259 921.4672 2014/may/12 2015/aug/14
PRINCESS 2 1028260 733.7936 2014/may/12 2015/aug/14
HOWSON N 1032685 1668.5474 2014/dec/11 2015/dec/11
TOTAL 36681.7809* expiry date based on acceptance of this and other reports for assessment
Burnie – Shea Park, covering Burnie Lakes and the upper Burnie River, adjoins thesouthwestern property area as shown in Figures 2 to 5. The Lefty occurrence, part ofthe Ant prospect, lies within the park. Surveyed lots, which indicate ownership of thesurface rights occur around Mooseskin Johnny (MSJ) Lake, the lower portion of DenysCreek, and the extreme northeast corner of the property.

5
N
93L/6
93L/11
93L/5
93L/12
Cre
ek
CLAIM & INDEXMAP
FIGURE 2
5 km
5000’
EL TOROPROJECT
How
son
Sunsets CreekGla
cisCreek
Th
au
til
River
Goath
orn
Ck
4000’
4000
’
6000’MSJLake
drillhole
Figure 12
Den
ys
Creek
Ho
usto
nT
om
my
Creek
Goath
orn
Ck
Burnie-Shea Park
Figure 6
Figure 8
Figure 9
Figure 10
Figure 11
Figure 13
Figure 14
MINFILE SHOWINGS
" showingdeveloped prospect
" prospectpast producer
Figure 7a
Figure 7bAl 4LiDAR survey

6
Table 2: Minfile Occurrences NAD 83, Zone 9
Minfile No. Name Status Commodities NTS Easting NorthingHANKIN BASIN
093L 033 HOPE Showing AG, AU, CU 093L11E 624244 6044837093L 034 OLD TOM Showing CU, AG, AU, ZN 093L11E 622780 6045107093L 035 HANKIN Showing CU, AG, AU 093L11E 623036 6043599093L 036 LORING, SLUMP BLOCK Showing CU, AG, MO, AU 093L11E 621936 6041713093L 037 LAVA Showing CU, MO 093L11E 622279 6042310093L 038 MARMOT, CHIMNEY Showing CU, AG 093L11E 620722 6043382093L 039 CRATER LAKE, COPPER Showing CU, AG 093L11E 621282 6043273
HUNTER BASIN
093L 040 IDAHO Showing CU, AG, AU 093L11E 618663 6043699093L 041 KING Past Producer CU, AG, AU 093L11E 618206 6042574093L 042 HUNTER Developed Prospect CU, AG, AU 093L11E 617334 6043603093L 043 COLORADO Past Producer CU, AG, AU 093L11E 616894 6043931093L 044 RAINBOW Past Producer CU, AG, AU 093L11E 618012 6043125093L 255 TRIBUNE Showing AG, CU, AU 093L11E 617403 6044439093L 080 HANNAH Showing AG, CU 093L11E 615625 6042198
SUNSETS BASIN
093L 045 FOG (FLY) Prospect MO, CU 093L06E 618264 6038957093L 046 FOG Prospect MO, CU 093L06E 619580 6038899
DOMINION BASIN
093L 047 DENY NORTH Prospect AG, PB, ZN, CU, AU 093L06E 619972 6037023093L 049 DENY SOUTH Showing CU, AG 093L06E 619840 6035164093L 050 DENY EAST Showing CU 093L06E 620356 6036105093L 304 SUNSET, SUN Showing CU, AG, AU 093L06E 616441 6037024
TOMMY HOUSTON CREEK
093L 166 LOLJUH Showing PB, ZN, AG, CU 093L06E 615663 6029335093L 168 JOE 1-3 Showing CU 093L06E 615682 6028563093L 227 RUDY Showing CU, AG, PB, ZN, MO 093L06E 620330 6031620093L 228 PETE Showing CU, AG, AU 093L06E 618664 6031206093L 299 DEL Showing CU, AG 093L06E 621799 6027237
HOWSON BASIN
093L 061 PRINCESS Showing ZN, CU, AG 093L06W 600601 6034173093L 062 WAR EAGLE Prospect CU, AG, ZN 093L06W 603164 6035560093L 064 EVENING Showing CU, PB 093L06W 601016 6036563093L 065 SILVER HEELS, Showing CU, AG, AU 093L06W 599780 6037928093L 066 DUCHESS (L.1820) Prospect CU, AG, AU, ZN, PB 093L06W 600149 6036668093L 067 COUNTESS (L.1826) Showing CU 093L06W 600139 6037132093L 068 TOM, CONTENTION Showing CU 093L06W 597610 6038344093L 069 STARR Showing CU, AG 093L05E 596803 6035668093L 185 GSC 1971-17 Showing CU 093L11W 605418 6045568093L 194 HOS Showing CU AG, AU 093L11W 603295 6049601
STARR CREEK
093L 241 MSJ Showing CU, MO 093L06W 604358 6031583093L 189 WOLVERINE, LG Showing CU 093L06W 597624 6029255093L 320 ANT 1, LEFTY Prospect CU, AG, ZN, AU 093L06W 599022 6028017
7
Barrett Lake
Driftw ood Creek
Houston
North Bulkley
Perow
Quick
Smithers
Telkw a
N
EL TOROPROJECT
FIGURE 3
10 kmACCESS MAP
93L/7
93L/1093L/593L/12
93L/6
93L/11
Hwy
16Telkwa
River
Go
ath
orn
Ck
Ho
wso
nC
ree
k
Hwy16
Th
au
til
gateR
ive
r
Creek
Ho
usto
nT
om
my
Hw
y16
Smithers
Burnie - SheaPark
BabinePark
MooseskinJohnny
Lake

8
5.0 ACCESSIBILITY, CLIMATE, LOCAL RESOURCES, INFRASTRUCTURE ANDPHYSIOGRAPHY
5.1 Access, Local Resources and Infrastructure (Figures 2 and 3)
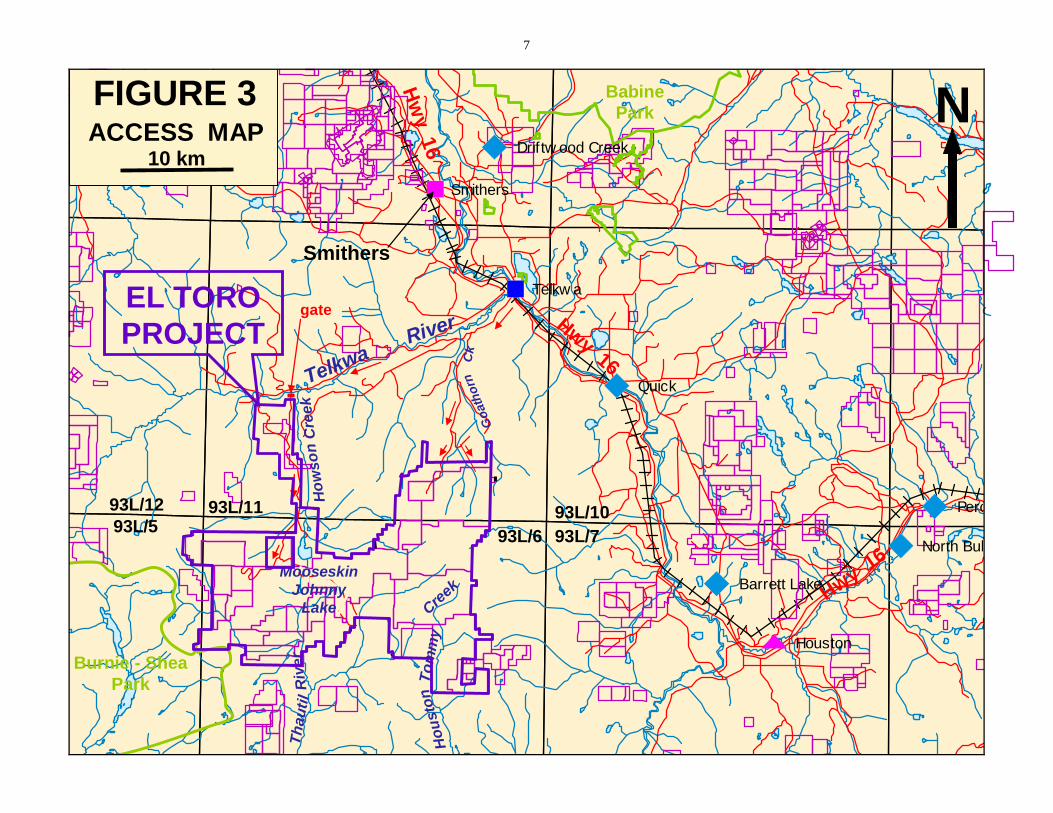
Access to the property from Telkwa is via the Coal Mine road, an all-weather gravel road,which initially follows the south side of the Telkwa River. To access the eastern propertyarea (Hunter and Hankin Basins) the road is followed for 7 km to Goathorn Creek, at whichpoint a logging road is taken to the south for 3 km to a junction where the right fork isfollowed, initially crossing Goathorn Creek (bridge currently out), for 11 km to a secondjunction. The right fork accesses Hunter Basin, and continues for another 4 km at whichpoint ATV access is recommended. The left fork, followed by a right fork, continues for 3.5km to an ATV trail, which accesses the Old Tom-Hankin showings.
The western property area is accessed by continuing along the Telkwa River for 18 kmpast Goathorn Creek (to km 25), crossing a bridge to the north side of the river at km 14.At this point a locked gate (key available from the Forest Service) accesses a loggingroad, which is followed for 7 km, past one junction on the left at km 6.5. At 7 km a secondroad to the left is followed for 4 km to the end, at which point an ATV trail is followed for 3km to a junction, then following the right branch for 6 km to the War Eagle area andanother 4 km to the closest access to the MSJ showing, and followed another 4.5 km tothe Princess. The ATV trail continues beyond this point to the west.
Upper Hankin Basin, Sunsets Basin, Dominion Basin, Tommy Houston Creek, Starr Creekand the Evening Creek portion of Howson Basin are best accessed by helicopter fromSmithers.
Power transmission lines follow the Telkwa River, approximately 10 km north of theproperty, and the Bulkley River, 10 km to the east. Smithers and Telkwa lie along theCanadian National Rail line linking Prince George with Prince Rupert with freight andpassenger service available at Smithers.
The town of Smithers, with a population of approximately 5,414, is the trading centre forthe entire Bulkley Valley with an area population of approximately 20,000. It lies alongHighway 16, part of the under-utilized Northwest transportation corridor, with PrinceGeorge located 370 km to the east and the port of Prince Rupert, 350 km to the west.Smithers has an airport with service to Vancouver and other communities within BritishColumbia. Facilities include a hospital, RCMP station, post office, government services,motels and hotels, grocery stores, service stations, restaurants, recreation facilities, acollege, freight and courier services, bus facilities and helicopter and fixed wing aircraftbases. Smithers has a strong mining oriented labour force.
The village of Telkwa, 11 km southeast of Smithers via Highway 16, is the closestcommunity to the property (Figure 3), and has a population of 1,426. Main industriesinclude forestry, agriculture, tourism, and mining. Facilities include accommodation(lodges and bed & breakfasts), a gas station/restaurant, recreation facilities, a smallmining oriented labour force and some local heavy equipment availability.

9
5.2 Physiography and Climate (Figures 2 and 3)
The El Toro Project lies within the Telkwa Range, situated at the south end of the BulkleyRanges of the Hazelton Mountains of west-central British Columbia (Figures 2 and 3).
The eastern and western portions of the property are rugged, separated by the broad andswampy Howson Creek drainage which flows northerly into the Telkwa River, which, inturn, flows easterly into the Bulkley River. Elevations range from approximately 670malong Howson Creek in the north-central property area to 2338m at the headwaters ofSunsets Creek. Vegetation primarily consists of large spruce forests, with some pine, andthickets of willow and alder which gives way to scrub balsam at subalpine elevations.Approximately one-third of the claim area lies above tree line, at approximately 1500m,with grassy highland plateaus and talus filled cirques.
Water is available year round from Howson Creek, its east and west flowing tributariesand easterly flowing tributaries of the Bulkley River, and in the south, the southerlyflowing Thautil River and its tributaries (see Figure 3). Although there does not appearto be any topographic or physiographic impediments, and suitable lands appear to beavailable for a potential mine, including mill, tailings storage, heap leach and wastedisposal sites, engineering studies have not been undertaken and there is no guaranteethat such areas will be available within the subject property.
The area has a moderate climate with temperatures ranging from -10.6 to 18ºC inTelkwa. Average annual rainfall is 287 mm, and median snowfall is 197 mm.Temperatures would be cooler at the higher elevations on the property. The explorationseason generally extends from mid June to mid September.
6.0 HISTORY
The El Toro Project covers 38 Minfile showings (Figure 2) as documented by the BritishColumbia Geological Survey Branch and summarized in Table 2 on page 6 (BritishColumbia Minfile, 2008). A summary of the work completed by various operators, asdocumented in assessment reports filed with the British Columbia Ministry of Energyand Mines and various reports by the British Columbia Geological Survey Branch or itspredecessors, is summarized below. The showings have been grouped by area due tothe abundance of showings and similar history for adjacent showings. Old workings areshown in Figures 6-15.
6.1 Hunter Basin (King, Rainbow, Idaho, Hunter, Colorado, Tribune, Hannah)
1903-04 Initial discovery by W. Hunter of King, Rainbow, Hunter, Idaho showings (BCDM,1904-05).
1909-15 Two tunnels were driven on the Colorado and at least one shaft on the Tribune priorto 1915 (Tompson, 1982). In 1914 38 tonnes of ore was shipped from the Coloradorecovering 155,515 g Ag and 2722 kg Cu (British Columbia Minfile, 2008). Several
10
open cuts and a 4.8m adit were cut on the Hunter in 1914 exposing high gradelenses, with 23 tonnes from the dump assaying 1.2% Cu, 2523 g/t Ag and 0.69 g/tAu (British Columbia Minfile, 2008) and a tunnel was driven on the Hannah, with nosignificant mineralization encountered (BCDM, 1915).
1914-41 Combined production from the King and Rainbow mines totaled 269 tonnes ofhand-sorted ore which produced 8160g Au, 283,366g Ag, and 42,710 kg copper(British Columbia Minfile, 2008).
1962 Canadian American Mining Co. Inc. shipped 24.5 tonnes of ore which produced373g Au, 11,539g Ag , and 1647 kg copper (BCDM, 1962).
1967 An induced polarization survey in Hunter Basin for Canadian American Mining Co.Inc. identified several conductors that could represent the extensions of knownmineralization and additional zones (Baird, 1967).
1982 The Colorado tunnel was re-opened by Lloyd Gething and a 020-030º/70Wº quartz-calcite-adularia vein zone was identified with tetrahedrite and electrum (Tompson,1982).
1988 Mapping and soil geochemistry on Colorado-Tribune by Atna Resources Ltd.delineating four north trending structures with anomalous copper and silver (Harivel,1988).
1989 Old workings in Hunter Basin were located and sampled by Van Alphen (Ethier,1989).
6.2 Hankin Basin (Old Tom, Hankin, Hope, Marmot, Lava, Loring, Crater)
1899-20 Discovery of copper mineralization in Hankin Basin followed by additionaldiscoveries in area and exploration by open cuts and adits (BCDM, 1900 and1915).
1968-69 Geochemical and magnetic and self potential geophysical surveys werecompleted on Loring Creek area by Falconbridge Nickel Mines with anomaliesdelineated (Brown, 1968 and Rutherford, 1981), which were followed up by210.6m of diamond drilling in four holes (BCDM, 1969).
1973-78 Geochemical and geophysical surveys by Maharaja Minerals, with diamonddrilling on the Old Tom showing in 1973 and 1978 (3 holes), and on the Marmotin 1975 and 1978 (Rutherford, 1981). The average assay from chip sampling a24.3m cliff section on the Marmot is 4.3% Cu and 109.71 g/t Ag (McAndrew et.al., 1973).
1980-83 Magnetic (50 km), short VLF-electromagnetic and geochemical soil surveys onCrater Lake – Marmot areas and a short induced polarization survey on theMarmot by Mecca Minerals. Known mineralized zones were detected andadditional anomalies delineated by the geophysical and soil surveys (Rutherford,1981 and 1983).
1991 Quartz-carbonate vein discovered by Skeena Resources Ltd. returned 39.6 g/tAu, 300 g/t Ag with 7.3% Pb and 8.4% Zn, 500m southwest of Loring showing(Jamieson, 1991a). Suggests potential for similar mineralization to FriendlyTrench at Deny North. Also Cu-AgAu skarn mineralization (5.5% Cu, 280 g/t Ag,0.75 g/t Au) discovered 1 km southwest of Loring, Cu-Zn mineralization 2 km

11
south of Loring (1.8% Cu, 10.3% Zn, 0.6 g/t Au) and significant CuAg at Loring(10.6% Cu, 350 g/t Ag) (Jamieson, 1991a).
6.3 Sunsets Basin (Fog, Fly)
1966-7 Copper - molybdenum stream sediment anomalies were delineated by NorandaMines Ltd. in southwest part of the Sunsets Pluton. Mapping, soil geochemistry,trenching and VLF-electromagnetic surveys indicated a typical "porphyry"environment with several possible conductors (Dirom, 1967).
1968 Soil geochemical (200 ft spacing on lines 400 ft apart) and horizontal loopelectromagnetic surveys with minor mapping, delineated a western copper(rimming Fly) and eastern copper - molybdenum (Fog) soil anomaly, the latterwith a weak conductive zone coincident with previous VLF anomalies. This wasfollowed by 152.4m of diamond drilling in 2 holes on the lower Fly by WhitesailMines Ltd. but results not reported (Woolverton, 1969).
1970 Diamond drilling of 478m in 3 holes (on the upper Fly) by Ducanex ResourcesLtd. under option from Whitesail Mines Ltd. but results not reported (Allen, 1981).
1980-81 Nine spot check grab samples by Canadian Nickel Company Limited for RedfernResources Ltd. yielded maximum results of 0.645% Mo with 0.08% Cu and0.25% Mo over 0.5m from the Fog, and 0.102% Mo and 0.11% Cu from the Flyphyllic alteration zones in 1980 (Kenyon, 1980). This was followed by mapping,rock and soil geochemistry to confirm previous data, and an evaluation of old drillcore stored on site (Allen, 1981).
1991 Significant copper in rock (up to 0.59% Cu) obtained in north to northeasternSunsets stock by Skeena Resources Ltd. (Jamieson, 1991a).
6.4 Dominion (Denys) Basin (Deny North, Deny South, Deny East, Sunset)
1989 Discovery with rumours of "oldtimers" packing out high-grade gold ore (Kikuchi,1985).
1912-14 Discovery of native silver from a narrow 035º/60ºSE quartz vein which wasexplored by a short adit (1,615m elevation) and several open cuts (Sunsetshowing) with values up to 18.8% Cu, 27.6 oz/t Ag and 0.03 oz/t Au on cliffs onsouth side of Sunsets Creek (BCDM, 1915).
1953 Geological survey by New Jersey Zinc Exploration Ltd. in Dominion Basin withtwo chip samples from Deny North assaying 1.6% Cu 13% Zn 7.2% Pb 117.0 g/tAg 3.0 g/t Au and 3.3% Cu 21% Zn 0.4% Pb 156.0 g/t Ag 0.3 g/t Au (Kikuchi,1985).
1968-69 Geological and geochemical surveys, 27.6m of pack-sack diamond drilling in 3holes on Deny North, intersecting minor copper-silver-zinc mineralization, anddiamond drilling of several holes northeast of Deny South with the last 5m of corein one hole assaying 2.72% Cu and 25 g/t Ag, all by Falconbridge Nickel MinesInc. (Kikuchi, 1985).
12
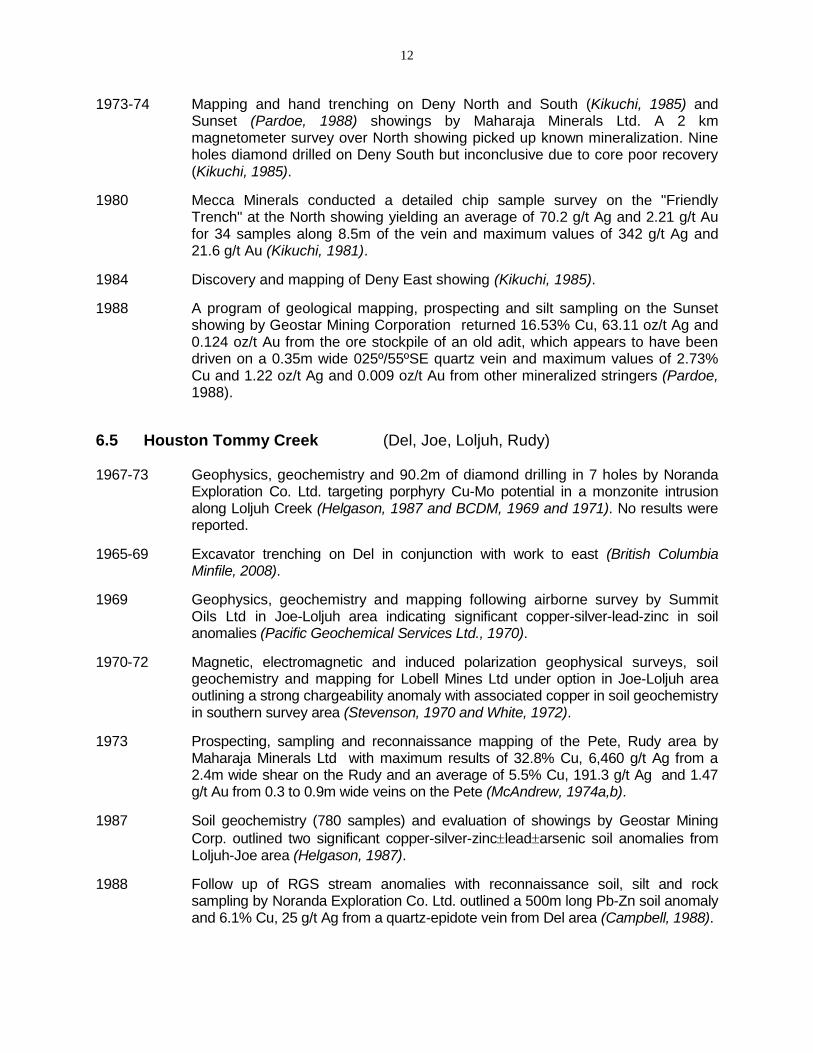
1973-74 Mapping and hand trenching on Deny North and South (Kikuchi, 1985) andSunset (Pardoe, 1988) showings by Maharaja Minerals Ltd. A 2 kmmagnetometer survey over North showing picked up known mineralization. Nineholes diamond drilled on Deny South but inconclusive due to core poor recovery(Kikuchi, 1985).
1980 Mecca Minerals conducted a detailed chip sample survey on the "FriendlyTrench" at the North showing yielding an average of 70.2 g/t Ag and 2.21 g/t Aufor 34 samples along 8.5m of the vein and maximum values of 342 g/t Ag and21.6 g/t Au (Kikuchi, 1981).
1984 Discovery and mapping of Deny East showing (Kikuchi, 1985).
1988 A program of geological mapping, prospecting and silt sampling on the Sunsetshowing by Geostar Mining Corporation returned 16.53% Cu, 63.11 oz/t Ag and0.124 oz/t Au from the ore stockpile of an old adit, which appears to have beendriven on a 0.35m wide 025º/55ºSE quartz vein and maximum values of 2.73%Cu and 1.22 oz/t Ag and 0.009 oz/t Au from other mineralized stringers (Pardoe,1988).
6.5 Houston Tommy Creek (Del, Joe, Loljuh, Rudy)
1967-73 Geophysics, geochemistry and 90.2m of diamond drilling in 7 holes by NorandaExploration Co. Ltd. targeting porphyry Cu-Mo potential in a monzonite intrusionalong Loljuh Creek (Helgason, 1987 and BCDM, 1969 and 1971). No results werereported.
1965-69 Excavator trenching on Del in conjunction with work to east (British ColumbiaMinfile, 2008).
1969 Geophysics, geochemistry and mapping following airborne survey by SummitOils Ltd in Joe-Loljuh area indicating significant copper-silver-lead-zinc in soilanomalies (Pacific Geochemical Services Ltd., 1970).
1970-72 Magnetic, electromagnetic and induced polarization geophysical surveys, soilgeochemistry and mapping for Lobell Mines Ltd under option in Joe-Loljuh areaoutlining a strong chargeability anomaly with associated copper in soil geochemistryin southern survey area (Stevenson, 1970 and White, 1972).
1973 Prospecting, sampling and reconnaissance mapping of the Pete, Rudy area byMaharaja Minerals Ltd with maximum results of 32.8% Cu, 6,460 g/t Ag from a2.4m wide shear on the Rudy and an average of 5.5% Cu, 191.3 g/t Ag and 1.47g/t Au from 0.3 to 0.9m wide veins on the Pete (McAndrew, 1974a,b).
1987 Soil geochemistry (780 samples) and evaluation of showings by Geostar MiningCorp. outlined two significant copper-silver-zincleadarsenic soil anomalies fromLoljuh-Joe area (Helgason, 1987).
1988 Follow up of RGS stream anomalies with reconnaissance soil, silt and rocksampling by Noranda Exploration Co. Ltd. outlined a 500m long Pb-Zn soil anomalyand 6.1% Cu, 25 g/t Ag from a quartz-epidote vein from Del area (Campbell, 1988).

13
6.6 Howson Basin (Duchess, Countess, Evening, Silver Heels, Starr, Tom,War Eagle, Princess, Hos, GSC 1971-17)
1905-1910 Exploration by open cuts, shafts, 2 adits on Duchess, 1 adit (21m) on Evening, andwork on War Eagle by Telkwa Mines Ltd. (Jamieson, 1991b and Cuttle, 1990).
1915-1917 Exploration by Jefferson-Dockrill Syndicate (Jamieson, 1991b and Cuttle, 1990).
1928-29 Extension of adits by Cominco on Duchess with only narrow zones of mineralizationfound (Jamieson, 1991b). A total of 1224m of underground workings is reported in 2adits with the upper adit encountering good mineralization averaging 4-5% Cu inthe first 27m after which the zone is cut off by faulting. Only narrow zones ofmineralization were encountered in the lower adit (Price, 1983).
1952 Hand trenching of Princess showing on rim of cirque by Kennecot (Preto, 1967).
1966-67 An airborne electromagnetic survey followed by induced polarization,electromagnetic and self potential geophysical surveys, a soil geochemicalsurvey, geological mapping, trenching and diamond drilling of 6 holes on theDuchess were completed by Norcan Mines Ltd. Coincident geophysical anomalieswere outlined in a drift covered area (Stevenson, 1970).
1968 Mapping, prospecting, sampling, geophysics and trench rehabilitation by Bethex onthe Duchess and Evening (Jamieson, 1991b). Bethex drill hole N-1 or Pathfinder?(Cuttle, 1990)
1966-70 A 2.5 km induced polarization survey, soil geochemical surveys, and in 1968 adeep drill hole, were completed by Pathfinder Resources Ltd. A broad east-westtrending magnetic anomaly and copper soil anomalies were outlined associatedwith a stock at the War Eagle pyrite zone and the drill hole intersected porphyrystyle alteration (Sharp, 1970).
1971 Limited trenching and soil geochemistry by Branta Explorations Ltd. on the Hosshowing area (Ashton, 1972).
1969-73 Access trail construction, minor trenching, followed by mapping and sampling byMaharaja Minerals Ltd. in 1973 on the Tom showing. Two vein/shear zones arereported with maximum values of 16.9% Cu and 6.58 oz/t Ag (Cullen and Biss,1974).
1983 Minor sampling and VLF-electromagnetic geophysics by Joyce Warren returning7% Cu and 5.74 oz/t Ag on the Duchess (Jamieson, 1991b).
1991 Minor sampling and examination of Duchess and Evening adits by SkeenaResources Ltd. with the best sample returning 9% Cu and 88 g/t Ag over 1m on theDuchess and 1.9% Cu from the Evening (Jamieson, 1991b).
6.7 Starr Creek (MSJ, Ant, Wolverine)
6.7.1 MSJ
1974 A 20 km induced polarization survey (with 1,000 ft line spacings by Hudson's BayOil and Gas Co. Ltd delineated a 5,000 by 10,000 ft chargeability high, associated

14
with phyllic alteration in a quartz monzonite intrusion in Trail Creek (MSJ showing)and surrounding overburden covered terrain (Homeniuk, 1974).
1989 A geochemical evaluation by Placer Dome Inc. on the MSJ showing for A. Schmidt,found anomalous copper and gold in rock, silt and bulk silt samples (Schmidt,1989).
1991 Grid soil samples (201 samples) were collected at 100m intervals on 200-400mspaced lines was undertaken over the 1974 chargeability high by Cominco underoption. Higher values were found, especially for zinc, over the western portion ofthe area (Pauwels, 1991).
6.7.2 Ant, Wolverine
1971 Geological and soil geochemical (339 samples) surveys and 130m of trenching byGranby Mining Co. Ltd. on the Wolverine showing, delineating breccia veins withchalcopyrite (BCDM, 1971).
1987 Prospecting, mapping, magnetometer and VLF-electromagnetic surveys, andexcavator trenching by Atna Resources Ltd. on Ant showing with discovery of a 3by 0.6 km epithermal system with values up to 4.1 g/t Au across 0.6m on Lefty 1(Hanson, 1991).
1990 Mapping and soil geochemical and induced polarization surveys by AtnaResources Ltd. resulted in discovery of an 800m long shear zone with associatedcopper-silver-gold mineralization on Ant 1, which was followed by 1100m ofdiamond drilling in 7 holes. The drill program intersected a phyllic altered zonerelated to a major northeast trending shear zone with minor chalcopyrite, sphaleriteand tetrahedrite (Hanson, 1991).
In 1967 Pyramid Mining Co. Ltd. completed Turam electromagnetic and magnetic surveyson a number of claims within the El Toro Project area, including the Phil, John and Daveclaims south of Starr Creek (Mo-05, -06 claims), the Al claims near the outlet of GlacisCreek, on the Mike claims at the headwaters of Glacis and Sunsets Creeks and alongSunset Ridge to the south to delineate drill targets (Baird, 1968). In 1969 one hole wasdiamond drilled on the Phil 6 claim, one on the Al 4 claim, one on the Mike 44 claim (westof Fly) and some holes on the Mike 3, 11, and 12 claims (above Sunset Adit). Results ofthis program (BCDM, 1969) could not be located.
The El Toro Project was acquired by Lions Gate Energy Inc. in 2007, which has completedprograms from 2007 to 2014 of airborne magnetic and electromagnetic geophysicalsurveys, limited ground magnetic, induced polarization, resistivity, self potential and VLF-EM geophysical surveys, mapping, prospecting, rock and soil geochemical sampling, MMIsoil and biogeochemical surveys, GPS surveying of old workings and drill hole collars andLiDAR.
In 2007 Lions Gate Energy Inc. undertook a 629 line km airborne magnetic andelectromagnetic Aerotem 2 geophysical survey over the Sunset stock with 100m linespacing on north-south lines, delineating a strong magnetic low in the southern stock area.A reconnaissance evaluation of some of the showings on the El Toro Project was initiatedwith significant molybdenum obtained from the Fly showing within the Sunsets stock.

15
The 2008 and 2009 programs by Lions Gate Energy Inc. involved mapping, prospecting,rock and soil geochemical sampling, including an MMI soil geochemical survey over theMSJ porphyry target, GPS surveying of old workings and drill hole collars, and a 1495 linekm airborne magnetic and electromagnetic geophysical survey in 2 blocks resulting in thecoverage of approximately 50% of the property. The program identified potential forsignificant gold bearing quartz sulphide vein type mineralization in southern Hunter Basin,Dominion (Denys) Basin and along the 5 km long Princess-Duchess-Countess-SilverHeels structure. Possible bulk tonnage and local high grade copper-silver-gold potentialwith significant similarities to the past producing Equity Silver mine exists in Hankin BasinThe airborne survey delineated additional electromagnetic anomalies in Hunter Basin,Hankin Basin, Denys Creek area and peripheral to the MSJ stock. A 2 km diametermagnetic low in the Starr Creek area was identified which may reflect an altered intrusion.
Four stocks of the Bulkley plutonic suite with calc-alkaline porphyrycoppermolybdenumgold(silver) potential were identified, the Sunsets, the MSJ, theWar Eagle stock and the Loljuh stocks. The Huckleberry Mine, 70 km south of the ElToro Project, is an example of this deposit type and is associated with a stock of theLate Cretaceous Bulkley plutonic suite. Potential for epithermal style mineralization wasrecognized in the southwest project area.
In 2011 magnetic and VLF-EM geophysical surveys (7.325 line km) and tree barksampling grids (200 samples) in the War Eagle area and in the central property areabetween Sunsets and Denys Creek were carried out. A copper-molybdenum tree barkanomaly was identified in the western War Eagle grid area (Mark, 2012). The 2013program consisted of biogeochemical sampling with 287 samples primarily of whitespruce, MMI soil geochemical sampling with 169 samples from three grid areas and onetest line, an 800m long line of self potential geophysics, and a LiDAR survey (Justasonand Mark, 2014). Exploration in 2014 consisted of induced polarization and resistivitysurveys in the Howson area.
7.0 GEOLOGICAL SETTING
7.1 Regional Geology (Figure 4)
The El Toro Project is underlain by arc volcanic rocks of the Upper Paleozoic to MiddleMesozoic Stikine Terrane, allochthonous rocks accreted to North America in theJurassic. The Stikine Terrane is intruded by post-accretionary stocks and plutons ofJurassic to Tertiary age and overlain by overlap assemblages of the Bowser Basin inthe north and the Nechako Basin in the south. The following discussion of the regionalgeology is based on mapping by the British Columbia Geological Survey shown onFigure 4 and available at http://www.em.gov.bc.ca/Mining/Geolsurv/MapPlace.
Within the regional map area (93L and north 93E) the Stikine Terrane consists of theLower Jurassic Hazelton Group, predominantly calc-alkaline volcanic rocks of the LowerJurassic Telkwa Formation (lJHT) with minor volcaniclastic rocks of the Eagle Peak

16
Formation (lJHE). Subaerial andesitic to dacitic crystal and lithic tuffs predominate overrhyolitic flows, breccia and vesicular basalt. The Hazelton Group is underlain byintermediate to mafic marine volcanic and sedimentary rocks of the Upper TriassicTakla Group (uTrTv), the oldest rocks in the region, which are exposed in thenortheastern map area around Babine Lake.
The Stikine Terrane is overlain by marine shale, greywacke, breccia, tuff andconglomerate of the Middle Jurassic Smithers (MJHSms) and Ashman Formations(uJBAms), and by coarse clastic rocks of the Upper Cretaceous Skeena Group (LKS),primarily the Red Rose Formation, which consists of shale, greywacke, conglomerateand coal (LKSRs).
The above lithologies are cut by intrusions of three main plutonic suites. The oldest arethe Topley plutonic suite, of primarily Early Jurassic age consisting of quartz monzoniteand granodiorite stocks (EJTpgd) arrayed in a northeast trending belt in the easternregional map area. Small equant stocks and bosses of the Late Cretaceous BulkleyIntrusions (lKBg), composed of quartz monzonite, granodiorite and quartz diorite(lKBqd), occur in a northwest trending belt that extends from the Huckleberry Mine areathrough the El Toro Project area and into the north Smithers area. The youngest andmost abundant intrusions are small stocks and bosses of the Eocene Nanika Intrusions,consisting of quartz monzonite, granodiorite and quartz diorite compositions that form awide northwest trending belt across the Smithers map area (93L), coincident with that ofthe Bulkley Suite.
Early Tertiary sedimentary rocks (Ts) are exposed near the perimeter of the Bowserand Nechako Basins. Eocene basalts (EEBvb) extensively overlie much of thesoutheastern map area, within the Nechako Basin, with felsic volcanic rocks (EO)dominating generally south of Francois Lake.
Extensional basin and range type block faulting characterizes the area. Morepenetrative north-northwest and north trending faults are evident with less continuouseast-northeast trending faults.
Economically, the Huckleberry coppermolybdenumgold porphyry Mine, 70 km southof the El Toro Project, is associated with a stock of the Late Cretaceous Bulkley plutonicsuite, with mineralization occurring within both the stock and the hornfelsed TelkwaFormation volcanic rocks of the Hazelton Group, both of which underlie the El ToroProject. Huckleberry opened in 1997 with a mineable reserve of 90 million tonnes of0.51% Cu, 0.062 g/t Au and 2.8 g/t Ag. The Granisle and Bell coppermolybdenum pastproducing mines in the Babine Lake area are hosted by Eocene Babine intrusions ofquartz diorite and biotite feldspar porphyry compositions.
The Equity Silver past producing mine, 60 km southeast of El Toro, is a subvolcanicsilver-gold-copper or transitional type deposit which has similar characteristics tomineralization observed on the El Toro Project. Equity Silver produced 33.8 milliontonnes of 0.4% copper, 64.9 g/t Ag, and 0.46 g/t Au. Characteristics of this deposit typewill be discussed under section 8.0, “Deposit Types”.

17
FIGURE 4
25 km
REGIONAL GEOLOGY
lJHT
lJHT
uT
rTv
eJT
pg
d
ENg
lKBg
lKB
fp
lKS
lKSRs
Ts
Eocene Basalts(EEBvb)
Babine
Hwy
16
Park
SMITHERS
HOUSTON
EE
Bvb
lJHE
lJHT
uTrT
v
EEBvb
LTrgd
EKMqm
lKS
MJHSms
lKSRs
uKK
Mine or major pastproducer
uKK
MJTqd
ENg
lKBg
Babine
ENg
Ts
lKBqd
eJTpgd
lJHT uKK
lJHT
MJHSms
lKBg
lJHT
uKK
lKBg
lKS
N
EG
Bur
nie-
She
a
Par
k
EL TOROPROJECT
lJHE
lKB
qd
FrancoisLake
JqmL
TrJ
Tp
gd
ZYMO
lKBg
see text for Legend
18
lJHT
lJHT
lJHT
lJHT
lJHE
lJHT
lJHT
lJHT
lJHT
LKBg
lKSKC
MJqplJHT
LKBg
lJHT
lKSKC
lJHTlJHT
LKBg
lJHT
lJHT
LKBglJHElJHE
lJHE
LKBg
lJHT
lJHT
LKBgmJHSms
lJHT
lJHE
lJHT
lJHELKBg
uJBAm
lJHE lJHNk
lJHT
LKBg
LKBg
lJHE
LKBg
lJHT
lJHT
LKBfp
lJHTlJHT
LKBg
lJHT
lJHE
lJHT
lJHT
lJHT
LKBg
lJHT
LKBfp
LKBg lJHNk
lJHE
lJHT
LKBdrlJHT
EKMqm
lJHT
lJHT
lJHE
lJHT
lJHE
lJHT
lJHT
lJHT
lJHT
lJHNk
lJHT
LKBg
lKS
lJHT EEBvb
EKMqm
LKBqd
lJHE
lJHTLKBqdlJHNk
lJHNk
lJHNk
lJHT
lJHTlJHT
LKBqp
lJHT lJHTlJHT
LKBg
lJHT lJHTEKMdrLJdr lJHNkLKBqd
NFIGURE 5
5 km
lKBg
PROPERTY GEOLOGY
MooseskinJohnny
Lake
lKBg
lKBg
lKBg
LJdr
lKJHNk
property boundary
Cre
ek
How
son
Starr
Den
ys
Sunsets
Creek
Creek
Creek
Glacis
Creek
Ho
usto
nT
om
my
Creek
Th
au
til
River
Go
ath
orn
CkEL TORO PROJECT
lJHT
lKBg
33
3637
34
45 46
304 47
5049
241
320
228
227
61
62
68
646667
65
80
43
4139
3840
69
42 "255
4435
lJHT
5000’4000’
4000’
6000’
lKBg
168
166
War EagleStock
MSJStock
Sunsets
Stock
LoljuhStock
93L/6
93L/1193L/5
93L
/12
93L/6
93L/11
185
Faults as purple and blue linesMinfile numbers in white
Significant rhyolite
194
189
299

19
7.2 Property Geology (Figure 5)
The El Toro Project is primarily underlain by the Telkwa Formation (lJHT) of thesubaerial to locally submarine Lower Jurassic Hazelton Group, dominated by beddedmaroon and green subaerial andesitic to dacitic crystal and lithic tuffs and lesserbreccia, with minor flow interbeds including vesicular basalt. Rhyolitic flows and tuffsoccur in the southwest property area (Ant-Wolverine showings) and in the southeast atthe Del and Rudy showings. Minor volcaniclastic rocks of the Eagle Peak Formation(lJHE), which overlies the Telkwa Formation, locally underlie part of Hunter Basin in thenortheast property area, along southern Starr Creek and just east of its junction with theThautil River in the southwest property area and just north of the Loljuh showing, southof the bend in Denys Creek. (Refer to Figure 5.)
Thin beds of fine clastic sedimentary rocks of the Lower Cretaceous to JurassicHazelton Group Nitwitka Formation (lKJHNk) are exposed in the eastern property area,primarily in the southeast. A small exposure of the Nitwitka Formation and coarse clasticrocks of the Late Cretaceous Skeena Group (LKS) underlies the south-central propertyarea.
Small bosses, stocks and related dykes and sills of the Late Cretaceous Bulkleyplutonic suite, primarily of quartz monzonite, monzonite and granodiorite compositionsintrude the Hazelton Group across the El Toro Project. The best exposed stock, locatedabove tree line in Sunsets Basin and referred to as the Sunsets stock, is approximately2 by 3 km in size and has been radiometrically dated at 70 Ma (Carter, 1974). Twodistinct phases of the Sunsets stock have been recognized and mapped, grey quartzmonzonite porphyry with feldspar and quartz phenocrysts in a fine grained potassiumfeldspar rich matrix and a later coarser grained porphyritic quartz monzonite (Allen,1981). The stock has domed the surrounding pyroclastic sequence, which dips awayfrom the stock in all directions (Sutherland Brown, 1967). A hornfels zone up to 300mwide surrounds the Sunsets stock, (Allen, 1981).
An incompletely exposed Bulkley quartz monzonite stock, possibly similar in size to theSunsets stock, is exposed in the Starr Creek area which will be referred to as the MSJstock. A poorly exposed quartz monzonite to granodiorite stock of the Bulkley plutonicsuite, possibly of similar size, is exposed in the Houston Tommy Creek area near LoljuhCreek and will be informally referred to as the Loljuh stock. A smaller, 1km diameterBulkley feldspar porphyry stock is exposed at the War Eagle Pyrite zone, which will bereferred to as the War Eagle stock. A 0.5 by 1 km subvolcanic monzonite stock (relatedto felsic volcanism in the area) has been mapped proximal to the Ant and Wolverineshowings. A buried intrusion is suggested by alteration and dykes below Joker Ridge inthe Howson Basin area.
A Bulkley quartz porphyry stock is mapped to the west of the Del showing. An EarlyCretaceous aged quartz monzonite pluton (eKMqm), of the McCauley Island plutonicsuite, lies just east of the southeastern property area. A number of small dioriteintrusions have been identified in the property area, which may represent subvolcanicintrusions associated with the Telkwa Formation volcanic rocks.

20
Abundant dykes primarily associated with the Bulkley plutonic suite, includinggranodiorite, quartz diorite, feldspar porphyry and quartz-feldspar porphyrycompositions, intrude the Hazelton Group throughout the property.
Eocene basalts of the Buck Creek Formation of the Endako Group (EEBvb) overlie theabove lithologies in the southern property area, just west of the Thautil River and occuras dykes throughout the property area.
A prominent north trending fault trends through the Mooseskin Johnny Valley. Twothrough-going north-northeast trending faults bisect the central property area, one ofwhich extends through Hunter Basin. Extensional basin and range type block faulting,which characterizes the regional area, is evident across the property.
7.3 Mineralization (Figures 2, 5 and 6-15)
The El Toro Project covers a well-mineralized area southwest of Telkwa that includes38 Minfile occurrences, including 3 past producers, 1 developed prospect, 6 prospectsand 28 showings, as documented by the British Columbia Geological Survey Branch(Minfile, 2008.) (Refer to Figure 2 and Table 2 on pages 5 and 6.) The occurrences aregrouped into seven distinct areas due to the abundance of showings and, generally,similarities in mineralization for adjacent showings. Significant results are shown onFigures 6-15.
7.3.1 Hunter Basin (King, Rainbow, Idaho, Hunter, Colorado, Tribune, Hannah)(Figure 6)
The Hunter Basin occurrences consist of fissure veins, fracture fillings anddisseminations, primarily hosted by andesitic pyroclastic rocks, interbedded flows andepiclastic rocks. Vein mineralogy consists of bornite, chalcopyrite, tetrahedrite,chalcocite, specularite, lesser pyrite, pyrrhotite, galena and magnetite in quartz withlesser calcite gangue. Veins primarily trend northeast to easterly, dipping steeplysoutheast and commonly follow dyke, fracture and shear zones in the volcanic hostrocks, accompanied by an alteration assemblage that includes intense silicification,calcite, epidote and sericite. The north side of Hunter Basin shows lower gold values buthigh silver, associated with freibergite (a silver rich variety of tetrahedrite).Mineralization consists of chalcocite, tetrahedrite with lesser chalcopyrite, as opposed topyrite, bornite, chalcopyrite and magnetite on the south side of the basin.
Electrum has been noted at the Colorado vein which trends 022º/75ºNW. The Tribuneappears to cover the northeasterly strike extension of the Colorado, 450m along trend.The King, Rainbow and Colorado were small past producing mines, operating primarilybetween 1914 and 1941. Combined production from the King and Rainbow minesbetween 1914 and 1962 totaled 293.5 tonnes producing 8,533g Au, 294,905g Ag, and44,357 kg copper. In 1914 38 tonnes of ore was shipped from the Colorado minerecovering 155,515 g Ag and 2722 kg Cu. The King covers a 070º/90º trending fissurevein that was previously traced for 150m. The West showing, approximately 150m alongstrike to the west, may represent the strike extension of the King. Approximately 600malong strike to the east of the King shaft, a gossan occurs in a cliff face, which could
21
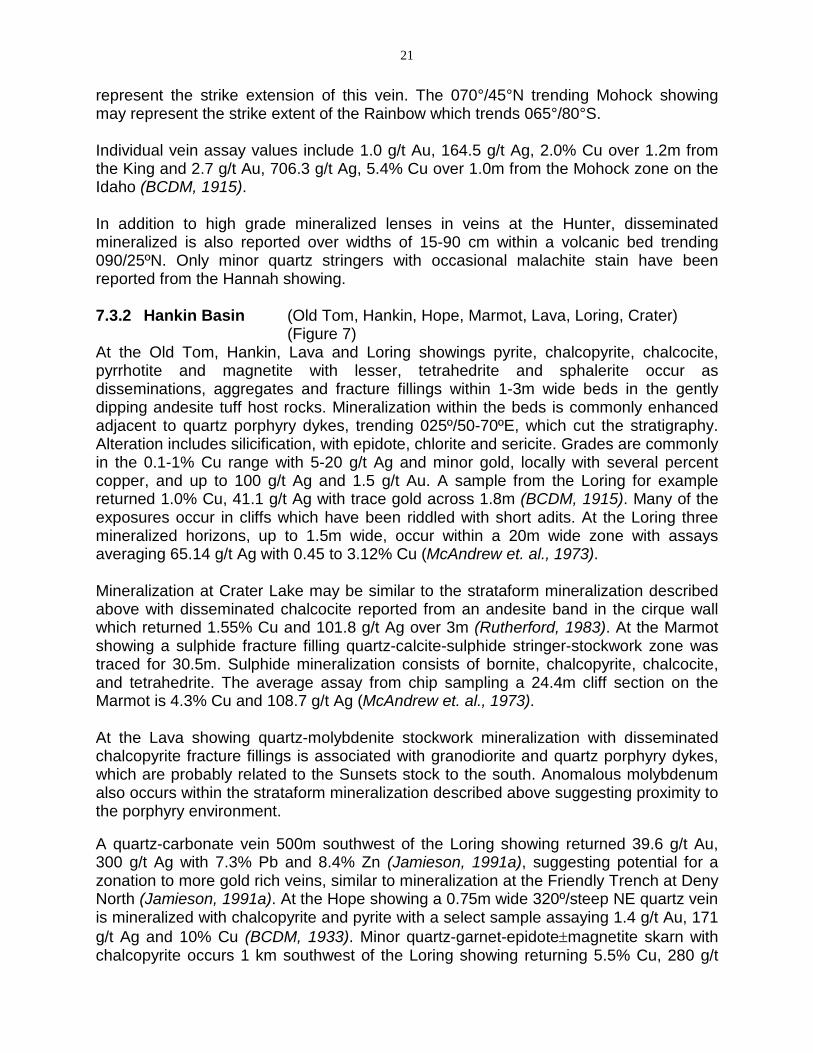
represent the strike extension of this vein. The 070°/45°N trending Mohock showingmay represent the strike extent of the Rainbow which trends 065°/80°S.
Individual vein assay values include 1.0 g/t Au, 164.5 g/t Ag, 2.0% Cu over 1.2m fromthe King and 2.7 g/t Au, 706.3 g/t Ag, 5.4% Cu over 1.0m from the Mohock zone on theIdaho (BCDM, 1915).
In addition to high grade mineralized lenses in veins at the Hunter, disseminatedmineralized is also reported over widths of 15-90 cm within a volcanic bed trending090/25ºN. Only minor quartz stringers with occasional malachite stain have beenreported from the Hannah showing.
7.3.2 Hankin Basin (Old Tom, Hankin, Hope, Marmot, Lava, Loring, Crater)(Figure 7)
At the Old Tom, Hankin, Lava and Loring showings pyrite, chalcopyrite, chalcocite,pyrrhotite and magnetite with lesser, tetrahedrite and sphalerite occur asdisseminations, aggregates and fracture fillings within 1-3m wide beds in the gentlydipping andesite tuff host rocks. Mineralization within the beds is commonly enhancedadjacent to quartz porphyry dykes, trending 025º/50-70ºE, which cut the stratigraphy.Alteration includes silicification, with epidote, chlorite and sericite. Grades are commonlyin the 0.1-1% Cu range with 5-20 g/t Ag and minor gold, locally with several percentcopper, and up to 100 g/t Ag and 1.5 g/t Au. A sample from the Loring for examplereturned 1.0% Cu, 41.1 g/t Ag with trace gold across 1.8m (BCDM, 1915). Many of theexposures occur in cliffs which have been riddled with short adits. At the Loring threemineralized horizons, up to 1.5m wide, occur within a 20m wide zone with assaysaveraging 65.14 g/t Ag with 0.45 to 3.12% Cu (McAndrew et. al., 1973).
Mineralization at Crater Lake may be similar to the strataform mineralization describedabove with disseminated chalcocite reported from an andesite band in the cirque wallwhich returned 1.55% Cu and 101.8 g/t Ag over 3m (Rutherford, 1983). At the Marmotshowing a sulphide fracture filling quartz-calcite-sulphide stringer-stockwork zone wastraced for 30.5m. Sulphide mineralization consists of bornite, chalcopyrite, chalcocite,and tetrahedrite. The average assay from chip sampling a 24.4m cliff section on theMarmot is 4.3% Cu and 108.7 g/t Ag (McAndrew et. al., 1973).
At the Lava showing quartz-molybdenite stockwork mineralization with disseminatedchalcopyrite fracture fillings is associated with granodiorite and quartz porphyry dykes,which are probably related to the Sunsets stock to the south. Anomalous molybdenumalso occurs within the strataform mineralization described above suggesting proximity tothe porphyry environment.
A quartz-carbonate vein 500m southwest of the Loring showing returned 39.6 g/t Au,300 g/t Ag with 7.3% Pb and 8.4% Zn (Jamieson, 1991a), suggesting potential for azonation to more gold rich veins, similar to mineralization at the Friendly Trench at DenyNorth (Jamieson, 1991a). At the Hope showing a 0.75m wide 320º/steep NE quartz veinis mineralized with chalcopyrite and pyrite with a select sample assaying 1.4 g/t Au, 171g/t Ag and 10% Cu (BCDM, 1933). Minor quartz-garnet-epidotemagnetite skarn withchalcopyrite occurs 1 km southwest of the Loring showing returning 5.5% Cu, 280 g/t

22
Ag, 0.75 g/t Au, and 2 km south of the Loring mineralization carrying up to 1.8% Cu,10.3% Zn, 0.6 g/t Au was reported (Jamieson, 1991a).
7.3.3 Sunsets Basin (Fog, Fly) (Figure 8)
The Fog and Fly prospects are hosted by two quartz-sericite-pyrite (phyllic altered)zones within the southern part of the Sunsets stock, a Bulkley intrusion immediatelysouth of Hunter Basin in the northeastern project area. Quartz-pyritemolybdenitechalcopyrite veins 2 to 5 cm wide and trending predominantly northeasterly anddipping southeast are associated with the alteration zones (Allen, 1981). Potassicalteration, suggested by pink feldspar alteration envelopes along fractures and quartzveins, is reported at a lower vertical level beneath the phyllic zones.
Vein abundance in general is sparse but the western alteration zone (Fly), measuring300-600m by 1000m, contains between 10 and 25 veins per metre and is flanked by acopper in soil anomaly. Maximum results of 0.102% Mo and 0.11% Cu were reported in1980 (Kenyon, 1980).
The eastern phyllic zone (Fog) is 300m in diameter and lies near the eastern edge of alarger copper-molybdenum soil anomaly (maximum 1900 ppm Cu and 125 ppm Mo) atthe contact between two phases of the stock. A 0.5m channel sample assayed 0.252 %Mo and 0.01 % Cu with maximum results of 0.645% Mo with 0.08% Cu (Kenyon, 1980).
Significant copper in rock anomalies (up to 0.59% Cu) were subsequently obtained inthe north to northeastern Sunsets stock by Skeena Resources Ltd. (Jamieson, 1991a).
7.3.4 Dominion (Denys) Basin (Deny North, Deny South, Deny East, Sunset)(Figure 9)
The Sunset showing covers a zone of narrow quartz veins and stringers mineralizedwith malachite, azurite, tetrahedrite, bornite, chalcopyrite pyrite, native copper andpossible native silver. The largest vein, explored by an adit in cliffs on the south side ofSunsets Creek is 0.35m wide and trends 030º/60ºSE with values up to 18.8% Cu, 946g/t Ag and 1.03 g/t Au (BCDM, 1915, Pardoe, 1988).
At the Friendly Trench on the Deny North showing a 1m wide north trending, 35ºWdipping quartz-carbonate-sulphide vein is exposed which yielded an average of 70.2 g/tAg and 2.21 g/t Au for 34 samples along 8.5m of the vein with maximum values of 342g/t Ag and 21.6 g/t Au (Kikuchi, 1981). Sulphide minerals include chalcopyrite, pyrite,sphalerite, galena and bornite. Quartz-diopside-epidote-magnetite garnet skarn withminor chalcopyrite and sphalerite mineralization is exposed above the vein.
Mineralization at Deny South is reported as disseminations and predominantlynorthwest trending, steep northeast dipping fracture fillings of chalcopyrite, chalcocite,bornite and specularite hosted by a basalt flow.
The Deny East showing is reported to consist of a 320º trending quartz vein zone tracedfor 70m with malachite staining and limonite boxworks within a 20m wide contact zonebetween andesite and pink basalt (Kikuchi, 1985). No assay values were reported.

23
7.3.5 Houston Tommy Creek (Del, Joe, Loljuh, Rudy) (Figure 10)
On Loljuh Creek chalcopyrite, bornite and molybdenite occur as disseminations ingranodiorite and volcanic rocks of the Telkwa Formation (BCDM, 1971). At the Loljuhshowing, minor galena, sphalerite and chalcopyrite occur in quartz-siderite veins cuttingandesite proximal to a carbonate unit within the sedimentary sequence.
Chalcopyrite, sphalerite, pyrite, pyrrhotite, bornite, galena, magnetite, chalcocite andmolybdenite occur as north to northeast trending fracture fillings and quartz veins at theJoe, Pete and Rudy showings, generally hosted by andesitic volcanic rocks. At the Peteshowing the veins are hosted by a northerly trending feldspar porphyry dyke, possiblyrelated to the Loljuh stock. Disseminated pyrite, chalcopyrite and minor molybdeniteoccur within the Loljuh stock in a porphyry style environment.
Mineralization at the Del showing consists of disseminated chalcopyrite, pyrite, bornite,malachite and azurite, primarily in northerly trending quartz-epidote veins (a grabsample reported from one returned 6.1% Cu, 25 g/t Ag – Campbell, 1988), but also inandesite, quartz diorite and rhyolitic host rocks.
7.3.6 Howson Basin (Duchess, Countess, Evening, Silver Heels, Starr, Tom, WarEagle, Princess, Hos, GSC 1971-17) (Figures 11-13)
The main vein type occurrence in this area is the Duchess prospect which covers anortherly trending (170º/80ºE) shear hosted quartz-sulphide vein with chalcopyrite,pyrite, tetrahedrite, and minor sphalerite and galena, at the contact between an andesiteflow and tuff unit. Good mineralization averaging 4-5% Cu in the first 27.5m is reportedwith mineralization occurring over widths up to 3.7m after which the zone is cut off byfaulting. More recent sampling from the Duchess returned 9% Cu and 88 g/t Ag over 1m(Jamieson, 1991b). The Countess, 400 m north of the Duchess covers its northern strikeextension.
The Duchess and Countess appear to be localized by a 170º/70ºW trending fault whichhas been traced 2.8 km to the south to the Princess where minor mineralization isexposed over a width of 60m, and 1.4 km north of the Duchess to the Silver Heels. At theSilver Heels showing mineralization, which assayed 34.3 g/t Ag and 2.3% Cu over 3.6m, isassociated with a north/80ºE trending dyke (BCDM, 1917).
The Princess, Evening, Tom and main War Eagle showings cover minor, irregular smallquartz-sulphide and sulphide vein and shear occurrences, with minor associatednortherly trending disseminated mineralization also noted at the Evening, Silver Heelsand War Eagle. Mineralization at the Evening generally trends northeast to east, dippingmoderately north. Mineralization on the Tom trends northerly, dipping 40-80ºE, isexposed over a 500m area, is commonly associated with dykes and locally containsmaximum values of 16.9% Cu and 6.58 oz/t Ag (Cullen and Biss, 1974).
Minor quartz-garnet-epidotemagnetite skarn with chalcopyrite and sphalerite occursjust west of the Duchess vein, and at the Tom and Princess showings.

24
The War Eagle Pyrite zone, 800m southeast of the main War Eagle showing, consists ofa 15-25m wide iron oxide zone coincident with an induced polarization anomaly andassociated with a 305º trending shear zone mineralized with pyrite and minorchalcopyrite with quartz stockworks, stringers and local breccias evident (Sharp, 1970).The zone occurs within a felsic feldspar porphyry plug, 500m by 700m in size withcopper soil anomalies. A drill hole in the southern part of the stock intersected porphyrystyle alteration and significant gold results (24.0 and 9.43 g/t Au, each over 3.05m) butno significant copper mineralization. Joker Ridge, 5 km northwest of the War Eagle,consists of an extensive iron oxide-pyrite-silica zone that lies along the samenorthwesterly trending structure identified at the War Eagle Pyrite zone and maysuggest proximity to porphyry or subvolcanic type mineralization.
The Starr showing covers minor disseminated chalcopyrite, bornite, tetrahedrite, pyrite,sphalerite and galena mineralization as disseminations in a granitic intrusion and asfracture fillings within the adjacent contact zone with intermediate volcanic rocks.
At the Hos showing chalcocite and bornite, with malachite, occur as disseminations andfracture fillings in felsite dykes proximal to pyritized zones in andesite. Just to the southchalcopyrite occurs in andesitic rocks proximal to felsic dykes at the GSC 1971-17showing. The mineralization has similarities to those in Hankin Basin.
7.3.7 Starr Creek (MSJ, Ant, Wolverine) (Figures 13-15)
The MSJ porphyry copper-gold-molybdenum(-silver) showing covers a roughlyconcentric zone of propylitic, argillic and phyllic alteration within a quartz monzonitestock (Preto, 1967), possibly 2 by 3 km in size. The intense quartz-sericite-pyrite(phyllic) alteration forms a prominent gossan along Trail Creek which flows easterly intothe Thautil River. A 1 by 2 km chargeability high anomaly occurs within the stockcoincident with a copper, gold, molybdenum ±silver MMI soil geochemical signature(Pautler, 2009c) Quartz feldspar porphyry dykes occur along the western margin of thestock, associated with pyrite-chalcopyrite mineralization in propylitically altered volcanictuffs (Pauwels, 1991). Mineralization of this type occurs along Lone Chasm Creek(Pautler, 2009a). Minor quartz-molybdenite veinlets are reported, associated with argillicalteration in the western stock area (Pauwels, 1991). A large hornfels alteration zoneoccurs within epiclastic rocks along lower Starr Creek, which may be related toproximity to the MSJ stock (Pautler, 2009a).
West of Starr Creek, in the southwest El Toro Project area, epithermal stylemineralization occurs within Telkwa Formation rhyolite flows, pyroclastics andandesites. At the Ant prospect a phyllic altered 800m long northeast trending shearzone with minor disseminated chalcopyrite, sphalerite and tetrahedrite was delineated(Hanson, 1991). Approximately 1.5 km to the west a 3 by 0.6 km epithermal system wasoutlined (Lefty showing) with values up to 4.1 g/t Au across 0.6m. Mineralization occursas 020-060º trending quartz veins, stockwork and breccia zones with minor pyrite,chalcopyrite and sphalerite, locally with more massive pyrite and chalcopyrite zones(Hanson, 1990). The Wolverine showing consists of chalcopyrite bearing breccia veinshosted by Telkwa Formation volcanic rocks and dykes (BCDM, 1971) and mayrepresent the northeast strike extension of the Lefty.
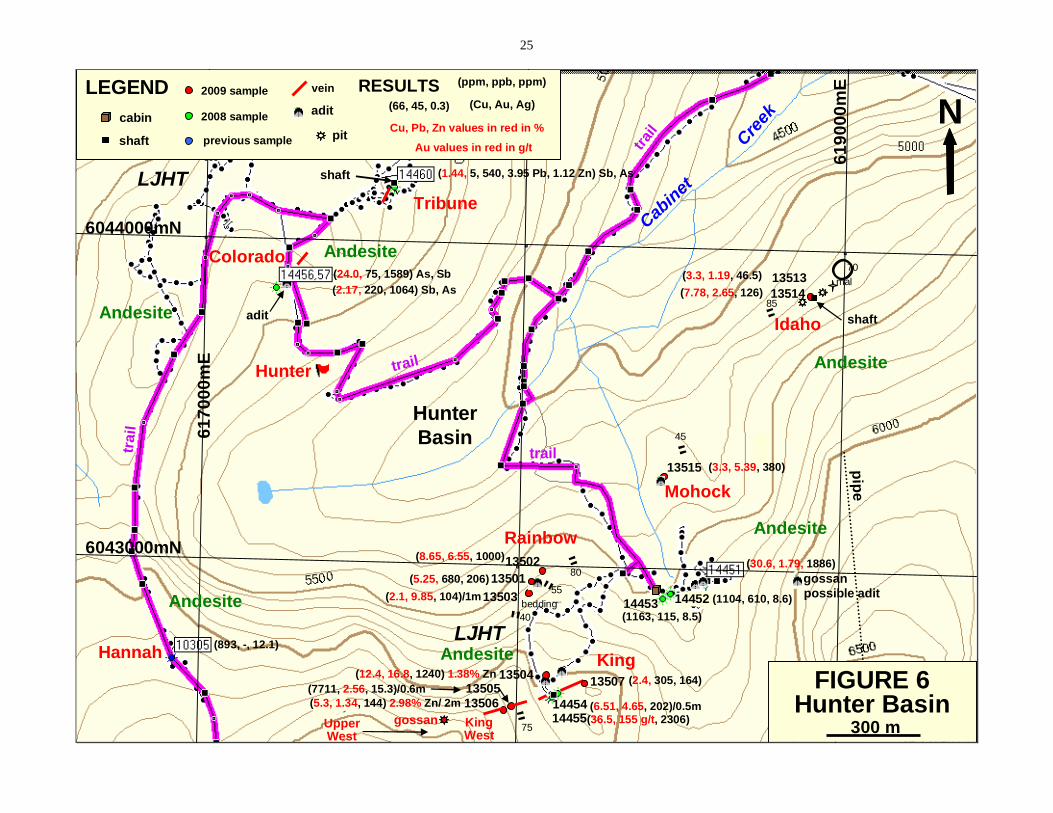
25
61
70
00
mE
6044000mN
N
61
90
00
mE
6043000mN
HunterBasin
Cabin
et
Cre
ek
(893, -, 12.1)
adit
Andesite
Andesite
LJHT
LJHT
FIGURE 6Hunter Basin
300 m
Andesite
Andesite
Andesite
Rainbow
King
Colorado
Tribune
shaft
Hannah
14454
14453
(30.6, 1.79, 1886)
(1163, 115, 8.5)
(1104, 610, 8.6)14452
(36.5, 155 g/t, 2306)(6.51, 4.65, 202)/0.5m
(1.44, 5, 540, 3.95 Pb, 1.12 Zn) Sb, As
(24.0, 75, 1589) As, Sb
(2.17, 220, 1064) Sb, As
LEGEND (ppm, ppb, ppm)
Cu, Pb, Zn values in red in %
(Cu, Au, Ag)
RESULTS(66, 45, 0.3)
2008 sample
previous sample
cabin
shaft
adit
trail
trai
l
trail
trail
Hunter
vein
14455
gossanpossible adit
KingWest
Au values in red in g/t
2009 sample
pip
e
135071350513506
13502
13501
13503
Mohock
Idaho
pit
13504
13514
(5.25, 680, 206)
(8.65, 6.55, 1000)
(2.1, 9.85, 104)/1m
(12.4, 16.8, 1240) 1.38% Zn
(7711, 2.56, 15.3)/0.6m(2.4, 305, 164)
(3.3, 5.39, 380)
(7.78, 2.65, 126)
(3.3, 1.19, 46.5) 13513
13515
(5.3, 1.34, 144) 2.98% Zn/ 2m
""
80
40
shaft
"
75
Andesite
85 "
mal
O70
55
gossanUpperWest
45 "
"
bedding

26
6240
00m
E
6045000mN
FIGURE 7aHankin Basin
North Loring Creek
500m
Cre
ek
Lorin
g
Old Tom
AndesiteLJHT
pro
pe
rtyb
ou
nd
ary
N
Hankin
6220
00m
E
6046000mN
aditadit
adit
adit
(2933, 150, 13.3, 2.58 Zn)
HankinPlateau
14463
trail
trail
trail end
malachite stainedcliffs with adits
felsicdykes
Andesite
Andesite
Andesite
"
05
(2052, 40, 4.2, 0.14 Zn)
(1.27, 1.08, 50.3, 0.066 Mo)
(3607, 650, 16.8, 0.069 Mo)
(1.29, 190, 15.8, 0.037 Mo)
(6.53, 1.74, 108, 0.018 Mo)
(3.18, 535,16.0)
(9813, 140, 5.1, 0.072 Mo)/1m
(8767, 225, 6.8)/1.2m
Hope
pit
78-1, -2
73-1
(2300, 72, 9) BCGS
(ppm, ppb, ppm)
Cu, Zn, Mo values in red in %, Au in red in g/t
2008 sample
LEGEND
(66, 45, 0.3) (Cu, Au, Ag)RESULTS
drill holeprevious sample
adit
Nad 83, Zone 9
Andesite
L-2
L-1
EM anomaly
LJHT
showing2009 sample

27
6043000mN
FIGURE 7bHANKIN BASIN
South Loring Creek
620000m
E
700 m
LJHT
Andesite
(ppm, ppb, ppm)
2009 sample
LEGEND
(66, 45, 0.3) (Cu, Au, Ag)
RESULTS
Cre
ek
Lo
ring
N
622000m
E
Cre
ek
Web
ster
13511
13509
14532
14529
S13520
2008 sample
(1.45%, 185, 54.3) /2m
Old
Baselin
e
(13, 5, 0.2)
(17, 5, 0.2)S
S
S
S
L(18, 5, 0.4)
(88, 5, 0.6)
(52, 5, 0.5)
(16, 5, 0.4)
(3.05%, 135, 108)
(1.00%, 115, 60.5) /1m
(1.45%, 185, 54.3)
(3.00%, 2.25, 164) /0.5m
(12.8%, 655, 204) /0.5m
gossan
gossan
LakeCrater
pro
pert
yb
ou
nd
ary
EM anomaly
old camp
SeeFigure 7a
drill hole
Hankinpit (2300, 72, 9) BCGS
Marmot
possible lastdrill site
LJHT
Andesite
Hornfels
linea
men
t
malachite stainedcliffs with adits
showing
LJHT
AndesiteCu values in red in %, Au in g/t
felsic dyke
old camp?
"85
adit
O70
DDH approximate
Lava
"25N
L-1
L-2
L-3
Loring
L-3, 4
L-1 or 2

28
618
00
0m
E
6041000mN
Cre
ek
Sunsets
N
620
00
0m
E
HankinBasin
14499
Fly
6039000mN14500
144921449114490
14498
Fog
GlacisBasin
Webste
r
Cre
ek
14458
W-S1W-S4
14494
14495
SunsetsBasin
(497, 20, 0.8, 8.23 Zn, 0.014 Mo)
(302, 10, 0.3, 0.041 Mo)
(5694, 20, 12.3)
(751, 60, 5.6)
(228, 5, 2.4)
(1241, 10, 1.1)
(525, 5, 0.5)
(257, 75, 54.2)
(2198, 945, 504)
(39, 10, 1.1)
14501, 02(1352, 455, 110, 0.12 Pb)(376, 15, 1.2)
10319 (0.0605 Mo)
10326 (0.151 Mo)
Andesite
Andesite
Andesite
93L/6
93L/11 Loring
Ck
Mike 44
(322, 35, 1.3)
LEGEND(ppm, ppb, ppm) Cu, Zn, Mo values in red in %
2008 sample, S denotes soil
(Cu, Au, Ag)RESULTS
drill hole felsic dyke
(66, 45, 0.3)
previous sample
old claim post
Fog Detail
144821448114484
14488
(9341, 65, 48.2, 0.013 Mo)
(206, 15, 3.4)
(2605, 40, 8.5)
(562, 5, 1.0)/1m
(231, 5, 0.8)
(29, 10, 0.7)
(135, 5, 0.9)/0.7m
(830, 10, 0.8)/1m
Quartz monzonite
LKBg
Sunsets Stock
LJHT
LJHT
LJHT
FIGURE 8Sunsets Basin
500 mphyllic zone
Andesite
DDH 68-1, -2
DDH 70-1
DDH 70-2, -3
(173, 5, 0.7) 10 ppm Mo(231, 5, 0.2) 20 ppm Mo
(198, 15, 0.6) 9 ppm Mo
(153, 5, 0.2) 21 ppm Mo
W-S2W-S3
S
S
(237, 5, 0.3) 18 ppm Mo
(372, 5, 1.2) 13 ppm Mo
area of previous0.4-0.5% Cu in float
6000’
Nad 83, Zone 9
(150, 5, 0.9)
(44, <5, 0.8)
(344, 5, 3.6)SbA

29
61800
0m
E6038000mN
Cre
ek
Sunsets
DominionBasin
6036000mN
Andesite
Andesite
Area of Mike 3, 11, 12 drill holeslocations approximated
Deny North Detail
LJHT
LJHT
(1.68, 9.52, 180, 15.7 Zn, 0.95 Pb)
(1406, 730, 4.7)(28, 20, 0.45)
Friendly Trench
Tr 1
Tr 2
camp
Sunset
DenyNorth
Deny East
Cre
ek
Den
ys
Andesite
FIGURE 9Dominion Basin
500 m
50 m
LEGEND(ppm, ppb, ppm) Cu, Zn, Pb values in red in %, Au in red in g/t
2008 sample
(Cu, Au, Ag)RESULTS
drill hole
(66, 45, 0.3)
previous sample Nad 83, Zone 9adit
pit
Deny South
62000
0m
E
Diorite

30
621000m
E
6028000mN
(1395, 20, 1.2)
FIGURE 10Houston Tommy
Area1 km
Cre
ek
Ho
usto
n
Creek
Loljuh
Tom
my
Rudy
Pete
Joe
LoljuhLoljuh
619000m
E
6030000mN
AndesiteLJHT
Andesite
LJHT
Del
Del DetailAndesite
LJHT
property boundary
pro
pe
rty
bo
un
da
ry
Andesite
Andesite
Rhyolitegossan
gossan
NN
LJHT
1987 sample (6.0, -, 25)
Del 1, 2 #1 post
(335, 10, 0.6)
(66, 45, 0.3) (ppm, ppb, ppm) Cu in red in %RESULTS
2008 sample
quartz-epidote veins
LEGEND
T1
T3
T4
T6
T2
Cu, Ag, (Au)Cu, Ag
(Zn, Pb)(Cu)
(Cu, Mo)
LJHE
felsic dyke
epiclasticsediments
sediments
100m
previous sample
5700’
5800’
(Cu, Au, Ag)Nad 83 Zone 9
old camp
Granodiorite
Loljuh StockLKBg
LJHE
See Figure 10a
0
sediments
LJHE Loljuh porphyrygossan
LJHE

31
Loljuh
Creek
Loljuh
61
900
0m
E
6030000mN
LJHE
N
FIGURE 10aLoljuh Detail
61
850
0m
E
LJHE
LJHE
LJHE
150 m
py
trail
helipad
LJHT
Andesite
Granodiorite
Loljuh StockLKBg
sediments
epiclastics
"
40
$
fresh
(3513, 50, 6.3, 8) /1m
(1959, 170, 5.5, 5)
(33, 5, <0.2, 1)
(74, 5, <0.2, 1)
(100, 15, 0.2, 36)
(453, 5, 0.2, 9)(3392, 35, 3.5, 21)
(490, 15, 0.3, 6)
(76, 10, <0.2, 123)
(765, 15, 0.4, 5)(310, 15, 0.4, <1)
(87, 15, <0.2, <1)
(35, 5, 0.2, 156)
(265, 5, 0.3, 9)
13528
epiclastics
epiclastics
gossan
(ppm, ppb, ppm, ppm)
2009 sample
LEGEND
(66, 45, 0.3, 9) (Cu, Au, Ag, Mo)RESULTS
Adesite dykes
composite grab over 15m
py
py
mte
py pyrite mte magnetite

32
60200
0m
E
Creek
Evening
Andesite
LJHT
N
Countess
60000
0m
E
trail
Andesite
(130, 55, 0.5)
Creek
Howson
Ridge
Silver Heels
Duchess
Evening
Andesite
FIGURE 11Howson Basin
Evening Area
300m
adit
14515,16
trail
14521, 22
6037000mN
6038000mN
(2523, 15, 5.2)
(1960, 10, 1.8) 14 ppm Mo(2.35, 15, 142)
(7.91, 35, 100)
Nad 83Zone 9
LEGEND(ppm, ppb, ppm) Cu, Zn values in red in %, Au in red in g/t
2008 sample, S denotes soil
(Cu, Au, Ag)RESULTS
drill hole felsic dyke
(66, 45, 0.3)
previous sample
camp
Joker
vein
(483, 40, 1.5) 42 ppm Mo
(434, 5, 1.4) 41 ppm Mo
(1070, 35, 8.7) 33 ppm Mo, As
(817, 35, 6.3) Pb
(8482, 20, 90.2)
(1.55, 50, 24.6)
(1.13, 5, 13.3)
(8159, 20, 22.5)/2m
adit
adit
quartz-pyrite alteration
fault
fau
lt
Andesite(4631, 10, 9.1) Pb, Zn
(5.27, 85, 69.9)
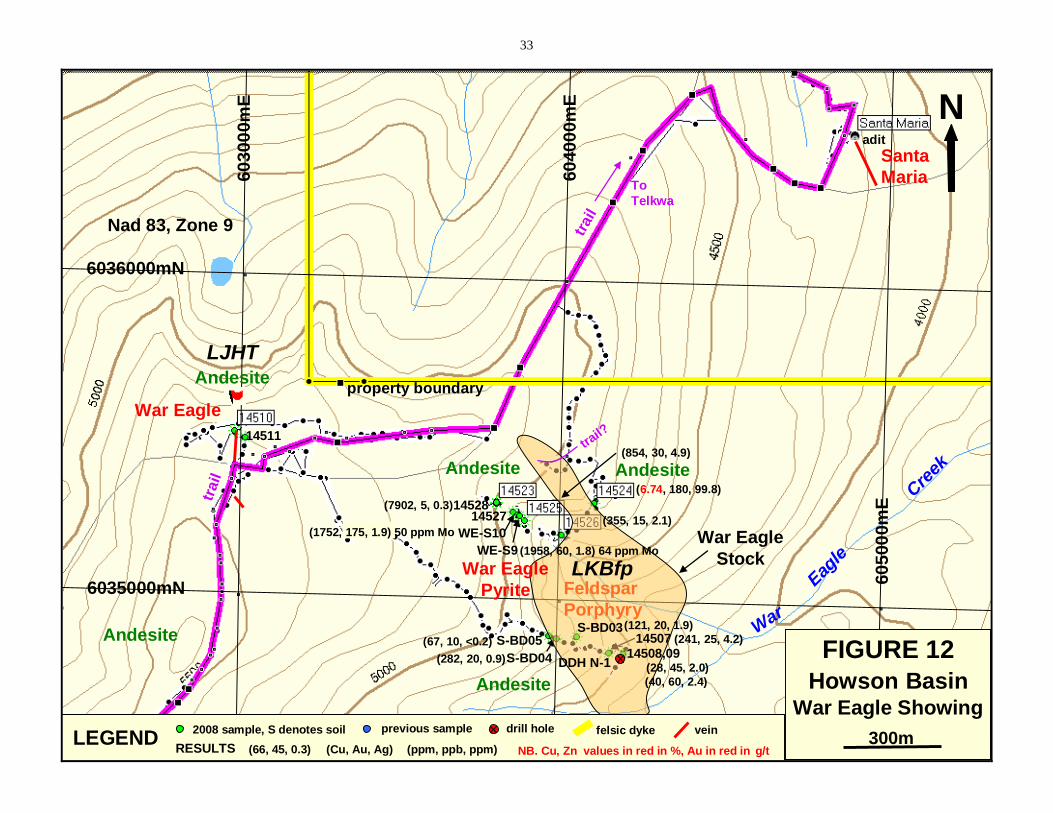
33
60500
0m
E
6035000mN
Cre
ek
War
Andesite
LJHT
N
60300
0m
E
trai
l
Andesite
SantaMaria
adit
14511
ToTelkwa
FIGURE 12Howson Basin
War Eagle Showing
300m
Eagle
6036000mN
60400
0m
EWE-S9
War Eagle
Nad 83, Zone 9
property boundary
(6.74, 180, 99.8)
trail
(854, 30, 4.9)
(7902, 5, 0.3)
(28, 45, 2.0)(40, 60, 2.4)
(121, 20, 1.9)
(282, 20, 0.9)
(67, 10, <0.2)
(1752, 175, 1.9) 50 ppm Mo
War EaglePyrite
1452714528
S-BD03S-BD05
S-BD04
WE-S10
(1958, 60, 1.8) 64 ppm Mo
(241, 25, 4.2)
DDH N-1
trail?
14508,0914507
FeldsparPorphyry
LKBfp
Andesite
AndesiteAndesite
LEGEND(ppm, ppb, ppm)
2008 sample, S denotes soil
(Cu, Au, Ag)RESULTS
drill hole felsic dyke
(66, 45, 0.3)
previous sample vein
NB. Cu, Zn values in red in %, Au in red in g/t
War EagleStock
(355, 15, 2.1)

34
14565
N
Creek
Starr
pro
pert
yb
ou
nd
ary
6050
00
mE
6000
00
mE
6033000mN
(4.55, 90, 328)
(7142, 25, 4.2, 9.7 Zn)
MSJ Creek
Trail Th
au
til
Riv
er
trail
Lone
Chasm
14567,68
(107, <5, 0.4)
(4.03, 35, 146)
(3.32, 10, 63.8)
(4.28, 5, 52.9)
To Telkwa
6027000mN
Princess
FIGURE 13Starr Creek AreaMSJ & Princess Showings
1 km
Malachite,chalcopyrite,molybdenite
LEGEND
(66, 45, 0.3) (Cu, Au, Ag)
(ppm, ppb, ppm)
Cu, Zn values in red in %Au values in red in g/t
RESULTS
2008 sample drill hole
Nad 83 Zone 9
AndesiteQuartz monzonite
Andesite
phylliczone
arg
illic
zo
ne
pyri
tezo
ne
chargeabilityanomaly
epiclastic sediments
hornfelsed sediments
LKBgLJHT
LJHT
LJHE
Evb
LJHT
LJHT
14566
pro
py
liti
c
14569
felsic dykes
vein
skarn
MSJStock
Andesite
2009 sample
13548
M13549
(58, <5, 0.4)
(11, 65, 0.2)276 Zn
Figure 14
"
60
55
3m calcitevein, mal
trail
Andesite Felsite
Monzonitesubvolcanic
ON
cut lines
mag low

35
FIGURE 14
3500’
4500’
4800’
"
45
R
QMp
QMa
70"
A
mal, cp
mal malachitecp chalcopyrite
S13536 Soil 58 15 0.3 10 3 Mo
QMa
felsic dykes
QMp
R
S13538
6
rhyolite
argillic altered
phyllic altered
andesite
quartzmonzonite
QM
LEGEND
QMp
A
R
QMpA
A
felsite dykes
O80
O
60
"
70sheeted quartz stringers
EM anomaly
previouschargeability anomaly
A

36
14476,77
N
property boundary
LEGEND5
98
000
mE
6027000mN
6028000mN
(0.69, 4.96, 2.4)
(66, 45, 0.3)(0.21, 2.09, 1.4)
(41, 1.68, 1.5) (0.30, 165, 2.1)(355, 910, 8.1)
(419, 220, 3.2, 0.11 Zn)
(841, 35, 28.2 1.47 Zn)
(251, 95, 2.2, 0.23 Zn)
5000’
5000’
5500’
4500’
59
70
00
mE
LEFTY
ANT
(66, 45, 0.3) (Cu, Au, Ag) (ppm, ppb, ppm) NB. Cu, Zn values in red in %, Au in red in g/tRESULTS
2008 sample drill hole vein
fau
lt
fau
lt
Andesite
Rhyo
lite
flow
less
eran
desite
Nad 83 Zone 9
Andesite,lesser rhyolite
93
L/6
93
L/5
LJHT
LJHT
LJHT
LJHT
FIGURE 15Starr Creek AreaAnt, Lefty & Wolverine
2009 sample
13545
13544
WOLVERINE
(1741, 140, 32.6)Rhyolitefra
gmental
lesser andesiteflows
sil(6447, 165, 30.3) 0.9% Zn
13543
13546
(28, 20, 1.1)(1879, 120, 12.5) 1.84% Zn
(21, 25, 0.8)
13542
(37, 30, 1.2)
Andesite 13547
Andesite Rhyolite fragmental Rhyolite dyke
And
esiteM
onzo
nite
subvo
lcan
ic (37, 30, 1.2)13542
37
8.0 DEPOSIT TYPES
The principal deposit type present on the El Toro Project is the subvolcanic copper-gold-silver (arsenic, antimony) type, also referred to as transitional or intrusion relatedpolymetallic stockwork and vein types. The Equity Silver past producing mine, 60 kmsoutheast of El Toro, is an example of this type of deposit. The three past producingmines and developed prospect on the El Toro Project (King, Rainbow, Colorado andHunter) and the remaining Hunter Basin showings, and the Hankin, Dominion andHowson Basin showings, and possibly the Rudy, Pete and Joe also belong to this classof deposit.
Mineralization of the calc-alkaline porphyry coppermolybdenumgold(silver) deposittype, commonly related to the subvolcanic type, is less abundant in the project area butis associated with the Bulkley plutonic suite which occur as stocks and dykes across theproperty. The Huckleberry Mine, 70 km south of the El Toro Project, is a calc-alkalinecoppermolybdenumgold porphyry type deposit associated with a stock of the LateCretaceous Bulkley plutonic suite, with mineralization occurring within both the stockand the hornfelsed Telkwa Formation volcanic rocks of the Hazelton Group.Mineralization at the Fog and Fly fall into this category and the MSJ, War Eagle Pyriteand Loljuh SE exhibit porphyry characteristics.
Epithermal veins are commonly associated with subvolcanic and porphyry deposit typeswith mineralization on the Ant, Wolverine and possibly the Del of this type.
Several occurrences of copper-silver-zinc skarn mineralization with calc-silicate-magnetite skarn assemblages are recorded adjacent to dyke and plutonic contacts, inassociation with vein and porphyry style mineralization, e.g. Duchess, Fog-Fly,Princess, War Eagle, Tom, Deny North and Loring. The host Telkwa Formation rocksare generally lacking in carbonate members, and extensive or economic concentrationsof skarn type mineralization are not likely to occur (Dawson, 2006).
8.1 Subvolcanic copper-gold-silver (arsenic, antimony)
The following characteristics of the subvolcanic copper-gold-silver (arsenic, antimony)deposit model are primarily summarized from Panteleyev (1995). Examples include theEquity Silver past producing mine in British Columbia, the Rochester District in Nevada,Kori Kollo in Bolivia, and the epithermal gold zones at Lepanto, Phillippines.Commodities are copper, gold and silver with associated arsenic and antimony.
Mineralization typically occurs as sulphide and sulphide-quartz veins, stockworks andbreccias in subvolcanic intrusions with stratabound to discordant massive pyriticreplacements, veins, stockworks, disseminations and related hydrothermal breccias incountry rocks, located near or above porphyry copper hydrothermal systems. Theycommonly contain pyritic auriferous polymetallic mineralization with silver sulphosaltand other arsenic and antimony bearing minerals and occur in volcano-plutonic belts inisland arcs and continental margins as well as continental volcanic arcs. Extensional

38
tectonic regimes are favourable, allowing high level emplacement of the intrusions.Ages of mineralization are variable, although Tertiary deposits are most abundant.
Host rocks include subvolcanic (hypabyssal) stocks, rhyodacite and dacite flow-domecomplexes with fine to coarse-grained quartz-phyric intrusions common. Dyke swarmsand other small subvolcanic intrusions are likely to be present. Where coeval volcanicrocks are present, they range from andesite to rhyolite in composition and occur asflows, breccias and pyroclastic rocks with related epiclastic rocks (as observed at ElToro).
Ore mineralogy includes pyrite, commonly auriferous, chalcopyrite and tetrahedrite-tennantite, with subordinate enargite, covellite, chalcocite, bornite, sphalerite, galena,arsenopyrite, argentite, sulphosalts, gold, stibnite, molybdenite, wolframite or scheelite,pyrrhotite, marcasite, realgar, hematite, tin and bismuth minerals. (Ore mineralsobserved on the El Toro Project include pyrite, chalcopyrite and tetrahedrite-tennantite,with subordinate chalcocite, bornite, sphalerite, galena, possible arsenopyrite andstibnite, molybdenite, pyrrhotite, and hematite.) Gangue and alteration minerals includepyrite, sericite and quartz (typically observed at El Toro) with minor kaolinite, alunite andjarosite primarily in supergene zones. Weathering of the pyritic zones can producelimonitic blankets with jarosite, goethite and locally alunite.
Ore zones are typically localized in strongly fractured to crackled zones in cupolas andinternal parts of intrusions and flow-dome complexes, along faulted margins of high-level intrusive bodies in permeable lithologies (primary and secondary) in the countryrocks. Primary controls are structural features such as faults, shears, fractured andcrackled zones and breccias. Secondary controls are porous volcanic units (as is thecase in the Hankin Basin area of the El Toro Project), bedding plane contacts andunconformities. Breccia pipes provide channelways for hydrothermal fluids originatingfrom porphyry copper systems and commonly carry elevated values of gold and silver(Marmot showing may be an example).
Vertical zonation and superimposition of different ore types is common. Pyrite richdeposits contain enargite near surface, passing downwards into tetrahedrite/tennantite-chalcopyrite and then chalcopyrite in porphyry intrusions at depth. The vein andreplacement mineralization can be separated from the deeper porphyry mineralizationby 200 to 700m. Geochemical signature includes gold, copper, silver, arsenic, antimony,zinc, cadmium, lead, iron and fluorine, with molybdenum, bismuth, tungsten, and locallytin at depth.
Equity Silver produced 33.8 million tonnes of 0.4% copper, 64.9 g/t Ag, and 0.46 g/t Auprimarily from bulk mineable tetrahedrite bearing zones. Kollo, Bolivia contained 10million tonnes of oxide ore grading 1.62 g/t Au, 23.6 g/t Ag with 64 million tonnes ofsulphide ore grading 2.26 g/t Au, 13.8 g/t Ag from closely spaced fracture and veinsystems. Associated deposit types include high and low sulphidation epithermal gold-silver, porphyry copper±molybdenum±gold and related polymetallic veins.
39
8.2 Porphyry copper molybdenum gold
The following characteristics of the calc-alkaline porphyry coppermolybdenumgolddeposit model are primarily summarized from Panteleyev, (1995). Examples of theclassic morphologic type of calc-alkaline porphyry include Brenda and Huckleberry inBritish Columbia, Bingham in Utah, USA and El Salvador in Chile. Commodities arecopper, molybdenum and gold in varying quantities with minor silver in most deposits.
Classic type deposits, which appear to be the morphologic type on the El Toro Project,are stock related with multiple emplacements at shallow depths (1-2 km) of generallyequant, cylindrical porphyritic intrusions, modified by numerous associated dykes andbreccias. Orebodies occur along margins and adjacent to intrusions as annular oreshells. Lateral outward zoning of alteration and sulphide minerals from a weaklymineralized potassic/propylitic core is usual. Surrounding ore zones with potassic(commonly biotite-rich) or phyllic alteration contain molybdenite-chalcopyrite, thenchalcopyrite and a generally widespread propylitic, barren pyritic aureole.
Mineralization typically occurs as sulfide-bearing veinlets, fracture fillings and lesserdisseminations in large hydrothermally altered zones (up to 100 ha in size) with quartzveinlets and stockworks, commonly wholly or partially coincident with intrusion orhydrothermal breccias and dyke swarms, hosted by porphyritic intrusions and relatedbreccia bodies. Sulfide mineralogy includes pyrite, chalcopyrite, with lessermolybdenite, bornite and magnetite. Two main ages of mineralization are evident in theCanadian Cordillera, Triassic to Jurassic (210-180 Ma) and Cretaceous to Tertiary (85-45 Ma).
Alteration generally consists of an early central potassic zone that can be variablyoverprinted by potassic (potassium feldspar and biotite), phyllic (quartz-sericite-pyrite),less commonly argillic and rarely, advanced argillic (kaolinite-pyrophyllite) in theuppermost zones.
Regional faults are important in localizing the porphyry stocks with fault and fracturesets (especially coincident and intersecting multiple sets) an important ore control.Other ore controls include internal and external igneous contacts, cupolas, dyke swarmsand intrusive and hydrothermal breccias.
British Columbia porphyry coppermolybdenumgold deposits contain 115 milliontonnes of 0.37% Cu, 0.01% Mo, 0.3 g/t Au and 1.3 g/t Ag, from median values for 40deposits with reported reserves. Porphyry deposits contain the largest reserves ofcopper, almost 50% of the gold reserves in British Columbia and significantmolybdenum resources and are primarily mined by open pit methods. Associateddeposit types include skarn, porphyry gold, low and high sulphidation epithermalsystems, polymetallic veins and sulfide mantos and replacements.

40
8.3 Epithermal gold-silver veins
The following characteristics of the low sulphidation epithermal gold deposit model areprimarily summarized from Panteleyev, (1996). Examples include the Midas Mine ofFranco Nevada in Nevada, the El Penon Mine of Meridian Minerals in Chile, and theformer Baker and Cheni Mines in the Toodoggone District of British Columbia.Commodities are gold and silver with minor copper, lead and zinc.
Mineralization typically occurs as quartz veins, stockworks and breccias carrying gold,silver, electrum, argentite and pyrite with lesser and variable amounts of sphalerite,chalcopyrite, galena, rare tetrahedrite and sulphosalt minerals in high level (epizonal) tonear surface environments. The ore commonly exhibits open space filling textures andis associated with volcanic-related hydrothermal to geothermal systems in volcanicisland and continent margin magmatic arcs and continental volcanic fields withextensional structures.
Host rocks include most types of volcanic rocks with calcalkaline andesitic compositionspredominating. Some deposits occur in areas with bimodal volcanism and extensivesubaerial ashflow deposits. A less common association is with alkalic intrusive rocksand shoshonitic volcanic rocks. Clastic and epiclastic sedimentary rocks host depositsin intra-volcanic basins and structural depressions.
Gangue minerals include quartz, amethyst, chalcedony, quartz pseudomorphs aftercalcite and calcite, with minor adularia, sericite, barite, fluorite, calcium-mangnesium-manganese-iron carbonate minerals such as rhodochrosite, hematite and chlorite.
Alteration generally consists of extensive silicification occurring as multiple generationsof quartz and chalcedony, commonly accompanied by adularia and calcite. Pervasivesilicification in vein envelopes is flanked by sericite-illite-kaolinite assemblages.Intermediate argillic alteration (kaolinite-illite-montmorillonite smectite) forms adjacentto some veins. Advanced argillic alteration (kaolinite-alunite) may form along the tops ofmineralized zones. Propylitic alteration dominates at depth and peripherally. Weatheredoutcrops are often characterized by resistant quartz ± alunite 'ledges' and flankingextensive, bleached, clay-altered zones with supergene alunite, jarosite and otherlimonite minerals.
The deposits occur in high-level hydrothermal systems from depths of approximately 1km to surficial hotspring settings. They are associated with regional-scale fracturesystems related to grabens, resurgent calderas, flow-dome complexes and rarely,maar diatremes. Extensional structures in volcanic fields (normal faults, fault splays,ladder veins and cymoid loops, etc.) are common; locally graben or caldera-fill clasticrocks are present. High-level (subvolcanic) stocks and/or dikes and pebble brecciadiatremes occur in some areas. Locally resurgent or domal structures are related tounderlying intrusive bodies.

41
Ore zones are typically localized in structures, but may occur in permeable lithologies.Upward-flaring ore zones centred on structurally controlled hydrothermal conduits aretypical. Large (greater than 1m wide and hundreds of metres in strike length) to smallveins and stockworks are common with lesser disseminations and replacements. Veinsystems can be laterally extensive but ore shoots have relatively restricted verticalextent. High-grade ores are commonly found in dilational zones in faults at flexures,splays and in cymoid loops.
Deposits are commonly zoned vertically over 250 to 350m from a base metal poor,gold-silver rich top to a relatively silver rich base metal zone and an underlying basemetal rich zone grading at depth into a sparse base metal, pyritic zone. From surface todepth, metal zones contain gold-silver-arsenic-antimony-mercury, gold-silver-lead-zinc-copper, silver-lead-zinc. In alkalic hostrocks tellurides, roscoelite (vanadium mica) andfluorite may be abundant, with lesser molybdenite.
Ages of mineralization are variable although Tertiary deposits are most abundant. Theage is closely related to the associated volcanic rocks but invariably slightly younger inage (0.5 to 1 Ma, more or less).
Typical grade and tonnage figures for the median low sulphidation epithermal golddeposits, based on worldwide mines and U.S.A. models, include 0.77 million tonnes of7.5 g/t Au, 110 g/t Ag and minor copper, zinc and lead for 41 Comstock-type 'bonanza'deposits and 0.3 million tonnes of 1.3 g/t Au, 38 g/t Ag and >0.3% Cu from 20 Sado-type gold-copper deposits. Associated deposit types include high sulphidationepithermal gold-silver, hotspring gold-silver, porphyry copper±molybdenum±gold andrelated polymetallic veins and placer gold.
Economic low sulphidation epithermal deposits are usually mined by a combination ofopen pit mining and underground operations with conventional cyanide millingprocessing, with moderate daily tonnage production. They typically contain high-gradesections, often with significant silver content, high silver to gold ratios, “clean”metallurgy, and good recoveries.
9.0 GEOPHYSICS (Figures 16-17)
Three airborne magnetic and electromagnetic surveys have been flown by AeroquestLimited over the El Toro Project for Lions Gate Energy Inc., covering 2194 line km in twoblocks. A 629 line km Aerotem 2 magnetic-electromagnetic survey was flown in 2007 tocover Hunter, Sunsets and Dominion Basins and filed as event number 4161638. In2008 two surveys were flown utilizing an Aerotem 3 system, a western block (995 linekm) covering the Howson Basin and Starr Creek areas and an eastern block (500 linekm) surrounding the 2007 survey area, covering Hunter, Hankin and Dominion Basinsand filed as event number 4280427. The surveys were flown using 100m line spacingswith east-west lines in 2008 due to the predominance of north to northeasterly trendingstructures throughout the project area and north-south lines in 2007. The survey areasand total field magnetic results are shown on Figure 16.

42
MSJ
FOGFLY
LAVA
LORING
OLD TOM
HANKIN
N
Nad 83, Zone 9
FIGURE 16: Airborne Total Field Magnetic Map
WOLVERINE
PRINCESS
STARRMAG
WAREAGLESTOCK
SUNSETS STOCK
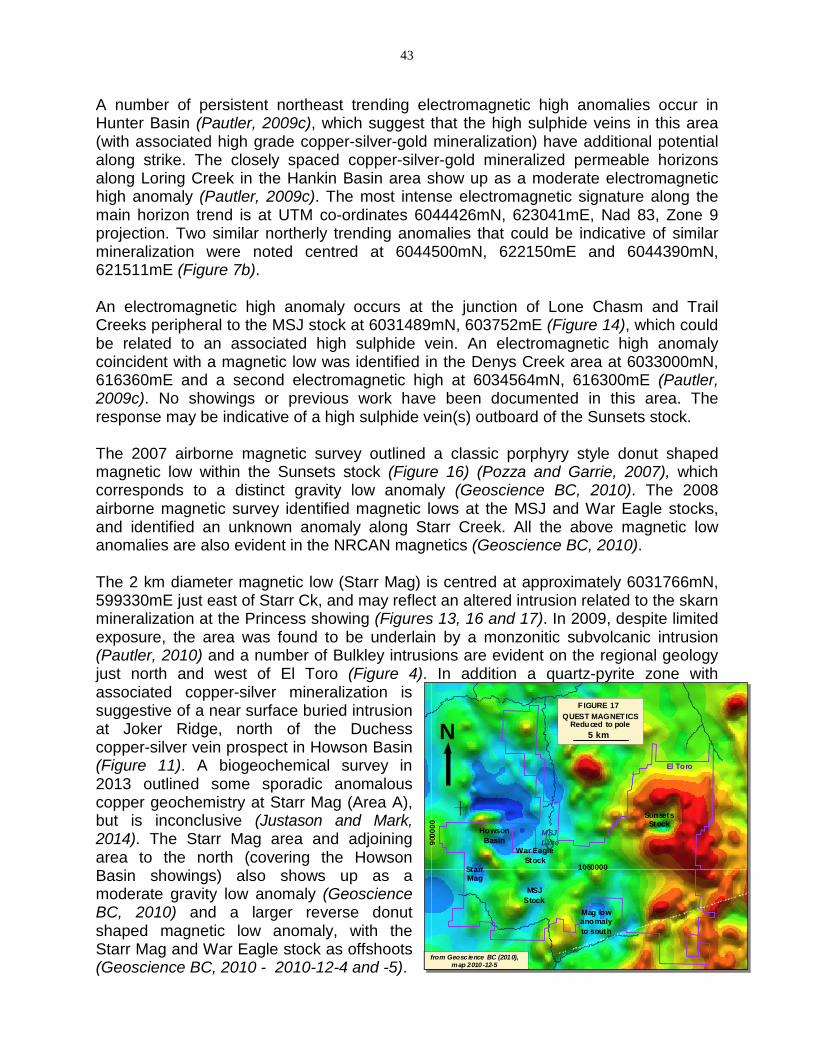
43
A number of persistent northeast trending electromagnetic high anomalies occur inHunter Basin (Pautler, 2009c), which suggest that the high sulphide veins in this area(with associated high grade copper-silver-gold mineralization) have additional potentialalong strike. The closely spaced copper-silver-gold mineralized permeable horizonsalong Loring Creek in the Hankin Basin area show up as a moderate electromagnetichigh anomaly (Pautler, 2009c). The most intense electromagnetic signature along themain horizon trend is at UTM co-ordinates 6044426mN, 623041mE, Nad 83, Zone 9projection. Two similar northerly trending anomalies that could be indicative of similarmineralization were noted centred at 6044500mN, 622150mE and 6044390mN,621511mE (Figure 7b).
An electromagnetic high anomaly occurs at the junction of Lone Chasm and TrailCreeks peripheral to the MSJ stock at 6031489mN, 603752mE (Figure 14), which couldbe related to an associated high sulphide vein. An electromagnetic high anomalycoincident with a magnetic low was identified in the Denys Creek area at 6033000mN,616360mE and a second electromagnetic high at 6034564mN, 616300mE (Pautler,2009c). No showings or previous work have been documented in this area. Theresponse may be indicative of a high sulphide vein(s) outboard of the Sunsets stock.
The 2007 airborne magnetic survey outlined a classic porphyry style donut shapedmagnetic low within the Sunsets stock (Figure 16) (Pozza and Garrie, 2007), whichcorresponds to a distinct gravity low anomaly (Geoscience BC, 2010). The 2008airborne magnetic survey identified magnetic lows at the MSJ and War Eagle stocks,and identified an unknown anomaly along Starr Creek. All the above magnetic lowanomalies are also evident in the NRCAN magnetics (Geoscience BC, 2010).
The 2 km diameter magnetic low (Starr Mag) is centred at approximately 6031766mN,599330mE just east of Starr Ck, and may reflect an altered intrusion related to the skarnmineralization at the Princess showing (Figures 13, 16 and 17). In 2009, despite limitedexposure, the area was found to be underlain by a monzonitic subvolcanic intrusion(Pautler, 2010) and a number of Bulkley intrusions are evident on the regional geologyjust north and west of El Toro (Figure 4). In addition a quartz-pyrite zone withassociated copper-silver mineralization issuggestive of a near surface buried intrusionat Joker Ridge, north of the Duchesscopper-silver vein prospect in Howson Basin(Figure 11). A biogeochemical survey in2013 outlined some sporadic anomalouscopper geochemistry at Starr Mag (Area A),but is inconclusive (Justason and Mark,2014). The Starr Mag area and adjoiningarea to the north (covering the HowsonBasin showings) also shows up as amoderate gravity low anomaly (GeoscienceBC, 2010) and a larger reverse donutshaped magnetic low anomaly, with theStarr Mag and War Eagle stock as offshoots(Geoscience BC, 2010 - 2010-12-4 and -5).
N
FIGURE 17
5 km
QUEST MAGNETICSReduced to pole
1050000
900
00
0
from Geoscience BC (2010),map 2010-12-5
MSJ
Lake
SunsetsStock
Howson
Basin
Mag lowanomaly
to south
MSJ
Stock
War Eagle
StockStarrMag
El Toro
N
FIGURE 17
5 km
QUEST MAGNETICSReduced to pole
1050000
900
00
0
from Geoscience BC (2010),map 2010-12-5
MSJ
Lake
SunsetsStock
Howson
Basin
Mag lowanomaly
to south
MSJ
Stock
War Eagle
StockStarrMag
El Toro

44
Another circular magnetic low is evident just south of the central property area as seenin maps 2010-12-4 and -5 (Geoscience BC, 2010) (Figure 17) and has not beenfollowed up. A small quartz diorite body is mapped at the northern extent of thisanomaly (Figure 5). An east-northeast trending fault is evident to the south of thisanomaly which connects to a previously mapped fault further to the east (Figure 17).
Two major faults are evident from the airborne magnetic surveys (Figure 16); a northerlyfault extends across the entire 13 km length of the eastern block along Loring Creek(Loring fault) and south, and a 7 km long northwest trending fault through the HunterBasin showings (Hunter fault), through the Loring showing and beyond. The Loringshowing occurs near the junction of the Loring and Hunter faults.
10.0 LIDAR INTERPRETATION AND INTEGRATION (Figures 2, and 6 to 19)
A 12,770 ha airborne LiDAR survey was completed in September, 2013 over the ElToro Project by Eagle Mapping Services Ltd. of Port Coquitlam, British Columbia forLions Gate Energy Inc. of Vancouver, British Columbia and filed as events 5466359,5468858 and 5484614. LiDAR (Light Detection and Ranging) is a remote sensingtechnology that measures distance by illuminating a target with a laser and analyzingthe reflected light. LiDAR uses laser light to measure distance rather than radio wavesas in RADAR. The result is the ability to produce accurate, detailed surfacemodels quickly at reduced costs over conventional photogrammetric mapping. EagleMapping’s system is based on Riegl’s VQ-580 laser scanner, which provides state ofthe art high speed, medium altitude laser scanning with superior accuracy from Riegl’sonline waveform analysis. This report documents an initial interpretation of the LiDARsurvey over the El Toro Project and integration with the known geology and geophysics,which was completed between November 5 and 18, 2014.
The LiDAR survey was flown to provide a bare-earth view of the ground below thecanopy of vegetation in order to enhance structural and stratigraphic interpretation(critical in this area dominated by block faulting), identify outcrop exposures (particularlyin areas of poor exposure), and delineate existing road and trail networks and oldworkings for essential access and evaluation of previous work.
The northerly trending Mooseskin Johnny fault (MSJ), which follows lower HowsonCreek, the Mooseskin Johnny valley and the Thautil River, is clearly seen in the digitalelevation model in Google Earth (Figure 18). Newly mapped fault sets and one previousset show right lateral displacement across the Mooseskin Johnny fault of approximately800m.

45
The MSJ porphyry showing appears to occur at the intersection of five faults. Othermajor fault intersections are evident along the Mooseskin Johnny fault, south ofMooseskin Johnny Lake just east of the War Eagle Pyrite (WEP) zone, and at thejunction of Starr Creek with the Thautil River (Figure 18). One drill hole (Figure 13) wasdrilled across an electromagnetic anomaly along a northeast trending structure,approximately 2.5 km southwest of this junction in 1968 (Baird, 1968 and BCDM, 1969).No results are reported.
The War Eagle showing and Starr Creek magnetic anomaly (Starr Mag) occur along thenortheast trending War Eagle fault, which is clearly visible in Figure 18, but only weaklyevident in the total field magnetics (Figure 16).
The northerly trending Duchess fault extends over 5 km from north of the Silver Heelsthrough the Countess and Duchess, and south to the Princess is also clearly visible inFigure 18.
The grayscale bare earth image (Figure 19) more clearly illustrates stratigraphicfeatures within the survey area. The volcanic strata on the hillside east of the mouth ofStarr Creek clearly trend northerly, parallel to the Mooseskin Johnny fault and dip east.In addition a fan is evident at the base of Trail Creek, below the MSJ showing.Conventional soils would not be effective due to the thick overburden and transportednature of the overburden. MMI soils have the potential to see below the overburdencover here.

46
N
MSJLake
Cre
ek
Howson
Sta
rr
Creek
Th
au
til
River
Den
ys
Creek
trail creek fault
sta
rrcre
ekfa
ult
MS
Jfa
ult
war eaglefault
approximately 2 km in centre
SCALE
Digital Elevation Modelin Google Earth
showing interpreted faults
FIGURE 18 correspond to previouslymapped faults
faults not previously mapped
property boundary
proper
tyboundar
y
property boundary
property boundary
du
ch
ess
fau
lt

47
N
MSJLake
Cre
ek
Howson
Starr
Creek
Th
au
til
River
Den
ys
Creek
trail creek fault
sta
rrcre
ek
fau
lt
MS
Jfa
ult
war eaglefault
approximately 2 km in centre
SCALE
Bare Earth Imagein Google Earth
showing interpreted faults
FIGURE 19 correspond to previouslymapped faults
faults not previously mapped
property boundary
proper
tyboundar
y
property boundary
property boundary
du
ch
ess
fau
lt

48
11.0 DRILLING
No drilling was undertaken by Lions Gate Energy Inc. during the 2007 to 2009programs. At least 16 drill programs, only totalling approximately 3800 metres inapproximately 60 holes, were completed on twelve of the showings on the El ToroProject between 1967 and 1990 and are summarized in Table 3 below. Complete detailsof most of the programs are not available in the assessment records with someprograms only mentioned in the annual reports of the British Columbia Ministry ofEnergy, Mines and Petroleum Resources (formerly the British Columbia Department ofMines).
Table 3: Drill programs
Year Showing Company Holes Type Size Depth (m)
1967 Duchess Norcan Mines Ltd. 6 diamond BQ 150?1967 Loljuh Noranda 7 diamond BQ 90.21968? King Canadian American Mining Co.? ? diamond AQ 100?1968 War Eagle Py Pathfinder Resources Ltd. 1 diamond NQ >177 (250?)1968 Fly Whitesail Mines Ltd. 2 diamond AX? 152.41968 Loring Falconbridge Nickel Mines Inc. 4 diamond AX 210.61968 Sunset, etc. Pyramid Mining Co. Ltd. 5? ? 150?1969 Deny N Falconbridge Nickel Mines Inc. 3 diamond AX 27.61969 NE Deny S Falconbridge Nickel Mines Inc. 4 diamond AX 181.21970 Fly Ducanex Resources Ltd. 3 diamond BQ 4781973 Old Tom Maharaja Minerals 1 diamond BQ short 201974 Deny S Maharaja Minerals 9 diamond BQ 400?
1975 Marmot Maharaja Minerals 2? diamond BQ 150?
1978 Old Tom Cardero Resources Ltd. 2 diamond BQ 1821978 Marmot Maharaja Minerals 2? diamond BQ 150?1990 Ant Atna Resources Ltd. 7 diamond BQ 1100
TOTAL 12 properties 16 programs 58+ 3792m
There is no record of drill hole locations, specifications or results from the 1967 diamonddrill program by Noranda on the Loljuh copper-molybdenum porphyry target (BCDM,1969). There is no record of the drilling on the King but minor drill core was observed onsite and may have followed an induced polarization survey in 1967 (Baird, 1967). There isno documentation of the two Fly drill programs, but locations were shown in assessmentrecords (Allen, 1981) with specifications shown for the 1968 program (Woolverton, 1969).Details of the 1969 programs on the Deny North and NE Deny South showings byFalconbridge were not found but locations were documented with some specifications insubsequent assessment reports (Kikuchi, 1981).
In 1968 one hole was diamond drilled on the Phil 6 claim (south of Starr Creek), one onthe Al 4 claim (near outlet of Glacis Creek), one on the Mike 44 claim (west of Fly) andsome holes on the Mike 3, 11, and 12 claims (above Sunset Adit) by Pyramid Mining Co.Ltd. (BCDM, 1969). A number of proposed holes and claim locations are shown in theassessment records (Baird, 1968), so approximate locations can be inferred and areshown in Figures 2, 8, 9 and 13.
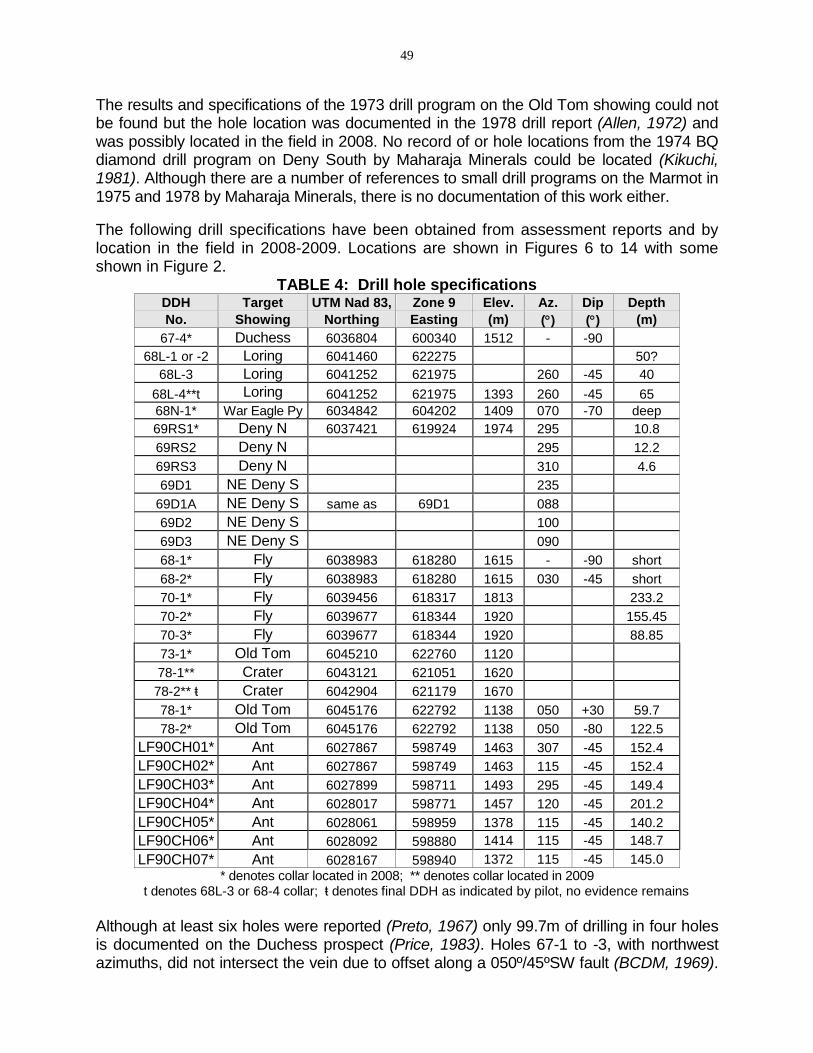
49
The results and specifications of the 1973 drill program on the Old Tom showing could notbe found but the hole location was documented in the 1978 drill report (Allen, 1972) andwas possibly located in the field in 2008. No record of or hole locations from the 1974 BQdiamond drill program on Deny South by Maharaja Minerals could be located (Kikuchi,1981). Although there are a number of references to small drill programs on the Marmot in1975 and 1978 by Maharaja Minerals, there is no documentation of this work either.
The following drill specifications have been obtained from assessment reports and bylocation in the field in 2008-2009. Locations are shown in Figures 6 to 14 with someshown in Figure 2.
TABLE 4: Drill hole specificationsDDH Target UTM Nad 83, Zone 9 Elev. Az. Dip Depth
No. Showing Northing Easting (m) () () (m)
67-4* Duchess 6036804 600340 1512 - -90
68L-1 or -2 Loring 6041460 622275 50?
68L-3 Loring 6041252 621975 260 -45 40
68L-4**t Loring 6041252 621975 1393 260 -45 65
68N-1* War Eagle Py 6034842 604202 1409 070 -70 deep
69RS1* Deny N 6037421 619924 1974 295 10.8
69RS2 Deny N 295 12.2
69RS3 Deny N 310 4.6
69D1 NE Deny S 235
69D1A NE Deny S same as 69D1 088
69D2 NE Deny S 100
69D3 NE Deny S 090
68-1* Fly 6038983 618280 1615 - -90 short
68-2* Fly 6038983 618280 1615 030 -45 short
70-1* Fly 6039456 618317 1813 233.2
70-2* Fly 6039677 618344 1920 155.45
70-3* Fly 6039677 618344 1920 88.85
73-1* Old Tom 6045210 622760 1120
78-1** Crater 6043121 621051 1620
78-2** ŧ Crater 6042904 621179 1670
78-1* Old Tom 6045176 622792 1138 050 +30 59.7
78-2* Old Tom 6045176 622792 1138 050 -80 122.5
LF90CH01* Ant 6027867 598749 1463 307 -45 152.4
LF90CH02* Ant 6027867 598749 1463 115 -45 152.4
LF90CH03* Ant 6027899 598711 1493 295 -45 149.4
LF90CH04* Ant 6028017 598771 1457 120 -45 201.2
LF90CH05* Ant 6028061 598959 1378 115 -45 140.2
LF90CH06* Ant 6028092 598880 1414 115 -45 148.7
LF90CH07* Ant 6028167 598940 1372 115 -45 145.0* denotes collar located in 2008; ** denotes collar located in 2009
t denotes 68L-3 or 68-4 collar; ŧ denotes final DDH as indicated by pilot, no evidence remains
Although at least six holes were reported (Preto, 1967) only 99.7m of drilling in four holesis documented on the Duchess prospect (Price, 1983). Holes 67-1 to -3, with northwestazimuths, did not intersect the vein due to offset along a 050º/45ºSW fault (BCDM, 1969).
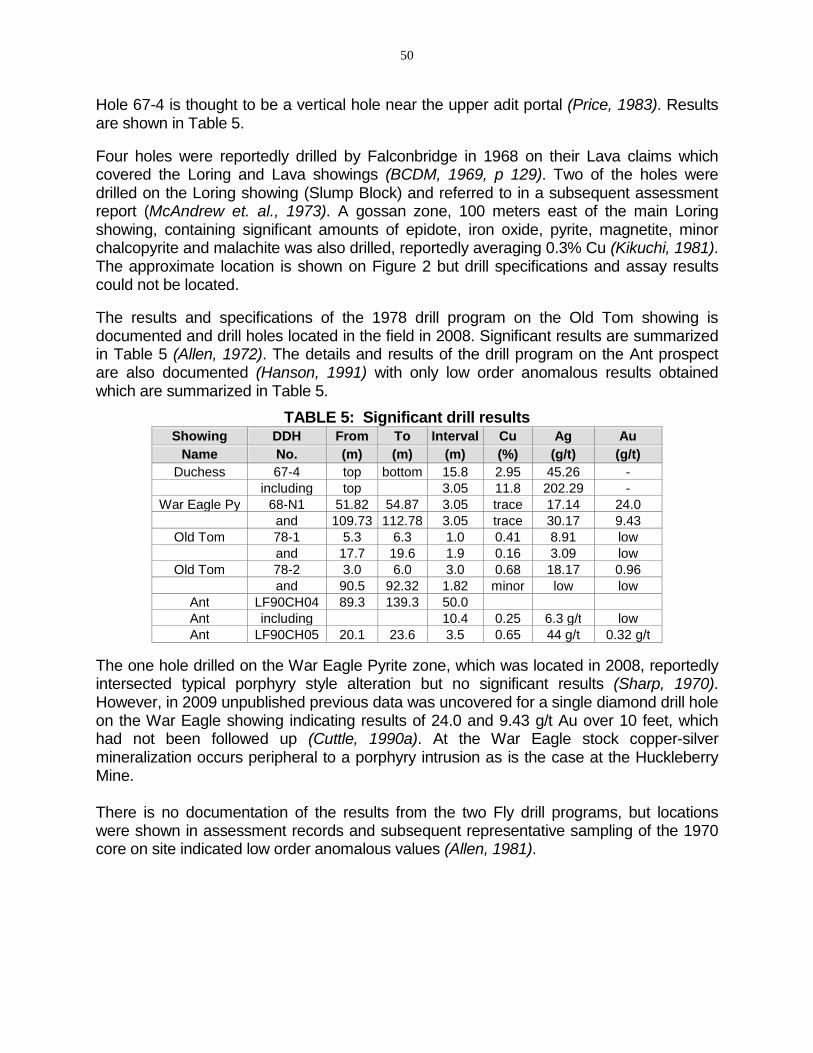
50
Hole 67-4 is thought to be a vertical hole near the upper adit portal (Price, 1983). Resultsare shown in Table 5.
Four holes were reportedly drilled by Falconbridge in 1968 on their Lava claims whichcovered the Loring and Lava showings (BCDM, 1969, p 129). Two of the holes weredrilled on the Loring showing (Slump Block) and referred to in a subsequent assessmentreport (McAndrew et. al., 1973). A gossan zone, 100 meters east of the main Loringshowing, containing significant amounts of epidote, iron oxide, pyrite, magnetite, minorchalcopyrite and malachite was also drilled, reportedly averaging 0.3% Cu (Kikuchi, 1981).The approximate location is shown on Figure 2 but drill specifications and assay resultscould not be located.
The results and specifications of the 1978 drill program on the Old Tom showing isdocumented and drill holes located in the field in 2008. Significant results are summarizedin Table 5 (Allen, 1972). The details and results of the drill program on the Ant prospectare also documented (Hanson, 1991) with only low order anomalous results obtainedwhich are summarized in Table 5.
TABLE 5: Significant drill resultsShowing DDH From To Interval Cu Ag Au
Name No. (m) (m) (m) (%) (g/t) (g/t)
Duchess 67-4 top bottom 15.8 2.95 45.26 -including top 3.05 11.8 202.29 -
War Eagle Py 68-N1 51.82 54.87 3.05 trace 17.14 24.0and 109.73 112.78 3.05 trace 30.17 9.43
Old Tom 78-1 5.3 6.3 1.0 0.41 8.91 lowand 17.7 19.6 1.9 0.16 3.09 low
Old Tom 78-2 3.0 6.0 3.0 0.68 18.17 0.96and 90.5 92.32 1.82 minor low low
Ant LF90CH04 89.3 139.3 50.0Ant including 10.4 0.25 6.3 g/t lowAnt LF90CH05 20.1 23.6 3.5 0.65 44 g/t 0.32 g/t
The one hole drilled on the War Eagle Pyrite zone, which was located in 2008, reportedlyintersected typical porphyry style alteration but no significant results (Sharp, 1970).However, in 2009 unpublished previous data was uncovered for a single diamond drill holeon the War Eagle showing indicating results of 24.0 and 9.43 g/t Au over 10 feet, whichhad not been followed up (Cuttle, 1990a). At the War Eagle stock copper-silvermineralization occurs peripheral to a porphyry intrusion as is the case at the HuckleberryMine.
There is no documentation of the results from the two Fly drill programs, but locationswere shown in assessment records and subsequent representative sampling of the 1970core on site indicated low order anomalous values (Allen, 1981).

51
12.0 INTERPRETATION AND CONCLUSIONS
There is good potential on the El Toro Project to discover a subvolcanic copper-gold-silver(arsenic, antimony) deposit similar to Equity Silver, 60 km to the southeast, whichproduced 33.8 million tonnes of 0.4% copper, 64.9 g/t Ag, and 0.46 g/t Au based on theabundance of mineral showings of this type on the property (particularly at Hankin andHunter Basins), significant previous results, and lack of recent systematic exploration.There is also potential for the discovery of a calc-alkaline porphyrycoppermolybdenumgold(silver) deposit based on the abundance of stocks and smallplugs of the Bulkley plutonic suite across the property, which hosts the HuckleberryMine (70 km to the south), four of which are known to exhibit porphyry style alterationand/or mineralization (Sunsets, MSJ, War Eagle and Loljuh stocks). Only 3800 metresof diamond drilling in approximately 60 holes has been completed within the projectarea, 1100m in 7 holes of which tested the Ant showing (one of 38 Minfile occurrenceson the property).
The initial LiDAR and geophysics interpretation and integration has delineated additionalpotential in the El Toro Project area and augments the potential of known targets. TheSunsets, MSJ, and War Eagle stocks are defined by significant magnetic low features,suggestive of altered intrusions, with the latter two anomalies larger than the mappedsurface extent of the intrusions. In addition a significant magnetic low anomaly wasdelineated along Starr Creek (Starr Mag) and another just south of the central propertyarea. Intrusions have been found or reported in these areas. In addition the Starr Maganomaly and War Eagle stock appear to be part of a much larger magnetic low anomalythat underlies the Howson Basin area. Small intrusions have been mapped in the area andquartz-pyrite alteration at Joker Ridge is suggestive of a near surface buried intrusion. Itshould be noted that a previous DDH record was uncovered from the War Eagle Pyriteshowing indicating results of 24.0 and 9.43 g/t Au, each over 3.05m, which has not beenfollowed up.
The MSJ porphyry showing, which covers anomalous copper, gold, molybdenum ±silverMMI soil geochemistry associated with a chargeability high anomaly in an altered intrusionwith associated chalcopyrite mineralization, appears to occur at the intersection of fivefaults. Other significant multiple fault intersections occur near the War Eagle Pyrite zoneand at the junction of Starr Creek with the Thautil River.
The Hankin Basin area has potential for possible bulk tonnage and local high gradecopper-silver-gold mineralization with significant similarities to the past producing EquitySilver mine. Mineralization, traced for 5 by 2 km and 350-400m in elevation, occurs inrelatively flat lying permeable horizons within andesite tuffs and in cross fractures andstockwork-breccia zones. The mineralization corresponds to moderate electromagneticconductors. A northerly trending fault extends for at least 13 km along Loring Creek(Loring fault) and further south. A 7 km long northwest trending fault extends through theHunter Basin showings (Hunter fault), through the Loring showing, and beyond. TheLoring showing occurs near the junction of the Loring and Hunter faults.

52
At Hunter Basin previous production records and 2008 sampling (6.51% Cu, 4.65 g/t Auand 202 g/t Ag over 0.5m from the King Vein with 36.5% Cu, 155 g/t Au and 2306 g/t Agfrom a grab sample) indicate high grade copper-gold-silver vein type mineralization fromthe south side of Hunter Basin. Combined production from the King and Rainbow minesbetween 1914 and 1962 totaled 293.5 tonnes producing 8,533g Au, 294,905g Ag, and44,357 kg copper. In 1914 38 tonnes of ore was shipped from the Colorado minerecovering 155,515 g Ag and 2722 kg Cu. Geophysical surveys and observedlineaments and a gossan, suggest continuity to the hosting structure of the King Vein.There does not appear to have been significant drilling to test the structures. TheRainbow and King Veins have potential to host similar mineralization along strike anddown dip. In addition strataform mineralization has been reported from the Hunterdeveloped prospect suggesting similarities to the mineralization in Hankin Basin.
In Dominion Basin a significant quartz sulphide vein is exposed for 15m in the FriendlyTrench returning 9.52 g/t Au, 180 g/t Ag, 1.68% Cu, 15.7% Zn and 0.95% Pb across1.0m in 2008. There does not appear to have been extensive work in this area to tracethe vein and additional veins are suggested by the discovery of gold-bearing quartzcarbonate float in upper Hankin Basin (Jamieson, 1991a).
Although mineralization was locally restricted at the Duchess prospect due to late faults,there is significant potential along strike of the persistent, 5 km long Princess-Duchess-Countess-Silver Heels structure, which is clearly evident in Google Earth images.
Previous porphyry coppermolybdenumgold(silver) exploration in the Sunsets stockfocussed on the phyllic alteration zones, but previous soil sampling and continuedexploration in 2008 has indicated better grades peripheral to these zones. At the WarEagle stock copper-silver mineralization occurs peripheral to the intrusion as is the caseat the Huckleberry Mine. High grade copper-silver mineralization is associated withfelsic dykes peripheral to the poorly exposed MSJ stock and similar mineralization isassociated with felsic dykes at the Joker Ridge quartz-pyrite zone and possibly relatedhigh grade Duchess copper-silver vein prospect in the Howson Basin area. The dykesmay be related to mineralized stocks, the MSJ stock in the former case and a nearsurface buried intrusion at Joker Ridge. A mineralized dyke is also documented at thePete showing in the Houston Tommy Creek area, outboard of the Loljuh stock.
13.0 RECOMMENDATIONS
Additional mapping and sampling is warranted in south Hunter, Hankin, Sunsets,Dominion and Howson Basins and at the MSJ, Loljuh and War Eagle stocks. The Hunterdeveloped prospect in north Hunter Basin, the southern magnetic low anomaly and thejunction of Starr Creek with the Thautil River (multiple fault intersections) should also beexamined.
The high grade quartz-sulphide mineralization at south Hunter Basin and the Princess-Duchess-Countess-Silver Heels structure can be traced by electromagnetic geophysics

53
surveys. HLEM may be necessary due to the topographic variance with VLF-EM. Initiallythe survey can be tested over known mineralization and, if effective, completed over thestrike extensions. An attempt should be made to trace the gold intersections from the WarEagle Pyrite showing DDH, by mapping, detailed prospecting and possibly geophysics.
Induced polarization geophysics is recommended over the MSJ stock. Detailed soil/talusfine sampling should be undertaken in Sunsets Basin, followed by induced polarizationgeophysics to delineate drill targets. Soil sampling is recommended over the Loljuh stockto determine the extent of mineralization and an attempt should be made to locate the1967 diamond drill core.
An initial Phase 1 exploration program consisting of mapping, detailed prospecting andsampling, with select conventional soil and geophysical surveys, is recommended on theEl Toro Project at a cost of $250,000 in order to delineate drill targets. Phase 1 should befollowed up by a 2,500m diamond drill program in Phase 2, with priority targets inHankin Basin, Sunsets stock and the MSJ stock, at an estimated cost of $750,000. Thedetailed budget is summarized below.
Phase 1: mapping, prospecting, geochemistry, geophysics geology wages (30 man days) $20,000 wages (geochemistry contractors, including data processing) 38,000 groceries and meals 15,000 geochemistry (300 rocks @ $30/ea, 1500 soils @ $25/ea, shipping) 38,000 transportation (trucks, ATVs, fuel) 10,000 helicopter 45,000 IP, HLEM geophysics 55,000 preparation, report and drafting 15,000 contingency and miscellaneous (communication, mob, demob) 15,000
TOTAL: $250,000
Phase 2: diamond drilling $750,000
TOTAL of Phases 1 & 2 $1,000,000

54
14.0 REFERENCES
Aeroquest Surveys, 2009. Report on a helicopter-borne AeroTEM electromagnetic andmagnetic survey, Aeroquest Job # 09-004, El Toro Project, Smithers, BritishColumbia, NTS 93L 06, 11. Report for Lions Gate Energy Inc.
Allen, A.R., 1978. Diamond drill report on the Mecca group, Old Tom 1 & 2 and Hankin1-16. Report for Maharaja Minerals Ltd. British Columbia Ministry of Energy andMines assessment report 07070.
Allen, D.G., 1981. Geological and geochemical report on the Sunsets Creek propertyB.C. Report for Redfern Resources Ltd. British Columbia Ministry of Energy andMines assessment report 09770.
Ashton, A.S., 1972. Jan Howson property. Report for Branta Explorations Ltd. by BullisEngineering Ltd. British Columbia Ministry of Energy and Mines assessmentreport 03583.
Baird J.G., 1968. Report on ground magnetic and electromagnetic surveys on Smithersarea, British Columbia. Report for Pyramid Mining Company Ltd. BritishColumbia Ministry of Energy and Mines assessment report 01570.
1967. Report on induced polarization survey on some Meg, John, King, Helenand West claims, Telkwa. Report for Canadian American Mining Co. Inc. BritishColumbia Ministry of Energy and Mines assessment report 01086.
BCDM, 1972. Geology, Exploration and Mining in British Columbia 1972. BritishColumbia Department of Mines and Petroleum Resources, GEM 1972.
1971. Geology, Exploration and Mining in British Columbia 1971. BritishColumbia Department of Mines and Petroleum Resources, GEM 1971.
1970. Geology, Exploration and Mining in British Columbia 1970. BritishColumbia Department of Mines and Petroleum Resources, GEM 1970.
1969. Annual Report of the Ministry of Mines, British Columbia - 1968, p. 129.
1963. Annual Report of the Ministry of Mines, British Columbia - 1962, p. A46.
1933. Annual Report of the Ministry of Mines, British Columbia - 1932, p. 85.
1926. Annual Report of the Ministry of Mines, British Columbia - 1925, p. A140.
1915. Annual Report of the Ministry of Mines, BC –1914, pp 222-225.
1912. Annual Report of the Ministry of Mines, BC –1911, pp 100, 110-112.
1905. Annual Report of the Ministry of Mines, British Columbia -1904, p.102,125.
1904. Annual Report of the Ministry of Mines, British Columbia –1903, p. 52-53.
1900. Annual Report of the Ministry of Mines, British Columbia –1899, p. 657.
British Columbia Minfile, 2008. 93L, 93E; British Columbia Ministry of Energy andMines.

55
Brown, D.H., 1968. Geophysical report on the Lava and Webster claims. Report forFalconbridge Nickel Mines Ltd. British Columbia Ministry of Energy and Minesassessment report 01880.
1968. Geological report on the Old Tom, Crater, Webster, Dominion, Lava,Marmot, and Dome claims. Report for Falconbridge Nickel Mines Ltd. BritishColumbia Ministry of Energy and Mines assessment report 01810.
Cartwright, P. A., Dispirito F., 1980. Report on the induced polarization and resistivitysurvey on the Copper 1-4 claims (Crater Lake) Telkwa area, B.C. Report forMecca Minerals Ltd. British Columbia Ministry of Energy and Mines assessmentreport 08624A.
Cullen, R., 1973. Dominion property South Showing - north slope of Denys Valley.Report for Maharaja Minerals Ltd. British Columbia Ministry of Energy and Minesassessment report 04813.
Cullen, R. and Biss, R., 1974. Revised geological report on the Tom, T.K. claims -Scallon Creek. Report for Maharaja Minerals Ltd. British Columbia Ministry ofEnergy and Mines assessment report 04812.
Cuttle, J., 1990b. A geochemical and geological report on the JJ-1 and Barb 1-4 MineralClaims. Report for Maharaja Minerals Ltd. British Columbia Ministry of Energyand Mines assessment report 04812.
1990a. Memo to Cheni Gold Mines with DDH N1 log.
Campbell, T., 1988. Geochemical and geological report on the Houston-Tommyproperty. Report for Noranda Exploration Company Ltd. British Columbia Ministryof Energy and Mines assessment report 18032.
Carter, N.C., 1974. Geology and geochronology of porphyry copper and molybdenumdeposits in west central British Columbia. Unpublished Ph.D. thesis, U.B.C.
Dawson, K.M., 2006. A review of historical data on El Toro claims of Farshad Shirvani,093L/5, 6, 11, Telkwa, B.C. Report for Farshad Shirvani.
Desjardins, P., .et. al. 1990. Geology of the Thautil River Area British ColumbiaGeological Survey Open File 1990-5.
Dirom, G.E., (1967). Report on electromagnetic survey on the Fog mineral claims ofNoranda Exploration Company Ltd. British Columbia Assessment Report 01189.
Ethier, D., 1989. Prospecting report on the Hunt claim. Report for Van AlphenExploration Services Ltd. British Columbia Ministry of Energy and Minesassessment report 19555.
Geoscience BC (2010): QUEST-West Project – Geology, Minfile, Magnetic, Gravity,Geochemistry; Geoscience BC, Maps 2010-12-1 to 2010-12-18, scale 1:500,000.
56
Hanson, D. J., 1991: 1990 diamond drilling report on the Lefty property Mineral Claims.Report by Equity Silver Mines Limited for Atna Resources Ltd. British ColumbiaMinistry of Energy and Mines assessment report 21925.
1990. Geology, geochemistry and geophysics on the Lefty property, BC. Reportby Equity Silver Mines Limited for Atna Resources Ltd. British Columbia Ministryof Energy and Mines assessment report 20741.
Harivel, C., 1988. The geology and geochemistry 1990 of the Silver Hill property. Reportfor Atna Resources Ltd. British Columbia Ministry of Energy and Minesassessment report 17488.
Helgason, R., 1987. Geochemical reconnaissance geological report on the Kuku, Rutzand Corn claims. British Columbia Ministry of Energy and Mines assessmentreport 17407.
Homeniuk, L.A., 1974. Geophysical report on the MSJ claims, Hudson’s Bay Oil andGas Co. Ltd. British Columbia Ministry of Energy and Mines assessment report05208
Hunter, S.J., 1966. Howson Basin property, Telkwa River area, British Columbia. Reportfor Norcan Mines Ltd.
2009b. Technical report on the El Toro Project, Telkwa, British Columbia. Reportfor Lions Gate Energy Inc.
Kikuchi, T., 1985. Geophysical and geochemical report for the Dominion East showing,Deny claims. British Columbia Ministry of Energy and Mines assessment report13191.
1981. Geophysical report on a magnetic and electromagnetic survey on theCopper and Loring Creek Groups, Telkwa area. Report for Mecca MineralsLimited. British Columbia Ministry of Energy and Mines assessment report10043.
1969. Preliminary geological report on the Starr Creek property. Report forTelkwa Mountain Mines Ltd. British Columbia Ministry of Energy and Minesassessment report 02449.
Jamieson, M.D., 1991a. Geological and geochemical sampling report on the Rainbowclaims. Report by Taiga Consultants Ltd. for Skeena Resources Limited. BritishColumbia Ministry of Energy and Mines assessment report 21765.
1991b. Geological and geochemical sampling report on the Royal 1 and 2 claims.Report by Taiga Consultants Ltd. for Skeena Resources Limited. BritishColumbia Ministry of Energy and Mines assessment report 21722.
Kenyon, J.M., 1980. Geological Summary Report of Webster 1 and 2 mineral claims.B.C. Report for Redfern Resources Ltd. Assessment report 08444.

57
Maclntyre, D.G., Desjardins, P. and Tercier, P., 1989. Jurassic stratigraphicrelationships in the Babine and Telkwa Ranges (93L/10, 11, 14, 15). In BritishColumbia Ministry of Energy and Mines and Petroleum Resources GeologicalFieldwork 1988, Paper 1989-1, pp 195-208.
Mallen, Neil D., 2007. Report on 2007 Aerotem survey. Report for Lions Gate EnergyInc. British Columbia Ministry of Energy and Mines assessment report 29456.
Mark, D. G., 2014b. Exploration report on IP and resistivity surveys and an MMI soilsampling survey within the El Toro Project, Howson Creek, Smithers area.Report for Lions Gate Energy Inc. British Columbia Ministry of Energy and Minesassessment report 35000.
2014a. Exploration report on a magnetic survey within the El Toro Project,Howson Creek, Smithers area. Report for Lions Gate Energy Inc. BritishColumbia Ministry of Energy and Mines assessment report 34445.
2012. Exploration report on magnetic, VLF-EM, and tree bark sampling surveyswithin the El Toro Project, Howson Creek, Smithers area. Report for Lions GateEnergy Inc. British Columbia Ministry of Energy and Mines assessment report33275.
1980. Geophysical report on a magnetic survey Copper Claim Group Crater Lakearea B.C. Report for Mecca Minerals Ltd. British Columbia Ministry of Energy andMines assessment report 08624B.
McAndrew, J. P., 1974a. Geological assessment report on Houston Tommy property -Pete claims. Report for Maharaja Minerals Ltd. British Columbia Ministry ofEnergy and Mines assessment report 04891.
1974b. Geological assessment report on Houston Tommy property - Rudyclaims. Report for Maharaja Minerals Ltd. British Columbia Ministry of Energyand Mines assessment report 04890.
McAndrew, J. P., Biss, R., Miskovlc, E. and Cullen, R., 1973. Geological assessmentreport on the Marmot Group claims, Crater Lake area. Report for MaharajaMinerals Ltd. British Columbia Ministry of Energy and Mines assessment report04811.
McAndrew, J. P., Biss, R. and Miskovlc, E., 1973. Geological assessment report on theMarmot Group claims, Slump Block area. Report for Maharaja Minerals Ltd.British Columbia Ministry of Energy and Mines assessment report 04831.
Pacific Geochemical Services Ltd., 1970. Geochemical, geological and geophysicalreport on the Loljuh Creek property. Report for Summit Oils Ltd. BCMEMPRassessment report 02292.
Panteleyev, A., 1996. Epithermal Au-Ag: low sulphidation. In Selected British ColumbiaMineral Deposit Profiles, Volume 2 - Metallic Deposits, Lefebure, D.V. and Hõy,

58
T, Editors, British Columbia Ministry of Employment and Investment, Open File1996-13, pages 41-44.
1995a. Porphyry CuMoAu, in Selected British Columbia Mineral DepositProfiles, Volume 1 - Metallic and Coal, Lefebure, D.V. and Ray, G.E., editors,British Columbia Ministry of Employment and Investment, Open File 1995-20, pp87-92.
1995b. Subvolcanic Cu-Au-Ag (As, Sb) in Selected British Columbia MineralDeposit Profiles, Volume 1 - Metallic and Coal, Lefebure, D.V. and Ray, G.E.,editors, British Columbia Ministry of Employment and Investment, Open File1995-20, pp 79-82.
Pardoe, A.J., 1988. Geological and geochemical report on the Sun claim. Report byCun Management Group Inc. for Geostar Mining Corporation. British ColumbiaMinistry of Energy and Mines assessment report 17977.
Pautler, J. M., 2010. Geological and geochemical assessment report on the El ToroProject. Report for Lions Gate Energy Inc. British Columbia Ministry of Energyand Mines assessment report 31515.
2009c. Geophysical assessment report on the El Toro Project Telkwa, BritishColumbia. Report for Lions Gate Energy Inc. British Columbia Ministry of Energyand Mines assessment report 30982.
2009b. Technical report on the El Toro Project, Telkwa, British Columbia. NI 43-101 report for Lions Gate Energy Inc.
2009a. Geological and geochemical assessment report on the El Toro Project.Report for Lions Gate Energy Inc. British Columbia Ministry of Energy and Minesassessment report 30731.
Pauwels, A. M., 1991. Geochemical report MSJ 1-4 mineral claims. Report for ComincoLimited. British Columbia Ministry of Energy and Mines assessment report22058.
Pozza and Garrie, 2007. Report on a helicopter-borne AeroTEM electromagnetic andmagnetic survey, Aeroquest Job # 08 034, El Toro Project, Smithers area, BritishColumbia, NTS 93L 06, 11. Report for Lions Gate Energy Inc. by AeroquestSurveys.
Preto, V.A.G., 1967, Joker, PR, SQ. In British Columbia Department of Mines andPetroleum Resources Annual Report 1967, pp.91-95.
Price, B.J., 1983. Brief geological report, Duchess 1 and 2 mineral claims. Report forJoyce Lee Warren. British Columbia Ministry of Energy and Mines assessmentreport 12135.
Reid, R.E., 1974. Lunlik claim group, diamond drill report. Report for GrangesExploration. British Columbia Ministry of Energy and Mines assessment report05094.

59
Richards, T.A. and Tipper, H.W., 1976. Smithers Map sheet, 93L; Geological Survey ofCanada, Open File 351.
Rutherford, J.A., 1983. Report on a geophysical and geochemical survey Crater LakeClaim Group. Report for Mecca Minerals Limited. British Columbia Ministry ofEnergy and Mines assessment report 11903.
1981. Geophysical report on a magnetic and electromagnetic survey on the DenyClaim Group (Dominion Basin) Houston-Telkwa Area. Report for Mecca MineralsLimited. British Columbia Ministry of Energy and Mines assessment report10011.
Schmidt, A. J., P. Eng., 1989. Geochemical report MSJ 1-4 mineral claims. BritishColumbia Ministry of Energy and Mines assessment report 19493.
Sharp, W. M., P. Eng., 1970. Interim geological report Santa Maria - War Eagleexploration. Report for Pathfinder Resources Limited. British Columbia Ministry ofEnergy and Mines assessment report 03485.
Stevenson, W. G., 1970. Geological, geochemical and geophysical report on the Joeclaims. Lobell Mines Ltd. BCMEMPR Assessment Report 02893.
1966. Preliminary geological report Howson Basin. Report for Norcan Mines Ltd.British Columbia Ministry of Energy and Mines assessment report 00929.
Sutherland Brown, A., 1967. Fog, Fly. In British Columbia Minister of Mines AnnualReport 1967. p 97-100.
Tompson, W.D., 1982. Geology of the L. E. claims Hunter Basin area. Report for LloydGething and Emerson Berndt. British Columbia Ministry of Energy and Minesassessment report 10918.
1967. Exploration of Howson Creek, area, Telkwa Range, British Columbia.Report for Norcan Mines Ltd.
Tipper, H.W. and Richards, T.A., 1976. Jurassic stratigraphy and history of north centralBritish Columbia Geological Survey of Canada, Bulletin 270.
Watson, I.M., 1968. Norcan property, Howson Basin, area, British Columbia. Report forNorcan Mines Ltd.
White, G.E., 1972. Induced polarization and geochemical report on the Joe claims.Report for Lobell Mines Ltd. BCMEMPR assessment report 03874.
Woolverton, R.W., 1969. A geological, geophysical and geochemical report on the Fog,S.L. and Sherry Groups. British Columbia Assessment Report 01922.
Yin, Jim, 2008. Report on the 2007 exploration program on the El Toro Project. BritishColumbia assessment report 30188.

60
15.0 CERTIFICATE, DATE AND SIGNATURE
1) I, Jean Marie Pautler of 103-108 Elliott Street, Whitehorse, Yukon Territory amself-employed as a consultant geologist, authored and am responsible for thisreport entitled “Initial LiDAR interpretation and integration report on the El ToroProject”, dated June 8, 2015.
2) I am a graduate of Laurentian University, Sudbury, Ontario with an HonoursB.Sc. degree in geology (May, 1980) and 35 years mineral explorationexperience in the North American Cordillera. Pertinent experience includes theacquisition and delineation of the Tsacha epithermal gold deposit, BritishColumbia and the evaluation of various deposit types including porphyry,subvolcanic and redbed copper for Teck Exploration Limited, and drilling theBrenda gold-copper porphyry property in the Kemess Camp for NorthgateExploration Limited.
3) I am a registered member of the Association of Professional Engineers andGeoscientists of British Columbia (APEGBC Registration Number 19804).
4) I have visited the subject mining property of this report and am a “QualifiedPerson”in the context of and have read and understand National Instrument 43-101 and the Companion Policy to NI 43-101.
5) This report is based upon work conducted on the project area betweenNovember 5 and 18, 2014, and a review of pertinent data.
6) As stated in this report, in my professional opinion the property is of potentialmerit and further exploration work is justified.
7) As of the date of this report I am not aware of material facts that are not reflectedin this report by written inclusion or reference.
8) I do not have any agreement, arrangement or understanding with Lions GateEnergy Inc. and any affiliated company to be or become an insider, associate oremployee.
9) I do not own securities in Lions Gate Energy Inc. and my professionalrelationship with Lions Gate Energy Inc. is at arm’s length as an independentconsultant, and I have no expectation that the relationship will change.
Dated at Whitehorse, Yukon Territory this 8th day of June, 2015.
“Signed and Sealed”
_______________________
Jean Pautler, P.Geo. (APEGBC Reg. No. 19804)JP Exploration Services Inc.#103-108 Elliott StWhitehorse, Yukon Y1A 6C4
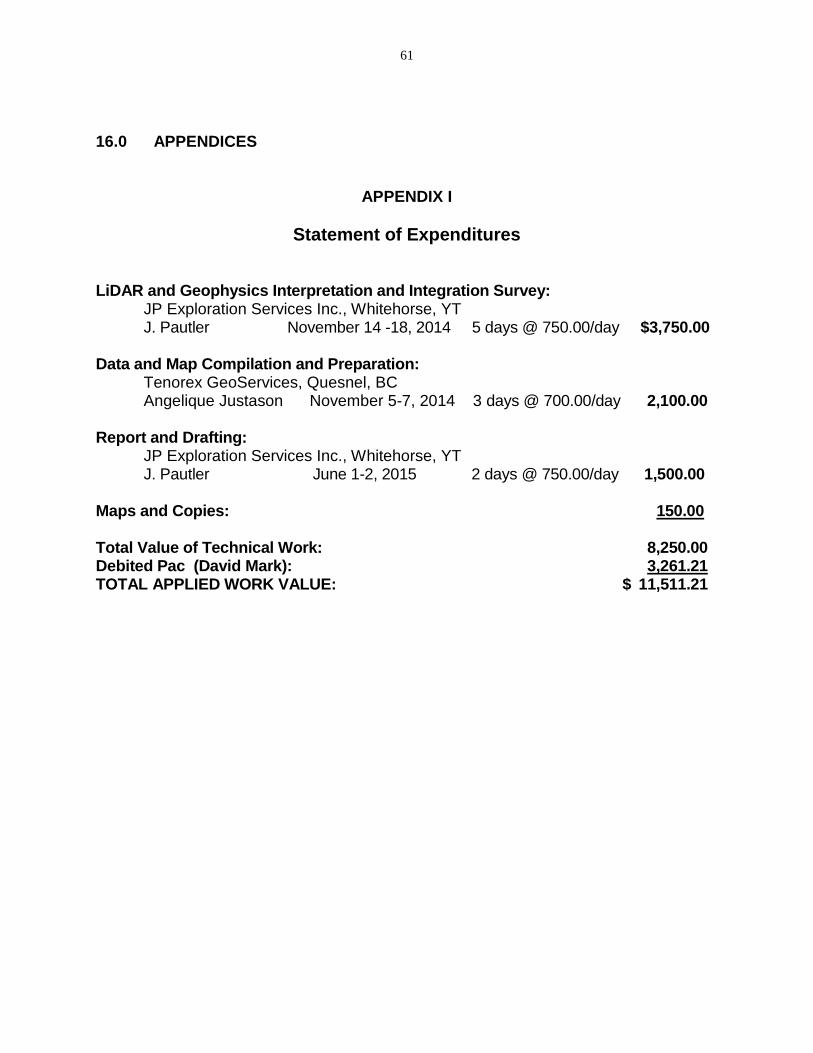
61
16.0 APPENDICES
APPENDIX I
Statement of Expenditures
LiDAR and Geophysics Interpretation and Integration Survey:JP Exploration Services Inc., Whitehorse, YTJ. Pautler November 14 -18, 2014 5 days @ 750.00/day $3,750.00
Data and Map Compilation and Preparation:Tenorex GeoServices, Quesnel, BCAngelique Justason November 5-7, 2014 3 days @ 700.00/day 2,100.00
Report and Drafting:JP Exploration Services Inc., Whitehorse, YTJ. Pautler June 1-2, 2015 2 days @ 750.00/day 1,500.00
Maps and Copies: 150.00
Total Value of Technical Work: 8,250.00Debited Pac (David Mark): 3,261.21TOTAL APPLIED WORK VALUE: $ 11,511.21


![Introduction - wiki.math.ntnu.no · Physics Tools to Reduce Interpretation Risk. Cambridge University Press. Buland, A. and Omre, H. [2003] Bayesian linearized AVO inversion. Geophysics,](https://img.pdfslide.net/doc/110x75/5f15886d7af4bc0c9c1c6f48/introduction-wikimathntnuno-physics-tools-to-reduce-interpretation-risk-cambridge.jpg)