Embed Size (px)
Citation preview
e'Je'" Vol. 16 No. I. pp. 27-43 (2008) ISSN 1823-4445
Initial Performance of IPOs listed on MESDAQ
Othman Y ong* Universiti Kebangsaan Malaysia
•. ,,---: T1w> paper examines the initial performance and bandwagon effect of all 93 IPOs • lESDAQ from the time of its merging with KLSE in April 2002 to December
b the first in-depth study of the performance of IPOs listed on MESDAQ; past ru-.ed ei ther on the Main Board or the Second Board of Bursa Malaysia. Detailed
initial returns is made on the basis of type of offer, investor demand, issuing e of offer. and sector classification. The average initial return (offer-to-open) is
- per cent and the average initial return (offer-to-close) is 43 .29 per cent. The average =r--"l:m...cnption ratio is 53.14 times, a figure higher than reported by earlier studies on
the ~fain Board or the Second Board of Bursa Malaysia. There is a significant , ..... "' ..... PIV .... between the average initial return of the offer for sale and that of public issue. In
public issue is more under-priced than the offer for sale. Overall, the higher the ,::!i;i::r~;un"':Tiptio n ratio, the higher is the initial return . However, even though the average ~ of public issue is significantly higher than the average initial return of offer for
\erage over-subscription ratio of public issue is somewhat significantly lower than ~ .. ge over-subscription ratio of offer for sale. Finally, this study finds that there is no ~on effect, that is, the high demand for an IPO (as represented by the over-subscription
d Je not result in a high increase in price from the opening to the closing.
• ords: Initia l public offering, Malaysian IPOs, bandwagon effect
classification: G12. G14, G24 and G32 .
. rence of under-pricing for new issues of stocks or initial public offerings (IPOs) is ocumented in the literature, especially in the developed equity markets . A hen ive review of research on IPOs carried out in developed markets can be found
(2003) and quite recently in Yong (2007) for IPO research in Asia. There have number of explanations for the under-pricing phenomenon in IPOs, such as the
r' curse, prospect theory, lawsuit avoidance, and informational cascades (or agon effect). The availability of data on the opening price and the closing price
- :: the first day of listing of the IPOs, enables us to examine the issue of bandwagon eel in the IPOs listed on MESDAQ. Welch (1992) argues that if an investor pays
rion not only to hi s own information about an IPO, but also to other investors who -gin be buying the IPO, the bandwagon effect can develop because the investor is not
ing to buy even though he possesses favorable information about the IPO when he . other investors not buying. In order to induce the first few potential buyers, and later u e a cascade in which all subsequent investors would want to buy, irrespective of iT information, the issuer has got to under-price the IPO. This is also true in the case
• Faculty of Economics and Business, Universiti Kebangsaan Malaysia, 43600 UKM, Bangi, Selangor, Malays ia
Capital Markets Review Vol.l6 No. I, 2008 27
Othman Yong
when the investor is willing to purchase an IPO when he sees other investors are buying even-though his own information indicates that the IPO is not favorable.
In the 1980s, the Benveniste and Spindt (1989) dynamic information acquisition and Rock's (1986) winner's curse models were considered appropriate in explaining the underpricing phenomenon. In the I 990s, behavioural and agency explanations of under-pricing were considered more appropriate in explaining the under-pricing in IPOs. Quite recently, Denien (2005) examined the impact of investor sentiment on IPO pricing.
In Malaysia. recent studies on the under-pricing phenomenon of Malaysian IPOs are mostly focused on the relationship between the initial performance of IPOs and certain relevant factors!characteristics of IPOs. Examples of such studies are those by Dawson (1995) (on types of offer) , Yong (1996) (on firm size and over-subscription ratio), Paudyal et al. (I 998)(on privatisation IPOs versus otherIPOs), Jelic ef al. (2001) (on underwriters ' reputation), Yong and Isa (2003) (on variables that can explain the levels of IPO underpricing), and Saadouni ef al. (2005) (on proportion of IPO shares allocated to Bumiputra investors and on the change in regulation in 1996 towards a market-based pricing mechanism). None of these studies examine the explanations used in the developed markets that describe the under-pricing phenomenon in the IPOs . The current study looks at the issue of bandwagon effect as a possible explanation for the under-pricing ofIPOs listed on MESDAQ.
All of the studies on Malaysian IPOs cited earlier deal with either the TPOs listed on the Main Board of the Kuala Lumpur Stock Exchange (KLSE) or the ones listed on the Second Board of the KLSE or both. None covers exclusively the IPOS listed on the newly established board called MESDAQ. MESDAQ stands for Malaysian Exchange of Securities Dealing and Automated Quotation Berhad which commenced trading in April 1999, independent of the more established KLSE. MESDAQ was established with the objective of catering for the needs of the so-called high-growth and technology companies which are usually lacking in track records, small in size (as compared to those companies listed on the Second Board and the Main Board of the KLSE) and having difficulty in securing conventional sources of financing. The MESDAQ was later merged with the KLSE in April 2002 in order to improve its operation and at the same time improve its image or acceptance within the investing public in Malaysia. This study is an attempt to fill this void, by studying in detail the performance of IPOs listed on MESDAQ since its inception (or more appropriately its merging with the KLSE) in 2002. In addition, this study can add to our understanding of the performance of technology stocks in Malaysia. which are perceived to be very risky or volatile by investors. Furthermore, since IPOs listed on MESDAQ are relatively smaller in size in comparison to their counterparts listed on the Main Board and the Second Board of the KLSE, we can also study the issue of size effect which suggests that smaller companies should produce higher initial returns due to their perceived higher risk compared to larger companies. The data used in this study begins in April 2002 in order to be consistent with the merging of MESDAQ with the KLSE.
This remainder of this paper is organised as follows. Review of past studies is presented in the next section, followed by the section on data and methodology. It is then followed by the section on empirical results. The last section summarises, concludes, and offers implications of the study.
28 Capital Markets Review Vol. 16 No. I. 2008
]mllal Performance of [POs listed on MESDAQ
Past Studies a large body of literature has developed in documenting the returns earned
mitia! public offerings (IPOs). A comprehensive review on early studies in Ibbotson and Ritter (1995). Early studies (examples are Reilly and
: • "euberger and Hammond (1974); Bear and Curly (1975); Ibbotson _ (977); Block and Stanley (1980); Baron (1982); Rock (1986); Chalk and
-. WIer and Reilly (1987); Allen and Faulhaber (1989); Grinblatt and Hwang e ch \ 1989») all report the under-pricing phenomenon with the IPOs. In the
arried out by Chemmanur (1993), BaITY and Jennings (1993), Hanley and . Booth and Chua (1996), Dunbar (1997), and Chaney and Lewis (1998) ,
tbeame phenomenon with the IPOs. Quite recently, Purnanandam and 200t) examined the pricing ofIPOs using comparable firms, and found, on have an offer price 50 per cent higher than predicted on the basis of industry
eo 12005) examined the impact of investor sentiment on IPO pricing. _ e planations such as the Rock's (1986) winner's curse model, lawsuit avoidance
~~~,,'" by fbbotson (1975) and Tinic (1988), prospect theory, and informational bandwagon effect), to name a few, have been offered in an attempt to explain
-pricing phenomenon. Since this study examines the issue of bandwagon effect on MESDAQ, a brief explanation of the bandwagon effect is given here.
1992 I argues that if a potential investor pays attention not only to his own .a&:o2iion about an IPO but also to whether or not other investors are purchasing the IPO,
·.....,....,..,,'.,,~ .. on effect (or information cascades) may develop. This is due to investor ",",",-__ ,=,U",,'" to purchase even though he possesses favorable information about the IPO
_ investors do not purchase. This is also true in the case when the investor is purchase an IPO when he sees other investors are buying even though his own
.JItj:C::2icn indicates that the IPO is not favourable. Welch further argues that in order to fir t few potential buyers, and later induce a cascade in which all subsequent
.Jn~nI"S .:ant to buy ilTespective of their infolTl1ation, the issuer has to under-price the
relative importance of these different explanations has also changed over time. ~ ample, in the 1980s, the Benveniste and Spindt (1989) dynamic information
-lioo and Rock's winner's curse models were accepted as proper explanation for the -pricing. However, in the 1990s, behavioural and agency explanations of under-:: were considered better in explaining the under-pricing. Quite recently, DelTien
- examined the impact of investor sentiment on IPO pricing, using a model in which after-market price of IPO shares depends on the infolTl1ation about the intrinsic value
company and the investor sentiment. DelTien found that IPOs can be over-priced illIl exhibit positive initial return. Baron (1982), Rock (1986), Beatty and Ritter (1986), Beatty (1989) and Levis (1990)
te the under-pricing to a group of infolTl1ed investors possessing superior infolTl1ation C'OIlIIDare,d to those who are uninfolTl1ed. This asymmetric infolTl1ation between the two
is hypothesised to lead the uninfolTl1ed investors to buy more over-priced issues . Ie s under-priced issues. Realising the situation, uninfolTl1ed investors will stay out of
Capital Markets Review Vo1.l6 No. I , 2008 29
Othman Yong
the new issues market. In order to ensure the issues are fully subscribed, the new issues will be discounted to attract the uninformed investors to buy the issues.
Ibbotson (1975) and Tinic (1988) suggest that under-pricing is due to the issuing firms purposely under-pricing their new issues in order to avoid lawsuits by unhappy subscribers in the event the new issues do not appreciate in value when they are traded in the secondary market. Grinblatt and Hwang (1989), Welch (1989) , Allen and Faulhaber (1989), and Chemmanur (1993), suggest that asymmetric information between groups of infornled and uninformed investors causes quality firms to signal their quality by underpricing the IPOs. They hope that in so doing, they are able to raise capital under better terms in the future. Booth and Chua (1996) suggest that issuer' s demand for ownership dispersion creates an incentive to under-price the new issues.
In contrast to the traditional explanation of IPO under-pricing mentioned earlier, there are those who try to explain this phenomenon differently , based on a unique characteristic/factors in non US equity markets. Pettway and Kaneko (1996), using Japanese IPO data, examined the effect of public policies (that change the IPOs pricing regimes) on the level of initial returns. They discovered that removing price limits and introducing public auctions can reduce the level of initial returns significantly. Choi and Nam (1998), using a sample of 185 privatisation IPOs from 30 countries for the period from 1981 to 1997, suggest that there is a general tendency for privatisations to be under-priced more than the IPOs of privately owned companies.
In Malaysia, among the early studies on the initial performance of IPOs are those by Dawson (1987), Yong (1991), Ismail et al. (1993), Loughran et af. (1994), Dawson (1994), and Yong (1997). Dawson (1987), using data on 21 Malaysian IPOs from 1978 to 1983, reports an average initial return of 166.7 per cent. Yong (1991) reports an average initial return of 167.4 per cent for the Malaysian IPOs. Dawson (1987) and Yong (1991) independently report an average over-subscription ratio of approximately 46 times. Ismail et al. (1993), using 63 new issues from 1980 to 1989, report an average initial excess return (initial return adjusted for market movement) of 114.6 per cent. Loughran et af. (1994) report an average initial return of80.3 per cent for 132 Malaysian new issues for the period 1980-1991. Dawson (1994) used a revised measure ofIPO under-pricing rather than the usual difference between offer price and market price on the first trading day, and found under-pricing measured from the issuer's viewpoint to be greater than previously reported. Using 224 IPOs from 1990 to 1994, Yong (1997) reported an average initial (offer-to-open) return of 72.85 per cent with the recomputed average initial (offer-toclose) return of 75.03 per cent and an average over-SUbscription ratio of 32.32 times. The study also found a significant positive relationship between the over-subscription ratio and the initial return.
Recent studies on Malaysian IPOs shifted focus to finding out the relationship between the initial performance of IPOs and certain relevant factors/characteristics of IPOs. Examples of such studies are those by Dawson (1995) (on types of IPO offer), Yong (1996) (on firm size and over-subscription ratio), Paudyal et af. (1998) (on prisatisation of IPOs versus other IPOs) , Jelic et af. (2001) (on underwriters ' reputation) , Yong and Isa (2003) (on variables that can explain the levels of IPO under-pricing), and Saadouni et af. (2005) (on proportion of IPO shares allocated to Bumiputra investors and on the change in regulation in 1996 towards a market-based pricing mechanism).
30 Capital Markets Review Vo1.l6 No. I, 2008
Initial Performance of IPOs listed on MESDAQ
1995 ) examined the difference in initial performance between the two of IPO in Malaysia, namely offer for sale and public offer. Dawson (1995) on average, during 1979 through 1993, IPOs involving offer for sale of had less under-pricing and were smaller in offer size than public offer of
:\'evertheless, it was the original shareholders selling shares in offer for sale :n;:nred the greatest loss from LPO under-pricing, 32.5 per cent on average compared
eDt for public offer, while the original shareholders who did not participate in sale incurred no loss at all from the under-pricing.
! af. (1998) studied the performance of privatisation initial public offers 11:> the performance of other initial public offers (IPOs) in Malaysia. The study laJay ian PIPOs offer significantly higher initial returns than other IPOs. This
• complete contrast to what Choi and Nam (1998) found ; privatisation in _.,' .... =-.. ·elds lower initial returns than private IPOs.
- ~ af. (200 1), using data from 1980 to 1995, report that underwriters with a better -:::;1£010 tend. on average, increase initial under-pricing; this contradicts the results
tudies on underwriters ' role in other countries, such as Beatty and Ritter Caner et af. (1998). However, the results of both parametric and non parametric no significant difference between average initial returns of IPOs underwritten
tr;;:mable underwriters and IPOs underwritten by less reputable underwriters. ~""UllJ· et af. (2005), using 322 IPOs listed on the Second Board for the period
. found that under-pricing is inversely related to the proportion of shares _-,"",!oO;U. Bumiputra investors. On average, Bumiputra investors and the Malaysian
a1Iocated almost an equal proportion and make similar profits per issue. However, __ lIiIoo:lI Bumiputra investors appear to be allocated a higher proportion of the over
De than the most under-priced ones. Saadouni et al.(2005) also examind the regulation in 1996 towards a market-based pricing mechanism and its effect on
-pricing of Malaysian IPOs. Saadouni et af. report that the change in regulation .....,.- ..... ,u.;, a market-based pricing mechanism in 1996 has an adverse effect on under-pricing;
h -ted before the change in regulatory environment are significantly less underman those listed after the change.
Yong (1996), using 158 IPOs listed on the Main Board and the Second Board of the E from from January 1990 to December 1993, noted that initial observations seem to
::: I that the larger the firm size, the lower is the initial return, a phenomenon consistent ·lZe effect, but, statistically speaking, this is not significant. Yong et af. (1999) and
:: and Isa (2003) found that over-subscription ratio or investor demand for IPO is a Ie that consistently explains the levels of initial return of Malaysian IPOs.
. Data and Methodology =eneral , there tend to be three mechanisms used in IPOs around the world: auctions, ed-priced offers, or book building. The most common mechanism by which IPOs are
around the world has been the book building mechanism. In Malaysia, the most common mechanism is the fixed-price offer. Basically, there are three common types of IPOs in Malaysia, namely: (1) offer for sale; (2) public issue; and (3) a combination of
. Offer for sale refers to shares that have already been issued to the original stockholders, in turn offer their shares for sale to the public. As such, there is no change in the
Cap"ital Markets Review Vo1.l6 No. I, 2008 31
Othman Yan g
company's paid-up capital and the money received from the sale of the stock does not go to the company. Its purpose is to restructure the company ' s ownership distribution in line with the government's rules and regulations. Public issue refers to new shares of stock offered to the public for the first time. Because of this, it results in an increase in the paidup capital of the company concerned.
There are other types of offer such as tender offer, special issue, private placement, restricted offer for sale, restricted public issue, restricted offer for sale to eligible employees, restricted offer for sale to Bumiputera (literally, it means sons-of-the-soil or the natives) investors, special issue to Bumiputera investors and restricted issue to Burniputera investors. The current study excludes companies that undertook anyone of these types of offer alone (without the three common types of IPO mentioned before). During the period of this study, these types of offer were rarely undertaken in isolation ; they were undertaken together with the offer for sale or public issues or a combination of both. In cases where the issuing company also undertook other types of offer, in addition to the offer for sale and public issue, total units offered excluded the total units from other types of offer, and the same is true for the total proceeds received where the proceeds from other types of offer were not included in the total proceeds received by the company concerned.
The sample used in this study comprises all IPOs listed on MESDAQ since its merge with the KLSE in 2002 until December 2005. The information used in this study was compiled from Investors Digest (a monthly publication of the KLSE), the KLSE website (with the name change of Kuala Lumpur Stock Exchange to Bursa Malaysia from January 2004, the website has been renamed http://www.bursamalaysia. com) and the Star Online website (http://biz.thestar.com.my/marketwatch/ipo). The usable information on IPOs listed on MESDAQ has only been available for analysis since April 2002. Information on over-subscription ratio was compiled from various newspaper reports, as made available on the BiznewsDatabank website (http://www.biznewsdb.com).
Initial return is first calculated as the percentage change in price from the offer price to the opening price of the first day of trading, denoted as initial return (offer-to-open). It is also calculated as the percentage change in price from the offer price to the closing price of the first day of trading, denoted as initial return (offer-to-c1ose). First- day return is also calculated. It is the percentage change from the opening price of the first day of trading to the closing price of that day. A significant positive first-day return indicates the existence of a bandwagon effect; it means that secondary traders can still benefit from the underpricing of IPOs. A significant negative first-day return indicates that the market is overreacted to the pricing of IPOs. Detailed analysis of initial returns was made on the basis of type of offer, over-subscription ratio, issuing house, size of offer, and sector classification.
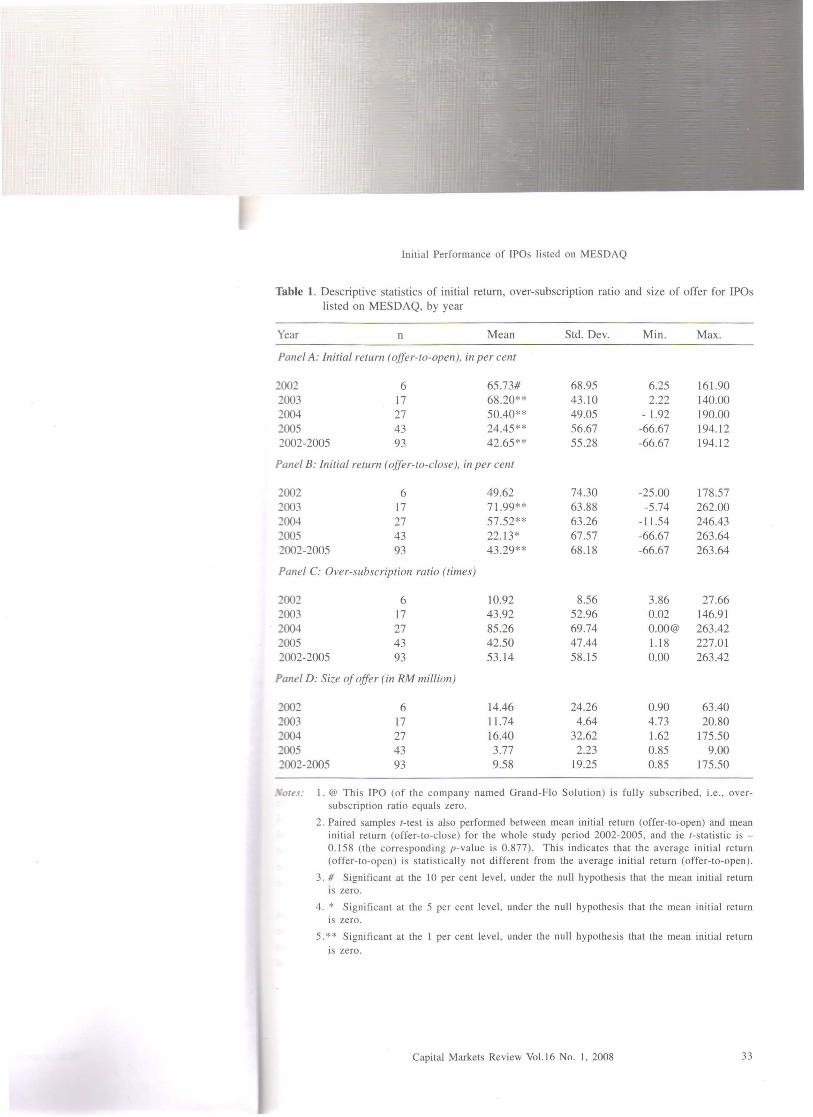
4. Results Table 1 reports the descriptive statistics of initial return, over-subscription ratio and offer size for 93 IPOs listed on MESDAQ from April 2002 to December 2005. Panel A reports the descriptive statistics of initial returns measured as the percentage change in price from the offer price to the opening price of the first day of trading, whilst Panel B presents the summary statistics of the initial returns calculated as the percentage change in price from the offer price to the closing price of the first day's trading. Panel C presents summary
32 Capital Markets Review Vo1.l6 No. I , 2008
Initial Performance of IPQs listed on MESDAQ
Table 1. Descriptive statistics of initial return , over-subscription ratio and size of offer for IPOs listed on MESDAQ, by year
Year n Mean Std. Dev. Min . Max.
Panel A: initial return (offer-to-open), in per cent
1002 6 65.73# 68.95 6.25 161.90 2003 17 68.20** 43.10 2.22 140.00 1004 27 50.40** 49.05 - 1.92 190.00 1005 43 24.45 ** 56.67 -66.67 194.12 1002-2005 93 42.65** 55.28 -66.67 194.12
Panel B: initial return (offer-to-c1ose), in per cent
1002 6 49 .62 74.30 -25.00 178.57 1003 17 71.99** 63.88 -5.74 262.00 1004 27 57.52** 63.26 -11.54 246.43 1005 43 22.13* 67.57 -66.67 263.64 1002-2005 93 43.29** 68.18 -66.67 263.64
Panel C: Over-subscription ratio (times)
1002 6 10.92 8.56 3.86 27.66 1003 17 43 .92 52.96 0.02 146.91 2004 27 85.26 69.74 O.OO@ 263.42 2005 43 42.50 47.44 l.I8 227.01 2002-2005 93 53.14 58.15 0.00 263.42
Panel D: Size of offer (in RM million)
1002 6 14.46 24.26 0.90 63.40 1003 17 11.74 4.64 4.73 20.80 2004 27 16.40 32.62 1.62 175.50 1005 43 3.77 2.23 0.85 9.00 1002-2005 93 9.58 19.25 0.85 175.50
OleS: l. @ Thi s IPQ (of the company named Grand-Flo Solution) is fully subscribed, i.e ., over-subscription ratio equals zero.
2. Paired samples I-test is also performed between mean initial return (offer-to-open) and mean initial return (offer-to-close) for the whole study period 2002-2005, and the I-statistic is -0.15S (the corresponding p-value is O.S77). This indicates that the average initial return (offer-to-open) is statistically not different from the average initial return (offer-to-open).
3 . # Significant at the 10 per cent level, under the null hypothesis that the mean initial return is zero.
4. * Significant at the 5 per cent level , under the null hypothesis that the mean initial return is zero .
5 . * * Significant at the I per cent level , under the null hypothesis that the mean initial return is zero.
Capital Markets Review Vol.16 No. I , 200S 33
Othman Yong
statistics of the over-subscription ratio, and finally Panel D reports the summary statistics for the offer size.
The highest average initial return (offer-to-open) of 68.20 per cent is registered in 2003, and the lowest average of 24.45 is registered in 2005. For initial return (offer-toclose), the highest average of 71.99 per cent is also registered in 2003 as in the case of the average initial return (offer-to-open), and the lowest average of 22.13 is also registered in 2005 as in the case of the average initial return (offer-to-open). The highest number of !pas is registered in 2005 with a total of 43 !pas; and the lowest number of 6 is registered in 2002. Overall, there has been an increase in the number of IPOs issued from year to year, since 2002.
All annual average initial returns (offer-to-open), with the exception of year 2002, are significantly different from zero at the 1 per cent level. Average initial returns (open-toclose) are significantly different from zero at the 1 per cent level in year 2003 and year 2004; in year 2005, the average initial return is significant at 5 per cent level, and in year 2002, the average initial return is not significantly different from zero even at the 10 per cent level. In year 2003 and year 2004, the average initial returns (offer-to-close) are higher than their corresponding average initial returns (offer-to-open), whereas ,for year 2002 and year 2005, the average initial returns (offer-to-close) are lower than their corresponding average initial returns (offer-to-open). Overall, for the entire period April 2002-December 2005, the average initial return (offer-to-open) is 42.65 per cent and the average initial return (offer-to-close) is 43.29 per cent, and they are both significantly different from zero at the 1 per cent level. Statistically speaking (as discussed in Note 2 of Table 1), these average figures are not significantly different (t-value of -0.158 with its corresponding p-value of 0.877) from each other at the 5 per cent level , and this means that the benefits of under-pricing do not accrue to the secondary market traders . In other words, there is no bandwagon effect in the !pas listed on MESDAQ.
As shown in Panel C, the average over-subscription ratio for the period 2002-2005 is 53.14 times, with the minimum over-subscription ratio of zero (meaning fully subscribed) registered in 2004 and the maximum over-subscription ratio of 263.42 times, also in 2004. The lowest average over-subscription ratio of 10.92 times is registered in 2002, and the highest average over-subscription ratio of 85.26 times is registered in 2004. For comparison, Dawson (1987) and Yong (1991) both independently report an average over-subscription ratio of 46 times for IPOs listed on the Main Board of the Kuala Lumpur Stock Exchange (KLSE). Yong (1997) reports an average over-subscription ratio of 32.32 times for 224 !pas listed on the Main Board and the Second Board of the KLSE for the 1990-1994 period. Yong and Isa (2003) report, for the 1990-1998 period, an average over-subscription ratio of 29.87 times for 179 !pas listed on the Main Board, and they report an average over-subscription ratio of 52.46 times for 283 IPOs listed on the Second Board of the KLSE.
Panel D presents the average size of !pas offered for each year, of the 2002-2004 period. For the entire 2002-2005 period, the average size is RM9.58 million with the minimum size of RMO.85 million in 2005 and the maximum size of RM175 million in 2004. The smallest average size of RM3.77million is registered in 2005, and the biggest average size of RM16.40 million is registered in 2004.
34 Capital Markets Review Vo1.l6 No. I, 2008
I '
Initial Performance of IPOs listed on MESDAQ
Table 2. Average initial returns for the period 2002-2004 based on the type of offer, over-subscription ratio, issuing house, offer size, and the sector classification
Average Average Result of paired-initial return initial return samples t-test@
offer-to-open) ( offer-to-close n (%) (%) t-statistic p-value
Panel A: Type of offer
Offer for Sale 70 34.46 35.78 -0.273 0.786 Public Issue 23 67.55 66.15 0.168 0.868
Results of independent I-statistic = -2.565* t-statistic = -1.879 t-test@@ (p-value = 0.012) (p-value = 0.063)
Panel B: Over-subscription ratio(times)
Less than 10 26 24.56 27.23 -0.455 0.653 JO to less than 40 23 31.31 20.58 2.508* 0.020 40 to less than 80 23 45.41 53.87 -0.784 0.442 80 and more 21 74.43 76.47 -0.181 0.858
Results of F-value = 3.927* F-value = 3.425* F-test@@@ (p-value = 0.011) (p-value = 0.021)
Panel C: Issuing house
MIDFCCS 24 49.32 58.99 -0.938 0.358 MIH 69 40.32 37.83 0.578 0.565
Results of independent t-statistic = 0.685 t-statistic = 1.314 t-test@@ (p-value = 0.495) (p-value = 0.192)
Panel D: Offer size (RM million)
Less than 2.5 22 45.69 53.26 -0.557 0.584 2.5 to < 5.5 21 27.45 23.24 0.611 0.548 5 to < 10 25 41.54 36.22 1.091 0.286 10 and more 25 53.84 58.43 -0.703 0.489
Results of F-value = 0.894 F-value = 1.274 F-test@@@ p-value = 0.448) (p-value = 0.288)
Panel E: Sector classification
Finance 2 2.16 -18.27 1.889 0.310 Industrial Product 17 50.14 38.19 1.474 0.160 Trading/Services 18 60.08 71.84 -0.959 0.351 Technology 56 36.21 37.87 -0.329 0.744
Result of F-value = 1.326 F-value = 1.790 F-test@@@@ (p-value = 0.271) (p-value = 0.155)
.... Oles: I. @ Paired samples I-test between average initial return (offer-to-open) and average initial return (offer-to-close) .
2. @@ Independent I-test between two groups .
3. @@@ F-test among the groups.
4. * Significant at the 5 per cent level.
Capital Markets Review Vo1.l6 No. I, 2008 35
J j t ..
Othman Yong
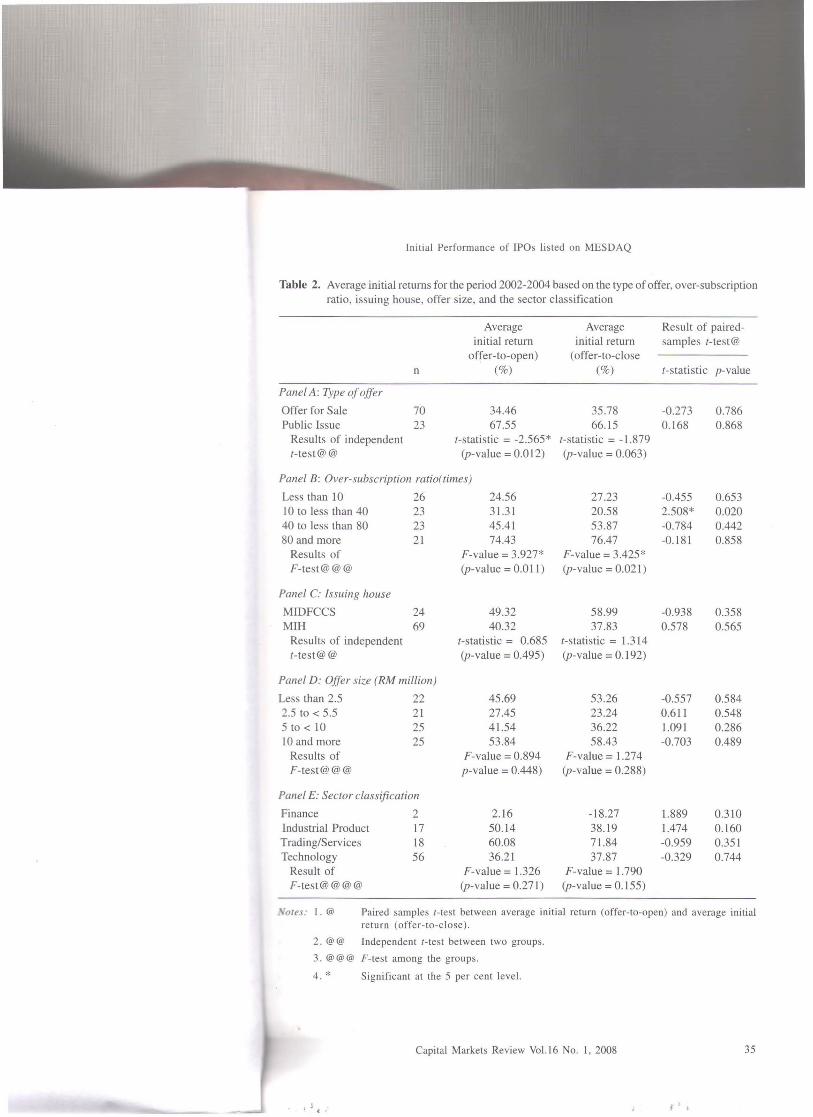
Table 2 presents the detailed analysis of the average initial returns for the period 2002-2005 based on type of offer, over-subscription ratio, the issuing house, size of offer, and classification of sector. As shown in Panel A, offer for sale contributes 70 of the 93 IPOs issued for the period, with an average initial return (offer-to-open) of 34.46 per cent and a slight increase in its corresponding average initial return (offer-to-close) of 35.78 per cent. As indicated by the results (t-statistic = -0.273 and the corresponding p-value = 0.786) of the paired-samples t-test, the slight increase in the average initial return is not significant, even at the 5 per cent level. However, in the case of public issue, there is a slight decrease from initial return (offer-to-open) of 67.55 per cent to initial return (offerto-close) of 66.15 per cent. Again, this slight decrease is also not significant, even at the 5 per cent level, as indicated by the t-statistic of 0.168 and its corresponding p-value of 0.868. However, when comparison is made based on the type of offer, there is a significant difference (at the 5 per cent level) between the average initial return (offer-to-open) of 34.46 per cent for the offer for sale and the average of 67 .55 per cent for the public issue. When the comparison is made for the initial return (offer-to-close), the significance degree is somewhat lessened (p-value of 0.063 compared to the p-value for the initial return (offer-to-open) of 0.0 12). In general, this finding indicates that public issue is more underpriced than the offer for sale, resulting in its higher return. For comparison, Yong and Isa (2003) reported an average initial return (offer-to-open), for the period 1990-1998, of 82.71 per cent for offer for sale (n=95), and 78.16 per cent for public issue (n=45) listed on the Main Board of the KLSE. For the Second Board, they reported an average initial return (offer-to-open), of 99.79 per cent for offer for sale (n=I77), and 139.74 per cent for public issue (n=31).
Panel B of Table 2 presents the initial returns based on the over-subscription ratios. When comparison is made between the initial return (offer-to-open) and the initial return (offer-to-close), there seems to be a slight increase (though not significant even at the 5 per cent level) from the initial return (offer-to-open) to the initial return (offer-to-close) in all groups, except for the group with over-subscription ratios of 10 to 40 times. For this group, there is a significant decrease (significant at the 5 per cent level as indicated by the t-statistic of 2.508 and its corresponding p-value of 0.020) from the average initial return (offer-to-open) of 3l.31 per cent to the average initial return (offer-to-close) of 20.58 per cent.
In the case of initial return (offer-to-open), the initial return seems to increase with the increase in the over-subscription ratio. The group with the lowest over-subscription ratios (less than 10 times) registers the lowest average initial return of 24.56 per cent, and the highest average initial return of 74.43 per cent is registered by the group with the highest over-subscription ratios (80 times and more). As indicated by the F-value of 3.927 (pvalue of 0.011), the difference in the average initial returns among groups, based on the over-subscription ratios, is significant (at the 5 per cent level). This means that the higher the over-subscription ratio, the higher is the initial return. Yong (1997) also reports a similar pattern (that is, the average initial return (offer-to-open) is the lowest for the group with the lowest over-subscription ratios, and the group with the highest over-subscription ratios exhibits the highest average initial return) with 224 IPOs listed on the Main Board and the Second Board of the KLSE from January 1990 to December 1994.
36 Capital Markets Review Vol.l6 No. I , 2008
Initial Performance of IPOs listed on MESDAQ
In the case of initial return (offer-to-c1ose), except for the second group (oversubscription ratios of 10 to 40 times), the initial return also seems to increase with the increase in the over-subscription ratio. The second group registers the lowest average initial return of 20.58 per cent, and the group with the highest over-subscription ratios (80 times and more) registers the highest average initial return of76.47 per cent. As in the case of initial return (offer-to-open), the F-value of 3.425 (p-value of 0.021) indicates that difference in the average initial returns among groups, based on the over-subscription ratios, is also significant (at the 5 per cent level).
Panel C shows the average initial return according to the issuing house. MIH issued 69 IPOs, whereas MIDFCCS issued only 24 IPOs even though MIH is younger in age compared to the older and more established MIDFCCS. Overall, the results of the t-test indicate that the average initial return between the two issuing houses is not significantly different from each other, and there is no significant increase or decrease from the average initial return (offer-to-open) to the average initial return (offer-to-c1ose).
Panel D presents the average initial return according to offer size (in RM million). Overall, the results of the t-test indicate that there is no significant increase or decrease from the average initial return (offer-to-open) to the average initial return (offer-to-c1ose) for all groups of offer size. Furthermore, the results of the F-test indicate that the difference in average initial returns among groups, based on the offer size, is not significant.
Panel E presents the average initial return according to sector classification of the IPOs. Overall , the results of the (-test indicate that there is no significant increase or decrease from the average initial return (offer-to-open) to the average initial return (offerto-close) for all groups of offer size. Furthermore, the results of the F-test indicate that the difference in average initial returns among groups, based on the sector classification, is not significant. Panel E also presents an interesting result. In the Finance sector, even though there are only two IPOs, the average initial return (offer-to-open) of 2.16 per cent is very low compared to IPOs in other sectors. In fact, the average initial return declines further to -18.27 per cent when measured as average initial return (offer-to-c1ose).
To further investigate the possible connection between the type of offer and the over-subscription ratio, over-subscription ratios are analysed according to type of offer as shown in Table 3. Public issue is offered only in 2002 and 2003, whereas offer for sale is offered only in 2004 and 2005. For the period of 2002-2005, there were 70 offers for sale with an average over-subscription ratio of 59.00 times, and there were 23 public issues with an average over-subscription ratio of 35.31 times. Overall, the average oversubscription ratio of public issue is significant (t-statistic = -1.712 with the corresponding p-value = 0.090) lower than the average over-subscription ratio of offer for sale, at the 10 per cent level.
In 2002, there were 6 public issues with an average over-subscription ratio of 10.92 times, but in 2003 the number of public issues increased to 17 with an average oversubscription ratio of 43.92 times, a substantial and significant (t-statistic = 2.479 with the corresponding p-value = 0.023) increase from the previous year. In 2004, there were 27 offers for sale with an average over-subscription ratio of 85.26 times, and in 2005 the number of public issues increased to 43 but the average over-subscription ratio decreased to 42.50 times, a very significant (t-statistic = -3.055 with the corresponding p-value = 0.003) decrease from the previous year.
Capital Markets Review Vol. 16 No. I, 2008 37

Othman Yong
Table 3. Average over-subscription ratio according to type of offer, by year
Year
Panel A: Offer Jar sale 2002 2003 2004 2005 2002-2005
Panel B: Public issue 2002 2003 2004 2005 2002-2005
Panel C: Results oJindependen( t-tes( Between offer for sale and public issue@ Between offer for sale in 2004 and 2005 @@ Between public issue in 2002 and 2003 @@@
n
o o 27 43 70
6 17 o o 23
Average over-subscription
ratio (ti mes)
85.26 42.50 59.00
10.92 43.92
35.31
(-statistic = -1.712; p-value = 0.090 (-statistic = -3.055; p-value = 0.003 (-statistic = 2.479; p-value = 0.023
Noles: I . @ Independent I-test (using pooled variance estimate) between average over-subscription ratio of offer for sale and average over-subscription ratio of public issue, for the overall period of 2002-2205 .
2 . @@ Independent I-test (using pooled variance estimate) between average over-subscription ratio of offer for sale in 2004 and average over-subscription ratio of offer for sale in 2005.
3. @@@ Independent I-test (using separate variance estimate) between average over-subscription ratio of public issue in 2002 and average over-subscription ratio of public issue in 2003.
When the results shown in Panel A of Table 2 are combined with the results shown in Table 3, there is one peculiar observation that can be made. Though the average initial return of public issue (offer-to-open) is significantly (at the 5 per cent level) higher than the average initial return of offer for sale, the average over-subscription ratio of public issue is somewhat significantly (at the 10 per cent level) lower than the average oversubscription ratio of offer for sale. This seems to indicate that there is an inverse relationship between the demand (as represented by the over-subscription ratio) for an IPO and its performance (as represented by the initial return), something that is the opposite of the results shown in Panel B of Table 2.
To investigate the possible connection between the demand for an IPO and the bandwagon effect, the price change from the opening price to the closing price during the first day of trading is analysed, and the results are presented in Table 4. Though our interest is in the price increase, the results for the price decrease are also shown for comparison purposes. Overall, there are 52 price decreases compared to only 37 price increases, that somewhat gives an early indication that bandwagon effect is perhaps not prominent. In
38 Capital Markets Review Vol.l6 No. I, 2008
Initial Performance of IPOs listed on MESDAQ
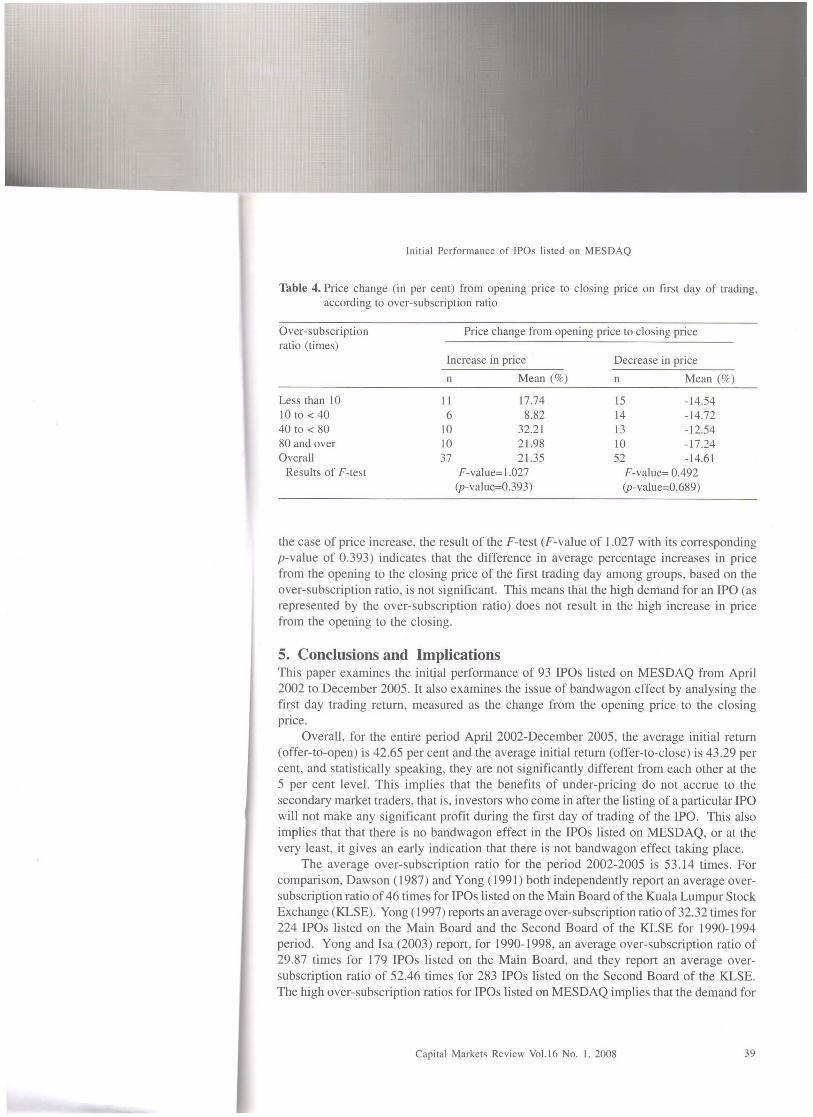
Table 4. Price change (in per cent) from opening price to closing price on first day of trading, according to over-subscription ratio
Over-subscription ratio (times)
Less than 10 10 to < 40 40 to < 80 80 and over Overall
Results of F-test
Price change from opening price to closing price
Increase in price Decrease in price
n Mean (%) n Mean (%)
II 17.74 15 -14.54 6 8.82 14 -14.72
10 32.21 13 -12.54 10 21.98 10 -17.24 37 21.35 52 -14.61
F-value= 1.027 F-value= 0.492 (p-value=0.393) (p-value=0.689)
the case of price increase, the result of the F-test (F-value of l.027 with its corresponding p-value of 0.393) indicates that the difference in average percentage increases in price from the opening to the closing price of the first trading day among groups, based on the over-subscription ratio, is not significant. Tills means that the high demand for an IPO (as represented by the over-subscription ratio) does not result in the high increase in price from the opening to the closing.
5. Conclusions and Implications This paper examines the initial performance of 93 IPOs listed on MESDAQ from April 2002 to December 2005. It also examines the issue of bandwagon effect by analysing the first day trading return, measured as the change from the opening price to the closing price.
Overall , for the entire period April 2002-December 2005, the average initial return (offer-to-open) is 42.65 per cent and the average initial return (offer-to-close) is 43.29 per cent, and statistically speaking, they are not significantly different from each other at the 5 per cent level. This implies that the benefits of under-pricing do not accrue to the secondary market traders, that is, investors who come in after the listing of a particular IPO will not make any significant profit during the first day of trading of the IPO. This also implies that that there is no bandwagon effect in the IPOs listed on MESDAQ, or at the very least, it gives an early indication that there is not bandwagon effect taking place.
The average over-subscription ratio for the period 2002-2005 is 53.14 times. For comparison, Dawson (1987) and Yong (1991) both independently report an average oversubscription ratio of 46 times for IPOs listed on the Main Board of the Kuala Lumpur Stock Exchange (KLSE). Yong (1997) reports an average over-subscription ratio of 32.32 times for 224 IPOs listed on the Main Board and the Second Board of the KLSE for 1990-1994 period. Yong and lsa (2003) report, for 1990-1998, an average over-subscription ratio of 29.87 times for 179 IPOs listed on the Main Board, and they report an average oversubscription ratio of 52.46 times for 283 IPOs listed on the Second Board of the KLSE. The illgh over-subscription ratios for IPOs listed on MESDAQ implies that the demand for
Capital Markets Review Vol.l6 No. I, 2008 39

Othman Yong
technology and growth stocks is very high indeed, surpassing the demand for large-sized IPOs listed on the Main Board and the medium-sized IPOs listed on the Second Board, which means the regulatory agencies involving in the listing approval of an IPO should not lower the initial offer price submitted by the issuer of the IPO for fear that it will not be fully subscribed. By maintaining the 'true' value of an IPO as first submitted by the issuer, the company concerned can benefit from more funds received through the IPO exercise. This can also lower the level of under-pricing ofIPOs listed on MESDAQ, which is beneficial to the IPO issuer in reducing the cost of an IPO issuance (the common terminology used in the IPO literature for this situation is 'to reduce the money left on the table').
When a comparison is made based on the type of offer, there is a significant difference at the 5 per cent level between the average initial return (offer-to-open) of 34.46 per cent for the offer for sale and the average of 67.55 per cent for the public issue. When a comparison is made for the initial return (offer-to-close), the significance degree is somewhat lessened as shown by the p-value of 0.063 compared to the p-value for the initial return (offer-to-open) of 0.012). In general, public issue is more under-priced than the offer for sale, resulting in its higher return. This implies that investors demand higher return for IPOs that are offered for the first time to the public, that is, the public issue, as compared to IPOs that are already in existence, but only in a few hands, that is, the offer for sale. This is perhaps due to public perception that IPOs of the public issue type are riskier than the offer for sale because IPOs of public offer type have no track records. For comparison, Yang and Isa (2003) report an average initial return (offer-to-open), for the period 1990-1998, of 82.71 per cent for offer for sale, and 78.16 per cent for public issue listed on the Main Board of the KLSE. For the Second Board, they report an average initial return (offer-to-open), of 99.79 per cent for offer for sale, and 139.74 per cent for public issue.
The difference in the average initial returns among groups, based on the oversubscription ratios, is significant at the 5 per cent level. This means that the higher the over-subscription ratio, the higher is the initial return. This implies that investor demand plays a very important role in determining the level of under-pricing of an IPO listed on MESDAQ, that is, an IPO with a high demand will result in bigger under-pricing and hence a higher initial return. This also implies that investors can use information on oversubscription ratio as a guide to future investment in IPOs. This is consistent with the findings of Yang (1997) and Yang and Isa (2003) for IPOs listed on the Main Board and the Second Board of the KLSE.
Overall, the average initial return between the two issuing houses is not significantly different from each other, and there is no significant increase or decrease from the average initial return (offer-to-open) to the average initial return (offer-to-close). There is no significant increase or decrease from the average initial return (offer-to-open) to the average initial return (offer-to-close) for all groups of offer size. This implies that offer size has no effect on the level of under-pricing ofIPOs listed on MESDAQ. Furthermore, the difference in average initial returns among groups, based on the offer size, is not significant. In general, the difference in average initial returns among groups, based on the sector classification, is not significant.
To further investigate the possible connection between the type of offer and the oversubscription ratio, over-subscription ratios are analysed according to type of offer. Overall,
40 Capital Markets Review Vol. 16 No. I, 2008
Initial Performance of IPOs listed on MESDAQ
the average over-subscription ratio of public issue is significantly lower than the average over-subscription ratio of offer for sale, at the 10 per cent level. There is one peculiar observation that is worth noting here. Even though the average initial return (offer-toopen) of public issue is significantly (at the 5 per cent level) higher than the corresponding average initial return of offer for sale, the average over-subscription ratio of public issue is somewhat significantly (at the 10 per cent level) lower than the average over-subscription ratio of offer for sale. This implies that there is some sort of inverse relationship between the demand (as represented by the over-subscription ratio) for an IPO (based on its type, either public issue or offer for sale) and its performance (as represented by the initial return), something that contradicts the earlier conclusion on the overall (when both types of IPOs are combined) relationship between the over-subscription ratio and the initial return.
To further investigate the possible connection between the demand for an IPO and the bandwagon effect, the price change from the opening price to the closing price during the first day of trading is also analysed. Overall, during the period of the study, there are 52 price decreases compared to only 37 price increases, an early indication that bandwagon effect is perhaps not prominent. Overall, the difference in average percentage increases in price from the opening to the closing price of the first trading day among groups, based on the over-subscription ratio, is not significant. This means that the high demand for an IPO (as represented by the over-subscription ratio) does not result in a high increase in price from the opening to the closing, which implies that there is no bandwagon effect in the IPOs listed on MESDAQ.
References -\lIen, F. and G.R. Faulhaber. 1989. Signaling by under-pricing in the IPO market.
Journal of Financial Economics 23: 303-323. Baron, D.P. 1982. A model of the demand for investment banking and distribution
services for IPOs. Journal of Finance 37:955-976. arry, C.B. and R.H. Jennings. 1993. The opening price performance of initial public
offerings of common stock. Financial Management(Spring): 54-63. 3ear, R.M. and A.J. Curley. 1975. Unseasoned equity financing. Journal of Financial
and Quantitative Analysis 10: 311-325. tty, R. P. 1989. Auditor reputation and the pricing of initial public offerings. The Accounting Review(October): 693-709. tty, R.P. and J.R. Ritter. 1986. Investment banking, reputation, and the under-pricing of initial public offerings. Journal of Financial Economics 15:213-232.
nveniste, L.M. and P.A. Spindt. 1989. How investment bankers determine the offer price and allocation of new issues. Journal of Financial Economics 24:343-361. k, S. and M. Stanley. 1980. The financial characteristics and price movement patterns of companies approaching the unseasoned securities market in the late 70s. Financial Management(Winter): 30-36. th, J.R. and L. Chua. 1996. Ownership dispersion, costly infOlmation, and IPO underpricing. Journal of Financial Economics 41 (2):291-310.
~er, R., Dark, F. and A. Sing. 1998. Underwriter reputation, initial returns, and the longrun performance of IPO stocks. Journal of Finance 53: 285-311.
Capital Markets Review Vol. 16 No. I, 2008 41

Othman Yong
Chalk, AJ. and 1. W. Peavy. 1987. Initial public offerings: daily returns, offering types and the price effect. Financial Analysts Journal(Sept/Oct): 65-69.
Chaney, P. K. and C.M. Lewis. 1998. Income smoothing and under-performance in initial public offerings. Journal of Corporate Finance 4 (1):1-29.
Chemmanur, TJ. 1993. The pricing of initial public offerings: a dynamic model with information production. Journal of Finance 48: 285-304.
Choi, S. and S. Nam. 1998. The short-run performance ofIPOs of privately- and publiclyowned firms: international evidence. Multinational Finance Journal 2 (3): 225-244.
Dawson, S.M. 1987 . Secondary stock market performance of initial public offers, Hong Kong, Singapore and Malaysia: 1978-1984. Journal of Business Finance and
Accounting(Spring): 65-76. Dawson, S.M. 1994. Measuring the costs ofIPO under-pricing: the issuer's view. Capital
Markets Review 2 (1): 1-14. Dawson, S.M. 1995. Measuring the costs of IPO under-pricing: the original shareholders'
view. Capital Markets Review 3 (1): 33-48. Derrien, F. 2005. IPO pricing in 'hot' market conditions: who leaves money on the table?
Journal of Finance 60 (1): 487-521. Dunbar, C. G. 1997. Over-allotment, option restrictions and contract choice in initial
public offerings. Journal of Corporate Finance 3 (3):251 -275 . Grinblatt, M. and c.Y. Hwang. 1989. Signaling and the pricing of new issues. Journal
of Finance(lune): 393-420. Hanley, K.W. and W.l. Wilhelm. 1994. Evidence of the strategic allocation of initial
public offerings. Journal of Financial Economics 37 (2): 239-257. Ibbotson, RG. 1975. Price performance of common stock IPOs. Journal of Financial
Economics 2: 235-272. Ibbotson, R.G. and 1. R. Ritter. 1995. Initial public offerings. In Handbooks of Operations
Research and Management Science: Finance, ed. R.A. larrow, V. Maksimovic and W.T. Ziemba, 10:993-1016. Amsterdam: North Holland Publications.
Ismail, K.N.I., F. Z Abidin and N. Zainudin. 1993. Performance of new stock issues on the KLSE. Capital Markets Review 1 (1): 81-95.
lelic, R., B. Saadouni and R.J. Briston. 2001. Performance of Malaysian IPOs: underwriters' reputation and management earnings forecast. Pacific-Basin Finance Journal 9: 457-486.
Levis, M. 1990 . The winner's curse problem, interest costs and the under-pricing of initial public offerings. Economic Journal(March): 76-89.
Loughran, T., 1.R Ritter and K. Rydqvist. 1994. Initial public offerings: international insights. Pacific-Basin Finance Journal 2:165-199.
Miller, R.E. and F.K. Reilly. 1987. An examination of mispricing, returns, uncertainty, for initial public offerings. Financial Management(Summer): 33-38.
Neuberger, B.M. and C.T Hammond. 1974. A study of underwri"ters' experience with unseasoned IPOs. Journal of Financial and Quantitative Analysis(March): 165-177.
Paudyal, K., B. Saadouni and R.J. Briston. 1998. Privatisation initial public offerings in Malaysia: initial premium and long-term performance. Pacific-basin Finance Journal 6 (5): 427-451.
42 Capital Markets Review Vol.l6 No. I , 2008
Initial Performance of IPOs listed on MESDAQ
Pettway, R.H. and T. Kaneko. 1996. The effects of removing price limits and introducing auctions upon short-term IPO returns:the case of Japanese IPOs. Pacific-basin Finance Journal 4 (2&3): 241-258.
Purnanandam, A. K. and B. Swaminathan. 2004. Are IPOs really under-priced? The Review of Financial Studies 17 (3): 811-848.
Reilly, F.K. 1977. IPOs re-visited. Financial Management(Winter): 28-42. Reilly, F.K. and K. Hatfield. 1969. Investor experience with new stock issues. Financial
Analyst Journal 25: 73-80. Ritter, 1.R. 2003. Investment banking and securities issuance, Chapter 5. In Handbook of
the Economics of Finance, ed. G. Constandinides, M. Harris and R. Stulz, pp. 255-304. Amsterdam: Elsevier B.Y.
Rock, K. 1986. Why IPOs are under-priced. Journal of Financial Economics 15:1051-1069.
Saadouni, B., 1. How and R. Jelic. 2005. Share allocation and the performance of the KLSE Second Board IPOs. Paper presented at the AF A 2005 Conference, Kuala Lumpur, Malaysia, July 11-13.
Tinic, S.M. 1988. Anatomy of initial public offerings of common stock. Journal of Finance 43:789-822.
Welch, I. 1989 . Seasoned offerings, imitation costs and the under-pricing of initial public offerings. Journal of Finance(June): 421-449.
Welch, I. 1992. Sequential sales, learning, and cascades. Journal of Finance 47: 695-732. Yong,O. 1991. Performance of IPOs of securities in Malaysia. Malaysian
Accountant(June): 3-6. Yong,O. 1996. Size of the firm, over-subscription ratio and performance of IPOs. Malaysian
Management Review 31 (2):28-39. Yong, O. 1997. Initial public offerings: the Malaysian experience 1990-1994. In Advances
in Pacific-Basin Capital Markets, ed. T. Bos and T. Fetherston, 3:177-188. Connecticut: JAI Press.
Yong, O. 2007. A review of IPO research in Asia: what's next? Pacific-Basin Finance Journal 15: 253-275 .
Yong, O. and Z. Isa. 2003. Initial performance of new issues of shares in Malaysia. Applied Economics 35: 919-930.
Yong, 0., P. Yatim and R.Z. Sapian. 1999. Significance of board of listing and type of issue on the under-pricing and after-market performance of Malaysian IPOs. Capital Markets Review 7 (1&2): 47-74.
Capital Markets Review Vol.l6 No. I, 2008 43