Embed Size (px)
Citation preview
June 17, 2014 Mr. Matt Moran VTANR/Department of Environmental Conservation Waste Management and Prevention Division 1 National Life Drive – Davis 1 Montpelier, Vermont 05620-3704 RE: Initial Site Investigation of Subsurface Petroleum Contamination Report –
Interstate Shell, 1055 Williston Road, South Burlington, Vermont, VTDEC Site #2013-4452
Dear Mr. Moran: Please find enclosed a copy of the Initial Site Investigation of Subsurface Petroleum Contamination Report for the Interstate Shell in South Burlington, Vermont for your review. During the sampling event, light non-aqueous phase liquid (LNAPL) was observed in monitoring well MW14-02. The well has been manually bailed since April 4, 2014. KAS recommends the installation of one 4 inch recovery well and a multi-phase extraction (MPE) event to occur. At that time up to two additional 2 inch monitoring wells should be installed on the western portion of the Site to further define the extent of contamination. Following the installation of the monitoring and recovery wells, KAS also recommends a round of groundwater sampling in August/September 2014. This report has been forwarded to the Vermont Department of Environmental Conservation on behalf of Champlain Oil Company. Please feel free to contact me with any questions or comments via telephone, (802) 383-0486, or email, [email protected].
Sincerely,
Toni Poquette Project Geologist
CC: Mr. Dick Browne, Champlain Oil Company
KAS #409130505
Interstate Shell 1055 Williston Road South Burlington, Vermont VTDEC #2013-4452 KAS #409130505
INITIAL SITE INVESTIGATION OF SUBSURFACE PETROLEUM CONTAMINATION REPORT Report Date: June 17, 2014 Prepared for: Champlain Oil Company 45 San Remo Drive South Burlington, Vermont 05403
Initial Site Investigation of Subsurface Petroleum Contamination Report Interstate Shell, South Burlington, Vermont
i KAS #409130505
Table of Contents 1.0 Introduction .............................................................................................................................. 1
2.0 Scope of Work .......................................................................................................................... 1
3.0 Site Description ........................................................................................................................ 1
3.1 Site and Vicinity .................................................................................................................................. 1 3.2 Site and Area Features, Topography, Surface Water Bodies and Drainage ..................................... 1 3.3 Abutters and Nearby Properties ........................................................................................................ 2 3.4 Utilities ................................................................................................................................................ 2 3.5 Previous Hazardous Materials Releases and Site History .................................................................. 2
4.0 Subsurface Explorations and Laboratory Analysis ................................................................... 2
4.1 Pre-Drilling Activities .......................................................................................................................... 2 4.2 Monitoring Well Installation and Field Screenings of Subsurface Soils ............................................ 2
4.2.1 Soil Screening .............................................................................................................................. 2 4.3 Groundwater Flow Direction and Gradient ....................................................................................... 3 4.4 Groundwater Sampling and Laboratory Analysis .............................................................................. 3 4.5 Quality Assurance and Quality Control ............................................................................................. 3 4.6 Manual Bailing of LNAPL ................................................................................................................... 4
5.0 Site Hydrogeology ................................................................................................................... 4
5.1 Contaminant Distribution ................................................................................................................... 4 5.1.1 Soil ............................................................................................................................................... 4 5.1.2 Groundwater ............................................................................................................................... 4
6.0 Conceptual Hydrogeologic Model ............................................................................................ 4
6.1 Site Conditions ................................................................................................................................... 4 6.2 Geology .............................................................................................................................................. 5 6.3 Hydrogeology .................................................................................................................................... 5 6.4 Apparent Source of Contamination ................................................................................................... 5 6.5 Contaminant Transport ...................................................................................................................... 5 6.6 Sensitive Receptor Risk Assessment .................................................................................................. 5
6.6.1 Buildings in the Vicinity ............................................................................................................... 5 6.6.2 Water Supplies ............................................................................................................................ 6 6.6.3 Utility Corridors ........................................................................................................................... 6 6.6.4 Surface Waters ............................................................................................................................. 6
6.7 Impacted Third Parties ....................................................................................................................... 6
7.0 Conclusions ............................................................................................................................... 6
8.0 Recommendations .................................................................................................................... 7

Initial Site Investigation of Subsurface Petroleum Contamination Report Interstate Shell, South Burlington, Vermont
ii KAS #409130505
Appendices Appendix A 1) Site Location Map 2) Site Map 3) Groundwater Contour Map 4) Contaminant Concentration Map
Appendix B Boring Log and Well Construction Diagrams
Appendix C Liquid Level Monitoring Data
Appendix D Groundwater Quality Summary
Appendix E Analytical Laboratory Report
Appendix F LNAPL Recovery Data
Initial Site Investigation of Subsurface Petroleum Contamination Report Interstate Shell, South Burlington, Vermont
iii KAS #409130505
Executive Summary
An Initial Site Investigation has been completed by KAS, Inc. (KAS) at the Interstate Shell property in South Burlington, Vermont. The Interstate Shell property (herein referred to as “Site”) is located at 1055 Williston Road in South Burlington, Vermont (VTDEC #2013-4452). The Site property is currently used to house a convenience store and gasoline/diesel station.
Contamination was encountered in soils beneath the Site during the Underground Storage Tank (UST) Closure Assessment of one 6,000 gallon gasoline, two 10,000 gallon gasoline and two 1,000 gallon diesel USTs on October 16, 17 and 25, 2013.
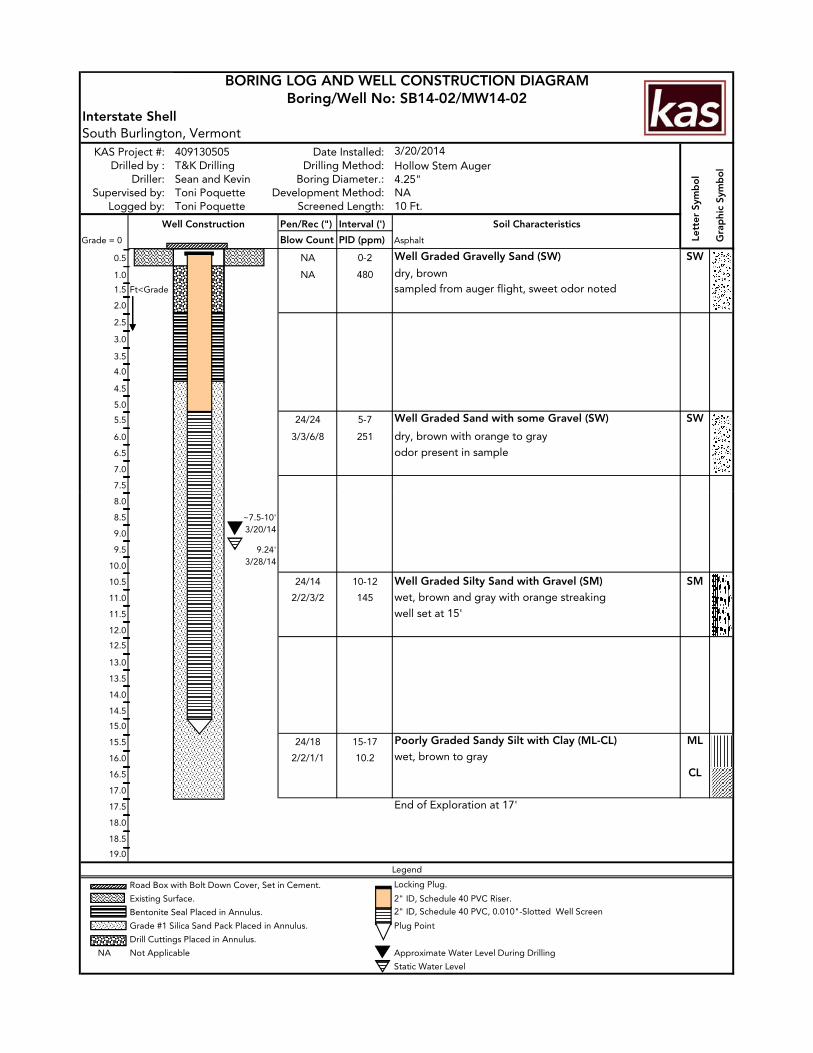
As part of this initial site investigation, KAS supervised the installation of four groundwater monitoring wells at the Site (MW14-01 through MW14-04) on March 20, 2014. PID soil screening results during drilling ranged from 1.9 to 480 ppm. Petroleum odors were noted in soils during the installation of two of the four monitoring wells. Groundwater analytical data collected at the Site in March 2014 indicate that dissolved petroleum constituents (volatile organic compounds [VOCs]) are present at concentrations above Vermont Groundwater Enforcement Standards (VGES) in groundwater in the vicinity of monitoring well MW14-04. Light non-aqueous phase liquid (LNAPL) was present with a thickness of 1.3 feet in monitoring well MW14-02.
The full extent of the contaminant plume was not defined during this initial site investigation; however, petroleum impacts to subsurface soils and groundwater beneath the Site appear to be low with the exception of the northern corner of the Site in the vicinity of monitoring well MW14-02. No sensitive receptors other than soil and groundwater have been identified at being at risk to petroleum impact during this initial site investigation.
Based on the results of this initial site investigation, KAS is recommending an additional round of groundwater monitoring to be conducted in August/September 2014. KAS also recommends the placement of a recovery well downgradient of the northern pump dispensers and a multi-phase extraction (MPE) event be performed in order to remediate the LNAPL within the subsurface. During the installation of the recovery well, an additional monitoring well should be installed on the northern portion of the Site to further define the contaminant plume.

Initial Site Investigation of Subsurface Petroleum Contamination Report Interstate Shell, South Burlington, Vermont
1 KAS#409130505
1.0 Introduction This report provides a summary of the methodology, results, conclusions, and recommendations completed as part of the Initial Site Investigation at the Interstate Shell property located at 1055 Williston Road in South Burlington, Vermont (Site Location Map, Appendix A). The initial site investigation work was performed in accordance with the Work Plan and Cost Estimate for Subsurface Investigation of Petroleum Contamination at the Interstate Shell dated January 20, 2014 prepared by KAS, Inc. (KAS). The initial site investigation was approved by Mr. Matt Moran of the Vermont Department of Environmental Conservation (VTDEC) in an electronic message to KAS and Champlain Oil Company (COCO, responsible party) dated January 21, 2014.
Manual bailing of LNAPL was verbally requested by the VTDEC during a phone conversation with KAS on April 2, 2014. It was requested to obtain a 55 gallon drum and begin bailing as the earliest time possible and to submit a cost estimate. The manual bailing of LNAPL was performed in accordance with the cost estimate submitted on April 8, 2014 and approved by Mr. Moran in an electronic message dated April 9, 2014. During this electronic message Mr. Moran also requested a fuel ID analysis be performed.
2.0 Scope of Work The Initial Site Investigation was conducted to assess the degree and extent of petroleum impact to soil and groundwater in the vicinity of the underground storage tanks (USTs) located on the property. Contamination was encountered in soils beneath the Site during the UST Closure Assessment of one 6,000 gallon gasoline, two 10,000 gallon gasoline, and two 1,000 gallon diesel USTs on October 16, 17 and 25, 2013. Results of the following investigative tasks performed by KAS are presented: soil boring advancement and monitoring well installation; soil screening; groundwater sampling and analysis; catch basin screening; evaluation of sensitive receptors in the vicinity of the Site, including indoor air screening of on and off-site buildings; and, LNAPL recovery.
Copies of previous reports are on file at the VTDEC office in Montpelier, VT.
3.0 Site Description 3.1 Site and Vicinity
The Site is located on the southern side of Williston Road and eastern side of Dorset Street in South Burlington, Vermont (Site Location Map, Appendix A). As of the date of this report, the Site is used as a convenience store and gasoline/diesel station. The Site is occupied by one building in the middle of the property and a garage on the southeastern portion of the property. The on-site building is located approximately 25 feet from the USTs. The gasoline dispensers are located approximately 20 feet from the building on the northern and southern sides with the canopy extending over the area covering half of the building. A paved parking lot occupies the remaining area of the Site. The Site Map (Appendix A) shows the Site and relevant features.
3.2 Site and Area Features, Topography, Surface Water Bodies and Drainage
Based on a review of the topographic map and aerial photograph included in Appendix A, the Site lies at an approximate elevation of 298 feet above mean sea level (AMSL). The coordinates of the property at the Site entrance are approximately 44o 28’ 08” North Latitude and 73o 10’ 51’’ West Longitude. Topography of the Site property is generally flat throughout with a very slight slope to the northwest. An unnamed stream is the closest surface water to the Site, located approximately 1,200 feet to the northeast of the USTs. Based on Site topography, the surface drainage from the Site is anticipated to flow to the north and west towards Williston Road and Dorset Street. No drainage swales in the immediate vicinity of the Site were noted. One on-site storm drainage catch basin was noted near the southeastern corner of the property, and multiple catch basins were noted near the Site along Williston Road and Dorset Street.

Initial Site Investigation of Subsurface Petroleum Contamination Report Interstate Shell, South Burlington, Vermont
2 KAS#409130505
3.3 Abutters and Nearby Properties
The land use in the surrounding area consists of commercial properties. The nearest neighboring building is located approximately 100 feet south of the former USTs. This building was occupied by Needleman’s bridal boutique in March 2014. The nearest neighboring building to the northern dispensers is located approximately 125 feet to the east and was occupied by the Vermont Gift Barn in March 2014. The eastern portion of the property is abutted by the aforementioned building and a grass strip, the southern portion of the property is abutted by a parking lot and Needleman’s Bridal boutique and Greer’s Laundry Mat/Dry Cleaning (VTDEC #20053395), the western portion of the property is abutted by a grass strip and Dorset Street, and the northern portion of the property is abutted by a grass strip and Williston Road. Across Williston Road is the Holiday Inn, and across Dorset Street is an unoccupied restaurant building.
3.4 Utilities
Public utilities in the area include, telephone, electricity, natural gas, water and sewer. Electric and telephone lines are located overhead, as well as the northern corner of the property. Water and sewer are obtained from the City of South Burlington and are located underground.
3.5 Previous Hazardous Materials Releases and Site History
Contamination was encountered in soils beneath the Site during the Underground Storage Tank Closure Assessment of one 6,000 gallon gasoline, two 10,000 gallon gasoline and two 1,000 gallon diesel USTs on October 16, 17 and 25, 2013. No other on-site sources have been identified.
A VTDEC hazardous site, the Greer’s Laundry Mat/Dry Cleaning (VTDEC #20053395), is located to the south of the Interstate Shell property. It has been reported that chlorinated solvent contamination is present within the groundwater.
4.0 Subsurface Explorations and Laboratory Analysis 4.1 Pre-Drilling Activities
Prior to drilling activities, KAS pre-marked the Site as required by DigSafe on February 26, 2014. DigSafe Number 20140903125 was obtained on February 26, 2014. The City of South Burlington was also contacted to clear any underground water, sewer lines or other utilities located at the Site. All subsurface utilities are shown on the Site Map in Appendix A.
4.2 Monitoring Well Installation and Field Screenings of Subsurface Soils
On March 20, 2014, KAS oversaw the advancement of four soil borings with all of them converted to monitoring wells (MW14-01and MW14-04) at the Site. Groundwater was encountered at depths ranging between 7 feet and 10 feet below grade (bg) in all four soil borings. All soil borings were advanced to a depth of 17 feet bg. All monitoring wells were set at a depth of 15 feet bg. Bedrock was not encountered in any of the soil borings.
The soil borings were advanced with a hollow stem auger. The locations of the borings were selected based upon proximity to the area of highest known contamination observed during the UST closure assessment in October 2013 and one in a presumed upgradient location. Monitoring wells were approved by Mr. Moran to be installed within a maximum of six soil borings if needed. Only four soil borings were advanced due to the number and location of below and above ground utilities at the Site which were unknown at the time of the wok plan preparation.
4.2.1 Soil Screening
Soil samples were collected from each boring location every five feet and screened with a properly calibrated photoionization detector (PID) at 2 foot intervals. Each monitoring well was set 2 feet to 5 feet below groundwater. Petroleum odor was noted in samples from two of the four boring locations. PID screening values for the borings ranged from 1.9 parts per million (ppm) to 480 ppm (Boring Log and Well Construction Diagrams, Appendix B). The subsurface sediments consisted of gravelly sand with some silt, and a silt and clay layer at the bottom of exploration for each soil boring. Results of the soil screening indicated that an elevated level of soil contamination is present in the subsurface near the northern pump island. The contamination

Initial Site Investigation of Subsurface Petroleum Contamination Report Interstate Shell, South Burlington, Vermont
3 KAS#409130505
appeared to be within the vicinity of soil boring SB14-02 (monitoring well MW14-02 was installed in this boring) during this drilling event. Contaminant levels were low in soil boring SB14-04 (MW14-04) within the saturated zone at 10 feet to 12 feet bg and decreased to minimal levels at the bottom of exploration. Contaminant levels were minimal in soil borings SB14-01 (MW14-01) and SB14-03 (MW14-03) in both the vadose and saturated zones.
4.3 Groundwater Flow Direction and Gradient
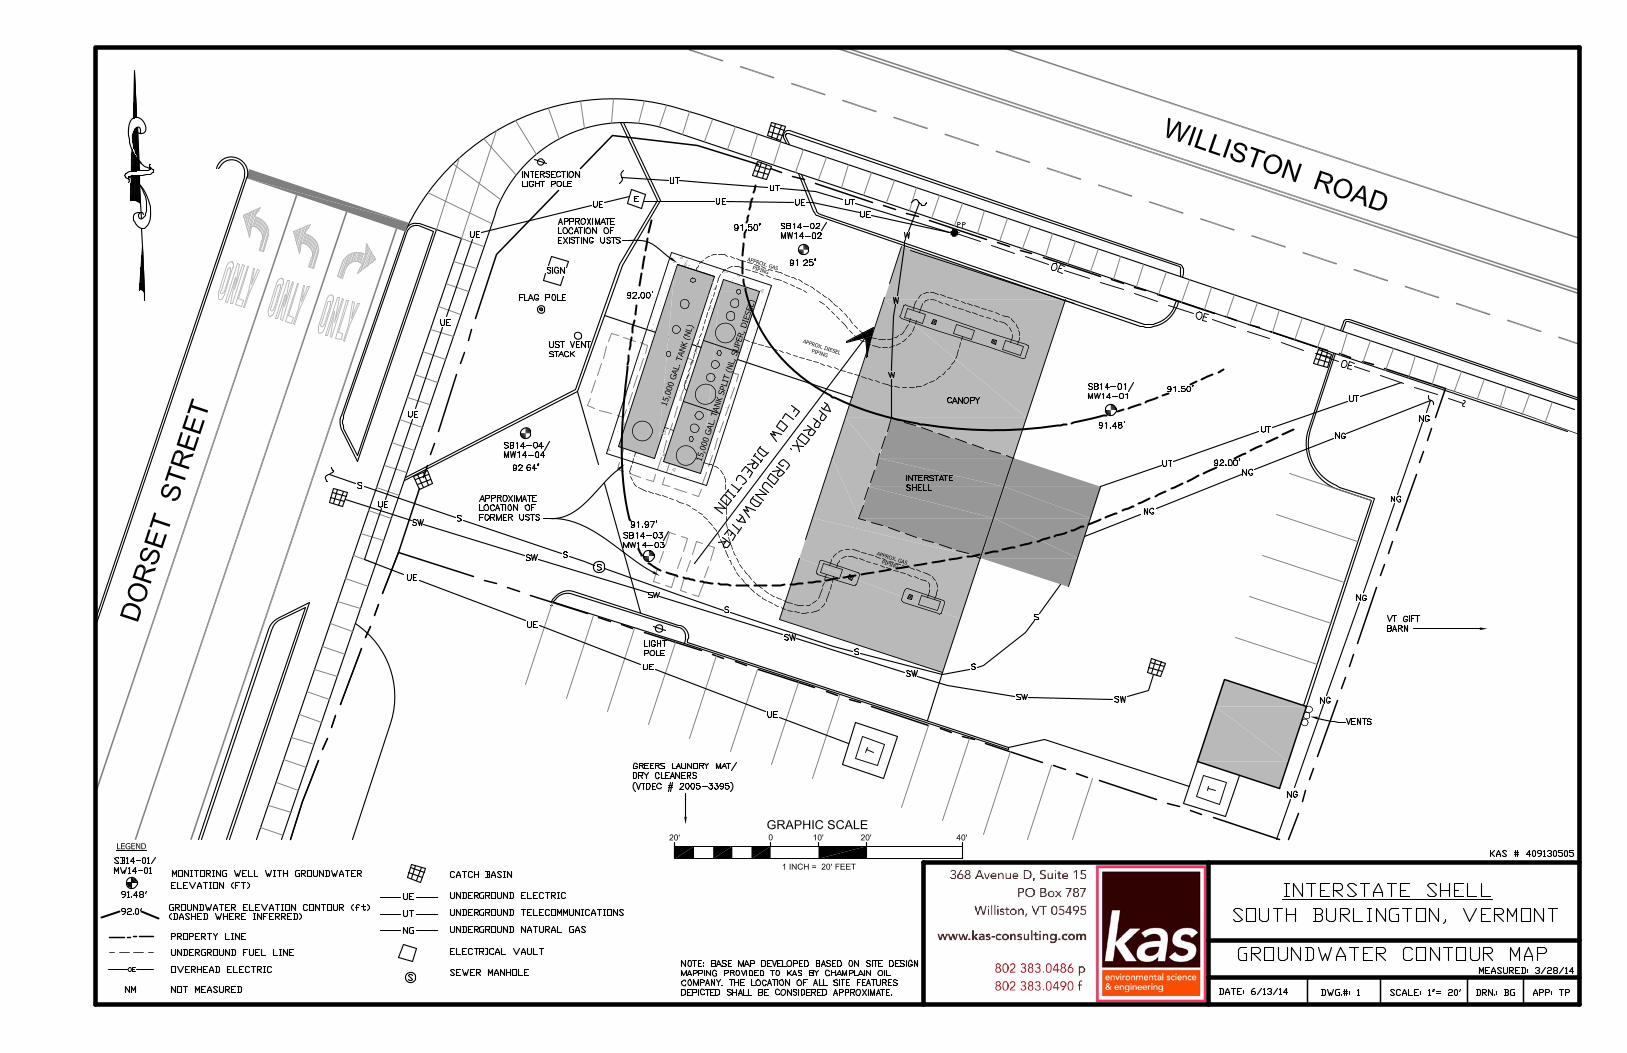
On March 28, 2014, the depth to water was measured in four Site monitoring wells (MW14-01 through MW14-04), relative to the top of the casing, using a Keck interface probe. The depth to water in each well was subtracted from the top of casing elevation to obtain the relative water table elevation.
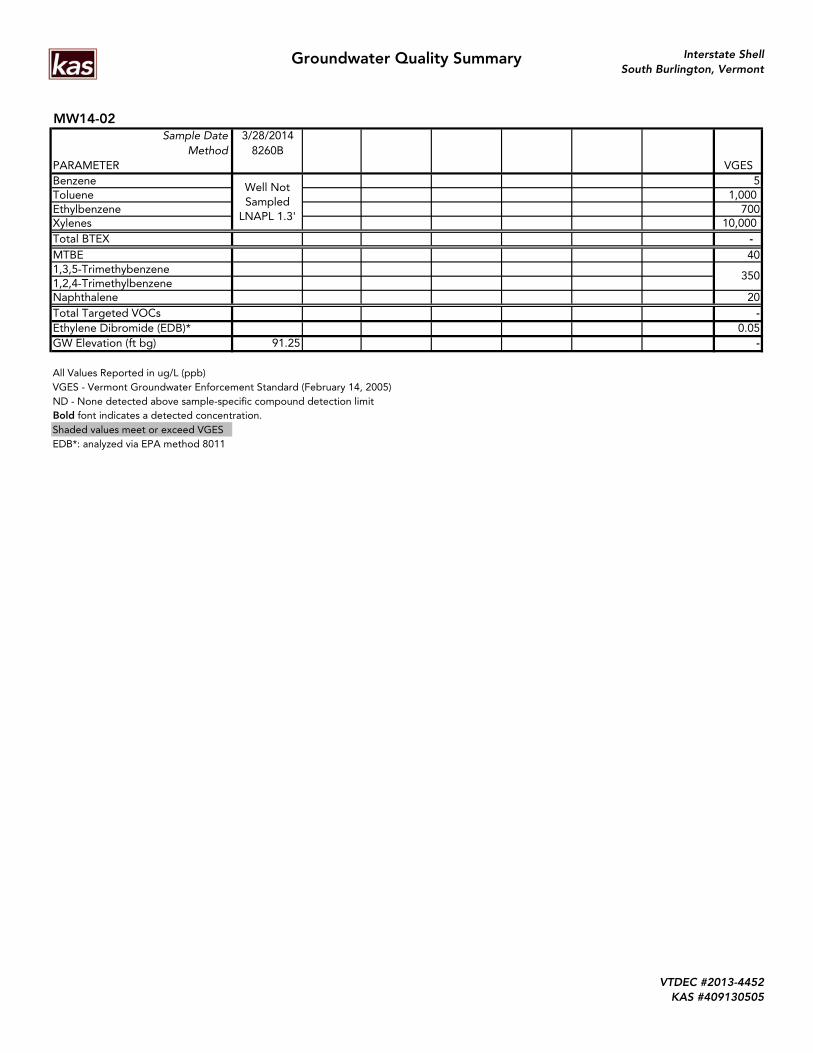
Groundwater level data is recorded in Appendix C (Liquid Level Monitoring Data). LNAPL was detected in monitoring well MW14-02 with a thickness of 1.3 feet. Depth to groundwater ranged from 8.24 feet to 9.40 feet bg.
As displayed on the Groundwater Contour Map included in Appendix A, the groundwater flow direction was directed generally towards the northeast. The groundwater was measured to flow at a hydraulic gradient of 1.0% across the Site.
4.4 Groundwater Sampling and Laboratory Analysis
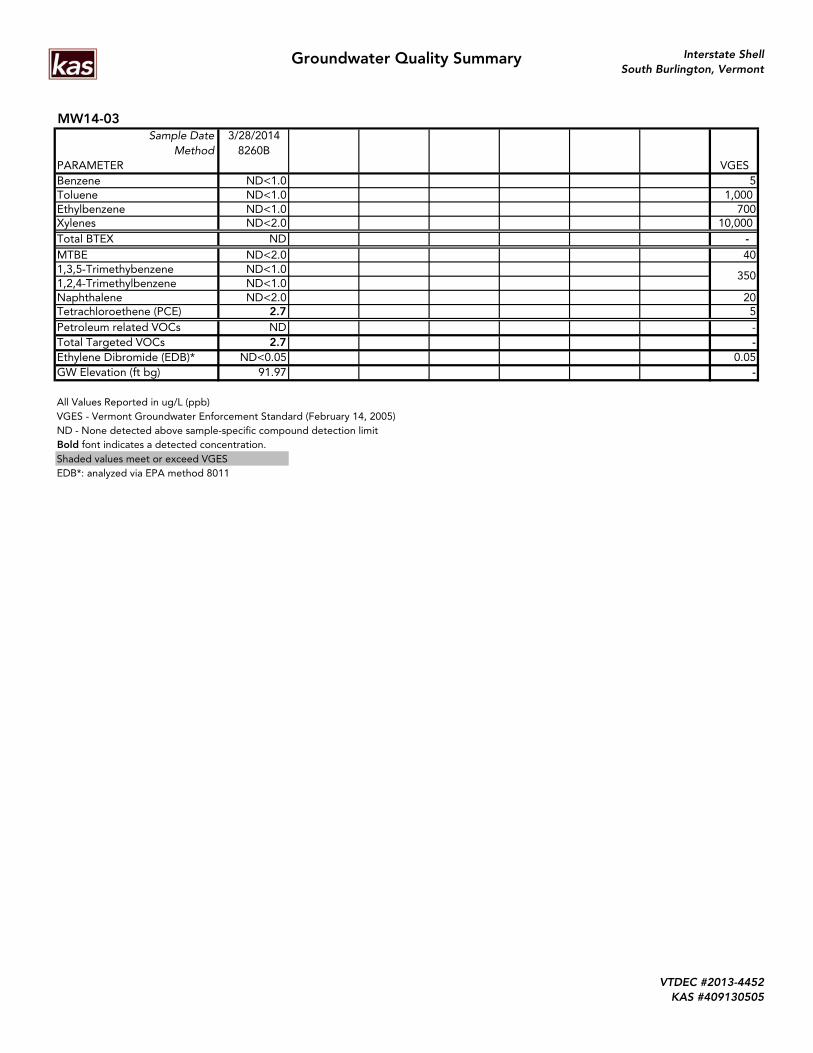
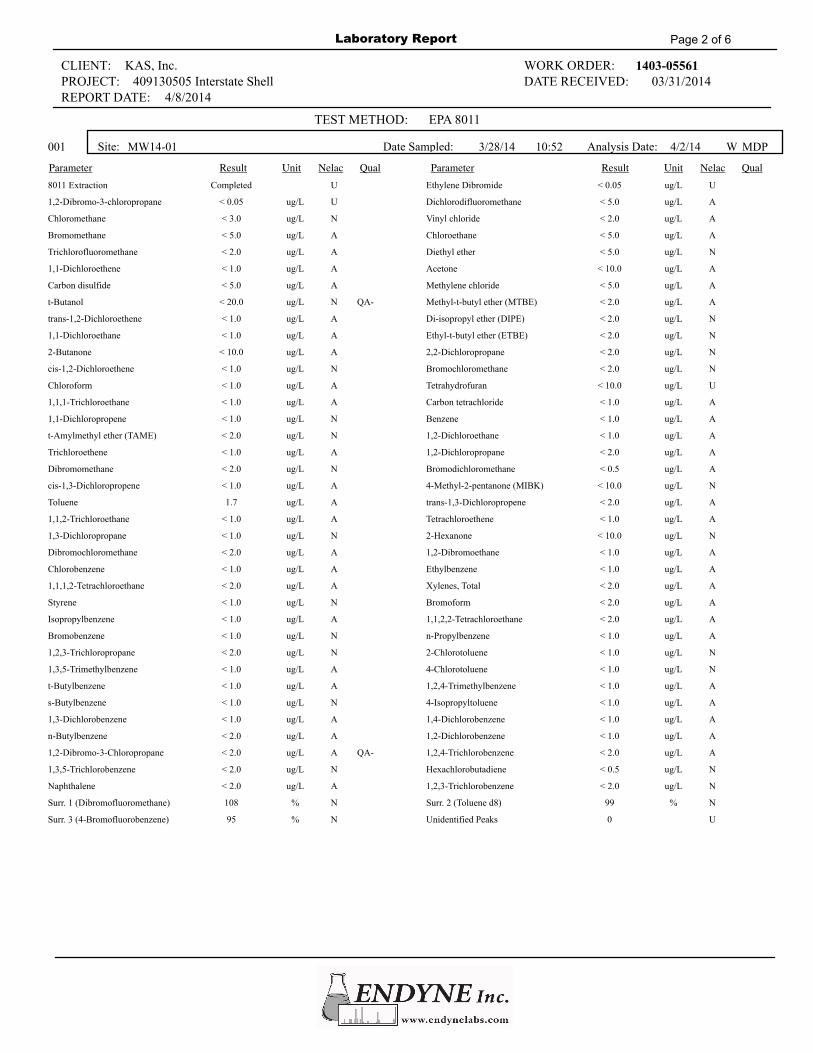
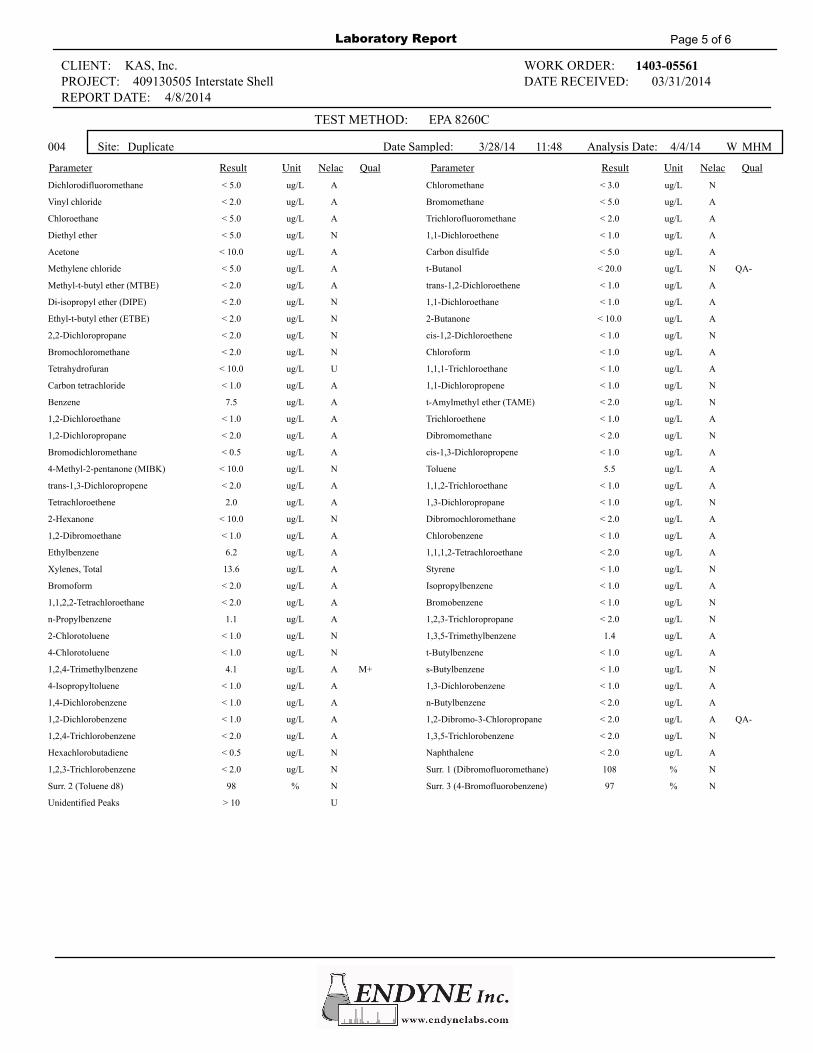
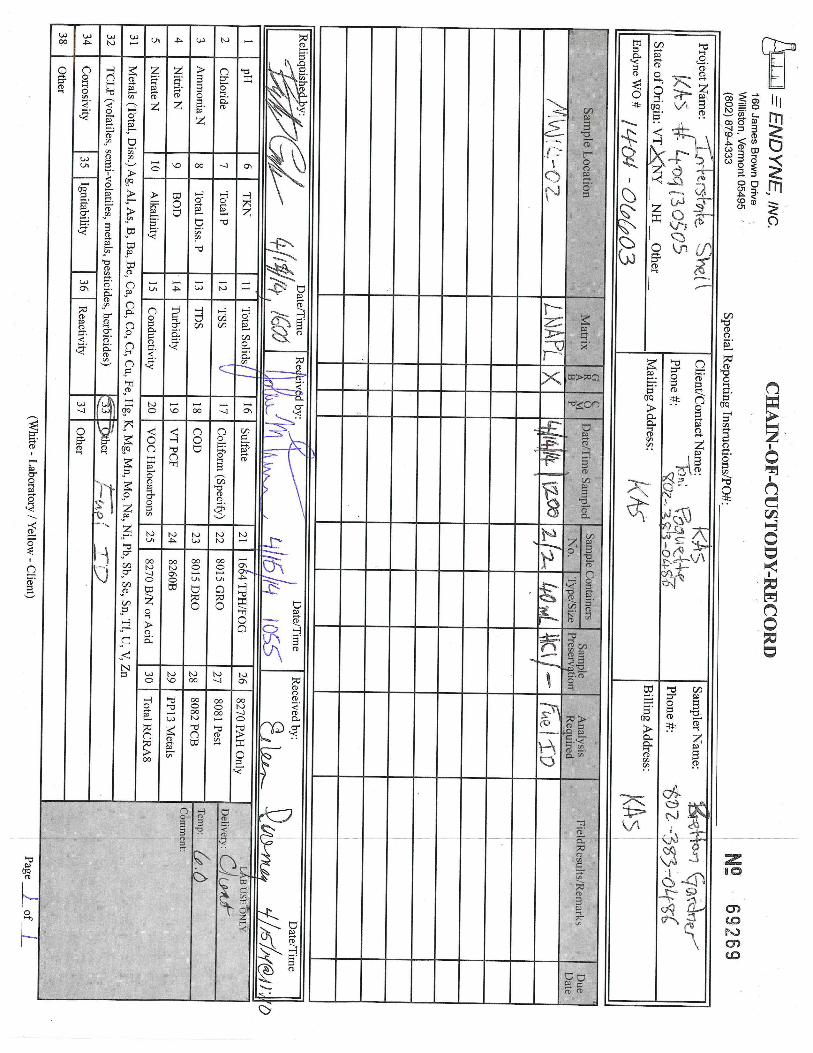
Groundwater samples were collected from three monitoring wells (MW14-01, MW14-03, and MW14-04) immediately following well gauging on March 28, 2014. A sample was unable to be collected from monitoring well MW14-02 due to the presence of LNAPL, catch basins due to being filled with snow, and existing monitoring well due to no longer being accessible. The samples were chilled and delivered under proper chain-of-custody procedures to Endyne, Inc. of Williston, Vermont. One duplicate sample (MW14-04) and one trip blank sample were collected for quality assurance/quality control (QA/QC) analyses. The samples were submitted and analyzed for volatile organic compounds (VOCs) by EPA Method 8260B, and Ethylene Dibromide (1,2-dribromoethane; EDB) via EPA method 8011. Results of the laboratory analyses are summarized in Appendix D. The laboratory report and chain-of-custody form are presented in Appendix E.
The laboratory report indicated that concentrations of select VOCs were present above the VGES in the groundwater samples collected from one of the three well locations (MW14-04). A tabulation presentation of analytical data for the groundwater monitoring wells is provided in Appendix D.
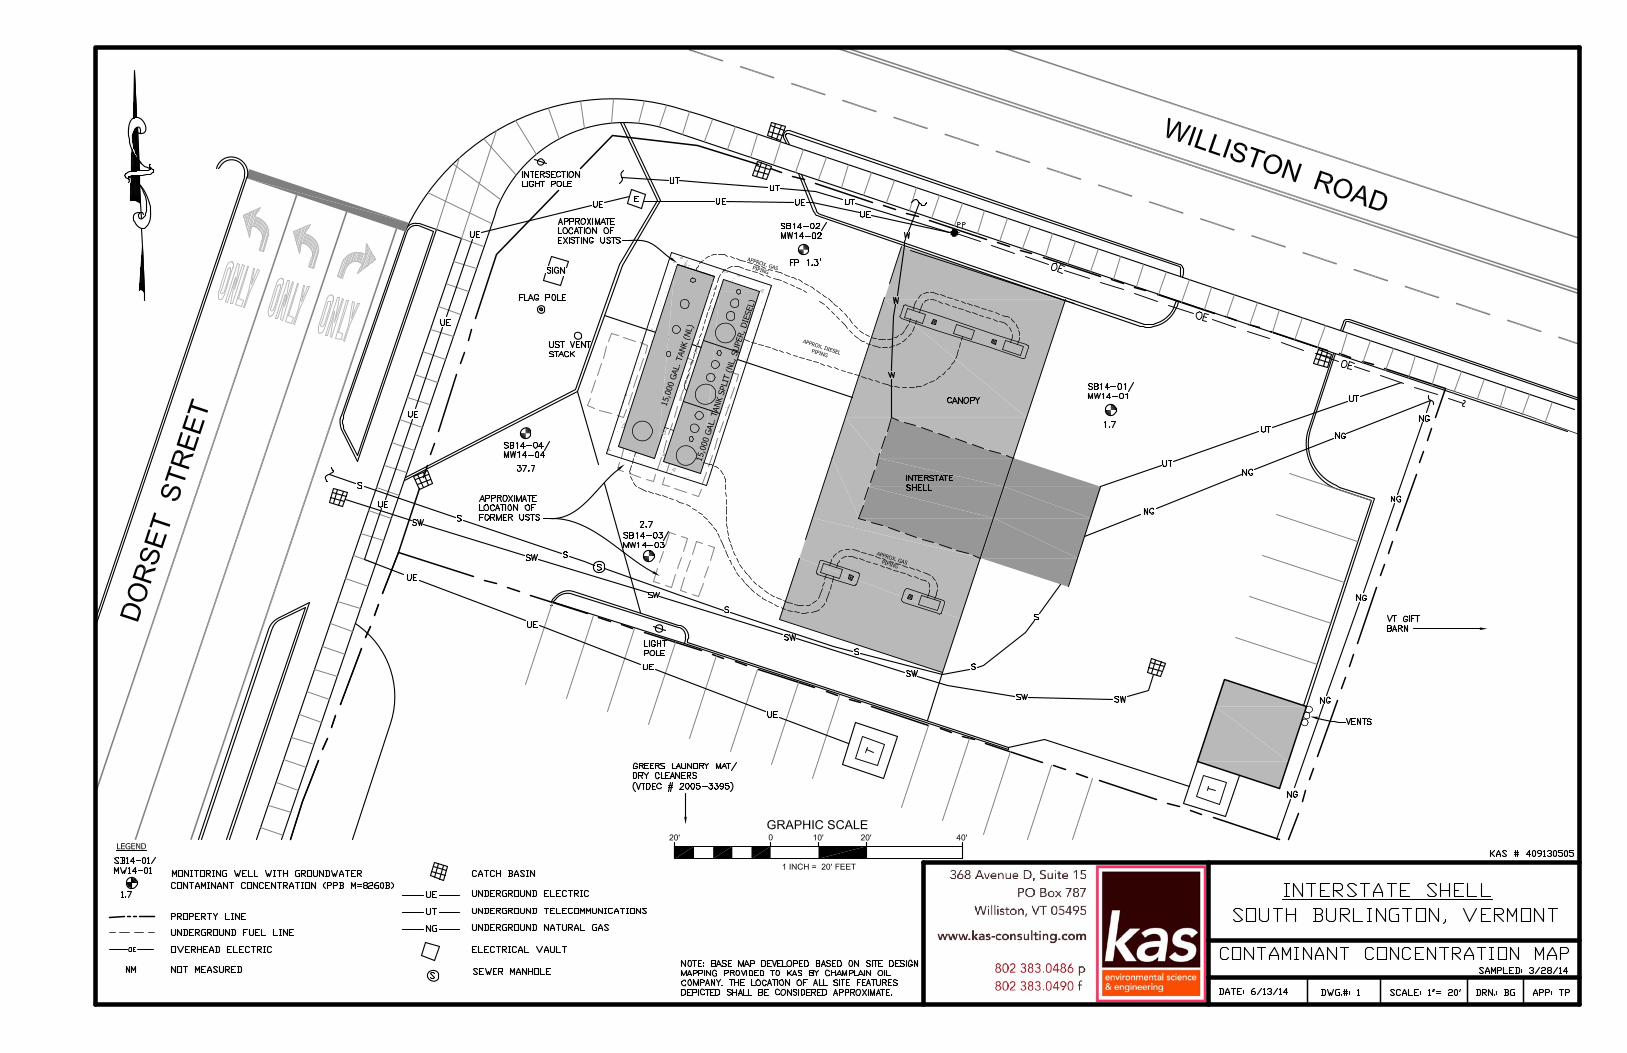
Reported concentrations of total targeted VOCs per Method 8260B were plotted on the Site Map to create the Contaminant Concentration Map in Appendix A. The current monitoring well network does not appear to fully characterize the contaminant plume to the north or west.
The following specific observations were made for the March 28, 2014 sampling event at the Site:
Monitoring well MW14-01 contained Toluene above the laboratory detection limit but below its respective VGES;
Monitoring well MW14-03 contained non-detectable levels of petroleum related VOC compounds. The chlorinated VOC (CVOC) compound Tetrachloroethene (PCE) was detected, but below its respective VGES;
Monitoring well MW14-04 contained Benzene above its respective VGES. The CVOC compound PCE was detected, but below its respective VGES; and,
The presence of PCE in monitoring wells MW14-03 and MW14-04 is believed to be from the Greer’s Laundry Mat/Dry Cleaning (VTDEC #20053395) located to the south of the Site.
4.5 Quality Assurance and Quality Control
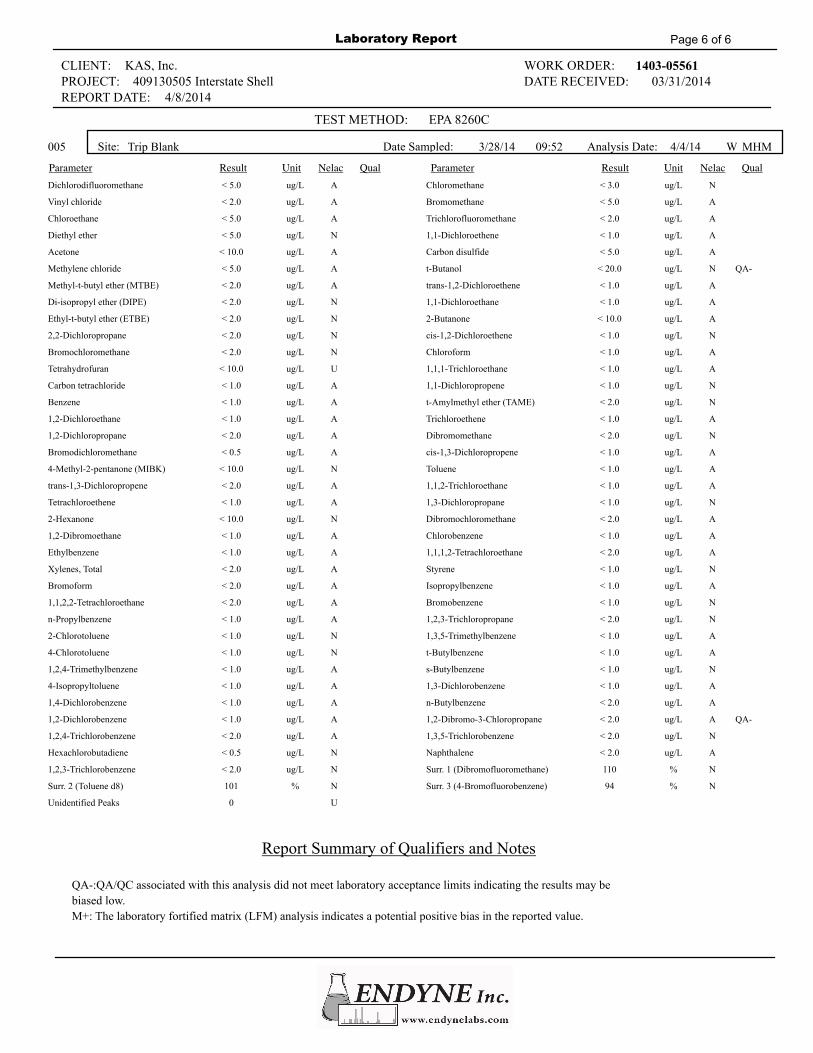
Samples were collected according to KAS’ groundwater sampling protocol. No VOCs were detected in the trip blank sample prepared on March 28, 2014. Relative percent difference (RPD) is defined as one hundred times the difference between the actual sample and the duplicate sample, divided by the mean of the two samples. RPD values are used to determine if adequate QA/QC were maintained during sample collection and analysis. The duplicate sample was collected from monitoring well MW14-04. The sample and duplicate contaminant constituents

Initial Site Investigation of Subsurface Petroleum Contamination Report Interstate Shell, South Burlington, Vermont
4 KAS#409130505
had RPDs ranging from 0.0% to -44.8%. The overall RPD result for total targeted VOCs was -10.4% indicating adequate precision.
4.6 Manual Bailing of LNAPL
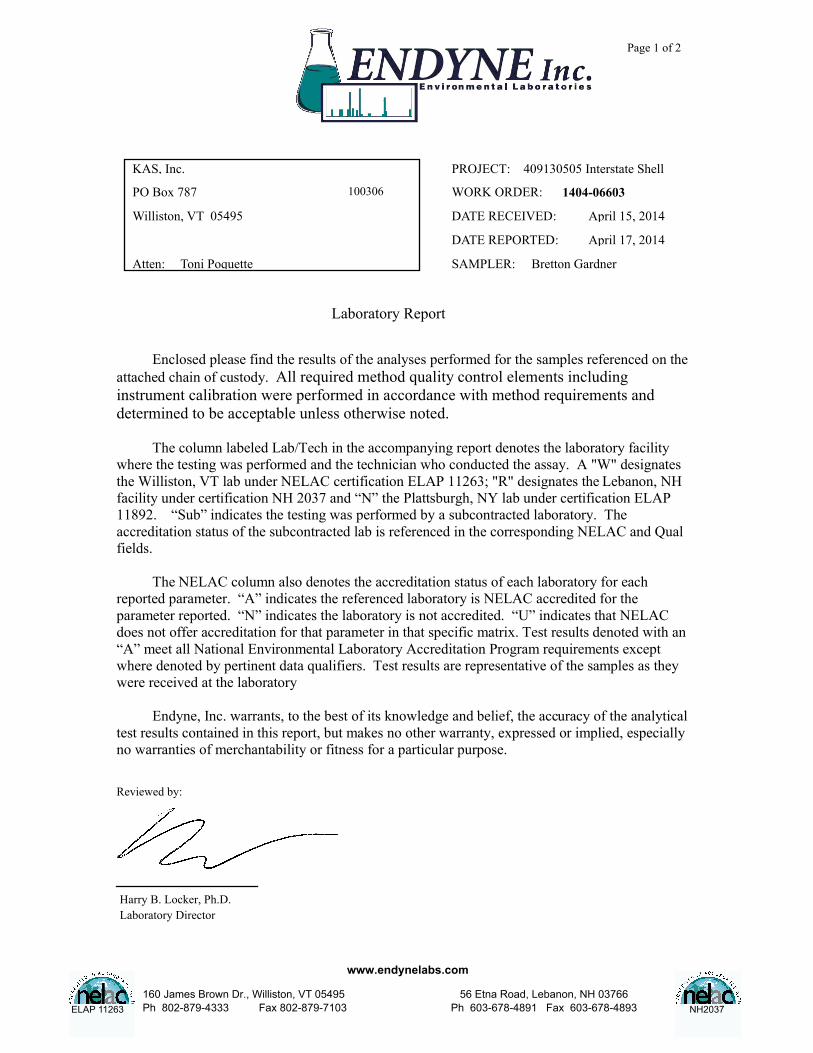
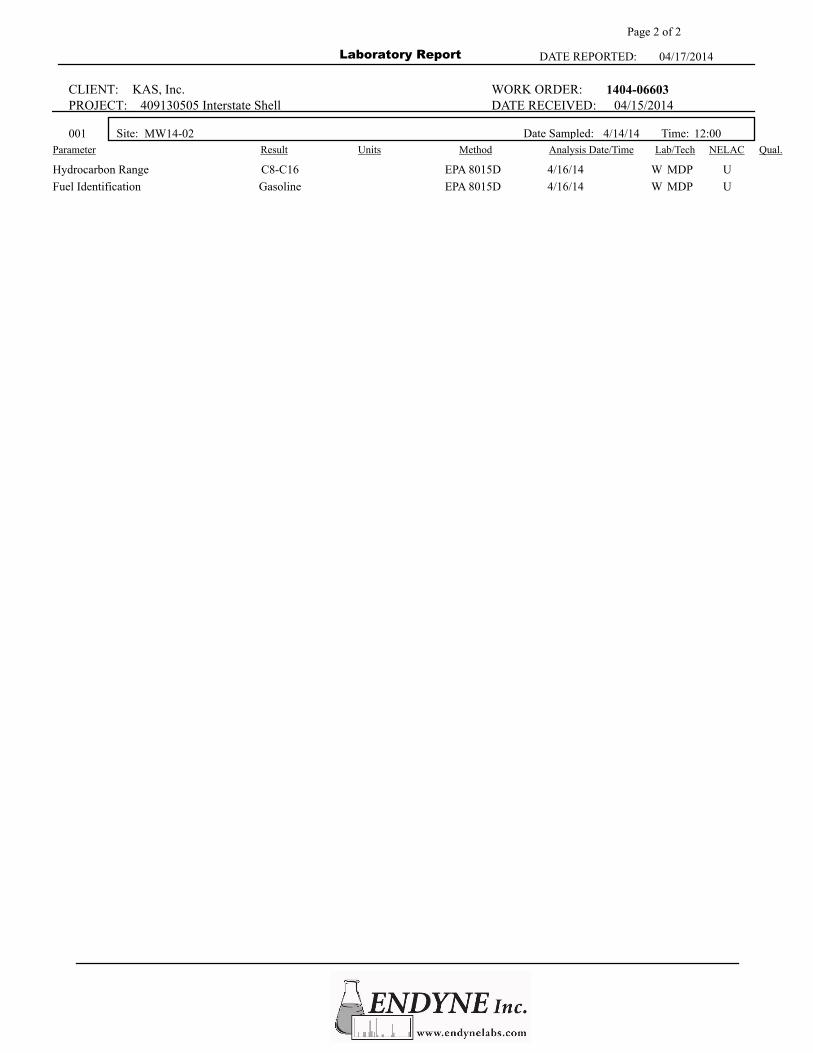
KAS initiated the manual bailing of LNAPL from monitoring well MW14-02 on April 4, 2014 following a request from the VTDEC. During each site visit LNAPL is manually recovered and placed in a 55 gallon steel drum located in the on-site garage. Bailing initially occurred on a weekly basis and was reduced to a biweekly basis starting on April 28, 2014. A total of 250 ounces (1.95 gallons) has been recovered. The overall thickness of LNAPL has decreased from 1.3 feet to 0.1 feet during the reporting period. A table of the LNAPL recovery is presented in Appendix F. On April 14, 2014 a LNAPL sample was taken and submitted to Endyne, Inc. of Williston, VT for fuel ID analysis via EPA method 8015D. The fuel ID was reported as being gasoline.
5.0 Site Hydrogeology 5.1 Contaminant Distribution
5.1.1 Soil
Based on a review of field screening data collected at the Site, it appears elevated levels of petroleum impacts to soils (adsorbed contamination) are present in the vicinity of the northern pump island at depths ranging from 0 feet to 15 feet bg (soil boring SB14-02); however, PID readings decreased with depth in SB14-02. Low levels of adsorbed contamination less than 10.0 ppm were present in soil borings SB14-01 and SB14-03, and between 10 ppm to 30 ppm in SB14-04.
A petroleum odor was noted in various soil samples collected from soil borings SB14-02 and SB14-04. Saturated soils were encountered in a gravelly sand layer in the four soil borings. Soil boring logs are included in Appendix B.
5.1.2 Groundwater
Groundwater analytical data collected at the Site indicates that dissolved petroleum constituents (VOCs) are present at concentrations above enforcement standards in groundwater in the vicinity of monitoring well MW14-04. EDB was reported at non-detectable levels in all three monitoring wells sampled on March 28, 2014.
The highest levels of VOCs were noted in groundwater collected from MW14-04. Low levels of VOCs were reported in groundwater collected from monitoring well MW14-03. No VOCs were reported in groundwater collected from MW14-01. LNAPL was present in monitoring well MW14-02. Based on the Contaminant Concentration Map included in Appendix A, the full extent of the dissolved phase contaminant plume has not been fully defined and appears to be predominantly travelling north towards the intersection of Williston Road and Dorset Street.
6.0 Conceptual Hydrogeologic Model 6.1 Site Conditions
The Interstate Shell is located in South Burlington on the southern side of Williston Road (US Route 2) and the eastern side of Dorset Street. Two structures currently reside on the property. The main structure is used as a convenience store located in the middle of the property and does not contain a basement. The second is a garage located on the southeastern portion of the property used to house the dumpster and for storage. The topography of the site is fairly flat with a gradual slope to the northwest towards the intersection of Williston Road and Dorset Street. The area immediately around the on-site building consists primarily of a paved parking lot. The nearest off-site building is located approximately 100 feet to the south and was occupied on March 20, 2014. This building does not contain a basement.
Initial Site Investigation of Subsurface Petroleum Contamination Report Interstate Shell, South Burlington, Vermont
5 KAS#409130505
6.2 Geology
Bedrock is indicated as being the Clarendon Springs Formation, which consists of calcite dolostone containing white quartz knots and locally contains calcite marble within dolostone of the Chipman Formation1.
Surficial deposits in the vicinity of the site are indicated to be pebbly marine sand, Champlain Sea deposit2.
Based on investigation activities conducted at the Site to date, the Site geology consists of gravelly sand with some silt, silt, and clay at the bottom of exploration for each soil boring (Boring Log and Well Construction Diagrams; Appendix B).
6.3 Hydrogeology
Depth to groundwater beneath the Site was observed to flow from southwest to northeast at a depth ranging from 8.24 feet to 9.40 feet bg. Groundwater was documented to flow to the northeast under a shallow gradient of approximately 1.0%.
6.4 Apparent Source of Contamination
Petroleum contamination was first detected at the Site in October 2013. Subsurface petroleum contamination that is present beneath the Site has been attributed to a historic generation of USTs and pump dispensers. Contamination was encountered in soils beneath the northern pump dispensers and diesel USTs in October 2013. The USTs, pump dispensers, and associated piping were found to be in fair to good condition. The majority of the contamination on-site is likely from a release from the associated UST piping based on the location and depth (0-2 ft) of the elevated PID readings in the vicinity of soil boring SB14-02. The source of LNAPL may be from the northern dispenser island.
The CVOC compound PCE is believed to originate from the Greer’s Laundry Mat/Dry Cleaning (VTDEC #20053395) located to the south of the Site. No other sources of contamination have been positively identified at this time.
6.5 Contaminant Transport
Based on the groundwater analytical data collected during the initial site investigation conducted at the Site, it appears petroleum contamination is predominantly migrating in a northerly direction. Additional monitoring and/or monitoring points are needed to determine a trend in groundwater flow direction and contaminant transport.
Dissolved phase contamination in groundwater is expected to continue due to the elevated concentration in soils near monitoring well MW14-04 and the presence of LNAPL in MW14-02. Petroleum contamination may extend further towards the north under Williston Road and potentially further west under Dorset Street. The full extent of the contaminant plume was not defined during the initial site investigation.
6.6 Sensitive Receptor Risk Assessment
A sensitive receptor risk assessment of the area surrounding the Site is provided below, and a determination of the potential risk to identified receptors has been made based on proximity to the contaminant plume, groundwater flow direction, contaminant mobility and volatility, contaminant concentration levels in subsurface soils and groundwater, and indoor air quality screening results. The following sensitive receptors have been identified:
6.6.1 Buildings in the Vicinity
The on-site structure is built slab on grade in a presumed upgradient location approximately 40 feet from the source area, and does not contain a basement. During the initial site investigation, indoor air screening results ranged from 0.4 to 0.5 ppm. Given the construction of the building, depth of impacted soil, and the screening results, the immediate and future risk to the building from the migration of petroleum vapors is considered to be low.
The closest off-site building to the source area is a commercial gift store (VT Gift Barn) located approximately 125 feet to the east of the northern dispensers, and a bridal boutique
1Bedrock Geologic Map of Vermont, State of Vermont, Ratcliffe, Stanley, Gale, Thompson & Walsh, 2011 2Natural Resource Atlas, Vermont Natural Resources, http://anrmaps.vermont.gov/websites/anra/
Initial Site Investigation of Subsurface Petroleum Contamination Report Interstate Shell, South Burlington, Vermont
6 KAS#409130505
(Needleman’s Bridal) and laundry mat/dry cleaning business (Greers Laundry Mat/Dry Cleaning; VTDEC #20053395) located approximately 100 feet to the south of the former USTs. Indoor air screening was conducted in the basement of the VT Gift Barn. A PID reading of 0.2 ppm was recorded throughout the basement. Indoor air screening was not conducted in Needleman’s Bridal due to the lack of a basement and presumed upgradient location from the source area.
Additional off-site buildings are located to the north across Williston Road and the west across Dorset Street. Due to the location, distance, and indoor air screening results, off-site buildings are not believed to be at risk of being impacted by petroleum vapor migration at this time.
6.6.2 Water Supplies
The Site and its vicinity are serviced by the City of South Burlington water and sewer which is located over a half mile away from the Site. According to the Vermont Agency of Natural Resources Natural Resources Atlas mapping tool (http://anrmaps.vermont.gov/websites/anra/), no private drinking water wells and no public water supply wells have been identified within a half mile radius of the Site. The closest well is located approximately 3,400 feet to the southwest of the Site. Based on the data collected during this initial site investigation, it is not believed that drinking water supplies are at potential risk to petroleum contamination.
6.6.3 Utility Corridors
There are several utility corridors located in the vicinity of the Site. Overhead electrical and telephone lines, underground electrical, and telecommunication lines, and the city underground water and sewer line utility corridors are located along Williston Road and Dorset Street, north and west of the Site. Natural gas utilities are located from the western corner of the property and extend to the middle of the on-site structure. An additional natural gas line is located on the grass along the western portion of the property to the Needleman’s bridal boutique building to the south.
A private storm drain is located on the southeastern portion of the Site. According to COCO, the storm drain pipe runs along the southern portion of the Site to a catch basin on Dorset Street. The on-site water line is indicated to run from Williston Road, across the front of the northern pump island, to the northeastern corner of the on-site building. The on-site water line extends from Williston Road and along the front of the northern pump island to the on-site building.
Based on data gathered during this investigation at the site it appears the depth to groundwater is below the approximate depth of a typical buried utility line. Therefore, the risk for contaminant migration along the aforementioned corridors is considered low at this time.
Five City of South Burlington catch basins are located along Williston Road and Dorset Street. Four catch basins were screened on March 20, 2014 with a properly calibrated PID. Readings ranged from 0.0 ppm to 1.1 ppm. Based on the data gathered to date, the catch basins are considered to be at low risk of petroleum contamination at this time.
6.6.4 Surface Waters
No potential jurisdictional wetlands were observed in the immediate vicinity (Site and abutters) of the Site. The nearest surface water, an unnamed stream, is located approximately 1,200 feet to the northeast of the source area. Based on the data collected during this initial site investigation is not believed to be a potential receptor to the subsurface contamination at this time due to the location and distance from the source area.
6.7 Impacted Third Parties
Based on the data collected during the initial site investigation significant off-site impact to neighboring properties is not likely. However, the potential exists that the contaminant plume extends further north beneath Williston Road and potentially further west towards Dorset Street. Additional data would be needed to fully define the contaminant plume.
7.0 Conclusions Based on the results of the March 20, 2014 initial site investigation, and additional work performed at the Site, the following conclusions are offered:
Initial Site Investigation of Subsurface Petroleum Contamination Report Interstate Shell, South Burlington, Vermont
7 KAS#409130505
On March 20, 2014, KAS oversaw the advancement of four soil borings (SB14-01 through SB14-04) and the installation of four monitoring wells (MW14-01 through MW14-04). The monitoring wells were installed to a depth of 15 feet bg;
On March 28, 2014 four on-site monitoring wells (MW14-01 through MW14-04) were gauged. LNAPL was detected in monitoring well MW14-02 with a thickness of 1.3 feet. Depth to groundwater ranged from 8.24 feet to 9.40 feet bg;
Groundwater samples were collected from three monitoring wells (MW14-01, MW14-03, and MW14-04) immediately following well gauging on March 28, 2014;
Monitoring well MW14-01 contained Toluene above the laboratory detection limit but below its respective VGES;
Monitoring well MW14-03 contained non-detectable levels of petroleum related VOC compounds. The CVOC compound Tetrachloroethene (PCE) was detected, but below its respective VGES;
Monitoring well MW14-04 contained Benzene above its respective VGES. The CVOC compound PCE was detected, but below its respective VGES; and,
The presence of PCE in monitoring wells MW14-03 and MW14-04 is believed to be from the Greer’s Laundry Mat/Dry Cleaning (VTDEC #20053395) located to the south of the Site;
A total of 250 ounces (1.95 gallons) has been recovered from monitoring well MW14-02. The overall thickness of LNAPL has decreased from 1.3 feet to 0.1 feet during the reporting period;
It appears petroleum contamination is predominantly migrating in a northerly direction. Additional monitoring and/or monitoring points are needed to determine a trend in groundwater flow direction and contaminant transport. Contamination may extend further towards the north under Williston Road and potentially west under Dorset Street. The full extent of the contaminant plume was not defined during the initial site investigation; and,
No sensitive receptors in the vicinity of the site, other than soil and groundwater, have been identified as being at potential risk of impact from subsurface petroleum contamination based on the data collected at the Site.
8.0 Recommendations Based on the results of the initial site investigation conducted at the Interstate Shell, KAS recommends the following:
Continue with the manual bailing of LNAPL from monitoring well MW14-02 on a monthly basis;
The placement of a recovery well downgradient of the northern pump dispensers and a multi-phase extraction (MPE) event be performed in order to remediate the LNAPL within the subsurface. During the installation of the recovery well, up to two additional monitoring wells should be installed on the northern portion and across the road of the Site to further define the contaminant plume.
An additional round of groundwater monitoring should be conducted in August/September 2014 to monitor groundwater impacts and groundwater flow following a MPE event. All accessible on-site monitoring wells should be gauged and groundwater samples collected for analysis of the major petroleum compounds via EPA method 8021B. A work plan and cost estimate to conduct this work can be prepared upon request; and,
Additional recommendations regarding sampling frequency will be made following the next sampling event.

Initial Site Investigation of Subsurface Petroleum Contamination Report Interstate Shell, South Burlington, Vermont
Appendix A
1) Site Location Map 2) Site Map
3) Groundwater Contour Map 4) Contaminant Concentration Map

KAS Job Number: 409130505
Source: www.topoquest.com
Date: 10/15/13 Drawing No. 0 Scale: 1:24,000 By: TP
Interstate Shell1055 Williston Rd., So. Burlington, Vermont
Site Location MapUSGS Map; Datum Nad27
SUBJECTPROPERTY
NORTH

Initial Site Investigation of Subsurface Petroleum Contamination Report Interstate Shell, South Burlington, Vermont
Appendix B
Boring Log and Well Construction Diagrams

Interstate ShellSouth Burlington, Vermont
KAS Project #: Date Installed: 3/20/2014Drilled by : T&K Drilling Drilling Method: Hollow Stem Auger
Driller: Sean and Kevin Boring Diameter.: 4.25"Supervised by: Toni Poquette Development Method: Disposable Bailer
Logged by: Toni Poquette Screened Length: 10 Ft.
Pen/Rec (") Interval (') Soil Characteristics
Grade = 0 Blow Count PID (ppm) Asphalt
0.5 NA 0-2 Well Graded Gravelly Sand (SW) SW
1.0 NA 9.6 dry, brown1.5 Ft<Grade sampled from auger flight2.0
2.5
3.0
3.5
4.0
4.5
5.0
5.5 24/20 5-7 Well Graded Sand with some Gravel (SW) SW
6.0 4/7/7/6 3.0 dry, brown with orange streaks
6.5
7.0
7.5
BORING LOG AND WELL CONSTRUCTION DIAGRAMBoring/Well No: SB14-01/MW14-01
409130505
Well Construction
Gra
ph
ic S
ymb
ol
Gra
phi
c Sy
mb
ol
Lett
er S
ymb
ol
8.0 8.52'
8.5 3/28/14
9.0 ~7.5-10'
9.5 3/20/14
10.0
10.5 24/12 10-12 Well Graded Sand (SW) SW11.0 2/2/2/3 1.9 wet, brown and gray
11.5 well set at 15'
12.0
12.5
13.0
13.5
14.0
14.5
15.0
15.5 24/18 15-17 Poorly Graded Silty Sand with some Clay (SM-SC) SM
16.0 1/2/2/3 0.9 wet, brown and gray
16.5
17.0 SC
17.5 End of Exploration at 17'
18.0
18.5
19.0
Road Box with Bolt Down Cover, Set in Cement. Locking Plug.
Existing Surface. 2" ID, Schedule 40 PVC Riser.
Bentonite Seal Placed in Annulus. 2" ID, Schedule 40 PVC, 0.010"-Slotted Well Screen
Grade #1 Silica Sand Pack Placed in Annulus. Plug Point
Drill Cuttings Placed in Annulus.
NA Not Applicable Approximate Water Level During Drilling
Static Water Level
Legend
Interstate ShellSouth Burlington, Vermont
KAS Project #: Date Installed: 3/20/2014Drilled by : T&K Drilling Drilling Method: Hollow Stem Auger
Driller: Sean and Kevin Boring Diameter.: 4.25"Supervised by: Toni Poquette Development Method: NA
Logged by: Toni Poquette Screened Length: 10 Ft.
Pen/Rec (") Interval (') Soil Characteristics
Grade = 0 Blow Count PID (ppm) Asphalt
0.5 NA 0-2 Well Graded Gravelly Sand (SW) SW
1.0 NA 480 dry, brown1.5 Ft<Grade sampled from auger flight, sweet odor noted2.0
2.5
3.0
3.5
4.0
4.5
5.0
5.5 24/24 5-7 Well Graded Sand with some Gravel (SW) SW
6.0 3/3/6/8 251 dry, brown with orange to gray
6.5 odor present in sample
7.0
7.5
BORING LOG AND WELL CONSTRUCTION DIAGRAM
Well Construction
409130505
Boring/Well No: SB14-02/MW14-02
Gra
ph
ic S
ymb
ol
Gra
phi
c Sy
mb
ol
Lett
er S
ymb
ol
8.0
8.5 ~7.5-10'
9.0 3/20/14
9.5 9.24'
10.0 3/28/14
10.5 24/14 10-12 Well Graded Silty Sand with Gravel (SM) SM11.0 2/2/3/2 145 wet, brown and gray with orange streaking
11.5 well set at 15'
12.0
12.5
13.0
13.5
14.0
14.5
15.0
15.5 24/18 15-17 Poorly Graded Sandy Silt with Clay (ML-CL) ML
16.0 2/2/1/1 10.2 wet, brown to gray
16.5 CL
17.0
17.5 End of Exploration at 17'
18.0
18.5
19.0
Road Box with Bolt Down Cover, Set in Cement. Locking Plug.
Existing Surface. 2" ID, Schedule 40 PVC Riser.
Bentonite Seal Placed in Annulus. 2" ID, Schedule 40 PVC, 0.010"-Slotted Well Screen
Grade #1 Silica Sand Pack Placed in Annulus. Plug Point
Drill Cuttings Placed in Annulus.
NA Not Applicable Approximate Water Level During Drilling
Static Water Level
Legend
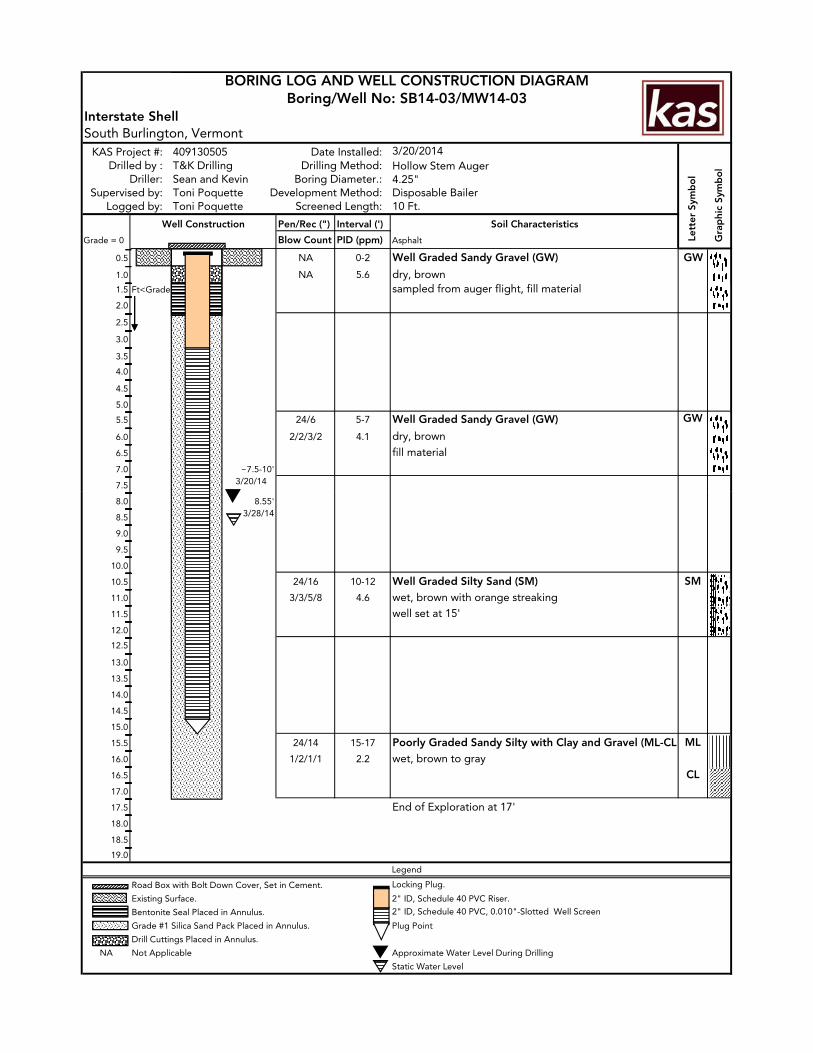
Interstate ShellSouth Burlington, Vermont
KAS Project #: Date Installed: 3/20/2014Drilled by : T&K Drilling Drilling Method: Hollow Stem Auger
Driller: Sean and Kevin Boring Diameter.: 4.25"Supervised by: Toni Poquette Development Method: Disposable Bailer
Logged by: Toni Poquette Screened Length: 10 Ft.
Pen/Rec (") Interval (') Soil Characteristics
Grade = 0 Blow Count PID (ppm) Asphalt
0.5 NA 0-2 Well Graded Sandy Gravel (GW) GW
1.0 NA 5.6 dry, brown1.5 Ft<Grade sampled from auger flight, fill material2.0
2.5
3.0
3.5
4.0
4.5
5.0
5.5 24/6 5-7 Well Graded Sandy Gravel (GW) GW
6.0 2/2/3/2 4.1 dry, brown
6.5 fill material
7.0 ~7.5-10'
7.5 3/20/14
BORING LOG AND WELL CONSTRUCTION DIAGRAM
Well Construction
Boring/Well No: SB14-03/MW14-03
409130505
Gra
ph
ic S
ymb
ol
Gra
phi
c Sy
mb
ol
Lett
er S
ymb
ol
8.0 8.55'
8.5 3/28/14
9.0
9.5
10.0
10.5 24/16 10-12 Well Graded Silty Sand (SM) SM11.0 3/3/5/8 4.6 wet, brown with orange streaking11.5 well set at 15'
12.0
12.5
13.0
13.5
14.0
14.5
15.0
15.5 24/14 15-17 Poorly Graded Sandy Silty with Clay and Gravel (ML-CL) ML16.0 1/2/1/1 2.2 wet, brown to gray16.5 CL17.0
17.5 End of Exploration at 17'18.0
18.5
19.0
Road Box with Bolt Down Cover, Set in Cement. Locking Plug.
Existing Surface. 2" ID, Schedule 40 PVC Riser.
Bentonite Seal Placed in Annulus. 2" ID, Schedule 40 PVC, 0.010"-Slotted Well Screen
Grade #1 Silica Sand Pack Placed in Annulus. Plug Point
Drill Cuttings Placed in Annulus.
NA Not Applicable Approximate Water Level During Drilling
Static Water Level
Legend

Interstate ShellSouth Burlington, Vermont
KAS Project #: Date Installed: 3/20/2014Drilled by : T&K Drilling Drilling Method: Hollow Stem Auger
Driller: Sean and Kevin Boring Diameter.: 4.25"Supervised by: Toni Poquette Development Method: Disposable Bailer
Logged by: Toni Poquette Screened Length: 10 Ft.
Pen/Rec (") Interval (') Soil Characteristics
Grade = 0 Blow Count PID (ppm) Gravel
0.5 NA 0-2 Well Graded Sandy Gravel (GW) GW
1.0 NA 11.0 dry, brown1.5 Ft<Grade sampled from auger flight, sweet odor noted2.0
2.5
3.0
3.5
4.0
4.5
5.0
5.5 24/18 5-7 Well Graded Gravelly Sand (SW) SW
6.0 8/15/16/12 18.6 dry, brown
6.5 sweet odor noted
7.0 ~6'
7.5 3/20/14
BORING LOG AND WELL CONSTRUCTION DIAGRAMBoring/Well No: SB14-04/MW14-04
409130505
Well Construction
Gra
ph
ic S
ymb
ol
Gra
phi
c Sy
mb
ol
Lett
er S
ymb
ol
8.0 8.24'
8.5 3/28/14
9.0
9.5
10.0
10.5 24/16 10-12 Well Graded Gravelly Sand (SW) SW11.0 1/2/3/2 26.9 wet, brown with orange streaking11.5 sweet odor with petroleum odor noted
12.0
12.5
13.0
13.5
14.0
14.5
15.0
15.5 24/16 15-17 Poorly Graded Sandy, Silty Clay (SM-CL) SM16.0 1/1/1/1 4.6 wet, brown to gray CL16.5
17.0
17.5 End of Exploration at 17'18.0
18.5
19.0
Road Box with Bolt Down Cover, Set in Cement. Locking Plug.
Existing Surface. 2" ID, Schedule 40 PVC Riser.
Bentonite Seal Placed in Annulus. 2" ID, Schedule 40 PVC, 0.010"-Slotted Well Screen
Grade #1 Silica Sand Pack Placed in Annulus. Plug Point
Drill Cuttings Placed in Annulus.
NA Not Applicable Approximate Water Level During Drilling
Static Water Level
Legend
Initial Site Investigation of Subsurface Petroleum Contamination Report Interstate Shell, South Burlington, Vermont
Appendix C
Liquid Level Monitoring Data

Liquid Level Monitoring Data Interstate ShellSouth Burlington, Vermont
Top of Depth To Depth To Specific Corrected Corrected
Well I.D. Well Depth Casing Product Water Product Gravity Water Depth Water Table
btoc Elevation btoc btoc Thickness Of Product Equivalent To Water Elevation
MW14-01 15.00 100.00 - 8.52 - - - - 91.48
MW14-02 15.00 100.49 8.10 9.40 1.30 0.88 1.14 9.24 91.25
MW14-03 15.00 100.52 - 8.55 - - - - 91.97
MW14-04 15.00 100.88 - 8.24 - - - - 92.64
Well I.D. 3/28/2014
MW14-01 91.48
MW14-02 91.25
MW14-03 91.97
MW14-04 92.64
All Values Reported in Feet btoc - Below Top of CasingElevations determined relative to top of casing at MW14-01, which was arbitrarily set at 100'Site surveyed by KAS, Inc. on March 20, 2014
Measurement Date: March 28, 2014
Historic Liquid Level Monitoring Data
VTDEC #2013-4452KAS #409130505

Initial Site Investigation of Subsurface Petroleum Contamination Report Interstate Shell, South Burlington, Vermont
Appendix D
Groundwater Quality Summary

Groundwater Quality Summary Interstate ShellSouth Burlington, Vermont
MW14-01Sample Date 3/28/2014
Method 8260BPARAMETER VGESBenzene ND<1.0 5Toluene 1.7 1,000 Ethylbenzene ND<1.0 700Xylenes ND<2.0 10,000Total BTEX 1.7 - MTBE ND<2.0 401,3,5-Trimethybenzene ND<1.01,2,4-Trimethylbenzene ND<1.0Naphthalene ND<2.0 20Total Targeted VOCs 1.7 -Ethylene Dibromide (EDB)* ND<0.05 0.05GW Elevation (ft bg) 91.48 -
All Values Reported in ug/L (ppb)VGES - Vermont Groundwater Enforcement Standard (February 14, 2005)ND - None detected above sample-specific compound detection limitBold font indicates a detected concentration.Shaded values meet or exceed VGESEDB*: analyzed via EPA method 8011
350
VTDEC #2013-4452KAS #409130505
Groundwater Quality Summary Interstate ShellSouth Burlington, Vermont
MW14-02Sample Date 3/28/2014
Method 8260BPARAMETER VGESBenzene 5Toluene 1,000 Ethylbenzene 700Xylenes 10,000Total BTEX - MTBE 401,3,5-Trimethybenzene1,2,4-TrimethylbenzeneNaphthalene 20Total Targeted VOCs -Ethylene Dibromide (EDB)* 0.05GW Elevation (ft bg) 91.25 -
All Values Reported in ug/L (ppb)VGES - Vermont Groundwater Enforcement Standard (February 14, 2005)ND - None detected above sample-specific compound detection limitBold font indicates a detected concentration.Shaded values meet or exceed VGESEDB*: analyzed via EPA method 8011
350
Well Not Sampled
LNAPL 1.3'
VTDEC #2013-4452KAS #409130505
Groundwater Quality Summary Interstate ShellSouth Burlington, Vermont
MW14-03Sample Date 3/28/2014
Method 8260BPARAMETER VGESBenzene ND<1.0 5Toluene ND<1.0 1,000 Ethylbenzene ND<1.0 700Xylenes ND<2.0 10,000Total BTEX ND - MTBE ND<2.0 401,3,5-Trimethybenzene ND<1.01,2,4-Trimethylbenzene ND<1.0Naphthalene ND<2.0 20Tetrachloroethene (PCE) 2.7 5Petroleum related VOCs ND -Total Targeted VOCs 2.7 -Ethylene Dibromide (EDB)* ND<0.05 0.05GW Elevation (ft bg) 91.97 -
All Values Reported in ug/L (ppb)VGES - Vermont Groundwater Enforcement Standard (February 14, 2005)ND - None detected above sample-specific compound detection limitBold font indicates a detected concentration.Shaded values meet or exceed VGESEDB*: analyzed via EPA method 8011
350
VTDEC #2013-4452KAS #409130505

Groundwater Quality Summary Interstate ShellSouth Burlington, Vermont
MW14-04Sample Date 3/28/2014
Method 8260BPARAMETER VGESBenzene 7.9 5Toluene 5.6 1,000 Ethylbenzene 6.2 700Xylenes 12.1 10,000Total BTEX 31.8 - MTBE ND<2.0 40n-Propylbenzene 1.1 -1,3,5-Trimethybenzene ND<1.01,2,4-Trimethylbenzene 2.6Naphthalene ND<2.0 20Tetrachloroethene (PCE) 2.2 5Petroleum related VOCs 35.5 -Total Targeted VOCs 37.7 -Ethylene Dibromide (EDB)* ND<0.05 0.05GW Elevation (ft bg) 92.64 -
All Values Reported in ug/L (ppb)VGES - Vermont Groundwater Enforcement Standard (February 14, 2005)ND - None detected above sample-specific compound detection limitBold font indicates a detected concentration.Shaded values meet or exceed VGESEDB*: analyzed via EPA method 8011
350
y
VTDEC #2013-4452KAS #409130505

Groundwater Quality Summary Interstate ShellSouth Burlington, Vermont
PARAMETER Trip Blank MW14-04 Duplicate RPD % VGESBenzene ND<1.0 7.9 7.5 5.2 5Toluene ND<1.0 5.6 5.5 1.8 1,000 Ethylbenzene ND<1.0 6.2 6.2 0.0 700Xylenes ND<2.0 12.1 13.6 -11.7 10,000 Total BTEX ND 31.8 32.8 -3.1 - MTBE ND<2.0 ND<2.0 ND<2.0 - 40n-Propylbenzene ND<1.0 1.1 1.1 0.01,3,5-TMB* ND<1.0 ND<1.0 1.4 - 1,2,4-TMB* ND<1.0 2.6 4.1 -44.8Naphthalene ND<2.0 ND<2.0 ND<2.0 - 20Tetrachloroethene (PCE) ND<1.0 2.2 2.0 9.5 5Total Targeted VOCs M8260B ND 37.7 41.4 -9.4 -
NOTES
350
Date of Sample CollectionMarch 28, 2014
Quality Assurance and Control Summary
The results of the laboratory analysis of the duplicate sample were analyzed using a relative percent difference (RPD) analysis. The RPD is defined as 100 times the difference in reported concentration between sample and duplicate, divided by the mean of the two samples. A small RPD indicates
* TMB = Trimethyl BenzeneAll values reported in ug/l (ppb) unless otherwise notedND<X - Not Detected (Detection Limit)Bold font indicates a detected concentration.Shaded values meet or exceed VGES
VTDEC #2013-4452KAS #409130505

Initial Site Investigation of Subsurface Petroleum Contamination Report Interstate Shell, South Burlington, Vermont
Appendix E
Analytical Laboratory Report
Laboratory Report
409130505 Interstate ShellPROJECT:
DATE RECEIVED:
WORK ORDER:
DATE REPORTED:
100306KAS, Inc.
PO Box 787
Williston, VT 05495
Atten: Toni Poquette SAMPLER:
April 08, 2014
1403-05561
Toni Poquette
March 31, 2014
Reviewed by:
Harry B. Locker, Ph.D.
Laboratory Director
Enclosed please find the results of the analyses performed for the samples referenced on the attached chain of custody. All required method quality control elements including instrument calibration were performed in accordance with method requirements and determined to be acceptable unless otherwise noted.
The column labeled Lab/Tech in the accompanying report denotes the laboratory facility where the testing was performed and the technician who conducted the assay. A "W" designates the Williston, VT lab under NELAC certification ELAP 11263; "R" designates the Lebanon, NH facility under certification NH 2037 and “N” the Plattsburgh, NY lab under certification ELAP 11892. “Sub” indicates the testing was performed by a subcontracted laboratory. The accreditation status of the subcontracted lab is referenced in the corresponding NELAC and Qual fields.
The NELAC column also denotes the accreditation status of each laboratory for each reported parameter. “A” indicates the referenced laboratory is NELAC accredited for the parameter reported. “N” indicates the laboratory is not accredited. “U” indicates that NELAC does not offer accreditation for that parameter in that specific matrix. Test results denoted with an “A” meet all National Environmental Laboratory Accreditation Program requirements except where denoted by pertinent data qualifiers. Test results are representative of the samples as they were received at the laboratory
Endyne, Inc. warrants, to the best of its knowledge and belief, the accuracy of the analytical
test results contained in this report, but makes no other warranty, expressed or implied, especially no warranties of merchantability or fitness for a particular purpose.
160 James Brown Dr., Williston, VT 05495
Ph 802-879-4333 Fax 802-879-7103 ELAP 11263
www.endynelabs.com
NH203756 Etna Road, Lebanon, NH 03766
Ph 603-678-4891 Fax 603-678-4893
Laboratory Report
KAS, Inc.
Page 2 of 6
CLIENT:PROJECT: 409130505 Interstate Shell
WORK ORDER:DATE RECEIVED:
1403-0556103/31/2014
4/8/2014REPORT DATE:
001 Date Sampled: 3/28/14Site: MW14-01 4/2/14 MDPWAnalysis Date:10:52
QualNelac
Result
UnitResult
Result
ParameterQualNelac
Result
UnitResult
Result
Parameter
TEST METHOD: EPA 8011
Completed U8011 Extraction < 0.05 UEthylene Dibromide ug/L
< 0.05 U1,2-Dibromo-3-chloropropane ug/L < 5.0 ADichlorodifluoromethane ug/L
< 3.0 NChloromethane ug/L < 2.0 AVinyl chloride ug/L
< 5.0 ABromomethane ug/L < 5.0 AChloroethane ug/L
< 2.0 ATrichlorofluoromethane ug/L < 5.0 NDiethyl ether ug/L
< 1.0 A1,1-Dichloroethene ug/L < 10.0 AAcetone ug/L
< 5.0 ACarbon disulfide ug/L < 5.0 AMethylene chloride ug/L
< 20.0 QA-Nt-Butanol ug/L < 2.0 AMethyl-t-butyl ether (MTBE) ug/L
< 1.0 Atrans-1,2-Dichloroethene ug/L < 2.0 NDi-isopropyl ether (DIPE) ug/L
< 1.0 A1,1-Dichloroethane ug/L < 2.0 NEthyl-t-butyl ether (ETBE) ug/L
< 10.0 A2-Butanone ug/L < 2.0 N2,2-Dichloropropane ug/L
< 1.0 Ncis-1,2-Dichloroethene ug/L < 2.0 NBromochloromethane ug/L
< 1.0 AChloroform ug/L < 10.0 UTetrahydrofuran ug/L
< 1.0 A1,1,1-Trichloroethane ug/L < 1.0 ACarbon tetrachloride ug/L
< 1.0 N1,1-Dichloropropene ug/L < 1.0 ABenzene ug/L
< 2.0 Nt-Amylmethyl ether (TAME) ug/L < 1.0 A1,2-Dichloroethane ug/L
< 1.0 ATrichloroethene ug/L < 2.0 A1,2-Dichloropropane ug/L
< 2.0 NDibromomethane ug/L < 0.5 ABromodichloromethane ug/L
< 1.0 Acis-1,3-Dichloropropene ug/L < 10.0 N4-Methyl-2-pentanone (MIBK) ug/L
1.7 AToluene ug/L < 2.0 Atrans-1,3-Dichloropropene ug/L
< 1.0 A1,1,2-Trichloroethane ug/L < 1.0 ATetrachloroethene ug/L
< 1.0 N1,3-Dichloropropane ug/L < 10.0 N2-Hexanone ug/L
< 2.0 ADibromochloromethane ug/L < 1.0 A1,2-Dibromoethane ug/L
< 1.0 AChlorobenzene ug/L < 1.0 AEthylbenzene ug/L
< 2.0 A1,1,1,2-Tetrachloroethane ug/L < 2.0 AXylenes, Total ug/L
< 1.0 NStyrene ug/L < 2.0 ABromoform ug/L
< 1.0 AIsopropylbenzene ug/L < 2.0 A1,1,2,2-Tetrachloroethane ug/L
< 1.0 NBromobenzene ug/L < 1.0 An-Propylbenzene ug/L
< 2.0 N1,2,3-Trichloropropane ug/L < 1.0 N2-Chlorotoluene ug/L
< 1.0 A1,3,5-Trimethylbenzene ug/L < 1.0 N4-Chlorotoluene ug/L
< 1.0 At-Butylbenzene ug/L < 1.0 A1,2,4-Trimethylbenzene ug/L
< 1.0 Ns-Butylbenzene ug/L < 1.0 A4-Isopropyltoluene ug/L
< 1.0 A1,3-Dichlorobenzene ug/L < 1.0 A1,4-Dichlorobenzene ug/L
< 2.0 An-Butylbenzene ug/L < 1.0 A1,2-Dichlorobenzene ug/L
< 2.0 QA-A1,2-Dibromo-3-Chloropropane ug/L < 2.0 A1,2,4-Trichlorobenzene ug/L
< 2.0 N1,3,5-Trichlorobenzene ug/L < 0.5 NHexachlorobutadiene ug/L
< 2.0 ANaphthalene ug/L < 2.0 N1,2,3-Trichlorobenzene ug/L
108 NSurr. 1 (Dibromofluoromethane) % 99 NSurr. 2 (Toluene d8) %
95 NSurr. 3 (4-Bromofluorobenzene) % 0 UUnidentified Peaks

Laboratory Report
KAS, Inc.
Page 3 of 6
CLIENT:PROJECT: 409130505 Interstate Shell
WORK ORDER:DATE RECEIVED:
1403-0556103/31/2014
4/8/2014REPORT DATE:
002 Date Sampled: 3/28/14Site: MW14-03 4/2/14 MDPWAnalysis Date:11:21
QualNelac
Result
UnitResult
Result
ParameterQualNelac
Result
UnitResult
Result
Parameter
TEST METHOD: EPA 8011
Completed U8011 Extraction < 0.05 UEthylene Dibromide ug/L
< 0.05 U1,2-Dibromo-3-chloropropane ug/L < 5.0 ADichlorodifluoromethane ug/L
< 3.0 NChloromethane ug/L < 2.0 AVinyl chloride ug/L
< 5.0 ABromomethane ug/L < 5.0 AChloroethane ug/L
< 2.0 ATrichlorofluoromethane ug/L < 5.0 NDiethyl ether ug/L
< 1.0 A1,1-Dichloroethene ug/L < 10.0 AAcetone ug/L
< 5.0 ACarbon disulfide ug/L < 5.0 AMethylene chloride ug/L
< 20.0 QA-Nt-Butanol ug/L < 2.0 AMethyl-t-butyl ether (MTBE) ug/L
< 1.0 Atrans-1,2-Dichloroethene ug/L < 2.0 NDi-isopropyl ether (DIPE) ug/L
< 1.0 A1,1-Dichloroethane ug/L < 2.0 NEthyl-t-butyl ether (ETBE) ug/L
< 10.0 A2-Butanone ug/L < 2.0 N2,2-Dichloropropane ug/L
< 1.0 Ncis-1,2-Dichloroethene ug/L < 2.0 NBromochloromethane ug/L
< 1.0 AChloroform ug/L < 10.0 UTetrahydrofuran ug/L
< 1.0 A1,1,1-Trichloroethane ug/L < 1.0 ACarbon tetrachloride ug/L
< 1.0 N1,1-Dichloropropene ug/L < 1.0 ABenzene ug/L
< 2.0 Nt-Amylmethyl ether (TAME) ug/L < 1.0 A1,2-Dichloroethane ug/L
< 1.0 ATrichloroethene ug/L < 2.0 A1,2-Dichloropropane ug/L
< 2.0 NDibromomethane ug/L < 0.5 ABromodichloromethane ug/L
< 1.0 Acis-1,3-Dichloropropene ug/L < 10.0 N4-Methyl-2-pentanone (MIBK) ug/L
< 1.0 AToluene ug/L < 2.0 Atrans-1,3-Dichloropropene ug/L
< 1.0 A1,1,2-Trichloroethane ug/L 2.7 ATetrachloroethene ug/L
< 1.0 N1,3-Dichloropropane ug/L < 10.0 N2-Hexanone ug/L
< 2.0 ADibromochloromethane ug/L < 1.0 A1,2-Dibromoethane ug/L
< 1.0 AChlorobenzene ug/L < 1.0 AEthylbenzene ug/L
< 2.0 A1,1,1,2-Tetrachloroethane ug/L < 2.0 AXylenes, Total ug/L
< 1.0 NStyrene ug/L < 2.0 ABromoform ug/L
< 1.0 AIsopropylbenzene ug/L < 2.0 A1,1,2,2-Tetrachloroethane ug/L
< 1.0 NBromobenzene ug/L < 1.0 An-Propylbenzene ug/L
< 2.0 N1,2,3-Trichloropropane ug/L < 1.0 N2-Chlorotoluene ug/L
< 1.0 A1,3,5-Trimethylbenzene ug/L < 1.0 N4-Chlorotoluene ug/L
< 1.0 At-Butylbenzene ug/L < 1.0 A1,2,4-Trimethylbenzene ug/L
< 1.0 Ns-Butylbenzene ug/L < 1.0 A4-Isopropyltoluene ug/L
< 1.0 A1,3-Dichlorobenzene ug/L < 1.0 A1,4-Dichlorobenzene ug/L
< 2.0 An-Butylbenzene ug/L < 1.0 A1,2-Dichlorobenzene ug/L
< 2.0 QA-A1,2-Dibromo-3-Chloropropane ug/L < 2.0 A1,2,4-Trichlorobenzene ug/L
< 2.0 N1,3,5-Trichlorobenzene ug/L < 0.5 NHexachlorobutadiene ug/L
< 2.0 ANaphthalene ug/L < 2.0 N1,2,3-Trichlorobenzene ug/L
108 NSurr. 1 (Dibromofluoromethane) % 99 NSurr. 2 (Toluene d8) %
96 NSurr. 3 (4-Bromofluorobenzene) % 0 UUnidentified Peaks

Laboratory Report
KAS, Inc.
Page 4 of 6
CLIENT:PROJECT: 409130505 Interstate Shell
WORK ORDER:DATE RECEIVED:
1403-0556103/31/2014
4/8/2014REPORT DATE:
003 Date Sampled: 3/28/14Site: MW14-04 4/2/14 MDPWAnalysis Date:11:48
QualNelac
Result
UnitResult
Result
ParameterQualNelac
Result
UnitResult
Result
Parameter
TEST METHOD: EPA 8011
Completed U8011 Extraction < 0.05 UEthylene Dibromide ug/L
< 0.05 U1,2-Dibromo-3-chloropropane ug/L < 5.0 ADichlorodifluoromethane ug/L
< 3.0 NChloromethane ug/L < 2.0 AVinyl chloride ug/L
< 5.0 ABromomethane ug/L < 5.0 AChloroethane ug/L
< 2.0 ATrichlorofluoromethane ug/L < 5.0 NDiethyl ether ug/L
< 1.0 A1,1-Dichloroethene ug/L < 10.0 AAcetone ug/L
< 5.0 ACarbon disulfide ug/L < 5.0 AMethylene chloride ug/L
< 20.0 Nt-Butanol ug/L < 2.0 AMethyl-t-butyl ether (MTBE) ug/L
< 1.0 Atrans-1,2-Dichloroethene ug/L < 2.0 NDi-isopropyl ether (DIPE) ug/L
< 1.0 A1,1-Dichloroethane ug/L < 2.0 NEthyl-t-butyl ether (ETBE) ug/L
< 10.0 A2-Butanone ug/L < 2.0 N2,2-Dichloropropane ug/L
< 1.0 Ncis-1,2-Dichloroethene ug/L < 2.0 NBromochloromethane ug/L
< 1.0 AChloroform ug/L < 10.0 UTetrahydrofuran ug/L
< 1.0 A1,1,1-Trichloroethane ug/L < 1.0 ACarbon tetrachloride ug/L
< 1.0 N1,1-Dichloropropene ug/L 7.9 ABenzene ug/L
< 2.0 Nt-Amylmethyl ether (TAME) ug/L < 1.0 A1,2-Dichloroethane ug/L
< 1.0 ATrichloroethene ug/L < 2.0 A1,2-Dichloropropane ug/L
< 2.0 NDibromomethane ug/L < 0.5 ABromodichloromethane ug/L
< 1.0 Acis-1,3-Dichloropropene ug/L < 10.0 N4-Methyl-2-pentanone (MIBK) ug/L
5.6 AToluene ug/L < 2.0 Atrans-1,3-Dichloropropene ug/L
< 1.0 A1,1,2-Trichloroethane ug/L 2.2 ATetrachloroethene ug/L
< 1.0 N1,3-Dichloropropane ug/L < 10.0 N2-Hexanone ug/L
< 2.0 ADibromochloromethane ug/L < 1.0 A1,2-Dibromoethane ug/L
< 1.0 AChlorobenzene ug/L 6.2 AEthylbenzene ug/L
< 2.0 A1,1,1,2-Tetrachloroethane ug/L 12.1 AXylenes, Total ug/L
< 1.0 NStyrene ug/L < 2.0 ABromoform ug/L
< 1.0 AIsopropylbenzene ug/L < 2.0 A1,1,2,2-Tetrachloroethane ug/L
< 1.0 NBromobenzene ug/L 1.1 An-Propylbenzene ug/L
< 2.0 N1,2,3-Trichloropropane ug/L < 1.0 N2-Chlorotoluene ug/L
< 1.0 A1,3,5-Trimethylbenzene ug/L < 1.0 N4-Chlorotoluene ug/L
< 1.0 At-Butylbenzene ug/L 2.6 A1,2,4-Trimethylbenzene ug/L
< 1.0 Ns-Butylbenzene ug/L < 1.0 A4-Isopropyltoluene ug/L
< 1.0 A1,3-Dichlorobenzene ug/L < 1.0 A1,4-Dichlorobenzene ug/L
< 2.0 An-Butylbenzene ug/L < 1.0 A1,2-Dichlorobenzene ug/L
< 2.0 A1,2-Dibromo-3-Chloropropane ug/L < 2.0 A1,2,4-Trichlorobenzene ug/L
< 2.0 N1,3,5-Trichlorobenzene ug/L < 0.5 NHexachlorobutadiene ug/L
< 2.0 ANaphthalene ug/L < 2.0 N1,2,3-Trichlorobenzene ug/L
108 NSurr. 1 (Dibromofluoromethane) % 92 NSurr. 2 (Toluene d8) %
95 NSurr. 3 (4-Bromofluorobenzene) % 0 UUnidentified Peaks
Laboratory Report
KAS, Inc.
Page 5 of 6
CLIENT:PROJECT: 409130505 Interstate Shell
WORK ORDER:DATE RECEIVED:
1403-0556103/31/2014
4/8/2014REPORT DATE:
004 Date Sampled: 3/28/14Site: Duplicate 4/4/14 MHMWAnalysis Date:11:48
QualNelac
Result
UnitResult
Result
ParameterQualNelac
Result
UnitResult
Result
Parameter
TEST METHOD: EPA 8260C
< 5.0 ADichlorodifluoromethane ug/L < 3.0 NChloromethane ug/L
< 2.0 AVinyl chloride ug/L < 5.0 ABromomethane ug/L
< 5.0 AChloroethane ug/L < 2.0 ATrichlorofluoromethane ug/L
< 5.0 NDiethyl ether ug/L < 1.0 A1,1-Dichloroethene ug/L
< 10.0 AAcetone ug/L < 5.0 ACarbon disulfide ug/L
< 5.0 AMethylene chloride ug/L < 20.0 QA-Nt-Butanol ug/L
< 2.0 AMethyl-t-butyl ether (MTBE) ug/L < 1.0 Atrans-1,2-Dichloroethene ug/L
< 2.0 NDi-isopropyl ether (DIPE) ug/L < 1.0 A1,1-Dichloroethane ug/L
< 2.0 NEthyl-t-butyl ether (ETBE) ug/L < 10.0 A2-Butanone ug/L
< 2.0 N2,2-Dichloropropane ug/L < 1.0 Ncis-1,2-Dichloroethene ug/L
< 2.0 NBromochloromethane ug/L < 1.0 AChloroform ug/L
< 10.0 UTetrahydrofuran ug/L < 1.0 A1,1,1-Trichloroethane ug/L
< 1.0 ACarbon tetrachloride ug/L < 1.0 N1,1-Dichloropropene ug/L
7.5 ABenzene ug/L < 2.0 Nt-Amylmethyl ether (TAME) ug/L
< 1.0 A1,2-Dichloroethane ug/L < 1.0 ATrichloroethene ug/L
< 2.0 A1,2-Dichloropropane ug/L < 2.0 NDibromomethane ug/L
< 0.5 ABromodichloromethane ug/L < 1.0 Acis-1,3-Dichloropropene ug/L
< 10.0 N4-Methyl-2-pentanone (MIBK) ug/L 5.5 AToluene ug/L
< 2.0 Atrans-1,3-Dichloropropene ug/L < 1.0 A1,1,2-Trichloroethane ug/L
2.0 ATetrachloroethene ug/L < 1.0 N1,3-Dichloropropane ug/L
< 10.0 N2-Hexanone ug/L < 2.0 ADibromochloromethane ug/L
< 1.0 A1,2-Dibromoethane ug/L < 1.0 AChlorobenzene ug/L
6.2 AEthylbenzene ug/L < 2.0 A1,1,1,2-Tetrachloroethane ug/L
13.6 AXylenes, Total ug/L < 1.0 NStyrene ug/L
< 2.0 ABromoform ug/L < 1.0 AIsopropylbenzene ug/L
< 2.0 A1,1,2,2-Tetrachloroethane ug/L < 1.0 NBromobenzene ug/L
1.1 An-Propylbenzene ug/L < 2.0 N1,2,3-Trichloropropane ug/L
< 1.0 N2-Chlorotoluene ug/L 1.4 A1,3,5-Trimethylbenzene ug/L
< 1.0 N4-Chlorotoluene ug/L < 1.0 At-Butylbenzene ug/L
4.1 M+A1,2,4-Trimethylbenzene ug/L < 1.0 Ns-Butylbenzene ug/L
< 1.0 A4-Isopropyltoluene ug/L < 1.0 A1,3-Dichlorobenzene ug/L
< 1.0 A1,4-Dichlorobenzene ug/L < 2.0 An-Butylbenzene ug/L
< 1.0 A1,2-Dichlorobenzene ug/L < 2.0 QA-A1,2-Dibromo-3-Chloropropane ug/L
< 2.0 A1,2,4-Trichlorobenzene ug/L < 2.0 N1,3,5-Trichlorobenzene ug/L
< 0.5 NHexachlorobutadiene ug/L < 2.0 ANaphthalene ug/L
< 2.0 N1,2,3-Trichlorobenzene ug/L 108 NSurr. 1 (Dibromofluoromethane) %
98 NSurr. 2 (Toluene d8) % 97 NSurr. 3 (4-Bromofluorobenzene) %
> 10 UUnidentified Peaks
Laboratory Report
KAS, Inc.
Page 6 of 6
CLIENT:PROJECT: 409130505 Interstate Shell
WORK ORDER:DATE RECEIVED:
1403-0556103/31/2014
4/8/2014REPORT DATE:
005 Date Sampled: 3/28/14Site: Trip Blank 4/4/14 MHMWAnalysis Date:09:52
QualNelac
Result
UnitResult
Result
ParameterQualNelac
Result
UnitResult
Result
Parameter
TEST METHOD: EPA 8260C
< 5.0 ADichlorodifluoromethane ug/L < 3.0 NChloromethane ug/L
< 2.0 AVinyl chloride ug/L < 5.0 ABromomethane ug/L
< 5.0 AChloroethane ug/L < 2.0 ATrichlorofluoromethane ug/L
< 5.0 NDiethyl ether ug/L < 1.0 A1,1-Dichloroethene ug/L
< 10.0 AAcetone ug/L < 5.0 ACarbon disulfide ug/L
< 5.0 AMethylene chloride ug/L < 20.0 QA-Nt-Butanol ug/L
< 2.0 AMethyl-t-butyl ether (MTBE) ug/L < 1.0 Atrans-1,2-Dichloroethene ug/L
< 2.0 NDi-isopropyl ether (DIPE) ug/L < 1.0 A1,1-Dichloroethane ug/L
< 2.0 NEthyl-t-butyl ether (ETBE) ug/L < 10.0 A2-Butanone ug/L
< 2.0 N2,2-Dichloropropane ug/L < 1.0 Ncis-1,2-Dichloroethene ug/L
< 2.0 NBromochloromethane ug/L < 1.0 AChloroform ug/L
< 10.0 UTetrahydrofuran ug/L < 1.0 A1,1,1-Trichloroethane ug/L
< 1.0 ACarbon tetrachloride ug/L < 1.0 N1,1-Dichloropropene ug/L
< 1.0 ABenzene ug/L < 2.0 Nt-Amylmethyl ether (TAME) ug/L
< 1.0 A1,2-Dichloroethane ug/L < 1.0 ATrichloroethene ug/L
< 2.0 A1,2-Dichloropropane ug/L < 2.0 NDibromomethane ug/L
< 0.5 ABromodichloromethane ug/L < 1.0 Acis-1,3-Dichloropropene ug/L
< 10.0 N4-Methyl-2-pentanone (MIBK) ug/L < 1.0 AToluene ug/L
< 2.0 Atrans-1,3-Dichloropropene ug/L < 1.0 A1,1,2-Trichloroethane ug/L
< 1.0 ATetrachloroethene ug/L < 1.0 N1,3-Dichloropropane ug/L
< 10.0 N2-Hexanone ug/L < 2.0 ADibromochloromethane ug/L
< 1.0 A1,2-Dibromoethane ug/L < 1.0 AChlorobenzene ug/L
< 1.0 AEthylbenzene ug/L < 2.0 A1,1,1,2-Tetrachloroethane ug/L
< 2.0 AXylenes, Total ug/L < 1.0 NStyrene ug/L
< 2.0 ABromoform ug/L < 1.0 AIsopropylbenzene ug/L
< 2.0 A1,1,2,2-Tetrachloroethane ug/L < 1.0 NBromobenzene ug/L
< 1.0 An-Propylbenzene ug/L < 2.0 N1,2,3-Trichloropropane ug/L
< 1.0 N2-Chlorotoluene ug/L < 1.0 A1,3,5-Trimethylbenzene ug/L
< 1.0 N4-Chlorotoluene ug/L < 1.0 At-Butylbenzene ug/L
< 1.0 A1,2,4-Trimethylbenzene ug/L < 1.0 Ns-Butylbenzene ug/L
< 1.0 A4-Isopropyltoluene ug/L < 1.0 A1,3-Dichlorobenzene ug/L
< 1.0 A1,4-Dichlorobenzene ug/L < 2.0 An-Butylbenzene ug/L
< 1.0 A1,2-Dichlorobenzene ug/L < 2.0 QA-A1,2-Dibromo-3-Chloropropane ug/L
< 2.0 A1,2,4-Trichlorobenzene ug/L < 2.0 N1,3,5-Trichlorobenzene ug/L
< 0.5 NHexachlorobutadiene ug/L < 2.0 ANaphthalene ug/L
< 2.0 N1,2,3-Trichlorobenzene ug/L 110 NSurr. 1 (Dibromofluoromethane) %
101 NSurr. 2 (Toluene d8) % 94 NSurr. 3 (4-Bromofluorobenzene) %
0 UUnidentified Peaks
Report Summary of Qualifiers and Notes
QA-:QA/QC associated with this analysis did not meet laboratory acceptance limits indicating the results may be
biased low.
M+: The laboratory fortified matrix (LFM) analysis indicates a potential positive bias in the reported value.

Laboratory Report
409130505 Interstate ShellPROJECT:
DATE RECEIVED:
WORK ORDER:
DATE REPORTED:
100306
KAS, Inc.
PO Box 787
Williston, VT 05495
Atten: Toni Poquette SAMPLER:
April 17, 2014
1404-06603
Bretton Gardner
April 15, 2014
Enclosed please find the results of the analyses performed for the samples referenced on the attached chain of custody. All required method quality control elements including instrument calibration were performed in accordance with method requirements and determined to be acceptable unless otherwise noted.
The column labeled Lab/Tech in the accompanying report denotes the laboratory facility where the testing was performed and the technician who conducted the assay. A "W" designates the Williston, VT lab under NELAC certification ELAP 11263; "R" designates the Lebanon, NH facility under certification NH 2037 and “N” the Plattsburgh, NY lab under certification ELAP 11892. “Sub” indicates the testing was performed by a subcontracted laboratory. The accreditation status of the subcontracted lab is referenced in the corresponding NELAC and Qual fields.
The NELAC column also denotes the accreditation status of each laboratory for each reported parameter. “A” indicates the referenced laboratory is NELAC accredited for the parameter reported. “N” indicates the laboratory is not accredited. “U” indicates that NELAC does not offer accreditation for that parameter in that specific matrix. Test results denoted with an “A” meet all National Environmental Laboratory Accreditation Program requirements except where denoted by pertinent data qualifiers. Test results are representative of the samples as they were received at the laboratory
Endyne, Inc. warrants, to the best of its knowledge and belief, the accuracy of the analytical
test results contained in this report, but makes no other warranty, expressed or implied, especially no warranties of merchantability or fitness for a particular purpose.
Page 1 of 2
Reviewed by:
Harry B. Locker, Ph.D.
Laboratory Director
ELAP 11263
160 James Brown Dr., Williston, VT 05495
Ph 802-879-4333 Fax 802-879-7103
www.endynelabs.com
NH2037
56 Etna Road, Lebanon, NH 03766
Ph 603-678-4891 Fax 603-678-4893
Laboratory Report
KAS, Inc.
Page 2 of 2
CLIENT:PROJECT: 409130505 Interstate Shell
WORK ORDER:DATE RECEIVED:
1404-0660304/15/2014
DATE REPORTED: 04/17/2014
001 Date Sampled: 4/14/14Site: MW14-02 Time: 12:00
Analysis Date/TimeMethodParameter Result NELACLab/TechUnits Qual.
C8-C16 4/16/14 MDPW UHydrocarbon Range EPA 8015D
Gasoline 4/16/14 MDPW UFuel Identification EPA 8015D
Initial Site Investigation of Subsurface Petroleum Contamination Report Interstate Shell, South Burlington, Vermont
Appendix F
LNAPL Recovery Data
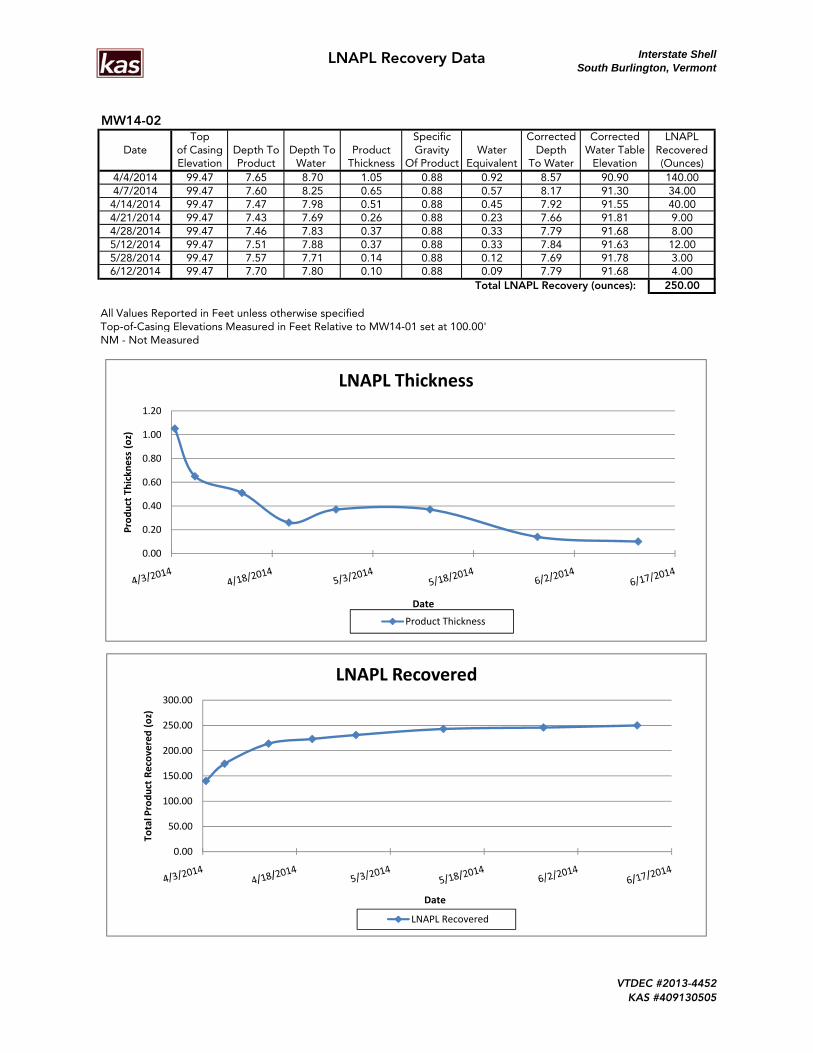
LNAPL Recovery Data Interstate ShellSouth Burlington, Vermont
MW14-02Top Specific Corrected Corrected LNAPL
Date of Casing Depth To Depth To Product Gravity Water Depth Water Table RecoveredElevation Product Water Thickness Of Product Equivalent To Water Elevation (Ounces)
4/4/2014 99.47 7.65 8.70 1.05 0.88 0.92 8.57 90.90 140.004/7/2014 99.47 7.60 8.25 0.65 0.88 0.57 8.17 91.30 34.00
4/14/2014 99.47 7.47 7.98 0.51 0.88 0.45 7.92 91.55 40.004/21/2014 99.47 7.43 7.69 0.26 0.88 0.23 7.66 91.81 9.004/28/2014 99.47 7.46 7.83 0.37 0.88 0.33 7.79 91.68 8.005/12/2014 99.47 7.51 7.88 0.37 0.88 0.33 7.84 91.63 12.005/28/2014 99.47 7.57 7.71 0.14 0.88 0.12 7.69 91.78 3.006/12/2014 99.47 7.70 7.80 0.10 0.88 0.09 7.79 91.68 4.00
250.00
All Values Reported in Feet unless otherwise specifiedTop-of-Casing Elevations Measured in Feet Relative to MW14-01 set at 100.00'NM - Not Measured
Total LNAPL Recovery (ounces):
0.60
0.80
1.00
1.20
Thickn
ess (oz)
LNAPL Thickness
0.00
0.20
0.40
Product T
Date
Product Thickness
0.00
50.00
100.00
150.00
200.00
250.00
300.00
Total Product Recovered (oz)
Date
LNAPL Recovered
LNAPL Recovered
VTDEC #2013-4452KAS #409130505