Embed Size (px)
Citation preview
71
Chapter 4
Initial Triage and Live Response: Data Analysis
Solutions in this chapter:
Initial Triage
Tricks of the Trade
User Activity
Network Connections
Running Processes
Open File Handlers
■
■
■
■
■
■
˛Summary
www.syngress.com
72 Chapter 4 • Initial Triage and Live Response: Data Analysis
IntroductionOK … so now you have gathered all of the volatile information from the target system(s), and powered them down. Now what? How do you go from a bunch of seemingly unrelated data, to meaningful information that will help to bring you closer to figuring out what has occurred? The information that needs to be gleaned from the volatile data will obviously change from case to case, but the means by which you parse out this information should remain the same. You should look for things in roughly the same way each time, allowing the data in the case to determine which trails you follow along the way.
Think of a tree. All trees are roughly the same in that they have roots, a trunk, and branches. Some trees may have large, thick branches like an Oak, some may have small brittle branches like a Pine, while others may have long drooping branches like a Willow. The point is, no matter how much they differ, they are all trees. Now, take this logic and apply is to forensic analysis. All of your cases will more or less be the same in that you have some computer systems, a network, an incident, and a bad guy. The specifics of the case will change each time, but the core of the incident will, for the most part, remain the same.
It is important to note that everybody is different, and will have a different way of doing things, and that’s OK. Personally, I like to begin by looking at log files. Having been a UNIX administrator for several years before moving into the security field, I have a good feel for the way things are supposed to look. I have spoken to other investigators who like to begin with the users, who has accounts, who logged in last, that sort of thing. Still others like to start with the network connections, what was being made to the box, what was coming from the box, and so forth. All of this information can be important to the investigation, however, it’s subjective with regards to what order the information is analyzed in. The remainder of the chapter contains my personal outline for volatile analysis, and is meant to be a guide. Feel free to modify it to fit your own personal style and level of comfort.
Initial TriageBefore delving into the forensics of an actual host, you need to establish the baseline parameters of the incident. What does the customer “think” happened, do they have a rough timeline, which systems are involved, and so forth. At this stage of the investi-gation, it is important to simply ask questions, write down information, and try and
www.syngress.com
Initial Triage and Live Response: Data Analysis • Chapter 4 73
clarify what the parameters of the incident are. From my experience, due to stress created by the incident and the pressure placed on the individual(s) from their supe-riors, the information provided to you during Initial Triage is sketchy at best. So it’s important to understand that you should be the calm voice of reason from the minute you walk through the door. Remember, the customer is relying on you to help them, so be cool.
After the customer has told you their version of what has happened, it is important to ask probing questions. You need to be able to fill in the gaps between what the customer thinks happened and what really did happen, which in many cases is easier said than done. The following are items that you will need to make sure you understand completely so that you can conduct an effective and efficient response.
Timeline If at all possible, you need to try and put the incident within a specific window. This may or may not be possible based on the nature of the incident, but it should be attempted inasmuch as the situation allows. Some cases will enable you to narrow your focus down to a specific day, or maybe even to specific hours within a day, while others may encompass several years. Whatever the case may be, make sure you are as thorough as possible. Failure to do so can seriously affect the rest of the investigation.
Network Topography Get the lay of the land. I have not been in a situa-tion yet where the customer does not at least have a high-level network diagram of their infrastructure, so make sure you ask them for it.
Data Flow Once you have the network diagram, make sure you understand the data flow. Where are the ingress and egress points? What other systems are on the same subnet? If in a Windows domain, are there domain cross trusts which allow access to other domains? You need to understand not just what systems are involved in the incident, but also what system could be involved in the incident. Many customers are only focused on what their Information Technology (IT) staff has determined to be the scope of the incident, and don’t see the bigger picture. Your job is to widen the area of focus to include all potentially involved systems. You can determine if they were involved later, during log analysis.
Security Appliances What does the customer have on their network, and does it log. Best security practices are easy to recite, and preach, but imple-mentation is an entirely different story. Many customers know they should
■
■
■
■

www.syngress.com
74 Chapter 4 • Initial Triage and Live Response: Data Analysis
log, but don’t. They have wanted to put in an Intrusion Detection System (IDS), or Intrusion Prevention System (IPS), but have not had the resources. You will need to find out what they have, where it sits on the network, and does it log. Make sure you request any logs they do have.
Status of Effected Systems This is another one of those items in which the customer may not really know much about. I have been involved in several cases in which you are told one thing, for instance that a particular system as not been rebooted; only to find out the exact opposite is true once you arrive on-site. So even if you asked the questions prior to your arrival at the customer location, you have to ask them again, and verify if possible. This information can affect the direction of your investigation.
Business as Usual As much as possible, you need to understand what “normal” is to the customer. When responding to an incident, you are most likely looking at the customer infrastructure for the first time. You will have no idea what their user ID naming convention is, what kind of traffic they experience on an average day, which systems normally communicate with each other, or any one of literally hundreds of potential variables that make up their typical day. For you to perform any sort of initial analysis you need to understand this as possible.
While you need to ask as many questions regarding this subject as possible, understand that more questions will undoubtedly arise as the investigation progresses. Make sure you let the customer know that you will have more questions, and you will need a solid point of contact (POC) that is knowledgeable enough about their technical and business processes to intelligibly answer them.
Once you have gathered all of the information you deem to be relevant (which will most assuredly change), you can begin initial analysis. The most important thing at this stage in the investigation is to remain neutral about the incident. Try not to formulate any premature conclusions about the direction the data is taking you. Simply let the data dictate the path you take.
Log AnalysisIn my humble opinion, the starting point for your investigation should be an analysis of whatever log files the customer was able to provide. This may be nothing, in which case you might as well take some aspirin now, because a headache is rapid
■
■
www.syngress.com
Initial Triage and Live Response: Data Analysis • Chapter 4 75
approaching, or it may be several terabytes of data, in which case you should probably take the aspirin anyway, as that same headache is rapidly approaching.
Start at the beginning. This is the simple notion that in any incident, the intruder has to get onto the customer network from somewhere, so start there. It may be a Virtual Private Network (VPN) concentrator, it may be a satellite office, and it may be from a specific workstation or server. Whatever the case may be, start there.
Log files on Linux systems can be wonderful things. They are highly configu-rable, efficient, and detailed. With any luck, the system you are gathering and/or analyzing logs from has at the very least, the default configurations for logging in place. Linux logs are in plain text, so you will not need to use any third-party software or utilities to perform effective searches. Additionally, you can write custom scripts to perform automatic actions based on the content of the logs, and the desired output.
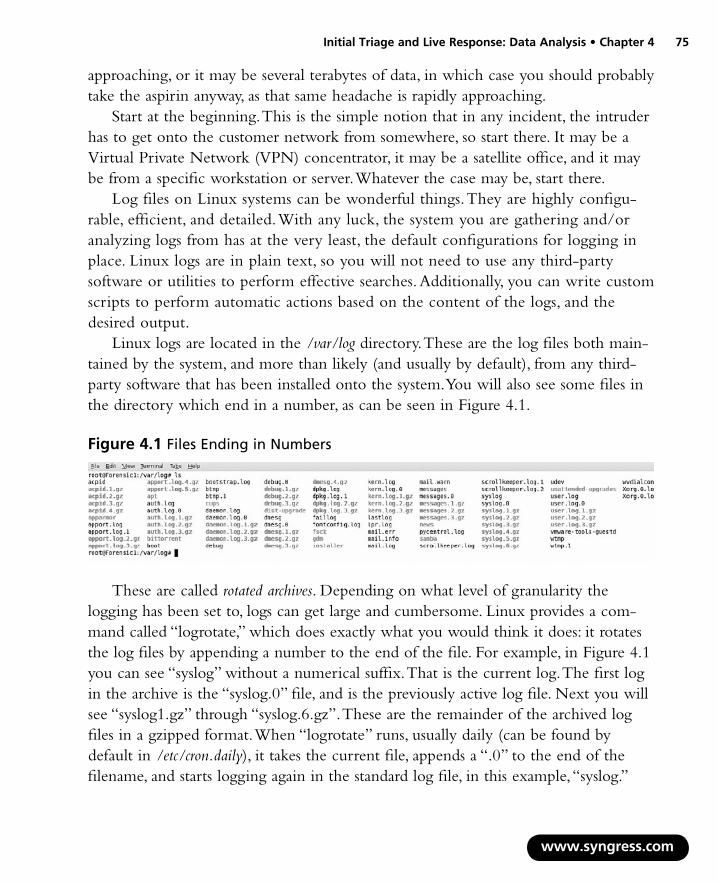
Linux logs are located in the /var/log directory. These are the log files both main-tained by the system, and more than likely (and usually by default), from any third-party software that has been installed onto the system. You will also see some files in the directory which end in a number, as can be seen in Figure 4.1.
These are called rotated archives. Depending on what level of granularity the logging has been set to, logs can get large and cumbersome. Linux provides a com-mand called “logrotate,” which does exactly what you would think it does: it rotates the log files by appending a number to the end of the file. For example, in Figure 4.1 you can see “syslog” without a numerical suffix. That is the current log. The first log in the archive is the “syslog.0” file, and is the previously active log file. Next you will see “syslog1.gz” through “syslog.6.gz”. These are the remainder of the archived log files in a gzipped format. When “logrotate” runs, usually daily (can be found by default in /etc/cron.daily), it takes the current file, appends a “.0” to the end of the filename, and starts logging again in the standard log file, in this example, “syslog.”
Figure 4.1 Files Ending in Numbers

www.syngress.com
76 Chapter 4 • Initial Triage and Live Response: Data Analysis
The other log files are then increased in numerical value by 1, with the oldest log being deleted. All of this information is configurable in the /etc/logrotate.conf file. The system administrator at the customer location should be able to tell you what the log gathering parameters are for his servers.
To begin searching through the logfiles, you can use the native Linux commands, or any text tool. Below are some useful commands:
zgrepZgrep invokes grep on compressed or gzipped files.zgrep <search_parameter> *
This will search all compressed files in the current working directory for the <search_parameter>.
TailTail will display the last output of the file as denoted by the next argument. For example, “tail -100 <filename>” will display the last 100 lines of the file. Additionally, using the –f switch will display a log file as it gathers information in real time.tail –f /var/log/messages
This will display the contents of /var/log/messages as new output occurs.
MoreMore works the same as the MS DOS version of the command, by simply sending the contents of the specified file to stdout. more <filename>
This will display the contents of the <filename>, stopping output at the bottom of the screen with the word “—More—(x%).” This indicates that you are currently looking (or have looked at) x% of the total file. You can press the enter key to scroll down by one line, or the space bar to scroll down by one page. To scroll backwards by one page, simply press the letter “b.” Additionally, you can search thorough the file with the “/” key followed by the <search_parameter>. If multiple occurrences of the <search_parameter> are found, simply press the “n” key to skip to the next entry,
www.syngress.com
Initial Triage and Live Response: Data Analysis • Chapter 4 77
while the letter “p” will take you to the previous entry. The letter “q” allows you to quit the current view and returns you to the command prompt.
LessLess is the opposite of more. It allows you to perform the same functions as the “more” command, but with much more control, like adding the ability to move both backwards and forwards in the file. It also loads much faster than more, since it does not read the entire file before opening it up.less <filename>
This will display the contents of the <filename>. You can scroll backward with the “b” key, and forward with the “d” key. Just like “more,” you can press the “/” key followed by a <search_parameter> to conduct a string search; “n” will take you to the next occurrence of the hit, “p” will take you to the previous one.
Keyword SearchesKeyword searches are a quick and easy way to help you identify points of interest on the targeted machines. These can either be performed on the live system, provided that the volatile information has already been gathered and the forensic imaging has already taken place, or post mortem in a laboratory environment. The important thing to remember is that keyword searches operate under the assumption that the bad guys have left the original names for whatever tools they have used, in place on the system. You obviously are not going to be able to guess if the names of any files that have been changed, so just keep it in the back of your mind during the data analysis and let the data guide you.
To perform our keyword searches, we are going to stick with the resident utilities found on the Linux operating system:
strings
grep
less
For our example, I have gathered the contents of /proc/kore from my Ubuntu 7.10 (Gutsy) machine.
■
■
■
www.syngress.com
78 Chapter 4 • Initial Triage and Live Response: Data Analysis
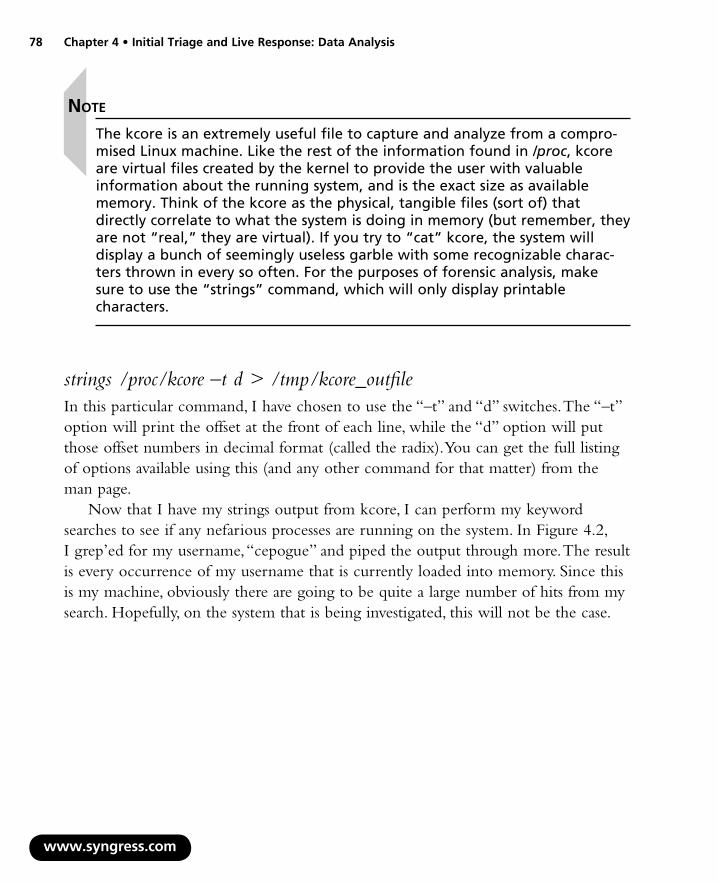
strings /proc/kcore –t d > /tmp/kcore_outfileIn this particular command, I have chosen to use the “–t” and “d” switches. The “–t” option will print the offset at the front of each line, while the “d” option will put those offset numbers in decimal format (called the radix). You can get the full listing of options available using this (and any other command for that matter) from the man page.
Now that I have my strings output from kcore, I can perform my keyword searches to see if any nefarious processes are running on the system. In Figure 4.2, I grep’ed for my username, “cepogue” and piped the output through more. The result is every occurrence of my username that is currently loaded into memory. Since this is my machine, obviously there are going to be quite a large number of hits from my search. Hopefully, on the system that is being investigated, this will not be the case.
Note
The kcore is an extremely useful file to capture and analyze from a compro-mised Linux machine. Like the rest of the information found in /proc, kcore are virtual files created by the kernel to provide the user with valuable information about the running system, and is the exact size as available memory. Think of the kcore as the physical, tangible files (sort of) that directly correlate to what the system is doing in memory (but remember, they are not “real,” they are virtual). If you try to “cat” kcore, the system will display a bunch of seemingly useless garble with some recognizable charac-ters thrown in every so often. For the purposes of forensic analysis, make sure to use the “strings” command, which will only display printable characters.
www.syngress.com
Initial Triage and Live Response: Data Analysis • Chapter 4 79
In addition to keywords provided to you by the customer, it is a good idea to keep your own personal keyword list,which is updated at the conclusion of each case. In my experience, I learn something new with each case, so keeping a dynamic keyword list helps me to not only remember what I have found in the past (and need to research further), but it helps me to find it again in future cases. Here are some of the keywords that I search for on a regular basis.
File and Directory Namesgrep –e (the “–e” is used here for pattern matching) “\/proc/” –e “\/bin” –e “\/bin\/.*?sh” kcore_strings.
grep –e “ftp” –e “root” kcore_strings
grep –e “rm –r” kcore_strings
grep –e “.tgz” kcore_strings
■
■
■
■
Figure 4.2 Greg’ed Username
www.syngress.com
80 Chapter 4 • Initial Triage and Live Response: Data Analysis
IP Addresses and Domain Namesgrep –e “[0-9]\+\.[0-9]\+\.[0-9]\+\.[0-9]\+” kcore_strings
grep –e “\.pl\” kcore strings
Tool Keywordsmsf (Metasploit Framework)
select
insert
dump
update
nmap
nessus
nikto
wireshark
tcpdump
kismet
airsnarf
paros
hping2
ettercap
aircrack
aircrack-ng
airsnort
nc (netcat)
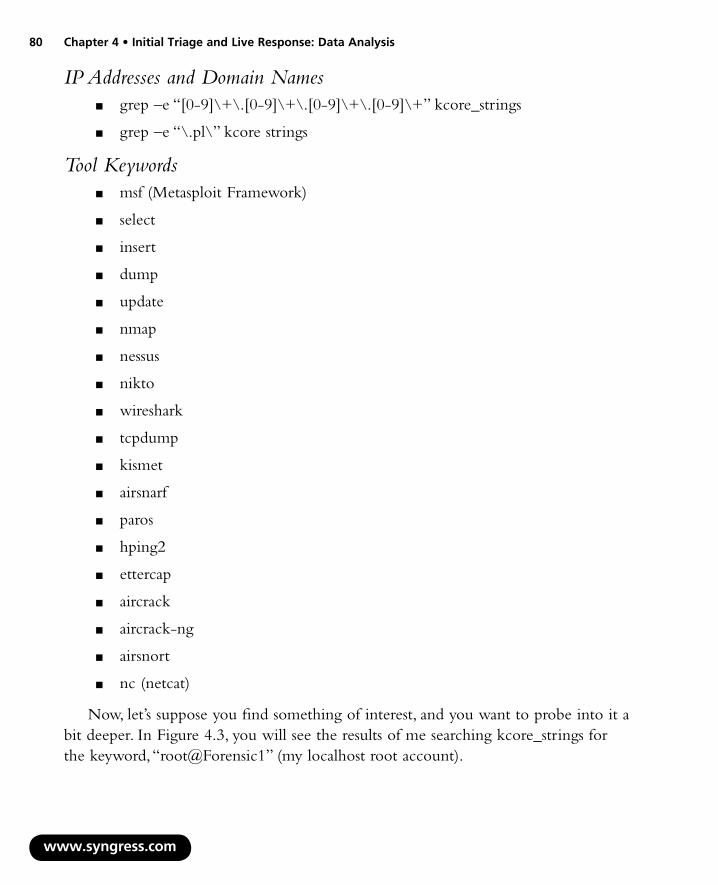
Now, let’s suppose you find something of interest, and you want to probe into it a bit deeper. In Figure 4.3, you will see the results of me searching kcore_strings for the keyword, “root@Forensic1” (my localhost root account).
■
■
■
■
■
■
■
■
■
■
■
■
■
■
■
■
■
■
■
■
■
www.syngress.com
Initial Triage and Live Response: Data Analysis • Chapter 4 81
As you can see, the search returned anything from my strings output from running memory that matched my search criteria, “root@Forensic1.” Now let’s say that you think that offset 805277704 looks interesting. The next step would be to open kcore_strings with a text editor. In this example, I use the “less” command. less kcore_strings
This will open up the kcore_strings file in a searchable format/<search_argument>
This will search through the file for an occurrence of the <search_argument>.In my example, I used the following search: /805277704 (This is quite a few
lines up in the kore_strings file, so this may take a few seconds to return with your results.
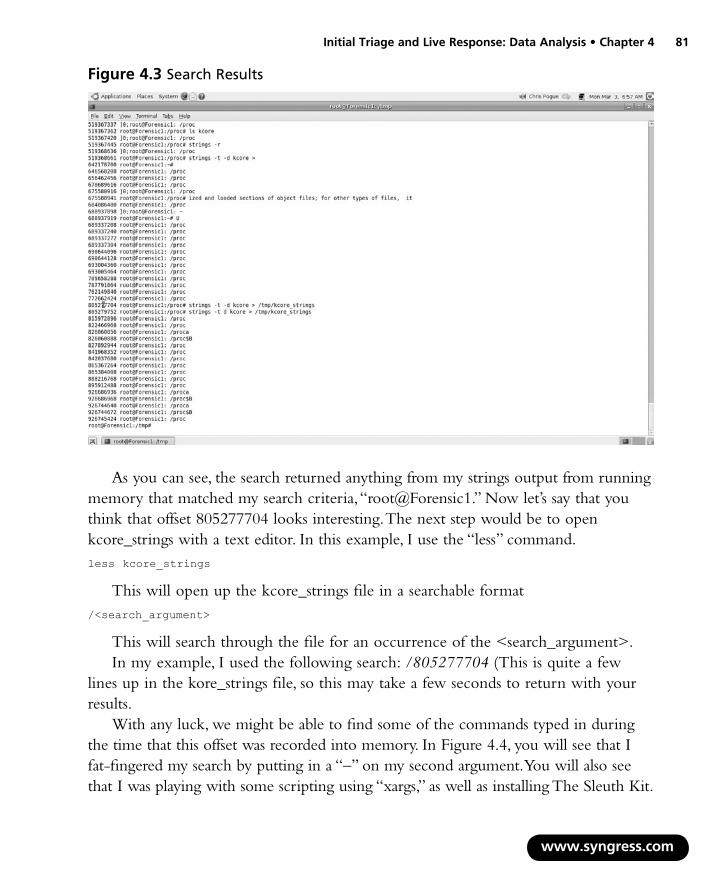
With any luck, we might be able to find some of the commands typed in during the time that this offset was recorded into memory. In Figure 4.4, you will see that I fat-fingered my search by putting in a “–” on my second argument. You will also see that I was playing with some scripting using “xargs,” as well as installing The Sleuth Kit.
Figure 4.3 Search Results
www.syngress.com
82 Chapter 4 • Initial Triage and Live Response: Data Analysis
So, as you can see, this is a simple yet powerful way to perform string searches on a live system or booted image. Remember, pages within the virtual memory, physical memory, and swap are overwritten in an unorganized manner. This means that your attempts may hit a dead end here, or they may be invalid. Use the information gleaned from this process in conjunction with other information acquired during the course of the investigation.
Tricks of the TradeThe operating system is not going to ask you to “be more specific” in your search requests. Put simply, you are going to get what you tell it to find. So, you have to know how to properly stack your search arguments to make your keyword searches as efficient and effective as possible.
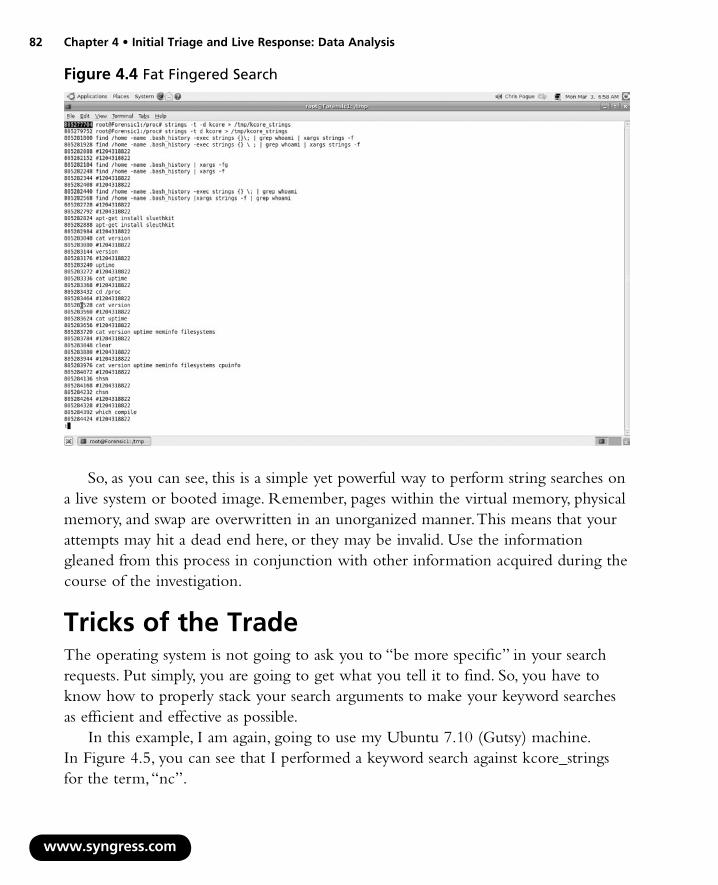
In this example, I am again, going to use my Ubuntu 7.10 (Gutsy) machine. In Figure 4.5, you can see that I performed a keyword search against kcore_strings for the term, “nc”.
Figure 4.4 Fat Fingered Search
www.syngress.com
Initial Triage and Live Response: Data Analysis • Chapter 4 83
As you can see, the search for the term “nc” yielded every entry in which the letters “n” and “c” appeared together. This is obviously not a very clean search, so I will have to refine my parameters to give me something a bit more useable.
Using what I know about netcat, it can either be used to send or receive infor-mation. The command structure to send a file is:nc <host.example.com> (or IP address) <port> < infile
The command structure to receive a file is:nc –l (for *l*isten) <port> > outfile
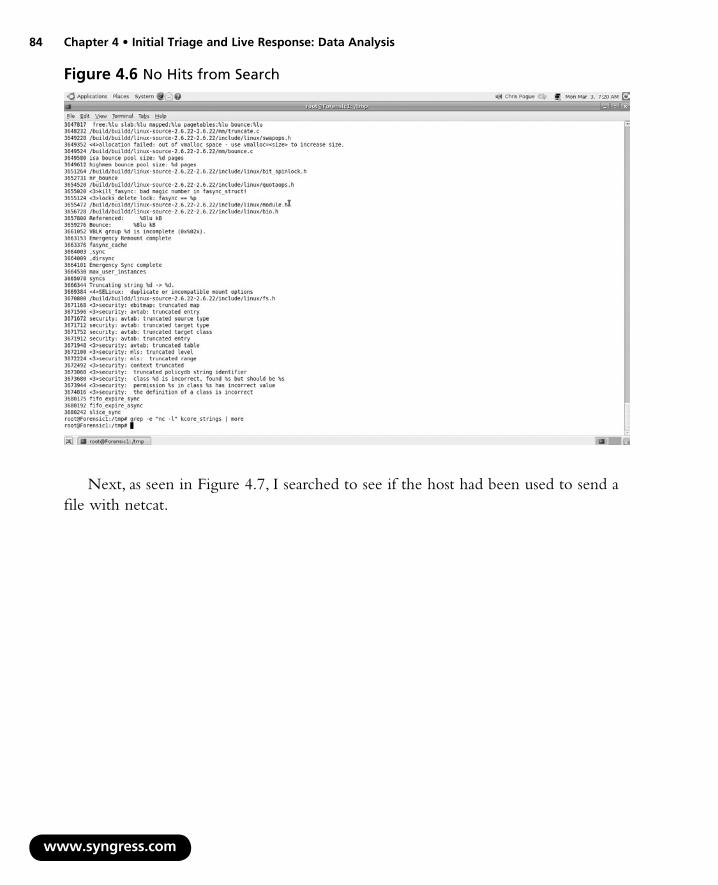
Based on this information, I can refine my search to see if the host I am investi-gating has been used to either send or receive a file using netcat. In Figure 4.6, you can see that my search argument did not yield any hits, so I can safely assume that the host did not receive any files using “nc –l.”
Figure 4.5 Keyword Search
www.syngress.com
84 Chapter 4 • Initial Triage and Live Response: Data Analysis
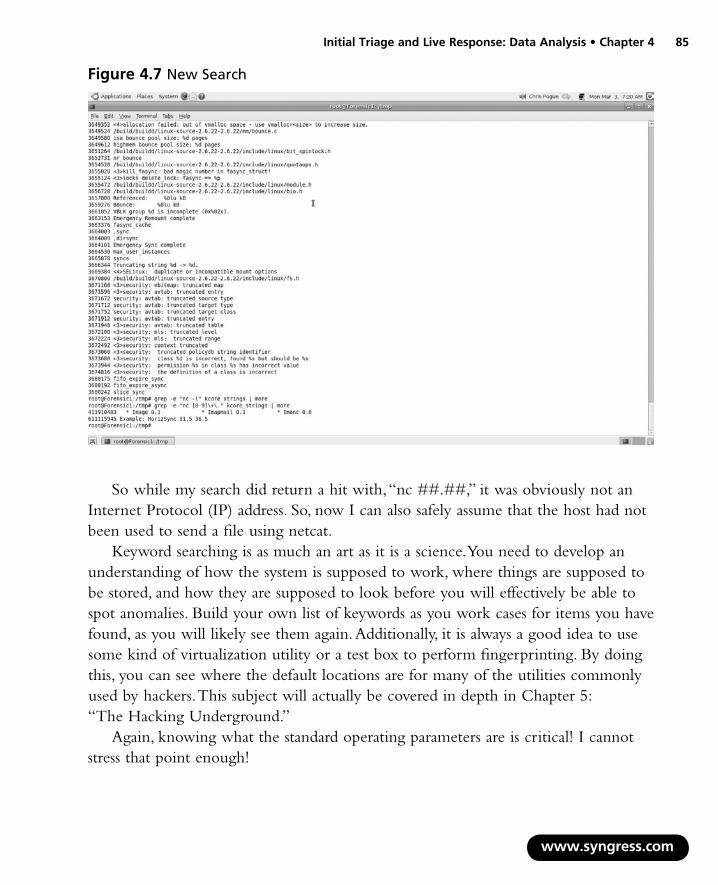
Next, as seen in Figure 4.7, I searched to see if the host had been used to send a file with netcat.
Figure 4.6 No Hits from Search
www.syngress.com
Initial Triage and Live Response: Data Analysis • Chapter 4 85
So while my search did return a hit with, “nc ##.##,” it was obviously not an Internet Protocol (IP) address. So, now I can also safely assume that the host had not been used to send a file using netcat.
Keyword searching is as much an art as it is a science. You need to develop an understanding of how the system is supposed to work, where things are supposed to be stored, and how they are supposed to look before you will effectively be able to spot anomalies. Build your own list of keywords as you work cases for items you have found, as you will likely see them again. Additionally, it is always a good idea to use some kind of virtualization utility or a test box to perform fingerprinting. By doing this, you can see where the default locations are for many of the utilities commonly used by hackers. This subject will actually be covered in depth in Chapter 5: “The Hacking Underground.”
Again, knowing what the standard operating parameters are is critical! I cannot stress that point enough!
Figure 4.7 New Search
www.syngress.com
86 Chapter 4 • Initial Triage and Live Response: Data Analysis
User ActivityShell HistoryKnowing who has done what is always of the utmost concern in any investigation. Fortunately for us, by default, Linux keeps a trail of user activity in the shell history, located in the /home/<user> directory. Remember, the shell history is only a record-ing of one side of the conversation. It does not show you how the system responded to the particular command. So while gathering information about what was typed in at the command line is a good information gathering technique, like anything else, it should be used in conjunction with other data retrieved from the investigation.
In my examples, I am again using an Ubuntu 7.10 (Gutsy) distribution, which uses the BASH shell by default. To find the history files that exist on my system, I simply type:locate bash_history
Understand that this command will only give you the .bash_history files. There are other shells which will create other history files. The most popular shells store their history files in the following locations with the /home/<user> directory:
BASH .bash_history
C-Shell history.csh
Korn .sh_history
POSIX .sh_history
Z-Shell .history
Again, by default, most Linux variants maintain a 500-line command history. To view the current command history of a system, type:echo $HISTSIZE
Like anything else in Linux, this environment variable is configurable within the .profile of the individual user. If you find that the HISTSIZE has been modified from the default value, take note of it, and follow up with the customer’s system adminis-trator to find out if this was a configuration change on their part, or something that was done maliciously by an intruder (especially if the value has been set to zero).
Included on your tools disk are two scripts I have written to make parsing through user shell history files a bit easier. The first script is called “history_search.sh.”
■
■
■
■
■
www.syngress.com
Initial Triage and Live Response: Data Analysis • Chapter 4 87
It takes the commands from all of the user history files on the local host, regardless of which shell has been used, removes the duplicate entries, and puts them into a single file in the current working directory called “outfile”. You can use this file to review all of the commands used on the target host and determine if any of them requires further investigation. For example, if a command is found such as, “msf”, indicating that the Metasploit Framework binary was invoked from the command line, you can then use the second script, “user_driller.sh” to find out which user(s) typed in that specific command. This script will create a directory called driller in a user-specified location; however, the default is the current working directory.
Logged on UsersWhen analyzing volatile data it is import to know which users are currently logged onto a system. Understand that most intruders are not so dumb as to create a user ID called, “hacker.” They will more than likely use an existing user ID to conduct their illicit activities. Just like with shell history, additional chronological correlations will have to be made to determine if the activities were part of normal business opera-tions, or if they were the work of an intruder.
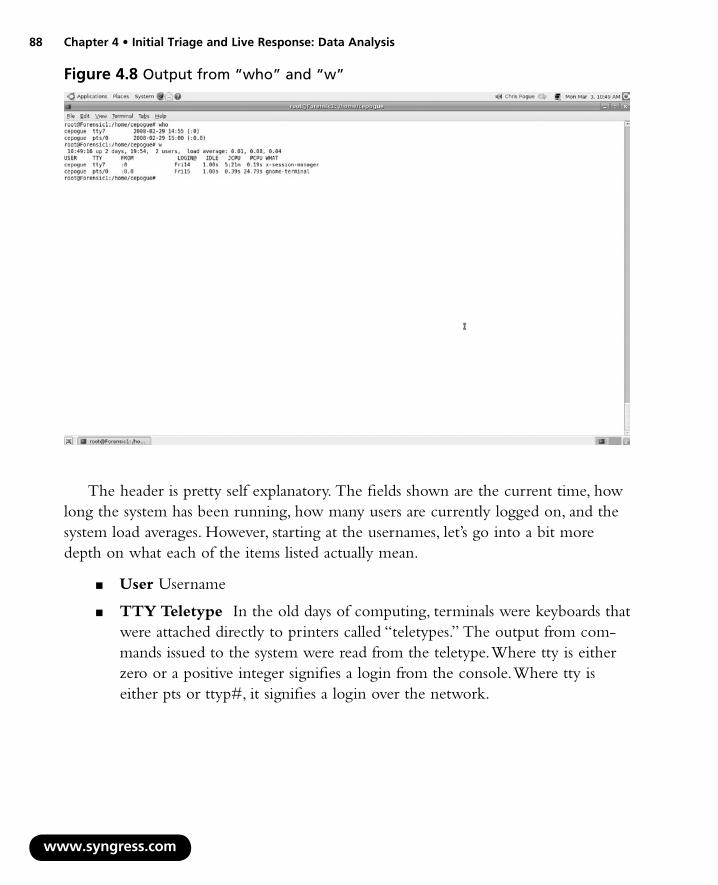
The output from the “who” and “w” commands are shown below in Figure 4.8. The results from the “w” may require a bit more information to fully comprehend what the user is looking at.
Note
One of the limitations of the shell history files is that other than the Media Access Control (MAC) time, there are no timestamps within the file itself. So while knowing what was typed in can be useful for formulating an idea of what may have happened on the host, other correlative measures will have to be taken to determine when those specific actions took place. Also tying a username to a command, or series commands only shows which username was used, not necessarily which user was actually using that account. A good hacker will most likely use an existing user account to perform his nefarious tasks. This means that log file correlations will be of the utmost importance for you to be able to piece together the different aspects of the investigation.
www.syngress.com
88 Chapter 4 • Initial Triage and Live Response: Data Analysis
The header is pretty self explanatory. The fields shown are the current time, how long the system has been running, how many users are currently logged on, and the system load averages. However, starting at the usernames, let’s go into a bit more depth on what each of the items listed actually mean.
User Username
TTY Teletype In the old days of computing, terminals were keyboards that were attached directly to printers called “teletypes.” The output from com-mands issued to the system were read from the teletype. Where tty is either zero or a positive integer signifies a login from the console. Where tty is either pts or ttyp#, it signifies a login over the network.
■
■
Figure 4.8 Output from “who” and “w”
www.syngress.com
Initial Triage and Live Response: Data Analysis • Chapter 4 89
From This field shows where the user is logging in. In Figure 4.8, the “:0” and “:0.0” indicates that I am logged in from the console. If, for example, I was Secure Shelled (SSH’d) into the localhost from another box on the network, then that IP address or fully qualified domain name (FQDN) would appear in place of the “0.0.”
Login@ This is pretty self explanatory. It shows the time of the last login.
Idle This shows how long it has been since the last user activity. This infor-mation can be of specific note if you see users with long idle times.
JCPU The JCPU time is the time used by all processes attached to the tty. It does not include past background jobs, but does include currently running background jobs.
PCPU The PCPU time is the time used by the current process, named in the “what” field.
What The What is the process that the user is currently running.
Network ConnectionsRecall from the introduction, I referred to the lack of information sometimes being called “negative evidence.” While the data necessary to prove negative evidence is mainly found in the customer’s network logs, the local network connections can prove to be equally as useful.
By running the netstat command with the “–an” and “–rn” switches, you can see which connections are being made to and from the host as well as on which port is being used and the state of that connection (either LISTEN, ESTABLISHED, or CLOSE_WAIT).
■
■
■
■
■
■
www.syngress.com
90 Chapter 4 • Initial Triage and Live Response: Data Analysis
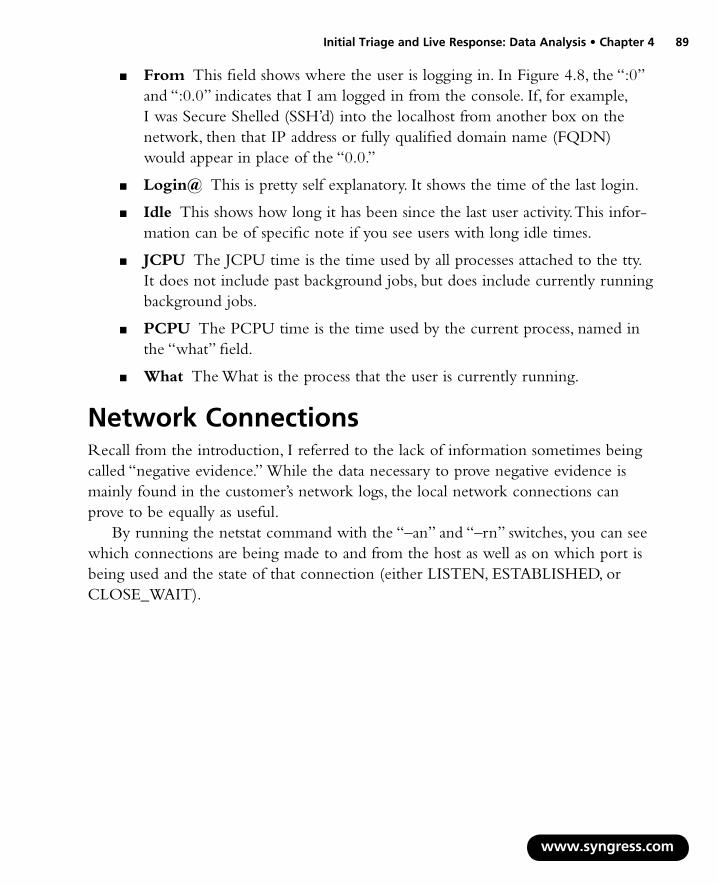
The results of the netstat “–an” command are separated into two sections, Active Connections and Domain Sockets. The Active Connections are separated into six columns, however, for our purposes we are only interested in four, Proto (Protocol), Local Address, Foreign Address, and State. As you can see from Figure 4.9, I have several established outbound connections to various destinations on various ports. Obviously the connections on port 80 are Web, while ports 5190, 1863, 5050, and 5222 are instant messaging via Pidgin. I was able to confirm this by running ARIN WHOIS queries against the IP addresses in the Foreign Address column.
In your case, this information will be different, but will show you the same type of information. Knowing the connection status of your machine is of critical impor-tance to your case, and can provide key insight into specifics of the incident.
The second section, Active Unix Domain Sockets, has the following breakdown:
Proto Protocol (usually UNIX) used
RefCnt Reference count (i.e., attached processes via this socket).
Flags Flags displayed is SO_ACCEPTON (displayed as ACC), SO_WAITDATA (W), or SO_NOSPACE (N). SO_ACCECPTON is used
■
■
■
Figure 4.9 Established Outbound Connections
www.syngress.com
Initial Triage and Live Response: Data Analysis • Chapter 4 91
on unconnected sockets if their corresponding processes are waiting for a connect request. The other flags are not of normal interest.
Type Types of socket access:
DGRAM Used in Datagram (connectionless) mode
STREAM Stream (connection) socket
RAW Raw socket
RDM Reliably-delivered messages
SEQPACKET Sequential packet socket
PACKET RAW Interface access socket
State:
FREE Not allocated
LISTENING Listening for a connection request. Those sockets are only displayed if the -a switch is set.
CONNECTING About to establish a connection.
CONNECTED Connected.
DISCONNECTING Disconnecting.
(empty) Not connected to another socket.
The last two columns are I-Node and Path, which identify the process attached to the socket. Since there are likely to be a whole slew of entries, and you will likely have no clue which ones are normal and which are not, be sure to get with the customer’s system and network administrators to help you establish a baseline of “normal” operating parameters. Additionally, simply using an Internet search engine will provide you with good information regarding the nature of a process. Since there are so many, this should be reserved only for processes that stand out as being potentially outside of what the customer administrator teams determine to be normal.
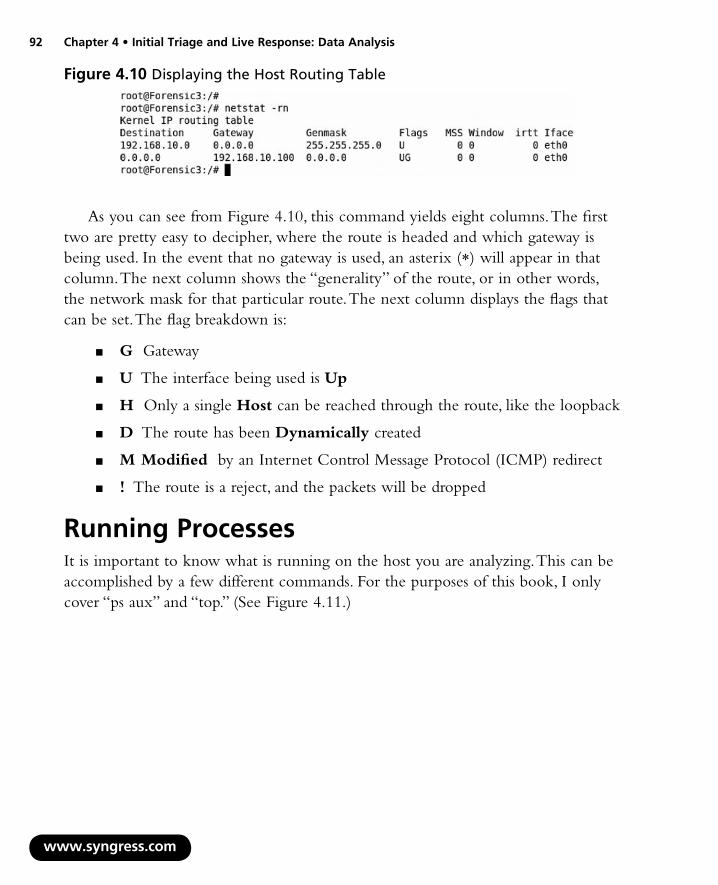
The netstat command with the “-rn” switch will display the hosts’ routing table. (See Figure 4.10.)
■
■
■
■
■
■
■
■
■
■
■
■
■
■
www.syngress.com
92 Chapter 4 • Initial Triage and Live Response: Data Analysis
As you can see from Figure 4.10, this command yields eight columns. The first two are pretty easy to decipher, where the route is headed and which gateway is being used. In the event that no gateway is used, an asterix (*) will appear in that column. The next column shows the “generality” of the route, or in other words, the network mask for that particular route. The next column displays the flags that can be set. The flag breakdown is:
G Gateway
U The interface being used is Up
H Only a single Host can be reached through the route, like the loopback
D The route has been Dynamically created
M Modified by an Internet Control Message Protocol (ICMP) redirect
! The route is a reject, and the packets will be dropped
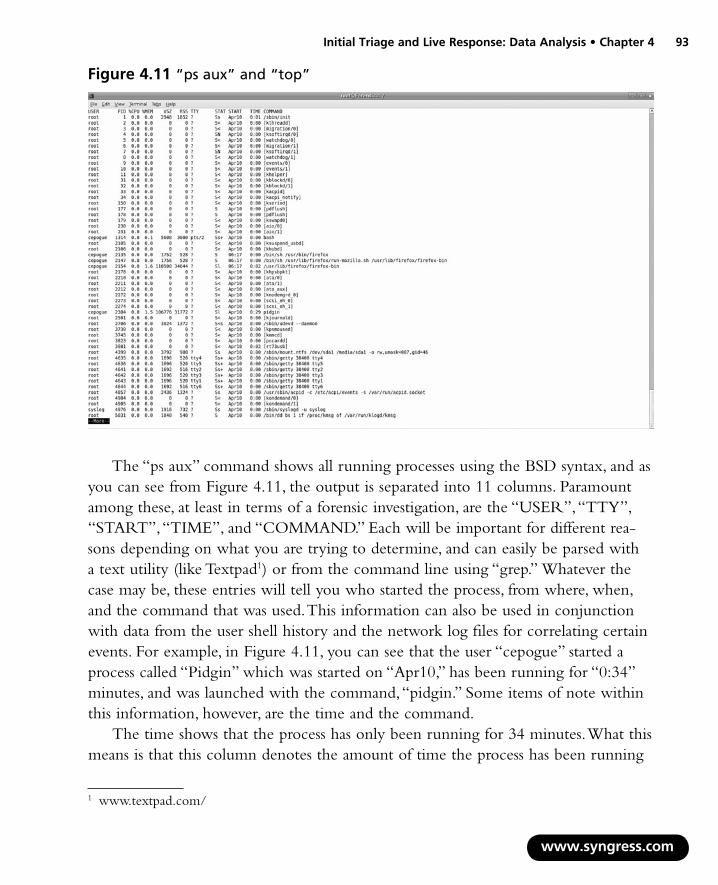
Running ProcessesIt is important to know what is running on the host you are analyzing. This can be accomplished by a few different commands. For the purposes of this book, I only cover “ps aux” and “top.” (See Figure 4.11.)
■
■
■
■
■
■
Figure 4.10 Displaying the Host Routing Table
www.syngress.com
Initial Triage and Live Response: Data Analysis • Chapter 4 93
The “ps aux” command shows all running processes using the BSD syntax, and as you can see from Figure 4.11, the output is separated into 11 columns. Paramount among these, at least in terms of a forensic investigation, are the “USER”, “TTY”, “START”, “TIME”, and “COMMAND.” Each will be important for different rea-sons depending on what you are trying to determine, and can easily be parsed with a text utility (like Textpad1) or from the command line using “grep.” Whatever the case may be, these entries will tell you who started the process, from where, when, and the command that was used. This information can also be used in conjunction with data from the user shell history and the network log files for correlating certain events. For example, in Figure 4.11, you can see that the user “cepogue” started a process called “Pidgin” which was started on “Apr10,” has been running for “0:34” minutes, and was launched with the command, “pidgin.” Some items of note within this information, however, are the time and the command.
The time shows that the process has only been running for 34 minutes. What this means is that this column denotes the amount of time the process has been running
Figure 4.11 “ps aux” and “top”
1 www.textpad.com/
www.syngress.com
94 Chapter 4 • Initial Triage and Live Response: Data Analysis
on the CPU and not the time that has elapsed since the program was launched, since most programs spend a great deal of time waiting for other stuff to happen before they actually need time on the CPU.
The command column in this example simply shows a single word, “pidgin.” This can mean one of two things. Either the binary is in my user path, or I launched it from a graphical user interface (GUI). In the case, the latter is true. Had I ran the binary from the command line using the full path, the entry in the “COMMAND” column would have read /usr/bin/pidgin.
The process state code, shown as “stat,” is not something you will likely use during an investigation. The codes show what state the process is currently in, or at least the time you issued the command. The codes are:
D Uninterruptible sleep (usually IO)
R Running or runnable (on run queue)
S Interruptible sleep (waiting for an event to complete)
T Stopped, either by a job control signal or because it is being traced
W Paging (not valid since the 2.6.xx kernel)
X Dead (should never be seen)
Z Defunct (“zombie”) process, terminated but not reaped by its parent
For BSD formats and when the stat keyword is used, additional characters may be displayed as:
< high-priority (not nice to other users)
N low-priority (nice to other users)
L has pages locked into memory (for real-time and custom IO)
s is a session leader
l is multi-threaded (using CLONE_THREAD, like NPTL pthreads do)
+ is in the foreground process group
The “top” command shows exactly what you think it would show, the running processes that are using the most CPU. (See Figure 4.12.)
■
■
■
■
■
■
■
■
■
■
■
■
■

www.syngress.com
Initial Triage and Live Response: Data Analysis • Chapter 4 95
Figure 4.12 shows the output from the “top” command on my local host. As you can see, the results are 12 columns, which don’t look entirely unlike the same columns we saw from the “ps” results. Again, the columns of the most interest in an investigation are “PID, “USER,” “TIME+,” and “COMMAND.”
You will see a bit of a difference in the “TIME” column from the “ps” command and the “TIME+” shown in Figure 4.12. “Top” shows more granularity by listing the CPU time down to the hundredth of a second.
There are also two additional columns which again, don’t hold any real forensic value, but I will explain so that you know what they are. The “PR” column stands for PRiority, and denotes well the priority of the task, and the “NI” column stands for NIce, and indicates the nice value of the task. With this value, the smaller the number, the less nice it is to the other processes, or the higher priority it has. A zero in this column simply means that the priority will not change when determining the task’s dispatchability.
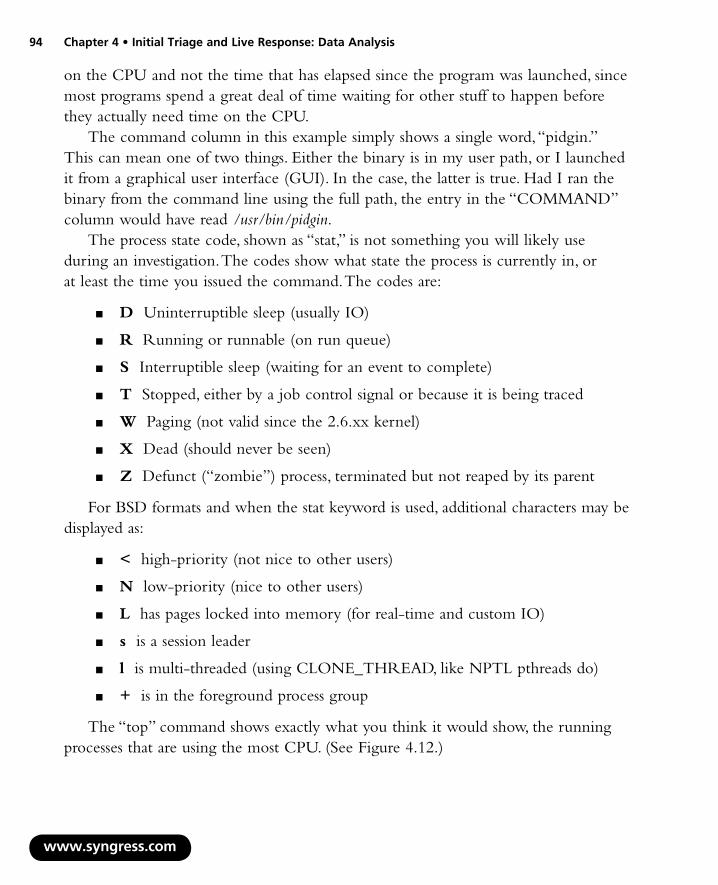
Open File HandlersThe “List Open Files” ( lsof ) command is used to show which files were and are opened by which processes. (See Figure 4.13.)
Figure 4.12 Running Processes Using the Most CPU
www.syngress.com
96 Chapter 4 • Initial Triage and Live Response: Data Analysis
As can be seen in Figure 4.13, the output from this command, without any additional switches, is separated into nine columns. You can see that I had to pipe my original “lsof ” command to “more” since it yielded so many lines of output. In fact, by sending the output to an outfile called “foo,” then cat’ing that file and piping that out to “wc –l,” I found that the standard “lsof ” command provided me with 404 lines of output. Which is really not all that bad, but that is my local Ubuntu workstation, not a server. A standard Linux server would probably have five times that many lines. So be sure to use a good text parser (again, like textpad) to effectively wade through the data to find what you are looking for.
Some of the switches which I have found useful in narrowing your focus if you can get console access are (from the lsof man pages):
To list all open Internet, x.25 (HP-UX) and UNIX domain files, use:lsof -i -U
To list all open IPv4 network files in use by the process whose PID is 1234, use:lsof -i 4 -a -p 1234
■
■
Figure 4.13 Open Files
www.syngress.com
Initial Triage and Live Response: Data Analysis • Chapter 4 97
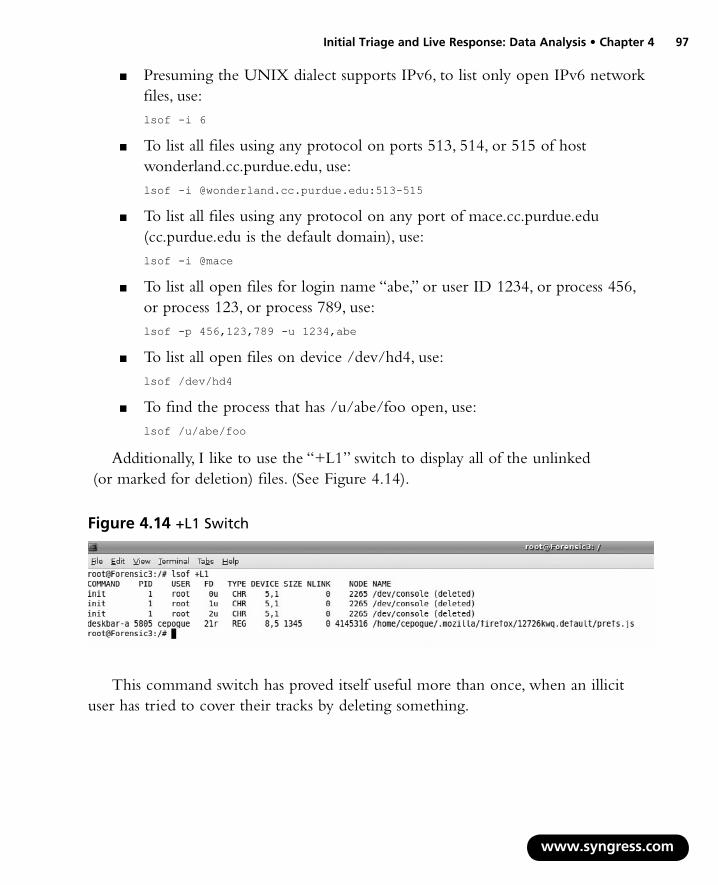
Figure 4.14 +L1 Switch
Presuming the UNIX dialect supports IPv6, to list only open IPv6 network files, use:lsof -i 6
To list all files using any protocol on ports 513, 514, or 515 of host wonderland.cc.purdue.edu, use:lsof -i @wonderland.cc.purdue.edu:513-515
To list all files using any protocol on any port of mace.cc.purdue.edu (cc.purdue.edu is the default domain), use:lsof -i @mace
To list all open files for login name “abe,” or user ID 1234, or process 456, or process 123, or process 789, use:lsof -p 456,123,789 -u 1234,abe
To list all open files on device /dev/hd4, use:lsof /dev/hd4
To find the process that has /u/abe/foo open, use:lsof /u/abe/foo
Additionally, I like to use the “+L1” switch to display all of the unlinked (or marked for deletion) files. (See Figure 4.14).
This command switch has proved itself useful more than once, when an illicit user has tried to cover their tracks by deleting something.
■
■
■
■
■
■

www.syngress.com
98 Chapter 4 • Initial Triage and Live Response: Data Analysis
SummaryGathering the volatile data is one thing, knowing what the heck it means is something else entirely. Hopefully, you now have a decent understanding of the commands that we discussed in Chapter 3, what the output looks like, and why it’s important. Remember, each case will be different, so likewise will the information you gather. Be flexible (Semper Gumby!) and be smart.
Simply gathering the data, and even understanding it is only the beginning to an effective analysis. Do not forget that the information you gather needs to be corre-lated. Compare your volatile data with the shell histories, localhost logs, network logs, and anything else the customer can provide you with. Never look at a single piece of information as the “end” of a trail, but as a piece of a larger puzzle, you just need to figure out where it fits in.
The beauty of Linux is that there is always more than one way to do something and likely more than one thing that is keeping track of those things. If a tool or utility is unfamiliar to you, test it out in your lab. Find out what it does, how it does it, and what it looks like. Often you will find that the work you do in the lab can make or break your case.


![Mental Health Triage in CAMHS - STORM...…the initial referral … was querying Asperger's syndrome, but during the triage appointment, the therapist picked up on [childs] lowness](https://img.pdfslide.net/doc/110x75/5e59bcdbd4fb72606319b033/mental-health-triage-in-camhs-the-initial-referral-was-querying-aspergers.jpg)