Embed Size (px)
Citation preview
Mayur Uniquoters Ltd. (MUL) is the largest manufacturer of artificial leather/ PVC vinyl in India. The company is a leading synthetic leather supplier to branded footwear, automotive and leather goods and garments companies in India and abroad.
MUL is a part of Rs 5,000crs domestic synthetic leather industry, which is expected to grow at a CAGR of 15% over FY16-20E to reach Rs 8,750crs. MUL has a market share of 10% of total synthetic leather industry, while it enjoys 50% market share of organized synthetic leather industry. Healthy demand outlook augurs well for MUL's revenue growth over FY17-19E.
In order to cater to high margin Polyurethane (PU) leather market, MUL is planning to set up a PU leather plant of capacity 0.6mn meters per month, with a capital expenditure of Rs 50crs. Further, to focus and expand business in the southern states of the country, the company is planning to set up a PVC leather plant of capacity 0.6mn meters at Mysore. The company has raised Rs 70crs through allotment of preference shares, which will be used to fund these expansion plans, keeping balance sheet deleveraged. MUL's additional capacity will be an impetus for higher sales volume in future.
MUL has focused on increasing export sales, which increased from 16.5% of the total revenue in FY12 to 26.3% in FY16. It is the only player from India to supply synthetic leather to Ford and Chrysler in US. In FY16, the company incorporated a fully owned subsidiary Mayur Uniquoters Corp. in Texas, USA to strengthen its overseas presence and add global auto OEMs as clients. We believe, the company is poised to benefit from increasing exports, supported by strong growth of global synthetic leather market.
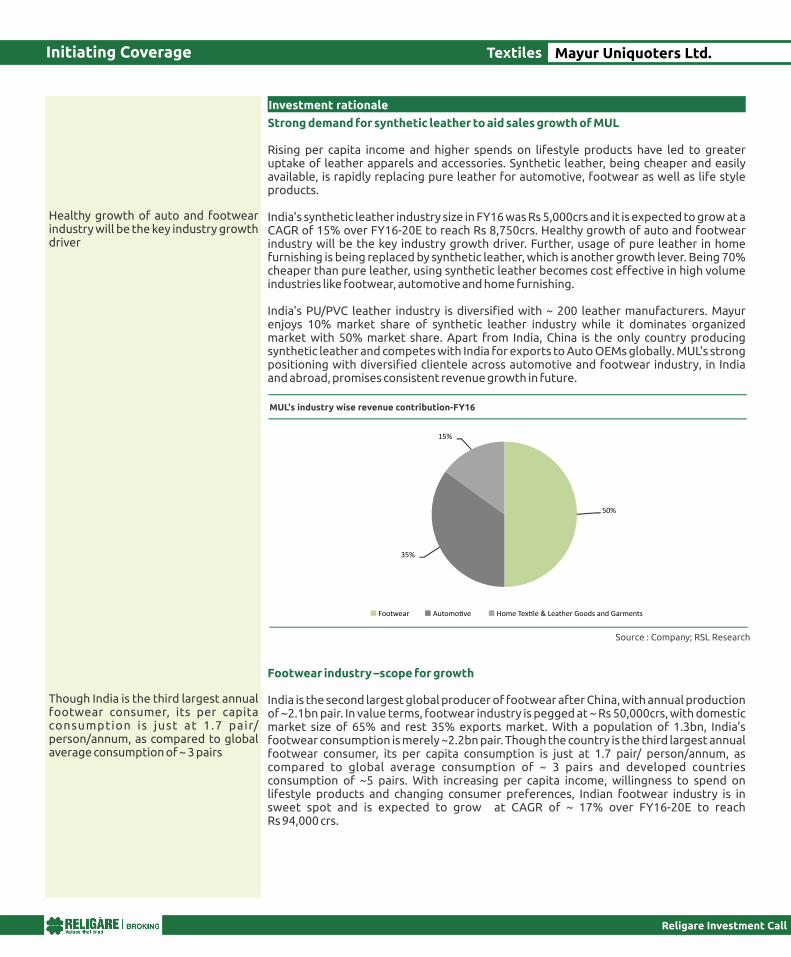
Footwear industry contributed 50% of sales in FY16, while rest was derived from automotive, home furnishing and fashion goods and garments. Footwear industry is dominated by unorgasnied players with 60% of total market share, while branded players form 40% of the industry size. Since catering to footwear companies is a low margin, high volume business, MUL has diversified focused onto automotive and home furnishing segments in India. MUL's strong positioning in branded leather segment will help to diversify business risk as well as assist revenue growth.
MUL enjoys 50% market share of organised industry, which mirrors its strong positioning and growth opportunities, in line with industry growth. MUL's diversified clientele base, increasing exports sales, PU and PVC leather capacity addition augur well for company's future growth prospects. Competition from unoragnised players weighed on FY17 earnings, however, we expect earnings to improve gradually. We estimate Net sales, EBITDA and PAT to grow at a CAGR of 10.7%, 14.8% and 14.5% over FY17-19E. We initiate coverage on Mayur Uniquoters with a BUY rating and a price target of Rs. 478.
Financial Summary
Religare Investment Call
April 18, 2017
Textiles
CMP (Rs)
Target Price (Rs)
Potential Upside
Sensex
Nifty
Key Stock data
BSE Code
NSE Code
Bloomberg
Shares o/s, Cr (FV 5)
Market Cap (Rs Cr)
3M Avg Volume
52 week H/L
Shareholding Pattern
(%)
Promoter
FII
DII
Others
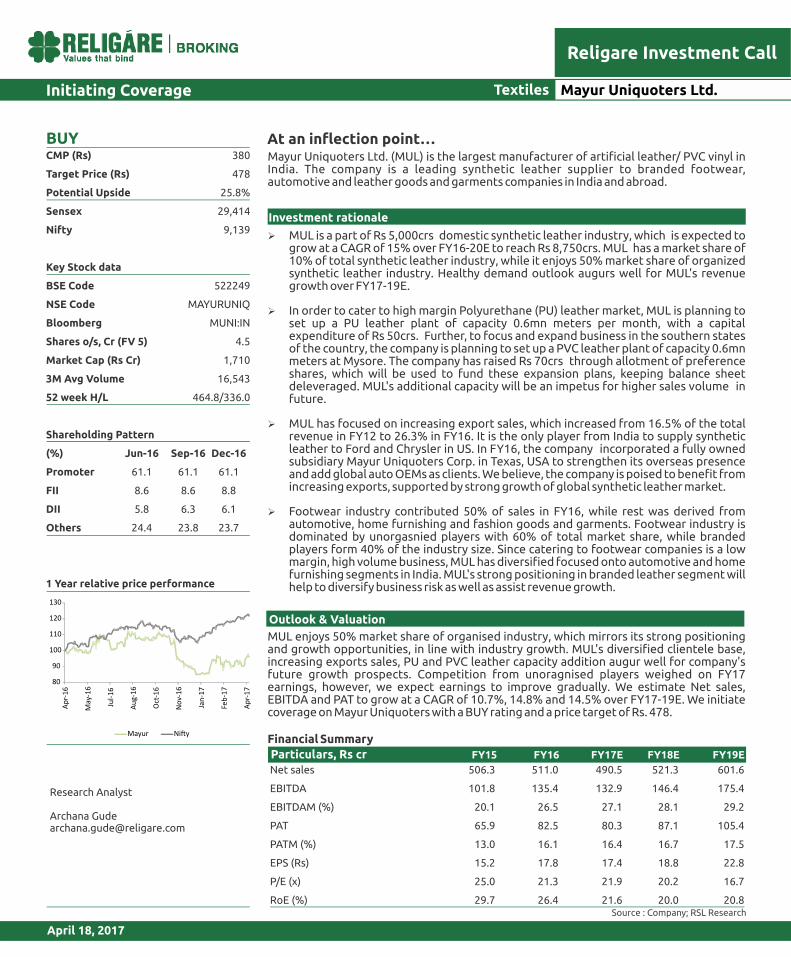
1 Year relative price performance
380
478
25.8%
29,414
9,139
522249
MAYURUNIQ
MUNI:IN
4.5
1,710
16,543
464.8/336.0
Jun-16
61.1
8.6
5.8
24.4
Sep-16
61.1
8.6
6.3
23.8
Dec-16
61.1
8.8
6.1
23.7
Research Analyst
Archana Gude [email protected]
Investment rationale
Outlook & Valuation
Initiating Coverage Mayur Uniquoters Ltd.
At an inflection point…BUY
Particulars, Rs cr FY15 FY16 FY17E FY18E FY19E
Net sales
EBITDA
EBITDAM (%)
PAT
PATM (%)
EPS (Rs)
P/E (x)
RoE (%)
506.3
101.8
20.1
65.9
13.0
15.2
25.0
29.7
511.0
135.4
26.5
82.5
16.1
17.8
21.3
26.4
490.5
132.9
27.1
80.3
16.4
17.4
21.9
21.6
521.3
146.4
28.1
87.1
16.7
18.8
20.2
20.0
601.6
175.4
29.2
105.4
17.5
22.8
16.7
20.8Source : Company; RSL Research
80
90
100
110
120
130
Ap
r-1
6
May
-16
Jul-
16
Au
g-1
6
Oct
-16
No
v-1
6
Jan
-17
Feb
-17
Ap
r-1
7
Mayur Ni�y
Initiating Coverage Textiles
Religare Investment Call
Mayur Uniquoters Ltd.
Investment rationale
Strong demand for synthetic leather to aid sales growth of MUL
Rising per capita income and higher spends on lifestyle products have led to greater uptake of leather apparels and accessories. Synthetic leather, being cheaper and easily available, is rapidly replacing pure leather for automotive, footwear as well as life style products.
India's synthetic leather industry size in FY16 was Rs 5,000crs and it is expected to grow at a CAGR of 15% over FY16-20E to reach Rs 8,750crs. Healthy growth of auto and footwear industry will be the key industry growth driver. Further, usage of pure leather in home furnishing is being replaced by synthetic leather, which is another growth lever. Being 70% cheaper than pure leather, using synthetic leather becomes cost effective in high volume industries like footwear, automotive and home furnishing.
India's PU/PVC leather industry is diversified with ~ 200 leather manufacturers. Mayur enjoys 10% market share of synthetic leather industry while it dominates organized market with 50% market share. Apart from India, China is the only country producing synthetic leather and competes with India for exports to Auto OEMs globally. MUL's strong positioning with diversified clientele across automotive and footwear industry, in India and abroad, promises consistent revenue growth in future.
Footwear industry –scope for growth
India is the second largest global producer of footwear after China, with annual production of ~2.1bn pair. In value terms, footwear industry is pegged at ~ Rs 50,000crs, with domestic market size of 65% and rest 35% exports market. With a population of 1.3bn, India's footwear consumption is merely ~2.2bn pair. Though the country is the third largest annual footwear consumer, its per capita consumption is just at 1.7 pair/ person/annum, as compared to global average consumption of ~ 3 pairs and developed countries consumption of ~5 pairs. With increasing per capita income, willingness to spend on lifestyle products and changing consumer preferences, Indian footwear industry is in sweet spot and is expected to grow at CAGR of ~ 17% over FY16-20E to reach Rs 94,000 crs.
Healthy growth of auto and footwear industry will be the key industry growth driver
Though India is the third largest annual footwear consumer, its per capita consumption is just at 1.7 pair/ person/annum, as compared to global average consumption of ~ 3 pairs
MUL's industry wise revenue contribution-FY16
Source : Company; RSL Research
50%
35%
15%
Footwear Automo�ve Home Tex�le & Leather Goods and Garments
In FY16, 50% of MUL’s revenue contribution was from domestic footwear industry. The company is a major supplier to leading footwear manufacturers like Bata, Relaxo, Paragon, Liberty to name a few. It offers products for various parts of footwear like shoe uppers, show lining and insoles. These products find application in formal shoe and boots, sports shoes, sandals, slippers as well as high end women's footwear.
With implementation of GST, organized footwear players will benefit as pricing parity between unorganized and organized comes at par. Being the largest supplier of synthetic leather to branded footwear companies, MUL will benefit from growth of the industry.
Automotive segment to continue its positive traction
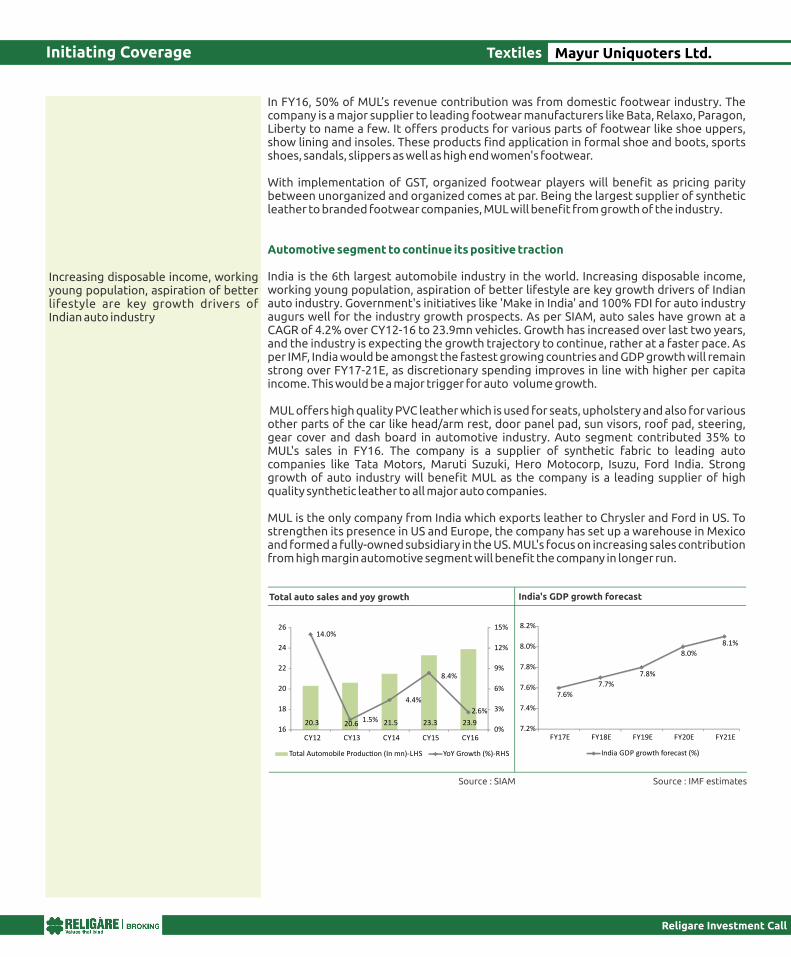
India is the 6th largest automobile industry in the world. Increasing disposable income, working young population, aspiration of better lifestyle are key growth drivers of Indian auto industry. Government's initiatives like 'Make in India' and 100% FDI for auto industry augurs well for the industry growth prospects. As per SIAM, auto sales have grown at a CAGR of 4.2% over CY12-16 to 23.9mn vehicles. Growth has increased over last two years, and the industry is expecting the growth trajectory to continue, rather at a faster pace. As per IMF, India would be amongst the fastest growing countries and GDP growth will remain strong over FY17-21E, as discretionary spending improves in line with higher per capita income. This would be a major trigger for auto volume growth.
MUL offers high quality PVC leather which is used for seats, upholstery and also for various other parts of the car like head/arm rest, door panel pad, sun visors, roof pad, steering, gear cover and dash board in automotive industry. Auto segment contributed 35% to MUL's sales in FY16. The company is a supplier of synthetic fabric to leading auto companies like Tata Motors, Maruti Suzuki, Hero Motocorp, Isuzu, Ford India. Strong growth of auto industry will benefit MUL as the company is a leading supplier of high quality synthetic leather to all major auto companies.
MUL is the only company from India which exports leather to Chrysler and Ford in US. To strengthen its presence in US and Europe, the company has set up a warehouse in Mexico and formed a fully-owned subsidiary in the US. MUL's focus on increasing sales contribution from high margin automotive segment will benefit the company in longer run.
Source : SIAM
Total auto sales and yoy growth India's GDP growth forecast
Initiating Coverage
Religare Investment Call
Increasing disposable income, working young population, aspiration of better lifestyle are key growth drivers of Indian auto industry
Textiles Mayur Uniquoters Ltd.
7.6%
7.7%
7.8%
8.0%
8.1%
7.2%
7.4%
7.6%
7.8%
8.0%
8.2%
FY17E FY18E FY19E FY20E FY21E
India GDP growth forecast (%)
Source : IMF estimates
20.3 20.6 21.5 23.3 23.9
14.0%
1.5%
4.4%
8.4%
2.6%
0%
3%
6%
9%
12%
15%
16
18
20
22
24
26
CY12 CY13 CY14 CY15 CY16
Total Automobile Produc�on (In mn)-LHS YoY Growth (%)-RHS
Focus on exports to help margin improvement
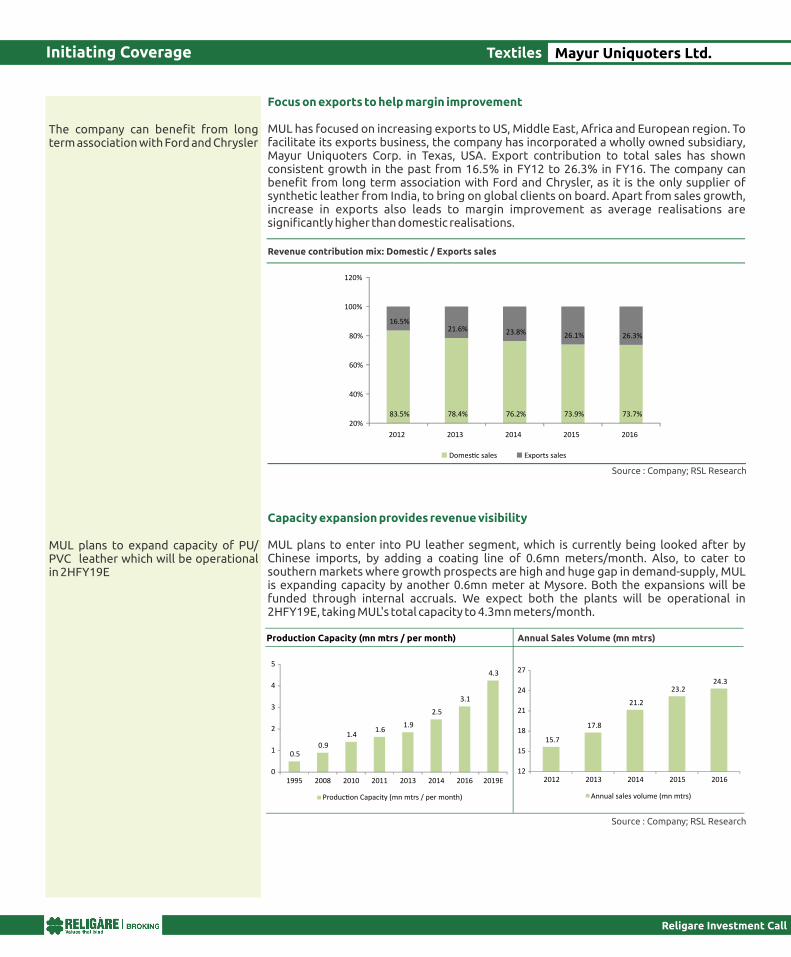
MUL has focused on increasing exports to US, Middle East, Africa and European region. To facilitate its exports business, the company has incorporated a wholly owned subsidiary, Mayur Uniquoters Corp. in Texas, USA. Export contribution to total sales has shown consistent growth in the past from 16.5% in FY12 to 26.3% in FY16. The company can benefit from long term association with Ford and Chrysler, as it is the only supplier of synthetic leather from India, to bring on global clients on board. Apart from sales growth, increase in exports also leads to margin improvement as average realisations are significantly higher than domestic realisations.
Capacity expansion provides revenue visibility
MUL plans to enter into PU leather segment, which is currently being looked after by Chinese imports, by adding a coating line of 0.6mn meters/month. Also, to cater to southern markets where growth prospects are high and huge gap in demand-supply, MUL is expanding capacity by another 0.6mn meter at Mysore. Both the expansions will be funded through internal accruals. We expect both the plants will be operational in 2HFY19E, taking MUL's total capacity to 4.3mn meters/month.
Initiating Coverage
Religare Investment Call
The company can benefit from long term association with Ford and Chrysler
MUL plans to expand capacity of PU/ PVC leather which will be operational in 2HFY19E
Revenue contribution mix: Domestic / Exports sales
Source : Company; RSL Research
Textiles Mayur Uniquoters Ltd.
83.5% 78.4% 76.2% 73.9% 73.7%
16.5%21.6% 23.8% 26.1% 26.3%
20%
40%
60%
80%
100%
120%
2012 2013 2014 2015 2016
Domes�c sales Exports sales
Source : Company; RSL Research
Production Capacity (mn mtrs / per month) Annual Sales Volume (mn mtrs)
0.50.9
1.41.6
1.9
2.5
3.1
4.3
0
1
2
3
4
5
1995 2008 2010 2011 2013 2014 2016 2019E
Produc�on Capacity (mn mtrs / per month)
15.7
17.8
21.2
23.224.3
12
15
18
21
24
27
2012 2013 2014 2015 2016
Annual sales volume (mn mtrs)
Extensive clientele list mitigates downside risks
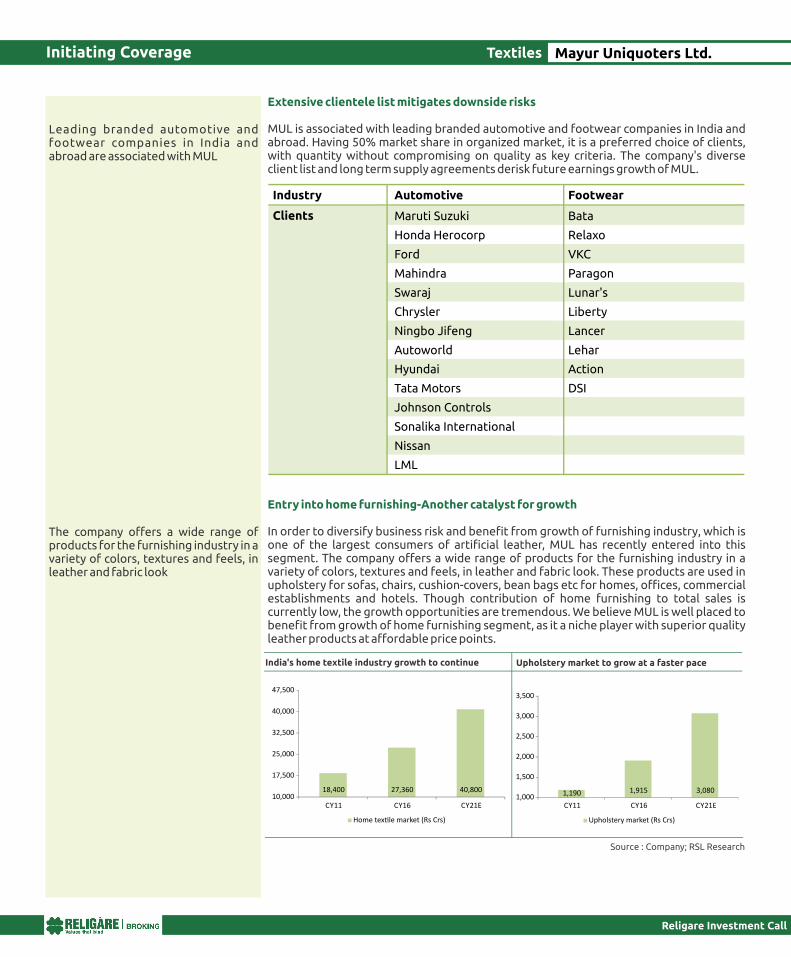
MUL is associated with leading branded automotive and footwear companies in India and abroad. Having 50% market share in organized market, it is a preferred choice of clients, with quantity without compromising on quality as key criteria. The company's diverse client list and long term supply agreements derisk future earnings growth of MUL.
Entry into home furnishing-Another catalyst for growth
In order to diversify business risk and benefit from growth of furnishing industry, which is one of the largest consumers of artificial leather, MUL has recently entered into this segment. The company offers a wide range of products for the furnishing industry in a variety of colors, textures and feels, in leather and fabric look. These products are used in upholstery for sofas, chairs, cushion-covers, bean bags etc for homes, offices, commercial establishments and hotels. Though contribution of home furnishing to total sales is currently low, the growth opportunities are tremendous. We believe MUL is well placed to benefit from growth of home furnishing segment, as it a niche player with superior quality leather products at affordable price points.
Initiating Coverage
Religare Investment Call
Leading branded automotive and footwear companies in India and abroad are associated with MUL
The company offers a wide range of products for the furnishing industry in a variety of colors, textures and feels, in leather and fabric look
Textiles Mayur Uniquoters Ltd.
Industry Automotive Footwear
Clients Maruti Suzuki Bata
Honda Herocorp Relaxo
Ford
VKC
Mahindra
Paragon
Swaraj
Lunar's
Chrysler
Liberty
Ningbo Jifeng
Lancer
Autoworld
Lehar
Hyundai
Action
Tata Motors
DSI
Johnson Controls Sonalika International
Nissan
LML
Source : Company; RSL Research
India's home textile industry growth to continue Upholstery market to grow at a faster pace
18,400 27,360 40,800 10,000
17,500
25,000
32,500
40,000
47,500
CY11 CY16 CY21E
Home tex�le market (Rs Crs)
1,190 1,915 3,080 1,000
1,500
2,000
2,500
3,000
3,500
CY11 CY16 CY21E
Upholstery market (Rs Crs)
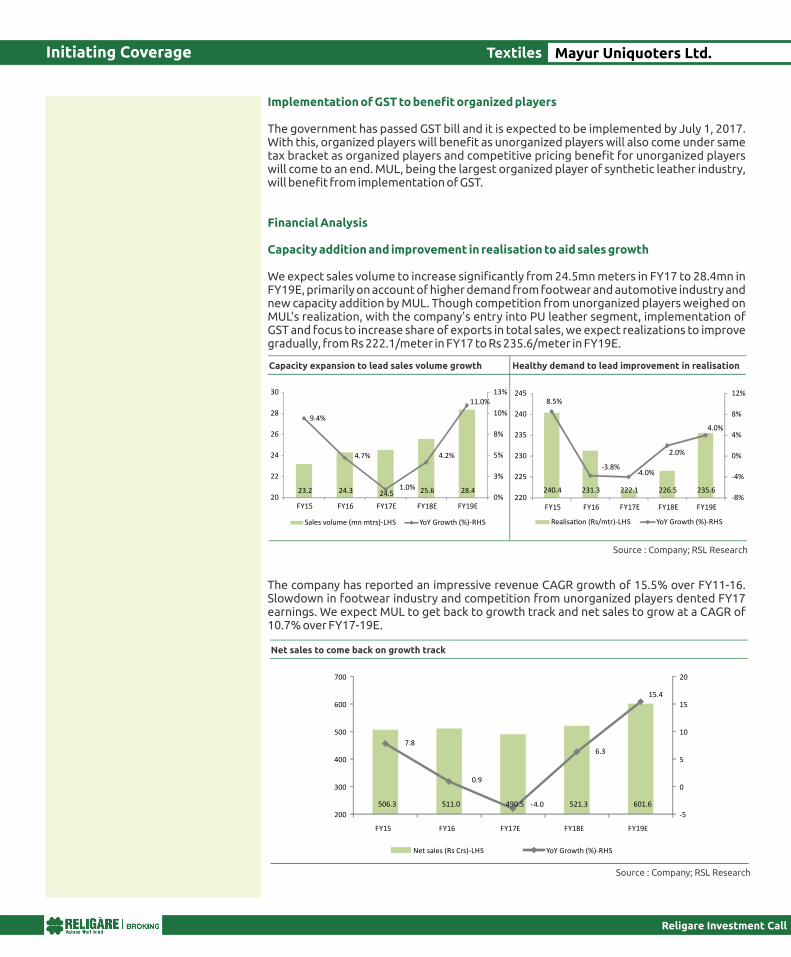
Implementation of GST to benefit organized players
The government has passed GST bill and it is expected to be implemented by July 1, 2017. With this, organized players will benefit as unorganized players will also come under same tax bracket as organized players and competitive pricing benefit for unorganized players will come to an end. MUL, being the largest organized player of synthetic leather industry, will benefit from implementation of GST.
Financial Analysis
Capacity addition and improvement in realisation to aid sales growth
We expect sales volume to increase significantly from 24.5mn meters in FY17 to 28.4mn in FY19E, primarily on account of higher demand from footwear and automotive industry and new capacity addition by MUL. Though competition from unorganized players weighed on MUL's realization, with the company's entry into PU leather segment, implementation of GST and focus to increase share of exports in total sales, we expect realizations to improve gradually, from Rs 222.1/meter in FY17 to Rs 235.6/meter in FY19E.
The company has reported an impressive revenue CAGR growth of 15.5% over FY11-16. Slowdown in footwear industry and competition from unorganized players dented FY17 earnings. We expect MUL to get back to growth track and net sales to grow at a CAGR of 10.7% over FY17-19E.
Initiating Coverage
Religare Investment Call
Textiles Mayur Uniquoters Ltd.
Source : Company; RSL Research
Capacity expansion to lead sales volume growth Healthy demand to lead improvement in realisation
23.2 24.3 24.5 25.6 28.4
9.4%
4.7%
1.0%
4.2%
11.0%
0%
3%
5%
8%
10%
13%
20
22
24
26
28
30
FY15 FY16 FY17E FY18E FY19E
Sales volume (mn mtrs)-LHS YoY Growth (%)-RHS
240.4 231.3 222.1 226.5 235.6
8.5%
-3.8%-4.0%
2.0%
4.0%
-8%
-4%
0%
4%
8%
12%
220
225
230
235
240
245
FY15 FY16 FY17E FY18E FY19E
Realisa�on (Rs/mtr)-LHS YoY Growth (%)-RHS
Source : Company; RSL Research
Net sales to come back on growth track
506.3 511.0 490.5 521.3 601.6
7.8
0.9
-4.0
6.3
15.4
-5
0
5
10
15
20
200
300
400
500
600
700
FY15 FY16 FY17E FY18E FY19E
Net sales (Rs Crs)-LHS YoY Growth (%)-RHS
Initiating Coverage
Religare Investment Call
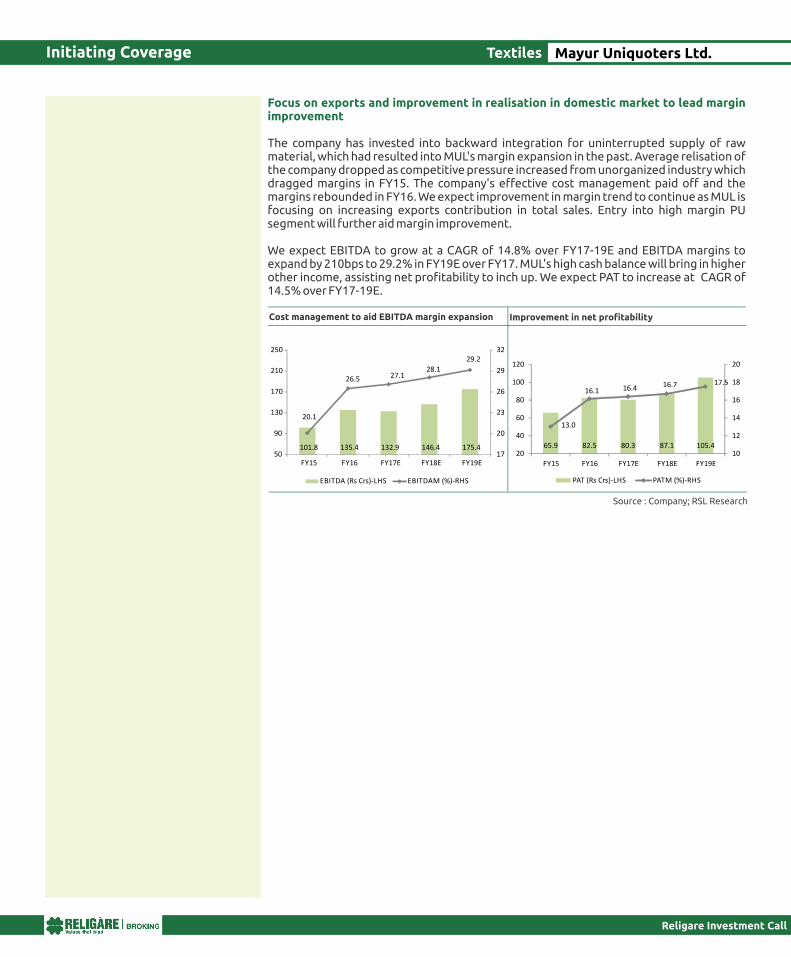
Focus on exports and improvement in realisation in domestic market to lead margin improvement
The company has invested into backward integration for uninterrupted supply of raw material, which had resulted into MUL's margin expansion in the past. Average relisation of the company dropped as competitive pressure increased from unorganized industry which dragged margins in FY15. The company's effective cost management paid off and the margins rebounded in FY16. We expect improvement in margin trend to continue as MUL is focusing on increasing exports contribution in total sales. Entry into high margin PU segment will further aid margin improvement.
We expect EBITDA to grow at a CAGR of 14.8% over FY17-19E and EBITDA margins to expand by 210bps to 29.2% in FY19E over FY17. MUL's high cash balance will bring in higher other income, assisting net profitability to inch up. We expect PAT to increase at CAGR of 14.5% over FY17-19E.
Textiles Mayur Uniquoters Ltd.
Source : Company; RSL Research
Cost management to aid EBITDA margin expansion Improvement in net profitability
101.8 135.4 132.9 146.4 175.4
20.1
26.5 27.128.1
29.2
17
20
23
26
29
32
50
90
130
170
210
250
FY15 FY16 FY17E FY18E FY19E
EBITDA (Rs Crs)-LHS EBITDAM (%)-RHS
65.9 82.5 80.3 87.1 105.4
13.0
16.1 16.4 16.7 17.5
10
12
14
16
18
20
20
40
60
80
100
120
FY15 FY16 FY17E FY18E FY19E
PAT (Rs Crs)-LHS PATM (%)-RHS
Risks
Initiating Coverage
Religare Investment Call
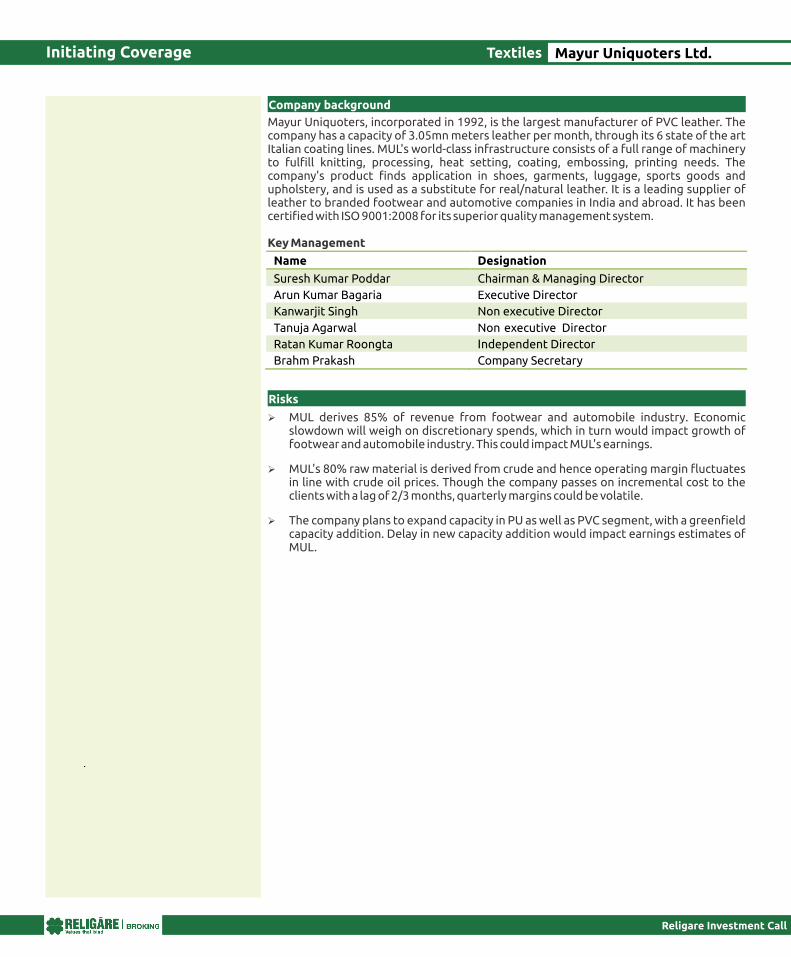
Mayur Uniquoters, incorporated in 1992, is the largest manufacturer of PVC leather. The company has a capacity of 3.05mn meters leather per month, through its 6 state of the art Italian coating lines. MUL's world-class infrastructure consists of a full range of machinery to fulfill knitting, processing, heat setting, coating, embossing, printing needs. The company's product finds application in shoes, garments, luggage, sports goods and upholstery, and is used as a substitute for real/natural leather. It is a leading supplier of leather to branded footwear and automotive companies in India and abroad. It has been certified with ISO 9001:2008 for its superior quality management system.
Key Management
MUL derives 85% of revenue from footwear and automobile industry. Economic slowdown will weigh on discretionary spends, which in turn would impact growth of footwear and automobile industry. This could impact MUL's earnings.
MUL's 80% raw material is derived from crude and hence operating margin fluctuates in line with crude oil prices. Though the company passes on incremental cost to the clients with a lag of 2/3 months, quarterly margins could be volatile.
The company plans to expand capacity in PU as well as PVC segment, with a greenfield capacity addition. Delay in new capacity addition would impact earnings estimates of MUL.
Company background
Textiles Mayur Uniquoters Ltd.
Name Designation Suresh Kumar Poddar
Chairman & Managing Director
Arun Kumar Bagaria
Executive Director
Kanwarjit Singh
Non executive Director
Tanuja Agarwal
Non executive
Director
Ratan Kumar Roongta Independent Director
Brahm Prakash Company Secretary
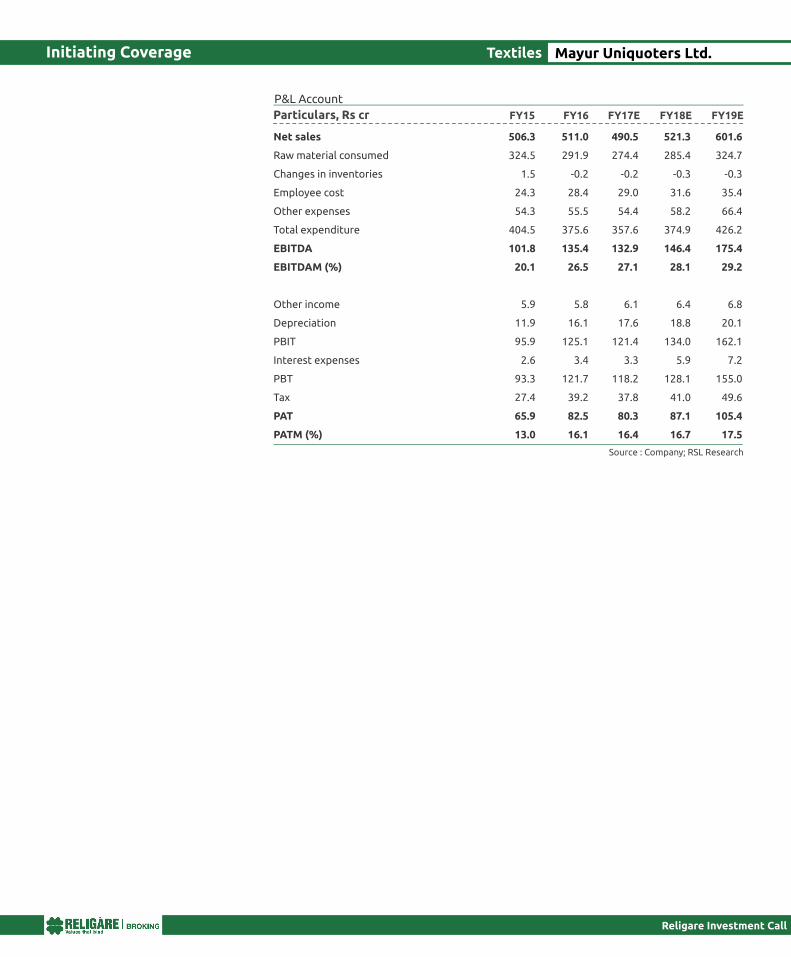
Net sales
Raw material consumed
Changes in inventories
Employee cost
Other expenses
Total expenditure
EBITDA
EBITDAM (%)
Other income
Depreciation
PBIT
Interest expenses
PBT
Tax
PAT
PATM (%)
Particulars, Rs cr FY16
FY18E FY15 FY19E
FY17E
Source : Company; RSL Research
511.0
291.9
-0.2
28.4
55.5
375.6
135.4
26.5
5.8
16.1
125.1
3.4
121.7
39.2
82.5
16.1
521.3
285.4
-0.3
31.6
58.2
374.9
146.4
28.1
6.4
18.8
134.0
5.9
128.1
41.0
87.1
16.7
506.3
324.5
1.5
24.3
54.3
404.5
101.8
20.1
5.9
11.9
95.9
2.6
93.3
27.4
65.9
13.0
601.6
324.7
-0.3
35.4
66.4
426.2
175.4
29.2
6.8
20.1
162.1
7.2
155.0
49.6
105.4
17.5
490.5
274.4
-0.2
29.0
54.4
357.6
132.9
27.1
6.1
17.6
121.4
3.3
118.2
37.8
80.3
16.4
P&L Account
Religare Investment Call
Initiating Coverage Textiles Mayur Uniquoters Ltd.
Religare Investment Call
Initiating Coverage
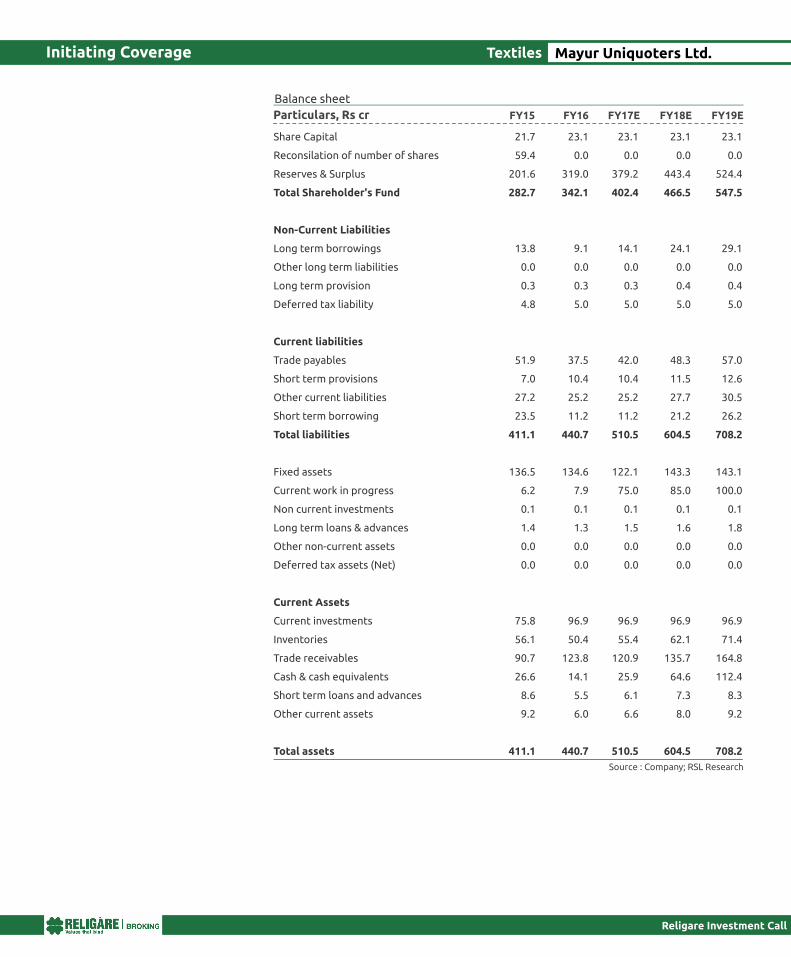
Share Capital
Reconsilation of number of shares
Reserves & Surplus
Total Shareholder's Fund
Non-Current Liabilities
Long term borrowings
Other long term liabilities
Long term provision
Deferred tax liability
Current liabilities
Trade payables
Short term provisions
Other current liabilities
Short term borrowing
Total liabilities
Fixed assets
Current work in progress
Non current investments
Long term loans & advances
Other non-current assets
Deferred tax assets (Net)
Current Assets
Current investments
Inventories
Trade receivables
Cash & cash equivalents
Short term loans and advances
Other current assets
Total assets
Particulars, Rs cr FY16
FY18E FY15 FY19E
FY17E
Source : Company; RSL Research
23.1
0.0
319.0
342.1
9.1
0.0
0.3
5.0
37.5
10.4
25.2
11.2
440.7
134.6
7.9
0.1
1.3
0.0
0.0
96.9
50.4
123.8
14.1
5.5
6.0
440.7
23.1
0.0
443.4
466.5
24.1
0.0
0.4
5.0
48.3
11.5
27.7
21.2
604.5
143.3
85.0
0.1
1.6
0.0
0.0
96.9
62.1
135.7
64.6
7.3
8.0
604.5
21.7
59.4
201.6
282.7
13.8
0.0
0.3
4.8
51.9
7.0
27.2
23.5
411.1
136.5
6.2
0.1
1.4
0.0
0.0
75.8
56.1
90.7
26.6
8.6
9.2
411.1
23.1
0.0
524.4
547.5
29.1
0.0
0.4
5.0
57.0
12.6
30.5
26.2
708.2
143.1
100.0
0.1
1.8
0.0
0.0
96.9
71.4
164.8
112.4
8.3
9.2
708.2
23.1
0.0
379.2
402.4
14.1
0.0
0.3
5.0
42.0
10.4
25.2
11.2
510.5
122.1
75.0
0.1
1.5
0.0
0.0
96.9
55.4
120.9
25.9
6.1
6.6
510.5
Balance sheet
Textiles Mayur Uniquoters Ltd.
Religare Investment Call
Initiating Coverage
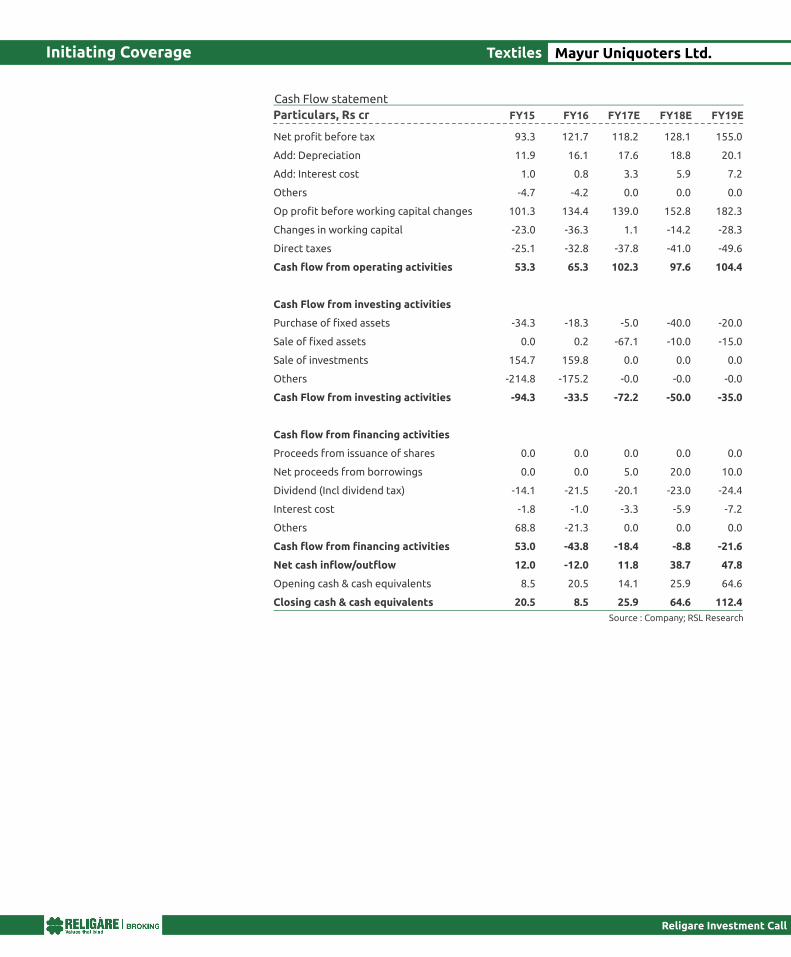
Net profit before tax
Add: Depreciation
Add: Interest cost
Others
Op profit before working capital changes
Changes in working capital
Direct taxes
Cash flow from operating activities
Cash Flow from investing activities
Purchase of fixed assets
Sale of fixed assets
Sale of investments
Others
Cash Flow from investing activities
Cash flow from financing activities
Proceeds from issuance of shares
Net proceeds from borrowings
Dividend (Incl dividend tax)
Interest cost
Others
Cash flow from financing activities
Net cash inflow/outflow
Opening cash & cash equivalents
Closing cash & cash equivalents
Particulars, Rs cr FY16
FY18E FY15 FY19E
FY17E
Source : Company; RSL Research
121.7
16.1
0.8
-4.2
134.4
-36.3
-32.8
65.3
-18.3
0.2
159.8
-175.2
-33.5
0.0
0.0
-21.5
-1.0
-21.3
-43.8
-12.0
20.5
8.5
128.1
18.8
5.9
0.0
152.8
-14.2
-41.0
97.6
-40.0
-10.0
0.0
-0.0
-50.0
0.0
20.0
-23.0
-5.9
0.0
-8.8
38.7
25.9
64.6
93.3
11.9
1.0
-4.7
101.3
-23.0
-25.1
53.3
-34.3
0.0
154.7
-214.8
-94.3
0.0
0.0
-14.1
-1.8
68.8
53.0
12.0
8.5
20.5
155.0
20.1
7.2
0.0
182.3
-28.3
-49.6
104.4
-20.0
-15.0
0.0
-0.0
-35.0
0.0
10.0
-24.4
-7.2
0.0
-21.6
47.8
64.6
112.4
118.2
17.6
3.3
0.0
139.0
1.1
-37.8
102.3
-5.0
-67.1
0.0
-0.0
-72.2
0.0
5.0
-20.1
-3.3
0.0
-18.4
11.8
14.1
25.9
Cash Flow statement
Textiles Mayur Uniquoters Ltd.

Religare Investment Call
Initiating Coverage
Dividend per share, Rs
Dividend Yield (%)
Payout (%)
EPS Rs
Book value per share Rs
Profitability Ratios
EBITDA/Total Income (%)
PBT/Total Income (%)
NPM/Total Income (%)
RoCE (%)
RoE (%)
Liquidity Ratios
Gross Debt Equity ratio
Interest Coverage ratio
Current ratio
Turnover Ratios
Total Asset Ratio
Fixed Asset Ratio
Debtors Velocity (Days)
Inventory (Days)
Creditor Velocity (Days)
Particulars FY16
FY18E FY15 FY19E
FY17E
Source : Company; RSL Research
3.5
1.0
24.3
17.8
73.9
26.5
23.8
16.1
36.1
26.4
0.1
0.0
3.5
1.2
3.8
88.4
49.0
26.8
4.0
1.1
26.4
18.8
100.8
28.1
24.6
16.7
28.2
20.0
0.1
0.0
3.4
0.9
3.9
95.0
60.4
33.8
3.1
0.9
25.5
15.2
65.3
20.1
18.4
13.0
36.3
29.7
0.1
0.0
2.4
1.4
4.3
65.4
50.6
37.4
4.3
1.2
23.1
22.8
118.3
29.2
25.8
17.5
28.8
20.8
0.1
0.0
3.7
0.9
4.2
100.0
61.1
34.6
3.5
1.0
25.0
17.4
86.9
27.1
24.1
16.4
30.4
21.6
0.1
0.0
3.5
1.0
3.8
90.0
56.6
31.3
Key Financial ratios
Textiles Mayur Uniquoters Ltd.
Religare Investment Call
Before you use this research report , please ensure to go through thedisclosure inter-alia as required under Securities and Exchange Board of India (Research Analysts) Regulat ions , 2014 and Research Disc la imer at the fol lowing l ink : http://old.religareonline.com/research/Disclaimer/Disclaimer_RSL.htmlSpecific analyst(s) specific disclosure(s) inter-alia as required under Securities and Exchange Board of India (Research Analysts) Regulations, 2014 is/are as under:Statements on ownership and material conflicts of interest , compensation– Research Analyst (RA) [Please note that only in case of multiple RAs, if in the event answers differ inter-se between the RAs, then RA specific answer with respect to questions under F (a) to F(j) below , are given separately]
S. No. Statement Answer
Tick appropriate
I/we or any of my/our relative has any financial interest in the subject company? [If answer is yes, nature of Interestis given below this table]
I/we or any of my/our relatives, have actual/beneficial ownership of one per cent. or more securities of the subject company, at the end of the month immediately preceding the date of publication of the research report or date of the public appearance?
I / we or any of my/our relative, has any other material conflict of interest at the time of publication of the research report or at the time of public appearance?
I/we have received any compensation from the subject company in the past twelve months?
I/we have managed or co-managed public offering of securities for the subject company in the past twelve months?
I/we have received any compensation for brokerage services from the subject company in the past twelve months?
I/we have received any compensation for products or services other than brokerage services from the subject company in the past twelve months?
I/we have received any compensation or other benefits from the subject company or third party in connection with the research report?
I/we have served as an officer, director or employee of the subject company?
I/we have been engaged in market making activity for the subject company?
YES NO
NO
NO
NO
NO
NO
NO
NO
NO
NO
NO
Nature of Interest ( if answer to F (a) aboveis Yes : …………………………………………………………………………………………………………………………………………………............................................Name(s)with Signature(s)of RA(s).[Please note that only in case of multiple RAs andif the answers differ inter-se between the RAs, then RA specific answer with respect to questions under F (a) to F(j) above , are given below]
SS.No Name(s) of RA Signatures of RASerial Question of question which the signing RA needs
to make separate declaration / answer YES NO
Copyright in this document vests exclusively with RSL. This information should not be reproduced or redistributed or passed on directly or indirectly in any form to any other person or published, copied, in whole or in part, for any purpose, without prior written permission from RSL. We do not guarantee the integrity of any emails or attached files and are not responsible for any changes made to them by any other person.
Disclaimer: www.religareonline.com/research/Disclaimer/Disclaimer_RSL.html
Initiating Coverage Textiles Mayur Uniquoters Ltd.