Embed Size (px)
Citation preview
Duc Thanh Wood Processing JSC
Ticker: GDT Reuters: GDT.HM Bloomberg: GDT Equity VN
A new growth cycle starting from 2021 likely
Wood Sector
Initiation Report
March 2021
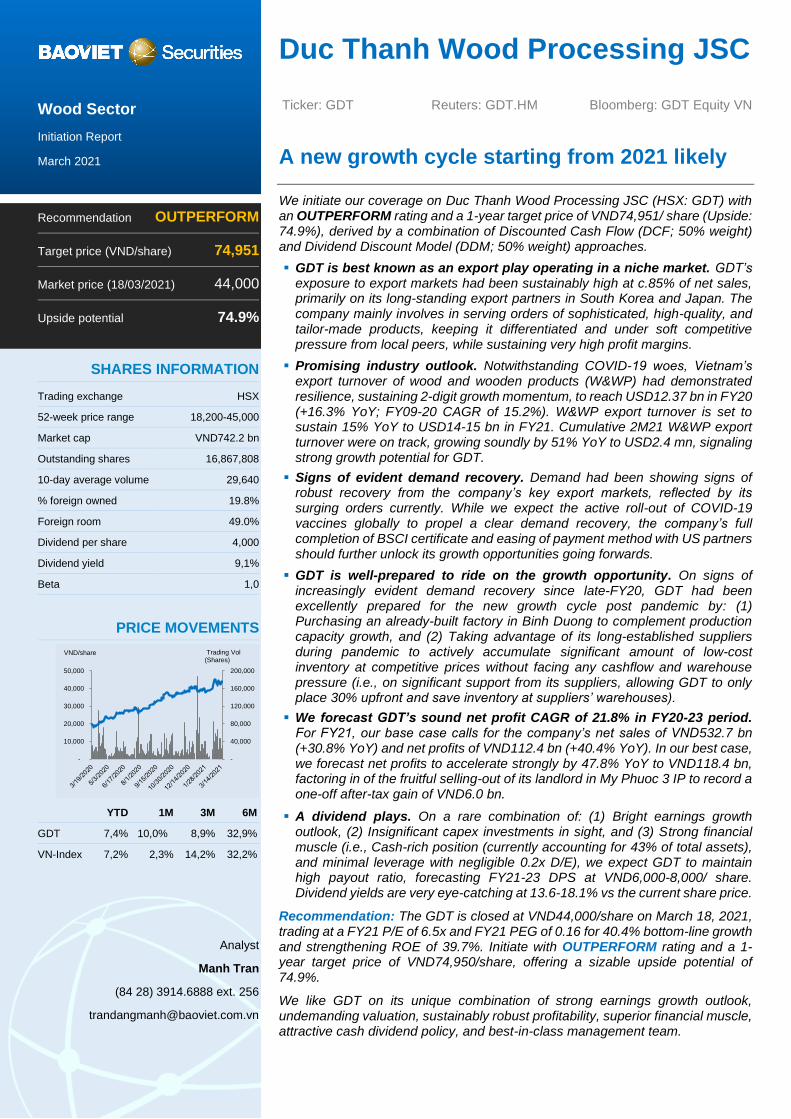
We initiate our coverage on Duc Thanh Wood Processing JSC (HSX: GDT) with an OUTPERFORM rating and a 1-year target price of VND74,951/ share (Upside: 74.9%), derived by a combination of Discounted Cash Flow (DCF; 50% weight) and Dividend Discount Model (DDM; 50% weight) approaches.
▪ GDT is best known as an export play operating in a niche market. GDT’s exposure to export markets had been sustainably high at c.85% of net sales, primarily on its long-standing export partners in South Korea and Japan. The company mainly involves in serving orders of sophisticated, high-quality, and tailor-made products, keeping it differentiated and under soft competitive pressure from local peers, while sustaining very high profit margins.
▪ Promising industry outlook. Notwithstanding COVID-19 woes, Vietnam’s export turnover of wood and wooden products (W&WP) had demonstrated resilience, sustaining 2-digit growth momentum, to reach USD12.37 bn in FY20 (+16.3% YoY; FY09-20 CAGR of 15.2%). W&WP export turnover is set to sustain 15% YoY to USD14-15 bn in FY21. Cumulative 2M21 W&WP export turnover were on track, growing soundly by 51% YoY to USD2.4 mn, signaling strong growth potential for GDT.
▪ Signs of evident demand recovery. Demand had been showing signs of robust recovery from the company’s key export markets, reflected by its surging orders currently. While we expect the active roll-out of COVID-19 vaccines globally to propel a clear demand recovery, the company’s full completion of BSCI certificate and easing of payment method with US partners should further unlock its growth opportunities going forwards.
▪ GDT is well-prepared to ride on the growth opportunity. On signs of increasingly evident demand recovery since late-FY20, GDT had been excellently prepared for the new growth cycle post pandemic by: (1) Purchasing an already-built factory in Binh Duong to complement production capacity growth, and (2) Taking advantage of its long-established suppliers during pandemic to actively accumulate significant amount of low-cost inventory at competitive prices without facing any cashflow and warehouse pressure (i.e., on significant support from its suppliers, allowing GDT to only place 30% upfront and save inventory at suppliers’ warehouses).
▪ We forecast GDT’s sound net profit CAGR of 21.8% in FY20-23 period. For FY21, our base case calls for the company’s net sales of VND532.7 bn (+30.8% YoY) and net profits of VND112.4 bn (+40.4% YoY). In our best case, we forecast net profits to accelerate strongly by 47.8% YoY to VND118.4 bn, factoring in of the fruitful selling-out of its landlord in My Phuoc 3 IP to record a one-off after-tax gain of VND6.0 bn.
▪ A dividend plays. On a rare combination of: (1) Bright earnings growth outlook, (2) Insignificant capex investments in sight, and (3) Strong financial muscle (i.e., Cash-rich position (currently accounting for 43% of total assets), and minimal leverage with negligible 0.2x D/E), we expect GDT to maintain high payout ratio, forecasting FY21-23 DPS at VND6,000-8,000/ share. Dividend yields are very eye-catching at 13.6-18.1% vs the current share price.
Recommendation: The GDT is closed at VND44,000/share on March 18, 2021, trading at a FY21 P/E of 6.5x and FY21 PEG of 0.16 for 40.4% bottom-line growth and strengthening ROE of 39.7%. Initiate with OUTPERFORM rating and a 1-year target price of VND74,950/share, offering a sizable upside potential of 74.9%.
We like GDT on its unique combination of strong earnings growth outlook, undemanding valuation, sustainably robust profitability, superior financial muscle, attractive cash dividend policy, and best-in-class management team.
Recommendation OUTPERFORM
Target price (VND/share) 74,951
Market price (18/03/2021) 44,000
Upside potential 74.9%
SHARES INFORMATION
Trading exchange HSX
52-week price range 18,200-45,000
Market cap VND742.2 bn
Outstanding shares 16,867,808
10-day average volume 29,640
% foreign owned 19.8%
Foreign room 49.0%
Dividend per share 4,000
Dividend yield 9,1%
Beta 1,0
PRICE MOVEMENTS
YTD 1M 3M 6M
GDT 7,4% 10,0% 8,9% 32,9%
VN-Index 7,2% 2,3% 14,2% 32,2%
Analyst
Manh Tran
(84 28) 3914.6888 ext. 256
-
40,000
80,000
120,000
160,000
200,000
-
10,000
20,000
30,000
40,000
50,000
VND/share Trading Vol (Shares)
Initiation Report Mar-2021 | GDT
2
FOCUS CHARTS
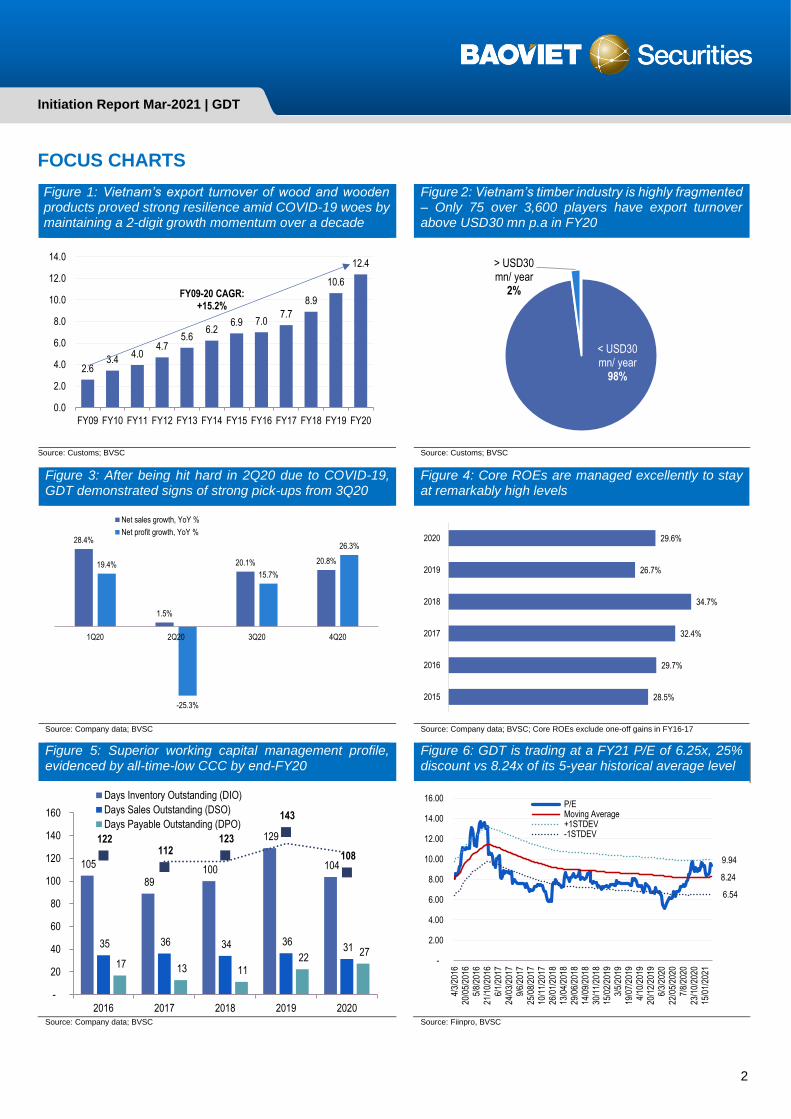
Figure 1: Vietnam’s export turnover of wood and wooden products proved strong resilience amid COVID-19 woes by maintaining a 2-digit growth momentum over a decade
Figure 2: Vietnam’s timber industry is highly fragmented – Only 75 over 3,600 players have export turnover above USD30 mn p.a in FY20
Source: Customs; BVSC Source: Customs; BVSC
Figure 3: After being hit hard in 2Q20 due to COVID-19, GDT demonstrated signs of strong pick-ups from 3Q20
Figure 4: Core ROEs are managed excellently to stay at remarkably high levels
Source: Company data; BVSC Source: Company data; BVSC; Core ROEs exclude one-off gains in FY16-17
Figure 5: Superior working capital management profile, evidenced by all-time-low CCC by end-FY20
Figure 6: GDT is trading at a FY21 P/E of 6.25x, 25% discount vs 8.24x of its 5-year historical average level
Source: Company data; BVSC Source: Fiinpro, BVSC
2.63.4
4.04.7
5.66.2
6.9 7.07.7
8.9
10.6
12.4
0.0
2.0
4.0
6.0
8.0
10.0
12.0
14.0
FY09 FY10 FY11 FY12 FY13 FY14 FY15 FY16 FY17 FY18 FY19 FY20
FY09-20 CAGR: +15.2%
< USD30 mn/ year
98%
> USD30 mn/ year
2%
28.4%
1.5%
20.1% 20.8%19.4%
-25.3%
15.7%
26.3%
1Q20 2Q20 3Q20 4Q20
Net sales growth, YoY %
Net profit growth, YoY %
28.5%
29.7%
32.4%
34.7%
26.7%
29.6%
2015
2016
2017
2018
2019
2020
105
89 100
129
104
35 36 34 36 31
17 13 11 22
27
122 112
123
143
108
-
20
40
60
80
100
120
140
160
2016 2017 2018 2019 2020
Days Inventory Outstanding (DIO)
Days Sales Outstanding (DSO)
Days Payable Outstanding (DPO)
8.24
9.94
6.54
-
2.00
4.00
6.00
8.00
10.00
12.00
14.00
16.00
4/3/
2016
20/0
5/20
165/
8/20
1621
/10/
2016
6/1/
2017
24/0
3/20
179/
6/20
1725
/08/
2017
10/1
1/20
1726
/01/
2018
13/0
4/20
1829
/06/
2018
14/0
9/20
1830
/11/
2018
15/0
2/20
193/
5/20
1919
/07/
2019
4/10
/201
920
/12/
2019
6/3/
2020
22/0
5/20
207/
8/20
2023
/10/
2020
15/0
1/20
21
P/E Moving Average +1STDEV -1STDEV

Initiation Report Mar-2021 | GDT
3
Company overview: An export play operating in a niche market
A reputable Vietnamese wood processor with sustainably large exposure to export
Founded in 1991 and listed in 2009, Duc Thanh Wood Processing JSC (HSX: GDT) is best known as
a small-sized, reputable Vietnamese wood process in both domestic and export markets. The
company’s four key product segments include: (1) Kitchenware; (2) Housewares; (3) Children toys;
and (4) Children tablets and other products. Apart from the best-in-class management team, GDT’s
key competitive advantage lies in its large, sustainable and growing exposure to export activities
(currently constituting c.85% of FY20 net sales) on top of its long-standing export partners in South
Korea and Japan, and tighter relationships with US partners.
Resilient and profitable business; A new growth cycle likely from 2021
On earnings side, GDT had proven itself a stable and profitable company with a FY15-20 CARG of
6.2% in net sales and 5.2% in net profits, while keeping net profit margin competitively high above
20.0%. As such, despite COVID-19 woes, GDT had further demonstrated its earnings resilience,
managing to deliver net sales of VND400.4 bn (+17.1% YoY) and net profit of VND80.8 bn (+7.8%
YoY). Going-forward outlook is very promising, premised on a growingly vivid recovery in both export
and domestic demand, coupled with its well-preparedness of a purchase of an already-built factory
expectedly to drive a new growth cycle.
Figure 7: GDT’s key earnings and balance sheet stats: Snapshot 2015 2016 2017 2018 2019 2020
Net sales (VND bn) 295.8 323.6 362.2 389.8 341.8 400.4
YoY % 12.0% 9.4% 11.9% 7.6% -12.3% 17.1%
Net profits (VND bn) 61.6 95.9 101.3 89.7 74.2 80.0
YoY % 19.2% 55.8% 5.6% -11.4% -17.3% 7.8%
GPM% 37.9% 37.6% 34.9% 35.8% 32.8% 31.2%
OPM% 25.5% 26.1% 25.0% 26.2% 23.3% 21.6%
NPM % 20.8% 29.6% 28.0% 23.0% 21.7% 20.0%
Adjusted EPS (VND/ share) 4,016 6,720 5,878 5,492 4,276 4,840
DPS (VND/ share) 4,000 6,000 6,000 5,000 5,000 4,000
Dividend payout ratio % 99.6% 89.3% 102.1% 91.0% 116.9% 82.6%
Cash and bank deposits/ Total assets 43.3% 55.2% 59.0% 50.8% 58.3% 43.2%
Total debts/ Total assets 3.8% 8.3% 13.9% 10.6% 21.7% 23.2% Source: Company data; BVSC
Shareholder structure and management team
Shareholder structure
As of December 31, 2020, GDT’s largest shareholders include: Ha Thi Hue (25.58%; the former (Mr.
Le Ba)’s wife) and PYN Elite Fund (6.9%). Management and related parties possess around 18.4%.
That said, other shareholders account for the latter 49.12% ownership. Per our estimates, Le family
is occupying the majority of the company’s ownership at over 40%.
Figure 8: GDT’s shareholder structure: A family-controlled business
Source: FiinPro; BVSC estimates
28.7%
18.4%
6.9%
46.0%
0.0% 5.0% 10.0% 15.0% 20.0% 25.0% 30.0% 35.0% 40.0% 45.0% 50.0%
Ha Thi Hue
Management and related parties
PYN Elite Fund (Non-UCITS)
Others
Initiation Report Mar-2021 | GDT
4
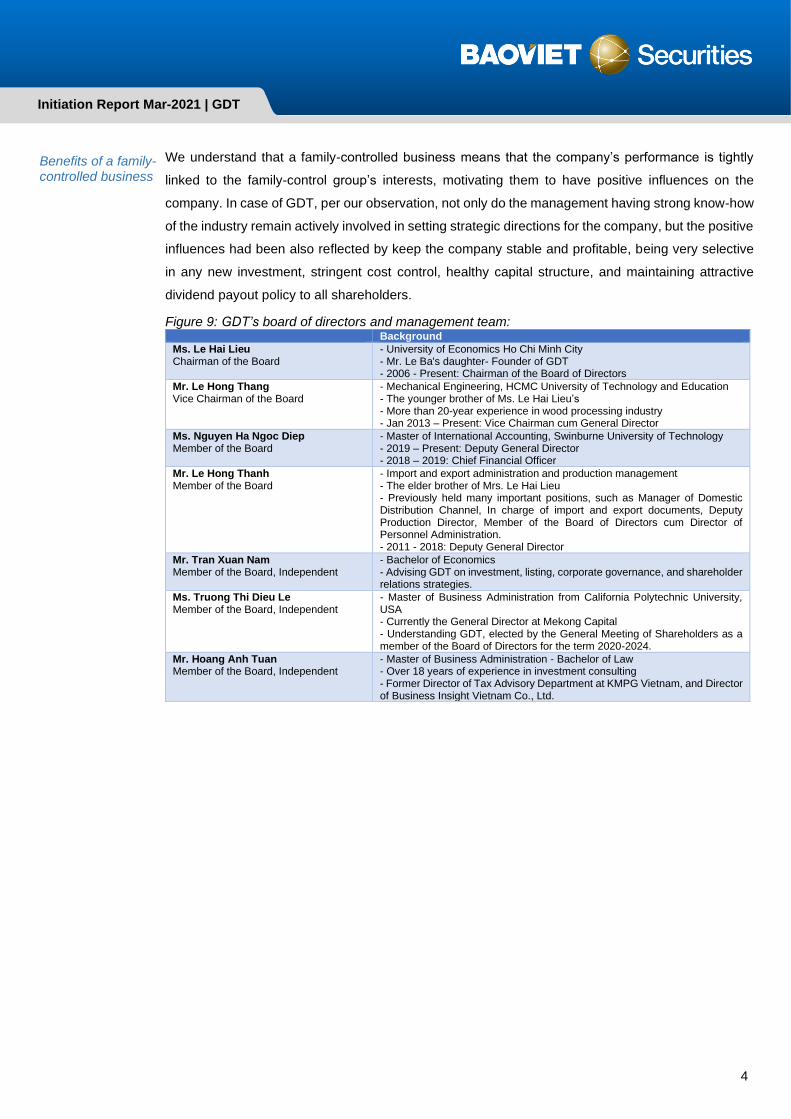
Benefits of a family-controlled business
We understand that a family-controlled business means that the company’s performance is tightly
linked to the family-control group’s interests, motivating them to have positive influences on the
company. In case of GDT, per our observation, not only do the management having strong know-how
of the industry remain actively involved in setting strategic directions for the company, but the positive
influences had been also reflected by keep the company stable and profitable, being very selective
in any new investment, stringent cost control, healthy capital structure, and maintaining attractive
dividend payout policy to all shareholders.
Figure 9: GDT’s board of directors and management team: Background
Ms. Le Hai Lieu Chairman of the Board
- University of Economics Ho Chi Minh City - Mr. Le Ba's daughter- Founder of GDT - 2006 - Present: Chairman of the Board of Directors
Mr. Le Hong Thang Vice Chairman of the Board
- Mechanical Engineering, HCMC University of Technology and Education - The younger brother of Ms. Le Hai Lieu’s - More than 20-year experience in wood processing industry - Jan 2013 – Present: Vice Chairman cum General Director
Ms. Nguyen Ha Ngoc Diep Member of the Board
- Master of International Accounting, Swinburne University of Technology - 2019 – Present: Deputy General Director - 2018 – 2019: Chief Financial Officer
Mr. Le Hong Thanh Member of the Board
- Import and export administration and production management - The elder brother of Mrs. Le Hai Lieu - Previously held many important positions, such as Manager of Domestic Distribution Channel, In charge of import and export documents, Deputy Production Director, Member of the Board of Directors cum Director of Personnel Administration. - 2011 - 2018: Deputy General Director
Mr. Tran Xuan Nam Member of the Board, Independent
- Bachelor of Economics - Advising GDT on investment, listing, corporate governance, and shareholder relations strategies.
Ms. Truong Thi Dieu Le Member of the Board, Independent
- Master of Business Administration from California Polytechnic University, USA - Currently the General Director at Mekong Capital - Understanding GDT, elected by the General Meeting of Shareholders as a member of the Board of Directors for the term 2020-2024.
Mr. Hoang Anh Tuan Member of the Board, Independent
- Master of Business Administration - Bachelor of Law - Over 18 years of experience in investment consulting - Former Director of Tax Advisory Department at KMPG Vietnam, and Director of Business Insight Vietnam Co., Ltd.

Initiation Report Mar-2021 | GDT
5
Comprehensive business model
Factories
Already-built third factory to open a new growth cycle.
Before 3Q20, GDT possessed two factories - One in Binh Duong province, another in HCMC -with
total production capacity of 8,500 m3 per annum. Given GDT’s steady mid-single-digit top-line CAGR
in the past five years, we understand that the utilization of these two factories were strengthening
year by year. We also recall that GDT had been very selective in any investment,
Figure 10: GDT’s production facilities: Snapshot Factories Location Area (m2) Annual production capacity (m3/ year)
Factory #1 and Headquarter HCMC 7,800 2,500
Factory #2 Binh Duong 38,000 6,000
Factory #3 Binh Duong 14,000 N/A Source: Company data; BVSC
Third factory coming online to open a new growth cycle post pandemic
On signs of stronger outlook from export markets, GDT had decidedly purchased a new, already-built
factory (Size: 14,000 m2) in 4Q20, located in Tan Uyen, Binh Duong province. This aims to stock their
key input materials, open new production lines to equip it well with sufficient production capacity to
ride on the upbeat outlook from export orders. Per GDT, the factory is already built and well-organized
by the previous owner, which is certainly beneficial for GDT, as construction process is normally time-
consuming. The management further share that investments in machineries are simple and quick,
while anticipating no difficulty in supply of labor force and key input materials. With the new factory
coming online, the management expect to deliver a 5-year forward CAGR of 15-20% in NPAT.
Depreciation expenses to increase by some VND1.78 bn p.a.
On GDT’s 4Q20 balance sheet, we estimate the cost of the new production facility at VND58.8 bn, of
which buildings and structure are recorded at VND13.3 bn under tangible assets, while the latter
VND45.5 bn is recorded at the land use right. Both are having the remaining useful life of some 33
years, per management, which we estimate its depreciation expenses to arrive at VND1.78 bn p.a.
Capex investments Highly selective in new investments
Figure 11: GDT’s historical and forecast capex investment during FY15-25F: No significant capex in sight after significant capex usage in FY20
Source: Company data; BVSC forecasts
12,050
4,117
(3,575)
1,984 3,357
60,236
5,958 1,658 1,658 1,658 1,658
(10,000)
-
10,000
20,000
30,000
40,000
50,000
60,000
70,000
2015 2016 2017 2018 2019 2020 2021F 2022F 2023F 2024F 2025F
Net tangible capex
Net intangible capex
Total capex, net
Initiation Report Mar-2021 | GDT
6
Per our observation, after the commencement of newly built factory in Tan Uyen, Binh Duong province
in FY15, GDT’s net capex was used for mostly for tangible assets, particularly investments in
machineries, ranging between VND2.0-4.1 bn during FY16-19, or merely 0.3%-1.3% of FY16-19 net
sales, which generally suggests that GDT’s business itself is not a capital-intensive one. It does prove
that GDT’s management had been very selective in any new investment, while managing excellently
between new purchases and disposals of old equipment.
No significant capex in sight in the forecast period
Significant capex usage was used for financing the third factory in Binh Duong province, we expect
FY21 net capex to decline sharply by to VND5.96 bn to mainly finance the company’s purchase of
new machineries. Going forward, we expect GDT to see no significant capex in sight, forecasting
FY22-25 net capex at VND1.66 bn p.a., which should further strengthen the company’s cash flows.
Key material inputs
Negligible import linkage; Significant bargaining power with suppliers of input material
GDT’s key input materials are, of course, rubber woods, which normally account for over 30% of
COGS. Typically, GDT will actively stock 6-month inventory of rubber wood for upcoming production.
Per management, the company’s rubber wood input is sourced domestically from its long-standing
local partners at competitive prices vs the overall market’s; while receiving significant supports during
the difficult time of COVID-19 pandemic, such as: allowing GDT to place only 30% upfront of total
order value, while keeping them at the suppliers’ warehouses. This, in turn, helps GDT actively
accumulate inputs at favorable prices, cut warehouse expenses, while easing GDT’s cashflow. GDT’s
long-standing partner can properly and fully meet GDT's requirements in terms of specifications and
types. Also, the quality control and production policy help the Company reduce wastage and take full
advantage of input materials.
Rubber wood price trend
Per management, current rubber wood prices are levelling off at some VND6.8-7.0 mn/ m3 after
surging in 4Q20, while FY20 price level was down, on average, by 5% YoY. While we believe that the
active accumulation of low-cost inventory should drive the company’s GPM gains favorably in the first
half of FY21, the management affirmed that GDT is eyeing to increase selling prices after 1Q21 in
response to the current rubber wood price hike.
Other materials Other material inputs include screws and other auxiliary materials, which are mostly sourced
domestically, while some are imported, depending upon customer requests. All in, GDT’s key material
inputs are having limited import linkage, lowering risks of input shortage, which might cause
production disruption.
Figure 11: GDT’s cost of goods sold mix in FY15-20:
VND bn 2015 2016 2017 2018 2019 2020
Input material costs 97.1 107.7 123.3 135.7 118.8 132.0
Labor costs 71.0 82.4 100.3 106.5 105.2 131.5
D&A expenses 3.4 3.1 4.0 3.8 4.0 4.0
Outsourcing and other cash expenses 12.14 8.62 8.40 4.24 1.84 7.91
Total COGS 183.6 201.9 236.0 250.1 229.8 275.4 Source: Company data; BVSC estimates

Initiation Report Mar-2021 | GDT
7
Products Working in niche market keeps GDT differentiated.
The company (1) designs and manufactures its own products and (2) serves as an outsourcing unit
for orders from foreign customers. GDT's products are typically sophisticated, high-quality, and tailor-
made for different orders, keeping it differentiated from local manufacturers (which are typically
smaller ones ineligible for stringent requirements from export partners). Having that said, GDT has
been working in a niche market, which in turn not only helps it limit competitive pressure, but also
nurture long-term relationships with its customers.
Figure 12: GDT’s sales trend across product segments during FY15-20: Kitchenware remained the top-tier earnings generators
Source: Company data; BVSC forecasts; Unit: VND mn
In particular, GDT’s four key product segments include: (1) Kitchenware; (2) Housewares; (3) Children
toys; and (4) Children tablets and other products. We note that as the company’s sales are linked directly
to orders from customers, causing share of each product segment to vary over time. However, per our
latest discussion with the management, we learnt that share between product segments remain largely
unchanged in FY20. Per our estimates, contribution from kitchenware remained dominant at 67% in
FY20, followed by housewares (27%), children toys (3%) and others (3%), respectively.
Figure 14: GDT’s key product segments:
Source: Company data; BVSC
-
50,000
100,000
150,000
200,000
250,000
300,000
2015 2016 2017 2018 2019 2020
KitchenwareHomewareChildren toysChildren tables and others
Kitchenware
Houseware
Children products

Initiation Report Mar-2021 | GDT
8
Customer base – Export is the company’s top-tier consumption market
Customer base and distribution network developments
Exports (85.3% of FY20 net sales). Notwithstanding COVID-19 headwinds, GDT’s FY20 export
sales expanded soundly by 22.4% YoY to VND338.7 bn, marking a decent 6.0% FY15-20 CAGR, per
our estimate. Noteworthily, GDT is not dependent on any single large customer, as the company’s 10
largest customers accounted for some 40% of total sales, per management’s sharing.
Figure 15: GDT’s sales split by geography in FY15-20:
2015 2016 2017 2018 2019 2020 FY15-20 CAGR
Net sales 295.8 323.6 362.2 389.8 341.8 400.4 6.2%
Export sales 252.8 273.8 308.9 329.0 276.6 338.7 6.0%
YoY % 21.9% 8.3% 12.8% 6.5% -15.9% 22.4% NM
Export/ Net sales % 85.5% 84.6% 85.3% 84.4% 80.9% 84.6% NM
Asia 201.4 211.6 245.3 266.5 229.1 268.0 5.9%
Europe 42.0 56.9 58.4 49.4 40.7 46.8 2.2%
America 8.1 4.7 5.3 13.2 6.9 23.9 24.2%
Others 1.3 0.5 - - - - NM Source: BVSC estimates
Cemented a long-standing customer base in Asia
▪ Asia remains GDT’s dominant export market, accounting for 78.4% of total FY20 export sales.
GDT’s FY20 exports to Asian countries stepped up respectably by 17.0% YoY to VND268 bn. We
take an important note that within Asian countries, particularly South Korea and Japan, GDT had
cemented a loyal customer base in these countries with most of them being the company’s partners
for over 10 years. For example, Lotte Mart, Nitori, H1 Global, Fair Friend, Dong Yang International.
US is the rising star ▪ US is the rising star with FY20 sales surging by 245.6% YoY to VND23.9 bn off a low FY19
base of VND6.9 bn, per our estimates. As such, GDT did have some partners from a few years
back, the company’s surging orders were on benefitting from US customers’ switching their orders
from China to Vietnam due to US tariff imposition on China-originated wooden products. GDT
had further applied a payment method with US partners (i.e., from immediate payment policy to
a 1-to-2-week payable policy). Per management, the application of the new payment method had
been proven to be progressing well, incurring no overdue receivable or bad debt so far.
EU posted good signs of pick-ups
▪ GDT did see some improvement in exports to EU with FY20 sales rebounding encouragingly
by 15% YoY, per our estimate, to VND46.8 bn, as GDT was fully eligible for BSCI qualification,
which had been partly easing the requirement of FSC certificate from its export partners in EU.
We take an important note that not all customers require FSC or BSCI certificates for their orders.
Figure 16: GDT’s some notable export partners’ profile:
Export partners Key information
Fair Friends Co.Ltd Founded in 2002, Fair Friends Co. Ltd is a home furnishing wholesaler in South Korea
KidKraft Inc a proven leader in the world of wooden toys and furniture, with 40-year experience in US.
MH AND CO., LTD MH & Co. MH & Company manufactures household furniture, office furniture, and housewares.
Nitori Co., Ltd A Japanese furniture and home accessories retail company. It is the largest furniture and home furnishing chain in Japan.
ASUNG CO., LTD Main Activities: Furniture and Home Furnishing Merchant Wholesalers in South Korea
Source: BVSC Research
Domestic sales trend – Pre-COVID-
Domestic sales (13.5% of FY20 net sales): a solid 7.5% FY15-20 CAGR. GDT’s FY20 domestic
sales were hit by COVID-19 pandemic, down slightly by 5.0% YoY to VND52.7 bn, per our estimates.

Initiation Report Mar-2021 | GDT
9
19 domestic sales were very solid.
Aggressive expansion of presence in high-traffic stores
Intensifying online sales presence on changes in consumer behaviors
In which, we believe COVID-19 impacts primarily fall into 2Q20, improving subsequentially in the latter
quarters. Taking a closer look at GDT’s pre-COVID-19 performance (pre-FY20), GDT did consistently
deliver solid domestic sales growth at 10.9% on average, during FY15-19 period. We saw GDT had
put enormous efforts to capture the on-going shift in Vietnamese consumers towards well-branded
and better-quality products as well as the emerging trend of E-Commerce in Vietnam via
strengthening an omni sales channels by notable strategies:
▪ Aggressively strengthening physical store network through tapping into high-traffic BHX and ĐMX
store coverage nationwide, which had been bearing fruits. As of end-FY19, GDT's retail sales
network comprises of 2,247 points of sales, of which stores located inside supermarkets surged
strongly to 1,687 and shopping centers and 1 showroom.
▪ Intensifying online sales presence on numerous well-established e-Commerce platform,
including: Tiki, Shopee, Sendo, and Adayroi, together with building up its own in-house
winwinshop website. Per our latest interview with the management, they shared that their online
sales surged rapidly in FY20, though still accounting for a minor share of total sales. In our view,
the upsurge in online sales was propelled by changes in consumer behaviors tending to shop
online during the pandemic that people are trying to limit face-to-face interaction. Given the on-
going shift in consumer behavior, GDT is strategically further leveraging its online sales channels
by: (1) Offering steeper discounts to both distributors and end-users, and (2) Building customer
loyalty via membership program to accumulate points that can be converted into cash for the next
purchases, while studying customer insight for its in-house R&D processes.
Figure 17: GDT’s domestic sales trend in FY15-20: Solid performance pre-COVID-19 2015 2016 2017 2018 2019 2020
Domestic sales, net (VND bn) 39.87 46.65 50.02 55.10 60.24 57.23
YoY % -29.0% 17.0% 7.2% 10.1% 9.3% -5.0% Source: Company data; BVSC estimates
Figure 18: GDT’s aggressive expansion of distribution network nationwide:
2015 2016 2017 2018 2019
Total physical distribution network (stores) 1,193 962 1,042 1,217 2,247
YoY % -7.9% -19.4% 8.3% 16.8% 84.6%
Located inside supermarkets, shopping malls NA NA 300 302 1,687
YoY % NA NA NA 0.7% 458.6% Source: Company data; BVSC
Initiation Report Mar-2021 | GDT
10
Industry dynamics: Resilience amid COVID-19 woes…
All-time-high export turnover of wood and wooden products
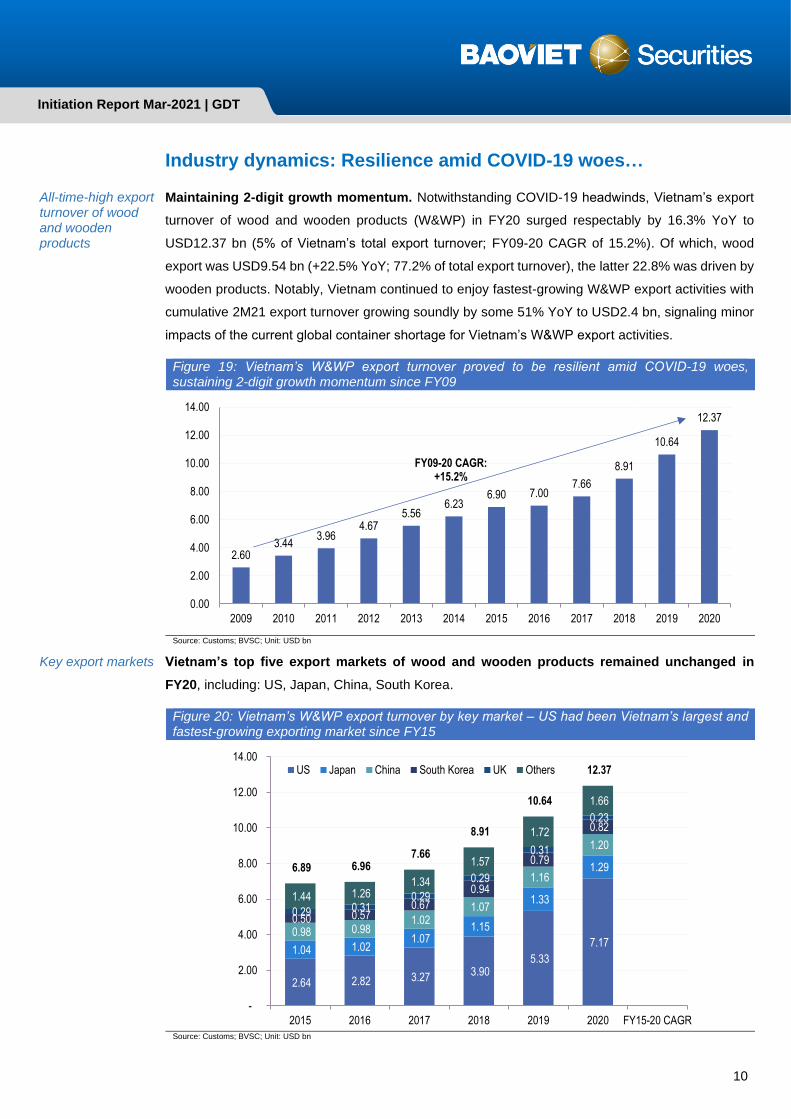
Maintaining 2-digit growth momentum. Notwithstanding COVID-19 headwinds, Vietnam’s export
turnover of wood and wooden products (W&WP) in FY20 surged respectably by 16.3% YoY to
USD12.37 bn (5% of Vietnam’s total export turnover; FY09-20 CAGR of 15.2%). Of which, wood
export was USD9.54 bn (+22.5% YoY; 77.2% of total export turnover), the latter 22.8% was driven by
wooden products. Notably, Vietnam continued to enjoy fastest-growing W&WP export activities with
cumulative 2M21 export turnover growing soundly by some 51% YoY to USD2.4 bn, signaling minor
impacts of the current global container shortage for Vietnam’s W&WP export activities.
Figure 19: Vietnam’s W&WP export turnover proved to be resilient amid COVID-19 woes, sustaining 2-digit growth momentum since FY09
Source: Customs; BVSC; Unit: USD bn
Key export markets
Vietnam’s top five export markets of wood and wooden products remained unchanged in
FY20, including: US, Japan, China, South Korea.
Figure 20: Vietnam’s W&WP export turnover by key market – US had been Vietnam’s largest and fastest-growing exporting market since FY15
Source: Customs; BVSC; Unit: USD bn
2.603.44
3.964.67
5.566.23
6.90 7.007.66
8.91
10.64
12.37
0.00
2.00
4.00
6.00
8.00
10.00
12.00
14.00
2009 2010 2011 2012 2013 2014 2015 2016 2017 2018 2019 2020
FY09-20 CAGR: +15.2%
2.64 2.82 3.27 3.90 5.33
7.17 1.04 1.02
1.07 1.15
1.33
1.29
0.98 0.98 1.02
1.07
1.16
1.20
0.50 0.57 0.67
0.94
0.79
0.82
0.29 0.31 0.29
0.29
0.31
0.23
1.44 1.26 1.34
1.57
1.72
1.66
6.89 6.96 7.66
8.91
10.64
12.37
-
2.00
4.00
6.00
8.00
10.00
12.00
14.00
2015 2016 2017 2018 2019 2020 FY15-20 CAGR
US Japan China South Korea UK Others

Initiation Report Mar-2021 | GDT
11
US remained Vietnam’s largest and fastest growing export market.
Exports to Japan flat
Exports to China and South Korea manageable
▪ Exports to US surged strongly by 34.4% YoY to USD7.17 bn (accounting for 57.9% of total FY20
export turnover) off a high FY19 base of USD5.33 bn (+36.8% YoY). While we understand that
Vietnam had been the beneficiary of the on-going order shift from China to Vietnam even pre-
COVID-19 pandemic on the US-China trade war, causing China’s timber industry to bear anti-
dumping duties and anti-subsidy taxes; Vietnam did enjoy further order shift during the pandemic,
propelled by (1) US imposed some temporary restrictions on trades in response to COVID-19;
and (2) People work from home to avoid the spread of the pandemic, which leads to an increase
in home improvement demand and surging online shopping sales of Vietnam’s export partners,
in-line with our discussion with wood-related companies under our coverage (GDT and PTB).
Noteworthily, fast-growing product segments include kitchen furniture (+134% YoY), other
wooden furniture (+36% YoY) and wooden parts (+43% YoY).
▪ Exports to Japan were muted at USD1.29 bn (-2.5% YoY), constituting 10.5% of FY20 W&WP
export turnover.
▪ Exports to China and South Korea were manageable, up 3.2% YoY and 3.3% YoY to USD1.20
bn and USD0.82 bn, respectively.
The industry is highly fragmented
Per Customs statistics, Vietnam’s W&WP market is currently comprised of over 3,600 producers in
FY20. The industry proved to us highly fragmented, as merely 75 producers have annual export
turnover (AET) above USD30 mn. Specifically, only 3 players have AET above USD200 m; 4 players
own AET between USD100-200 mn; 27 players have AET between USD50-100 mn; and 41 players
possess AET between USD30-50 mn. Given sizable wood export market, we understand that the
majority of the latter 3,525 producers are involving primarily in wood exports, while other mid- to large-
scaled producers in wooden products are furniture-related, in our view. This reaffirms our view that
GDT is working in a niche market, helping it lower competition pressure, nurturing a loyal customer
base while keeping its business highly profitable.
Figure 21: Vietnam’s timber industry is highly fragmented:
AET range >USD200 mn USD100-200 mn USD50-100 mn USD30-50 mn USD30 mn
Number of manufacturers 3 4 27 41 3525
% of total 0.08% 0.11% 0.75% 1.14% 97.92% Source: Customs; BVSC
Going-forward outlook; 2-digit export growth to sustain till FY25
… Post-COVID-19 industry growth outlook very promising
For FY21, Vietnam is targeting to strengthen its W&WP export turnover by 15% YoY to some
USD14.5-15 bn, which is expectedly driven by: (1) Demand recovery on a normalization of global
economy and active COVID-19 vaccine roll-out; and (2) Vietnam’s competitive advantages, including
several wide-ranging FTAs, cheap labor costs, and further order shifts from China to Vietnam put it
well-positioned to drive further market share gains globally. For longer-term, the government had long
set an export turnover of USD25 mn in FY25, which, in turn, suggests that Vietnam’s W&WP export
turnover to sustain 2-digit growth till FY25.

Initiation Report Mar-2021 | GDT
12
Vietnam’s wooden kitchenware driving sound market share gains
Market size
Per latest TradeMap statistics, Vietnam's wooden kitchenware is driving market share gains soundly
in GDT's main export markets, including Korea, Japan and the US, primarily on benefiting from
China’s market share losses.
Figure 22: Wooden kitchenware’s market size of South Korea, Japan and US:
Unit: USD thousand 2016 2017 2018 2019 2020
South Korea 54,727 63,421 67,826 62,604 71,664
Japan 262,422 262,388 264,967 262,719 234,588
The US 246,442 267,968 298,730 322,378 360,178 Source: TradeMap; BVSC; Market size is calculated as total import turnover of wooden kitchenware MH4419
▪ South Korea’s wooden kitchenware sales were robust in FY20 at USD71.7 mn (+14.5% YoY).
Vietnam continuously expanded its market share from 16.4% in 2018 to 20.0% in 2020.
▪ Japan's market size for wooden kitchenware is much larger than that of South Korea, settling
at USD 234.6 million (-10.7% YoY) in 2020. Vietnam’s exports outperformed the overall market,
hitting USD26.7 mn (-3.1% YoY) and thus, driving further market share gains to its highest ever
level at 11.4% in 2020.
▪ The US’s wooden kitchenware sales grew solidly by 11.7% YoY to USD360.2 mn in FY20.
Vietnam’s market share inched up to 3.4% in FY20 from 3.3% in FY19. We note that Vietnam's
exports of wooden kitchenware to the US are only USD12.3 mn, far smaller than exports to Japan,
suggesting a strong headroom for outsized growth potential.
Figure 23: The trend of Vietnam’s market share in key export markets South Korea, Japan and the US:
Source: TradeMap; BVSC estimates
Optimistic outlook for wooden kitchenware export
Besides the positive outlook of global recovery thanks to “Vaccine passport”, we expect the on-going
upside trend of the market to support the prospect of Vietnam wooden kitchenware export in the near
future.
68.2% 64.1% 65.3% 66.0% 62.9%
16.9%17.8% 16.4% 18.0% 20.0%
14.9% 18.1% 18.3% 16.0% 17.1%
0.0%
10.0%
20.0%
30.0%
40.0%
50.0%
60.0%
70.0%
80.0%
90.0%
100.0%
2016 2017 2018 2019 2020
Hàn Quốc
Others Vietnam China
83.3% 83.6% 84.3% 84.1% 82.5%
9.6% 9.4% 9.9% 10.5% 11.4%
7.1% 7.0% 5.7% 5.4% 6.1%
0.0%
10.0%
20.0%
30.0%
40.0%
50.0%
60.0%
70.0%
80.0%
90.0%
100.0%
2016 2017 2018 2019 2020
Nhật Bản
Others Vietnam China
65.5% 66.9% 65.2% 64.4% 65.0%
3.9% 3.8% 4.2% 3.3% 3.4%
30.6% 29.3% 30.5% 32.3% 31.5%
0.0%
10.0%
20.0%
30.0%
40.0%
50.0%
60.0%
70.0%
80.0%
90.0%
100.0%
2016 2017 2018 2019 2020
Mỹ
Others Vietnam China
Initiation Report Mar-2021 | GDT
13
Financial analysis: ROEs were remarkably high at c.30%
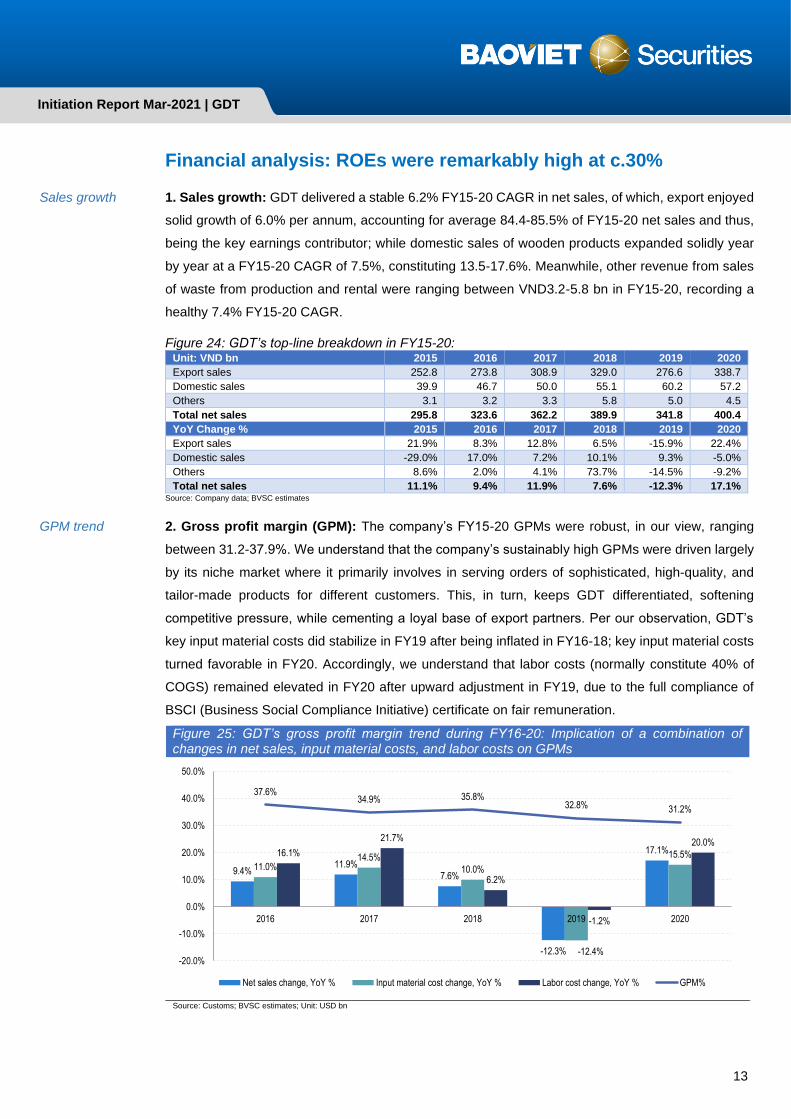
Sales growth 1. Sales growth: GDT delivered a stable 6.2% FY15-20 CAGR in net sales, of which, export enjoyed
solid growth of 6.0% per annum, accounting for average 84.4-85.5% of FY15-20 net sales and thus,
being the key earnings contributor; while domestic sales of wooden products expanded solidly year
by year at a FY15-20 CAGR of 7.5%, constituting 13.5-17.6%. Meanwhile, other revenue from sales
of waste from production and rental were ranging between VND3.2-5.8 bn in FY15-20, recording a
healthy 7.4% FY15-20 CAGR.
Figure 24: GDT’s top-line breakdown in FY15-20: Unit: VND bn 2015 2016 2017 2018 2019 2020
Export sales 252.8 273.8 308.9 329.0 276.6 338.7
Domestic sales 39.9 46.7 50.0 55.1 60.2 57.2
Others 3.1 3.2 3.3 5.8 5.0 4.5
Total net sales 295.8 323.6 362.2 389.9 341.8 400.4
YoY Change % 2015 2016 2017 2018 2019 2020
Export sales 21.9% 8.3% 12.8% 6.5% -15.9% 22.4%
Domestic sales -29.0% 17.0% 7.2% 10.1% 9.3% -5.0%
Others 8.6% 2.0% 4.1% 73.7% -14.5% -9.2%
Total net sales 11.1% 9.4% 11.9% 7.6% -12.3% 17.1% Source: Company data; BVSC estimates
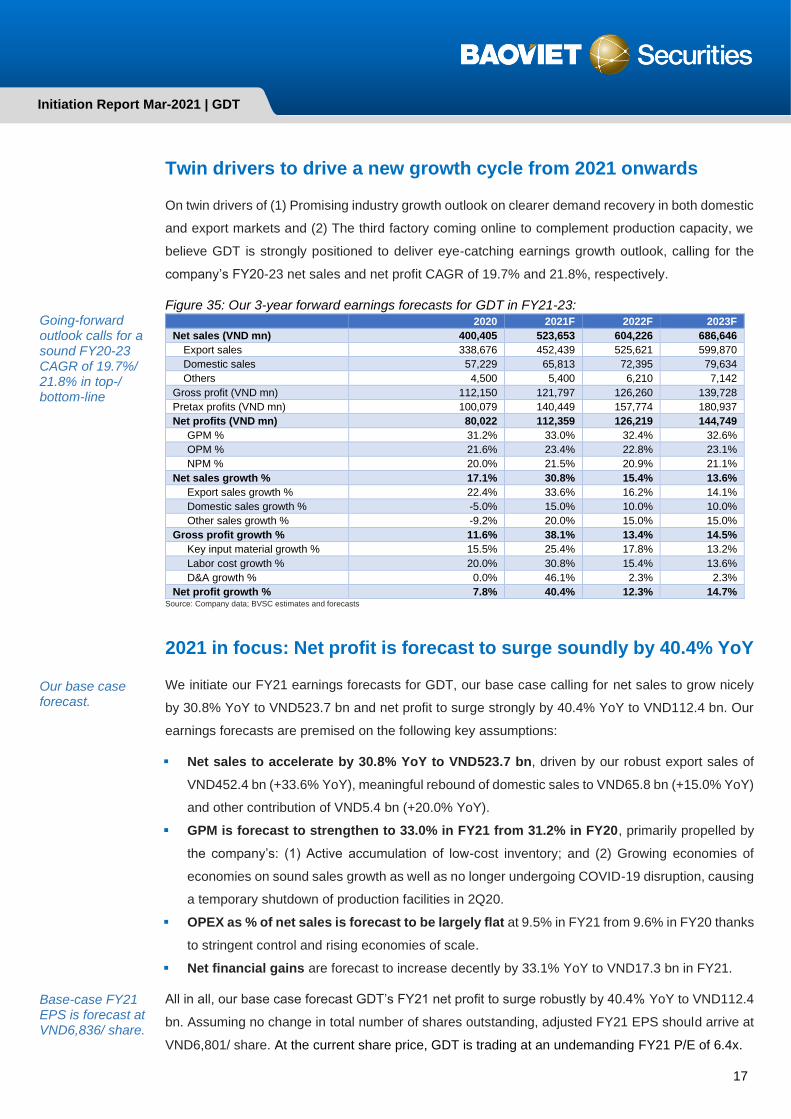
GPM trend 2. Gross profit margin (GPM): The company’s FY15-20 GPMs were robust, in our view, ranging
between 31.2-37.9%. We understand that the company’s sustainably high GPMs were driven largely
by its niche market where it primarily involves in serving orders of sophisticated, high-quality, and
tailor-made products for different customers. This, in turn, keeps GDT differentiated, softening
competitive pressure, while cementing a loyal base of export partners. Per our observation, GDT’s
key input material costs did stabilize in FY19 after being inflated in FY16-18; key input material costs
turned favorable in FY20. Accordingly, we understand that labor costs (normally constitute 40% of
COGS) remained elevated in FY20 after upward adjustment in FY19, due to the full compliance of
BSCI (Business Social Compliance Initiative) certificate on fair remuneration.
Figure 25: GDT’s gross profit margin trend during FY16-20: Implication of a combination of changes in net sales, input material costs, and labor costs on GPMs
Source: Customs; BVSC estimates; Unit: USD bn
9.4%11.9%
7.6%
-12.3%
17.1%
11.0%14.5%
10.0%
-12.4%
15.5%16.1%
21.7%
6.2%
-1.2%
20.0%
37.6%34.9% 35.8%
32.8% 31.2%
-20.0%
-10.0%
0.0%
10.0%
20.0%
30.0%
40.0%
50.0%
2016 2017 2018 2019 2020
Net sales change, YoY % Input material cost change, YoY % Labor cost change, YoY % GPM%

Initiation Report Mar-2021 | GDT
14
Opex management 3. Operating expenses (OPEX): GDT’s FY15-20 OPEX as percentage of net sales were well-
controlled, trending down from 12.4% in FY15 to ranging around 9.5-9.7% in the last three years. It
appears to us that GDT had strong bargaining power over its partners and distribution network,
evidenced by managing OPEX excellently in response to changes in GPMs. Correspondingly, FY15-
20 operating profit margins (OPMs) stayed largely robust at 21.6-26.2%.
Figure 26: Stringent OPEX management save operating profit margin.
2015 2016 2017 2018 2019 2020
GPM % 37.9% 37.6% 34.9% 35.8% 32.8% 31.2%
OPEX as % of Net sales 12.4% 11.5% 9.9% 9.7% 9.5% 9.6%
OPM % 25.5% 26.1% 25.0% 26.2% 23.3% 21.6% Source: Company data; BVSC
Consistent net financial gains
4. Consistent net financial gains: During FY15-20, GDT recorded decent financial income at
VND7.9-17.3 bn (3.2-4.3% of FY15-20 net sales), with interest income being the key contributor,
which is driven by the company’s cash-rich position under excellent management. FY15-20 financial
expenses were insignificant, accounting for only 0.3-1.1% of net sales; of which, interest expenses
were negligible at 0.05-0.19% of net sales, given the company’s very low leverage usage. Net net,
GDT consistently recorded FY15-20 decent net financial gains at 2.4-3.8% of net sales.
Figure 27: GDT delivered consistent net financial gains in FY15-20:
VND bn 2015 2016 2017 2018 2019 2020
Financial income 7.9 11.8 14.2 12.5 14.3 17.3
Financial expenses (2.4) (1.7) (1.1) (3.2) (1.4) (4.4)
Net financial gains/ (losses) 5.5 10.2 13.2 9.3 12.8 13.0
% of net sales 1.9% 3.1% 3.6% 2.4% 3.8% 3.2% Source: Company data; BVSC
Net other gains/ losses
5. Net other gains/ losses: GDT’s net other gains/ losses were generally insignificant in the last
three years, mostly from disposals of old fixed assets (i.e., machineries and transportation mean).
Meanwhile, one-off gains in FY16-17 were marked at VND20.2 bn in FY16 and VND21.6 bn in FY17,
coming from the company’s sell-out of its land use right at My Phuoc 2 industrial park (IP), totaling
size of 100,000 m2.
What’s more, GDT still had another 4,877 m2 landlord at My Phuoc 3 IP, which the management had
long planned for building a dormitory for their employees. However, for some subjective reasons, the
project was pending and unlikely came into fruition. Understanding there is demand for such land,
GDT’s management did propose to sell such landlord in FY20 and get shareholder approval. Per our
discussion with the management, we learnt that there are potential buyers, however, the process is
temporarily slow-moving due to COVID-19 woes. Upon completion, GDT estimates one-off gains
would come at VND4.5-6.0 bn, which should further power GDT’s high cash dividend pay-out policy.
NPM trend
6. Net profit margin (NPM) – GDT’s FY15-20 NPMs were high at 20.0-29.6%. As such, should we
exclude one-off gains from sales of 100,000 m2 land use right at My Phuoc 2 IP in FY16-17, NPMs
would have come at 23.6% in FY16 and 22.9% in FY17. GDT’s robust NPMs further prove itself a
highly lucrative company.

Initiation Report Mar-2021 | GDT
15
ROE in good shape on better asset turnover and active usage of leverage
Figure 28: GDT’s reported/ core net profits and NPMs in FY15-20:
2015 2016 2017 2018 2019 2020
Net profits, reported (VND bn) 61.6 95.9 101.3 89.7 74.2 80.0
YoY % 19.2% 55.8% 5.6% -11.4% -17.3% 7.8%
Net profits, core (VND bn) 61.6 76.5 83.1 89.7 74.2 80.0
YoY % 19.2% 24.2% 8.6% 8.0% -17.3% 7.8%
Net profit margin, reported % 20.8% 29.6% 28.0% 23.0% 21.7% 20.0%
Net profit margin, core % 20.8% 23.6% 22.9% 23.0% 21.7% 20.0% Source: Company data; BVSC
Our employment of 5-step DuPont analysis highlights that GDT’s return on equity did improve
encouragingly to 29.6% by end-FY20 from 26.7% in FY19. The key drivers include: (1) Better asset
turnover (to 1.00x in FY20 from 0.88x in FY19), and (2) Increasingly active usage of financial leverage,
which we still consider very minimal (to be discussed in the balance sheet session).
Figure 29: Five-step DuPont analysis on GDT’s return to shareholder equity (ROE) trend:
Five-step DuPont Analysis 2016 2017 2018 2019 2020
1. Tax burden = Net Income/ Pretax profit 2015 0.80 0.80 0.80 0.80 0.80
2. Interest burden = Pretax profit/ Operating income 1.06 1.13 1.15 1.10 1.17 1.16
3. Operating margin = Operating income/ Net sales 25.5% 26.1% 25.0% 26.2% 23.3% 21.6%
4. Asset turnover = Net sales/ Total assets 1.03 0.89 1.03 1.13 0.88 1.00
5. Financial leverage = Total assets/ Total equity 1.34 1.42 1.37 1.33 1.39 1.47
Product of (1,2,3,4,5) = *Core ROE % 28.5% 29.7% 32.4% 34.7% 26.7% 29.6% Source: Company data; BVSC; *We use core pretax profits and core after-tax profits in FY16, FY17.
Fortress balance sheet
Cash-rich position
7. Fortress balance sheet – GDT’s financial position had been fundamentally sound, evidenced by
expansive balance sheet on a combination of its cash-rich position, coupled with negligible leverage.
Figure 30: GDT’s cash and bank deposit balance trend in FY15-20: 2015 2016 2017 2018 2019 2020
Cash (VND mn) 4,247 3,983 743 16,949 8,686 897
Bank deposits (VND mn) 120,500 197,100 206,100 157,700 217,064 171,500
% Total assets 43.3% 55.2% 59.0% 50.8% 58.3% 43.2%
Year-end cash per share (VND/ share) 9,041 14,086 12,634 10,693 13,270 10,758 Source: Company data; BVSC
Leverage remains soft, despite more active usage
▪ GDT’s total assets grew solidly at a 6.7% FY15-20 CAGR to VND398.9 bn by end-FY20.
▪ GDT’s cash and bank deposit position rose decently at a 6.7% FY15-20 CAGR. Cash and bank
deposits occupy a significant amount of total assets, ranging between 43.2-59.0% in FY15-20. Of
which, cash and bank deposits were consistently under excellent management. Normally, cash
position only made up 0.2-4.9% of total assets, while term deposits at banks accounted for larger
share of 41.8-58.8% of total assets during FY15-20.
Figure 31: GDT’s long- and short-term debt balance and leverage trend in FY15-20: 2015 2016 2017 2018 2019 2020
Long-term debts (VND mn) - - - - - -
Short-term debts (VND mn) 8,099 21,445 35,618 27,542 60,365 62,785
Total debts (VND mn) 8,099 21,445 35,618 27,542 60,365 62,785
Total debts/ Total equity (D/E) 0.04x 0.08x 0.14x 0.11x 0.22x 0.23x
Net debts (VND mn) (116,648) (179,638) (171,225) (147,107) (165,385) (109,612) Source: Company data; BVSC
▪ GDT remains long-term debt free, while having a little short-term debt. Despite demonstrating
some active usage of short-term debts in the past two years, GDT’s end-FY20 short-term debts
rose slightly to VND62.8 bn (+4.0% YoY), which we firmly believe to be beneficial for GDT amid
the current low interest rate environment. All in, GDT’s end-FY20 leverage stayed broadly low at
a negligible D/E of 0.23x and a D/A of 0.16x, respectively. GDT’s liquidity and solvency ratios are
notably outstanding.

Initiation Report Mar-2021 | GDT
16
High earnings quality
8. Superior cash flow profile – GDT had consistently generated sound operating cashflow in FY15-
20, indicating the company’s high earnings quality. As such, GDT’s cash conversion cycle (CCC) had
been trending down from 143 days in FY19 to 108 days by end-FY20, which is the lowest level in our
study period (vs 112-123 days in FY16-18).
Figure 32: GDT’s superior cashflow profile during FY16-20: Strong operating cashflow
Figure 33: Strong operating cashflow management, evidenced by all-time-low CCC by end-FY20
Source: Company data; BVSC; Unit: VND bn Source: Company data; BVSC
▪ Days inventory outstanding (DIO) dropped to 104 days in FY20 from 129 days in FY19 and
106 days of FY15-19 average level. We recall that GDT had actively accumulated sizable input
materials with huge support from its multi-year suppliers, such as: paying only 30% upfront for
the purchase and allowing GDT to keep the purchase at suppliers’ warehouse. Not only did it
enable GDT to proactively stock up inventory at competitive prices, but it also does: (1) Pose no
pressure on the company’s cash position and (2) Lower warehouse costs.
▪ Days payable outstanding surged to highest ever level at 27 days in FY20, sustaining pick-up
momentum from FY17 at only 13 days, which we consider GDT to have high and growing
bargaining power over its suppliers.
▪ Days sales outstanding (DSO) fell to 31 days in FY20 from 36 days in FY19 and 35 days of
FY15-19 average level, on the back of the company’s fast-moving sales environment.
A good record track of paying out high cash dividend
Figure 34: GDT had proven to be a dividend play, maintaining high payout ratio:
2015 2016 2017 2018 2019 2020
EPS (VND/ share) 4,016 6,720 5,878 5,492 4,276 4,840
Cash DPS (VND/ share) 4,000 6,000 6,000 5,000 5,000 4,000
Payout ratio % 99.6% 89.3% 102.1% 91.0% 116.9% 82.6%
GDT had consistently maintained attractive cash dividend policy of between VND4,000-6,000/ share,
translating to FY15-20 high dividend payout ratio range of 82.6-116.9%, explaining GDT’s persistent
negative financing cashflows. We understand that the paying out of high cash dividend payment was
thanks primarily to: (1) The company’s negligible capex investments and (2) Strong financial muscle.
76.2
46.9 46.6 69.1 74.8
(36.6)
32.1 56.5
(50.2)
0.2
(39.9)
(82.3) (86.9)
(27.2)
(82.9)
2016 2017 2018 2019 2020
Operating cashflow Investing cashflow Financing cashflow
105
89
100
129
104
35 36 34 36 31
17 13 11
22 27
122
112
123
143
108
-
20
40
60
80
100
120
140
160
2016 2017 2018 2019 2020
Days Inventory Outstanding (DIO)Days Sales Outstanding (DSO)Days Payable Outstanding (DPO)Cash Conversion Cycle (CCC)
Initiation Report Mar-2021 | GDT
17
Twin drivers to drive a new growth cycle from 2021 onwards
On twin drivers of (1) Promising industry growth outlook on clearer demand recovery in both domestic
and export markets and (2) The third factory coming online to complement production capacity, we
believe GDT is strongly positioned to deliver eye-catching earnings growth outlook, calling for the
company’s FY20-23 net sales and net profit CAGR of 19.7% and 21.8%, respectively.
Going-forward outlook calls for a sound FY20-23 CAGR of 19.7%/ 21.8% in top-/ bottom-line
Figure 35: Our 3-year forward earnings forecasts for GDT in FY21-23: 2020 2021F 2022F 2023F
Net sales (VND mn) 400,405 523,653 604,226 686,646
Export sales 338,676 452,439 525,621 599,870
Domestic sales 57,229 65,813 72,395 79,634
Others 4,500 5,400 6,210 7,142
Gross profit (VND mn) 112,150 121,797 126,260 139,728
Pretax profits (VND mn) 100,079 140,449 157,774 180,937
Net profits (VND mn) 80,022 112,359 126,219 144,749
GPM % 31.2% 33.0% 32.4% 32.6%
OPM % 21.6% 23.4% 22.8% 23.1%
NPM % 20.0% 21.5% 20.9% 21.1%
Net sales growth % 17.1% 30.8% 15.4% 13.6%
Export sales growth % 22.4% 33.6% 16.2% 14.1%
Domestic sales growth % -5.0% 15.0% 10.0% 10.0%
Other sales growth % -9.2% 20.0% 15.0% 15.0%
Gross profit growth % 11.6% 38.1% 13.4% 14.5%
Key input material growth % 15.5% 25.4% 17.8% 13.2%
Labor cost growth % 20.0% 30.8% 15.4% 13.6%
D&A growth % 0.0% 46.1% 2.3% 2.3%
Net profit growth % 7.8% 40.4% 12.3% 14.7% Source: Company data; BVSC estimates and forecasts
2021 in focus: Net profit is forecast to surge soundly by 40.4% YoY
Our base case forecast.
Base-case FY21 EPS is forecast at VND6,836/ share.
We initiate our FY21 earnings forecasts for GDT, our base case calling for net sales to grow nicely
by 30.8% YoY to VND523.7 bn and net profit to surge strongly by 40.4% YoY to VND112.4 bn. Our
earnings forecasts are premised on the following key assumptions:
▪ Net sales to accelerate by 30.8% YoY to VND523.7 bn, driven by our robust export sales of
VND452.4 bn (+33.6% YoY), meaningful rebound of domestic sales to VND65.8 bn (+15.0% YoY)
and other contribution of VND5.4 bn (+20.0% YoY).
▪ GPM is forecast to strengthen to 33.0% in FY21 from 31.2% in FY20, primarily propelled by
the company’s: (1) Active accumulation of low-cost inventory; and (2) Growing economies of
economies on sound sales growth as well as no longer undergoing COVID-19 disruption, causing
a temporary shutdown of production facilities in 2Q20.
▪ OPEX as % of net sales is forecast to be largely flat at 9.5% in FY21 from 9.6% in FY20 thanks
to stringent control and rising economies of scale.
▪ Net financial gains are forecast to increase decently by 33.1% YoY to VND17.3 bn in FY21.
All in all, our base case forecast GDT’s FY21 net profit to surge robustly by 40.4% YoY to VND112.4
bn. Assuming no change in total number of shares outstanding, adjusted FY21 EPS should arrive at
VND6,801/ share. At the current share price, GDT is trading at an undemanding FY21 P/E of 6.4x.

Initiation Report Mar-2021 | GDT
18
Our best-case forecast – Factoring in of one-time gains from selling-out of landlord in My Phuoc 3 IP
Our best case incorporates the company’s fruitful selling-out of its 4,877 m2 landlord at My Phuoc 3
IP in FY21 to get a one-off gain of VND6.0 bn (equivalent to 7.5% of FY20 net profit). Fatter net profit
should further power GDT’s higher cash dividend payment policy. GDT’s best-case net profit should
have surged stronger by 47.8% YoY to VND118.4 bn and thus, strengthening adjusted FY21 EPS to
VND7,164.2. At the current share price, GDT is trading at a very attractive FY21 P/E of 6.1x.
Figure 36: Our FY21 earnings forecasts for GDT, by scenario:
2020 Actual
2021F Base case
YoY % 2021F
Best Case YoY %
Net sales (VND mn) 400.4 522.5 30.5% 522.5 30.5%
Pretax profit (VND mn) 100.1 140.4 40.4% 147.2 47.0%
Net profits (VND mn) 80.1 112.4 40.4% 118.4 47.8%
EPS (VND/ share) 4,996.0 7,011.4 40.3% 7,385.8 47.8%
Adjusted EPS (VND/ share) 4,840.4 6,801.0 40.5% 7,164.2 47.8% Source: Company data; BVSC forecasts
Cash dividends are forecast to up strongly to VND6,000-8,000/share
A dividend play
Mid-term cash dividends are forecast to up strongly to VND6,000-8,000/share.
Historically, GDT had delivered attractive cash dividend payments, ranging between VND4,000-6,000
per share, translating to a very high payout range of between 89.3% to 116.9% during FY15-19. FY20
cash dividend was set at VND4,000/ share, got shareholder approval at the company’s FY20 AGM;
of which, the first interim tranche of VND2,000/ share was executed in Nov FY20. We expect the
second tranche to be paid shortly after FY21 AGM, tentatively taking place on April 17, 2021. Should
there be no change in FY20 cash dividend at VND4,000/ share, FY20 payout ratio appears at 82.6%,
relatively low vs FY15-19 range. We do see upside potential risks to the second tranche of FY20 cash
dividend, which will be certain after FY21 AGM.
Going forward, we believe GDT is able to deliver or even strengthen its sustainable cash dividend
policy, on the back of its cash-rich position, minimal leverage, and robust earnings outlook (FY10-23
CAGR of 21.8% in the bottom-line). We forecast FY21-23 cash dividend of VND6,000-8,000/ share,
(equivalent to a payout range of 88.2%-91.6%), translating to very attractive dividend yields of 13.6-
18.2% vs the current share price.
Figure 37: GDT’s historical and forecast cash dividend payments in FY15-23F:
2015 2016 2017 2018 2019 2020 2021F 2022F 2023F
Adjusted EPS (VND/ share) 4,016 6,720 5,878 5,492 4,276 4,840 6,801 7,640 8,762
DPS (VND/ share) 4,000 6,000 6,000 5,000 5,000 4,000* 6,000 7,000 8,000
Payout ratio % 99.6% 89.3% 102.1% 91.0% 117% 82.6% 88.2% 91.6% 91.3% Source: Company data; BVSC forecasts; 2020 cash dividend was set at VND4,000/ share at last year AGM

Initiation Report Mar-2021 | GDT
19
GDT’s latest developments on new orders and Jan results
New orders are surging strongly
Per our latest discussion with the management, we learnt that as of end-Feb FY21, GDT’s new orders
from its export partners grew strongly by some 120% YoY to over USD8 mn, driven by both its long-
standing export partners in South Korea and Japan as well as tighter relationships with US partners.
Per our estimates, GDT’s new orders had started to surge impressively since Dec FY20 to remain
very robust at, on average, above USD2.0 mn per month till Feb FY21. We understand that time to
finish orders are normally varying around 3-9 months. While this is implying strong earnings potential
at least for the first half of the year FY21, our view on GDT’s 1H21 strong earnings growth potential
is further supported by a low base in 2Q20 when GDT did undergo COVID-19 hit, causing it to
temporarily shut down its production facility during the period.
Jan FY21 earnings results
Container shortage no longer an issue from Feb
While we firmly believe Jan sales to be robust on increasingly evident consumption recovery; per our
discussion with the management, we learnt that GDT’s profit margins were strong thanks to the
company’s active stocking-up of low-cost inventories, which should have positive effects on GDT’s
GPMs in the up-and-coming months. Rapid order growth post COVID-19 coupled with sizable low-
cost inventory further solidifies our optimistic view on GDT’s strong FY21 earnings growth potential.
We did also question the company on the global container shortage issue. After discussion with the
management, we understand that GDT had experienced negligible impacts of the container shortage
issue in Jan, while seeing normalization of its export activities from Feb.
Figure 38: GDT’s quarterly earnings results trend in FY20:
Quarterly earnings trend 1Q20 2Q20 3Q20 4Q20
Net sales (VND bn) 81.9 88.2 106.2 124.1
YoY % 28.4% 1.5% 20.1% 20.8%
Net profits (VND bn) 14.5 15.6 21.8 28.1
YoY % 19.4% -25.3% 15.7% 26.3%
GPM % 29.2% 30.7% 32.4% 32.0%
OPM % 18.2% 18.0% 22.3% 25.9%
NPM % 17.7% 17.7% 20.5% 22.7% Source: BVSC estimates

Initiation Report Mar-2021 | GDT
20
We value GDT at VND74,951/ share (74.9% upside)
Valuation approach: an equally weighted combination of DCF and DDM
We adopt an equally weighted combination of two valuation methodologies to derive our target price
(TP) for GDT, including: (1) Discounted Cash Flow (DCF, 50% weight), and (2) Dividend Discount
Model (DDM, 50% weight). In our valuation model, we apply a 25% valuation discount on the stock’s
relatively low liquidity. Our 1-year target price (TP) for GDT arrived at VND74,951/ share, offering
sizable upside potential of 74.9%.
▪ Our DCF adoption is to better capture the company’s stronger earnings growth potential on
promising demand growth post COVID-19 and the third factory coming into operation from FY21.
▪ We utilize DDM model, given the company’s strong track record of paying out stable cash
dividends at high payout ratio. Furthermore, GDT’s business is not a capital-intensive one – capex
investments look insignificant in the forecast period, even considering the commencement of the
third factory; while the company’s strong financial muscle with little debts should further power
the company’s attractive cash dividend payments to shareholders.
Figure 39: Valuation Summary: Our 1-year TP for GDT arrived at VND74,951/ share (Upside: 74.9%)
Methodology Weightage Fair Value Results
Discounted Cash Flow (DCF) 50% 112,439 56,220
Dividend Discounted Model (DDM) 50% 87,429 43,714
Implied equity value per share (VND/ share) 99,934
Valuation discount % 25.0%
1Y TP (VND/ share) 74,951
Dividend yield % (calculated on 4.5%
Total shareholder's return % 74.9%
Implied FY21F P/E at our TP 11.0x
FY21 P/E at current price 6.5x Source: BVSC Research
Figure 40: Our DCF valuation model: Snapshot
FCFF Calculation FY2021 FY2022 FY2023 FY2024 FY2025
EBIT 122,669 137,939 158,464 177,953 197,697
EBIT(1-t) 98,135 110,351 126,771 142,363 158,158
Plus: D&A 6,470 6,619 6,767 6,916 7,065
Minus: Capex 5,958 1,658 1,658 1,658 1,658
Minus: Change in WC (19,093) (12,424) (12,759) (13,112) (12,985)
Free Cash Flow to Firm (FCFF) 117,740 127,736 144,640 160,733 176,550
WACC Calculation
DCF Valuation Summary VND mn
Beta 1.0
PV FY21-25 520,812
Risk free rate 4.0%
Terminal growth (%) 3.0%
Market risk premium 8.5%
Terminal value FY25-after 1,266,183
Cost of equity 12.5%
Fair value of Core business (EV) 1,786,996
Cost of debt, calculation
Add: Cash 897
After-tax cost of debt 4.8%
Add: Short-term Investments 171,500
Capital structure
Total EV 1,959,393
Debt/ Total capital 15.0%
Less: Debt 62,785
Equity/ Total capital 85.0%
Less: Minority Interest -
Implied Equity Value 1,896,608
Number of Shares Outstanding 16,867,808
WACC 11.4%
DCF-derive fair value per share (VND/ share) 112,439 Source: BVSC Research
Initiation Report Mar-2021 | GDT
21
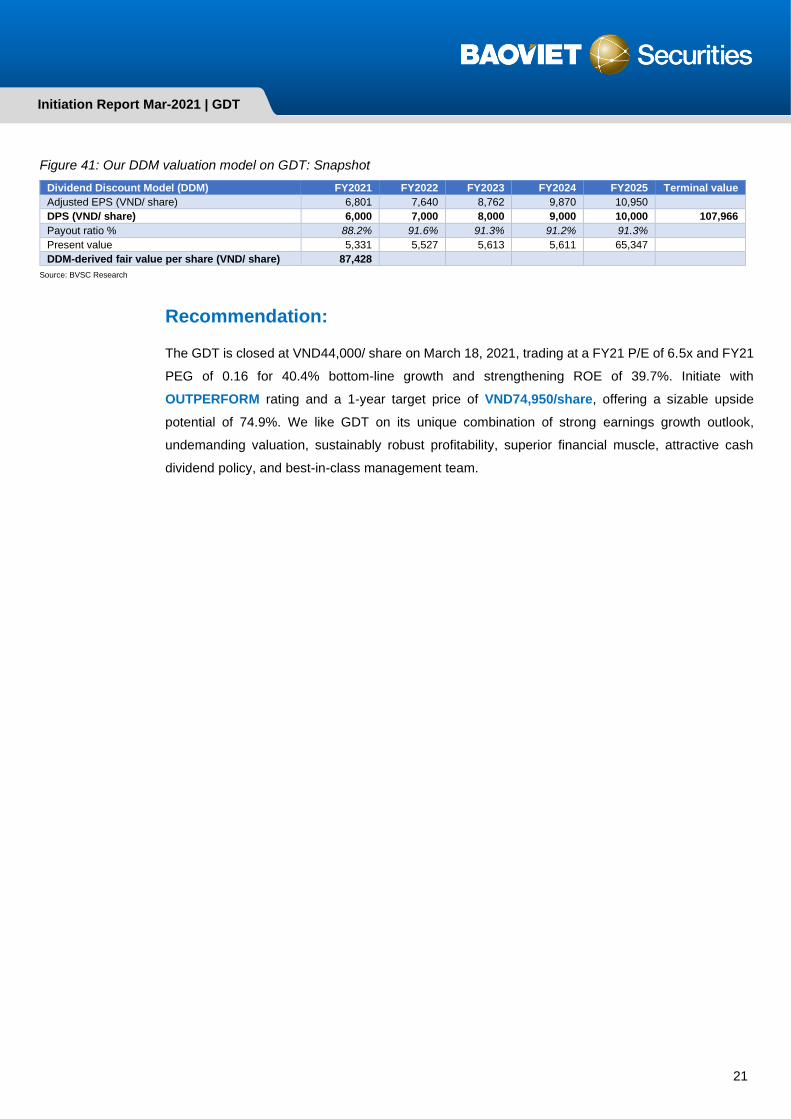
Figure 41: Our DDM valuation model on GDT: Snapshot
Dividend Discount Model (DDM) FY2021 FY2022 FY2023 FY2024 FY2025 Terminal value
Adjusted EPS (VND/ share) 6,801 7,640 8,762 9,870 10,950
DPS (VND/ share) 6,000 7,000 8,000 9,000 10,000 107,966
Payout ratio % 88.2% 91.6% 91.3% 91.2% 91.3%
Present value 5,331 5,527 5,613 5,611 65,347
DDM-derived fair value per share (VND/ share) 87,428
Source: BVSC Research
Recommendation:
The GDT is closed at VND44,000/ share on March 18, 2021, trading at a FY21 P/E of 6.5x and FY21
PEG of 0.16 for 40.4% bottom-line growth and strengthening ROE of 39.7%. Initiate with
OUTPERFORM rating and a 1-year target price of VND74,950/share, offering a sizable upside
potential of 74.9%. We like GDT on its unique combination of strong earnings growth outlook,
undemanding valuation, sustainably robust profitability, superior financial muscle, attractive cash
dividend policy, and best-in-class management team.

Initiation Report Mar-2021 | GDT
22
FINANCIAL RATIOS
Income Statement
Unit: VND bn 2018 2019 2020 2021F 2022F
Net sales 389.8 341.8 400.4 523.7 604.2
COGS (250.1) (229.8) (275.4) (351.0) (408.5)
Gross profit 139.7 112.0 125.0 172.7 195.8
EBIT 102.0 79.5 86.6 122.7 137.9
EBT 112.4 92.7 100.1 140.4 157.8
NPAT-MI 89.7 74.2 80.0 112.4 126.2
BALANCE SHEET
Unit: VND bn 2018 2019 2020 2021F 2022F
Cash and cash equivalents 16.9 8.7 0.9 1.4 7.7
Short-term investments 157.7 217.1 171.5 171.5 171.5
Account receivables 41.0 27.3 41.5 46.3 55.1
Inventories 77.6 85.0 71.3 101.2 117.8
Fixed assets 32.2 31.3 41.9 42.6 39.1
Total assets 343.9 387.4 398.9 433.6 460.2
Short-term liabilities 81.6 105.5 123.9 145.8 162.2
Long-term liabilities 3.6 3.5 4.4 4.4 4.4
Shareholers’ equity 258.7 278.3 270.5 283.4 293.6
Total liabilities and equity 343.9 387.4 398.9 433.6 460.2
FINANCIAL RATIOS
Chỉ tiêu 2018 2019 2020 2021F 2022F
Growth 7.6% -12.3% 17.1% 30.8% 15.4%
Net sales (%) -11.4% -17.3% 7.8% 40.4% 12.3%
Net profits (%)
Profitability 35.8% 32.8% 31.2% 33.0% 32.4%
Gross profit margin (%) 23.0% 21.7% 20.0% 21.5% 20.9%
Net profit margin (%) 34.7% 26.7% 29.6% 39.7% 43.0%
ROE (%) 26.1% 19.2% 20.1% 25.9% 27.4%
ROA (%)
Capital structure 0.11 0.22 0.23 0.24 0.25
D/E 0.08 0.16 0.16 0.16 0.16
D/A
Per share 5,492 4,276 4,840 6,801 7,640
EPS (VND/ share) 15,839 16,361 16,881 17,682 18,322
BVPS (VND/ share) 2018 2019 2020 2021F 2022F

Initiation Report Mar-2021 | GDT
23
DISCLAIMER
I, Manh Tran, confirm that I am totally honest and have no personal motivation in making this report. All information in this report has
been verified carefully and is deemed to be the most reliable; however, I shall take no responsibilities regarding the accuracy and
completeness of the information provided herein. Viewpoints, comments and assessments in this report are of my personal opinions with
no purpose of advising the readers to buy, sell or hold any securities. This report is only for the purpose of providing information; readers
should only use this analysis report as a source of reference. Bao Viet Securities Joint-stock Company (BVSC) and I shall take no
responsibilities to investors as well as subjects mentioned in this report for losses incurring during investments or incorrect information
about the enterprise.
This report is an asset of Bao Viet Securities Joint-stock Company. Therefore, no part of this report may be (i) copied or duplicated in any
form by any mean or (ii) redistributed without the prior consent of Bao Viet Securities Joint-stock Company.
CONTACTS
Research & Investment Advisory Department. BAOVIET Securities Joint Stock Company
Dung Pham
Head of Research
Luong Luu
Deputy Head of Research
Ngoc Hoang
Information Technology, Seaport
Ngoc Nguyen
Real Estate, Industrial Park
Duc Nguyen
Public Utilities
Khanh Do
Aviation
Hoa Le
Banking sector
Thuan Pham
Pharmaceutical, Seafoods
Thao Tran
Building Materials, R/E, Natural Rubber
Phu Truong
Consumer Goods
Huyen Hoang
Economist
Anh Nguyen
FMCG, Public Utilities
Vinh Ngo
Consumer, Livestock, Securities
Bach Tran
Technical Analyst
Hoang Nguyen
Steel, Fertilizers
Manh Tran
Construction, Automobile & Parts
Phuong Le
Market Strategist

BaoViet Securities Joint Stock Company
Hanoi Headquarter: Ho Chi Minh Branch:
▪ 72 Tran Hung Dao, Hoan Kiem, Hanoi ▪ 8 Floor, No 233 Dong Khoi, Dist. 1, HCM city
▪ Tel: (84 24) 3 928 8080 ▪ Tel: (84 28) 3 914 6888