Embed Size (px)
Citation preview
Working Report 2004-46
Injection Grout for Deep Repositories Sub project 1: low-oH Cementitious Grout
for larger fractures, leach Testing of Grout Mixes and [valuation of the long-Term Safety
Ulla Vuorinen
Jarmo Lehikoinen
Harutake lmoto
Takeshi Yamamoto
Maria Cruz Alonso
October 2005
Research organisation and address Customer VTT Processes, Nuclear Energy Posiva Oy P.O. Box 1608 FI-27160 OLKILUOTO FI-02044 VTT, FINLAND
Responsible person Contact person
Ulla Vuorinen Johanna Hansen
Diary code (VTT) Order reference PR01-69T-03, PR01-68T-04 9707 /03/EJOH, 9683/04/EJOH
Title and reference code for assignment Report identification & Pages Date 13LOW-PH PROl/1042/05 1.6.2005 C3SU00786 64 p. + App. 37 p.
Report title and author(s)
INJECTION GROUT FOR DEEP REPOSITORIES, SUBPROJECT 1: Low-PH CEMENTITIOUS
GROUT FOR LARGER FRACTURES, LEACH TESTING OF GROUT MIXES AND EVALUATION OF THE
LONG-TERM SAFETY. U. VUORINEN, J. LEHIKOINEN, H. IMOTO, T. Y AMAMOTO, M. CRUZ ALONSO
Summary Constructing an underground disposal facility for spent nuclear fuel deep in bedrock requires low-pH cement-based injection grout, because assured data of the extent of a possible high-pH plume in saturated bedrock conditions is lacking. In this work low-pH grout mixes of new design were subjected to leach testing. Before chosen to leach testing the grout mixes had to fulfil certain technical requirements. Leach testing was performed in order to establish that the pH requirement (~11) set for the leachates was met. For comparison reasons also one conventionally used cement based grout material was included in the tests. Two kinds of low-pH grout cement mixes were tested; mixes with added blast furnace slag (4 mixes) or added silica (6 mixes). All the mixes were not completely tested according to the test plan, because for some mixes during leach testing factors detrimental to the long-term safety of a repository were observed, e.g. too high pH or leached sulphide, which is harmful for copper. Leach testing of the grout mixes was performed in a glove-box (N2 atmosphere) in order to avoid the interference of atmospheric C02 on the alkaline leachates. Two simulated groundwater solutions, saline OL-SO and fresh ALL-MR, were used as leachates. Two leach tests were applied; equilibrium and diffusion tests. In the equilibrium test at each measuring point only a part of the leachate was exchanged, whereas in the diffusion test the entire leachate was exchanged. The pH value of each leachate sample was measured, but total alkalinity was determined only for some leachates. Na, K, Ca, Mg, AI, Fe, Si, So/-, STOT, and Cl were analysed in the leach solutions collected in the diffusion test of four grout mixes chosen. Also the corresponding solid specimens were analysed (SEM, XRD, EPMA, MIP, TG) in Japan. A few grout pore fluid pH values were measured in Spain, as well. The simplified thermodynamic model calculations were successful in qualitatively reproducing the experimentally observed results. Leach rates or/and diffusion coefficients were calculated for Ca, K, SToT. Si, AI, and Na using two different Fickian diffusion models. Amongst the tested new injection grouts the most promising characteristics (from chemical point of view) were found in the silica modified mixes when the content of silica fume was increased and ettringite-acceleration added. Two of these mixes, f63 and w I, had similar compositions; the ratio of silica fume to cement was 0.69 and only the type of cement used (Ordinary Portland Cement vs. Egyptian White Cement, respectively) was different. In addition to fulfilling the pH requirement of the leachate at the end of testing these two mixes had also demonstrated promising technical characteristics (Kronlof 2004). Of these two mixes mix wl showed better chemical characteristics. In saline leachate in the chosen equilibrium conditions the dissolved amounts were lower forK, so/- (almost an order of magnitude) and Si. Also in ALL-MR at the end of diffusion testing the leachate contents ofNa, K, Ca and Si were lower for mix w1.
Distribution Posiva Oy VTT Processes/archive
Ulla Vuorinen Senior Research Scientist
Rev~we~a~n
~~~ Group Manager
Publicity Confidential
Timo Vanttola Research Manager
The use of the name of the Technical Research Centre of Finland (VTT) in advertising or publication in part of this report is only permissible by written authorisation from the Technical Research Centre of Finland
Working Report 2004-46
Injection Grout for Oeep Repositories Suboroject 1: low-oH Cementitious Grout
for larger fractures, leach Testing of Grout Mixes and fvaluation of the long-Term Safety
Ulla Vuorinen, Jarmo Lehikoinen
VTT Processes, Finland
Harutake lmoto, Takeshi Yamamoto
CRIEPI, .Japan
Maria Cruz Alonso
IETcc, Spain
October 2005
Working Reports contain information on work in progress
or pending completion.
The conclusions and viewpoints presented in the report
are those of author(s) and do not necessarily
coincide with those of Posiva.
ABSTRACT
Constructing an underground disposal facility for spent nuclear fuel deep in bedrock requires low-pH cement-based injection grout, because assured data of the extent of a possible high-pH plume in saturated bedrock conditions is lacking.
In this work low-pH grout mixes of new design were subjected to leach testing. Before chosen to leach testing the grout mixes had to fulfil certain technical requirements. Leach testing was performed in order to establish that the pH requirement (:Sll) set for the leachates was met. For comparison reasons also one conventionally used cement based grout material was included in the tests. Two kinds of low-pH grout cement mixes were tested; mixes with added blast furnace slag (4 mixes) or added silica (6 mixes). All the mixes were not completely tested according to the test plan, because for some mixes during leach testing factors detrimental to the long-term safety of a repository were observed, e.g. too high pH or leached sulphide, which is harmful for copper.
Leach testing of the grout mixes was performed in a glove-box (N2 atmosphere) in order to avoid the interference of atmospheric C02 on the alkaline leachates. Two simulated ground water solutions, saline OL-SO and fresh ALL-MR, were used as leachates. Two leach tests were applied; equilibrium and diffusion tests. In the equilibrium test at each measuring point only a part of the leachate was exchanged, whereas in the diffusion test the entire leachate was exchanged. The pH value of each leachate sample was measured, but total alkalinity was determined only for some leachates. Na, K, Ca, Mg, AI, Fe, Si, sol-, SToT, and Cl were analysed in the leach solutions collected in the diffusion test of four grout mixes chosen. Also the corresponding solid specimens were analysed (SEM, XRD, EPMA, MIP, TG) in Japan. A few grout pore fluid pH values were measured in Spain, as well.
The simplified thermodynamic model calculations were successful in qualitatively reproducing the experimentally observed results. Leach rates or/and diffusion coefficients were calculated for Ca, K, SToT, Si, Al, and Na using two different Fickian diffusion models.
Amongst the tested new injection grouts the most promising characteristics (from chemical point of view) were found in the silica modified mixes when the content of silica fume was increased and ettringite-acceleration added. Two of these mixes, f63 and wl, had similar compositions; the ratio of silica fume to cement was 0.69 and only the type of cement used (Ordinary Portland Cement vs. Egyptian White Cement, respectively) was different. In addition to fulfilling the pH requirement of the leachate at the end of testing these two mixes had also demonstrated promising technical characteristics (Kronlof 2004). Of these two mixes mix wl showed better chemical characteristics. In saline leachate in the chosen equilibrium conditions the dissolved amounts were lower forK, S04 (almost an order of magnitude) and Si. Also in ALLMR at the end of diffusion testing the leachate contents of N a, K, Ca and Si were lower for mix wl.
Keywords: injection grout, cement, low-pH, leach test, pH, alkalinity, sulphide, leach rate, diffusion, thermodynamic modelling
LOPPUSIJOITUSTILOJEN INJEKTOINTIAINE - ALAPROJEKTI 1: Matalan pH:n sementin injektointiaine kallioraoille, injektointiaineiden uuttokokeet ja pitkaaikaisturvallisuuden arviointi
TIIVISTELMA
Kaytetyn ydinpolttoaineen loppusijoitustilan rakentamista varten tarvitaan matalan pH:n omaavaa sementtipohjaista injektointi ainetta, koska normaalisti kaytetyn injektointisementin osalta ei ole olemassa varmaa tietoa sen pH-vaikutusten laajuudesta syvalla kalliossa pohj avesiolosuhteissa.
Tassa tyossa testattiin uuttotesteilla uusilla resepteilla valmistettuja matalan pH:n injektointiaineita, jotka tayttivat tietyt ennalta asetetut tekniset vaatimukset. Uuttotestilla haluttiin selvittaa injektointiaineelle asetetun pH-vaatimuksen ( <11) tayttymista. Vertailun vuoksi testeihin otettiin mukaan myos yksi tavallisesti kalliorakentamisessa kaytetty sementtipohjainen injektointiaine. Testattavana oli kahdenlaisia matalan pH:n sementtimassoja; sellaisia joihin oli lisatty masuunikuonaa ( 4 kpl) ja sellaisia joihin oli lisatty silikaa (6kpl). Kaikkia massoja ei testattu aina edes loppuun asti sovitun testiohjelman mukaisesti, koska jo testin aikana havaittiin loppusijoitustilan pitkaaikaisturvallisuutta heikentavia tekijoita; mm. liian korkea pH-arvo tai vapautuva sulfidi (kuonaa sisaltavat massat), joka on haitallista kuparin kannalta.
Injektointimassojen uuttotestit tehtiin typpiatmosfaarissa hanskakaapissa, jossa voitiin valttaa ilman hiilidioksidin hairiot korkean pH:n uuttoliuoksiin. Uuttotesteissa kaytettiin kahdenlaista simuloitua pohjavetta; suolaista OL-SO ja makeaa ALL-MR vetta. Uuttotesteja oli kaksi; nk. tasapaino- ja diffuusiotesti. Tasapainotestissa jokaisella vaihtokerralla vaihdettiin vain osa uuttovedesta kun taas diffuusiotestissa vaihdettiin aina koko vesimaara kerralla. Uuttovesista mitattiin pH ja joistakin maaritettiin kokonaisalkaliteetti. Neljan valitun massan (referenssi-, silika- kuona ja matala-alkalinen sementti massa, jossa oli kuonaa) diffuusiotestissa keratyista uuttoliuoksista analysoitiin Na, K, Ca, Mg, AI, Fe, Si, SO/-, SToT, ja Cl. Myos vastaavat eluutiotestissa olleet kappaleet analysoitiin (SEM, XRD, EPMA, MIP, TG) Japanissa. Lisaksi muutamien naytekappaleiden huokosvesien pH-arvot mitattiin Espanjassa.
Kokeellisesti mitatut tulokset selittyivat kvalitatiivisesti yksinkertaistetun termodynaamisen mallilaskennan avulla. Tietyille aineille (Ca, K, SToT, Si, AI ja Na) laskettiin eluutionopeudet ja/tai diffuusiokertoimet soveltaen kahta Fickin diffuusiomallia.
Testattujen injektointimassojen joukossa lupaavimmat ominaisuudet (kemialliselta nakokannalta katsottuna) olivat silikalla modifioiduilla massoilla, joissa oli lisatty silikan osuutta ja kaytettiin ettringiittikiihdytysta. Kaksi tallaista massaa, f63 ja w1, joiden koostumus oli muuten sama paitsi kaytetyn sementin suhteen (tavallinen Portland sementti ja egyptilainen valkosementti, vastaavasti) ja joissa silikan suhde sementtiin oli 0.69 osoittautuivat lupaaviksi. Kummallakin massalla saavutettiin vaatimuksissa esitetty uuttoliuoksen pH-arvo testin lopussa ja lisaksi tekniset ominaisuudetkin olivat lupaavia (Kronlof 2004). Naista massoista massalla w1 oli paremmat kemialliset ominaisuudet valitussa suolaisessa tasapaino-olosuhteessa; suolaiseen veteen liukeni vahemman kaliumia, sulfaattia (melkein kertaluokkaa vahemman) ja piita. Myos makean veden diffuusiotestin lopussa w1 massan eluutioliuoksen Na, K, Caja Si pitoisuudet olivatjonkin verran matalammat kuin massalla f63.

Avainsanat: injektointiaine, sementti, matala pH, uuttotesti, pH, alkaliteetti, sulfidi, uuttonopeus, diffuusio, termodynaaminen mallinnus
1
TABLE OF CONTENTS
ABSTRACT
TIIVISTELMA
1 INTRODUCTION ................................................................................................. 5
2 LEACH TESTING ................................................................................................ 7
2.1 Methods and procedures ............................................................................ 7 2.1 .1 Leach tests ..................................................................................... 7 2.1.2 Leach solutions ............................................................................... 8 2.1 .3 Experimental arrangements ............................................................ 9 2.1 .4 Other tests .................................................................................... 1 0
2.2 Tested grout mixes and sample preparation ............................................. 1 0
3 RESULTS ON LEACHATES .............................................................................. 13
3.1 Equilibrium test pH ................................................................................... 13 3.1.1 Reference mix 52 ......................................................................... 14 3.1.2 OPC-silica mixes .......................................................................... 14 3.1.3 Slag mixes .................................................................................... 17
3.2 Total alkalinity and sulphide ...................................................................... 18 3.2.1 Sulphide ....................................................................................... 20 3.2.2 Total alkalinity ............................................................................... 22
3.3 Diffusion test pH ....................................................................................... 24 3.3.1 Reference mix 52 ......................................................................... 25 3.3.2 OPC-silica mixes .......................................................................... 25 3.3.3 Slag mixes .................................................................................... 26
3.4 Chemical analysis of leachates ................................................................. 26
4 RESULTS FROM SOLID ANALYSES ............................................................... 33
4.1 XRD results .............................................................................................. 33 4.2 Chemical composition (XRF) .................................................................... 35 4.3 EPMA ....................................................................................................... 37 4.4 Pore size (M lP) ......................................................................................... 38 4.5 SEM results .............................................................................................. 39
5 MODELLING ..................................................................................................... 41
5.1 Modelling of leaching ................................................................................ 41 5.1 .1 Theoretical .................................................................................... 41 5.1.2 Results ......................................................................................... 42
5.2 Chemical modelling .................................................................................. 46
6 SUMMARY AND MAIN CONCLUSIONS ........................................................... 57
7 REFERENCES .................................................................................................. 63
2
APPENDIX 1: SAMPLE PREPARATION ............................................................... 65
APPENDIX 2: PH RESULTS IN EQUILIBRIUM TESTS ......................................... 57
APPENDIX 4: PH AND ALKALINITY FIGURES ..................................................... 71
APPENDIX 5: ANALYTICAL RESULTS OF LEACHATES (DIFF TEST) ................ 73
APPENDIX 6: EPMA MAPS FOR CA AND SI AND XRF ....................................... 81
APPENDIX 7: SEM MICROGRAPHS .................................................................... 85
APPENDIX 8: LEACHING MODELLING ................................................................ 87
APPENDIX 9: PH MEASUREMENTS BY IETCC ................................................... 97
APPENDIX 10: DETAILS ON ANALYTICAL METHODS ....................................... 101
3
NOTATIONS
The following notations are used in the report:
ALL-MR =simulated fresh granitic groundwater A=Ah03 AFt = calcium sulfoaluminate hydrate (Ah03 - Fe20 3 - tri ) e.g. ettringite AFm = calcium aluminate hydrate (Ah03 - Fe203 - mono) C4AF = tetracalcium aluminoferrite c3s = tricalcium silicate C(A)SH =calcium aluminium silicate hydrate CH = calcium hydroxide CSH or C-S-H =calcium silicate hydrate DIFF-test = diffusion leach test DM = dry matter EQ-test = equilibrium leach test EPMA =Electron Probe Microanalysis ETTA = ettringite acceleration F = Fe203 F AAS = Flame Atomic Absorption Spectrometry G =gypsum Grout Aid = commercial slurry of silica fume (SF) HAC = high alumina cement ICP-AES =Inductively Coupled Plasma Atomic Emission Spectrometry IC =Ion Chromatography LAC = low alkali cement LOI =loss on ignition (weight loss on heating cement) MIP = Mercury Intrusion Porosimetry OL-SR = simulated saline granitic groundwater OPC = Ordinary Portland Cement RClO = Rheocem 900 SCM = shrinking core model SEM = Scanning Electron Microscopy SF = silica fume SL = blast furnace slag SPL = superplasticizer SRB = sulphate reducing bacteria TG = Thermogravimetry TG-DTA = Thermo Gravimetric-Differential Thermal Analysis UF16 =commercial injection cement WCE =Egyptian White Cement XRD = X-Ray Diffractometry XRF = X-Ray Fluoresence

4
5
1 INTRODUCTION
Grouting is a common and an unavoidable practice used in constructing underground rock facilities, but the requirements to the grout material used when spent nuclear fuel repository in deep bedrock is in question are far stricter. The possible effects caused by the grout material in the surrounding repository environment have to be carefully evaluated, especially in respect of the long-term safety of the repository.
The possibility of a high-pH plume resulting from ordinary grouting material has been a concern especially in respect of the stability of bentonite and the higher solubility of spent fuel and cladding. Another risk is imposed by the organic cement admixtures, which are able to complex radionuclides and thereby enhance their transport. In order to overcome such effects a co-operation project, "Injection Grout for Deep Repositories", was set up between three organizations, Posiva Oy, Swedish Nuclear Fuel and Waste Management Co (SKB) and Nuclear Waste Management of Japan (NUMO). The cooperation project consists of several sub-projects but the work discussed in this report encompasses Task 5 ("Leach testing of the most promising low-pH grout mixes developed") in Subproject 1 (SP1) ("Low pH cementitious injection grout for larger fractures") lead by Posiva Oy.
The acceptable target pH resulting in the leach solutions used was set at a value ~ 11, which would limit the OH-alkalinity of the leachate to a value of about 1 mmol/L in pure water. Preferred characteristics of the grout were a known chemical composition with tested properties and without added organics. Two types of leach solutions were selected; fresh and saline simulated groundwaters representing the present lower and deeper bedrock groundwater conditions at Olkiluoto, the site for the Finnish underground rock characterization facility ONKALO. For comparison reasons it was felt necessary to include a reference grout in the leach tests, as well. The reference grout represented a conventionally used grout with high-pH.
To aid evaluation of the long-term safety of the tested mixes leach testing was planned to provide various analytical data,
• for estimating the leachable inventory and the remaining leachable fraction of the analysed solutes as a function of time, as well as,
• for performing thermodynamic equilibrium modelling of the chemical behaviour of cement phases.
Leach testing was performed with two different types of low-pH grout mixes where the added pozzolan was either blast furnace slag or silica fume. Preparation and testing of the technical performance of the grout mixes subjected to leach testing is reported by Kronlof (2004).
Leaching of cementitious materials has been extensively studied, but in general experiments have been primarily concerned with the degradation of structural materials, with a consequent loss of strength and integrity. Here the main objective was to assess the pH in the leachates in contact with the low-pH grout materials. The test conditions were chosen to represent deep groundwater conditions in granitic bedrock.

6
7
2 LEACH TESTING
A variety of test procedures are available to characterise materials with respect to their leaching behaviour (van der Sloot 1996, 1998, van der Sloot et al.1996, Wahlstrom 1996, Fallman and Aurell 1996, MCC Nuclear Waste Materials Handbooks, Saito and Deguchi 2000, Hohberg et al. 2000). Such tests are carried out on a wide variety of materials for regulatory purposes, waste management purposes, environmental impact assessment, and for scientific purposes in several countries (e.g., Netherlands, Germany, France, Switzerland, Canada, USA; Finland, Japan). Test methods have been developed for monolithic, crushed and powdered materials. Leach tests can be classified, e.g., into tests aimed at
attaining equilibrium conditions at the end of the leaching experiment,
dynamic aspects of leaching (e.g. time-dependence)
accelerated dissolution, or
understanding the leaching behaviour of materials. Several different procedures are in use but new ones are developed as well. However, a chosen test procedure may have to be altered or combined with other procedures as to fulfil the aim of the test and to take account of the local environmental conditions and to correspond to them as closely as possible. The distinction between solubility- and kinetically-controlled releases is important for a proper assessment of both the shortand long-term environmental impact.
2.1 Methods and procedures
2.1.1 Leach tests
Two leaching methods were used; one method for assessing the maximum equilibrium pH deep in the bedrock with slow turnover of groundwater, and another test (diffusion controlled release), which would facilitate the assessment of long-term safety by modelling of diffusion coefficients.
1) Equilibrium test:
In the equilibrium test (EQ) a part of the leach solution was extracted and replaced with the same amount of fresh leach solution periodically. The extracted leach solution was filtered (0.22 J.Lm) and used for measuring the pH value, and if necessary, also for titration of alkalinity. The amount of leach solution replaced periodically was evaluated on the basis of the groundwater flow-rate in Olkiluoto bedrock.
The turnover rate of groundwater was chosen to meet the effective flow per area in a potential grouted area at Olkiluoto. According to Vieno et al. (2003) the characteristics of a grouted zone could be,
20 m in diameter and 250 J.Lm aperture of an injected fracture.
This gives a 0.016 m2 contact area of the flowing water in the fracture with the grout resulting in an effective ground water flow in a fracture varying between 1. 7 and 5.1 Uyr. Thus the groundwater flow per area would be about 100 U(yr·m2
) with the flow rate of 1. 7 Uyr. The surface area of a cement sample in the laboratory leach
8
experiments was about 0.0026 m2. Thus the leachate in the test vessel needed to be
changed with a rate of 0.26 Uyr in order to reach the flow per area of 100 L/(yr·m2).
This periodic replacement of the leach solution was considered necessary in the equilibrium test in order to remove the highly soluble alkalis, Na and K hydroxides1
,
present in the aqueous pore solution of the cement specimen. If sufficient amounts of the alkalis were present the resulting pH in the leachate would have been high. On the other hand, also portlandite, Ca(OHh, even if considered solubility limited2
, could have kept the pH::::: 12.5 when sufficiently available. In this context the development of a low pH material aimed at binding portlandite to CSH phases and thereby reducing the pH of the pore solution (Kronlof 2004). Without any replacement of the leachate these highpH alkalis would have remained in the leachate permanently and caused a higher pH than the long-term pH controlled by the CSH phases (pH::::: 10.5).
Equilibrium tests were carried out for 20 or 25 weeks after which the specimens were left in the leachates inside a glove-box until further actions. The composition of the mixes tested is given in Tables 2.2 to 2.4.
2) Diffusion test:
In the diffusion tests (DIFF) the entire leachate volume was replaced at each exchange point. In the beginning of the test the leachates were exchanged more often and later on the exchange frequency was decreased. Generally the exchange of leachates occurred twice on the first day, 3h and 6h, thereafter daily up to day 6 and continuing day 8, 11 and 15, after which the exchange was made at 7 day intervals up to the 20th exchange point. However, some modifications had to be made to the schedule due to holidays etc. The duration of the entire testing period was 70 and 79 days for mixes 52 and L8, respectively, whereas mixes 44 and f63 were tested up to 25th exchange point reaching up to 106 and 109 days of testing, respectively. After the last exchange the samples were left in the leachates inside the glove-box until further actions.
Later at two occasions the solid specimens of four mixes were removed and sent for analyses to CRIEPI, Japan (the actual specimens) and IETcc, Spain (the duplicate specimens) together with the initial (unleached) specimens.
2.1.2 Leach solutions
The compositions of the two simulated groundwater solutions, saline (OL-SR) and fresh (ALL-MR), are given in Table 2.1. The C02-free leach solutions were prepared inside the anoxic glove-box at least two weeks before starting the leach testing. The test temperature was the ambient box-temperature, which was kept at 25 oc ±1 °C, but due to fluctuations in the laboratory air-conditioning system the temperature range may have been larger for shorter time periods.
1 soluble in pure water at 20°C; 2 soluble in pure water at 20°C;
NaOH- 1090 g/L, KOH- 1130 g/L Ca(OHh- 1.7 g/L
Table 2.1
9
Nominal compositions of the two leachates used.
Fresh (ALL-MR)
Saline (OL-SR)
pH 8.8 8.3 ll-_.o:;..;;;.'7--t-----ll·····-·· ····································:~ ................................................................................................ .
Na+ mol/L 2.3·10 0.21 ca2+ , ·····-··-··········(J":ffTo:J ..... -········································6:--r··a ........................... . Il--K- +::---+---, --ll·······-·······-····a·:·ia·:io::r····-··· ··-···· ··························· · ·a:-s-4·:·ia:~r··· · ·· · ··
Mg2+ , ······················a·:·a3··:io::r··············· ·······························2·:·:f i o::r············· n--s~r2o:-+ --t--, --ll··········-·-··················· · ············· · ··-·-······ ············· · · ····· · ·· · ····· · ·· ·· · ···· ·a~·4a:··i·a:·j· · ·· ·······
sio2 , ·-·-·-··········a:a3·:io:1·-·---····· ·········································· ............................... .
n- H- C- 0-=-3
---+---, --li ·--···-·----Ti":"io:~---······--.......................................................................... . ---c-.-~-._-,-, --ll······--··-········i":4·:"i·o:~········-· .. ······································6 :4i"··························
Br- , ·-·-·····-·············--·······················-·--··········· ········· .. ············· ·· ·· ···i":·3·:·ia:~···············
~~---J_--+---, --ll·-·-···-·······-·-·····--············-·--·--······-··································a:ai·:··i"a:J··········· F- , ····--·-········-····-······-··-········-·-··-·-·-·-· ······························a:·a6·:··i·a:·j···········
n--B- ---+---,--tl····--·--·-·-····-·--···-·-·--·---····-·····································a:·ag·:"i"a:·r ········ so4 l- , · ---·-·-·-iiio:ia-~·····--···-····· ··· ·· ·· ··· ·· .. ······ · ·· · ····a~·Q4·:To:J· · ·· ·· ·· ..
2.1.3 Experimental arrangements
The grout mixes were cast in plastic pipes and after an adequate curing period suitable disks were sawn (diamond blade) for leach testing. During the curing period the cast pipes were tightly taped with duct tape from both ends. The end parts of the pipes were not used as specimen but were discarded. Preparation and preliminary treatment of the grout samples are given in detail in Appendix 1.
The specimen slices (0 2.84 cm) for the first mix in test were 1.5 cm thick (total volume of specimen slice = 9.5 cm3
) for which the plastic pipe had been removed before sawing. The amount of leachate added was 31 mL, which gave the nominal value of -0.85 cm to the ratio of sample surface area to leach solution volume (AsNL). Due to fragmentation of the specimens during testing (indefinable surface area) it was decided not to remove the plastic pipe but leave it on the specimen slices. However, doing so the test arrangement had to be altered so that two 1.0 cm thick disks (total volume of specimen slices = 12.7 cm3
) were used instead of one disk in order to obtain about the same AsNL ratio with 30 mL of leachate. The leach tests were performed in tightly closed polyethylene vessels inside an anaerobic glove-box. Polyethylene crosssupporters were used to keep the disks from lying on the bottom of the leach vessel or on top of each other. The different arrangements used are shown in Figure 2.1.
Leach tests were run in duplicate with one back-up sample. No measurements were performed on the back-up sample unless there was great disagreement between the results of the duplicates. After each leachate exchange the remaining solutions, not needed for the measurement of pH or titration of alkalinity, were taken out of the glove box into a freezer to be stored for the purpose of chemical analysis to be performed later when so decided.
Figure 2.1
10
a) b)
The experimental arrangements used. a) Mix 12 b) and c) are similar except for the vessels, which are of same material though. The vessel in c) was used especially in diffusion testing as the system was easier to stir before exchanging the leachate.
The leached samples were kept immersed in the leachates without stirring until each sampling point when, before extracting any solution samples, the system was stirred. All solution samples extracted were filtered (0.2 J.lm) in order to remove possible fragments or larger colloidal particles present in the leachates. The measurement of pH was performed with a commercial glass combination electrode (Orion ROSS) inside the anoxic glove-box. In the calibration of the pH measurement commercial pH buffers of adequate pH values were used.
2.1.4 Other tests
In Japan CRIEPI performed solid phase analyses, whereas IETcc in Spain measured pore fluid pH values with different methods. The analytical results by CRIEPI are presented in Chapter 3 and in Appendix 9 the cement pore fluid pH results by IETcc (Table A9-1) with the descriptions of the methods and devices (Figure A9-1) used.
2.2 Tested grout mixes and sample preparation
Different grout mixes were designed and their technical performance was tested before any mixes were chosen for leach testing. Detailed information on the materials, mix characteristics, designing of the mixes and results from their performance are found in Kronlofs report (2004).
The compositions of the mixes chosen for leach testing are given in Table 2.2 for the OPC-silica mixes and in Table 2.3 for the slag and LAC mixes. The composition of the reference mix (Ref52), a conventional grout mix with high pH, is included in both tables. The chemistry of the grout mixes tested is given in Table 2.4.
NOTE! Throughout the report instead of using Ref52 the mix is in most cases referred to as only R52 or 52.
.Table 2.2
11
The mix composztzons of the OPC-silica mixes and the reference mix (Kronlof2004).
Mix Binder OPC SF OPC SF Gypsum HAC SF Super plas- Water
-type type IDM IDM /OPC /OPC /OPC ticizer/DM IDM
12 UF16-SF UF16 Grout Aid'
f63 UF16-SF
UF16 Grout
with ETTA Aid'
f64 UF16-SF
UF16 Grout
with ETTA Aid'
w1 WCE-SF
WCE Grout
with ETTA Aid'
w2 WCE-SF
WCE Grout
with ETTA Aid'
Ref52 UF16-SF-SPL UF16 Grout Aid
OPC = Ordinary Portland Cement • DM = dry matter • UF16 = commercial cement
SF = Silica Fume SPL = Super plasticizer
0.77 0.23 0.000 0.000 0.30 0.00 1.26
0.56 0.38 0.027 0.075 0.69 0.00 2.48
0.49 0.46 0.027 0.075 0.94 0.00 2.91
0.56 0.38 0.027 0.075 0.69 0.00 2.48
0.49 0.46 0.027 0.075 0.94 0.00 2.91
0.925 0.070 0 0 0.075 0.01 1.21
• Grout Aid = commercial slurry of SF • WCE = Egyptian White Cement • ETT A = Ettringite Acceleration • HAC = High Alumina Cement
Table 2.3 The mix composition of the slag, LAC and reference mixes ( Kronlof 2004).
B Binder OPC SF OPC SF SL G SF OPC G Super plas- Water type type
44 Slag-RC10-
UF16 Grout
SF Aid'
S14 Slag-RC10-
RC10 Grout
Gypsum-SF Aid
S20 Slag-RC10-
RC10 Grout
SF Aid LS LAC
Ref52 UF16-SF-SPL
UF16 Grout Aid
• RC1 0 = commercial cement LAC = Low Alkali Cement
IDM
0.04
0.029
0.031
0.925
IDM IDM IDM
0.16 0.80 0.00
0.29 0.59 0.093
0.31 0.63 0.000
0.000
0.070 0 0.000
/SL /SL /SL
0.20 0.05 0
0.50 0.05 0.16
0.50 0.1 0
SL = Blast furnace slag G = Gypsum
ticizer/DM
0.00
0
0
0
0.01
Table 2.4 The chemical composition of the mixes tested, given as weight unit per volume unit of grout and molar ratio for Ca/Si ( Kronlof 2004 ).
D CaO Si02 Ca/Si Na20 eq. Na20 eq. Na20 eq. Al20 3 M gO Fe20 3 S03 s Other
OPC+SL OPC+SL OPC +SF
w% w% mol/mol w% w% w% w% w% w% w% w% w%
12 49.7 39.5 1.35 0.84 0.38 0.38 2.69 0.69 3.23 1.85 0.00 1.55
f63 37.8 49.3 0.82 1.06 0.30 0.30 4.87 0.50 2.36 2.03 0.00 2.08
f64 33.2 54.9 0.65 1.18 0.26 0.26 4.28 0.44 2.07 1.78 0.00 2.19
w1 39.6 50.0 0.85 0.83 0.06 0.06 4.43 0.15 0.12 2.12 0.00 2.75
w2 34.8 55.5 0.67 0.97 0.05 0.05 3.88 0.13 0.11 1.86 0.00 2.78
44 33.8 44.8 0.81 1.57 1.25 0.06 7.80 7.74 1.08 0.12 1.04 2.04
S14 27.7 49.5 0.60 1.50 0.91 0.04 5.71 5.66 0.79 4.41 0.76 3.99
S20 28.4 53.5 0.57 1.64 1.02 0.09 6.26 6.16 0.93 0.19 0.81 2.13
LS 38.1 18.2 2.25 0.22 0.22 0.00 16.92 2.25 0.82 22.63 0.00 0.91
Ref52 63.1 29.0 2.33 0.20 0.07 0.07 2.51 0.24 0.19 2.38 0.00 2.36
IDM
1.36
1.6
1.6
1.0
1.21
Tot
w%
100
100
100
100
100
100
100
100
100
100

12
---------------- -
13
3 RESULTS ON LEACHATES
In the beginning leach testing was performed with both leachates, fresh and saline, and with grout samples cured at two temperatures, 20 oc and 50 °C. The samples cured at the higher temperature were included as they represented more mature grout for which the hydration reactions had proceeded further. However, this accelerated hydration may have caused changes in repartition of the hydrated phases, as the enthalpies of hydration and pozzolanic reactions are quite different. In the beginning all the tests were also run with duplicates and a back-up sample. However, later it was decided that it was not necessary to leach the samples cured at 50 °C, because the pH values were about the same or with time elapsing they tended to approach the same value anyway. It was also pointed out that in the actual grouting conditions in the bedrock the curing temperature will be much lower, even lower than the 20°C.
The pH values measured in the saline leachates were constantly lower than in the fresh leachates, and therefore the measurements in the saline leachate were also stopped, as the results in the fresh leachate gave an upper boundary. Later on as more experience was gained from the measurements also the analysis of the duplicates was stopped, because the differences between the measured pH values were not greater than about 0.06 pH units. However, the duplicates were kept as back-up specimens, which experienced the same treatments as the actual specimens, extraction and filtration of leachates, but no measurement of pH or alkalinity unless the measurements of the actual specimens gave questionable results. In both leach testings the excess leachates from each exchange occasion were deep-frozen and stored in a refrigerator.
The results on pH measurements for all experiments are shown in histograms. The duplicate values measured in the beginning are not shown in the histograms for reasons of clarity. A line (red) has been drawn across the histograms indicating the target value of pH (~11) that should be met in the equilibrium tests of the mixes.
3.1 Equilibrium test pH
Depending of the time when testing was started the figures include only the pH values measured for the at 20°C cured specimens but some figures give also results for the specimens cured at 50°C. Testing was started with mix 12 and the last mix tested was the reference mix 52. All the equilibrium pH results are presented together in Appendix 2 to facilitate easier comparison between the results of the different mixes tested, but some results are also presented in the text below. Alkalinity values are also referred to but they are more thoroughly dealt with in section 3.1.4.
As a general remark of all the pH values measured at the end of equilibrium testing it can be stated that the target pH of 11 or below was reached in the saline leachate (OL-SR) in the case of all other low-pH mixes except mix 12 (App.2, Fig.A2-1 and A2-2, the right-hand sub-figures. The line (red) across each histogram depicts the target pH of 11). Furthermore, for the specimen cured at 20°C the trend during EQ-leach testing was gradual decrease with time except in the case of mixes 52, 12 and 44, which showed rather constant pH values.
The amounts of leachates exchanged during the EQ-tests were about 104 mL and 130 mL for 20 and 25 week testing periods, respectively.
14
3.1.1 Reference mix 52
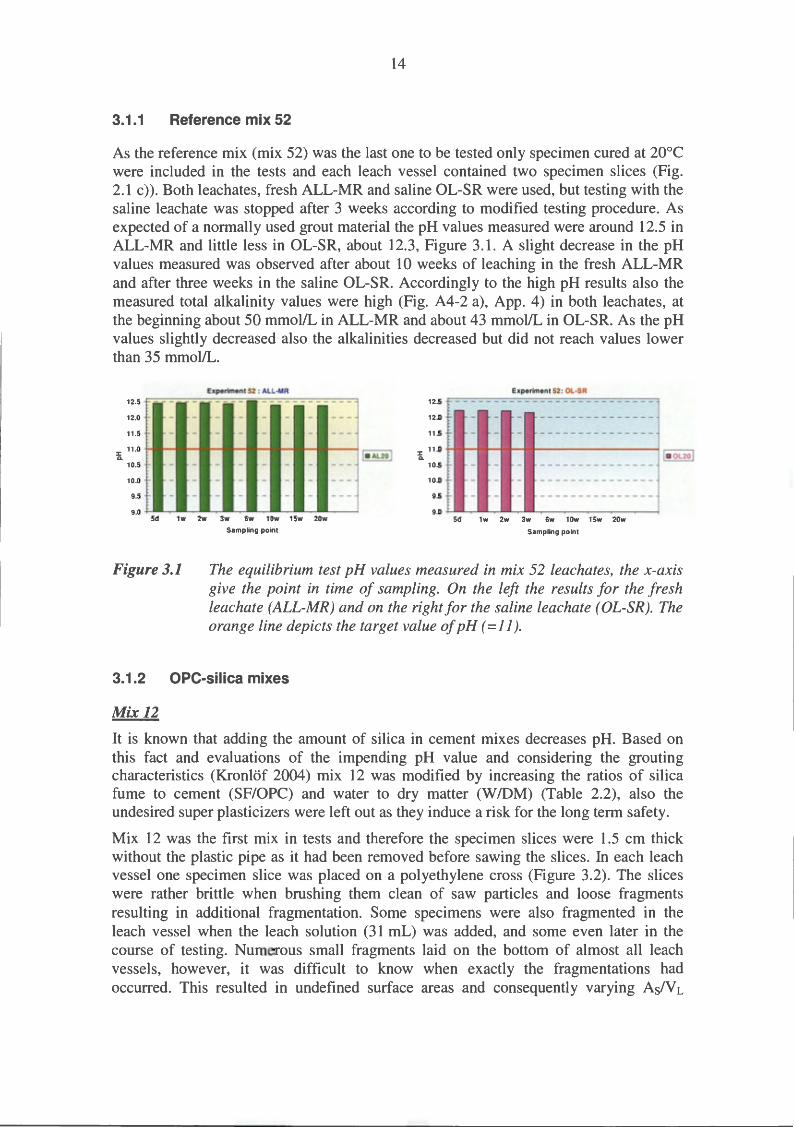
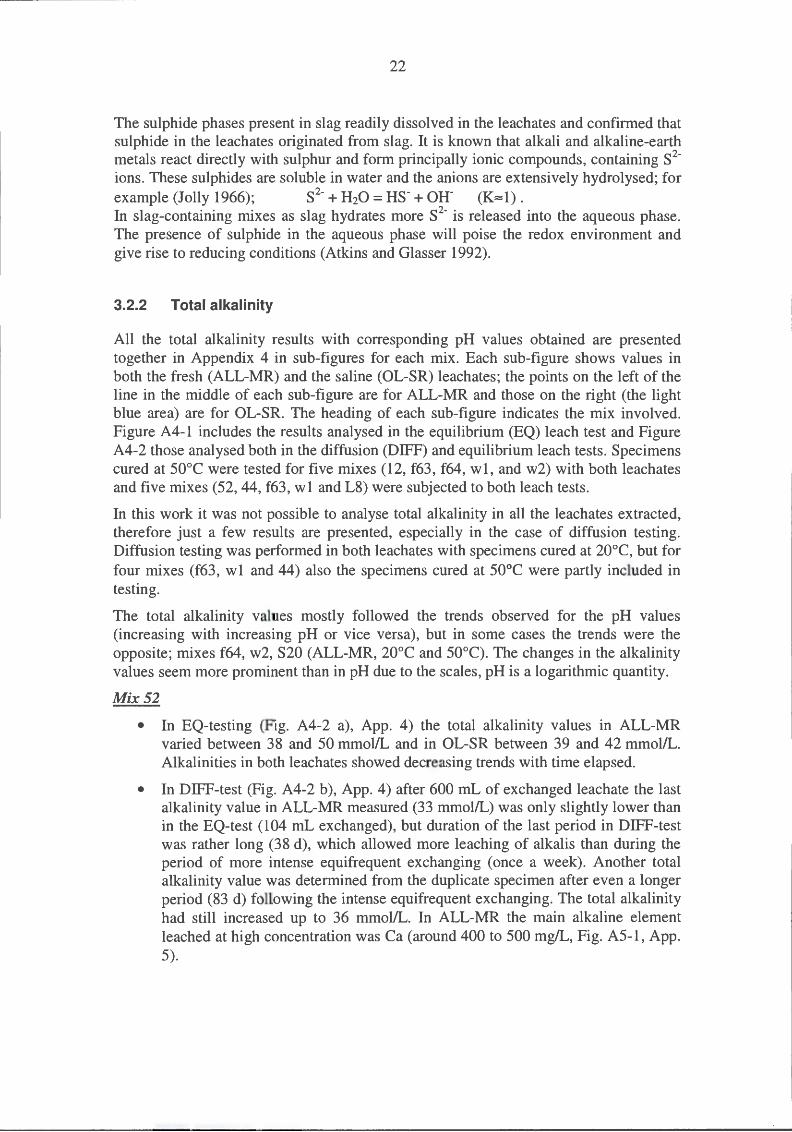
As the reference mix (mix 52) was the last one to be tested only specimen cured at 20°C were included in the tests and each leach vessel contained two specimen slices (Fig. 2.1 c)). Both leachates, fresh ALL-MR and saline OL-SR were used, but testing with the saline leachate was stopped after 3 weeks according to modified testing procedure. As expected of a normally used grout material the pH values measured were around 12.5 in ALL-MR and little less in OL-SR, about 12.3, Figure 3.1. A slight decrease in the pH values measured was observed after about 10 weeks of leaching in the fresh ALL-MR and after three weeks in the saline OL-SR. Accordingly to the high pH results also the measured total alkalinity values were high (Fig. A4-2 a), App. 4) in both leachates, at the beginning about 50 mmol/L in ALL-MR and about 43 mmol/L in OL-SR. As the pH values slightly decreased also the alkalinities decreased but did not reach values lower than 35 mmol/L.
Experiment 52 : ALL-MR Experiment 52 : OL·SR
12.5 12.5
12.0 12.0
11 .5 11 .5
:r:: 11 .0 :r:: 11.0 Q. Q.
10.5 10.5
10.0 10.0
9.5 9.5
9.0 9.0 5d 1w 2w 3w 6w 10w 15w 20w 5d 1w 2w 3w 6w 10w 15w 20w
Figure 3.1
Sampling po int Sampling point
The equilibrium test pH values measured in mix 52 leachates, the x-axis give the point in time of sampling. On the left the results for the fresh leachate (ALL-MR) and on the right for the saline leachate (OL-SR). The orange line depicts the target value of pH ( = 11 ).
3.1.2 OPC-silica mixes
Mix12
It is known that adding the amount of silica in cement mixes decreases pH. Based on this fact and evaluations of the impending pH value and considering the grouting characteristics (Kronlof 2004) mix 12 was modified by increasing the ratios of silica fume to cement (SF/OPC) and water to dry matter (W ID M) (Table 2.2), also the undesired super plasticizers were left out as they induce a risk for the long term safety.
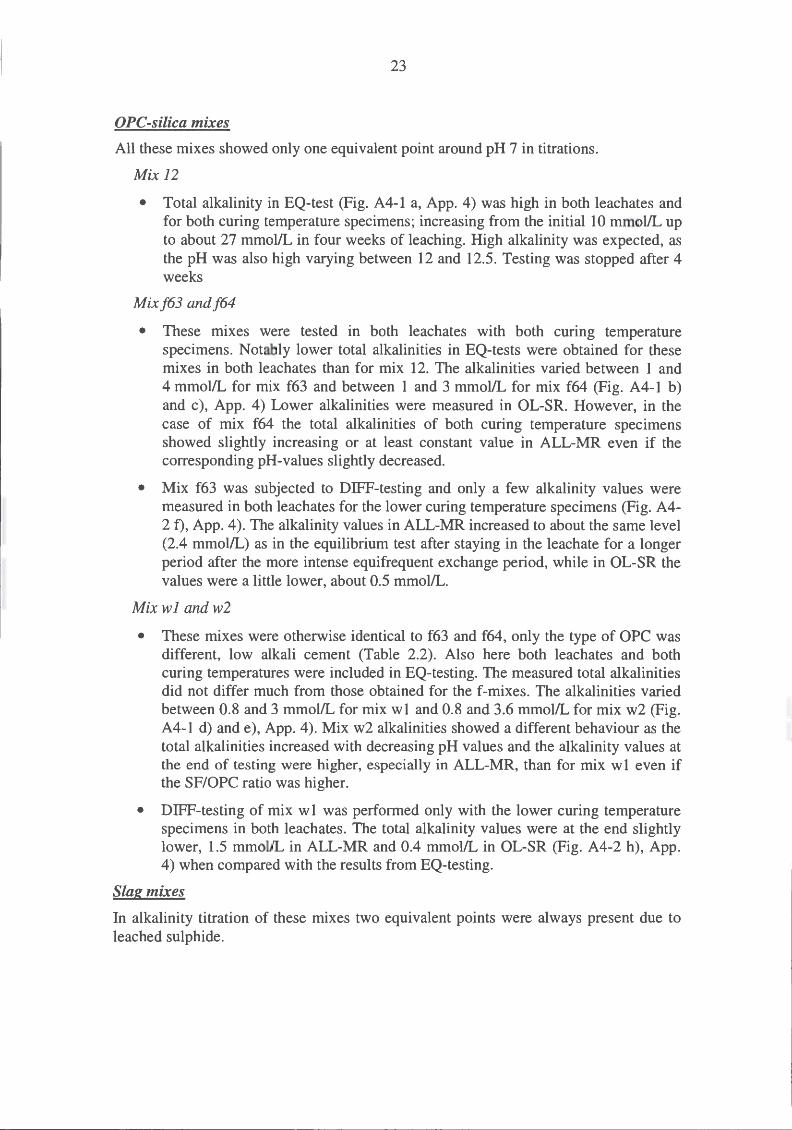
Mix 12 was the first mix in tests and therefore the specimen slices were 1.5 cm thick without the plastic pipe as it had been removed before sawing the slices. In each leach vessel one specimen slice was placed on a polyethylene cross (Figure 3.2). The slices were rather brittle when brushing them clean of saw particles and loose fragments resulting in additional fragmentation. Some specimens were also fragmented in the leach vessel when the leach solution (31 mL) was added, and some even later in the course of testing. Numerous small fragments laid on the bottom of almost all leach vessels, however, it was difficult to know when exactly the fragmentations had occurred. This resulted in undefined surface areas and consequently varying AsN L
15
ratios. Some variations in the pH values may be due to this additional fragmentation during the leach testing.
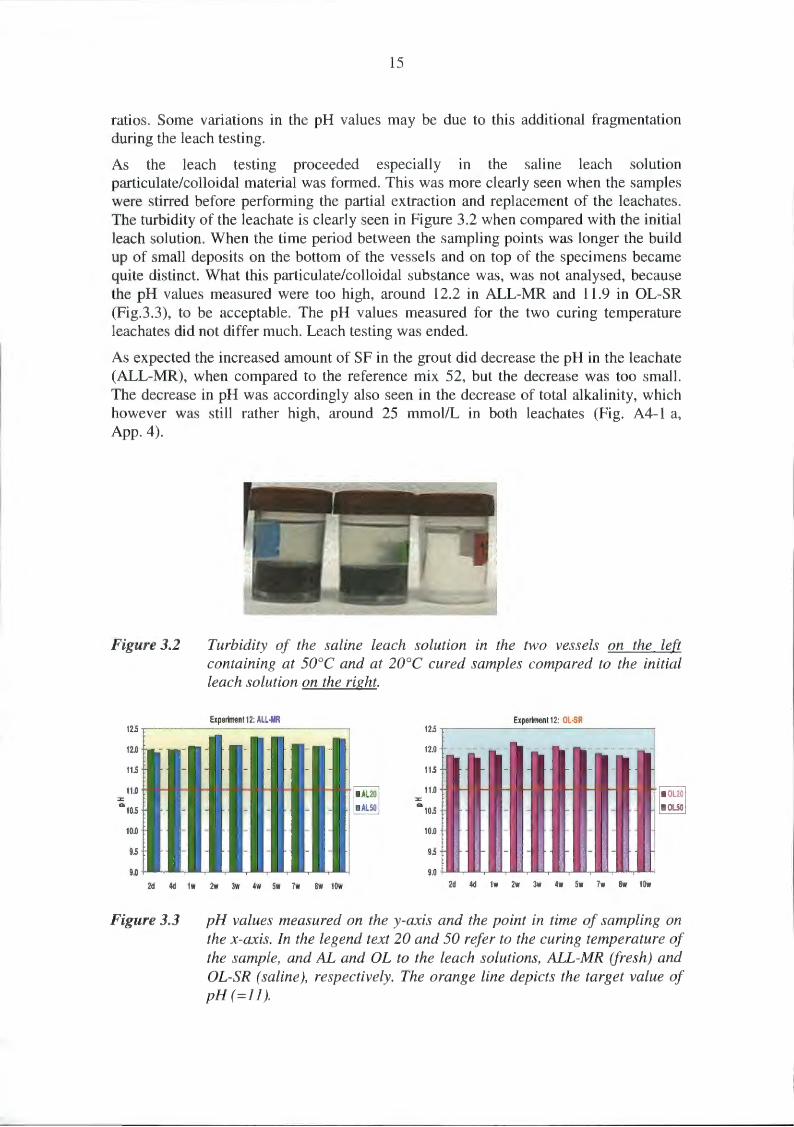
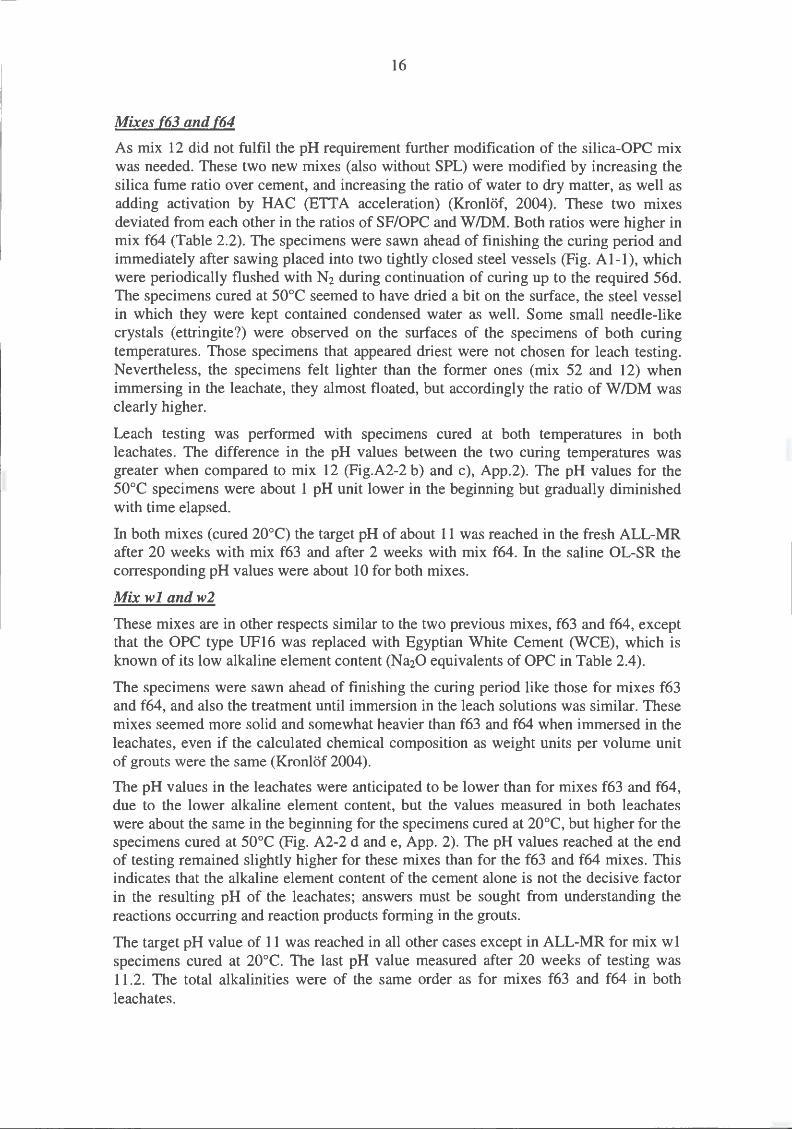
As the leach testing proceeded especially in the saline leach solution particulate/colloidal material was formed. This was more clearly seen when the samples were stirred before performing the partial extraction and replacement of the leachates. The turbidity of the leachate is clearly seen in Figure 3.2 when compared with the initial leach solution. When the time period between the sampling points was longer the build up of small deposits on the bottom of the vessels and on top of the specimens became quite distinct. What this particulate/colloidal substance was, was not analysed, because the pH values measured were too high, around 12.2 in ALL-MR and 11.9 in OL-SR (Fig.3.3), to be acceptable. The pH values measured for the two curing temperature leachates did not differ much. Leach testing was ended.
As expected the increased amount of SF in the grout did decrease the pH in the leachate (ALL-MR), when compared to the reference mix 52, but the decrease was too small. The decrease in pH was accordingly also seen in the decrease of total alkalinity, which however was still rather high, around 25 mmol/L in both leachates (Fig. A4-1 a, App. 4).
Figure 3.2
12.5
12.0
11.5
11.0 ::c ea
10.5
10.0
9.5
9.0
2d 4d 1w
Figure 3.3
Turbidity of the saline leach solution in the two vessels on the left containing at 50°C and at 20°C cured samples compared to the initial leach solution on the right.
Experiment12: ALL·MR Experiment12: OL.SR 12.5
12.0 ----- - - - --- - -----
11.5 r- - r- -
11.0 r- r- r- r- - r- r- r- r- I OL20 ::c ea
10.5 OL50 f- - - f- -
10.0 f- - f- -
9.5 f- - r- -
9.0
2w 3w 4w 5w 7w Bw 10w 2d 4d 1w 2w 3w 4w 5w 7w Bw 10w
pH values measured on the y-axis and the point in time of sampling on the x-axis. In the legend text 20 and 50 refer to the curing temperature of the sample, and AL and OL to the leach solutions, ALL-MR (fresh) and OL-SR (saline), respectively. The orange line depicts the target value of pH (=11).
16
Mixes (63 and (64
As mix 12 did not fulfil the pH requirement further modification of the silica-OPC mix was needed. These two new mixes (also without SPL) were modified by increasing the silica fume ratio over cement, and increasing the ratio of water to dry matter, as well as adding activation by HAC (ETTA acceleration) (Kronlof, 2004). These two mixes deviated from each other in the ratios of SF/OPC and W ID M. Both ratios were higher in mix f64 (Table 2.2). The specimens were sawn ahead of finishing the curing period and immediately after sawing placed into two tightly closed steel vessels (Fig. Al-l), which were periodically flushed with N2 during continuation of curing up to the required 56d. The specimens cured at 50°C seemed to have dried a bit on the surface, the steel vessel in which they were kept contained condensed water as well. Some small needle-like crystals (ettringite?) were observed on the surfaces of the specimens of both curing temperatures. Those specimens that appeared driest were not chosen for leach testing. Nevertheless, the specimens felt lighter than the former ones (mix 52 and 12) when immersing in the leachate, they almost floated, but accordingly the ratio of W IDM was clearly higher.
Leach testing was performed with specimens cured at both temperatures in both leachates. The difference in the pH values between the two curing temperatures was greater when compared to mix 12 (Fig.A2-2 b) and c), App.2). The pH values for the 50°C specimens were about 1 pH unit lower in the beginning but gradually diminished with time elapsed.
In both mixes (cured 20°C) the target pH of about 11 was reached in the fresh ALL-MR after 20 weeks with mix f63 and after 2 weeks with mix f64. In the saline OL-SR the corresponding pH values were about 10 for both mixes.
Mix wl andw2
These mixes are in other respects similar to the two previous mixes, f63 and f64, except that the OPC type UF16 was replaced with Egyptian White Cement (WCE), which is known of its low alkaline element content (N a20 equivalents of OPC in Table 2.4 ).
The specimens were sawn ahead of finishing the curing period like those for mixes f63 and f64, and also the treatment until immersion in the leach solutions was similar. These mixes seemed more solid and somewhat heavier than f63 and f64 when immersed in the leachates, even if the calculated chemical composition as weight units per volume unit of grouts were the same (Kronlof 2004).
The pH values in the leachates were anticipated to be lower than for mixes f63 and f64, due to the lower alkaline element content, but the values measured in both leachates were about the same in the beginning for the specimens cured at 20°C, but higher for the specimens cured at 50°C (Fig. A2-2 d and e, App. 2). The pH values reached at the end of testing remained slightly higher for these mixes than for the f63 and f64 mixes. This indicates that the alkaline element content of the cement alone is not the decisive factor in the resulting pH of the leachates; answers must be sought from understanding the reactions occurring and reaction products forming in the grouts.
The target pH value of 11 was reached in all other cases except in ALL-MR for mix wl specimens cured at 20°C. The last pH value measured after 20 weeks of testing was 11.2. The total alkalinities were of the same order as for mixes f63 and f64 in both leachates.
17
3.1.3 Slag mixes
Four mixes, 44, S14, S20 and L8 (Table 2.3), containing blast-furnace slag (SL) were tested. One of the cements used, LAC, was provided by the Japanese and the mix (L8) for leach tests was prepared at VTT/RTE. The amount or composition of slag in LAC was not known. Blast-furnace slag used in the other slag mixes contained about 1% of metal sulphides (according to supplier) and this may have influenced the redox conditions in the specimens.
Mix44
The first mix to be tested containing slag was mix 44. Specimens cured at both temperatures were subjected to leach testing in both leachates, fresh ALL-MR and saline OL-SR. The pH values measured (Fig. A2-1 b)) stayed at a quite constant level throughout the test period of 20 weeks; in ALL-MR around 11.5 and in OL-SR 10.7 for the specimens cured at 20°C and for the higher curing temperature around 11.3 and 10.5, respectively.
The slag mix composition needed further development, as the required pH was not met.
Mix S14 and S20
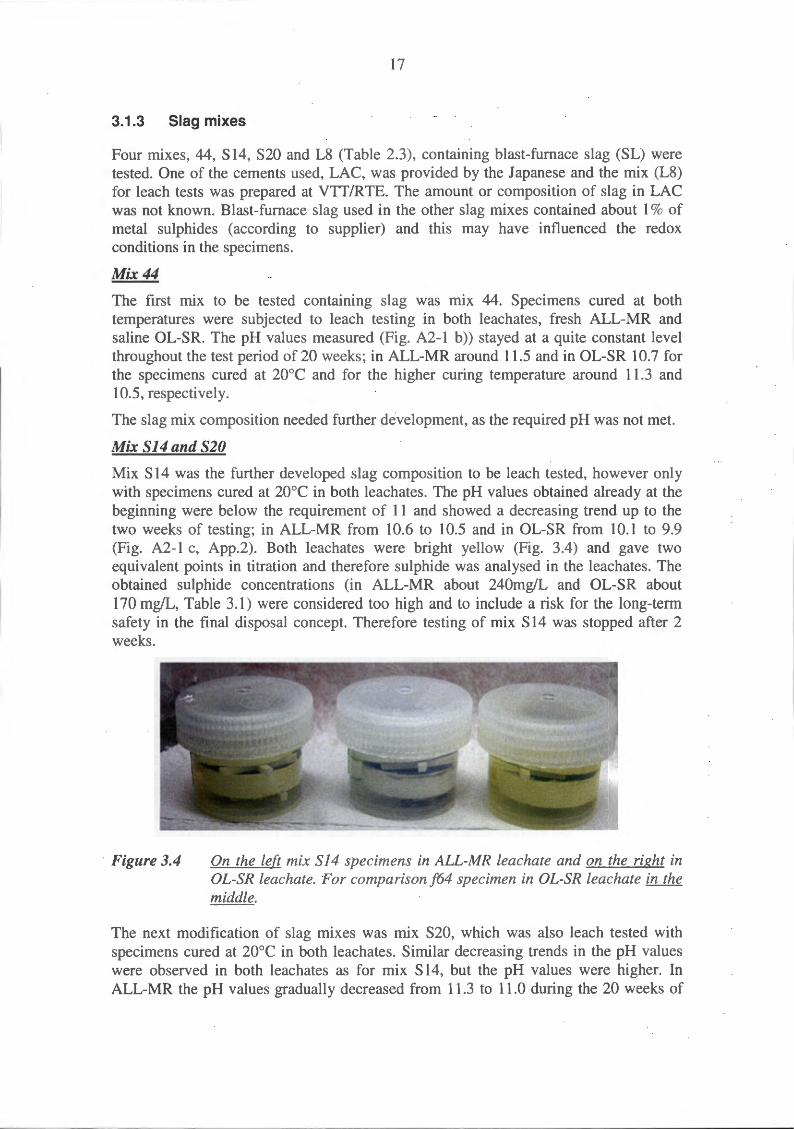
Mix S 14 was the further developed slag composition to be leach tested, however only with specimens cured at 20°C in both leachates. The pH values obtained already at the beginning were below the requirement of 11 and showed a decreasing trend up to the two weeks of testing; in ALL-MR from 10.6 to 10.5 and in OL-SR from 10.1 to 9.9 (Fig. A2-1 c, App.2). Both leachates were bright yellow (Fig. 3.4) and gave two equivalent points in titration and therefore sulphide was analysed in the leachates. The obtained sulphide concentrations (in ALL-MR about 240mg/L and OL-SR about 170 mg/L, Table 3.1) were considered too high and to include a risk for the long-term safety in the final disposal concept. Therefore testing of mix S 14 was stopped after 2 weeks.
Figure 3.4 On the left mix Sl4 specimens in ALL-MR leachate and on the right in OL-SR leachate. For comparisonf64 specimen in OL-SR leachate in the middle.
The next modification of slag mixes was mix S20, which was also leach tested with specimens cured at 20°C in both leachates. Similar decreasing trends in the pH values were observed in both leachates as for mix S 14, but the pH values were higher. In ALL-MR the pH values gradually decreased from 11.3 to 11.0 during the 20 weeks of
18
testing and in OL-SR from 10.5 to 10.2 during three weeks of testing. The titration curves showed two equivalent points and the leachates had yellowish tint. The analysed sulphide concentration in ALL-MR was about 15 mg/L and in OL-SR about 19 mg/L.
MixL8
The Japanese slag mix, L8, was leach tested with both leach solutions, ALL-MR and OL-SR, and only with specimens cured at 20°C. The pH values measured (Fig. A2-1 e), App. 2) showed quite similar decreasing trends as those for mix S20, but the initial values were a little higher in both leachates, 11.4 in ALL-MR and 10.9 in OL-SR. However the decrease of pH to the target value of 11 in ALL-MR occurred earlier, after 10 weeks of leaching when in the case of mix S20 it took 20 weeks. The titration curves showed two equivalent points and the fresh leachate had a yellowish tint (Fig. 3.5) indicating the presence of sulphide. Consequently sulphide was analysed but the concentration obtained was very low, about 0.02 mg/L (Table 3.1).
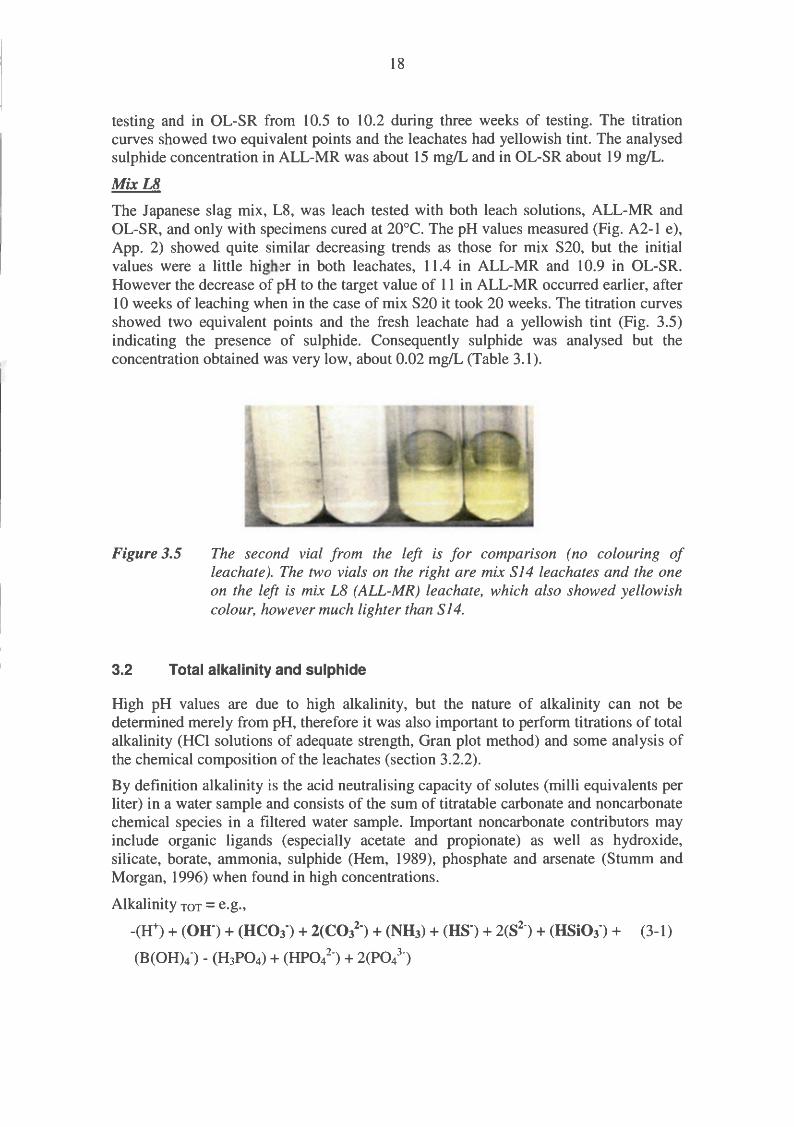
Figure 3.5 The second vial from the left is for comparison (no colouring of leachate). The two vials on the right are mix Sl4 leachates and the one on the left is mix L8 (ALL-MR) leachate, which also showed yellowish colour, however much lighter than Sl4.
3.2 Total alkalinity and sulphide
High pH values are due to high alkalinity, but the nature of alkalinity can not be determined merely from pH, therefore it was also important to perform titrations of total alkalinity (HCl solutions of adequate strength, Gran plot method) and some analysis of the chemical composition of the leachates (section 3.2.2).
By definition alkalinity is the acid neutralising capacity of solutes (milli equivalents per liter) in a water sample and consists of the sum of titratable carbonate and noncarbonate chemical species in a filtered water sample. Important noncarbonate contributors may include organic ligands (especially acetate and propionate) as well as hydroxide, silicate, borate, ammonia, sulphide (Hem, 1989), phosphate and arsenate (Stumm and Morgan, 1996) when found in high concentrations.
Alkalinity TOT= e.g.,
-(H+) +(OH-)+ (HC03) + 2(C032-) + (NH3) + (HS-) + 2(S2
) + (HSi03) + (3-1)
(B(OH)4) - (H3P04) + (HPOl-) + 2(POl-)
------------------------ --· -
19
At least the components shown in bold in the above formula (3-1) had to be considered as possible contributors to the total alkalinity in the leachates of the grout mixes, because the different grout components or the leach solution included possible sources of them.
The leach tests were performed inside an anoxic glove-box (N2 atmosphere, concentrations of C02 < 0.01 ppm and 0 2 <about lppm). The redox conditions in the tests could be reducing (presence of sulphide).
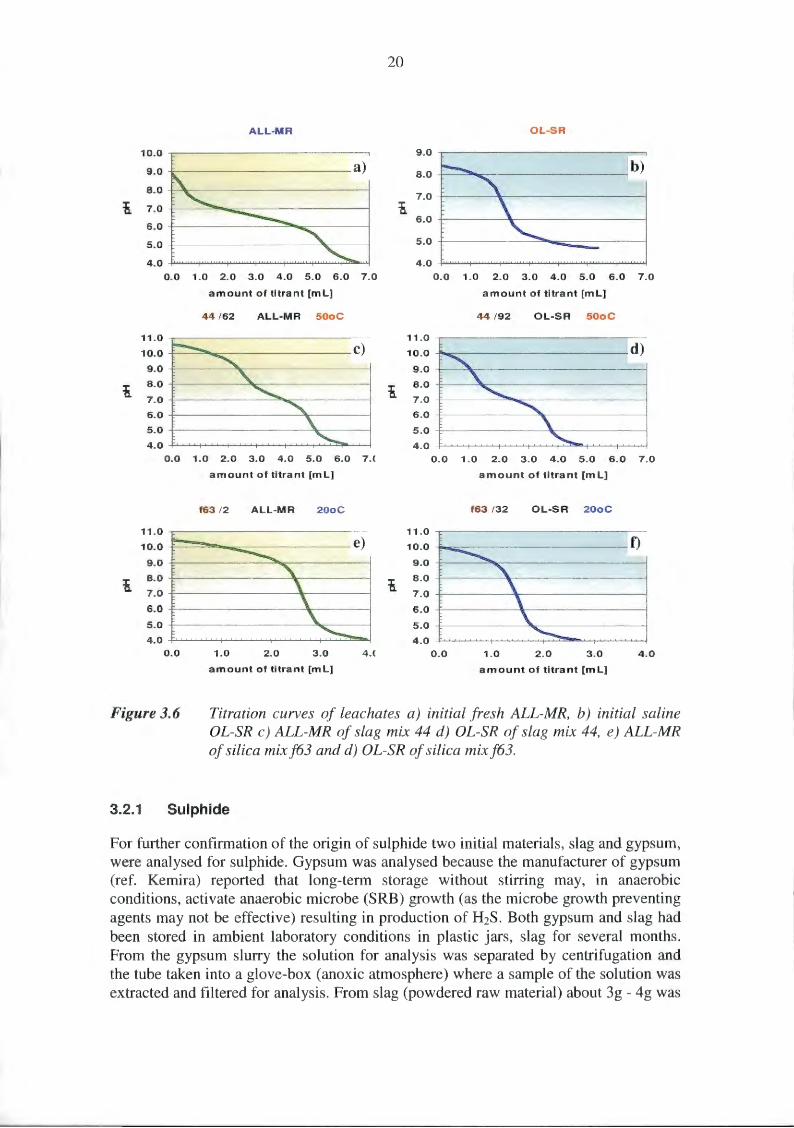
Titration curves
Examples of the shapes of the different alkalinity titration curves obtained in the tests are shown in Fig. 3.6. The initial fresh leachate (ALL-MR) contained sodium bicarbonate, which forms some carbonate ions as the pH was adjusted over 8.3, up to about 8.8, and hence, two equivalent points were shown due to the carbonate species (Fig. 3.6 a), one above 8 and the other around 5. Meanwhile the initial saline leachate (OL-SR) gave only one equivalent point (Fig. 3.6 b)).
As already discussed above the slag containing mixes all gave two equivalent points in both leachates, Fig. 3.6 c) and d), but not before analysing the sulphide concentration was the cause known. The distinct yellow colour and the high titration alkalinity of the mix S 14 leachates raised suspicions of the presence of sulphide. Also the smell of the S14 samples during clean cutting (Fig. Al-3, App.l) was explained by the presence of sulphide.
The titration curves of all the reference mix 52 and the OPC-silica mixes showed just one equivalent point and followed the shapes shown in Figure 3.6 e) and f).
10.0
9.0
8.0
~ 7.0
6.0
5.0
4.0
0.0
11.0
10.0
9.0
~ 8.0
7.0
6.0
5.0
4.0
0.0
11.0
10.0
9.0
~ 8.0
7.0
6.0
5.0
4.0 0.0
Figure 3.6
ALL-MR
1.0 2.0 3.0 4.0 5.0 6.0 7.0
amount of titrant [mL]
44 /62 ALL-MR 50oC
1.0 2.0 3.0 4.0 5.0 6.0 7.(
amount of titrant [mL]
f63 /2 ALL-MR 20oC
1.0 2.0 3.0 4.(
amount of titrant [mL]
20
~
~
OL-SR
9.0 ,.....---------------,
4.0-t'-'-'-'-.............,..I.J..I.I.J.J~.u..o..l..l..l""'t'-'-'"L.I..U...U.!~I.I.I..If..L.I.I.L.L.I..J.L.I.fU-'-.L.L.U...U..f
0.0 1.0 2.0 3.0 4.0 5.0 6.0 7.0
amount of titrant [mL]
44 /92 OL-SR 50oC
11.0
10.0
9.0
8.0
7.0
6.0
5.0
d)
"" ' "-..
' ~ ~ 4.0
0.0 1.0 2.0 3.0 4.0 5.0 6.0 7.0
amount of titrant [m L]
f63 /32 OL-SR 20oC
11.0
10.0
9.0
8.0
7.0
6.0
5.0
4.0 0.0 1.0 2.0 3.0 4.0
amount of titrant [mL]
Titration curves of leachates a) initial fresh ALL-MR, b) initial saline OL-SR c) ALL-MR of slag mix 44 d) OL-SR of slag mix 44, e) ALL-MR of silica mixf63 and d) OL-SR of silica mixf63.
3.2.1 Sulphide
For further confirmation of the origin of sulphide two initial materials, slag and gypsum, were analysed for sulphide. Gypsum was analysed because the manufacturer of gypsum (ref. Kemira) reported that long-term storage without stirring may, in anaerobic conditions, activate anaerobic microbe (SRB) growth (as the microbe growth preventing agents may not be effective) resulting in production of H2S. Both gypsum and slag had been stored in ambient laboratory conditions in plastic jars, slag for several months. From the gypsum slurry the solution for analysis was separated by centrifugation and the tube taken into a glove-box (anoxic atmosphere) where a sample of the solution was extracted and filtered for analysis. From slag (powdered raw material) about 3g- 4g was
21
weighed in each centrifuge tube. The tubes were thereafter taken into the glove-box where about 30 mL of either ALL-MR or OL-SR was added, the tubes were tightly closed and shaken by hand and left over night. On the next day the tubes were shaken again and left over night. On the following day the tubes were taken out of the glovebox and centrifuged after which they were carefully taken back into the glove-box for extracting a solution sample from each tube for analysis. The extracted samples were filtered (0.22 J..Lm) prior to analysing of S2oy colorimetry (methylen blue).
In addition both initial anaerobic leachates (ALL-MR and OL-SR) used were analysed for sulphid~, as well as, two leachate samples from the leaching experiments (performed in anaerobic conditions) of a mix containing gypsum but not slag (f63).
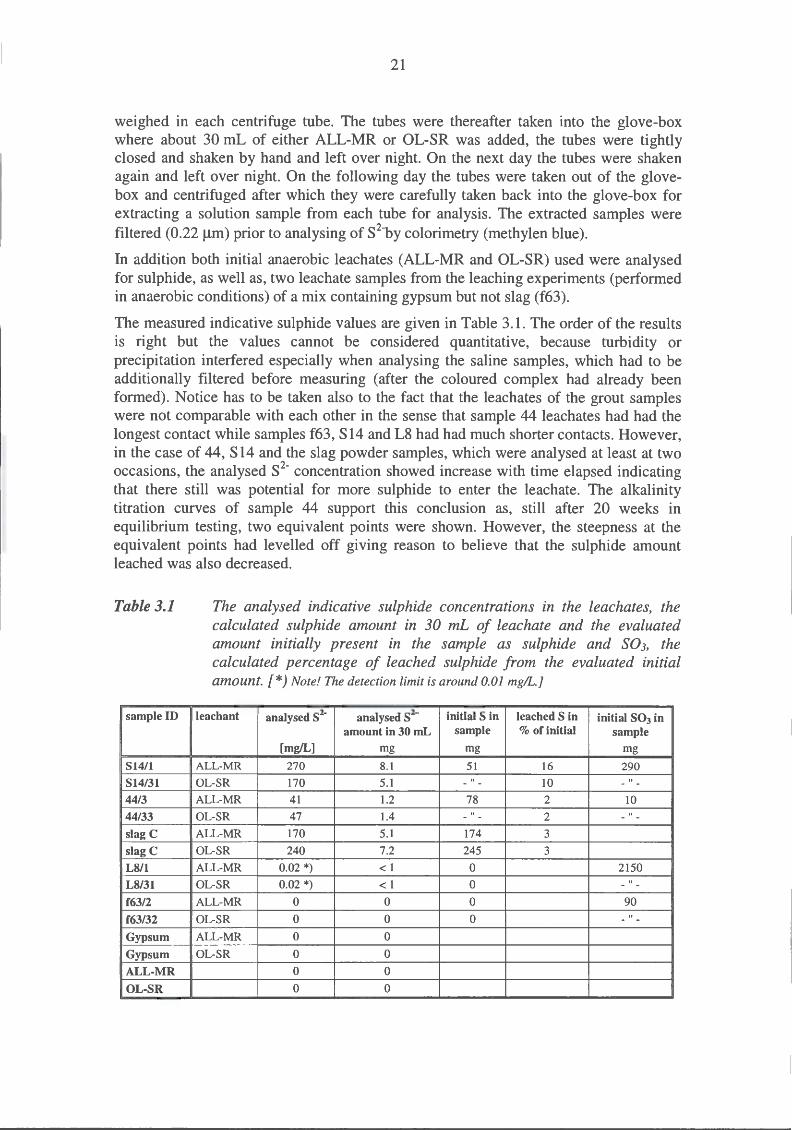
The measured indicative sulphide values are given in Table 3.1. The order of the results is right but the values cannot be considered quantitative, because turbidity or precipitation interfered especially when analysing the saline samples, which had to be additionally filtered before measuring (after the coloured complex had already been formed). Notice has to be taken also to the fact that the leachates of the grout samples were not comparable with each other in the sense that sample 44 leachates had had the longest contact while samples f63, S14 and L8 had had much shorter contacts. However, in the case of 44, S14 and the slag powder samples, which were analysed at least at two occasions, the analysed S2
- concentration showed increase with time elapsed indicating that there still was potential for more sulphide to enter the leachate. The alkalinity titration curves of sample 44 support this conclusion as, still after 20 weeks in equilibrium testing, two equivalent points were shown. However, the steepness at the equivalent points had levelled off giving reason to believe that the sulphide amount leached was also decreased.
Table 3.1
sample ID
S14/1
S14/31
44/3
44/33
slag C
slag C
LS/1
LS/31
f63/2
f63/32
Gypsum
Gypsum
ALL-MR
OL-SR
The analysed indicative sulphide concentrations in the leachates, the calculated sulphide amount in 30 mL of leachate and the evaluated amount initially present in the sample as sulphide and S03, the calculated percentage of leached sulphide from the evaluated initial amount. [*)Note! The detection limit is around 0.01 mg/L.]
leachant analysed S2" analysed S2
" initialS in leached Sin initial so3 in amount in 30 mL sample % of initial sample
[mg!L] mg mg mg
ALL-MR 270 8.1 51 16 290 OL-SR 170 5.1 - 11 - 10 - 11 -
ALL-MR 41 1.2 78 2 10 OL-SR 47 1.4 - 11 - 2 - 11 -
ALL-MR 170 5.1 174 3
OL-SR 240 7.2 245 3
ALL-MR 0.02 *) <1 0 2150 OL-SR 0.02 *) <1 0 - 11 -
ALL-MR 0 0 0 90 OL-SR 0 0 0 - 11 -ALL-MR 0 0 OL-SR 0 0
0 0 0 0
--------------------------~-~-~~--- ~ ~ ~-
22
The sulphide phases present in slag readily dissolved in the leachates and confirmed that sulphide in the leachates originated from slag. It is known that alkali and alkaline-earth metals react directly with sulphur and form principally ionic compounds, containing S2-ions. These sulphides are soluble in water and the anions are extensively hydrolysed; for example (Jolly 1966); S2- + H20 = HS- +OH- (K:::::1). In slag-containing mixes as slag hydrates more S2- is released into the aqueous phase. The presence of sulphide in the aqueous phase will poise the redox environment and give rise to reducing conditions (Atkins and Glasser 1992).
3.2.2 Total alkalinity
All the total alkalinity results with corresponding pH values obtained are presented together in Appendix 4 in sub-figures for each mix. Each sub-figure shows values in both the fresh (ALL-MR) and the saline (OL-SR) leachates; the points on the left of the line in the middle of each sub-figure are for ALL-MR and those on the right (the light blue area) are for OL-SR. The heading of each sub-figure indicates the mix involved. Figure A4-1 includes the results analysed in the equilibrium (EQ) leach test and Figure A4-2 those analysed both in the diffusion (DIFF) and equilibrium leach tests. Specimens cured at 50°C were tested for five mixes (12, f63, f64, w1, and w2) with both leachates and five mixes (52, 44, f63, w1 and L8) were subjected to both leach tests.
In this work it was not possible to analyse total alkalinity in all the leachates extracted, therefore just a few results are presented, especially in the case of diffusion testing. Diffusion testing was performed in both leachates with specimens cured at 20°C, but for four mixes (f63, w1 and 44) also the specimens cured at 50°C were partly included in testing.
The total alkalinity values mostly followed the trends observed for the pH values (increasing with increasing pH or vice versa), but in some cases the trends were the opposite; mixes f64, w2, S20 (ALL-MR, 20°C and 50°C). The changes in the alkalinity values seem more prominent than in pH due to the scales, pH is a logarithmic quantity.
Mix 52
• In EQ-testing (Fig. A4-2 a), App. 4) the total alkalinity values in ALL-MR varied between 38 and 50 mmol/L and in OL-SR between 39 and 42 mmol/L. Alkalinities in both leachates showed decreasing trends with time elapsed.
• In DIFF-test (Fig. A4-2 b), App. 4) after 600 mL of exchanged leachate the last alkalinity value in ALL-MR measured (33 mmol/L) was only slightly lower than in the EQ-test (1 04 mL exchanged), but duration of the last period in DIFF-test was rather long (38 d), which allowed more leaching of alkalis than during the period of more intense equifrequent exchanging (once a week). Another total alkalinity value was determined from the duplicate specimen after even a longer period (83 d) following the intense equifrequent exchanging. The total alkalinity had still increased up to 36 mmol/L. In ALL-MR the main alkaline element leached at high concentration was Ca (around 400 to 500 mg/L, Fig. A5-1, A pp. 5).
23
OPC-silica mixes
All these mixes showed only one equivalent point around pH 7 in titrations.
Mix 12
• Total alkalinity in EQ-test (Fig. A4-1 a, A pp. 4) was high in both leachates and for both curing temperature specimens; increasing from the initial 10 mmol/L up to about 27 mmol/L in four weeks of leaching. High alkalinity was expected, as the pH was also high varying between 12 and 12.5. Testing was stopped after 4 weeks
Mixf63 andf64
• These mixes were tested in both leachates with both curing temperature specimens. Notably lower total alkalinities in EQ-tests were obtained for these mixes in both leachates than for mix 12. The alkalinities varied between 1 and 4 mmol/L for mix f63 and between 1 and 3 mmol/L for mix f64 (Fig. A4-1 b) and c), A pp. 4) Lower alkalinities were measured in OL-SR. However, in the case of mix f64 the total alkalinities of both curing temperature specimens showed slightly increasing or at least constant value in ALL-MR even if the corresponding pH-values slightly decreased.
• Mix f63 was subjected to DIFF-testing and only a few alkalinity values were measured in both leachates for the lower curing temperature specimens (Fig. A4-2 f), App. 4). The alkalinity values in ALL-MR increased to about the same level (2.4 mmol/L) as in the equilibrium test after staying in the leachate for a longer period after the more intense equifrequent exchange period, while in OL-SR the values were a little lower, about 0.5 mmol/L.
Mix wl and w2
• These mixes were otherwise identical to f63 and f64, only the type of OPC was different, low alkali cement (Table 2.2). Also here both leachates and both curing temperatures were included in EQ-testing. The measured total alkalinities did not differ much from those obtained for the f-mixes. The alkalinities varied between 0.8 and 3 mmol/L for mix w1 and 0.8 and 3.6 mmol/L for mix w2 (Fig. A4-1 d) and e), App. 4). Mix w2 alkalinities showed a different behaviour as the total alkalinities increased with decreasing pH values and the alkalinity values at the end of testing were higher, especially in ALL-MR, than for mix w1 even if the SF/OPC ratio was higher.
• DIFF-testing of mix w1 was performed only with the lower curing temperature specimens in both leachates. The total alkalinity values were at the end slightly lower, 1.5 mmol/L in ALL-MR and 0.4 mmol/L in OL-SR (Fig. A4-2 h), App. 4) when compared with the results from EQ-testing.
Slag mixes
In alkalinity titration of these mixes two equivalent points were always present due to leached sulphide.
24
Mix44
• In EQ-testing the total alkalinity values were determined for both curing temperature specimens in both leachates. The obtained total alkalinities varied between 1.5 and 5.5 mmol/L (Fig. A4-2 c), App.4), slightly higher than for the fand w-mixes. One reason for the higher values could be sulphide. The alkalinities initially increased and thereafter gradually declined. However, deviating from the behaviour of all the other mixes similarly tested, the specimen cured at 50°C showed distinctly higher alkalinities in the saline OL-SR than the lower curing temperature specimen. Also in ALL-MR the alkalinity values show a similar behaviour at the end of EQ-testing.
• DIFF-test was performed only on the lower curing temperature specimen in both leachates. During the more intense exchange period the alkalinity values were slightly lower than in EQ-testing, about 2 mmol/L in ALL-MR and 0.4 mmol/L in OL-SR. But at the end of testing the alkalinity increased in ALL-MR even to a higher value, 4.6 mmol/L (Fig A4-2 d, App. 4), whereas in OL-SR it remained at the low value.
Mixes Sl4 and S20
• In EQ-testing of mix s 14 quite high alkalinity values were measured, about 19 mmol/L in ALL-MR and 12 mmol/L in OL-SR (Fig. A4-1 f, App.4). The high values resulted from high sulphide concentrations and testing was stopped.
• Mix S20 was another slag containing mix, which was subjected to EQ-test only using the lower curing temperature specimens in both leachates. The total alkalinity values varied between 2 and 6.5 mmol/L (Fig. A4-1 g, App.4) and showed an increasing trend in both leachates. Only after 15 weeks of leaching decreased alkalinity values (about 5 mmol/L) were measured in ALL-MR. However, the leachates had a yellowish tint indicating sulphide release.
MixL8
Both leaching tests were performed with the lower curing temperature specimens in both leachates.
• The total alkalinity values in EQ-tests varied between 1.5 and 3.5 mmol/L (Fig. A4-2 i, App. 4). The fresh leachate had a yellowish tint (Fig. 3.5) indicating the presence of sulphide but the analysed concentrations were very low (Table 3.1) near the detection limit of the method. In both leachates alkalinity showed a decreasing trend from the start, nicely following the pH trend.
• In DIFF-testing the obtained alkalinities showed an increasing trend in the very beginning in both (Fig. A4-2 j, App.4). However, only testing in ALL-MR was continued further and the last alkalinity values were slightly lower, about 1.5 mmol/L than in the EQ-test.
3.3 Diffusion test pH
Diffusion tests were performed on five mixes, 52, 44, f63, w1 and L8. During the actual diffusion testing the leachate was completely changed 25 times in the case of mixes f63,
25
44 and w1 and 20 times in the case of mixes 52 and L8. Thus the volume of leachate exchanged during testing was 750 mL or 600 mL in total. Because of practical reasons it was not possible to continue with a very frequent leachate exchange programme throughout the tests the exchange frequency had to be changed after the period of more intense exchanging to occur equifrequently once a week (last 8 or 9 categories).
After the last exchange of testing the specimens were left in the last leachate until the specimens of mixes 52, f63, 44 and L8 were withdrawn from the leachates and sent for analyses of the solids. The pH and total alkalinities in the last leachates were determined were additionally determined. When comparing the pH-values obtained in the case of mixes f63 and L8 the values decreased from the previous point measured (=last diffusion test point), even if the period between the measurements was long (157 d and 61 d, respectively). (Fig. A3-1 band e, App.3). This indicates that there was no potential left for an increase of pH in mixes f63 and L8. Whereas, in the case of mix 44 the pH value increased to -11.4 (during 158 d) which corresponded to the value measured in the equilibrium test (Fig. A2-1 b), App.2) and indicating potential left for pH to Increase.
3.3.1 Reference mix 52
Testing was performed only with specimens cured at 20°C in both leachates. The pH values measured (up to 70 days, Fig. A3-1 a), App. 3) vary after the initial increase between 12.1 and 12.6 in ALL-MR and between 12.0 and 12.3 in OL-SR. No trend of decreasing was observed during the testing period (79 days) when 600 mL of leachates had been used. After 108 days both specimen slices in ALL-MR were withdrawn from the last leach ate in which they had remained for 3 8 days. The pH was measured and was at the level of the previous value. The pH results in both leachates indicate that mix 52 owns a lot of potential to keep the pH at a high value.
3.3.2 OPC-silica mixes
Testing was performed with two mixes, f63 and w 1, and with specimens cured at both temperatures, 20°C and 50°C using both leachates. These mixes were quite identical in other respects but the type of OPC used (Table 2.2); in w1 it was low alkaline cement (Egyptian White Cement).
Testing of the higher curing temperature specimens was stopped earlier because the pH values approached or had reached the same value as the lower curing temperature specimens. In ALL-MR (20°C specimens) an initial increase was observed in the beginning of testing and only towards the end of testing the pH values gradually declined during the last equifrequent leach ate exchange period, Figures A3-1 b) and c), App. 3. The pH values for mix w1 were slightly lower than for mix 63, but both mixes qualified the target pH-value of 11 at the end of testing. The pH values in OL-SR were about 0.5 pH units lower than in ALL-MR and already from the beginning of testing well below 11, around 10.5. Similar declining trend at the end of testing was observed as in ALL-MR. The last values measured were about 9.7 and 9.5 for mix f63 and mix w1, respectively.
26
The specimens cured at 50°C showed different behaviour in respect with the specimens cured at 20°C. In ALL-MR for mix f63 the trend was increasing, whereas in OL-SR it slightly varied around 9.8 (Fig. A3-1 b, App 3). Between the two curing temperature specimens of mix w 1 differences in the pH values obtained were seen only in the very beginning of testing after which the pH values were quite the same. However, at the end of testing the pH values showed slightly increased values in both leachates in the higher temperature specimen leachates (Fig. A3-1 c, App 3).
3.3.3 Slag mixes
Leach testing of mix 44 was performed for specimens cured at both temperatures and in both leachates, while mix L8 was tested onlyt with specimens cured at 20°C in ALL-MR. For both mixes the pH values initially increased above 11 and remained around 11.3 in ALL-MR and between 10.2 and 10.5 in OL-SR without any clear trend (Figures A3-1 d) and e), App.3). The higher temperature specimens of mix 44 did not behave differently from the lower temperature ones.
3.4 Chemical analysis of leachates
The analysed substances were Na, K, Ca, Mg, Al, Si, er, sol-, SToT and Fe. Ion chromatography (IC) was used to determine er and sol- concentrations, K was determined by Flame Atomic Absorption Spectrometry (F AAS) and the rest by Inductively Coupled Plasma Atomic Emission Spectrometry (ICP-AES). The analyses were performed by VTT Processes analytic group. Details on the analytical methods are given in Table A10-1 in Appendix 10.
Before getting more leachate samples analysed a few were analysed for mixes 44, f63 and wl. The leachate samples were chosen from both leach tests. From DIFF-tests three samples of the fresh leachates for each mix were chosen; two from the start and one from the end. From EQ-tests two samples for each mix and both leachates were analysed. The analytical results are given in (Table 3.2) with the nominal compositions of the initial fresh (ALL-MR) and saline (OL-SR) leaching solutions. The notations below compare the analytical results mainly at the later stage of both tests.
• In all the leachate samples the results of Al and Fe were below the detection limits. Mg disappeared from the ALL-MR samples while in the OL-SR samples the concentrations greatly decreased from the initial :::::: 55 mg/L down to below 1 mg/L, and only in the case of mix w1 in the EQ-test Mg was at a level of 2 mg/L after 15 weeks. The pH in the leach ate samples was high enough (> 1 0) to precipitate brucite but absorption by CSH gel may also be possible.
• Increased sol- concentrations (initially :::::: 10 mg/L) were analysed in all the leachate samples. Only a slight increase was observed in the DIFF-test, but quite high in the EQ-test for both mix f63 leachates (after 15 weeks ::::::170 mg/L and 250 mg/L in ALL-MR and OL-SR, respectively), meanwhile in the DIFF-test with time elapsed the three mixes showed depletion of so4 2- down to about a same level (12-16 mg/L).
27
• Si concentrations in the leachate samples of both leach tests clearly increased from the initial concentration of the leachates (:::::: 0.8 mg/L in ALL-MR, none in OL-SR). In ALL-MR leachates the Si concentrations for mix 44 were about the same for the last analysis point of both leach tests ( ::::::23 mg/L) while mixes f63 and w1 showed higher concentrations in the EQ-test, (39 mg/L and 24 mg/L, respectively) than in the DIFF-test (23 mg/L and 7.4 mg/L, respectively). Whereas in the DIFF-test the saline leachates of all three mixes showed lower concentrations; 6.8 mg/L, 15 mg/L and 7.6 mg/L (44, f63 and w1, respectively).
Table 3.2 Analytical results of pre-analysis of a few leach solutions for three mixes, 44, f63 and w 1 from both leach tests. The topmost row gives the nominal compositions of the leachates, ALL-MR and OL-SR, and the second column from left (leach. mL) gives the total amount of leachate exchanged. ( < indicates below detection limit).
ALL-MR [mgll] => 8.80 1.10 52.5 3.9 5.1 0.7 0.8 9.6 52 - -OL-SS [mgll] => 8.30 0.04 4 800 21.0 4 000 55.0 - 4.2 14 600 - -
I test lle~~h · l Mix I pH Alkror Na K ea Mg Si s 504 Cl Fe AI
mmolll mall mall mall mall mall mall mall mall mall mall ALL-MR DIFF = 30 44 10.39 39 9.5 6.9 0.44 1.4 6.5 13 52 <0.05 < 1 DIFF = 60 44 10.74 43 11 7.4 0.4 0.7 8.3 17 53 <0.05 <1 DIFF :::: 720 44 11.15 2.06 54 10 21 <0.05 23 23 15 52 <0.05 < 1
DIFF = 30 f63 11.02 49 49 15 0.37 2.8 19 60 56 <0.05 <1 DIFF = 60 f63 11.15 38 32 12 0.24 1.8 16 65 54 <0.05 < 1 DIFF = 720 f63 11.03 42 7.3 20 <0.05 23 3.9 12 52 <0.05 <1
DIFF = 30 w1 10.77 52 11 15 0.49 2.9 6.9 20 53 <0.05 < 1 DIFF = 60 w1 10.96 22 3.8 5.8 0.17 0.8 3.8 25 56 <0.05 < 1 DIFF =720 w1 10.86 35 5.5 8.1 0.06 7.4 4.0 16 66 <0.05 < 1 ALL-MR EQ = 16 44 11.49 5.18 86 52 5.0 <0.1 28 45 43 68 <0.1 <2 EQ = 78 44 11.44 4.25 77 47 9.3 <0.1 23 34 32 55 <0.1 <2
EQ = 16 f63 11.24 3.00 72 150 55 <0.1 21 120 355 74 <0.1 <:;: EQ =78 f63 11.08 2.40 55 69 62 <0.1 39 58 169 58 <0.1 <:;:
EQ = 21 w1 11.36 2.81 57 31 14 <0.1 22 13 39 57 <0.1 <2 EQ = 78 w1 11.21 2.05 54 19 24 <0.1 24 7.7 24 56 <0.1 <2 OL-SR EQ = 16 44 10.73 2.56 4 700 120 4 200 0.71 8.4 31 24 12 700 <0.1 <10 EQ ::::78 44 10.69 2.10 4 700 120 4300 0.57 6.8 36 30 13 200 <0.1 <10
EQ = 16 f63 10.46 1.73 3 800 320 3 700 2.8 9.9 76 240 11 100 <0.1 <10 EQ =78 f63 10.05 0.91 4400 150 4 300 0.56 15 77 247 13 000 <0.1 <10
EQ = 21 w1 10.47 0.94 4 600 80 4 200 2.9 7.1 12 38 12 300 <0.1 < 10 EQ = 78 w1 10.14 0.73 4 800 52 4 300 2.0 7.6 9.6 29 13 300 <0.1 <10
• In both leach tests the lowest K content was analysed in mix w 1 leachates, indicating that in this respect the initial content of K in the cement used for
28
preparing the grout is reflected in the leachate concentration (f63 vs. w1 3). In
EQ-test the K concentrations were higher in OL-SR leachates than in ALL-MR leachates.
• er concentrations of the fresh leachate samples in both EQ- and DIFF-tests were of the same level as in the initial ALL-MR (:::::52 mg/L) except in the case of w1 DIFF-test, which showed a slightly increased content (::::: 66 mg/L). Whereas, in all the saline leachate samples the initial OL-SR concentration (::::: 14 600 mg/L) decreased to about 13 300 mg/L indicating diffusion of er into the grout specimens. Chloride can bind in Portland cement concrete by various mechanisms, e.g., by binding into AFm (Birnin-Yauri and Glasser 1998, Gascoyne 2002) or formation of calcium oxychlorides (Ca(OHh·CaCh·H20) (Brown and Bothe 2004 ), also binding by CSH phases is possible (Lagerblad and Tragardh 1995, Hirao et al. 2005).
• In both leach test theCa concentrations of the fresh leachates increased (initially ::::: 5 mg/L in ALL-MR), the highest concentration in DIFF-test was analysed for mix 44 (21 mg/1) whereas in EQ-test it was mix f63 (62 mg/L). In the saline leachates (initially 4 000 mg/L in OL-SR) all the mixes exhibited an increased value of 4 300 mg/L in EQ-test.
• Na concentration of the fresh leachates (initially :::::53 mg/L in ALL-MR) in DIFF-test for mix 44 was at the level of the initial value, whereas f63 and w1 leachates exhibited decreased concentrations ( 42 mg/L and 35 mg/L, respectively). Also in EQ-test with ALL-MR the leachates of f63 and w1 mixes showed lower concentrations (at the level of the initial ALL-MR) than mix 44 leachate (77 mg/L). In the saline leachates Na was decreased from the initial OL-SR content(::::: 4 800 mg/L) only in mix f63 leachate.
Later more leachates from the DIFF-tests were analysed, but only fresh leachates (ALLMR) and only for four mixes, 52, 44, f63 and L8. The analytical results of Fe were below the detection limit (0.02 mg/L) in all the samples analysed. All the results obtained are presented in Appendix 5, individually for each mix (mix 52 in Fig. A5-1, mix 44 in Fig. A5-2, mix f63 in Fig. A5-3 and mix L8 in Fig. A5-4) and are shown in sub-figures as histograms for each substance in mg/L, the pH-values measured are included as well. In addition to the individual histograms of substances S042
- and SToT are presented together in mmol/L in order to have commensurable quantities.
The target pH-value is depicted with a line (orange) across the pH histograms. A line (blue) across the other histograms indicates the concentration of that substance in the initial leachate (ALL-MR). But in the case of Al, which is not present in the initial leachate, the line (pink) depicts the detection limit of Al (0.1 mg/L, except for mix 52 1.0 mg/L). Furthermore, the two lines across in Mg histograms show the initial value of Mg in the leachate, the line (blue) at 0.7 mg/L, and the detection limit of Mg, the lower line (pink) at 0.02 mg/L. Table A5-2 in Appendix 5 gives the points in time (=category numbers in the histograms) when exchanges of leachates were done and how long the specimens remained in the leachates after completing the diffusion test part before the
3 mix f63 K20tot = 1.2 g/L of grout
mix w 1 K20tot = 0 g/L of grout
29
specimens were withdrawn from the leachate and sent to Japan for solid analyses. The last withdrawn leachates (on 25.10.04) were not analysed, but the pH values were determined before deep-freezing the solution samples and are depicted in the pH histograms as well.
Some trends have been emphasised with an arrow in the histograms, as there are some odd points that do not seem to fit the "obvious" trends, e.g., in Fig. A5-1 (Na, K, and Ca at categories 6, 8, and 19), or in Fig. A5-3 (Na, Ca, K, AI and Si at category 17). The deviations may be due to incomplete stirring of the system before withdrawing the leachate, which has resulted in inhomogeneous solution samples, because the entire amount of solution was not withdrawn at the same time but one sample vial was first filled after filtration for anion analyses and then another one for cation analyses and acidified. As SToT and sol- were not analysed from the same vial the amount of sulphide can not be directly obtained just by subtracting the SToT and so4 2-concentrations; erroneous or too high values may be obtained. An example of this is some of the questionably high SToT results measured for mix f63 when compared with the corresponding sol- results (Fig. A5-3, App.5), which most probably are false because sulphide analyses of two mix f63 leachates did not confirm the presence of S2
-
(Table 3.1). In the case of mix 52 the SToT concentration seems higher than SToT originating from sol-only (Fig. A5-1, A pp. 5), whether sulphide was present or not was not checked by analysing sulphide in the leachates.
There were also some problems of gel formation in some sample vials, which was discovered afterwards when some analytical results were checked for questionable values. The time elapsed between the leachate exchange points naturally affects the amount of substances entering or disappearing from the leachate, e.g. category 17 values in Fig. A5-3, especially the pH and cation contents when after a longer period the exchange of leachate was performed after two days only. Because of practical reasons it was not possible to continue with a very frequent leachate exchange programme like in the beginning but it had to be changed after a period of more intense exchanging to occur equifrequently once a week (last 8 or 9 categories).
All the results discussed below refer to the histograms in Appendix 5 unless otherwise referred to.
Na:
The level of Na leached was about the same in mixes 52 and L8 (category 5 discarded) around 80 mg/L which then gradually decreased to the level of the initial ALL-MR (- 52 mg/L), whereas mixes 44 and f63 showed no clear trends. The concentration of Na varied rather randomly; below the initial ALL-MR concentration (mix f63) or between about 52 and 60 mg/L (mix 44 ).
K:
In all the mixes the amount of K dropped off from the initially increased amount to the level initially in ALL-MR (- 4 mg/L) except for mix 44 it remained at a level of -9 mg/L. The highest amount of K was analysed fro mix 52(- 210 mg/L) but rather high ones also for mix f63 (- 60 mg/L). In the case of mixes L8 and 44 the highest K concentrations were around 20 mg/L and 18 mg/L, respectively.
30
Ca:
Highest amount of Ca was leached from the high pH mix 52 (up to - 520 mg/L), but a gradual decreasing trend was observed when the leachate exchange was equifrequent (the last 8 categories). Rather high concentrations were also analysed in mix L8 leachates; the trend was increasing (up to - 140 mg/L) then slightly dropping off at the end of testing. Rather similar trend was seen for the other slag mix ( 44 ), as well, but the highest concentration was only about 27 mg/L. Slightly higher Ca concentrations were reached in mix f63 leachates (about 35 mg/L) which also showed a decreasing trend at the end of testing.
Si:
When comparing the Si-histograms of the mixes the trend is increasing in all other mixes except mix 52, which on the contrary showed depletion of Si from the leachates. Mixes f63 and 44 showed rather similar concentration levels of Si in the leachates, little lower in mix 44, which is not as remarkable as the initial Si02 contents (Table 2.4) in the mixes did not differ so much. The lower content of Si in mix 44 corresponds well with the slightly lower initial content of Si in mix 44 than mix f63.
Mg:
The small amount of Mg (0.7 mg/L) present in the initialleachate gradually depleted from the leachates of each mix. Depletion below the detection limit (0.02 mg/L) occurred at the very beginning of testing in the high-pH leachates of mix 52. The leachate pH values are high enough to precipitate brucite (Mg(OH)2).
Al:
The analysed aluminium concentration was below the detection limit (1.0 mg/L) in mix 52 leachates, whereas the highest amount (- 4 mg/L) was analysed in mix L8 leachates, which also had the highest initial content of Ah03 (Table 2.4 ). The amount of AI in the leachates increased in the beginning of testing and in the long run gradually decreased. In the case of mixes f63 and 44 the Al-leachate histogram patterns seem to follow, more or less, the same pattern with K histograms, and in mix 44 also the pattern of Ca histogram while in mix L8 leachates the similarity is lacking.
Cl:
Chloride results varied rather randomly, but in the case of mixes 52 and f63 there seems to be a slightly increasing trend. The origin of high Na and Cl in category 5 in mix L8 histograms is not clear.
S04, Srorand S2":
Sulphide has been dealt with already in section 3 .2, but sulphate is a potential source of sulphide produced by sulphate reducing bacteria (SRB), which have been detected in deep bedrock and therefore large quantities of sulphate are preferably avoided.
In the leachates of two mixes, f63 and L8, sulphate was present; for mix L8 in high increasing concentrations up to - 330 mg/L after which slight decrease was observed, and for mix f63 decreasing concentrations (from -70 mg/L) down to the level of ALL-MR followed after the fast increase in the beginning. In the case of mix 52 the initial leachate content of sulphate (- 9.6 mg/L) was depleted to a level of about 2-3 mg/L. Some depletion occurred in the case of mix 44, as well, but in a few categories
31
(1, 2, 9, 15 and 24) the S04 content exceeded that of the initialleachate. For mix 44 the Cl and S04 histogram patterns followed each other but did not in the case of the other mixes.
General remarks:
By comparing the histogram patterns with each other for a mix it can be stated that;
• For mix 52 (Fig A5-1) the histogram patterns of Na, Ca, K and SToT are quite similar even if there are great concentration differences between the substances. However, similar declining as in the case of Na, Ca and K is not observed in the histogram of pH. It seems that the amount of alkalis in the leachate easily keeps the pH at a high value.
• For mix f63 (Fig. A5-3) the patterns of K, Al and S04 histograms follow each other very well and show early release, while Ca pattern differs slightly and shows later release, but all gradually decline towards the end of testing. A similar declining trend is also seen in the pH histogram.
• For mix 44 it is more difficult to see similar patterns in the histograms because of the variations, but Ca, K and Al seem to follow each other whereas Cl and S04 seem to have a different pattern. The pH histogram shows declining at the end of testing (last category is not included in the equifrequent period).
• For mix L8 similar histogram patterns are seen in the case of Ca and S04.
Cau Dit Coumes et al. (2004) have shown that the equilibrium pH of the pore solution mostly depends on the silica content of the binding whatever the added pozzolan is, because the added silica lowers the Ca/Si ratio in CSH and thereby enhances sorption of alkalis and decrease of the equilibrium pH of the pore solution. The leachate pH results were examined also in this respect.
For the four mixes subjected to diffusion testing the Ca/Si molar ratios in the analysed leachates were calculated and plotted with the corresponding pH values measured (Figure 3.7). TheCa/Si ratio in mix f63 and 44 leachates decreased from about 0.4 and 0.3, respectively down to about 0.1 at the end of testing. Mix L8 leachates showed about 100 times higher ratio values.
Table 3.3 gives the leachate pH values measured after the same time (=same amount of leachate) of leach testing in both leach tests. The order of mixes is arranged by the decreasing ratio of Ca/Si (mol/mol), the slag-based mixes are shown with italics and shaded cells, the other values are for the OPC-silica mixes. In the table there are missing values and some deviations in the measurement times, because a complete leach testing was not always conducted. A decreasing trend of the pH values in the EQ-test ALL-MR leachates followed the decreasing trend of the Ca/Si ratio of the initial OPC-silica mixes, but the slag mix results deviated from this trend and the reason for this was the leached sulphide from slag. An opposite trend, by about 0.2 pH units, was observed in OL-SR between two mixes, w1 and f63, in both leach tests, as well as in ALL-MR in the DIFF-test.
6000
5000
4000
~ 3000 0
2000
0 0
60
50
40
~ 30 0
20
10
0 0
Figure 3.7
Table 3.3
Mix
Ref52 L8 12 w1 f63 44
w2 f64 S14 S20
2
2
32
mix 52 mix f63 12.7
0.60 11.50
12.5 0.50 11.30
12.3 0.40 11.10
12.1 0.30 10.90 ~
11.9 0.20 10.70
11.7 0.10 10.50
11.5 0.00 10.30 4 6 8 10 12 14 16 18 20 22 0 2 4 6 8 10 12 14 16 18 20 22 24 26
4
mix L8 mix44 11.50 0.60 11.50
11.30 0.50 11.30
11.10 0.40 11.10
10.90 0.30 10.90 :a - 10.70 0.20 10.70
10.50 0.10 10.50
10.30 0.00 10.30 6 8 10 12 14 16 18 20 22 0 2 4 6 8 10 12 14 16 18 20 22 24 26
-*- Ca/Si -o.- pH
The four sub-figures give the calculated Ca/Si molar ratios in the leachates (primary y-axis) with the corresponding pH values (secondary y-axis) for the four mixes (sub-figure title) from DIFF-test. The x-axis indicates each leachate exchange point (Table AS-2, App. 5).
Leachate pH values measured of the mixes tested. The order is by decreasing ratio of Ca/Si (second column from the left) of the mixes. The slag containing mixes are shown in italics with shaded cells and the OPC-silica mixes without shading. Leach time and amount are given with one column in between the pH values of both leachates unless otherwise indicated. *) By decision leach testing was stopped at this point.
Ca/Si EQ-pH DIFF-pH
ALL-MR leach time (w) I OL-SR ALL-MR leachant
OL-SR amount
mol/mol pH amount (mL) pH pH mL pH 2.32 12.4 + lOw I 52 12.2 *)3w 12.3 600 12.1 2.25 11.0 lOw I 52 10.5 *)3w 11.2 600 10.2 1.35 12.3 lOw I 52 12.0 0.85 11.4 lOw I 52 10.1 10.9 600 9.8 0.82 11.1 1lr lOw I 52 10.3 11.1 600 10.1 0.81 11.5 lOw I 52 10.7 11.2 600 10.3 0.67 10.8 12w I 62 9.8 0.65 10.7 lOw I 52 9.7 0.60 10.5 *)2w I 10.4 9.9 0.57 11.1 ,. lOw I 52 10.2 *)3w
33
4 RESULTS FROM SOLID ANAL VSES
In order to gain more information on the changes occurring in the leached solids during leach testing some solids were sent for analysing to Japan, where CRIEPI (Central Research Institute of Electric Power Industry) performed the analyses (lmoto et al. 2005). The mixes chosen for solids analyses were 44, f63, L8 and 52. The amount of solids available for analyses was just two specimen slices of each mix type and the initial mix. In order to minimise the effects of C02 during transportation to Japan, the specimens were packed inside the glove-box. The specimen slices (diffusion tested) were extracted from the leachate and placed into small plastic bags (each type in its own bag), closed inside a plastic jar, which was then placed inside a bigger Teflon jar and the space between was filled with molecular sieve. The initial specimen from the refrigerator were taken into the glove-box and packed similarly.
Analyses were performed both on leached (diffusion test) and unleached solid samples. The unleached solid samples had been kept in a refrigerator in steel vessels (Fig. A 1, App 1) under N2 (periodical N2 flushing of the vessels) ever since curing was completed.
Before performing the analysis one of the specimen slices of the two had to be cut with a diamond cutter (ethanol as cooling liquid) in suitable parts for the analysing methods, Figure 4.1 (right disk) and the other disk was ground. Before XRD analyses the specimens were dried by an aspirator for 24h and ground, whereas for the other analyses drying was performed by D-dry (dried at equilibrium vapour pressure of -80°C) for 24h.
Figure 4.1
I
I 28. 4ntn ~-------------------
1 I
I I
28. 4ntn ~-------------------
Specimen for XRD, XRF. TG-DTA. Porosimetory and SEM
A scheme of the cutting of a specimen for the different analyses.
Qualitative phase analyses were performed by XRD (X-Ray Diffractometry), the chemical composition was analysed by XRF (X-Ray Fluorescence) and the amount of Ca(OHh in the solids by TG-DTA (Thermo Gravimetric-Differential Thermal Analysis). EPMA (Electron Probe Microanalysis) was used in analysing the profile of C/S ratio, sample surfaces were surveyed with SEM (Scanning Electron Microscopy) and the pore structure was analysed using MIP (Mercury Intrusion Porosimetry).
4.1 XRD results
The qualitative phase analysis results are gathered in Table 4.1 and the XRD patterns are shown in Figure 4.1.
--------------------------------------------- ·--·· -- -
34
The most prominent characteristic of the low-pH cementitious grouts (mix f63, 44 and L8) was that there was no Ca(OH)2 in the hydrated paste, neither could any differences be seen between the initial and leached specimens. Ca(OHh was only detected in mix 52, in both initial and leached specimens, but the intensity of the Ca(OHh peak decreased in the leached specimens. The amount of Ca(OHh decreased from 14.9 g/100mL (16.1 mass%) to 10.6 g/100mL (12.8 mass%), as determined by TG-DTA analysis, the dimension is the mass per unit volume of specimens calculated from the following equation;
C = C 0 (1 00 - LO I) x a 100 bulk where, C = amount of Ca(OHh (g/100mL
Co = amount of Ca(OHh (mass%) LOI = loss on ignition at 1000°C ah"'" = bulk density measured by MIP(g/cm3
)
The unhydrated cement clinker phase, C4AF, was detected only in mixes 52 and L8. Other unhydrated cement clinker phases or gypsum (CaS04·H20) were not detected. Ordinary Portland cement contains about 7% C4AF, which has lower reactivity than other clinker phases such as C3S. No peaks of unhydrated cement clinker phases or gypsum were detected in mixes f63 and 44.
Table 4.1 Results of qualitative phase composition by powder XRD.
Cement Initial/ Hydration products C4AF
Calcite type Altered AFt AFm CH C-S-H (CaC03)
Initial ++ (+) - ++ - (+) f63
Altered ++ (+) - ++ - (+) Initial + ++ - ++ - (+) 44
Altered (+) ++ - ++ - (+)
52 Initial ++ (+) +++ ++ + (+)
Altered ++ (+) ++ ++ + (+) Initial +++ - - ++ + -
L8 Altered +++ - - ++ + -
- not detected (+) very week + weak ++ medium +++ strong
AFt (Ah0rFe20rtri) = Ettringite, 3CaO·Ah03·3CaS04·3·2H20 AFm(Ah0rFe20rmono) = 3CaO·Ah03·CaX·nH20 (X=S04, C03 or (OHh) CH= Calcium Hydroxide (Ca(OH)2)
AFt was present in all specimens, but the most prominent AFt peaks (Fig.4.1) were observed for mix L8 without major loss of intensity after leaching. Whereas the slag mix 44 showed only a rather small peak, which lost intensity due to leaching. Rather broad peak of AFm with little intensity was observed in all other mixes spectra but mix L8, and leaching seemed not to have a great effect. In the case of mixes 52 and L8 also small C4AF peaks were present and the intensity did not decrease by leaching.
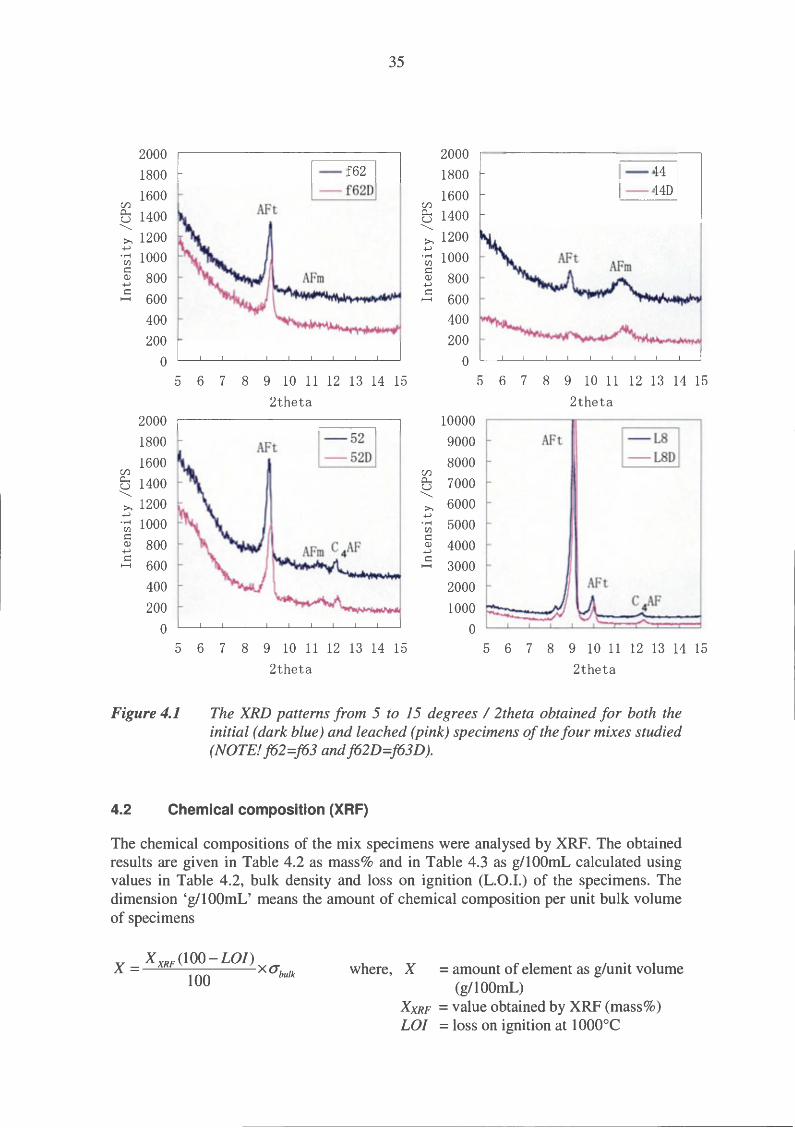
35
2000 2000
1800 ~ 1800 ~ 1600 D 1600 D (/) (/)
0..... 1400 0..... 1400 u u ............ ............
:>, 1200 :>, 1200 +-l +-l
·~ 1000 ·~ 1000 c c Q) 800 Q) 800 +-l +-l c
600 c
600 r--1 r--1
400 400
200 200
0 0 5 6 7 8 9 10 11 12 13 14 15 5 6 7 8 9 10 11 12 13 14 15
2theta 2theta 2000 10000
1800 AFt ~ 9000 AFt ~ 1600 D 8000 D (/) (/) 0..... 1400 0..... 7000 u u ............ ............
:>, 1200 :>, 6000 +-l +-l
·~ 1000 •r-i 5000 [/J
c c Q) 800 Q) 4000 +-l +-l c
600 c
3000 r--1 r--1
400 2000
200 1000 0 0
5 6 7 8 9 10 11 12 13 14 15 5 6 7 8 9 10 11 12 13 14 15 2theta 2theta
Figure 4.1 The XRD patterns from 5 to 15 degrees I 2theta obtained for both the initial (dark blue) and leached (pink) specimens of the four mixes studied (NOTE! f62=f63 andf62D=f63D).
4.2 Chemical composition (XRF)
The chemical compositions of the mix specimens were analysed by XRF. The obtained results are given in Table 4.2 as mass% and in Table 4.3 as g/lOOmL calculated using values in Table 4.2, bulk density and loss on ignition (L.O.I.) of the specimens. The dimension 'gllOOmL' means the amount of chemical composition per unit bulk volume of specimens
X= X xRF(100- LOI) xo-100 bulk
where, X = amount of element as g/unit volume (g/100mL)
XxRF = value obtained by XRF (mass%) LOI =loss on ignition at 1 oooac
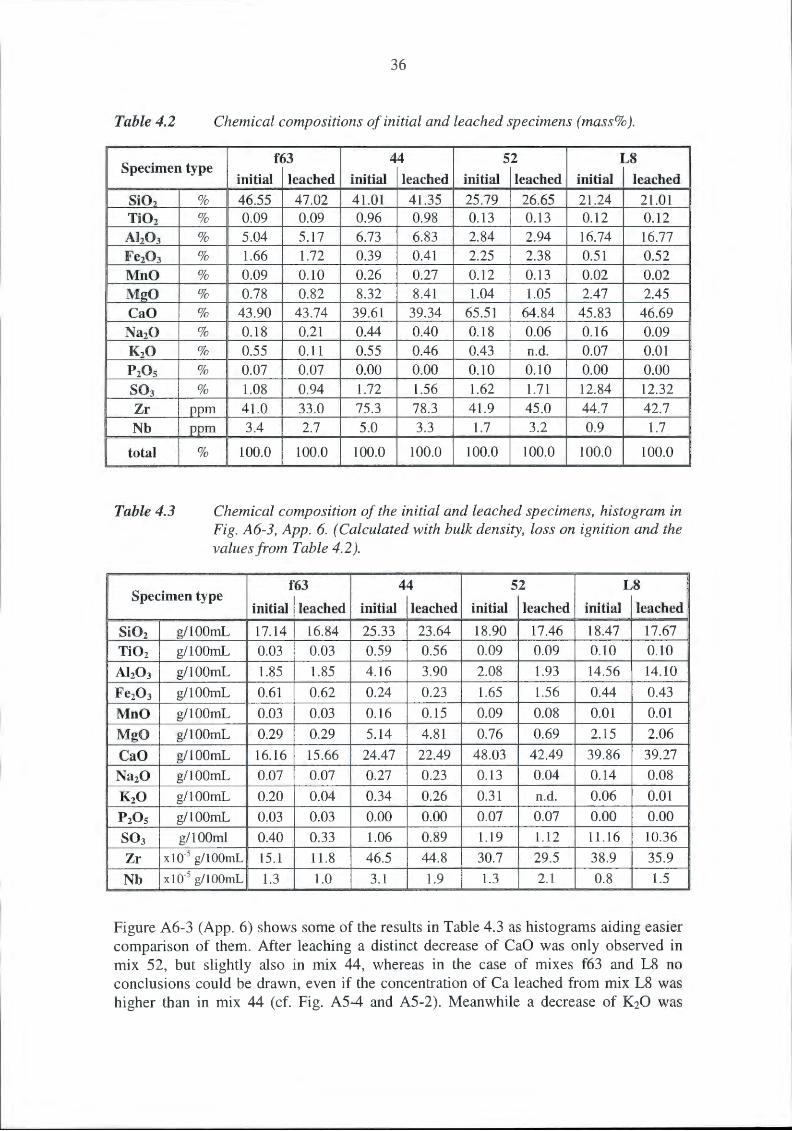
36
Table 4.2 Chemical compositions of initial and leached specimens (mass%).
Specimen type f63 44 52 LS
initial leached initial leached initial leached initial leached
Si02 % 46.55 47.02 41.01 41.35 25.79 26.65 21.24 21.01
Ti02 % 0.09 0.09 0.96 0.98 0.13 0.13 0.12 0.12
Ah03 % 5.04 5.17 6.73 6.83 2.84 2.94 16.74 16.77
Fe203 % 1.66 1.72 0.39 0.41 2.25 2.38 0.51 0.52
MnO % 0.09 0.10 0.26 0.27 0.12 0.13 0.02 0.02
M gO % 0.78 0.82 8.32 8.41 1.04 1.05 2.47 2.45
CaO % 43.90 43.74 39.61 39.34 65.51 64.84 45.83 46.69
Na20 % 0.18 0.21 0.44 0.40 0.18 0.06 0.16 0.09
K20 % 0.55 0.11 0.55 0.46 0.43 n.d. 0.07 0.01
P20s % 0.07 0.07 0.00 0.00 0.10 0.10 0.00 0.00
so3 % 1.08 0.94 1.72 1.56 1.62 1.71 12.84 12.32
Zr pp m 41.0 33.0 75.3 78.3 41.9 45.0 44.7 42.7
Nb pp m 3.4 2.7 5.0 3.3 1.7 3.2 0.9 1.7
total % 100.0 100.0 100.0 100.0 100.0 100.0 100.0 100.0
Table 4.3 Chemical composition ofthe initial and leached specimens, histogram in Fig. A6-3, App. 6. (Calculated with bulk density, loss on ignition and the values from Table 4.2 ).
f63 44 52 LS Specimen type
initial leached initial leached initial leached initial leached
Si02 g/100mL 17.14 16.84 25.33 23.64 18.90 17.46 18.47 17.67
Ti02 g/100mL 0.03 0.03 0.59 0.56 0.09 0.09 0.10 0.10
Ah03 g/100mL 1.85 1.85 4.16 3.90 2.08 1.93 14.56 14.10
Fe203 g/100mL 0.61 0.62 0.24 0.23 1.65 1.56 0.44 0.43
MnO g/100mL 0.03 0.03 0.16 0.15 0.09 0.08 0.01 0.01
M gO g/100mL 0.29 0.29 5.14 4.81 0.76 0.69 2.15 2.06
CaO g/100mL 16.16 15.66 24.47 22.49 48.03 42.49 39.86 39.27
Na20 g/100mL 0.07 0.07 0.27 0.23 0.13 0.04 0.14 0.08
K20 g/100mL 0.20 0.04 0.34 0.26 0.31 n.d. 0.06 0.01
P20s g/100mL 0.03 0.03 0.00 0.00 0.07 0.07 0.00 0.00
so3 g/100ml 0.40 0.33 1.06 0.89 1.19 1.12 11.16 10.36
Zr x 1 o-5 g/1 oomL 15.1 11.8 46.5 44.8 30.7 29.5 38.9 35.9
Nb x10-5 g/100mL 1.3 1.0 3.1 1.9 1.3 2.1 0.8 1.5
Figure A6-3 (App. 6) shows some of the results in Table 4.3 as histograms aiding easier comparison of them. After leaching a distinct decrease of CaO was only observed in mix 52, but slightly also in mix 44, whereas in the case of mixes f63 and L8 no conclusions could be drawn, even if the concentration of Ca leached from mix L8 was higher than in mix 44 (cf. Fig. A5-4 and A5-2). Meanwhile a decrease of K20 was
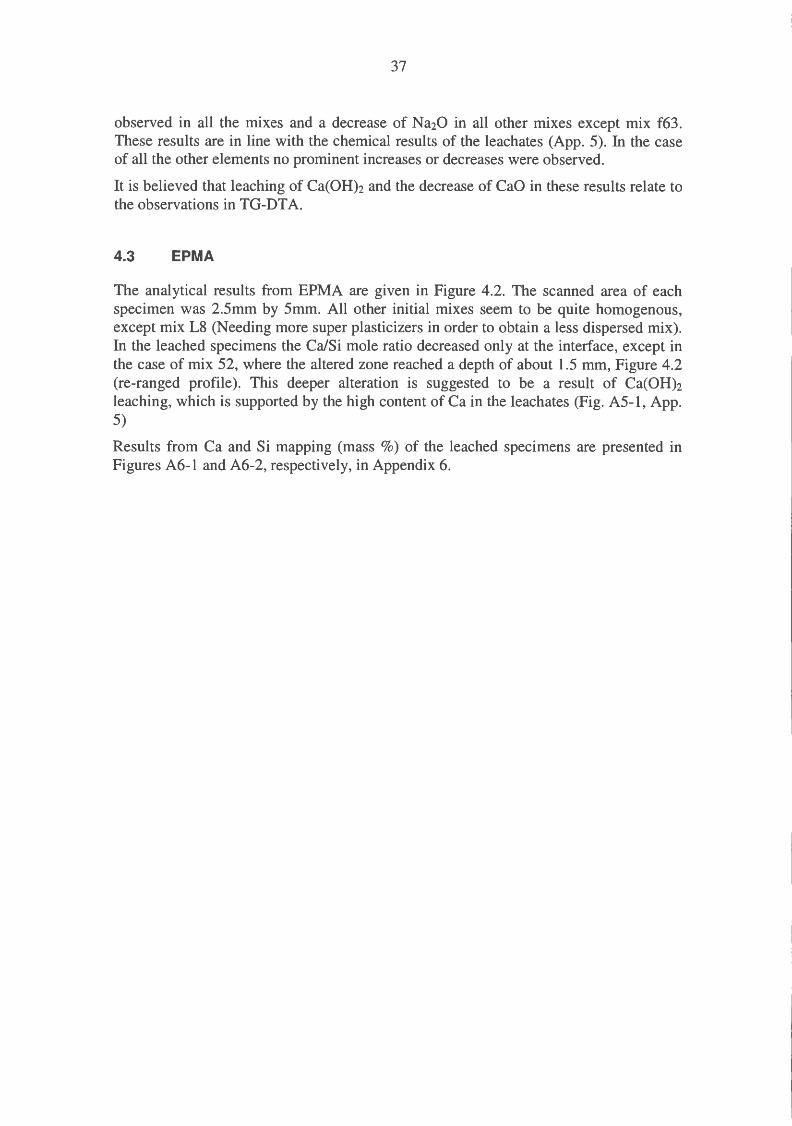
37
observed in all the mixes and a decrease of Na20 in all other mixes except mix f63. These results are in line with the chemical results of the leachates (App. 5). In the case of all the other elements no prominent increases or decreases were observed.
It is believed that leaching of Ca(OHh and the decrease of CaO in these results relate to the observations in TG-DTA.
4.3 EPMA
The analytical results from EPMA are given in Figure 4.2. The scanned area of each specimen was 2.5mm by 5mm. All other initial mixes seem to be quite homogenous, except mix L8 (Needing more super plasticizers in order to obtain a less dispersed mix). In the leached specimens the Ca/Si mole ratio decreased only at the interface, except in the case of mix 52, where the altered zone reached a depth of about 1.5 mm, Figure 4.2 (re-ranged profile). This deeper alteration is suggested to be a result of Ca(OHh leaching, which is supported by the high content of Cain the leachates (Fig. A5-1, A pp. 5)
Results from Ca and Si mapping (mass %) of the leached specimens are presented in Figures A6-1 and A6-2, respectively, in Appendix 6.
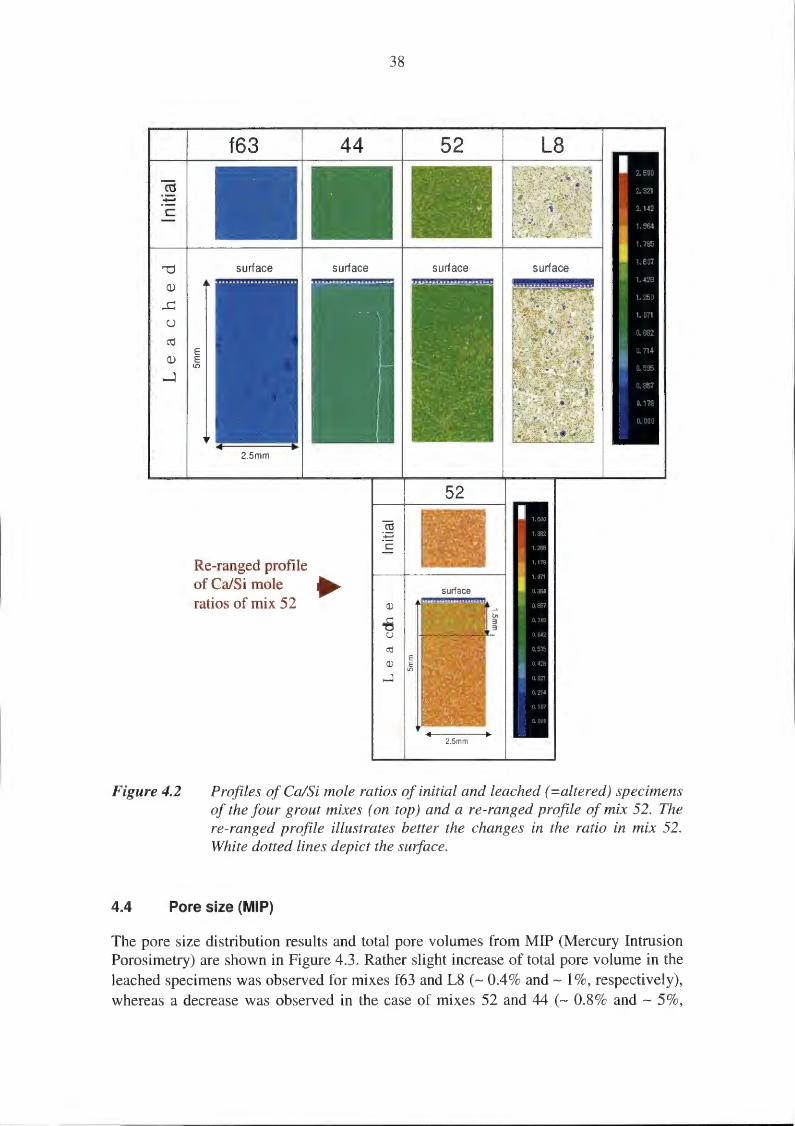
c
Figure 4.2
E E
LO
38
Re-ranged profile of Ca/Si mole ratios of mix 52
Profiles of Ca/Si mole ratios of initial and leached (=altered) specimens of the four grout mixes (on top) and a re-ranged profile of mix 52. The re-ranged profile illustrates better the changes in the ratio in mix 52. White dotted lines depict the surface.
4.4 Pore size (MIP)
The pore size distribution results and total pore volumes from MIP (Mercury Intrusion Porosimetry) are shown in Figure 4.3. Rather slight increase of total pore volume in the leached specimens was observed for mixes f63 and L8 (- 0.4% and - 1%, respectively), whereas a decrease was observed in the case of mixes 52 and 44 (- 0.8% and- 5%,
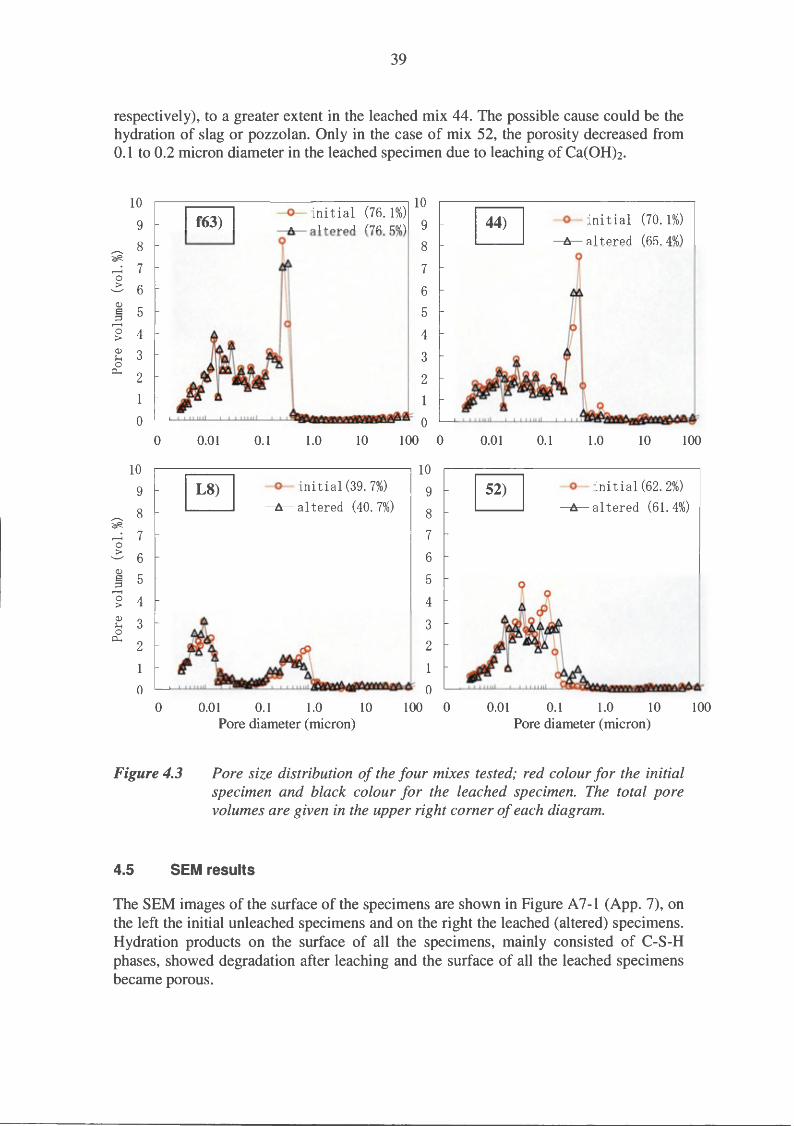
39
respectively), to a greater extent in the leached mix 44. The possible cause could be the hydration of slag or pozzolan. Only in the case of mix 52, the porosity decreased from 0.1 to 0.2 micron diameter in the leached specimen due to leaching of Ca(OH)2.
10
9
_.._ 8 C::f2..
,.......; 7 0
2- 6
~ 5 ;::::3
,.......;
~ 4 ~ 3 0
0... 2
0
~------------------------~ 10 ~ -O- initial (76.1%) ~ -A-altered (76. 5%) 9
8
7
6
5
4
3
2
1
~~~~~~~--------~ 0
-O- initial (70. 1%)
-A-altered (65. 4%)
0 0.01 0.1 1.0 10 100 0 0.01 0.1 1.0 10 100
10
9
_.._ 8 C::f2..
,.......; 7 0
2- 6 Q)
3 5 ,.......;
~ 4 ~ 3 0
0... 2
1
0
~------------------------~ 10 IL8)l ---0-- initial (39. 7%) 9 L:J -A-altered (40. 7%) 8
7
6
5
4
3
2
1
~~~~~~~~~--~~ 0
0 0.01 0.1 1.0 10 100 0 Pore diameter (micron)
---0-- initial (62. 2%)
-A-altered (61. 4%)
0.01 0.1 1.0 10 Pore diameter (micron)
Figure 4.3 Pore size distribution of the four mixes tested; red colour for the initial specimen and black colour for the leached specimen. The total pore volumes are given in the upper right corner of each diagram.
4.5 SEM results
The SEM images of the surface of the specimens are shown in Figure A 7-1 (A pp. 7), on the left the initial unleached specimens and on the right the leached (altered) specimens. Hydration products on the surface of all the specimens, mainly consisted of C-S-H phases, showed degradation after leaching and the surface of all the leached specimens became porous.
100
40
Very similar net-like structures were seen on the surfaces of the initial specimens of mixes f63 and 52 (Fig. A 7-1 a and c, A pp. 7). In the case of mixes f63 and 52 the structure was caused by the high water to binder ratio. The morphology of the C-S-H phases transformed to ball-like shapes after leaching in mix f63, whereas plate- and block-like crystalline structures of Calcite (Ca and C were detected by the EDX) were seen in the case of mix 52. The differences between the altered surfaces after leaching in mixes f63 and 52 are believed to be caused by the different pHs of the leachates, high (about 12.3) in the case of mix 52 and lower (around 11.0) in the case of mix f63. At the higher pH in mix 52 leachate the main species of the carbonate system is C03
2-, which
will produce Calcite with the high concentration of Ca leached.
The surfaces of the initial specimens of the two slag mixes, 44 and L8, (Fig. A 7-1 b) and d), App. 7) showed similar morphologies. The surface was smoother compared to the net-like structure of the OPC-SF systems (mixes f63 and 52). The smoother surface is believed to result from the reactions with slag. The surface of the leached mix 44 specimen shows in the center of the image slag that has not reacted covered by degraded C-S-H. Also in the image of the initial specimen (mix 44) not reacted slag was observed.
In the leached specimen of mix L8, remaining needle-like formations of AFt phase (Ettringite) were observed
41
5 MODELLING
5.1 Modelling of leaching
5.1.1 Theoretical
A widely used mathematical model to describe the leaching of a solubility-limited substance, such as calcium, from a cementitious material is the pseudo-steady-state shrinking core model (SCM) (e.g. Paul and McSpadden, 1976). According to this model, the cumulative leached amount, Q(t) (mol/m2
), is given by
Q(t) = ~2DAcs Ji, (5-1)
where D is the diffusion coefficient (m2/s ), A is the initial concentration in the solid (mol/m3
), and cs (<<A) is the solubility of the substance (mol/m3). The position of the
leaching front, X(t), is given by the expression,
(5-2)
Knowing ~ (2DAcs) from fitting the SCM (Eqn. 5-l) to experimental data, the time required for the leaching front to reach a specific location within the specimen is easily calculable from Eqn. 5-2, with Des taken as a parameter. The diffusive flux, F(t) (mol/m2/s ), into the solution phase is given by
F(t) = Q'(t) = ~2DAc, }r . (5-3)
For certain highly soluble substances, such as alkaline elements (Na, K), the initial inventories could be leached virtually in their entirety during the experimental time. The assumptions leading to the SCM (Eqn. 5-l) are then no longer valid and, therefore, an alternate leaching model with much stronger time dependence was used to explain the experimental data for the leached fraction,f(t) ([0,1]), for these substances,
f(t) =~ ~ 1 {l-ex [ (2n-1)21l2Dt]} 1l2 ~(2n-1)2 p L2
' (5-4)
where L is the length of the specimen (m). Eqn. 5-4 is calculated from Eqn. 4.17 in Crank (1975). The diffusive flux, F(t) (mol/m2/s), through one end of the specimen is given by
F(t) = 4Dc0 fexp[- (2n-1)2
21l
2Dt],
L n=l L (5-5)
where c0 is the initial concentration in the specimen (mol/m3), corresponding to A in
Eqn. 5-1. At large t, Eqn. 5-5 reduces to
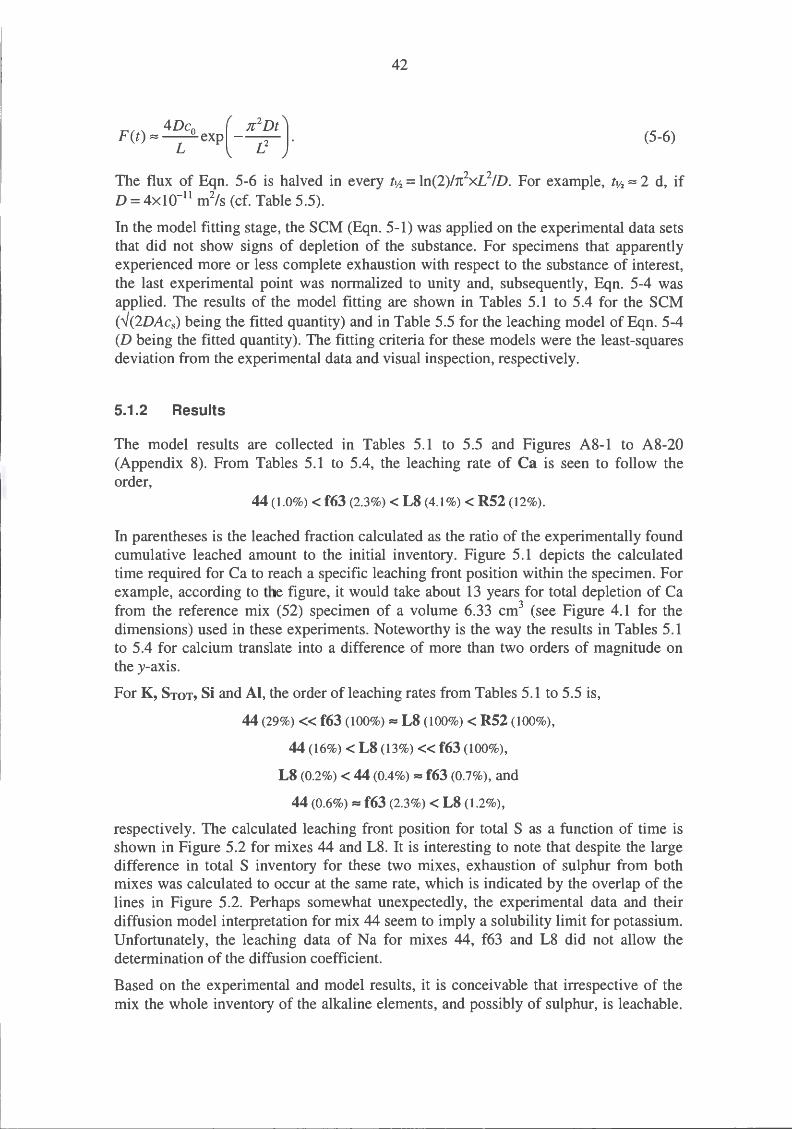
42
4Dc0 ( 7!2 DtJ F(t)~--exp --- .
L L2 (5-6)
The flux of Eqn. 5-6 is halved in every t•;2 = ln(2)/rr?x.L2/D. For example, tYz ~ 2 d, if D = 4x10-11 m2/s (cf. Table 5.5).
In the model fitting stage, the SCM (Eqn. 5-1) was applied on the experimental data sets that did not show signs of depletion of the substance. For specimens that apparently experienced more or less complete exhaustion with respect to the substance of interest, the last experimental point was normalized to unity and, subsequently, Eqn. 5-4 was applied. The results of the model fitting are shown in Tables 5.1 to 5.4 for the SCM (..J(2DAcs) being the fitted quantity) and in Table 5.5 for the leaching model of Eqn. 5-4 (D being the fitted quantity). The fitting criteria for these models were the least-squares deviation from the experimental data and visual inspection, respectively.
5.1.2 Results
The model results are collected in Tables 5.1 to 5.5 and Figures A8-1 to AS-20 (Appendix 8). From Tables 5.1 to 5.4, the leaching rate of Ca is seen to follow the order,
44 (1.0%) < f63 (2.3%) < L8 (4.1 %) < R52 (12%).
In parentheses is the leached fraction calculated as the ratio of the experimentally found cumulative leached amount to the initial inventory. Figure 5.1 depicts the calculated time required for Ca to reach a specific leaching front position within the specimen. For example, according to the figure, it would take about 13 years for total depletion of Ca from the reference mix (52) specimen of a volume 6.33 cm3 (see Figure 4.1 for the dimensions) used in these experiments. Noteworthy is the way the results in Tables 5.1 to 5.4 for calcium translate into a difference of more than two orders of magnitude on they-axis.
ForK, SToT, Si and AI, the order of leaching rates from Tables 5.1 to 5.5 is,
44 (29%) << f63 (100%) = L8 (100%) < R52 (100%),
44 (16%) < L8 (13%) << f63 (lOO%),
L8 (0.2%) < 44 (0.4%) = f63 (0.7%), and
44 (0.6%) = f63 (2.3%) < L8 (1.2%),
respectively. The calculated leaching front position for total S as a function of time is shown in Figure 5.2 for mixes 44 and L8. It is interesting to note that despite the large difference in total S inventory for these two mixes, exhaustion of sulphur from both mixes was calculated to occur at the same rate, which is indicated by the overlap of the lines in Figure 5.2. Perhaps somewhat unexpectedly, the experimental data and their diffusion model interpretation for mix 44 seem to imply a solubility limit for potassium. Unfortunately, the leaching data of Na for mixes 44, f63 and L8 did not allow the determination of the diffusion coefficient.
Based on the experimental and model results, it is conceivable that irrespective of the mix the whole inventory of the alkaline elements, and possibly of sulphur, is leachable.
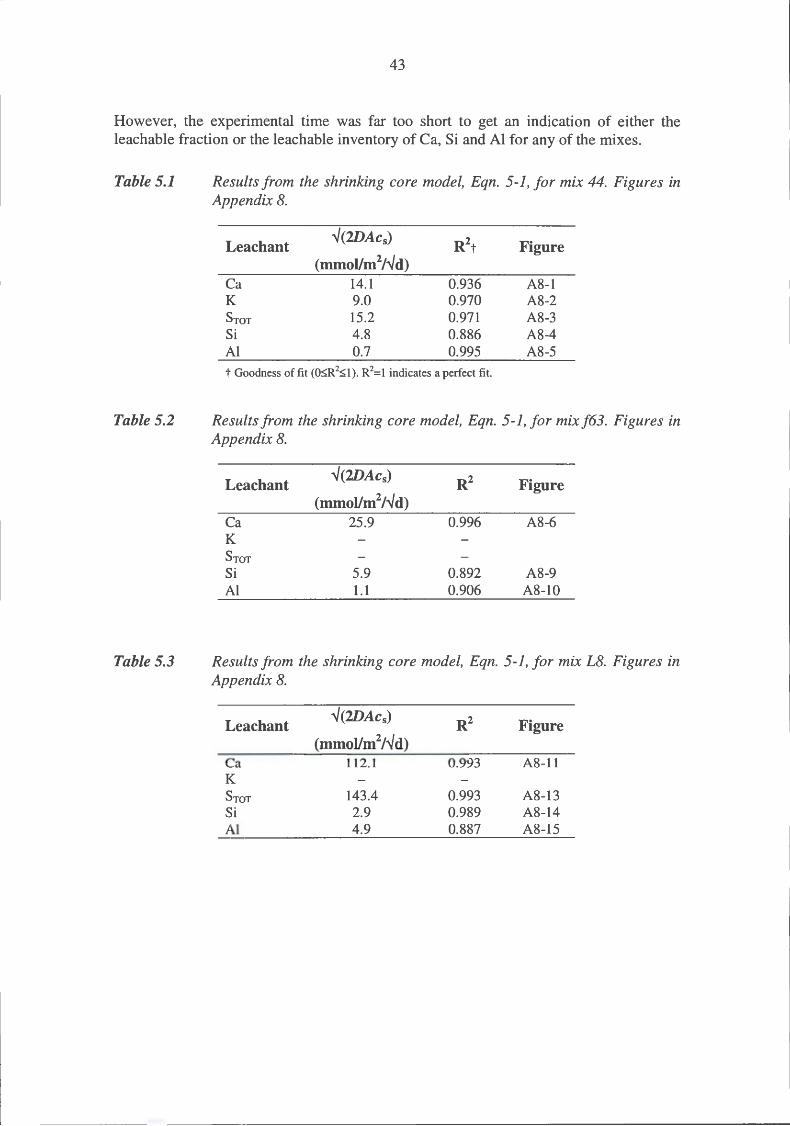
43
However, the experimental time was far too short to get an indication of either the leachable fraction or the leachable inventory of Ca, Si and AI for any of the mixes.
Table 5.1
Table 5.2
Table 5.3
Results from the shrinking core model, Eqn. 5-1, for mix 44. Figures in Appendix 8.
Lea chant V(2DAcs)
R2t Figure (mmollm2/vd)
Ca 14.1 0.936 A8-1 K 9.0 0.970 A8-2 SToT 15.2 0.971 A8-3 Si 4.8 0.886 A8-4 AI 0.7 0.995 A8-5
t Goodness of fit (O~R2~1). R2=1 indicates a perfect fit.
Results from the shrinking core model, Eqn. 5-1, for mix f63. Figures in Appendix 8.
Lea chant V(2DAcs) R2 Figure
(mmol/m2/Vd) Ca 25.9 0.996 A8-6 K SToT Si 5.9 0.892 A8-9 AI I. I 0.906 A8-10
Results from the shrinking core model, Eqn. 5-1, for mix L8. Figures in Appendix 8.
Lea chant V(2DAcs) R2 Figure
(mmol/m2/Vd) Ca 112.1 0.993 A8-11 K SToT 143.4 0.993 A8-13 Si 2.9 0.989 A8-14 AI 4.9 0.887 A8-15
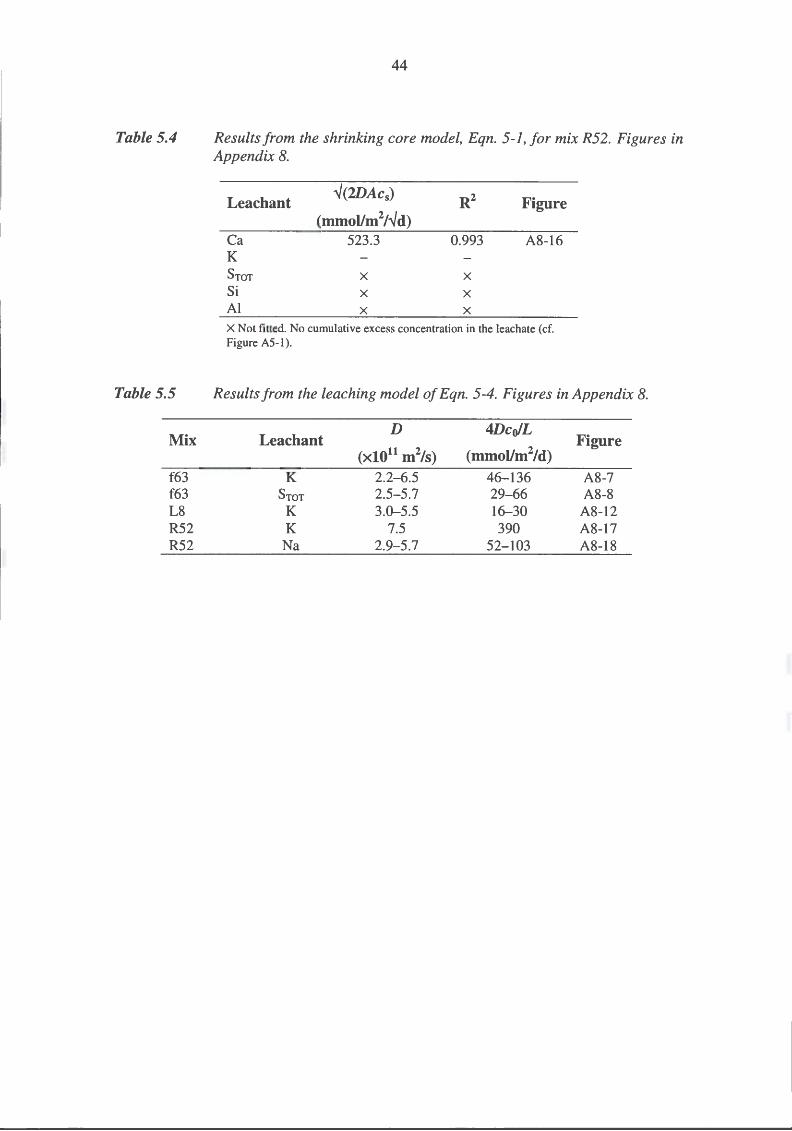
Table 5.4
Table 5.5
Mix
f63 f63 L8 R52 R52
44
Results from the shrinking core model, Eqn. 5-1, for mix R52. Figures in Appendix 8.
Lea chant .Y(2DAcs) R2 Figure
(mmol/m2/.Yd) Ca 523.3 0.993 A8-16 K SToT X X
Si X X Al X X
X Not fitted. No cumulative excess concentration in the leachate (cf. Figure AS-1).
Results from the leaching model of Eqn. 5-4. Figures in Appendix 8.
D 4Dco/L Lea chant Figure
(x1011 m2/s) (mmol/m2/d) K 2.2-6.5 46-136 A8-7
SToT 2.5-5.7 29-66 A8-8 K 3.0-5.5 16-30 A8-12 K 7.5 390 A8-17 Na 2.9-5.7 52-103 A8-18
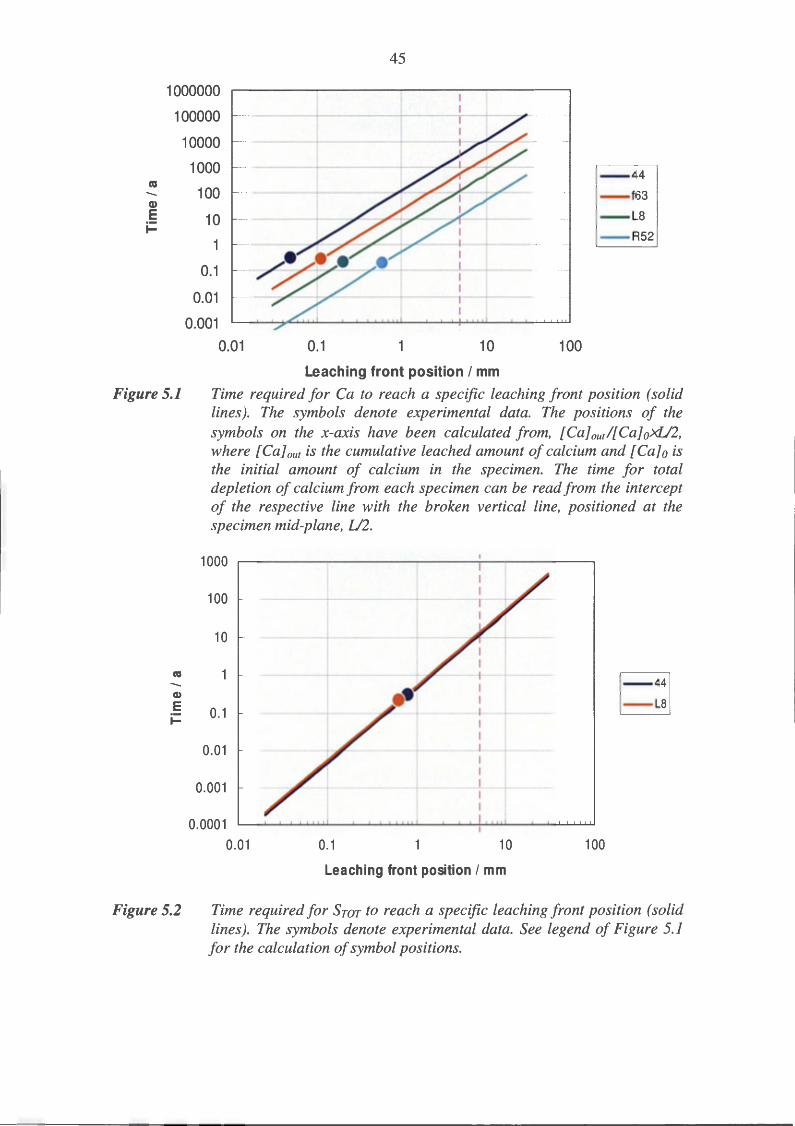
ea
Cl)
E ~
1000000
100000
10000
1000
100
10
1
0.1
0.01
0.001 0.01
45
- 44
- f63
--L8
--R52
0.1 1 10 100
Leaching front position I mm
Figure 5.1 Time required for Ca to reach a specific leaching front position (solid lines). The symbols denote experimental data. The positions of the symbols on the x-axis have been calculated from, [Calouti[Ca]oxL/2, where [Calout is the cumulative leached amount of calcium and [Ca]o is the initial amount of calcium in the specimen. The time for total depletion of calcium from each specimen can be read from the intercept of the respective line with the broken vertical line, positioned at the specimen mid-plane, U2.
ea
<» E ~
Figure 5.2
1000
100
10
0.1
0.01
0.001
0.0001
0.01
. I . ! I i
---+--:..~~------'>--: ---1--+----------1 I I
0.1 10 100
Leaching front position I mm
r==«l ~
Time required for SToT to reach a specific leaching front position (solid lines). The symbols denote experimental data. See legend of Figure 5.1 for the calculation of symbol positions.
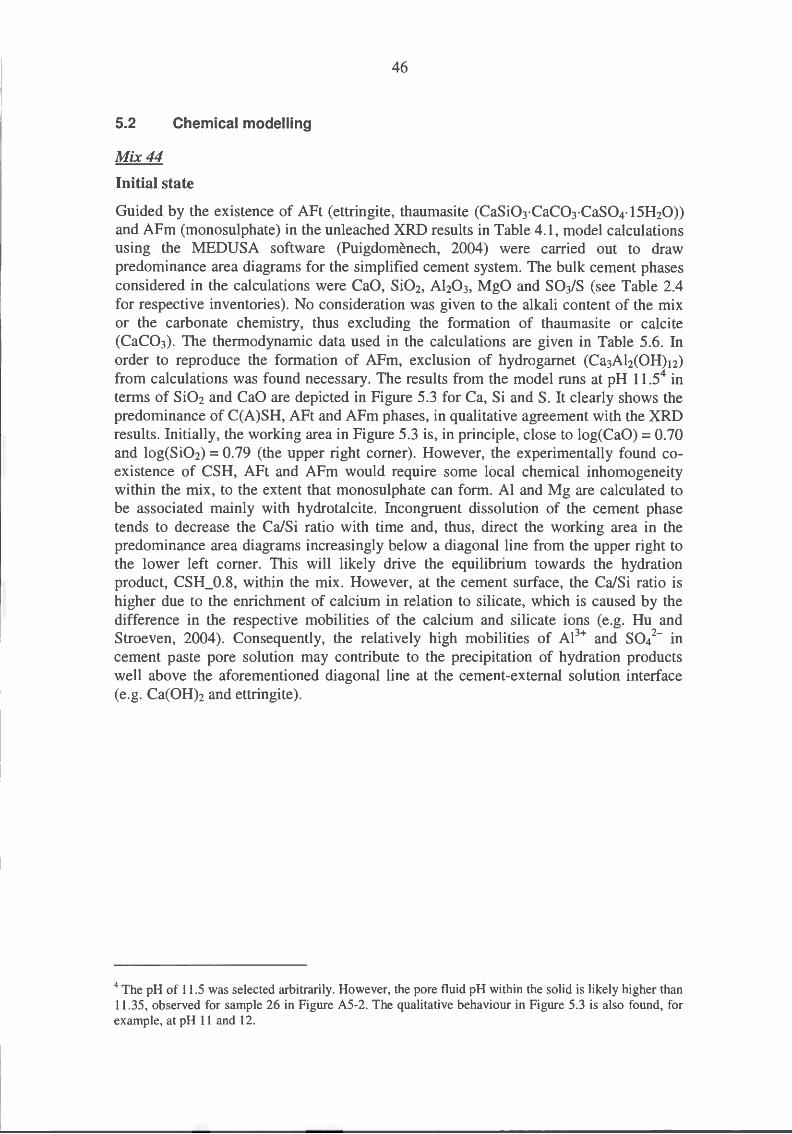
5.2 Chemical modelling
Mix44
Initial state
46
Guided by the existence of AFt (ettringite, thaumasite (CaSi03·CaC03·CaS04·15H20)) and AFm (monosulphate) in the unleached XRD results in Table 4.1, model calculations using the MEDUSA software (Puigdomenech, 2004) were carried out to draw predominance area diagrams for the simplified cement system. The bulk cement phases considered in the calculations were CaO, Si02, Ah03, MgO and S03/S (see Table 2.4 for respective inventories). No consideration was given to the alkali content of the mix or the carbonate chemistry, thus excluding the formation of thaumasite or calcite (CaC03). The thermodynamic data used in the calculations are given in Table 5.6. In order to reproduce the formation of AFm, exclusion of hydrogarnet (Ca3Ah(OH)12)
from calculations was found necessary. The results from the model runs at pH 11.54 in terms of Si02 and CaO are depicted in Figure 5.3 for Ca, Si and S. It clearly shows the predominance of C(A)SH, AFt and AFm phases, in qualitative agreement with the XRD results. Initially, the working area in Figure 5.3 is, in principle, close to log(CaO) = 0.70 and log(Si02) = 0.79 (the upper right corner). However, the experimentally found coexistence of CSH, AFt and AFm would require some local chemical inhomogeneity within the mix, to the extent that monosulphate can form. Al and Mg are calculated to be associated mainly with hydrotalcite. Incongruent dissolution of the cement phase tends to decrease the Ca/Si ratio with time and, thus, direct the working area in the predominance area diagrams increasingly below a diagonal line from the upper right to the lower left corner. This will likely drive the equilibrium towards the hydration product, CSH_0.8, within the mix. However, at the cement surface, the Ca/Si ratio is higher due to the enrichment of calcium in relation to silicate, which is caused by the difference in the respective mobilities of the calcium and silicate ions (e.g. Hu and Stroeven, 2004). Consequently, the relatively high mobilities of Ae+ and sol- in cement paste pore solution may contribute to the precipitation of hydration products well above the aforementioned diagonal line at the cement-external solution interface (e.g. Ca(OHh and ettringite).
4 The pH of 11.5 was selected arbitrarily. However, the pore fluid pH within the solid is likely higher than 11.35, observed for sample 26 in Figure A5-2. The qualitative behaviour in Figure 5.3 is also found, for example, at pH 11 and 12.
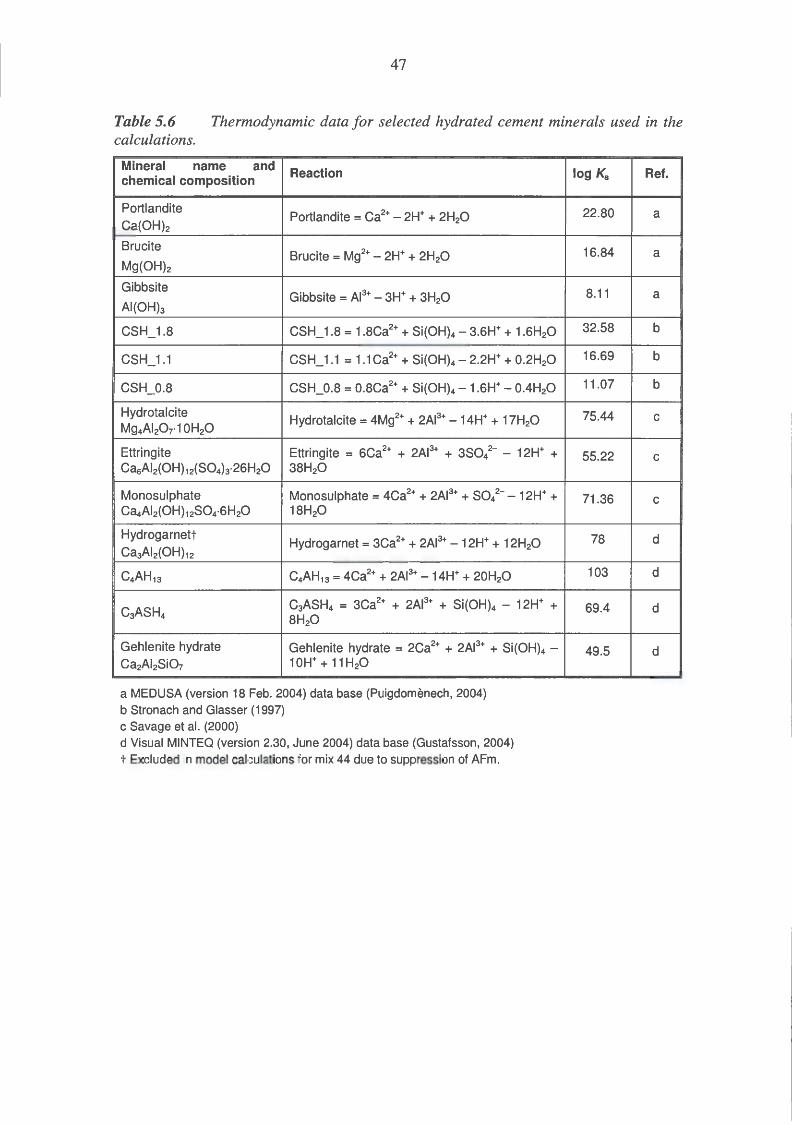
47
Table 5.6 calculations.
Thermodynamic data for selected hydrated cement minerals used in the
Mineral name and Reaction chemical composition
Portlandite Portlandite = Ca2+ - 2H+ + 2H20
Ca(OH)2
Brucite Brucite = Mg2+ - 2H+ + 2H20
Mg(OH)2
Gibbsite Gibbsite = Al3+ - 3H+ + 3H20
AI(OH)J
CSH_1.8 CSH_1.8 = 1.8Ca2+ + Si(OH)4- 3.6H+ + 1.6H20
CSH_1.1 CSH_1.1 = 1.1 Ca2+ + Si(OH)4- 2.2H+ + 0.2H20
CSH_0.8 CSH_0.8 = 0.8Ca2+ + Si(OH)4- 1.6H+ - OAH20
Hydrotalcite Hydrotalcite = 4Mg2+ + 2AI3+ - 14H+ + 17H20
Mg4AI20T 1 OH20
Ettringite Ettringite = 6Ca2+ + 2AI3+ + 3SO/- - 12H+ + CasAI2(0H)12(S04h26H20 38H20
Monosulphate Monosulphate = 4Ca2+ + 2AI3+ + S04 2-- 12H+ +
Ca4AI2(0H)12S04·6H20 18H20
Hydrogarnett Hydrogarnet = 3Ca2+ + 2AI3+ - 12H+ + 12H20
Ca3AI2(0H)12
C4AH13 C4AH1 3 = 4Ca2+ + 2AI3+- 14H+ + 20H20
C3ASH4 C3ASH4 = 3Ca2+ + 2AI3+ + Si(OH)4 - 12H+ + 8H20
Gehlenite hydrate Gehlenite hydrate = 2Ca2+ + 2AI3+ + Si(OH)4 -Ca2AI2Si07 1 OH++ 11 H20
a MEDUSA (version 18 Feb. 2004) data base (Puigdomenech, 2004) b Stronach and Glasser (1997) c Savage et al. (2000) d Visual MINTEQ (version 2.30, June 2004) data base (Gustafsson, 2004) t Excluded in model calculations for mix 44 due to suppression of AFm.
log K5 Ref.
22.80 a
16.84 a
8.11 a
32.58 b
16.69 b
11.07 b
75.44 c
55.22 c
71.36 c
78 d
103 d
69.4 d
49.5 d
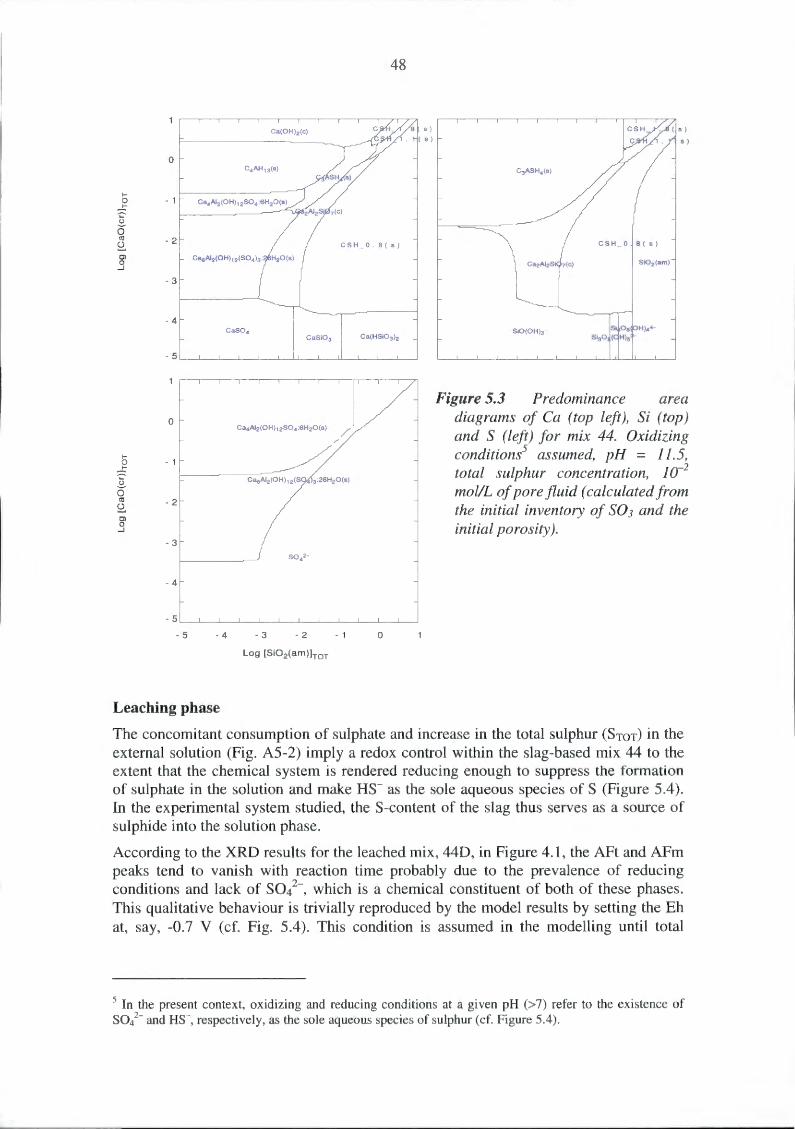
0
I-0 - 1
::5 Q
5 Cl! - 2 ~ Cl 0
...J
- 3
- 4 CaS04
CaSi03
- 5
0 Ca4AI2(0H) 12S04 :6H20(s)
/ /
I-0 - 1
::5 Q Ca6 AI2(0H) 12(S ~ 3:26H20(s)
5 Cl! - 2 ~ Cl 0
...J
- 3
S042-
- 4
-5
- 5 - 4 -3 - 2 - 1
Log [Si0 2 (am)hoT
Leaching phase
48
Ca(HSi03)2
0
Figure 5.3 Predominance area diagrams of Ca (top left), Si (top) and S (left) for mix 44. Oxidizing conditions5 assumed, pH = 11.5, total sulphur concentration, 1 o-2
mol/L of pore fluid (calculated from the initial inventory of so] and the initial porosity) .
The concomitant consumption of sulphate and increase in the total sulphur (SToT) in the external solution (Fig. A5-2) imply a redox control within the slag-based mix 44 to the extent that the chemical system is rendered reducing enough to suppress the formation of sulphate in the solution and make HS- as the sole aqueous species of S (Figure 5.4). In the experimental system studied, the S-content of the slag thus serves as a source of sulphide into the solution phase.
According to the XRD results for the leached mix, 44D, in Figure 4.1, the AFt and AFm peaks tend to vanish with reaction time probably due to the prevalence of reducing conditions and lack of sol-, which is a chemical constituent of both of these phases. This qualitative behaviour is trivially reproduced by the model results by setting the Eh at, say, -0.7 V (cf. Fig. 5.4). This condition is assumed in the modelling until total
5 In the present context, oxidizing and reducing conditions at a given pH (> 7) refer to the existence of SO/ - and HS-, respectively, as the sole aqueous species of sulphur (cf. Figure 5.4).
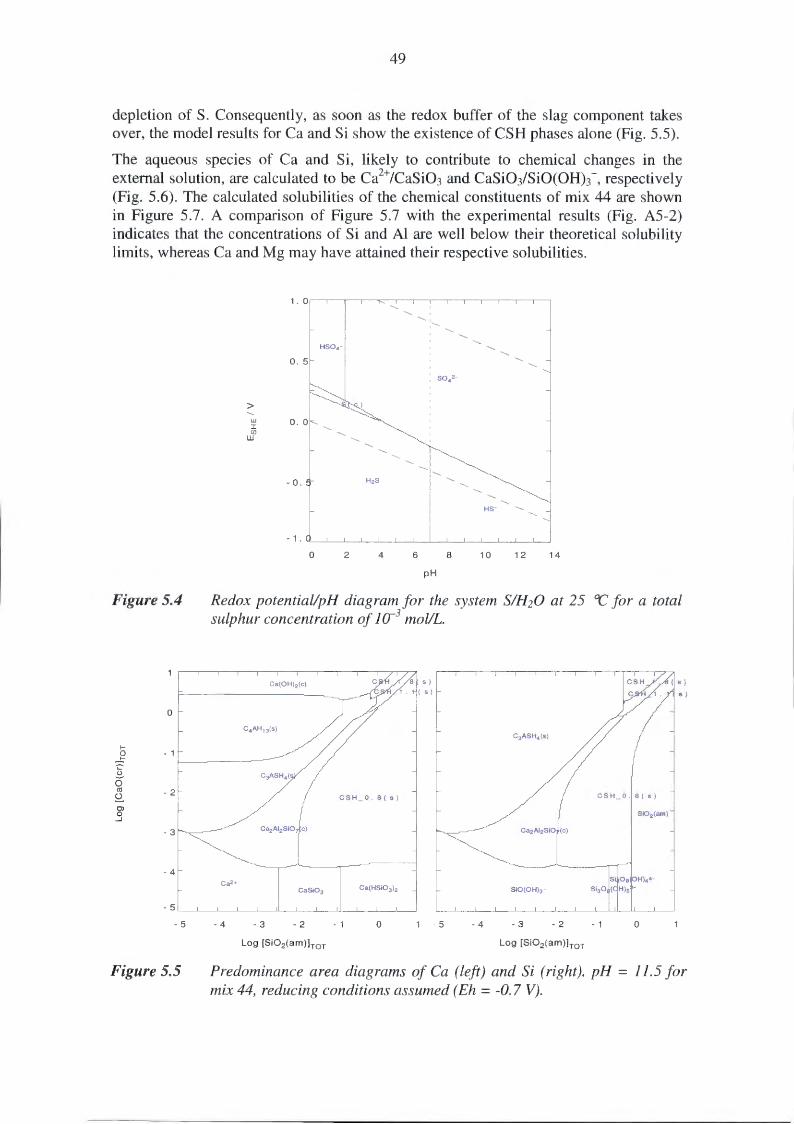
49
depletion of S. Consequently, as soon as the redox buffer of the slag component takes over, the model results for Ca and Si show the existence of CSH phases alone (Fig. 5.5).
The aqueous species of Ca and Si, likely to contribute to chemical changes in the external solution, are calculated to be Ca2+/CaSi03 and CaSi03/Si0(0Hh-, respectively (Fig. 5.6). The calculated solubilities of the chemical constituents of mix 44 are shown in Figure 5.7. A comparison of Figure 5.7 with the experimental results (Fig. A5-2) indicates that the concentrations of Si and Al are well below their theoretical solubility limits, whereas Ca and Mg may have attained their respective solubilities.
Figure 5.4
1-
J u 0
C13
~ Cl 0 _J
0
-1
-2
- 4
1 . 0 .......
....... ' ,---. .......
....... .......
HS04- ....... .......
0 . 5 ....... .......
: SQ42-
> -.. LJ.J I (/)
w
....... .......
....... .......
-0. ....... .......
....... .......
Hs- .......
- 1 .
0 2 4 6 8 10 12 14
pH
Redox potential/pH diagram for the system S/H20 at 25 sulphur concentration of 1 o-3 mol/L.
°C for a total
Ca2+
- 5~~~~~--~~~~~~~~~
- 5
Figure 5.5
- 4 -3 - 2 -1 0 · 5 -4 -3 -2 - 1 0
Predominance area diagrams of Ca (left) and Si (right). pH= 11.5 for mix 44, reducing conditions assumed (Eh = -0. 7 V).
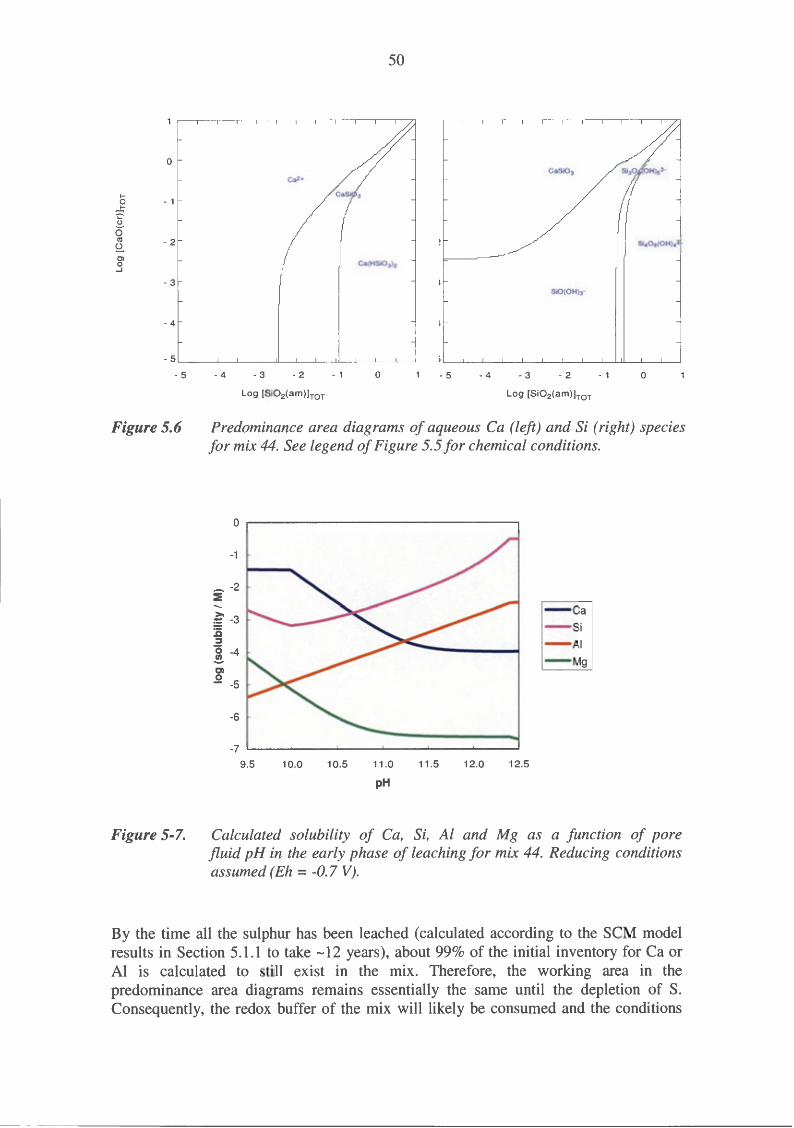
0
1-0 -1 ~ u 5 ctt -2 ~ Ol 0 _J
-3
-4
-5
-5
Figure 5.6
50
Ca2+
SiO(OH)3-
- 4 -3 - 2 -1 0 -5 - 4 - 3 -2 -1 0
Log [Si02(am)hoT
Predominance area diagrams of aqueous Ca (left) and Si (right) species for mix 44. See legend of Figure 5.5 for chemical conditions.
0
-1
i' -2
--~ -3 :c ::::s 0 -4 .!!. Cl ..2 -5
-6
-7
9.5 10.0 10.5 11.0
pH
11.5 12.0
- ea - Si
- AI
- Mg
12.5
Figure 5-7. Calculated solubility of Ca, Si, Al and Mg as a function of pore fluid pH in the early phase of leaching for mix 44. Reducing conditions assumed (Eh = -0. 7 V).
By the time all the sulphur has been leached (calculated according to the SCM model results in Section 5.1.1 to take -12 years), about 99% of the initial inventory for Ca or AI is calculated to still exist in the mix. Therefore, the working area in the predominance area diagrams remains essentially the same until the depletion of S. Consequently, the redox buffer of the mix will likely be consumed and the conditions
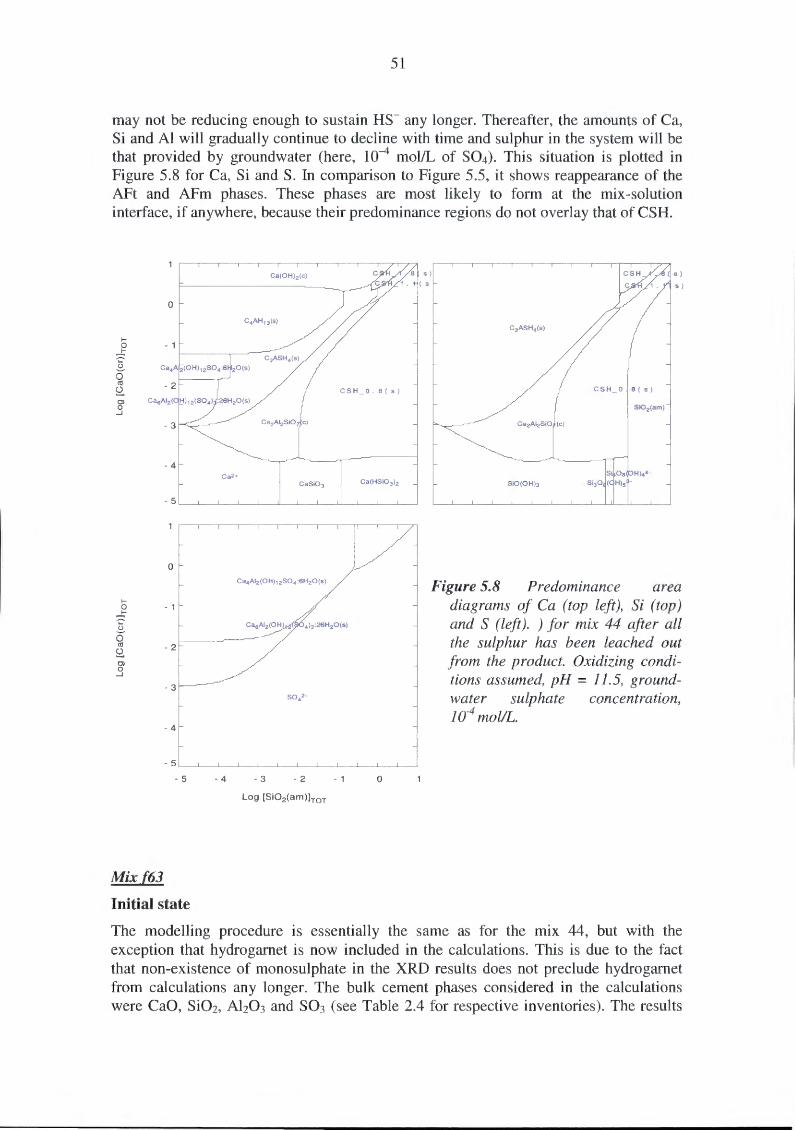
51
may not be reducing enough to sustain HS- any longer. Thereafter, the amounts of Ca, Si and Al will gradually continue to decline with time and sulphur in the system will be that provided by ground water (here, 10-4 mol/L of S04). This situation is plotted in Figure 5.8 for Ca, Si and S. In comparison to Figure 5.5, it shows reappearance of the AFt and AFm phases. These phases are most likely to form at the mix-solution interface, if anywhere, because their predominance regions do not overlay that of CSH.
1-0
~ u 0 ea ~ Cl 0
...J
1-0 ~ u 0 ea ~ Cl 0
...J
0
- 1
- 2
- 3
- 4
- 5
- 5
Mix (63
Initial state
Ca4AI2(0H)12S04 :6H20 (s)
SQ42-
- 4 - 3 - 2
Log [Si02 (am)hoT
- 1 0
Figure 5.8 Predominance area diagrams of Ca (top left), Si (top) and S (left). ) for mix 44 after all the sulphur has been leached out from the product. Oxidizing conditions assumed, pH = 11.5, groundwater sulphate concentration, 10-4 mol!L.
The modelling procedure is essentially the same as for the mix 44, but with the exception that hydrogamet is now included in the calculations. This is due to the fact that non-existence of monosulphate in the XRD results does not preclude hydrogamet from calculations any longer. The bulk cement phases considered in the calculations were CaO, Si02, Ah03 and S03 (see Table 2.4 for respective inventories). The results
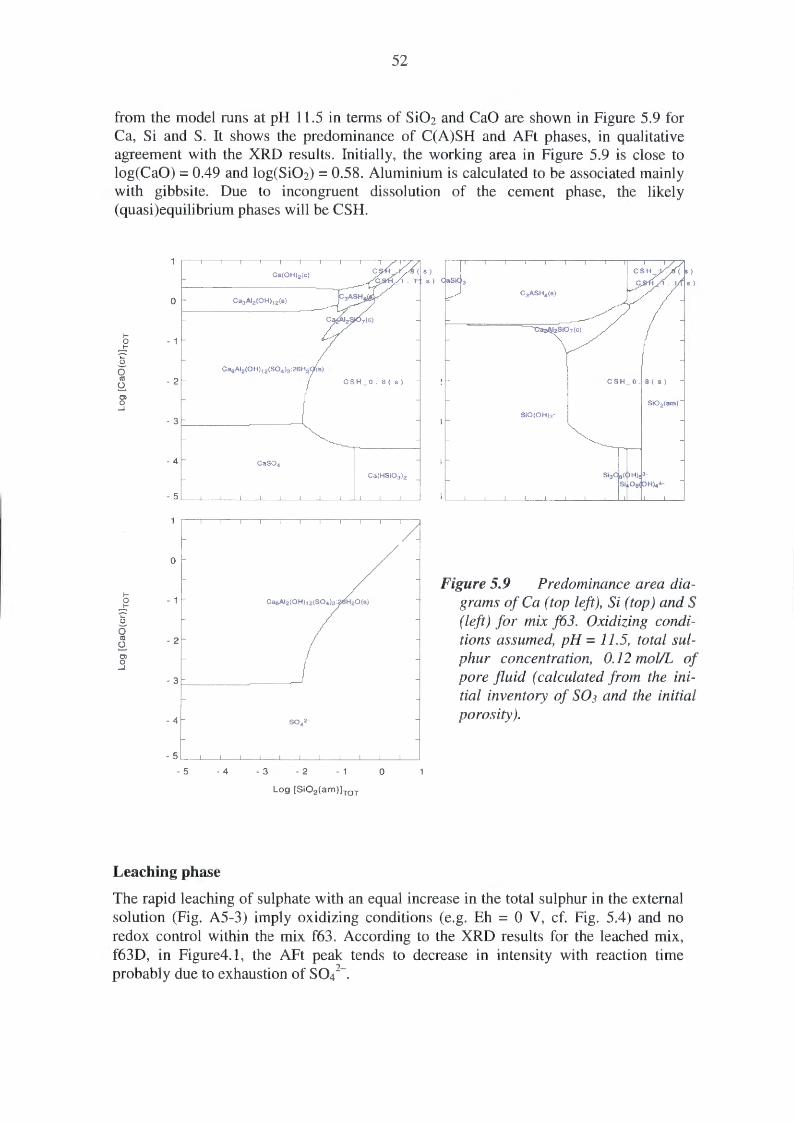
52
from the model runs at pH 11.5 in terms of Si02 and CaO are shown in Figure 5.9 for Ca, Si and S. It shows the predominance of C(A)SH and AFt phases, in qualitative agreement with the XRD results. Initially, the working area in Figure 5.9 is close to log(CaO) = 0.49 and log(Si02) = 0.58. Aluminium is calculated to be associated mainly with gibbsite. Due to incongruent dissolution of the cement phase, the likely ( quasi)equilibrium phases will be CSH.
Ca(OH)2(c)
0 Ca3AI2(0H)J 2(s)
1-0
~ - 1
u 0 Ca6AI2(0H)J 2(S04)3:26H2 (s)
ell - 2 CSH _ 0 . 8 ( s) S?. Cl 0 ...J
- 3
-4 CaS04
Ca(HSi03)2
-5
0
1-0 - 1 CasAI2(0Hh2(S04b: H20(s)
~ u 0 ell -2 S?. Cl 0 ...J
- 3
- 4 S042-
- 5
-5 - 4 -3 - 2 - 1 0
Log (Si02 (am)]TOT
Leaching phase
C3ASH4(s)
Si0(0H)3-
Figure 5.9 Predominance area dia-grams ofCa (top left), Si (top) and S (left) for mix f63. Oxidizing conditions assumed, pH= 11.5, total sulphur concentration, 0.12 mol/L of pore fluid (calculated from the initial inventory of so3 and the initial porosity).
The rapid leaching of sulphate with an equal increase in the total sulphur in the external solution (Fig. A5-3) imply oxidizing conditions (e.g. Eh = 0 V, cf. Fig. 5.4) and no redox control within the mix f63. According to the XRD results for the leached mix, f63D, in Figure4.1, the AFt peak tends to decrease in intensity with reaction time probably due to exhaustion of sol-.
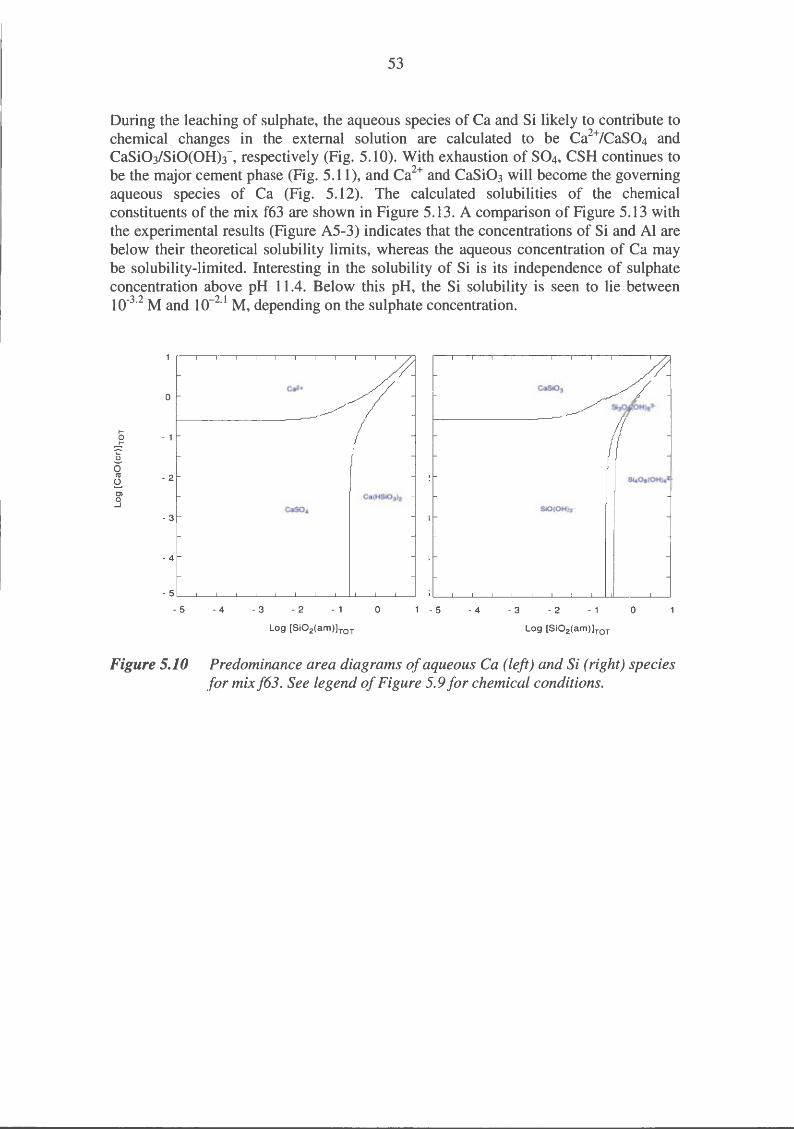
53
During the leaching of sulphate, the aqueous species of Ca and Si likely to contribute to chemical changes in the external solution are calculated to be Ca2
+ /CaS04 and CaSi03/SiO(OH)3 - , respectively (Fig. 5.1 0). With exhaustion of S04, CSH continues to be the major cement phase (Fig. 5.11), and Ca2
+ and CaSi03 will become the governing aqueous species of Ca (Fig. 5.12). The calculated solubilities of the chemical constituents of the mix f63 are shown in Figure 5.13. A comparison of Figure 5.13 with the experimental results (Figure A5-3) indicates that the concentrations of Si and Al are below their theoretical solubility limits, whereas the aqueous concentration of Ca may be solubility-limited. Interesting in the solubility of Si is its independence of sulphate concentration above pH 11.4. Below this pH, the Si solubility is seen to lie between 1 o-3·
2 M and 1 o-2·1 M, depending on the sulphate concentration.
CaSi03 0
t-0
~ - 1
u 0 Cl! - 2 ~ Cl Ca(HSi03)2 0 _J
CaS04 SiO(OH)J-
- 3
- 4
- 5
- 5 - 4 - 3 - 2 - 1 0 1 - 5 - 4 - 3 - 2 - 1 0
Log (Si02(am)]TOT Log [Si0 2(am)]TOT
Figure 5.10 Predominance area diagrams of aqueous Ca (left) and Si (right) species for mixf63. See legend of Figure 5.9 for chemical conditions.
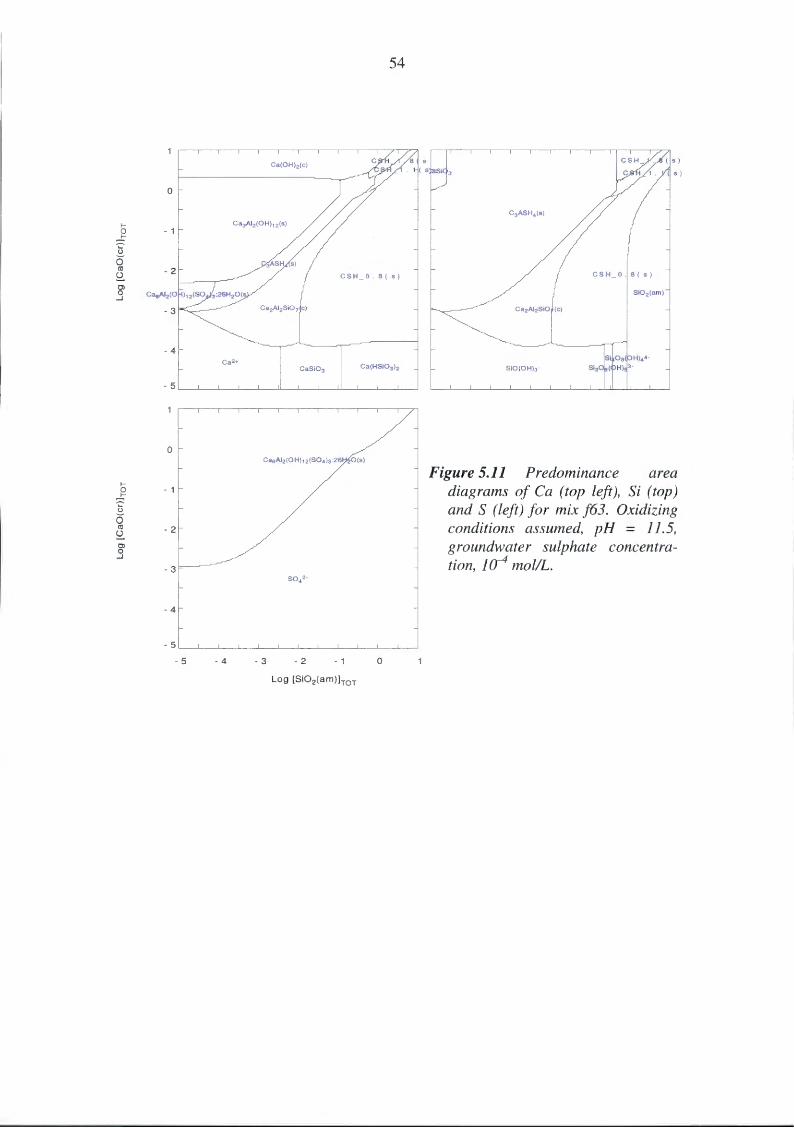
1-0
~ 0 0 ea ~ 0> 0 _J
1-0
~ 0 0 ea ~ 0> 0 _J
54
0
- 1
- 2
- 3
- 4
- 5
0
- 1
- 2
- 3
- 4
- 5 L-~--~--L-~--~--L-~--~--L--L--~~
- 5 - 4 - 3 - 2 - 1 0
Figure 5.11 Predominance area diagrams of Ca (top left), Si (top) and S (left) for mix f63. Oxidizing conditions assumed, pH = 11.5, groundwater sulphate concentration, 10-4 mol/L.
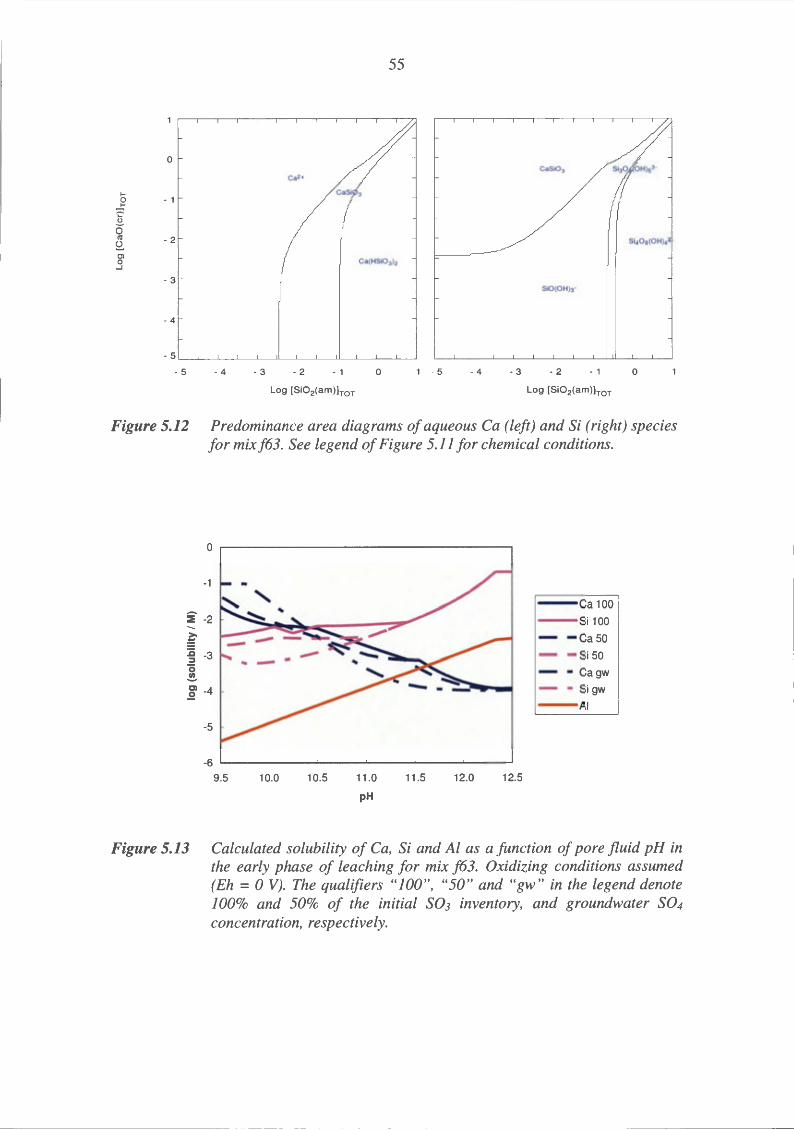
55
0 CaSi03
Ca2+
1-0
~ - 1
u 0 <U - 2 Si40a(OH)4 ~ Ol
Ca(HSi03)2 s - 3
SiO(OH)3-
- 4
- 5
- 5 - 4 -3 - 2 - 1 0 · 5 - 4 - 3 - 2 - 1 0
Log [Si02(am)hoT Log [Si02(am)]TOT
Figure 5.12 Predominance area diagrams of aqueous Ca (left) and Si (right) species for mix f63. See legend of Figure 5.11 for chemical conditions.
-1
:! -2 .._
~ :g -3 0 ~
~ -4
-5
9.5 10.0 10.5 11.0
pH
11.5 12.0 12.5
- Ca100
- Si100
- ea so - Si 50
• Cagw
• Si gw
- AI
Figure 5.13 Calculated solubility of Ca, Si and Al as a function of pore fluid pH in the early phase of leaching for mix f63. Oxidizing conditions assumed (Eh= 0 V). The qualifiers "100", "50" and "gw" in the legend denote 100% and 50% of the initial so3 inventory, and groundwater so4 concentration, respectively.

56
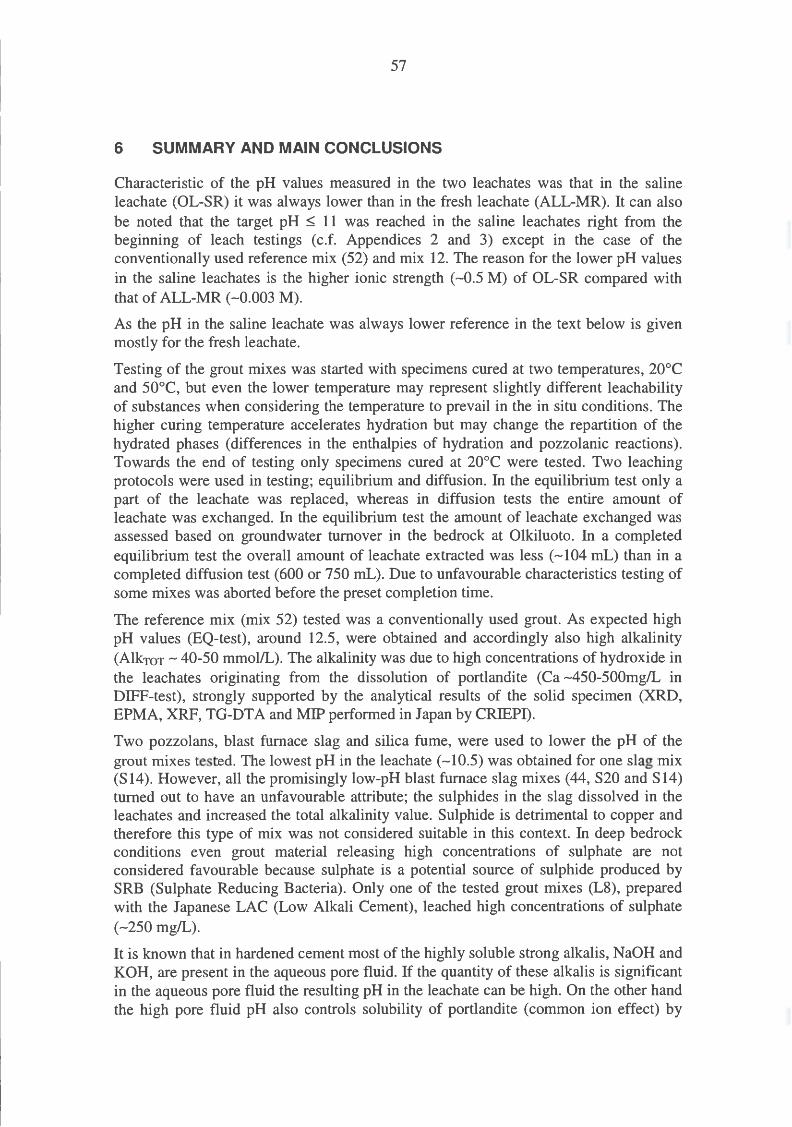
57
6 SUMMARY AND MAIN CONCLUSIONS
Characteristic of the pH values measured in the two leachates was that in the saline leachate (OL-SR) it was always lower than in the fresh leachate (ALL-MR). It can also be noted that the target pH ~ 11 was reached in the saline leachates right from the beginning of leach testings (c.f. Appendices 2 and 3) except in the case of the conventionally used reference mix (52) and mix 12. The reason for the lower pH values in the saline leachates is the higher ionic strength ( -0.5 M) of OL-SR compared with that of ALL-MR (-0.003 M).
As the pH in the saline leachate was always lower reference in the text below is given mostly for the fresh leachate.
Testing of the grout mixes was started with specimens cured at two temperatures, 20°C and 50°C, but even the lower temperature may represent slightly different leachability of substances when considering the temperature to prevail in the in situ conditions. The higher curing temperature accelerates hydration but may change the repartition of the hydrated phases (differences in the enthalpies of hydration and pozzolanic reactions). Towards the end of testing only specimens cured at 20°C were tested. Two leaching protocols were used in testing; equilibrium and diffusion. In the equilibrium test only a part of the leachate was replaced, whereas in diffusion tests the entire amount of leachate was exchanged. In the equilibrium test the amount of leachate exchanged was assessed based on groundwater turnover in the bedrock at Olkiluoto. In a completed equilibrium test the overall amount of leachate extracted was less ( -104 mL) than in a completed diffusion test (600 or 750 mL). Due to unfavourable characteristics testing of some mixes was aborted before the preset completion time.
The reference mix (mix 52) tested was a conventionally used grout. As expected high pH values (EQ-test), around 12.5, were obtained and accordingly also high alkalinity (AlkToT- 40-50 mmol/L). The alkalinity was due to high concentrations of hydroxide in the leachates originating from the dissolution of portlandite (Ca -450-500mg/L in DIFF-test), strongly supported by the analytical results of the solid specimen (XRD, EPMA, XRF, TG-DTA and MIP performed in Japan by CRIEPI).
Two pozzolans, blast furnace slag and silica fume, were used to lower the pH of the grout mixes tested. The lowest pH in the leachate (-10.5) was obtained for one slag mix (S14). However, all the promisingly low-pH blast furnace slag mixes (44, S20 and S14) turned out to have an unfavourable attribute; the sulphides in the slag dissolved in the leachates and increased the total alkalinity value. Sulphide is detrimental to copper and therefore this type of mix was not considered suitable in this context. In deep bedrock conditions even grout material releasing high concentrations of sulphate are not considered favourable because sulphate is a potential source of sulphide produced by SRB (Sulphate Reducing Bacteria). Only one of the tested grout mixes (L8), prepared with the Japanese LAC (Low Alkali Cement), leached high concentrations of sulphate (-250 mg/L).
It is known that in hardened cement most of the highly soluble strong alkalis, N a OH and KOH, are present in the aqueous pore fluid. If the quantity of these alkalis is significant in the aqueous pore fluid the resulting pH in the leachate can be high. On the other hand the high pore fluid pH also controls solubility of portlandite (common ion effect) by
58
reducing Ca solubility and therefore not until the strong alkalis (NaOH and KOH) have been leached out is the pH of pore solution controlled by the less soluble portlandite at about 12.5 for a long time depending on the amount unreacted portlandite present in the cement (Gascoyne 2002). At the outset of developing the new low-pH grouts it was believed that the total amount of alkaline elements (Na, K, and Ca) initially present in the grout mix would be decisive in determining the resulting leachate pH values. However, this was proven wrong as the grout mixes (w1 and w2) made with very low alkali cement (Egyptian White Cement) exhibited pH values of similar level with the two corresponding mixes (f63 and f64 ), which were identical in other respects but the type of cement used (OPC). The cement used in the f-mixes had higher contents of alkaline elements, especially N a and K. Cau Dit Coumes et al. (2004) have shown that the equilibrium pH of the pore solution mostly depends on the silica content of the binding whatever the added pozzolan is, because the added silica lowers the Ca/Si ratio in CSH and thereby enhances sorption of alkalis and decrease of the equilibrium pH of the pore solution. The leachate pH results were examined also in this respect. A decreasing trend of the pH values in EQ-test ALL-MR leachates followed the decreasing trend of the Ca/Si ratio of the initial OPC-Silica mixes, but the slag mix results deviated from this trend and the reason for this was the leached sulphide from slag (Table 3.3). However, in the saline conditions (OL-SR) an opposite trend, by about 0.2 pH units, was observed between two mixes, w1 and f63, in both leach tests, as well as in ALL-MR in DIFF-test. The reason for this was not clear with the data available.
In addition to the leachate pH values measured at VTT a few were measured with an other method in Spain by IETcc, as well as a few of the initial grout specimen pore solution pH values (Table A9-1, Appendix 9). As expected, the pore solution pH values (methods B and C) were higher than those of the leachates. Comparison of the IETcc (method A) and VTT leachate pH values is hampered by the differences of the test procedures applied; the ratio of solid to solution (solid amount(g)/solution amount(g)=1 vs. solid surface/solution volume=0.85), the state of the specimen (powdered vs. solid), and also the protection against C02 interferences (N2 flow vs. N2 atmosphere glovebox). Anyway, when compared the pH values measured at VTT for the leachates were higher than those measured at IETcc (method A, App 9) except in one case, the reference mix 52, for which the VTT pH values were about 0.2 pH units lower. The lower pH value of the leached specimen of mix 52 (52D), was anticipated to be due to the depleted amount of portlandite in surface layer (supported by the analyses results of both the solid specimen and the leachates exchanged), but the differences in the test procedures, may have been the main cause, and the only cause to the slightly lower pH values in the case of the unleached specimen, 52(N2). However, inconsistently all the other VTT pH values of the specimens were higher than those of the lET cc (method A), but the reason at this point remains unexplained. The importance of good C02 protection during entire testing procedures is of utmost importance, if it fails the pH values are bound to decrease.
In this study the most promising mixtures from the chemical point of view were the OPC-silica mixes with one exception, mix 12, which exhibited high pH values around 12. Table 6.2 gives the pH and alkalinity values measured in EQ-testing for the OPCsilica mixes. The table gives results in both leachates for both curing temperatures, as well as indicating the Ca/Si ratio for the grout mixes. The numerical values of other analytical parameters are shown in Appendix 5, Table A5-1.
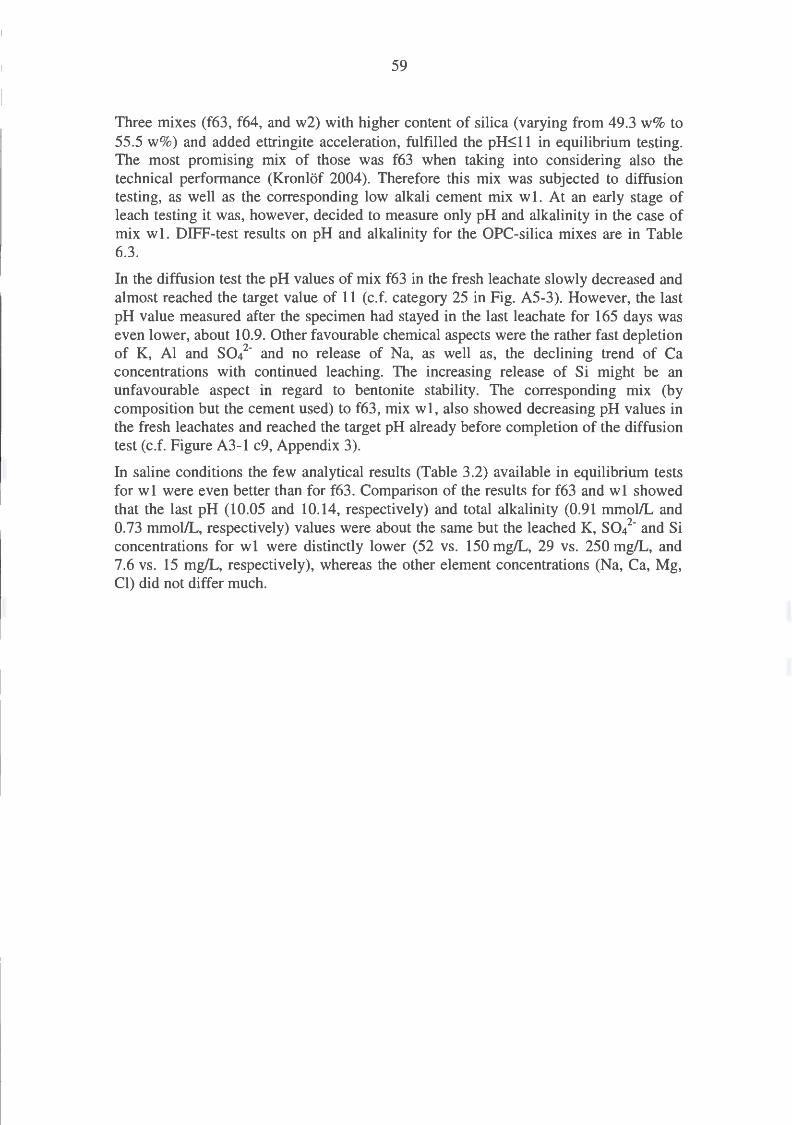
59
Three mixes (f63, f64, and w2) with higher content of silica (varying from 49.3 w% to 55.5 w%) and added ettringite acceleration, fulfilled the pH~11 in equilibrium testing. The most promising mix of those was f63 when taking into considering also the technical performance (Kronlof 2004 ). Therefore this mix was subjected to diffusion testing, as well as the corresponding low alkali cement mix w 1. At an early stage of leach testing it was, however, decided to measure only pH and alkalinity in the case of mix wl. DIFF-test results on pH and alkalinity for the OPC-silica mixes are in Table 6.3.
In the diffusion test the pH values of mix f63 in the fresh leachate slowly decreased and almost reached the target value of 11 (c.f. category 25 in Fig. A5-3). However, the last pH value measured after the specimen had stayed in the last leachate for 165 days was even lower, about 10.9. Other favourable chemical aspects were the rather fast depletion of K, AI and sol- and no release of N a, as well as, the declining trend of Ca concentrations with continued leaching. The increasing release of Si might be an unfavourable aspect in regard to bentonite stability. The corresponding mix (by composition but the cement used) to f63, mix w1, also showed decreasing pH values in the fresh leachates and reached the target pH already before completion of the diffusion test (c.f. Figure A3-1 c9, Appendix 3).
In saline conditions the few analytical results (Table 3.2) available in equilibrium tests for w 1 were even better than for f63. Comparison of the results for f63 and w 1 showed that the last pH (10.05 and 10.14, respectively) and total alkalinity (0.91 mmol/L and 0.73 mmol/L, respectively) values were about the same but the leached K, sol-and Si concentrations for w1 were distinctly lower (52 vs. 150 mg/L, 29 vs. 250 mg/L, and 7.6 vs. 15 mg/L, respectively), whereas the other element concentrations (Na, Ca, Mg, Cl) did not differ much.
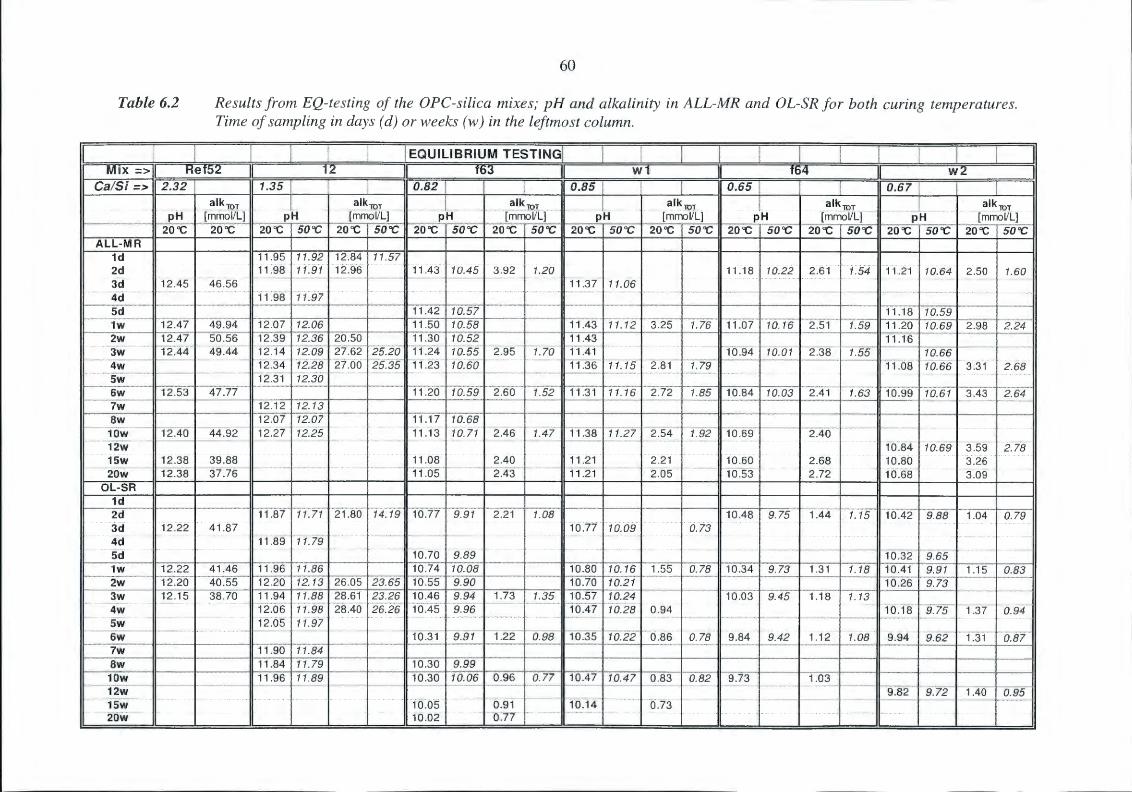
60
Table 6.2 Results from EQ-testing of the OPC-silica mixes; pH and alkalinity in ALL-MR and OL-SR for both curing temperatures. Time of sampling in days (d) or weeks (w) in the leftmost column.
1 1 r 1 --r 1 1 IEaUILIBRIUM TESTING! 1 1 1 11 1 1 1 1 1 1: ' 1 I MIX =>11 Ref52 11 12 11 f63 11 w1 11 f64 11 w2 1
Ca!Si => I 2.32 I 11 1.35 t I I 11 0.82 I' I I 11 0.85 i i f: 11 0.65 I I I 11 0.67 f i I I
2occ 1 2occ If 2oac~r~scioc~12iFc l sooc112occ j sooc 1 2occ r soocn2occ 1soCCT2occ l so"CU U20oc u rsoccr ·2tFc~rsooc 112occ rsooc 1 2oac l soac· ALL-MR
···~·~·· ······ ····· ~······ · · ~····· ~~:~~~·· ~L~~· ·····~··· ~}~~~ ....... !!-~?. tTA3To.4s 3~s2lt:2oll ... , ... , ....... E················l· lr1 ~Ta,to:·22~2~erl ·~:s411rr:2rlta:6412:sa ·· rt:6o := -·-3cl~=·~ =12·:45~ --4s.-~~- =·~~:~~-~- ·== -- -·-=.__ ·· ····-~== -·~··~·- -~- -=-··"=~ ~~.---·· ~n .3~. ~!L!!_7}~ ~~==== _ -~ ~··---=~ ·== ~-·~= =·· . =--~~= =- ~~==--l~··~-n
4d 11.98 11.97 1
Sd 11 I 11 I I I 1111.42110.571 I 11 I I I 11 I I I 1111.18 110.59 1w 1112.471 49.94 1112.07112.061 I 1111.50110.581 I 1111.43111.121 3.25 I 1.76 1111.07110.161 2.51 I 1.59 1111.20110.691 2.98 1 2.24
6w 12.53 I 47.77 i i .20 i 10.59 i 2.60 i 1.52 ii i i .3i i 11.16 i 2.72 i 1.85 il10.84 I 10.03 I 2.4i i 1.63 ii i0.99 i w.o7 i 3.43 i zo4 7w 11 I 11 12.12 I 12. 13 Sw 12.07 12.07 11.17 10.68 I
~---- _!=o~ := Ec22.. _~~~ - ·==:-~ : ~·~sj==-::~~ ===:==~ 10=---~~~·==~~== ··~cs.-:~~-.~ ~~; =·~:~~~ ~i-z~·~ 15w 12.38 39.88 11.08 2.40 1 11.21 2.21 10.60 2.68 10.80 3.26
~--2ow--·- -:r·2-:-3a- ·-37~7s-· .. -·---· --·-- -----.. -· lTOS- -----~- - 2-:4'"3 -r ·-- -·- Tr2·r ~ ·-·---·- ·-~~ros--· --·-· -fb-:s3 ··---- 2-:·'12- ·-··-- 10:68- ·~·---· -·-3-:-69" ·-- .. ---~ OL-SR I
1d 2d 11 .87 11.71 21.80 14.19 10.77 9.91 2.21 1.08 10.48 9.75 1.44 1.15 10.42 9.88 j1.04 J 0.79 .. 3d .. . . ... . .. . 12:22 . . 41:87 ... . .. fb.77 . 16:-iHi . . . . . ...... . . . 6.f3 . . . . . . . . ... .
-·-~·-4cr·· ·-·· "Tf:S9 "TT:'79- ·--·-· -·---.. ······- -·-········ -----~-- ·--------- ·--- l1f"7a~· 9.89 --~-·---···-·-- ·--.... ·.·---...... ·.·--C.....·-- ·TD.32 -9.'6.5'"1~----r---
1w 12.22 41.46 11.96 11 .86 10.74 10.08 10.80 10.16 1.55 0.78 10.34 9.73 1.31 1.18 10.41 9.91 1 1.15 1 0.83 2w 12.20 40.55 12.20 12.13 26 .05 23.65 10.55 9.90 10.70 10.21 10.26 9.73 3w 12.15 38.70 11.94 11.88 28.61 23.26 10.46 9.94 1.73 1.35 10.57 10.24 10.03 9.45 1.18 1.13
.... ___ 4w··- -- _ .. _____ ....... -12.mr 71~98 -2a~4cf ·· '26.26- To-:4·s- ·-9-:97r -nr~rr· -ro:2a ... 15':'94 . --·· .. -- ·-~·- ---- -··----- -· .... __ -ra·:Tlr --9:75 ---r37-···a.7J4-, _____ ···~sw----~· -·--· ---·---· 'T2.os-· -rr97 -~--·~ ·--·--- ·-·---- ·-·--.... .. ... --- - .... ····--·-... ·-· ·--~·-·-·-· ..... -·----·-··---·-~ ··----~·· ........ ---·-·· ... --.~·--··· ... -·-- -·-·-.. -~-· ....... --.---~·-.............. -.................. --... - .................... -. ~ ... --.. --. ··--·· -- ·-·--·--- --····- "f0.3r -9.F '""'1:22 ___ -6.-§'ir ·-:ro.35-· -rtf22. -o:as- '7:f'78·- ·-9-:-84- - 9.42- -·r12~ -roo· ·-g:g.;r-· --9-:62- r-r:3"1 -7i87-
7w 11.90 11 .84
- ~~ 1a0: ~ ~~:~~ ~~:~~·--·--- ~~ :;~ ;09
;6 ~lo.77 10.47 10.47 __ o.sa . ~:8~ ~:~--~- L~-~J==It~-L!i:.~_JI4o .1 9~ - -- ~··--~- ~-- --r---· .. ----· ·-·-·----1-·-··-- ~foT4 ...................... o .. ·r3-12w .. ·-······ ..... ··~-~--"'-· '"1505 0.91 1 · · "'~·--Tsw_ .... .... _ --~.. ...... 1o:o2 o.77 1 = 20w
61
Table 6.3 Results from DIFF-testing of the OPC-silica mixes; pH in both ALL-MR and OL-SR for both curing temperatures. The actual testing was stopped after 78 or 106 days. The leftmost column gives the time from the start of testing in hours or days.
I ---- DiFFUSION TESTING I .--------,1 Ref 52 (Ca/Si= 2.32) 11 f63 (Ca/Si = 0.82) 11 W1 (Ca/Si = 0.85) I
I pH I Alk TOT 11 pH I Alk TOT 11 pH I Alk TOT I
~~~:~~=l~i:~:t~t=2~::F~~~~~=t=;-~~~~~;-::1~~~~~61~R_I~~\~~~~~~~~~~~-~ 1h 11 12.03 I 11.80 I 14.22 I 15.76 11 11.02 I 9.91 I 10.52 t 9.94 I I 11 10.77 l 10.22 I 10.39 I 9.94
~~~~-1 12.10 I 17.56 l 21.44 1 10.14 1 10.47 1 9.93 1 l~-~~~· 10.96 1 ~ro~l 10.32 f 10.00 1 12.55 12.28 10.39 10.55 : 9.83 I 11.22 1o.81 10.46 1o.o1 2 11 12.28 I 12.13 I I 11 11.35 I 10.48 I 10.51 fi 9.84 I I 11 11.18 I 10.94 I 10.41 I 10.03
!-1t-tt~~t-~}~ =~~As~:l~:~~=ll =~tR=!:~~-1-~::it f{.~~ ~~--:==-i:===lti:~:=-R~:!!·=t-~-~~i -l~-·--- --- , _______ ,, 6 11 12.38 I 12.21 I I 11 11.25 I 10.52 I 10.41 ! 9.99 I I 11 10.92 I 10~8 I 10.29 I' 10.16
·----~ ·- 11---~~-09 --( ....... ~. :~~ · ·--~-·-··-" · ···--· t ··· · ... -.......... -,,··-n~·2s·-·t· l a·:s?-t ··fo~42 l--· s.s·a --t--··----··· ·· t ··· ····-----·-- lr--:rr.-os--r1cr9T···r -·fo~2~r ··- r····-Ta:17 9 11 12.45 I 12.23 11 11.30 I 10.63 I 10.38 9.87 11.12 10.98 10.13 10.04 13 11 12.29 I 12.05 1511 I ............ T.. . . ... .. .. . T 11 ff.3f .. T ldJ'f .. I .... Hf44 .. T fd.b3 .. I I llff.1b ... r···· tb.95 r 1b.2f I 10.18
21 12.26 12.00 11.26 10.74 10.31 9.85 11.14 11.04 10.09 10.05 -Iir ...... 12.ss··- ···1 2.ir--· ·····-···-- " · ·---····-···-·- ··1T~24-· ·-·fa.8o ·-- --:ro-:-24-· ···· -9']-s··-... --1-ro·r · · ··rr:a2·------ ........ 9~9a-··-------·ra~or- • --·--- · ........ 1 • ..... ···· -u
35 12:ss · ··· · 12:32 ·········· · I · rr2rr ·1o:9o · · 1a~21 9:96 I ·· rroa ······ rro3 ······ 9 ~9a· fo:ar · . 42 12.36 12.15 11.21 10.88 10.11 9.80 11.02 11.00 9.82 9.91 "49- 12.64 12.32-- 11.15 10.85 10.10 '---s.-rg--·--- 10.95 10.94 9.84 9.89 Si) ---- ·--- 11.08 10.79 10.03 9.76 10.78 10.79 9.75 9.79 56 11 12.33 I 12.08 I I 11 11.16 I 10.90 I 10.07 ! 9.81 I I 11 10.95 I 10.95 I 9.80 I 9.90
I ;i~ ll .. +}-}~ · 1 -- ~~ :g~·-+···--······ 1 - ··*··- ··~ 11-~+~·· l · +~ :~-l .. - ~~ :~~-+ ... ~~~ ... ···1 ..... ~ ......... , .......... ~ ....... 11 ···~~ :~~ ·+ -~~ : :;~-·1 -~i~·~~--· .. ···+ -i ::~ ·-I ·· ................ ...
7811 12.31 I 12.08 I I 11 11.09 r 10.90 I 1b.02 T 9.8f I r - 11 10.87 1 10.91 l 9.77 T ~f.88
8SII I l =-l =-ll11.07 r-=~-94 ! 1
1.89 I o.~3I10 .9R I 9.75 1--· ------· - . -· . ··- ---· ·----
-~-~·- ·-·········· ........ -- ....... --.- ·····---.- ······---·---···~ ·- +~ :~~ ....... ··-·- ... -~~~~·-· ·-·---~ ........................ .-- ... -...... -. .... -- ··-}~ ::~--·· ··-·--··· .................... : :~!····J ....... ~.-..... -....... -... ·-----......... . 1.46
1{~~~---~~-i~--~I ---=~t=i~~r:l " " . =ll~~~~r -1--- ---1--: -l ----1--i!i _[ _0-~7 ~! . ro:s2 I .. r · g;sg I r T.37 I I, ·t ··--.--··-·--··· .. --1···--··-· ........ ·-!···---·····--·---···-·
-------------------------------------------------------- - -- -
62
The simplified thermodynamic model calculations performed on slag mix 44 were successful in qualitatively reproducing the experimentally observed (XRD) cement phases in the initial state and during the early phases of leaching. It is conceivable, although not definite, that during the leaching phase, a redox buffer within the mix renders chemical conditions reducing enough to sustain sulphide in the aqueous solution until total depletion of sulphur.
The experimental XRD results of the mix f63 were also adequately explained by thermodynamic model calculations. The experimental leach results for Si were found to be below the solubility limit, which was calculated to lie between 1 o-3
·2 M and 1 o-2
·1 M
at pH <11.4, depending on the sulphate concentration in the system. The former value represents the depletion of sulphur in the mix, which is shown by the experimental leach results to occur relatively rapidly. Above pH 11.4, the solubility of Si was calculated to steadily rise up to 10-0
·7 M at pH 12.3-12.5.
Leaching rates or/and diffusion coefficients of Ca, K, SToT, Si, AI and Na from the cementitious mixes were calculated using two different Fickian diffusion models. Based on the model results, the order of leaching rates was found to be the following:
Ca: 44 < f63 < L8 < R52
K: 44 << f63 ::::: L8 < R52
SToT: 44 < L8 << f63
Si: L8 < 44 ::::: f63
Al: 44 ::::: f63 < L8
The chemical speciation of excess sulphur in the equilibrating solution (artificial fresh groundwater, composition given in Table 2.1) for mix 44 was 100% sulphide, whereas for mixes f63 and L8, it was mainly sulphate.
More reliable estimates of the long-term leaching rates for some substances6 would require longer duration of experiments. Unfortunately, allowance of longer times makes predictions of chemical equilibria increasingly difficult due to the fact that e.g. the CSH phases begin to crystallize with time, thus giving rise to new phases. In addition, explicit coupling of transport with equilibrium chemistry would undoubtedly create a more comprehensive and lucid picture of the long-term evolution of the system.
6 Ca and Si from mix 44, Si and Al from mix f63, and Al from mix L8.
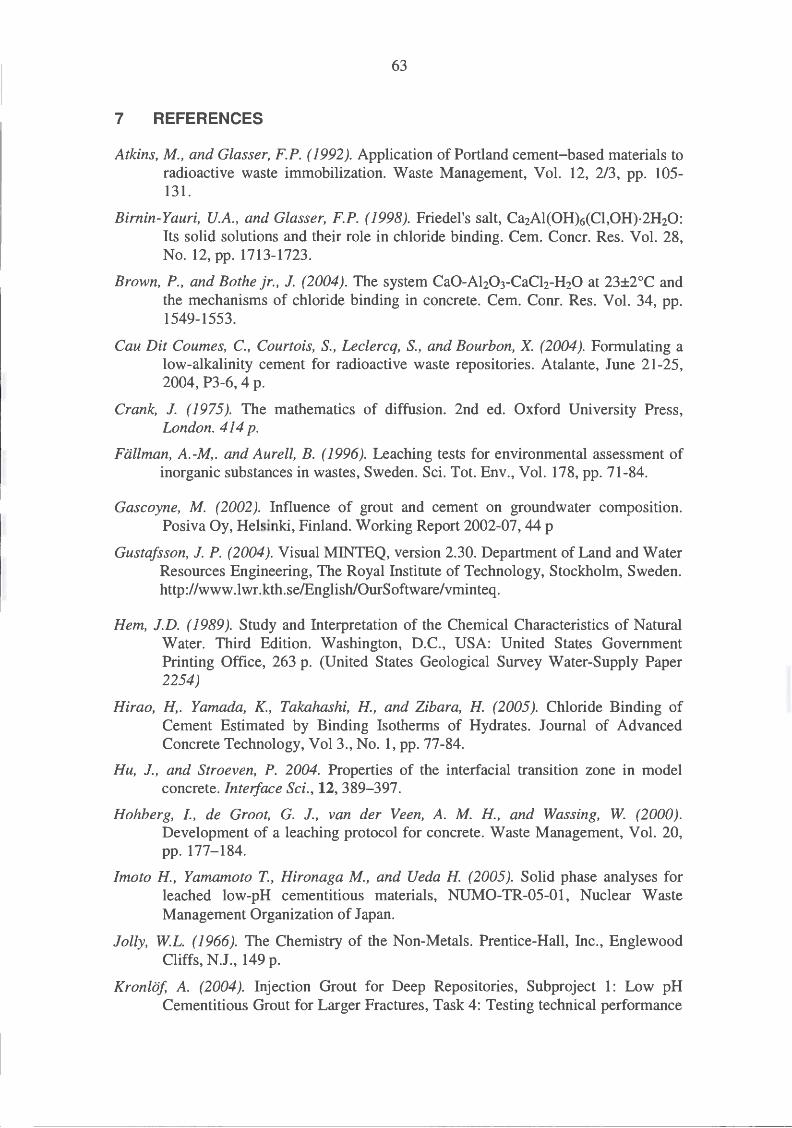
63
7 REFERENCES
Atkins, M., and Glasser, F.P. ( 1992 ). Application of Portland cement-based materials to radioactive waste immobilization. Waste Management, Vol. 12, 2/3, pp. 105-131.
Birnin-Yauri, U.A., and Glasser, F.P. (1998). Friedel's salt, Ca2Al(OH)6(Cl,OH)·2H20: Its solid solutions and their role in chloride binding. Cem. Concr. Res. Vol. 28, No. 12, pp. 1713-1723.
Brown, P., and Bothe jr., 1. (2004). The system Ca0-Ah03-CaCh-H20 at 23±2°C and the mechanisms of chloride binding in concrete. Cem. Conr. Res. Vol. 34, pp. 1549-1553.
Cau Dit Coumes, C., Courtois, S., Leclercq, S., and Bourbon, X. (2004 ). Formulating a low-alkalinity cement for radioactive waste repositories. Atalante, June 21-25, 2004, P3-6, 4 p.
Crank, 1. ( 1975). The mathematics of diffusion. 2nd ed. Oxford University Press, London. 414 p.
Fiillman, A.-M,. and Aurell, B. ( 1996). Leaching tests for environmental assessment of inorganic substances in wastes, Sweden. Sci. Tot. Env., Vol. 178, pp. 71-84.
Gascoyne, M. (2002 ). Influence of grout and cement on ground water composition. Posiva Oy, Helsinki, Finland. Working Report 2002-07,44 p
Gustafsson, J. P. (2004 ). Visual MINTEQ, version 2.30. Department of Land and Water Resources Engineering, The Royal Institute of Technology, Stockholm, Sweden. http://www.lwr.kth.se/English/OurSoftware/vminteq.
Hem, I . D. ( 1989 ). Study and Interpretation of the Chemical Characteristics of Natural Water. Third Edition. Washington, D.C., USA: United States Government Printing Office, 263 p. (United States Geological Survey Water-Supply Paper 2254)
Hirao, H,. Yamada, K., Takahashi, H., and Zibara, H. (2005). Chloride Binding of Cement Estimated by Binding Isotherms of Hydrates. Journal of Advanced Concrete Technology, Vol3., No. 1, pp. 77-84.
Hu, J., and Stroeven, P. 2004. Properties of the interfacial transition zone in model concrete. Interface Sci., 12, 389-397.
Hohberg, I. , de Groot, G. J., van der Veen, A. M. H. , and Wassing, W (2000) . Development of a leaching protocol for concrete. Waste Management, Vol. 20, pp. 177-184.
Imoto H., Yamamoto T., Hironaga M., and Ueda H. (2005). Solid phase analyses for leached low-pH cementitious materials, NUMO-TR-05-01, Nuclear Waste Management Organization of Japan.
Jolly, WL. ( 1966). The Chemistry of the Non-Metals. Prentice-Hall, Inc., Englewood Cliffs, N.J., 149 p.
Kronlof, A. (2004 ). Injection Grout for Deep Repositories, Subproject 1: Low pH Cementitious Grout for Larger Fractures, Task 4: Testing technical performance
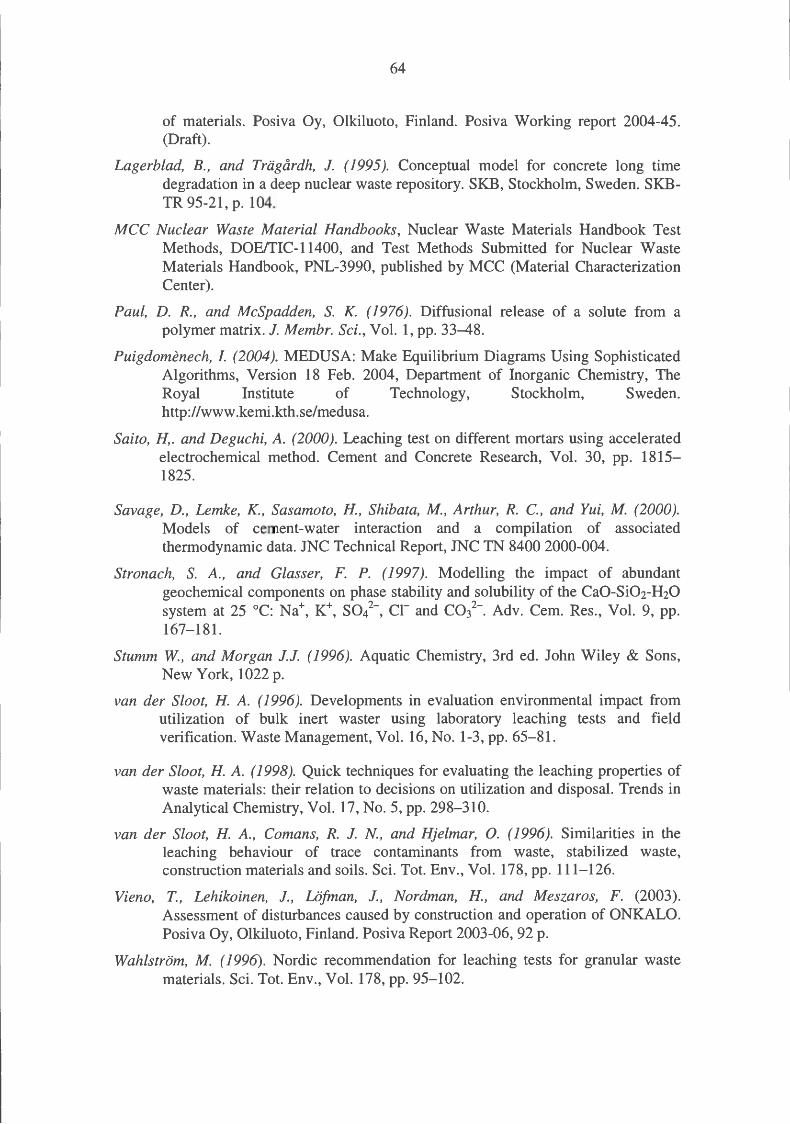
64
of materials. Posiva Oy, Olkiluoto, Finland. Posiva Working report 2004-45. (Draft).
Lagerblad, B., and Triigardh, 1. (1995). Conceptual model for concrete long time degradation in a deep nuclear waste repository. SKB, Stockholm, Sweden. SKBTR 95-21, p. 104.
MCC Nuclear Waste Material Handbooks, Nuclear Waste Materials Handbook Test Methods, DOE/TIC-11400, and Test Methods Submitted for Nuclear Waste Materials Handbook, PNL-3990, published by MCC (Material Characterization Center).
Paul, D. R. , and McSpadden, S. K. (1976). Diffusional release of a solute from a polymer matrix. 1. Membr. Sci., Vol. 1, pp. 33-48.
Puigdomenech, I. (2004). MEDUSA: Make Equilibrium Diagrams Using Sophisticated Algorithms, Version 18 Feb. 2004, Department of Inorganic Chemistry, The Royal Institute of Technology, Stockholm, Sweden. http://www .kemi.kth.se/medusa.
Saito, H,. and Deguchi, A. (2000). Leaching test on different mortars using accelerated electrochemical method. Cement and Concrete Research, Vol. 30, pp. 1815-1825.
Savage, D. , Lemke, K. , Sasamoto, H., Shibata, M., Arthur, R. C., and Yui, M. (2000). Models of cement-water interaction and a compilation of associated thermodynamic data. JNC Technical Report, JNC TN 8400 2000-004.
Stronach, S. A., and Glasser, F. P. (1997). Modelling the impact of abundant geochemical components on phase stability and solubility of the Ca0-Si02-H20 system at 25 oc: Na+, K+, sol-, er and col-. Adv. Cem. Res., Vol. 9, pp. 167-181.
Stumm W, and Morgan 1.1. (1996). Aquatic Chemistry, 3rd ed. John Wiley & Sons, New York, 1022 p.
van der Sloot, H. A. ( 1996). Developments in evaluation environmental impact from utilization of bulk inert waster using laboratory leaching tests and field verification. Waste Management, Vol. 16, No. 1-3, pp. 65-81.
van der Sloot, H. A. ( 1998 ). Quick techniques for evaluating the leaching properties of waste materials: their relation to decisions on utilization and disposal. Trends in Analytical Chemistry, Vol. 17, No. 5, pp. 298-310.
van der Sloot, H. A., Comans, R. 1. N., and Hjelmar, 0. (1996). Similarities in the leaching behaviour of trace contaminants from waste, stabilized waste, construction materials and soils. Sci. Tot. Env., Vol. 178, pp. 111-126.
Vieno, T. , Lehikoinen, 1. , Lofman, 1. , Nordman, H., and Meszaros, F. (2003). Assessment of disturbances caused by construction and operation of ONKALO. Posiva Oy, Olkiluoto, Finland. Posiva Report 2003-06, 92 p.
Wahlstrom, M. ( 1996). Nordic recommendation for leaching tests for granular waste materials. Sci. Tot. Env., Vol. 178, pp. 95-102.
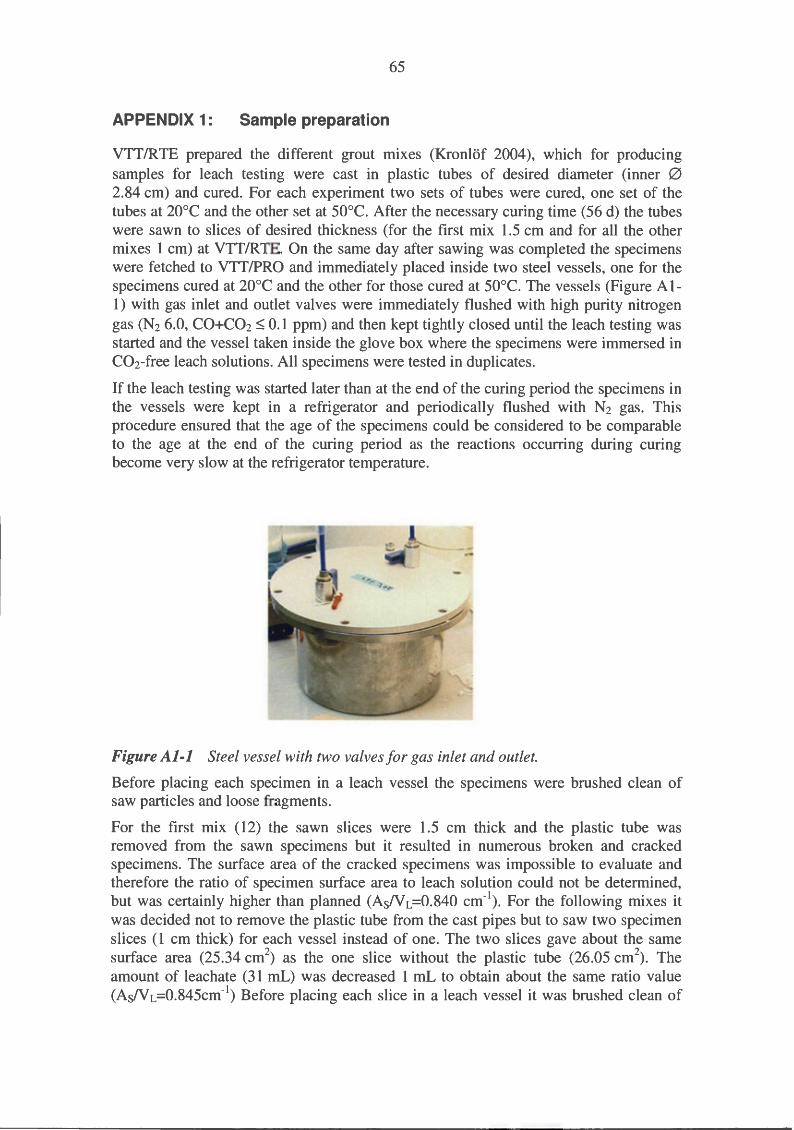
65
APPENDIX 1: Sample preparation
VTT/RTE prepared the different grout mixes (Kronlof 2004), which for producing samples for leach testing were cast in plastic tubes of desired diameter (inner 0 2.84 cm) and cured. For each experiment two sets of tubes were cured, one set of the tubes at 20°C and the other set at 50°C. After the necessary curing time (56 d) the tubes were sawn to slices of desired thickness (for the first mix 1.5 cm and for all the other mixes 1 cm) at VTT/RTE. On the same day after sawing was completed the specimens were fetched to VTT/PRO and immediately placed inside two steel vessels, one for the specimens cured at 20°C and the other for those cured at 50°C. The vessels (Figure A 1-1) with gas inlet and outlet valves were immediately flushed with high purity nitrogen gas (N2 6.0, CO+C02 ~ 0.1 ppm) and then kept tightly closed until the leach testing was started and the vessel taken inside the glove box where the specimens were immersed in C02- free leach solutions. All specimens were tested in duplicates.
If the leach testing was started later than at the end of the curing period the specimens in the vessels were kept in a refrigerator and periodically flushed with N2 gas. This procedure ensured that the age of the specimens could be considered to be comparable to the age at the end of the curing period as the reactions occurring during curing become very slow at the refrigerator temperature.
Figure Al-l Steel vessel with two valves for gas inlet and outlet.
Before placing each specimen in a leach vessel the specimens were brushed clean of saw particles and loose fragments.
For the first mix (12) the sawn slices were 1.5 cm thick and the plastic tube was removed from the sawn specimens but it resulted in numerous broken and cracked specimens. The surface area of the cracked specimens was impossible to evaluate and therefore the ratio of specimen surface area to leach solution could not be determined, but was certainly higher than planned (AsNL=0.840 cm-1
). For the following mixes it was decided not to remove the plastic tube from the cast pipes but to saw two specimen slices ( 1 cm thick) for each vessel instead of one. The two slices gave about the same surface area (25.34 cm2
) as the one slice without the plastic tube (26.05 cm2). The
amount of leachate (31 mL) was decreased 1 mL to obtain about the same ratio value (AsN L=0.845cm-1
) Before placing each slice in a leach vessel it was brushed clean of
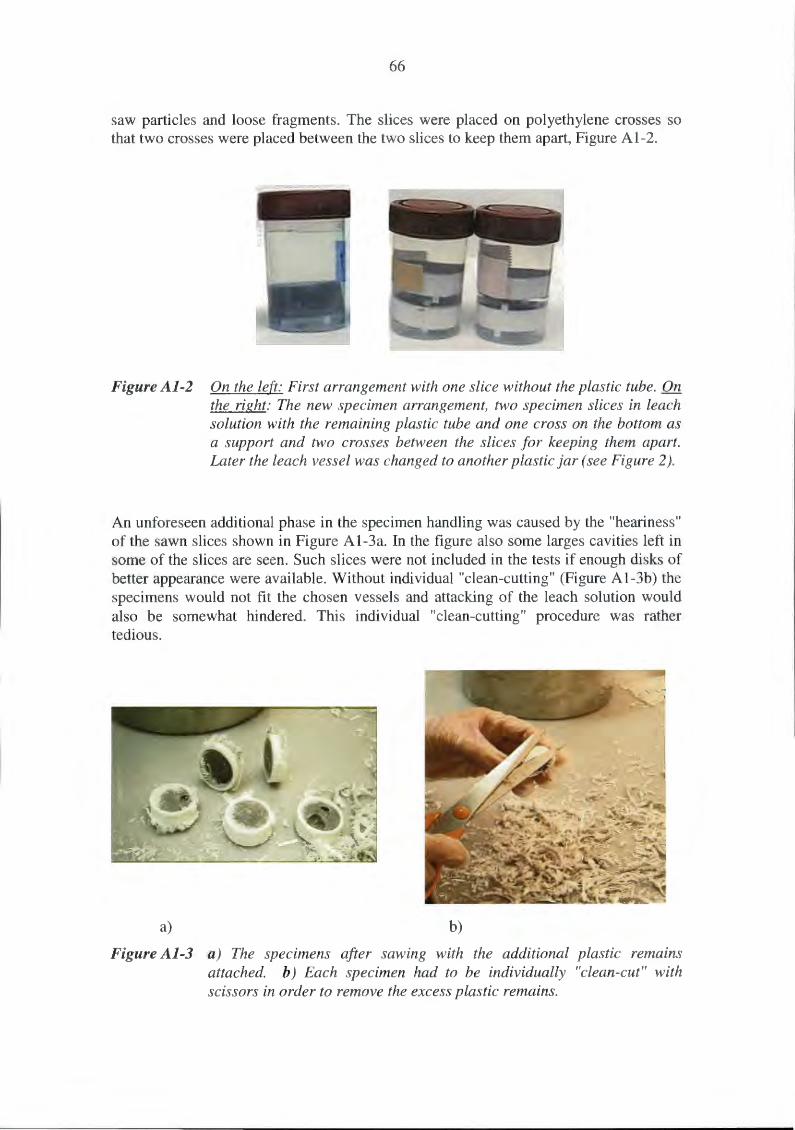
66
saw particles and loose fragments. The slices were placed on polyethylene crosses so that two crosses were placed between the two slices to keep them apart, Figure A 1-2.
Figure Al-2 On the left: First arrangement with one slice without the plastic tube. On the right: The new specimen arrangement, two specimen slices in leach solution with the remaining plastic tube and one cross on the bottom as a support and two crosses between the slices for keeping them apart. Later the leach vessel was changed to another plastic jar (see Figure 2 ).
An unforeseen additional phase in the specimen handling was caused by the "heariness" of the sawn slices shown in Figure A 1-3a. In the figure also some larges cavities left in some of the slices are seen. Such slices were not included in the tests if enough disks of better appearance were available. Without individual "clean-cutting" (Figure Al-3b) the specimens would not fit the chosen vessels and attacking of the leach solution would also be somewhat hindered. This individual "clean-cutting" procedure was rather tedious.
a) b)
Figure Al-3 a) The specimens after sawing with the additional plastic remains attached. b) Each specimen had to be individually "clean-cut" with scissors in order to remove the excess plastic remains.
67
APPENDIX 2: pH results in equilibrium tests
Reference mix: 52, and slag mixes: 44, S14, S20, and L8
:I: a.
:I: a.
:I: 0..
l: a.
:I: a.
12.5
12.0
11 .5
11.0
10.5
10.0
9.5
9.0
12.5
12.0
11 .5
11.0
10.5
10.0
9.5
Experiment 52 : ALL·MR
5d 1w 2w 3w 6w 10w 15w 20w
Experiment 44 : ALL·MR
2d 4d 1w 2 w 3w 4w 5w 6w 7w 10w 15w 20w Experiment S14 (1): ALL·MR
12.5 ....--------------------,
12.0
11.5
11 .0
10.5
10.0
9.5
9.0 3d 1w 2w 4w 6w tOw 15w 20w
Experiment S20 : ALL-MA 12.5
12.0
11 .5
11 .0
10.5
10.0
9.5
9.0 3d 1w 2w 3w 6w 10w 15w 20w
Experiment L8 : ALL·MR 12.5
12.0
11.5
11 .0
10.5
10.0
9.5
9.0 3d 1w 2w 3w 6w 10w 15w 20w
Sampling point
a) 52
b) 44
• AL20
•ALSO
c) S14
d) S20
e) L8
Experiment 52 : OL·SR
12.5
12.0
11.5
:I: 11 .0 a.
10.5
10.0
9.5
9.0 5d 1w 2w 3w 6w 10w 15w 20w
Experiment 44: OL·SR 12.5 .----------------.....,
12.0 - - - - - - - - - - - - - - - - - - - - - - - - - - -
11.5 -- - ---- -- -- -- --- --------- --
:I: 11 .0 +-----------------~-~ a.1o.5 - I~
:I: a.
l: a.
l: c..
10.0
9.5
12.5
12.0
11 .5
11 .0
10.5
10.0
9.5
9.0
12.5
12.0
11.5
11.0
10.5
10.0
9.5
9.0
12.5
12.0
11.5
11.0
10.5
10.0
9.5
9.0
1w 2w 3w 4w Sw 6w 7w 10w 15w 20w
Experiment S14 (1): OL.SR
3d 1w 2w 4w 6w 10w 15w 20w
Experiment S20: OL·SR
3d 1w 2w 3w 6w 10w 15w 20w
Experiment L8 : OL·SR
3d 1w 2w 3w 6w 10w 15w 20w Sampling point
Figure A2-1 pH results in equilibrium tests; sub-figures on the left for ALL-MR (fresh) and sub-figures on the right for OL-SR (saline). The x- axis in each histogram gives the time of sampling in days or weeks from the beginning, and the y-axis gives the pH-values measured. In the legend text 20 and 50 refer to the curing temperature of the specimen, and AL and OL to the leachates, ALL-MR and OL-SR, respectively. The line(orange) across each sub-figure depicts the target value of pH ( = 11 ). NOTE! Testing in the saline leachate was stopped and continued only with the fresh AL-MR, therefore always both values are not presented.
68
OPC-SF mixes: 12, f63, f64, w 1, and w2
12.5
12.0
11 .5
11.0 ~
10.5
10.0
9.5
9.0
12.5
12.0
11.5
11 .0
~ 10.5
10.0
9.5
9.0
12.5
12.0
11.5
11.0 ~
10.5
10.0
9.5
9.0
12.5
12.0
11 .5
11.0 ::t: c..
10.5
10.0
9.5
9.0
12.5
12.0
11.5
11 .0 ~
10.5
10.0
9.5
9.0
Experiment 12: ALL-MR
2d 4d 1w 2w 3w 4w 5w 7w aw 10w Experiment f63 : ALL-MR
2d Sd 1w 2w 3w 4w 6w Sw 10w 15w 20w
Experiment f64: ALL·MR
2d Sd 1w 2w 3w 6w 10w 15w 20w 25w
Experiment W1 : ALL·MR
- - - -
3d 1w 2w 3w 4w 6w 10w 15w 20w
Experiment W2: ALL·MR
a) 12
b) f63
c) f64
d)wl
•AL20
•ALSO
e) w2
[iAl2ol ----~
2d Sd 1w 2w 4w 6w 12w 15w 20w
Sampling point
Experiment 12: OL-SR 12.5
12.0
11 .5
11.0 - - - ~ - ~ - - ~ ~
::t: c..
J: a.
J: c..
J: a.
10.5
10.0 -
9.5
9.0 2d 4d 1w 2w 3w 4w 5w 7w 8w 10w
Experiment f63 : OL·SR 12.5 -,--- ---------------,
12.0 - - - - - - - - - - - - - - - - - - - - - - - - - -
11.5 ---------------- - ---------
11 .0 +----------------+ 10.5 - - - - - - - - - - - - - - - - - -
10.0
9.5
9.0 +--"'-r"'......,_ ................... ~-......~Lr"'u..>........,.-....,.--,---1
12.5
12.0
11 .5
11 .0
10.5
10.0
9.5
9.0
12.5
12.0
11.5
11.0
10.5
10.0
9.5
9.0
12.5
12.0
11.5
11.0
10.5
10.0
9.5
9.0
2d Sd 1w 2w 3w 4w 6w Sw 10w 15w 20w
Experiment 164: OL·SR
2d 5d 1w 2w 3w 6w 10w 15w 20w 25w Experiment W1 : OL·SR
1-------
1- -- -- --
3d 1w 2w 3w 4w 6w 10w 15w 20w
Experiment W2: OL-SR
2d Sd 1w 2w 4w 6w 12w 15w 20w
Sampling point
• OL20 ~ OLSO
• OL20
OLSO
Figure A2-2 pH results in equilibrium tests; sub-figures on the left for ALL-MR (fresh) and sub-figures on the right for OL-SR (saline). The x- axis in each histogram gives the time of sampling in days or weeks from the beginning, and the y-axis gives the pH-values measured. In the legend text 20 and 50 refer to the curing temperature of the specimen, and AL and OL to the leachates, ALL-MR and OL-SR, respectively. The line(orange) across each sub-figure depicts the target value of pH ( = 11 ). NOTE! Testing in the saline leachate was stopped and continued only with the fresh AL-MR, therefore always both values are not presented.
69
APPENDIX 3: pH results in diffusion tests
12.5
12.0
11.5
Experiment 52 (D): ALL-MR -
Experiment 52 (D): OL-SR
a) 52 12.5 12.0 -
----
11 .5
== 11.0 ~-----~I-IH~++~HI-I._. ....... .._~HI---l ~ 11 o - ~ ~ . 10.5
10.0
9.5
9.0 +--,..-,.--,.....,.....,....,_.'-r--~...-....a.,J ... ..,..t,A.-.,.-.,---,.....,... ... "'-,----1
1 2 3 4 5 6 7 8 9 10 11 12 13 14 15 16 17 18 19 20 21 22
Experiment f63 (D): ALL-MR 12.5 ..--------------------,
10.5
10.0
9.5
---
---
9.0 +--,..a,..a,J...,... ... t,.a.,.a.,,..a,.a,~.,..,...L,a,..a,..a,J...,_. ... I,A,....--,...---l
1 2 3 4 5 6 7 8 9 10 11 12 13 14 15 16 17 18 19 20 21 22
Experiment f63 (D): OL-5R 12.5 .---------------------,
12.0 - - - - - - - - - - - - - - - - - - -- - - - - - - - - - - - - b) f6312.0
11 .5 ------- - ------------------ - -----
:z: 11.0 ........ l-+-1-1-11-+~1-1---.-...t ............. ~l-+-l-.... 1-+-.---l ~
0..10.5 ~
10.0 L 9.5 I 9.0 ~ ..... ...-~ ...... ....-,-......,...,-,-..,......,.L,-,.-,..IJ.,.IIli.,-,...,.L,L~~
1 2 3 4 5 6 7 8 9 10 11 12 13 14 15 16 17 18 19 20 21 22 23 24 25 26
Experiment W1 (0): ALL-MR 12.5 .-------..:.._ __ .:._;__ ______ _ ____,
11.5 --------------------------------
11 .0 +------------------~ :z: 0..10.5
10.0
9.5
1 2 3 4 5 6 7 8 9 10 11 12 13 14 15 16 17 18 19 20 21 22 23 24 25 26
Experiment W1 (0): OL.SR 12.5 ..-------__:._ ________ ___ ___,
12.0 -------------------------------- c) wl12.o
11 .5 - - - - - - - - - - - -- - - - - - - - -- - - - - - - --- -
:z: 11 .0 f---l~r+ .... r-::-........ H ... ~ ... I-:r---: .... r-::r~~--1 • AL 20
CL 10.5 AL 50
10.0
9.5
1 2 3 4 5 6 7 8 9 10 11 12 13 14 15 16 17 18 19 20 21 22 23 24 25 26
Experiment 44 (D): ALL-MR 12.5 ..------ ---------------,
11 .5 - - - - - - - - - - - ---- ---- - - - - - - - - - - - - -
11 .0 +------------------~ :z: CL 10.5
1 2 3 4 5 6 7 8 9 10 11 12 13 14 15 16 17 18 19 20 21 22 23 24 25 26
Experiment 44 (D): OL·SR 12.5 ..--------------------,
12.0 -------------------------------- d) 44 12.0
11 .5 --------------------------------
:z: 11.0 +---t ... ~ ..... ~ ...... .-.! ... ~ ....... ~ ..... 1-+~I-I~I~[UL2olc-:-::-::lo
0..10.5 I~
10.0
9.5
1 2 3 4 5 6 7 8 9 10 11 12 13 14 15 16 17 18 19 20 21 22 23 24 25 26
Experiment LB (D): ALL-MR 125 .--------------- -----,
11 .5 --------------------------------
~ :::: +-_-_-_-_-_-_-_-_-_-_-_ -_-_-_-_-_-_-_- _-_-_-_-_-_-_- _-_-_-_-_-_- _11 r;~~-;;;;]
:: ~ e -
9.0 1 2 3 4 5 6 7 8 9 10 11 12 13 14 15 16 17 18 19 20 21 22 23 24 25 26
Experiment LB (D): OL·SR 12.5.--------------------,
12.0 1-- - - -- --- - ------------ ---- -------- e) LS 12.0
115 - - - - - - - - - - - - - - - - - -- - -- - - - - - - - -- - 11 .5 - - - - - - - - - - - - - - - - - - - - - - - - - - - - - -- - -
11 .0 ..... ~ .... --.t ........................... --.t ..... ._.l-4 ............ ...,_ -1 11 .0 -f--------------------1 :z: I• AL20 I ~ I• OL20 I 0..10.5 10.5
10.0
9.5
1 2 3 4 5 6 7 8 9 10 11 12 13 14 15 16 17 18 19 20 21 22
Sampling point
10.0
9.5
------------------ -
1 2 3 4 5 6 7 8 9 10 11 12 13 14 15 16 17 18 19 20 21 22
Sampling point
Figure A3-1 pH results in diffusion tests; sub-figures on the left for ALL-MR (fresh) and sub-figures on the right for OL-SR (saline). The x- axis in each histogram gives the time of sampling in days or weeks from the beginning, and the y-axis gives the pH-values measured. In the legend text 20 and 50 refer to the curing temperature of the specimen, and AL and OL to the leachates, ALL-MR and OL-SR, respectively. The line(orange) across each sub-figure depicts the target value of pH ( = 11 ). NOTE! Testing in the saline leachate was stopped and continued only with the fresh AL-MR, therefore always both values are not presented ..

70
71
APPENDIX 4: pH and alkalinity figures
13.0
12.5
12.0
11.5
~ 11.0
10.5
10.0
9.5
9.0
13.0
12.5
12.0
11.5
~ 11.0
10.5
10.0
9.5
9.0
13.0
12.5
12.0
11.5
~ 11.0
10.5
10.0
9.5
9.0
13.0
12.5
12.0
11.5
~ 11.0
10.5
10.0
9.5
9.0
12 (EQ) a)
1d 2 3 4 1d 2 3 4
2d 3
1 4
•
•
3d
f63 (EQ) b)
6 10 15 20 2d 3 6 10 15 20
w1 (EQ) d)
6 10 15 20 1 4 6 10 15
s14 (EQ) f)
•
.... .... .... ~ "
3d
sampling points [weeks]
55
45 .... _. 40 ~
35 ~ 30 '";:
0 25 ....
.¥
20 ;;(
15
10
f64 (EQ) c) 13.0
6 12.5
6
5-~
12.0 5-~
4 0 E
11.5 40 e 3 s ~ 11.0 3.§. e 10.5
.... 0
2 ..lll: 10.0
2.: ;;( ;;(
9.5
0 9.0 0 2d 1 3 6 10 15 20 2d 1 3 6 10
w2 (EQ) e) 13.0
6 12.5 6
5- 12.0 5-~ ~
4 0 11.5 4 0 e e 3 -e ~ 11.0 3-e
0 10.5 0
2; 2; ;;( 10.0 ;;(
9.5
0 9.0 0 2d 1 4 6 12 15 20 2d 1 4 6 12
20 19 12.5 +--------::---WI-------f---------:1 6 18 17 ~ 12.0 +---t::.-----__,.__-----f--------;r 5 ~
16 ~ 11.5 4 ~ 15 E. ~ 11.0 3 E. 14 ~ 10.5 ~ 13 .¥ 2 .¥ 12 ;;( 10.0 ;;( 11 9.5 +--- - ------1--------j
1 0 9.0 J:._~L........J.--L.._..J..._,L__J...._-'---1 -....___.J...____;L........J.~ 0
3d 1 2 3 6 1 0 15 20 3d 1 2 3
sampling points [weeks]
Figure A4-l pH and total alkalinity (titration) values in equilibrium tests (EQ). Alkalinity is given in mmol/L. Each sub-figure shows values in both the fresh (ALL-MR) and the saline (OLSR) leachates; the points on the left of the line in the middle of each sub-figure are for ALL-MR and those on the right (the light blue area) are for OL-SR. The x-axis gives the point in time of sampling.
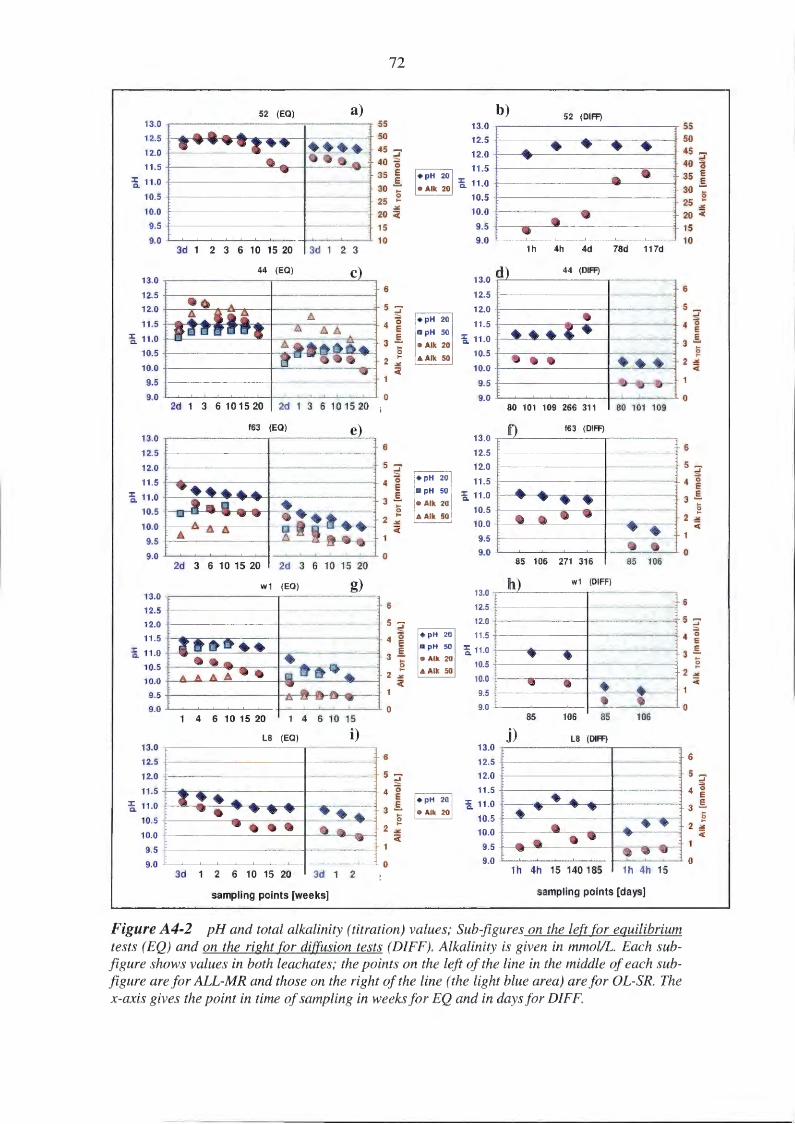
52 (EQ) a) 13.0
12.5
12.0
11.5
~ 11.0
10.5
10.0
9.5
9.0 3d 1 2 3 6 10 15 20 3d 1 2 3
44 (EQ) c 13.0
12.5
12.0
11.5
~ 11.0
10.5
10.0
9.5
9.0 2d 1 3 6101520 2d 1 3 6 10 15 20
f63 (EQ) e 13.0
12.5
12.0
11.5
~ 11.0
10.5
10.0
9.5
9.0 2d 3 6 10 15 20 2d 3 6 10 15 20
w1 (EQ) g) 13.0
12.5
12.0
11.5
:a 11.0
10.5
10.0
9.5
9.0 1 4 6 10 15 20 1 4 6 10 15
L8 (EQ) i) 13.0
12.5
12.0
11.5
~ 11.0
10.5
10.0
9.5
9.0 3d 1 2 6 10 15 20 3d 1 2
sampling points [weeks]
72
55 50
45 ::i' 40 15 35 ~ 30 5 25 1-
.X 20 Ci 15 10
6
5~ 4 0 e 3.§.
1-0
2; Ci
0
6
5~ 4 0 e 3.§.
1-0
2; Ci
0
6
5~ 4 0 e 3§.
15 1-
2 .X
<
0
6
5-~
4 0 e 3.§.
15 2;
Ci
0
b) 52 (DIFF) 13.0
12.5
12.0
11.5
:a. 11.0
10.5
10.0
9.5
9.0
13.0 d 12.5
12.0
11.5
a 11.0
10.5
10.0
9.5
9.0
13.0
12.5
12.0
11.5
a 11.0
10.5
10.0
9.5
9.0
13.0
12.5
12.0
11.5
~ 11.0
10.5
10.0
9.5
9.0
13.0
12.5
12.0
11.5
a 11.0
10.5
10.0
9.5
9.0
..... • • • • .... a 0
_G • \I
1h 4h 4d 78d 117d
44 (DIFF)
80 101 109 266 311 80 101 109
f63 (DIFF)
85 106 271 316 85 106
h) w1 (DIFF)
• • " Q • ..
~ t 85 106 85 106
j) L8 (DIFF)
1h 4h 15 140 185 1h 4h 15
sampling points [days]
Figure A4-2 pH and total alkalinity (titration) values; Sub1igures on the left for equilibrium tests (EQ) and on the right for diffusion tests (DIFF). Alkalinity is given in mmol/L. Each subfigure shows values in both leachates; the points on the left of the line in the middle of each subfigure are for ALL-MR and those on the right of the line (the light blue area) are for OL-SR. The x-axis gives the point in time of sampling in weeks for EQ and in days for DIFF.
55 50
45 ::i' 40 ~
35 ~ 30 ~ 25 ; 20 Ci 15 10
6
5~ s
4 0 e 3 .§.
~ 2 ::!!:
c(
0
6
5::~ 4 ~ e 3~
0
2; Ci
0
6
5~
4 ~ 3-e
0
2; Ci
0
6
5::~ :::.
4 0 e 3.§.
::; 2 .;
c(
0
73
APPENDIX 5: Analytical results of leachates (DIFF test)
The results of the chemical analysis of the leachates extracted in the diffusion tests are shown in the following Figures A4-1. .. A4-4.
• Figure AS-1: mix 52
• Figure AS-2: mix 44
• Figure AS-3: mix f63
• Figure AS-4: mix L8
For each mix the results include histograms for pH, so4 and SToT, Na, Ca, K, Al, S04, Mg, Cl and Si. Some details on the histograms:
• The x-axis gives the category number of the sampling points and the time in days from the beginning of the leach testing is given in Table A5-1, in Appendix 5.
• They-axis gives the concentration of analysed substances in mg/L, except in the histogram including results for both so4 and SToT (the upper right sub-figure in each figure) when mmol/L is used and in the case of pH (the upper left subfigure in each figure).
• In the pH histograms (the upper left sub-figure in each figure) the line across (orange) the figures depict the target pH-value of 11.
• In the other histograms the line across (blue) depicts the concentration of the corresponding substance initially present in the fresh leachate (ALL-MR), but in the case of Al the line (pink) depicts the detection limit of Al, because Al is not initially present in ALL-MR.
• In the Mg histograms two lines across the sub-figures are depicted; the line (blue) at 0.7 mg/L gives the initial concentration in ALL-MR and the line (pink) at 0.02 mg/L gives the detection limit of M g ..
In figures A5-2 and A5-3 some data points lack a result for Al, which is due to analyses performed at different occasions at which the detection limits have not been the same. Otherwise in figures Al and Mg data points lacking values have been below the detection limit (pink line) of the analytical method used. In addition to the histograms the numerical values of the analytical results, other than pH and alkalinity, are shown in Table AS-1.
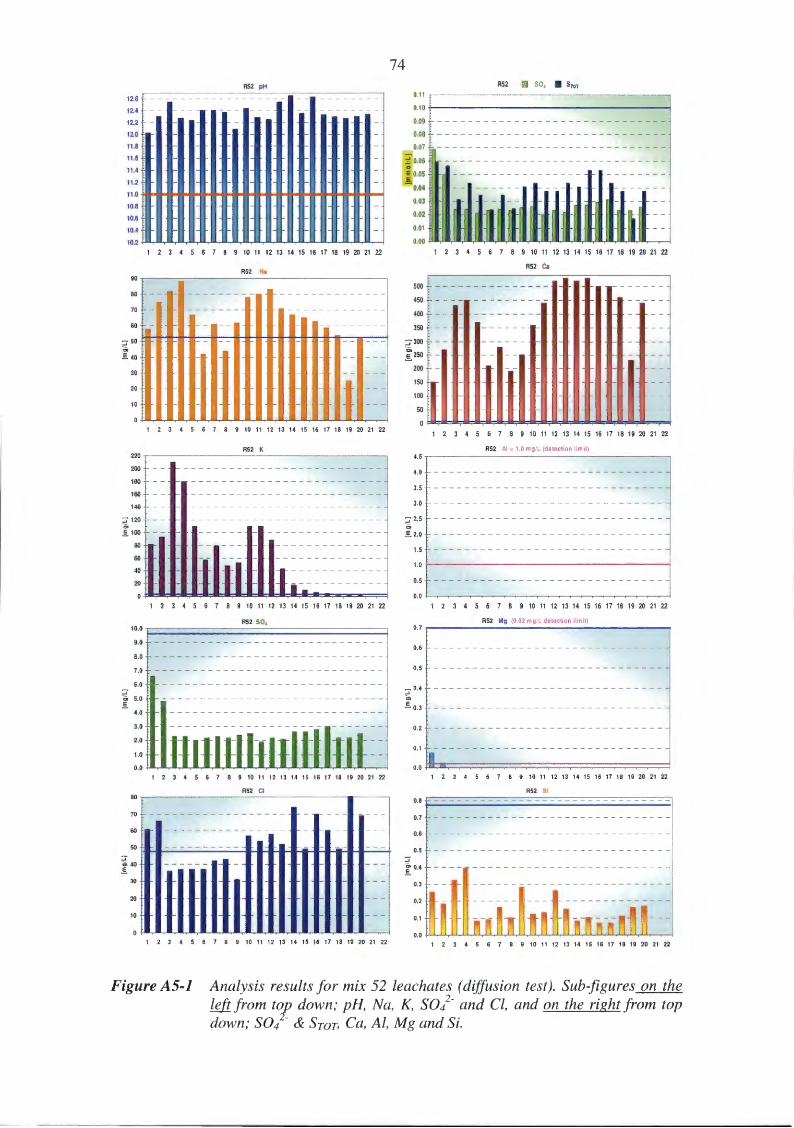
74 R52 pH
12.6 - - - - - - - - - - - - - - - - - -
12.4
12.2
12.0
11 .8
11 .6
11 .4
11.2
11 .0 -HI-tt-tt-ft-41-tt-tt-11Jo4ofto*'***'*'*-f+**'*'*.....j 10.8
10.6
10.4
10.2 -f'o'L,-IA,-JA~,......,..-,......,......,......,......,.......,......,......,......,.......,......,......,......,......,......,.......---1
1 2 3 4 5 6 7 8 9 10 11 12 13 14 15 16 17 18 19 20 21 22
R52 Na 90 ,------=------------------------------------~
80
70
60
~50
.§. 40
.... c;, .§.
30
20
10
1 2 3 4 5 6 7 8 9 10 11 12 13 14 15 16 17 18 19 20 21 22
R52 K 220 ,------------------------------------------.
200
180
160
140
80
60
40
20
10.0
9.0
8.0
7.0
6.0
5.0
4.0
3.0
2.0
1.0
0.0
1 2 3 4 5 6 7 8 9 10 11 12 13 14 15 16 17 18 19 20 21 22
R52 S04
1 2 3 4 5 6 7 8 9 10 11 12 13 14 15 16 17 18 19 20 21 22
R52 Cl 80 ,-----------------------------------~~----~
ro ------------------ - r---
60
~ ~~---------------------------------~~~~~~~----+ ::::1 0,40 .§.
30
20
10
1 2 3 4 5 6 7 8 9 10 11 12 13 14 15 16 17 18 19 20 21 22
R52 so. • Sror 0.11 ,---------------------------------------------,
0.10 +-------------------------------------------! 0.09
0.08
0.07
~ 0.06
E 0.05 E - 0.04
0.03
0.02
0.01
0.00 -fUI.,.UO.,.UO.,.UO.,.UO.,.UO.,.UO.,......,...,.ua.,...,.uo.,.uo.,.uo.,.,...,,.,...,c'A,,.,...,c'A,.....,----,----1
500
450
400
350
::.;300
~250 200
150
100
50
1 2 3 4 5 6 7 8 9 10 11 12 13 14 15 16 17 18 19 20 21 22
R52 ea
1 2 3 4 5 6 7 8 9 10 11 12 13 14 15 16 17 18 19 20 21 22
R52 AI< 1.0 mg/L {deteclion limit) 4.5 -r-------------------------------------------,
u ------------------------------
u ------------------------------3.0
::.; 2.5 -------------------------------~2.0 -------------------------------
1.5 -------------------------------1.0 +--------------------------------------------1 u -------------------------------
1 2 3 4 5 6 7 8 9 10 11 12 13 14 15 16 17 18 19 20 21 22
R52 Mg {0.02 mg/L detection limit) 0. 7 ,....-------------------------------------------,
u -------------------------------
u -------------------------------
~0.4
.§. 0.3
-------------------------------
u ------------------------------
~1 ------------------------------:n 0.0 _f:lt;n::;:::;::::;::::;::::;::::;::::;:::::;:::~:::;::::;::::;::::;:::;:::::;::::;::::;:::::;:::::;:=!
1 2 3 4 5 6 7 8 9 10 11 12 13 14 15 16 17 18 19 20 21 22
R52 SI
u - - -----------------------------
u -------------------------------
0.6
0.5 ::::1 ~0.4
0.3
0.2
1 2 3 4 5 6 7 8 9 10 11 12 13 14 15 16 17 18 19 20 21 22
Figure AS-1 Analysis results for mix 52 leachates (diffusion test). Subjigures on the left from top down; pH, Na, K, sol- and Cl, and on the right from top down; sol-& SToT, Ca, Al, Mg and Si.
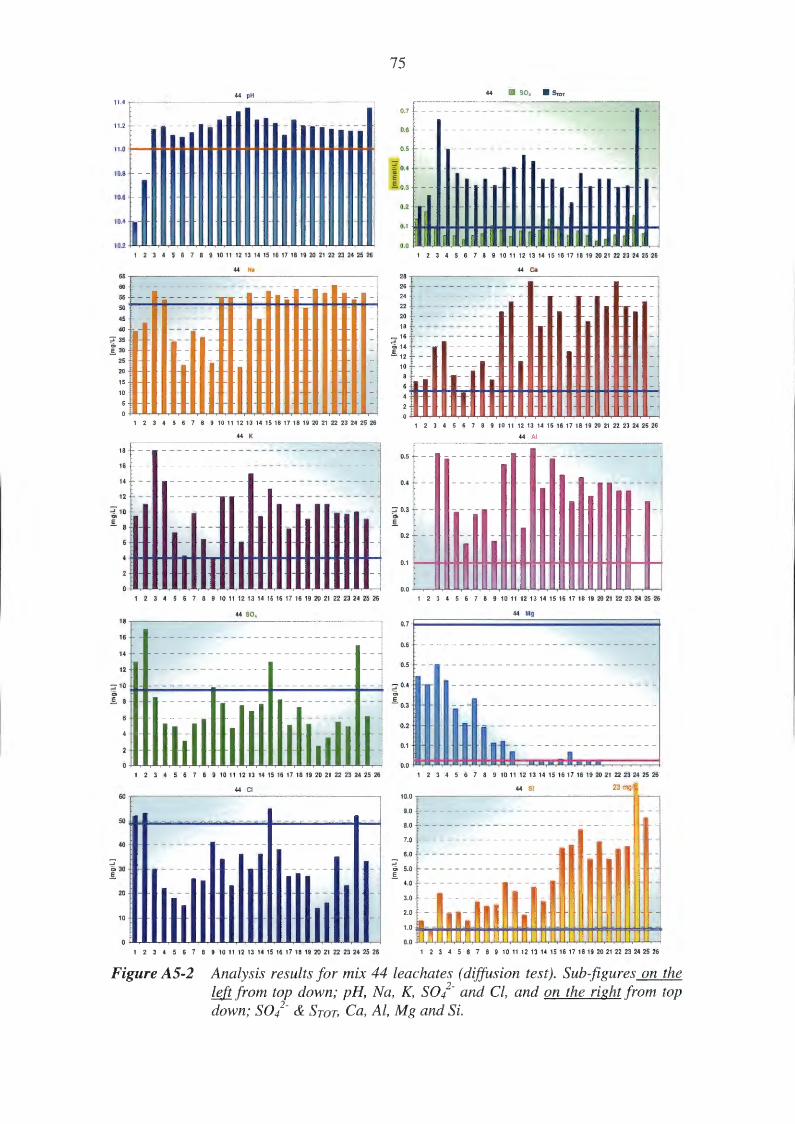
44 pH 11.4 -..----------------------.,
11.2 - - - - - - - -
11.0 +-----lHt4+ .. HI-+~Ht4+ .. HI-+..-tH ... +..-tli
10.8
10.6
1 2 3 4 5 6 7 8 9 10 11 12 13 14 15 16 17 18 19 20 21 22 23 24 25 26
44 Na 65 .---------------------.
~ -------------------------55 -------
50
45
40 --
::r 35 a, .§.. 30
25
20
15
10
18
16
14
12
1 2 3 4 5 6 7 8 9 10 11 12 13 14 15 16 17 18 19 20 21 22 23 24 25 26
44 K
~10 -.§:
t 11-1 2 3 4 5 6 7 8 9 10 11 12 13 14 15 16 17 18 19 20 21 22 23 24 25 26
44 so. 18 .---------------------.
16 - - - - - - - - - - - - - - - - - - - - - - - - - - - - -
14 - - - - - - - - - - - - - - - - - - - - - - - - - -
12
::r10 ~~---------------~-~---------------------------------------~--~
i 8
-t I 1 2 3 4 5 6 7 8 9 10 11 12 13 14 15 16 17 18 19 20 21 22 23 24 25 26
44 Cl 60 ,---------------------,
50 ~~---------------------------------------- ------------------.. --~ 40
20
10 t I 1 2 3 4 5 6 7 8 9 10 11 12 13 14 15 16 17 18 19 20 21 22 23 24 25 26
75
44 so. • Sror
0.7
0.6
0.5
~ 0.4 E .§.. 0.3
1 2 3 4 5 6 7 8 9 10 11 12 13 14 15 16 17 18 19 20 21 22 23 24 25 26
44 Ca 28 .---------------------.
~ -------------- ----------24 - - - - - - - - - - - - - -
22 - - - - - - - - - - - - -
20 ----------
18 - - - - - - - - - -
::r 16 a, 14 .§.. 12
10
8 .~
lt ~ 1 2 3 4 5 6 7 8 9 10 11 12 13 14 15 16 17 18 19 20 21 22 23 24 25 26
44 AI
~ -- --------- - ----------------
0.4
~ 0.3
.§:
...I
0.2
0.1 +-----ll++++t-+t-+H++t++-l++t-l++++t-t++HI++H+-I++H+--++--1
1 2 3 4 5 6 7 8 9 10 11 12 13 14 15 16 17 18 19 20 21 22 23 24 25 26
u -------------------------------
0.5
1 2 3 4 5 6 7 8 9 10 11 12 13 14 15 16 17 18 19 20 21 22 23 24 25 26
44 SI 23 mg 10.0 -..---------------------1 -
u --------------------------
u ---------------------------
n -------------------- ------
6.0 - - - - - - - - - - - - - - - - -
"' 5.0 .§..
-4.0 - - - - - - - - - -
3.0 -------
::: ~~ - n n ~- : ~ ~ o.o 1 n 111111 1111
Jt 11
-
-
-
1 2 3 4 5 6 7 8 9 10 11 12 13 14 15 16 17 18 19 20 21 22 23 24 25 26
Figure AS-2 Analysis results for mix 44 leachates (diffusion test). Sub-figures on the !&f1.from top down; pH, Na, K, sol- and Cl, and on the right from top down; sol- & Sror, Ca, Al, Mg and Si.
163 pH 11 .4 .------------------------,
11.2
11 .o +ti-~H ... + .. H~+ .. H+~H ... +.-tH~.-- I
10.8
10.6
10.4
1 2 3 4 5 6 7 8 9 10 11 12 13 14 15 16 17 18 19 20 21 22 23 24 25 26
163 Na ~ .--------------------~
50 ---------
40
20
10
1 2 3 4 5 6 7 8 9 10 11 12 13 14 15 16 17 18 19 20 21 22 23 24 25 26
163 K 65 ~-------------------~
~
55
50
45
40
~ 35 .§. 30
25
20
15
10
s ~~~~~~H~~~~~~~~~~~~~~
1 2 3 4 5 6 7 8 9 10 11 12 13 14 15 16 17 18 19 20 21 22 23 24 25 26
163 so.
ro -------------- -------------
~ ---------------------------
50
1 2 3 4 5 6 7 8 9 10 11 12 13 14 15 16 17 18 19 20 21 22 23 24 25 26
163 Cl 00 .---------------------,
ro ----------------------
~ ----------------
50 - - --
30
20
10
1 2 3 4 5 6 7 8 9 10 11 12 13 14 15 16 17 18 19 20 21 22 23 24 25 26
76
163 SO, • Sror 1.0.----------------------,
0.9
0.8
0.7
~ 0.6
~ 0.5
.§. 0.4
0.3
0.2
o.1 -H+Iol++lHI~+Io+HHI*'~HII*+Ioi~HI*~HHifoHio"""" 0.0 -flA,,....,...,....,.....,...,....,..,.....,...,....,.....,...,.....,......,....,.,ca,.u.,....ya,-,....,....,.....,...,---1
1 2 3 4 5 6 7 8 9 10 11 12 13 14 15 16 17 18 19 20 21 22 23 24 25 26
163 ea 40 .---------------------.
35
30
25
...J <;, 20 .§.
15
10
i
1 2 3 4 5 6 7 8 9 10 11 12 13 14 15 16 17 18 19 20 21 22 23 24 25 26
163 AI 1.0 .,-----------------------,
0.9
0.8
0.7
0.6 ...J
<;, 0.5 E -0.4 -------------
1 2 3 4 5 6 7 8 9 10 11 12 13 14 15 16 17 18 19 20 21 22 23 24 25 26
163 Mg
~ -------------------- ----------
0.5
":j 0.4 <;, E -o.3
0.2
1 2 3 4 5 6 7 8 9 10 11 12 13 14 15 16 17 18 19 20 21 22 23 24 25 26
163 Si 23 ~ WL 10.0 .-------------------1\----,
~ -------------------- -- -- --
6.0 ...J
"" .§. 4.0
2.0
0.0 111111 11 l 1 2 3 4 5 6 7 8 9 10 11 12 13 14 15 16 17 18 19 20 21 22 23 24 25 26
Figure AS-3 Analysis results for mix f63 leachates (diffusion test).Sub-figures on the left from top down; pH, Na, K, sol- and Cl, and on the right from top down; sol- & Sror, Ca, Al, Mg and Si.
L8 pH 11.4 .-----------__.:._ __________ ........,
11.2
11.0 +--............................................ ~
...J
"'
10.8
10.6
10.4
120
100
80
~ 60
40
20
20
18
16
14
::; 12
~ 10
1 2 3 4 5 6 7 8 9 10 11 12 13 14 15 16 17 18 19 20 21 22
LB Na
~~~~~~~~~~~~~~~~
1 2 3 4 5 6 7 8 9 10 11 12 13 14 15 16 17 18 19 20 21 22
L8 K
t- -
•• t 1-1 ---
1 2 3 4 5 6 7 8 9 10 11 12 13 14 15 16 17 18 19 20 21 22
L8 S04 350 .-----------~----------~
300
250 f---
f---
f---
1----
- 1- 1----
1 2 3 4 5 6 7 8 9 10 11 12 13 14 15 16 17 18 19 20 21 22
539 mg/L L8 Cl 120 .----~-----------------.
100
80
~ 60 l
40
20
1 2 3 4 5 6 7 8 9 10 11 12 13 14 15 16 17 18 19 20 21 22
77 L8 S04 • Sror
4.5 .------------------------,
u ----------------
3.5 - - - - - - - - - - - - - - - -
3.0 - - - - - - - - - - - - - -
t- --------
I--
t-
~ 2.5 0
_[ 2.0
...J
1.5
:: kf~l r 1 1~ 0.0
140
120
100
1 2 3 4 5 6 7 8 9 10 11 12 13 14 15 16 17 18 19 20 21 22
L8 ea
, -
- ----- 1--
------ --- -
1 2 3 4 5 6 7 8 9 10 11 12 13 14 15 16 17 18 19 20 21 22
L8 AI
u ---------- ----------------------
u --------- --------------------
3.0 - - - - - - - -
2.5
~ 2.0
1.5
1 2 3 4 5 6 7 8 9 10 11 12 13 14 15 16 17 18 19 20 21 22
L8 Mg
o.1 F~~~~~~~~;;;;;~~~~~~~~~
0.6
0.5
~ 0.4
E -0.3
1 2 3 4 5 6 7 8 9 10 11 12 13 14 15 16 17 18 19 20 21 22
L8 SI 4.5 .----------------------........,
u ---------------------- ------
3.5 - - - - - - - - - - - - - - - - - - - - - - - - - - - -
3.0
;g; 2.5
~ 2.0
---------
1.5
0.5
1 2 3 4 5 6 7 8 9 10 11 12 13 14 15 16 17 18 19 20 21 22
Figure AS-4 Analysis results for mix L8 leachates (diffusion test). Sub-figures on the left from top down; pH, Na, K, sol- and Cl, and on the right from top down; S042
- & SToT, Ca, Al, Mg and Si.
78
Table AS-1 Numerical values of the analytical results in Figures AS-1 ... AS-4 (DIFFtest in ALL-MR) for mixes R52, f63, 44 and LB. Analytical methods used are given in Appendix 10.
EJ Na K Ca Mg Fe AI Si s Cl so4 mg/1 mg/1 mg/1 mg/1 mg/1 mg/1 mg/1 mg/1 mg/1 mg/1
R52 1 58 81 150 0.076 <0.02 <1 0.25 1.9 61 6.6
R52 2 75 93 270 0.02 <0.02 <1 0.18 1.8 66 4.8
R52 3 82 210 430 <0.02 <0.02 <1 0.32 1.0 36 2.3
R52 4 88 180 450 <0.02 <0.02 <1 0.39 1.4 37 2.3
R52 5 67 110 370 <0.02 <0.02 <1 0.08 1.1 37 2.0
R52 6 42 57 210 <0.02 <0.02 < 1 0.09 0.75 37 2.2
R52 7 61 79 280 <0.02 <0.02 <1 0.16 1.1 42 2.3
R52 8 44 48 190 <0.02 <0.02 <1 0.10 0.78 43 2.2
R52 9 62 53 250 <0.02 <0.02 <1 0.28 1.3 31 2.4
R52 10 78 110 360 <0.02 <0.02 <1 0.12 1.4 57 2.5
R52 11 80 110 440 <0.02 <0.02 < 1 0.13 1.2 54 1.9
R52 12 83 88 520 <0.02 <0.02 <1 0.26 1.2 58 2.2
R52 13 71 43 530 <0.02 <0.02 <1 0.15 1.4 52 2.1
R52 14 67 18 520 <0.02 <0.02 <1 0.08 1.3 74 2.6
R52 15 65 10 530 <0.02 <0.02 < 1 0.10 1.7 49 2.6
R52 16 63 6.2 500 <0.02 <0.02 <1 0.07 1.7 70 2.8
R52 17 59 4.9 500 <0.02 <0.02 < 1 0.07 1.4 60 3.0
R52 18 54 4.1 460 <0.02 <0.02 <1 0.11 1.2 49 2.2
R52 19 25 1.8 230 <0.02 <0.02 <1 0.16 0.54 81 2.2
R52 20 52 3.8 440 <0.02 <0.02 <1 0.17 1.2 69 2.5
f63 1 49 49 15 0.37 <0.05 < 1 2.8 19 56 60
f63 2 38 32 12 0.24 <0.05 < 1 1.8 16 54 65
f63 2 31 41 19 0.078 <0.02 0.60 2.1 21 47 62
f63 3 43 56 24 0.085 <0.02 0.84 1.6 26 52 71
f63 4 50 62 31 0.091 <0.02 0.96 2.8 31 38 47
f63 5 53 49 26 0.12 <0.02 0.93 3.1 23 51 46
f63 6 43 42 17 0.13 <0.02 0.71 2.7 13 39 24
f63 7 42 26 16 0.14 <0.02 0.63 2.4 12 53 35
f63 8 37 28 21 0.073 <0.02 0.62 2.6 16 44 35
f63 9 48 36 32 0.076 <0.02 0.76 2.7 23 45 45
f63 10 39 22 27 0.065 <0.02 0.57 3.6 16 45 39
f63 11 50 26 37 0.068 <0.02 0.63 3.9 20 52 43
f63 12 36 15 24 0.044 <0.02 0.41 3.9 9.5 51 25
f63 13 38 15 25 0.045 <0.02 0.40 3.2 7.8 52 21
f63 14 47 15 28 0.049 <0.02 0.42 7.9 7.3 60 21
f63 15 47 13 26 0.057 <0.02 0.37 5.9 5.8 60 16
f63 16 22 4.6 8.9 0.041 <0.02 0.16 4 5.3 60 13
f63 17 48 12 25 0.055 <0.02 0.35 7.9 5.6 58 16
f63 18 45 8.8 24 0.05 <0.02 0.28 8 5.2 47 9.5
f63 19 52 8.5 28 0.059 <0.02 0.28 7.7 4.6 71 12
f63 20 52 8.4 27 0.057 <0.02 0.27 9.7 4.5 54 8.6
f63 21 48 7.0 24 0.065 <0.02 0.22 6.6 4.0 69 13
f63 22 50 6.8 26 0.072 <0.02 0.22 6.5 3.9 73 13
f63 23 42 7.3 20 <0.05 <0.05 <1 23 3.9 52 12
f63 24 44 6.0 20 0.038 <0.02 0.19 5.6 3.8 60 12
79
Table A5-1 continued.
I Sample 1:~ K Ca Mg Fe AI Si s Cl so4
mg/1 mg/1 mg/1 mg/1 mg/1 mg/1 mg/1 mg/1 mg/1
L8 1 66 11 25 0.54 <0.02 1.1 1.6 29 62 59
L8 2 71 11 36 0.50 <0.02 1.9 1.5 39 80 86
L8 3 79 20 66 0.15 <0.02 2.7 2.1 87 49 96
L8 4 78 16 68 0.13 <0.02 2.9 1.8 74 53 99
L8 5 130 11 100 0.26 <0.02 1.5 1.4 62 539 114
L8 6 87 15 79 0.15 <0.02 3.3 2.4 74 111 156
L8 7 73 12 66 0.18 <0.02 3.8 2.7 55 71 89
L8 8 67 12 67 0.12 <0.02 4.0 2.0 66 66 142
L8 9 72 15 86 0.082 <0.02 3.7 2.8 86 61 178
L8 10 69 15 100 0.068 <0.02 2.9 2.4 100 59 223
L8 11 57 11 96 0.090 <0.02 2.3 2.2 99 67 213
L8 12 51 10 130 0.076 <0.02 1.5 2.8 140 63 328
L8 13 46 8.2 120 0.048 <0.02 1.5 2.1 130 66 308
L8 14 57 7.1 130 0.060 <0.02 1.9 2.6 120 48 308
L8 15 59 8.4 140 0.060 <0.02 1.9 3.4 120 50 311
L8 16 45 6.0 120 0.048 <0.02 1.5 2.7 130 48 333
L8 17 28 3.4 88 0.027 <0.02 1.0 2.0 110 53 258
L8 18 60 6.2 130 0.052 <0.02 1.8 3.1 120 58 274
L8 19 44 4.7 120 0.036 <0.02 1.5 2.8 110 47 257
L8 20 53 5.1 120 0.042 <0.02 1.6 4.2 100 59 284
44 1 39 9.5 6.9 0.44 <0.05 < 1 1.4 6.5 52 13
44 2 43 11 7.4 0.40 <0.05 <1 0.7 8.3 53 17
44 3 58 18 14 0.50 <0.02 0.51 3.3 21 30 8.5
44 4 54 14 15 0.42 <0.02 0.49 1.9 16 22 5.3
44 5 34 7.3 8.2 0.28 <0.02 0.29 2.0 12 18 4.9
44 6 23 4.3 4.7 0.21 <0.02 0.17 1.4 11 15 3.1
44 7 39 9.8 9.1 0.33 <0.02 0.28 2.7 10 26 5.3
44 8 36 6.4 11 0.19 <0.02 0.30 2.4 11 25 5.8
44 9 24 4.1 7.3 0.11 <0.02 0.18 2.5 10 41 9.8
44 10 55 12 21 0.12 <0.02 0.47 4.0 13 34 7.8
44 11 55 12 23 0.067 <0.02 0.51 3.4 13 23 4.7
44 12 22 6.1 11 <0.02 <0.02 0.23 1.8 15 36 7.5
44 13 57 15 27 0.024 <0.02 0.53 3.7 14 30 6.8
44 14 45 9.4 18 0.025 <0.02 0.38 2.7 11 36 7.7
44 15 58 13 24 0.025 <0.02 0.49 4.1 11 55 13
44 16 56 11 21 0.029 <0.02 0.43 6.4 9.5 38 8.3
44 17 54 7.8 13 0.066 <0.02 0.33 6.6 7.1 27 5.1
44 18 59 11 24 0.022 <0.02 0.42 7.7 12 28 7.3
44 19 50 9.1 19 0.021 <0.02 0.35 5.6 9.8 27 5.2
44 20 59 11 24 0.020 <0.02 0.40 6.8 11 14 2.5
44 21 57 11 22 <0.02 <0.02 0.40 5.6 11 16 3.5
44 22 61 9.9 27 <0.02 <0.02 0.37 6.3 9.6 35 5.5
44 23 57 9.7 22 <0.02 <0.02 0.37 6.5 9.9 23 4.9
44 24 54 10 21 <0.05 <0.05 <1 23 23 52 15
44 25 57 9.1 23 <0.02 <0.02 0.33 8.5 11 33 6.2
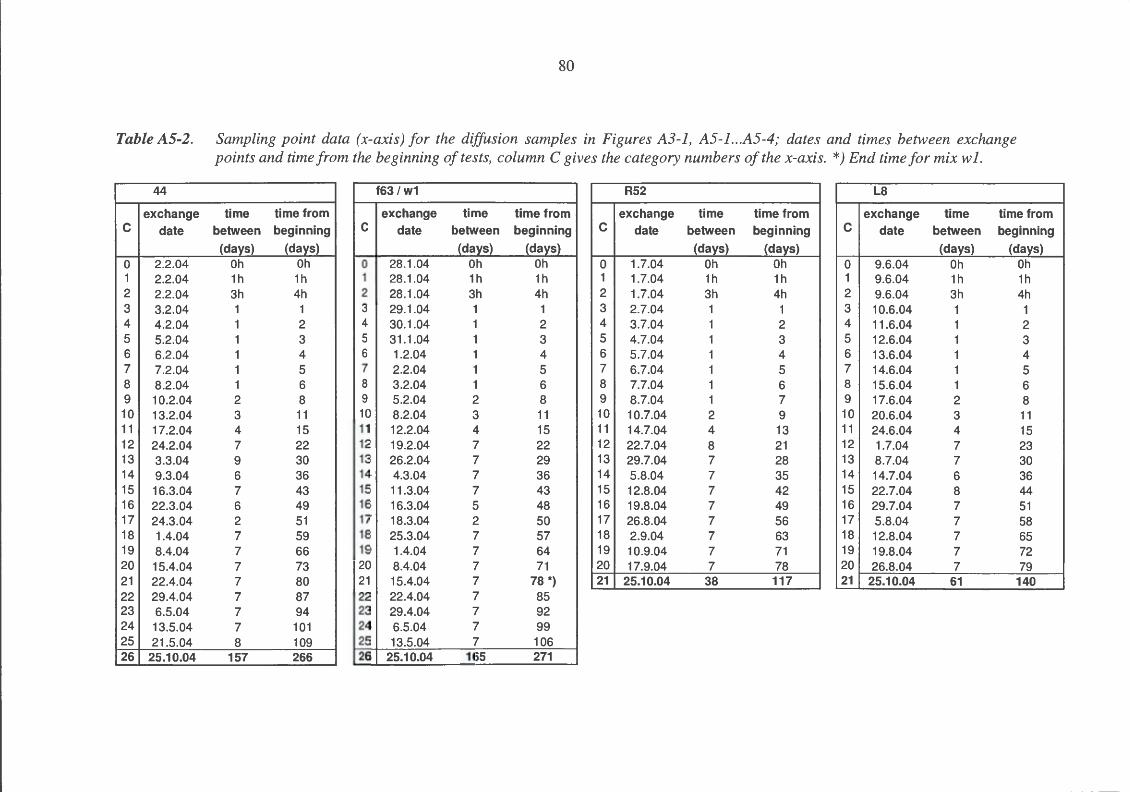
80
Table AS-2. Sampling point data (x-axis) for the diffusion samples in Figures A3-1, A5-l ... A5-4; dates and times between exchange points and time from the beginning of tests, column C gives the category numbers of the x-axis. *) End time for mix w 1.
44 f63 I w1 R52 L8
exchange time time from exchange time time from exchange time time from exchange time time from c date between beginning c date between beginning c date between beginning c date between beginning
(days) (days) (days) (days) (days) (days) (days) (days) 0 2.2.04 Oh Oh 0 28.1.04 Oh Oh 0 1.7.04 Oh Oh 0 9.6.04 Oh Oh 1 2.2.04 1h 1h 1 28.1.04 1h 1h 1 1.7.04 1h 1h 1 9.6.04 1h 1h 2 2.2.04 3h 4h 2 28.1.04 3h 4h 2 1.7.04 3h 4h 2 9.6.04 3h 4h 3 3.2.04 1 1 3 29.1.04 1 1 3 2.7.04 1 1 3 10.6.04 1 1 4 4.2.04 1 2 4 30.1.04 1 2 4 3.7.04 1 2 4 11.6.04 1 2 5 5.2.04 1 3 5 31.1.04 1 3 5 4.7.04 1 3 5 12.6.04 1 3 6 6.2.04 1 4 6 1.2.04 1 4 6 5.7.04 1 4 6 13.6.04 1 4 7 7.2.04 1 5 7 2.2.04 1 5 7 6.7.04 1 5 7 14.6.04 1 5 8 8.2.04 1 6 8 3.2.04 1 6 8 7.7.04 1 6 8 15.6.04 1 6 9 10.2.04 2 8 9 5.2.04 2 8 9 8.7.04 1 7 9 17.6.04 2 8 10 13.2.04 3 11 10 8.2.04 3 11 10 10.7.04 2 9 10 20.6.04 3 11 11 17.2.04 4 15 11 12.2.04 4 15 11 14.7.04 4 13 11 24.6.04 4 15 12 24.2.04 7 22 12 19.2.04 7 22 12 22.7.04 8 21 12 1.7.04 7 23 13 3.3.04 9 30 13 26.2.04 7 29 13 29.7.04 7 28 13 8.7.04 7 30 14 9.3.04 6 36 14 4.3.04 7 36 14 5.8.04 7 35 14 14.7.04 6 36 15 16.3.04 7 43 15 11.3.04 7 43 15 12.8.04 7 42 15 22.7.04 8 44 16 22.3.04 6 49 16 16.3.04 5 48 16 19.8.04 7 49 16 29.7.04 7 51 17 24.3.04 2 51 17 18.3.04 2 50 17 26.8.04 7 56 17 5.8.04 7 58 18 1.4.04 7 59 18 25.3.04 7 57 18 2.9.04 7 63 18 12.8.04 7 65 19 8.4.04 7 66 19 1.4.04 7 64 19 10.9.04 7 71 19 19.8.04 7 72 20 15.4.04 7 73 20 8.4.04 7 71 20 17.9.04 7 78 20 26.8.04 7 79 21 22.4.04 7 80 21 15.4.04 7 78 *) 21 25.10.04 38 117 21 25.10.04 61 140 22 29.4.04 7 87 22 22.4.04 7 85 23 6.5.04 7 94 23 29.4.04 7 92 24 13.5.04 7 101 24 6.5.04 7 99 25 21.5.04 8 109 25 13.5.04 7 106 26 25.10.04 157 266 26 25.10.04 165 271
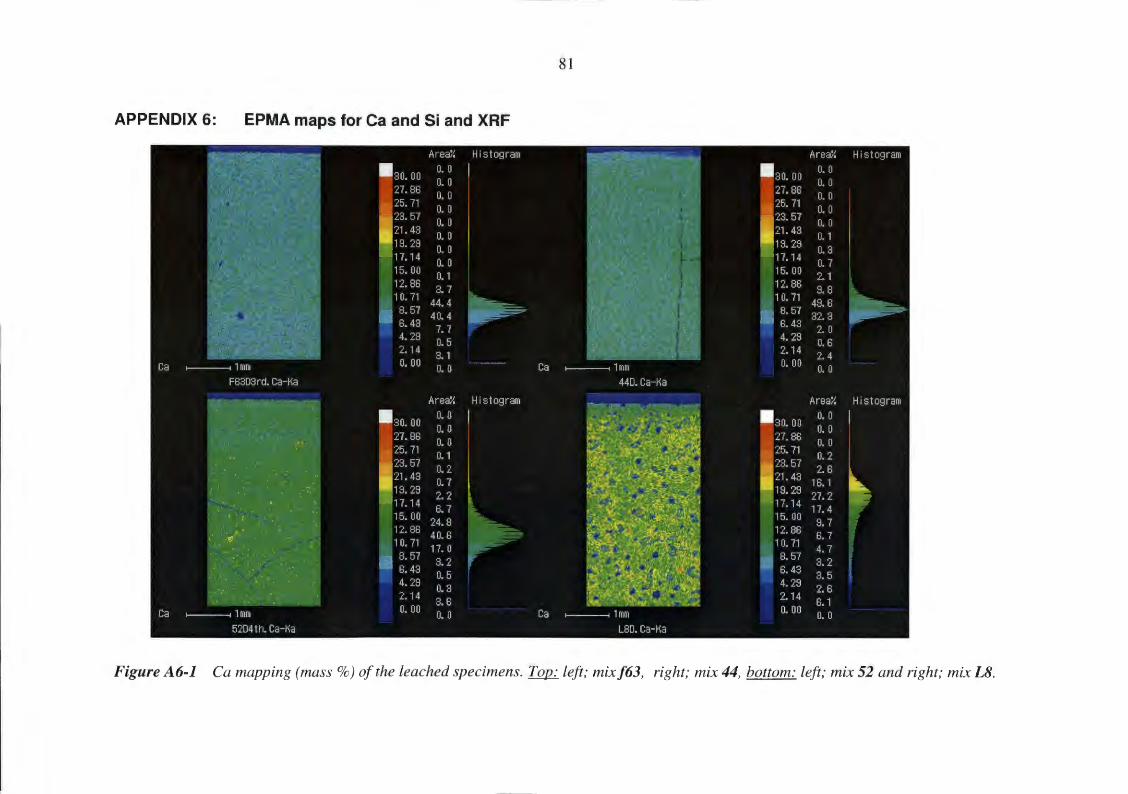
81
APPENDIX 6: EPMA maps for Ca and Si and XRF
Figure A6-1 Ca mapping (mass%) of the leached specimens. Top: left; mixf63, right; mix 44, bottom: left; mix 52 and right; mix L8.
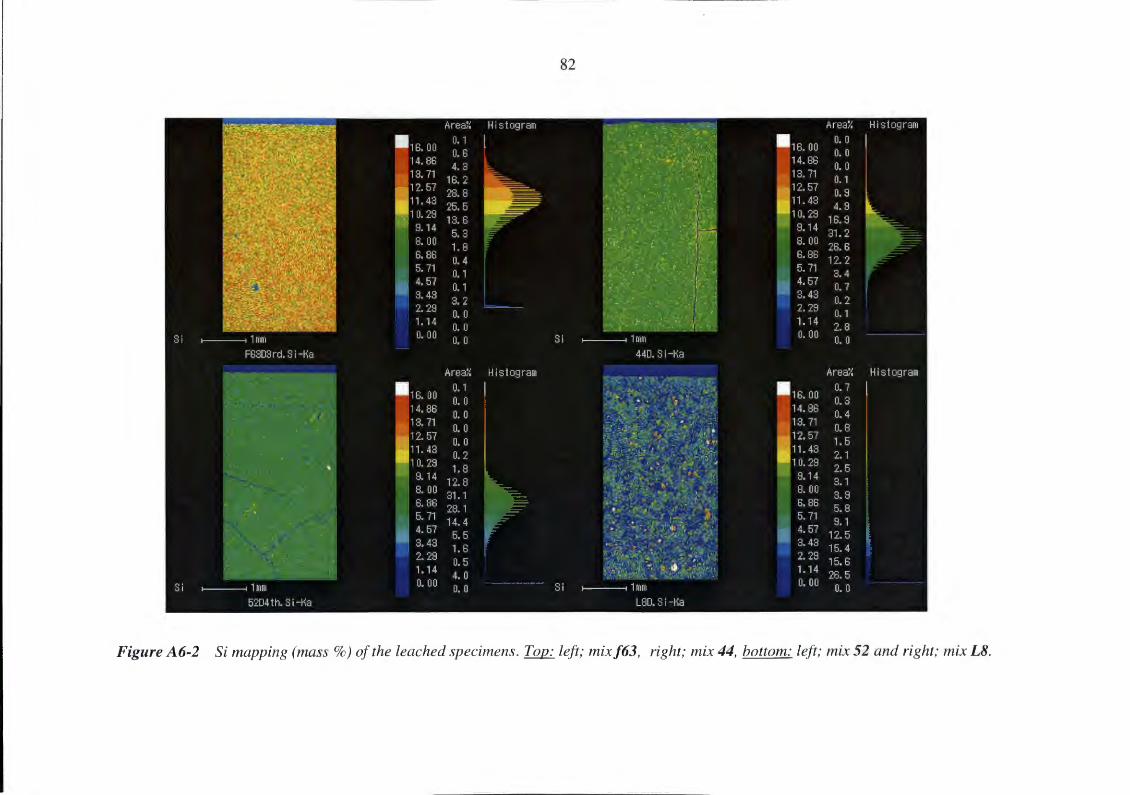
82
Figure A6-2 Si mapping (mass%) of the leached specimens. Top: left; mixf63, right; mix 44, bottom: left; mix 52 and right; mix L8.
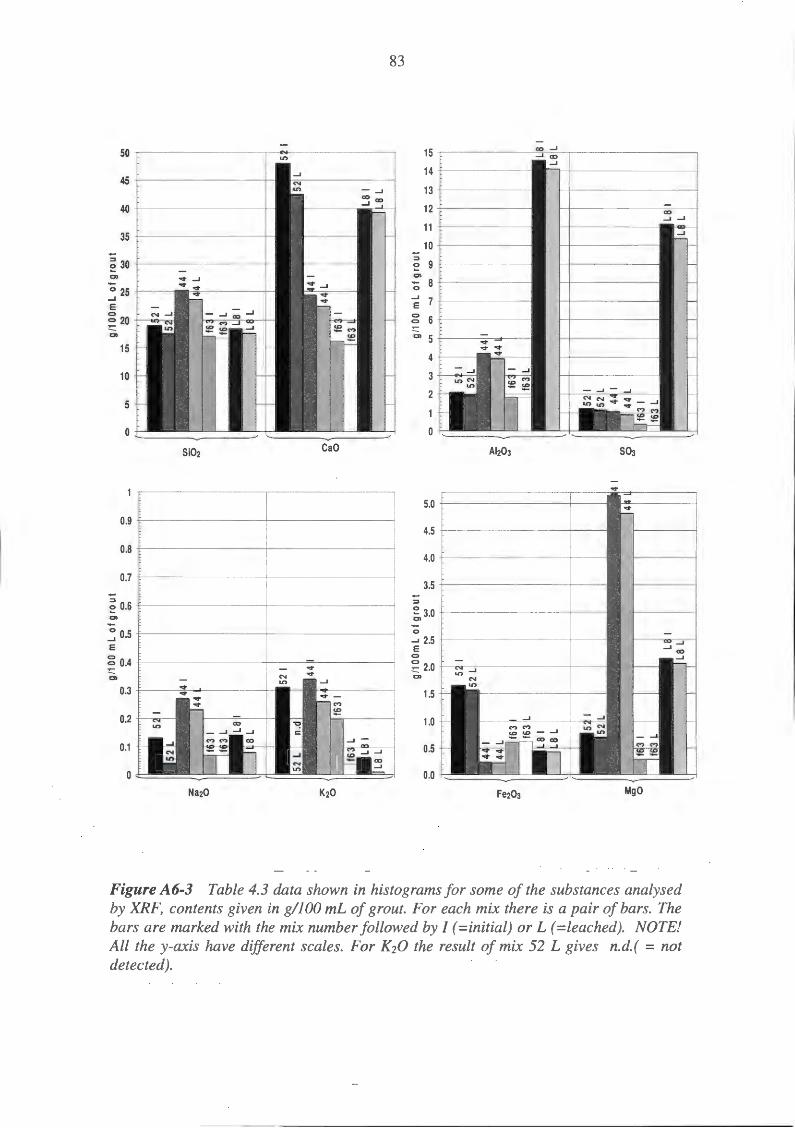
83
50 15 _,
14 45
13
40 12
11 35
10
e 30 :::::s
~ 9 C) C)
~ 8 0 25 ...J _,
7 E E c
~ 6 ~ 20 C)
C) 5 15
4
10 3
2 5
1
0 0
Si02 CaO AI203 S03
5.0
0.9 4.5
0.8 4.0
0.7 3.5
e o.s ~
~3.0 C)
~ 0.5 ~ ...J 2.5
E E
~ 0.4 c
~ 2.0 C) C)
0.3 1.5
0.2 1.0
0.1 0.5
0 0.0
Na20 K20 Fe203 MgO
Figure A6-3 Table 4.3 data shown in histograms for some of the substances analysed by XRF, contents given in g/100 mL of grout. For each mix there is a pair of bars. The bars are marked with the mix number followed by I (=initial) or L (=leached). NOTE! All the y-axis have different scales. For K20 the result of mix 52 L gives n.d.( = not detected).

84
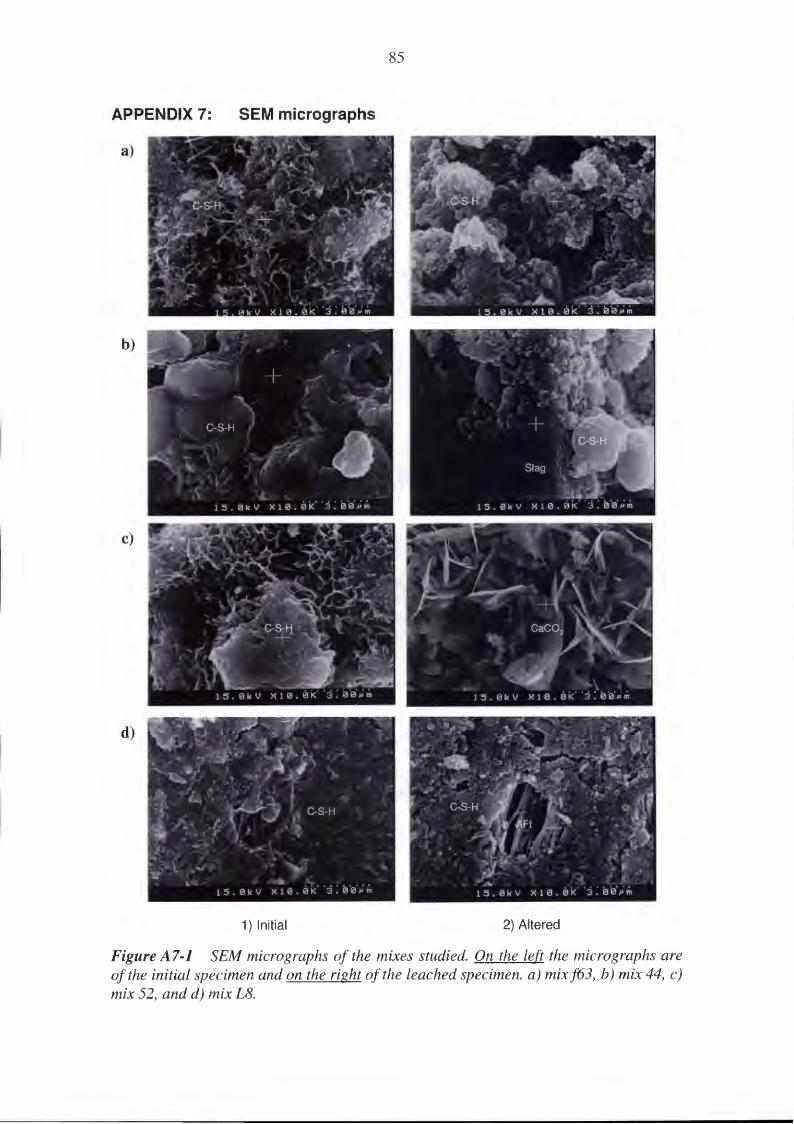
85
APPENDIX 7: SEM micrographs
a)
b)
c)
d)
1) Initial 2) Altered
Figure A7-1 SEM micrographs of the mixes studied. On the left the micrographs are of the initial specimen and on the right of the leached specimen. a) mixf63, b) mix 44, c) mix 52, and d) mix L8.

86
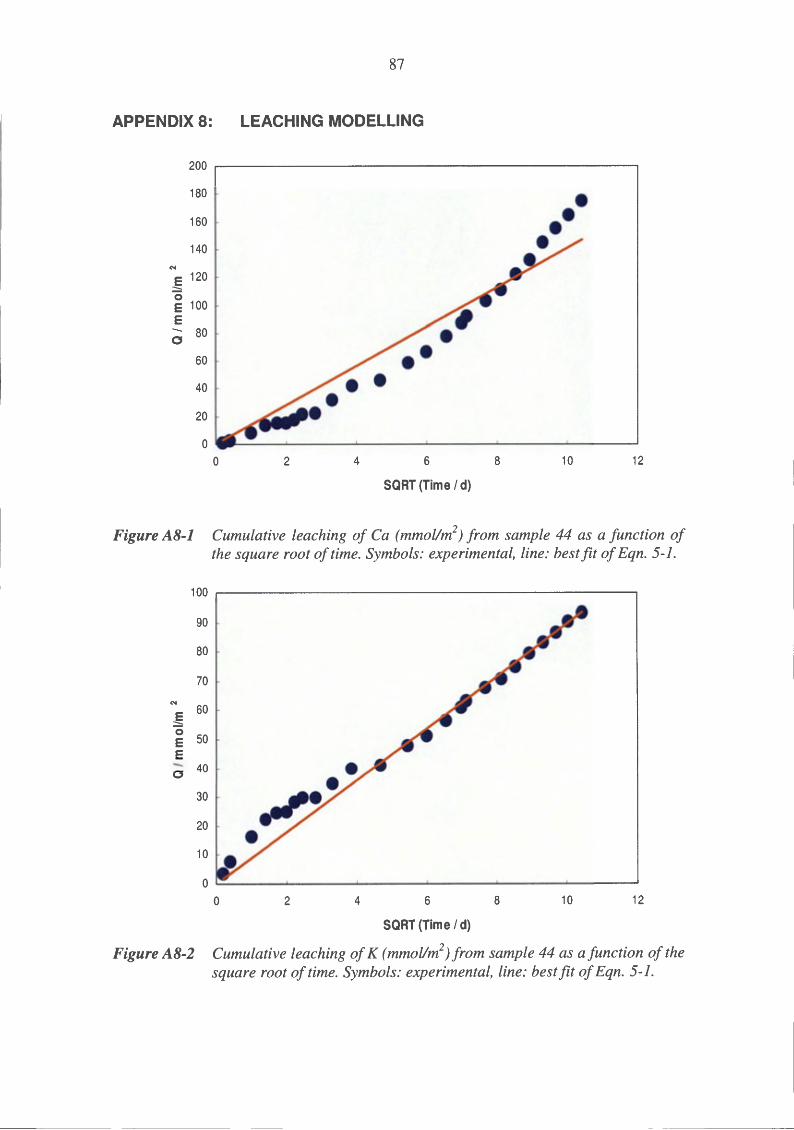
87
APPENDIX 8: LEACHING MODELLING
200
180
160
140 N
~ 120 0 E 100 E
0 80
60
40
20
0 0 2 4 6 8 10 12
SQRT (Time I d)
Figure A8-1 Cumulative leaching of Ca (mmol/m2) from sample 44 as a function of
the square root of time. Symbols: experimental, line: best fit of Eqn. 5-1.
100
90
80
70
~ 60
0 50 E
E
0 40
30
20
10
0 0 2 4 6 8 10 12
SQRT (Time I d)
Figure A8-2 Cumulative leaching of K ( mmollm2) from sample 44 as a function of the
square root of time. Symbols: experimental, line: best fit of Eqn. 5-l.
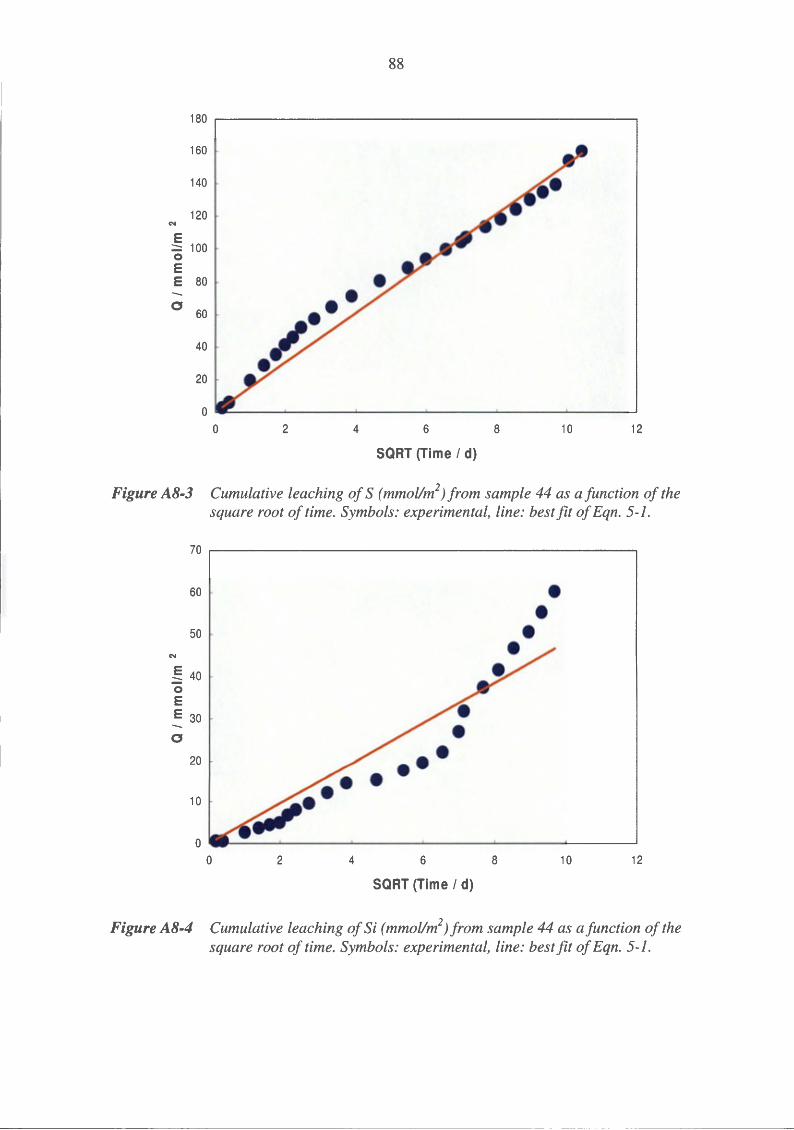
88
180
160
140
120 C\1
E ::::;; 100 0 E E 80
0 60
40
20
0 0 2 4 6 8 10 12
SQRT (Time I d)
Figure A8-3 Cumulative leaching of S (mmol/m2) from sample 44 as a function of the
square root of time. Symbols: experimental, line: best fit of Eqn. 5-1.
60
50
~ 40 0 E E 30 -0
20
10
2 4 6 8 10 12
SQRT (Time I d)
Figure A8-4 Cumulative leaching of Si ( mmollm2) from sample 44 as a function of the
square root of time. Symbols: experimental, line: best fit of Eqn. 5-1.
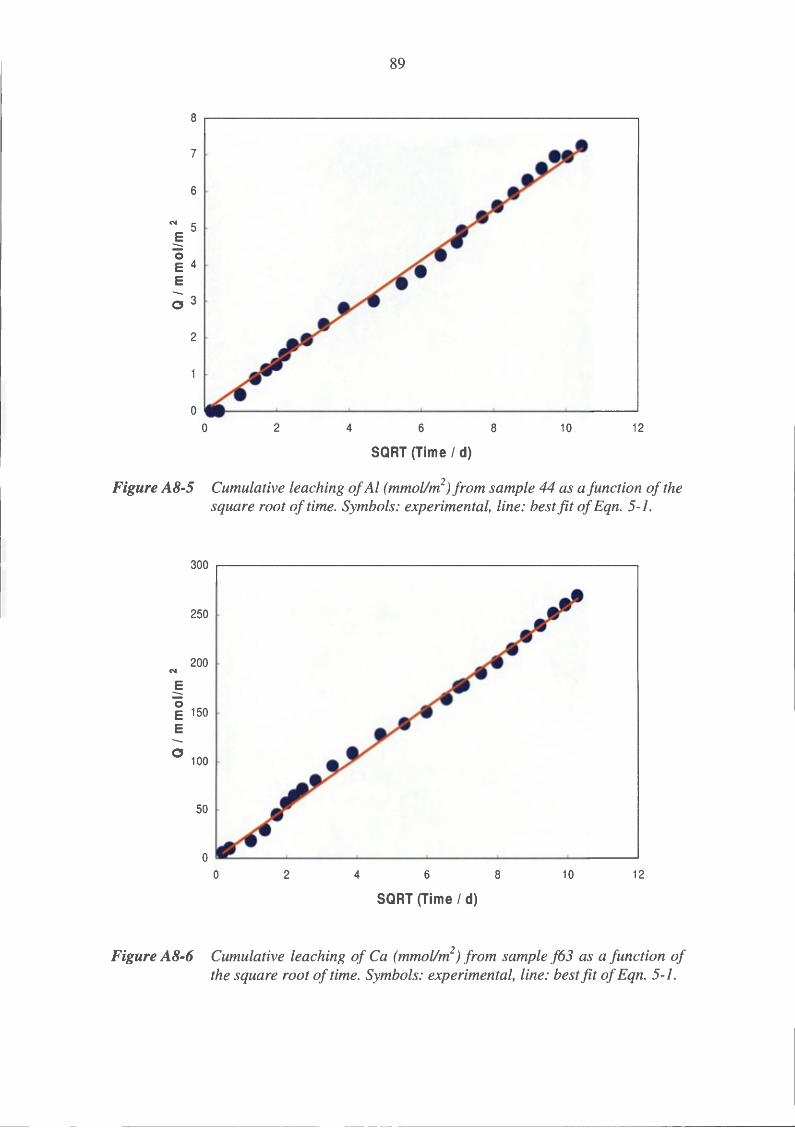
7
6
N 5 E -0 E 4 E
;;3
2
0 2
89
4 6 8 10 12
SQRT (Time I d)
Figure A8-5 Cumulative leaching of AI (mmol/m2)from sample 44 as a function of the square root of time. Symbols: experimental, line: best fit of Eqn. 5-l.
300
250
200 N
E -0 E 150 E
0 100
50
0 0 2 4 6 8 10 12
SQRT (Time I d)
Figure A8-6 Cumulative leaching of Ca ( mmol/m2) from sample f63 as a function of
the square root of time. Symbols: experimental, line: best fit of Eqn. 5-1.
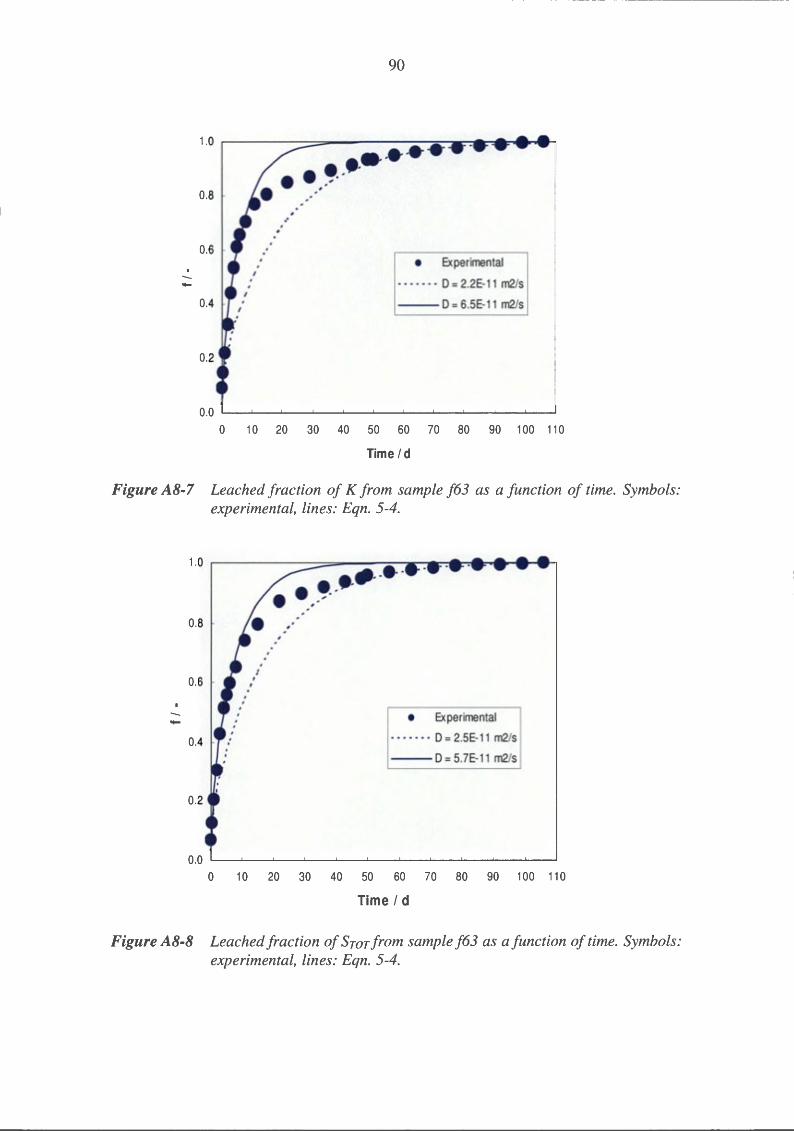
I --
90
. , 0.8 ..
.. ,
0.6 • Experimental
- - - - - - - D = 2.2E-11 m2/s
0.4 --D = 6.5E-11 m2/s
0.2
0.0 .____._ _ _.___.......__... _ __.__......____. _ __._ _ _.___..______,
0 1 0 20 30 40 50 60 70 80 90 1 00 11 0
Time /d
Figure A8-7 Leached fraction of K from sample f63 as a function of time. Symbols: experimental, lines: Eqn. 5-4 .
. , 0.8 ,•
0.6
- • Experimental
0.4 - - • - - - • D = 2.5E-11 m2/s
--D= 5.7E-11 m2/s
0.2
0.0 .______,_ _ __,__ _ _.___..____... _ __..._ _ __,___.......___. _ ___.._ _ __.
0 1 0 20 30 40 50 60 70 80 90 1 00 11 0
Time Id
Figure A8-8 Leached fraction of Sror from sample f63 as a function of time. Symbols: experimental, lines: Eqn. 5-4.
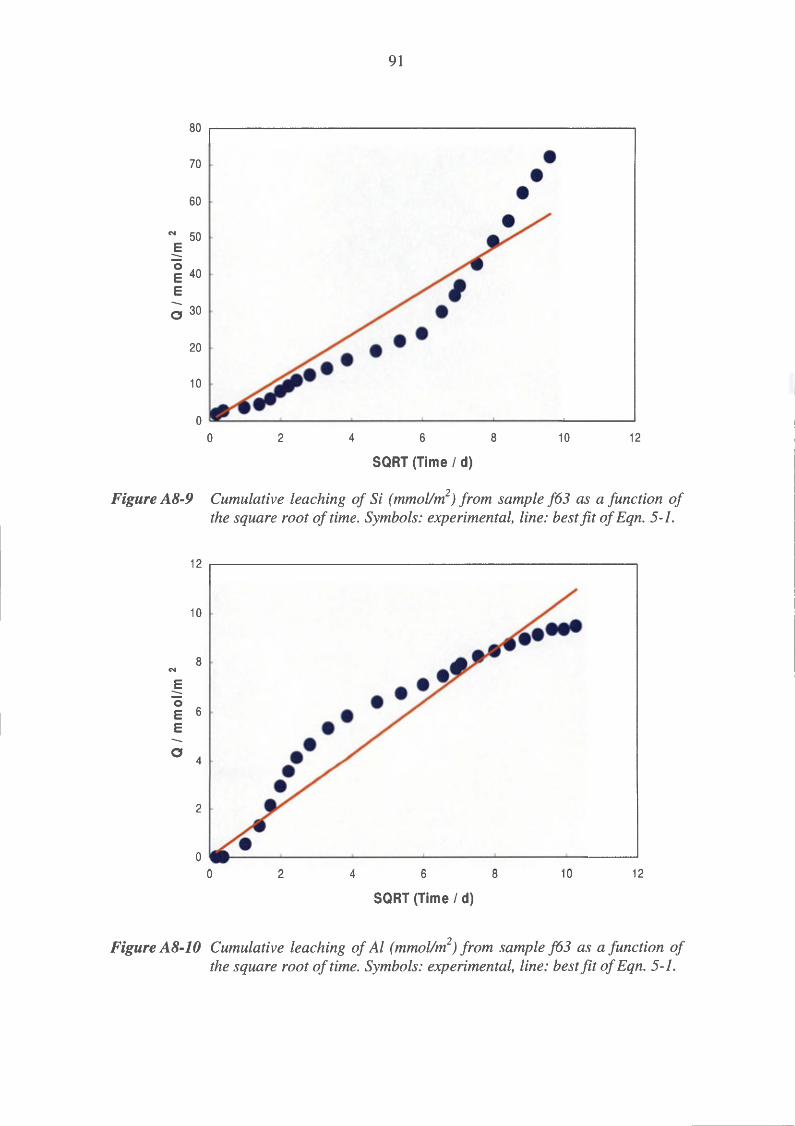
80
70
60
N 50 E -~ 40 E
~ 30
20
10
0 0 2 4
91
• •• • 6
I
SQRT (Time I d)
8
• • •
10 12
Figure A8-9 Cumulative leaching of Si (mmol/m2) from sample f63 as a function of
the square root of time. Symbols: experimental, line: best fit of Eqn. 5-1.
12
10
8 N
E -0 E 6 E
0 4
2
0 0
•• •• • •
2 4
•
6 8 10 12
SQRT (Time I d)
Figure A8-10 Cumulative leaching of Al (mmol/m2) from sample f63 as a function of
the square root of time. Symbols: experimental, line: best fit of Eqn. 5-l.
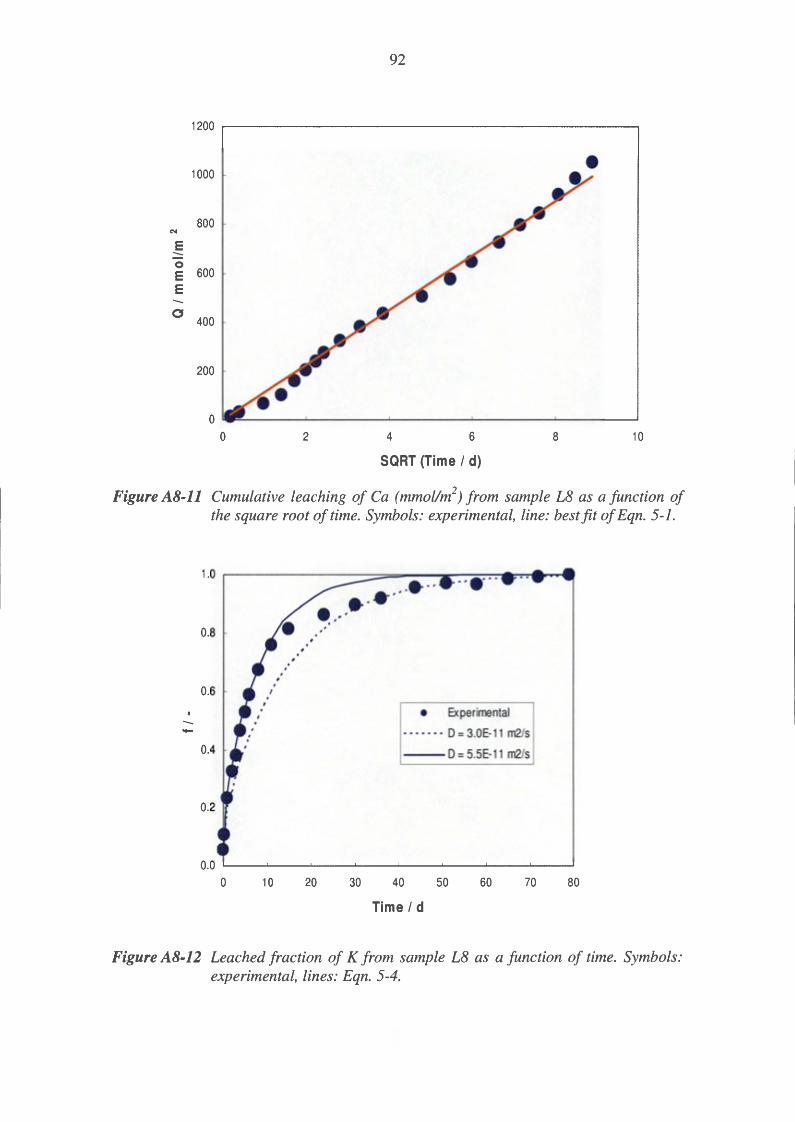
92
1200
1000
800 N
E -0 E 600 E
0 400
200
SQRT (Time I d)
Figure A8-11 Cumulative leaching of Ca (mmol/m2) from sample L8 as a function of
the square root of time. Symbols: experimental, line: best fit of Eqn. 5-l .
-
0.8
0.6
0.4
0.2
#
,
. ·
• Experimental
• • • • • • • D = 3.0E-11 m2/s
--D = 5.5E-11 m2/s
0.0 .__ _ _.__ _ _... __ _.__ _ __,__ __ ..__ _ ___._ _ __.. _ ___.
0 10 20 30 40
Time Id
50 60 70 80
Figure A8-12 Leached fraction of K from sample L8 as a function of time. Symbols: experimental, lines: Eqn. 5-4.
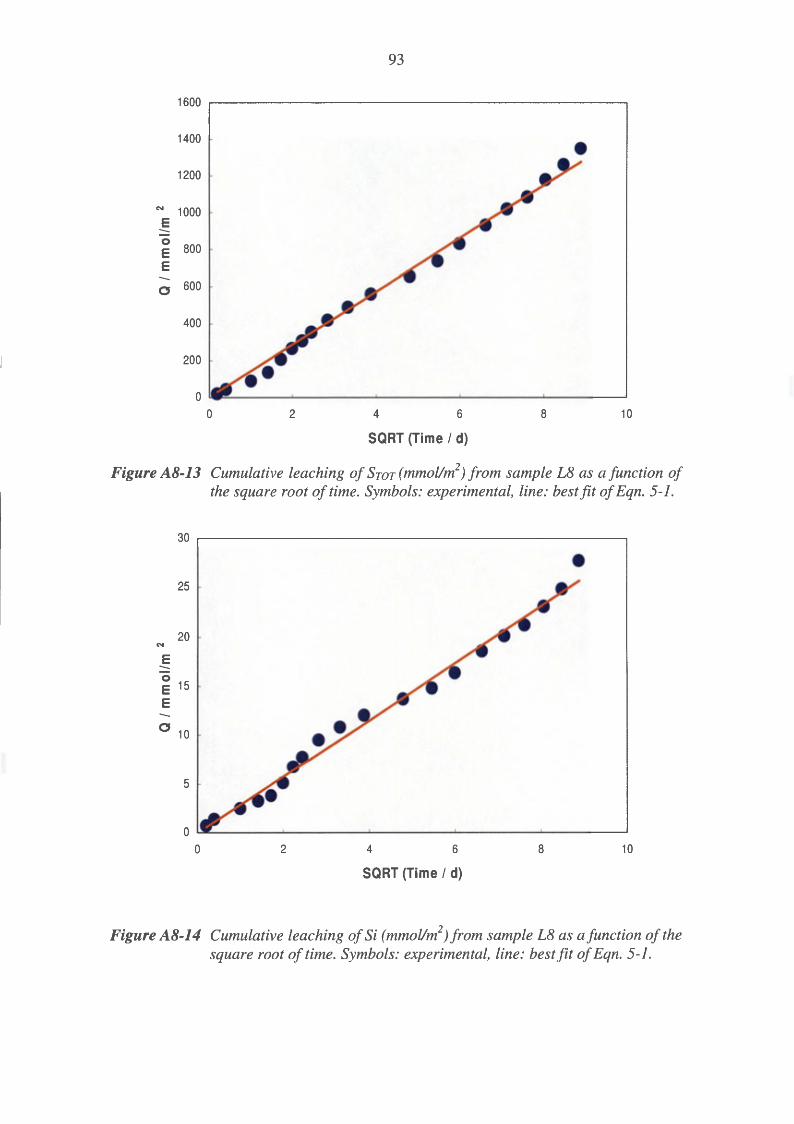
93
1600
1400 • 1200
N 1000 E -0
800 E E
0 600
400
200
10
SQRT (Time I d)
Figure A8-13 Cumulative leaching of SToT (mmol/m2) from sample L8 as a function of
the square root of time. Symbols: experimental, line: best fit of Eqn. 5-l.
30 ~--------------------------------------------~
• 25
20 N
E -~ 15 E
0 10
5
0 0 2 4 6 8 10
SQRT (Time I d)
Figure A8-14 Cumulative leaching of Si ( mmol/m2) from sample L8 as a function of the
square root of time. Symbols: experimental, line: best fit of Eqn. 5-l.
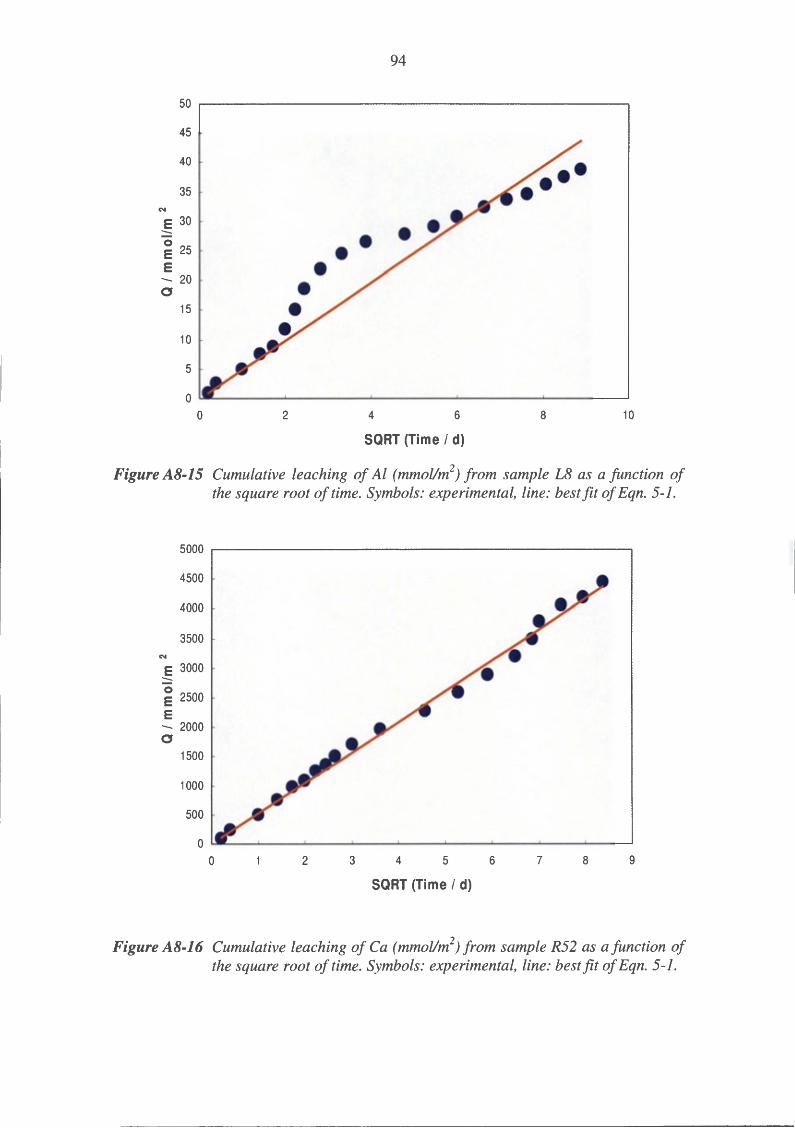
50
45
40
35 N
E 30 -~ 25 E - 20 0
15
10
5
0 0
• • • • 2
94
••
4 6 8 10
SQRT (Time I d)
Figure A8-15 Cumulative leaching of Al (mmol/m2) from sample L8 as a function of
the square root of time. Symbols: experimental, line: best fit of Eqn. 5-l.
5000
4500
4000
3500 N
E 3000 -~ 2500 E - 2000 0
1500
1000
500
0 0 2 3 4 5 6 7 8 9
SQRT (Time I d)
Figure A8-16 Cumulative leaching of Ca (mmollm2) from sample R52 as a function of
the square root of time. Symbols: experimental, line: best fit of Eqn. 5-l.
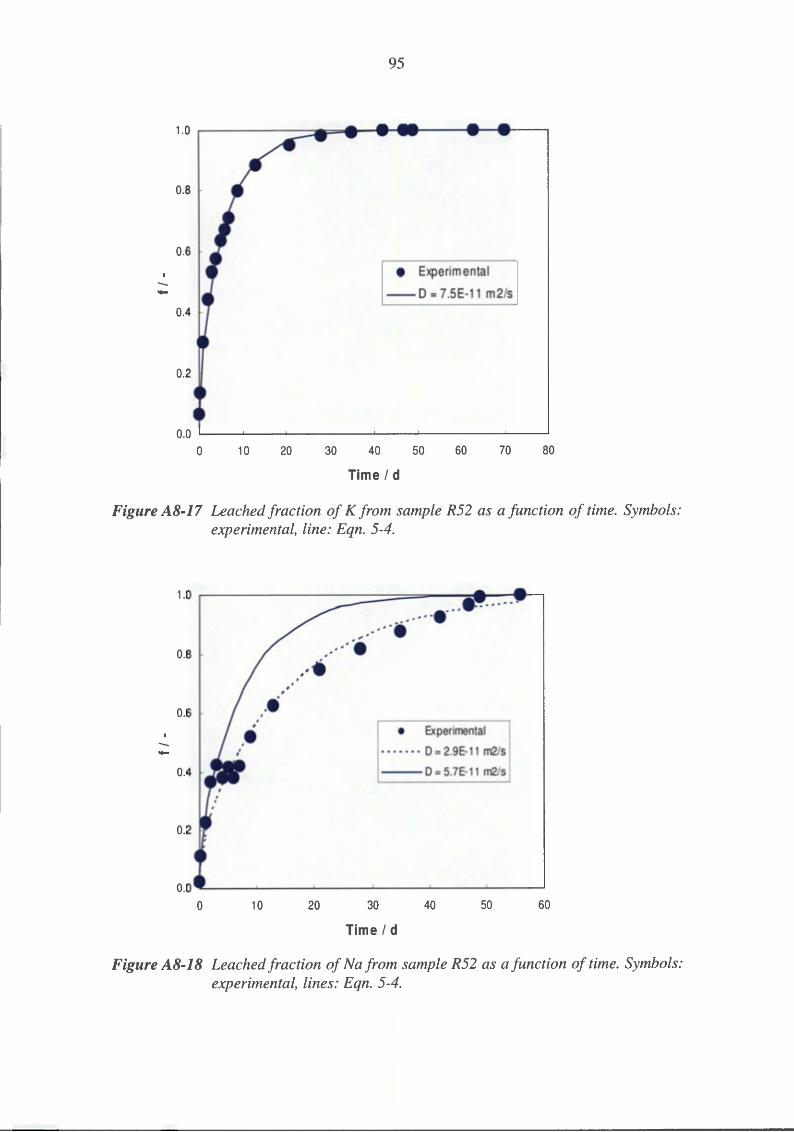
-
0.8
0.6
0.4
0.2
95
• Experimental
--0 = 7.5E-11 m2/s
0.0 L-----l.......----L----L..---.1.---L------"---...l------J
0 10 20 30 40
Time Id
50 60 70 80
Figure AS-17 Leached fraction of K from sample R52 as a function of time. Symbols: experimental, line: Eqn. 5-4.
-
0.8
0.6 •• 0.4
0.2
, ,
• •• •• ••• ,'. .· ··•·· ..... .-··
• Experimental
• • • • • • • D = 2.9E-11 m2/s
--D = 5.7E-11 m2/s
0.0 ~----l.......-----"----.l.-----....l...------1----~
0 10 20 30
Time Id
40 50 60
Figure AS-18 Leached fraction of Na from sample R52 as a function of time. Symbols: experimental, lines: Eqn. 5-4.

96
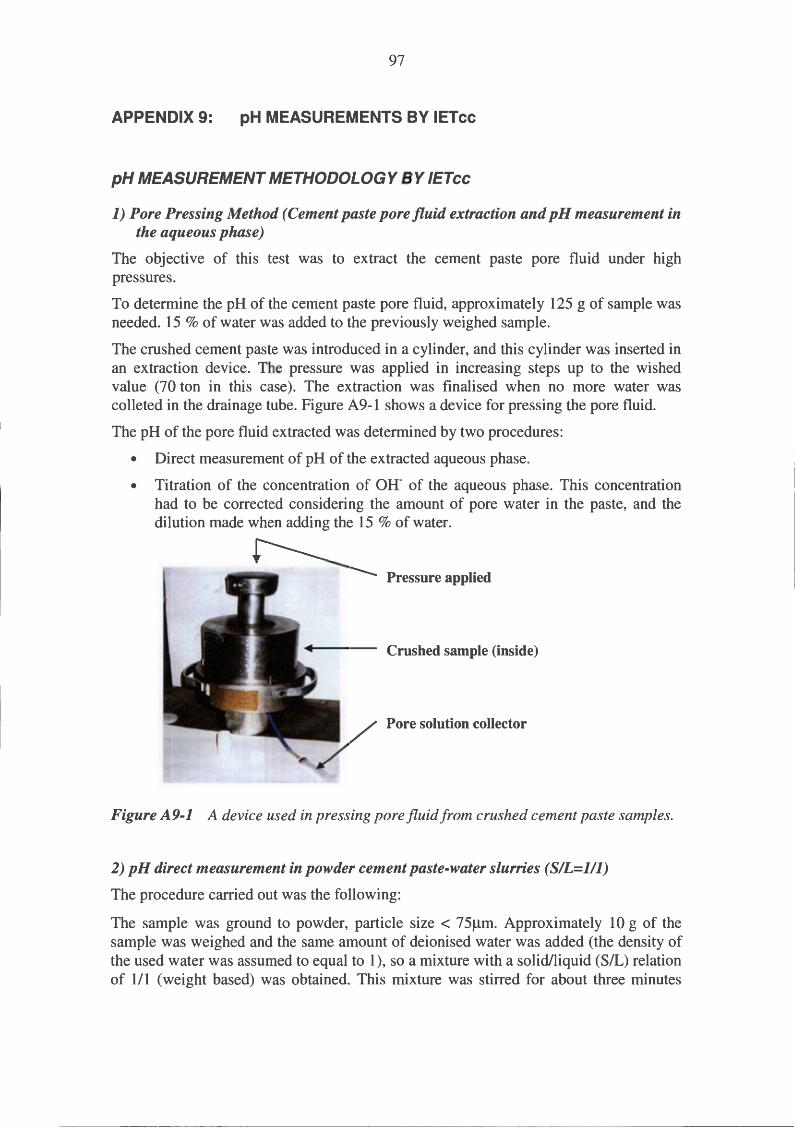
97
APPENDIX 9: pH MEASUREMENTS BY IETcc
pH MEASUREMENT METHODOLOGY BY IETcc
1) Pore Pressing Method (Cement paste pore .fluid extraction and pH measurement in the aqueous phase)
The objective of this test was to extract the cement paste pore fluid under high pressures.
To determine the pH of the cement paste pore fluid, approximately 125 g of sample was needed. 15 %of water was added to the previously weighed sample.
The crushed cement paste was introduced in a cylinder, and this cylinder was inserted in an extraction device. The pressure was applied in increasing steps up to the wished value (70 ton in this case). The extraction was finalised when no more water was colleted in the drainage tube. Figure A9-1 shows a device for pressing the pore fluid.
The pH of the pore fluid extracted was determined by two procedures:
• Direct measurement of pH of the extracted aqueous phase.
• Titration of the concentration of OH- of the aqueous phase. This concentration had to be corrected considering the amount of pore water in the paste, and the dilution made when adding the 15 % of water.
Crushed sample (inside)
Figure A9-1 A device used in pressing pore fluid from crushed cement paste samples.
2) pH direct measurement in powder cement paste-water slurries (SIL=lll)
The procedure carried out was the following:
The sample was ground to powder, particle size < 75J..Lm. Approximately 10 g of the sample was weighed and the same amount of deionised water was added (the density of the used water was assumed to equal to 1 ), so a mixture with a solid/liquid (S/L) relation of 111 (weight based) was obtained. This mixture was stirred for about three minutes
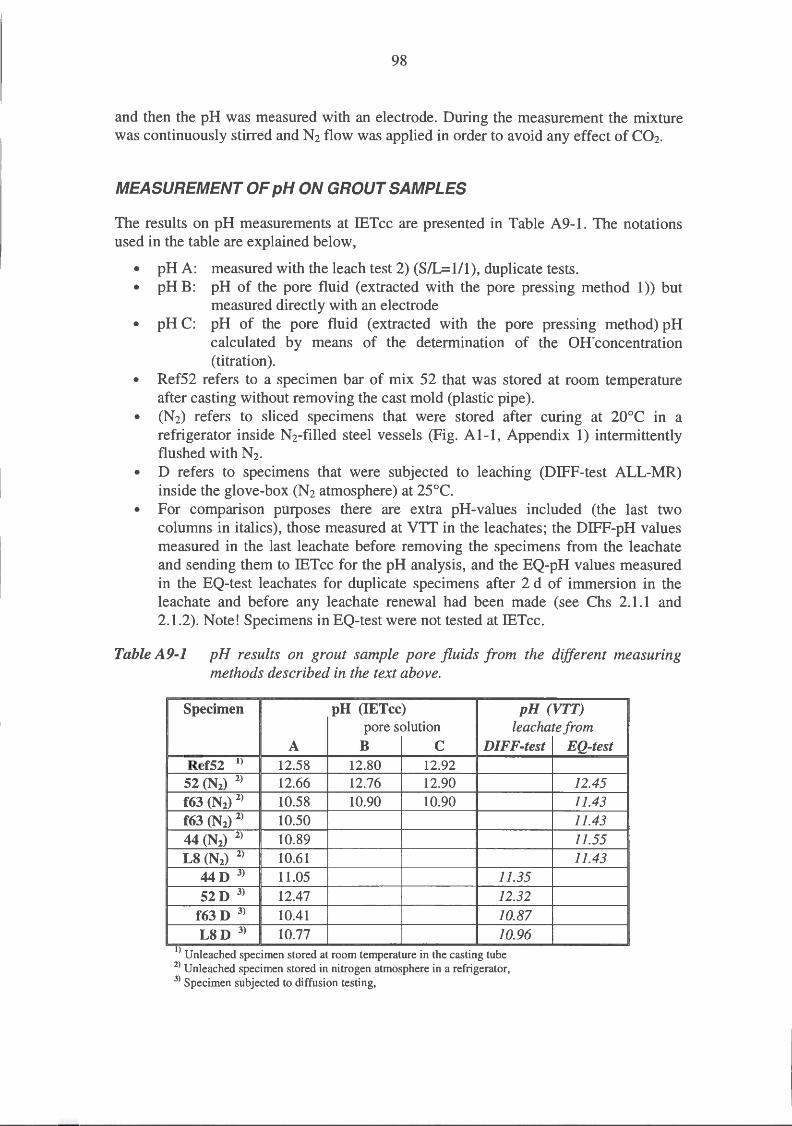
98
and then the pH was measured with an electrode. During the measurement the mixture was continuously stirred and N2 flow was applied in order to avoid any effect of C02.
MEASUREMENT OF pH ON GROUT SAMPLES
The results on pH measurements at IETcc are presented in Table A9-l. The notations used in the table are explained below,
• pH A: measured with the leach test 2) (SIL=l/1), duplicate tests. • pH B: pH of the pore fluid (extracted with the pore pressing method 1)) but
measured directly with an electrode • pH C: pH of the pore fluid (extracted with the pore pressing method) pH
calculated by means of the determination of the OH-concentration (titration).
• Ref52 refers to a specimen bar of mix 52 that was stored at room temperature after casting without removing the cast mold (plastic pipe).
• (N2) refers to sliced specimens that were stored after curing at 20°C in a refrigerator inside N2-filled steel vessels (Fig. Al-l, Appendix 1) intermittently flushed with N2.
• D refers to specimens that were subjected to leaching (DIFF-test ALL-MR) inside the glove-box (N2 atmosphere) at 25°C.
• For comparison purposes there are extra pH-values included (the last two columns in italics), those measured at VTT in the leachates; the DIFF-pH values measured in the last leachate before removing the specimens from the leachate and sending them to IETcc for the pH analysis, and the EQ-pH values measured in the EQ-test leachates for duplicate specimens after 2 d of immersion in the leachate and before any leachate renewal had been made (see Chs 2.1.1 and 2.1.2). Note! Specimens in EQ-test were not tested at IETcc.
Table A9-1 pH results on grout sample pore fluids from the different measuring methods described in the text above.
Specimen pH (IETcc) pH (VTT) pore solution leachate from
A B c DIFF-test Ref52 1
> 12.58 12.80 12.92 52 (N2) 2) 12.66 12.76 12.90 f63 (N2)
2) 10.58 10.90 10.90 f63 (N2)
2) 10.50 44 (N2)
2) 10.89 L8 (N2)
2) 10.61 44 D 3) 11.05 11.35 52D 3) 12.47 12.32
f63 D 3) 10.41 10.87 LSD 3) 10.77 10.96
I ) Unleached specimen stored at room temperature in the casting tube 2> Unleached specimen stored in nitrogen atmosphere in a refrigerator,
3> Specimen subjected to diffusion testing,
EQ-test
12.45 11.43 11.43 11.55 11.43
99
When comparing the lET cc pH values A, B and C (Table A9-1) with each other both pore solution pH values (B and C) were higher than the leach test value (A), as would be expected. The leachate pH values measured at VTT were higher than those of method A (only values available for all specimens) in all other cases except for mix 52, for which the VTT values were about 0.2 pH units lower and 0.3- 0.5 pH units lower in respect to methods B or C, real pH. The IETcc and VTT pH values can not, however, be straightforwardly compared; the procedures were quite different; leaching and pore fluid pressing vs. leaching, the ratio of solid to solution (IETcc ratio=l was weight based, whereas VTT ratio=0.85 was solid surface to solution volume), and the protection against C02 interference (N2 flow vs. glove-box).

100
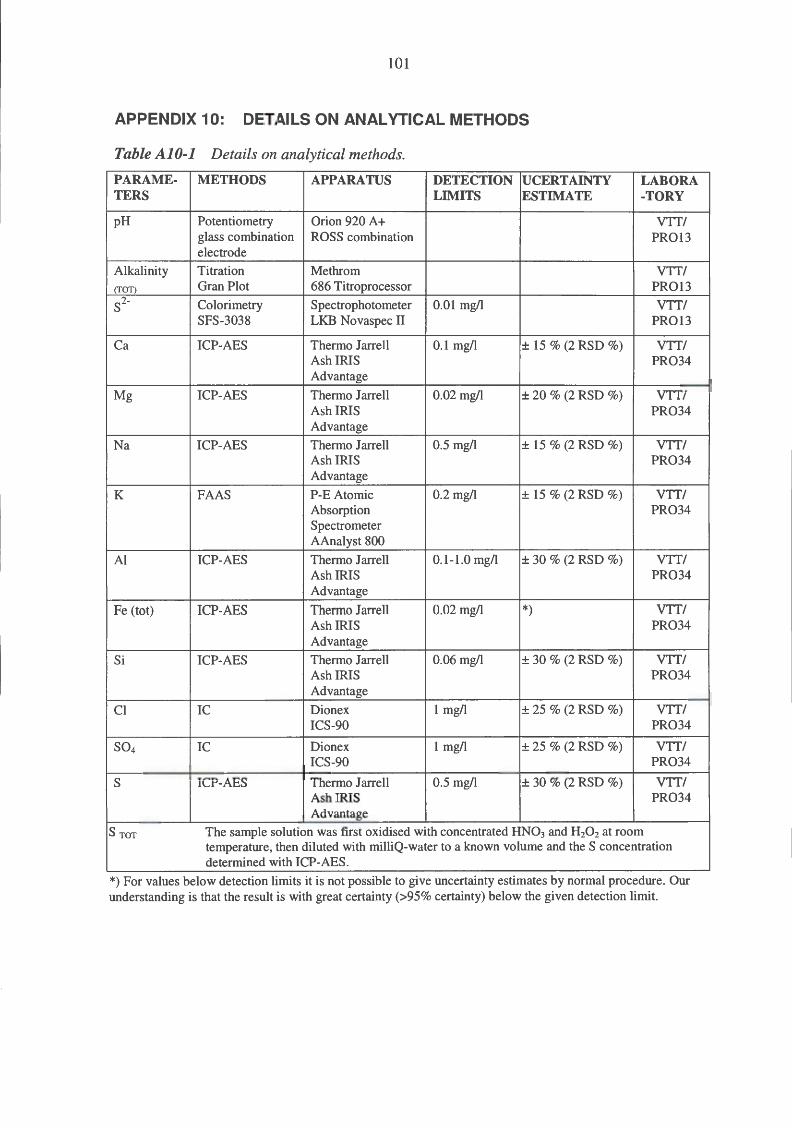
101
APPENDIX 10: DETAILS ON ANALYTICAL METHODS
Table Al0-1 Details on analytical methods.
PARAME- METHODS APPARATUS DETECTION UCERTAINTY LAB ORA TERS LIMITS ESTIMATE -TORY
pH Potentiometry Orion 920 A+ V'IT/ glass combination ROSS combination PR013 electrode
Alkalinity Titration Methrom V'IT/ (TOT) Gran Plot 686 Titroprocessor PR013 s2- Colorimetry Spectrophotometer 0.01 mg/1 V'IT/
SFS-3038 LKB Novaspec II PR013
Ca ICP-AES Thermo J arrell 0.1 mg/1 ± 15 % (2 RSD %) V'IT/ Ash IRIS PR034 Advantage
Mg ICP-AES Thermo J arrell 0.02 mg/1 ± 20 % (2 RSD %) V'IT/ Ash IRIS PR034 Advantage
Na ICP-AES Thermo J arrell 0.5 mg/1 ± 15% (2 RSD %) V'IT/ Ash IRIS PR034 Advantage
K FAAS P-E Atomic 0.2 mg/1 ± 15 % (2 RSD %) V'IT/ Absorption PR034 Spectrometer AAnalyst 800
AI ICP-AES Thermo J arrell 0.1-1.0 mg/1 ± 30 % (2 RSD %) V'IT/ Ash IRIS PR034 Advantage
Fe (tot) ICP-AES Thermo J arrell 0.02 mg/1 *) V'IT/ Ash IRIS PR034 Advantage
Si ICP-AES Thermo J arrell 0.06 mg/1 ± 30 % (2 RSD %) V'IT/ Ash IRIS PR034 Advantage
Cl IC Dionex 1 mg/1 ± 25 % (2 RSD %) V'IT/ ICS-90 PR034
so4 IC Dionex 1 mg/1 ± 25 % (2 RSD %) V'IT/ ICS-90 PR034
s ICP-AES Thermo J arrell 0.5 mg/1 ± 30 % (2 RSD %) V'IT/ Ash IRIS PR034 Advantage
S TOT The sample solution was first oxidised with concentrated HN03 and H20 2 at room temperature, then diluted with milliQ-water to a known volume and the S concentration determined with ICP-AES.
*) For values below detection limits it is not possible to give uncertainty estimates by normal procedure. Our understanding is that the result is with great certainty (>95% certainty) below the given detection limit.