Embed Size (px)
Citation preview
Summary of injury statistics for the years 2010-2012
Issue 5
Injuriesin the European Union
Working together to make Europe a safer place
Summary of injury statistics for the years 2010-2012
Issue 5
Injuriesin the European Union

ACKNOWLEDGEMENTS
The fifth edition of “Injuries in the European Union” presents an EU-level summary of the most recent injury statistics, covering the years 2010-2012. This report presents data from the European Injury Data Base (IDB) on non-fatal injuries treated in emergency departments at hospitals, complemented by data from WHO-Europe and Eurostat on respectively fatal injuries and hospital admissions.
The IDB is a unique data source that contains standardised cross-national data on the external causes and circumstances of injuries treated in emergency departments. Thanks to IDB we can present a comprehensive picture of the entire spectrum of accidents and injuries and the wide range of risk factors involved. This is much needed for guiding prevention actions.
The members of the IDB-network, i.e. the national bodies which collect and share data in accordance with a common methodology, are to be congratulated for their efforts to enhance the reporting on the burden of injury and its external causes and circumstances at national and regional as well as at EU level.
EuroSafe acknowledges also with thanks Rupert Kisser (Austrian Road Safety Board KFV) and Steven Macey (Swansea University) for colla-ting all the statistics and IDB-data presented in this publication and for producing the fifth edition of the report on Injuries in the European Union.
This report has been produced in the framework of the JAMIE-project which has received funding from the European Union, in the frame-work of the Health Programme.
Wim Rogmans,General secretary EuroSafe,JAMIE-project leader
Published by:
European Association for Injury Prevention and Safety Promotion (EuroSafe)Rijswijkstraat 2, 1059 GK Amsterdam, The Netherlands
ISBN: 978-90-6788-466-2
Preferred citation: EuroSafe, Injuries in the European Union, Report on injury statistics 2010-2012, Amsterdam, 2014
© EuroSafe, 2014© Photos: EuroSafe and KFVLayout: Opinion Leaders Network GmbH, ViennaPrint: Produced in electronic version only
Disclaimer:Despite the harmonisation efforts undertaken by the data providers, the injury statistics presented may not always be completely com-parable between countries due to differences in national health systems and differences in procedures for data collection and reporting. All reasonable precautions have been taken by EuroSafe to verify the information contained in this publication. However, the published information is being distributed without warranty of any kind, either expressed or implied. The responsibility for the interpretation and use of the material lies with the reader. In no event shall EuroSafe be liable for damages arising from its use.
INJURIES IN THE EUROPEAN UNION
CONTENTS
INJURY DATA: FOUNDATION FOR BETTER SAFETY POLICIES 4
THE BIGGER PICTURE OF INJURIES IN THE EU 6
HOTSPOT CHILDREN 12
HOTSPOT ADOLESCENTS 14
HOTSPOT OLDER PEOPLE 16
HOTSPOT VULNERABLE ROAD USERS 18
HOTSPOT PRODUCT AND SERVICES RELATED ACCIDENTS 20
HOTSPOT SPORTS INJURIES 22
HOTSPOT INTERPERSONAL VIOLENCE 24
HOTSPOT SUICIDE AND SELF-HARM 26
CONCLUSIONS AND THE WAY AHEAD 28
REFERENCES 30
ANNEX: FIGURES AND TABLES 32

4
INJURY DATA: FOUNDATION FOR BETTER SAFETY POLICIES We all want a society where people of all ages can live to their full potential. Promoting safety and in preventing accidents and acts of violence deliver an important contribution. In all age-groups the quality of life can be significantly improved by a higher level of safety, e.g. in living and working environments, of vehicles, buildings, consumer products and by promoting the use of personal protective equipment.
Injuries1 are an important and largely preventable public health problem. In fact, with almost one quarter of a million fatalities each year, injury is after cardiovascular disease, cancer and respiratory disease the fourth most common cause of death within the EU. Accidents and injuries are the leading cause of death in children, adolescents and young adults.
The information that is available tends to focus on fatal injuries. However, as will be explained in chapter 2, injury-deaths are only ‘the tip of the iceberg’:
y For every person killed, many more are seriously injured and a large proportion of them will be permanently disabled as a result. y Taking all age groups together, one out of twelve hospital admissions in the EU relates to an injury. y Across the board, injuries take a significant share in the total health care expenditures in today’s society. More than 48 million days
of hospital care represent about 8% of all days of hospital care [1]. y The number of cases treated in emergency departments outstrips by a factor of about 6.6 the number of injury patients admitted
to hospitals [2]. y The direct medical care costs of injuries treated in hospitals (inpatients and outpatients) in the EU is estimated to be at least 78
billion Euro each year [3, 15].
Thus, injury is a major cause of mortality as well as morbidity and is an important contributor to ever-rising health care costs. While the health burden of communicable diseases is reducing owing to better prevention and treatment, injury morbidity remained almost unchanged over the past decades, resulting into an increased share of injuries in the total burden of ill health.
Data needs
Injury data are essential for making prevention actions more effective. It is a critical tool for activating stakeholders, for targeting high risk groups and for addressing high risk products and environments.
1 At first, injury is a medical diagnosis. Its external causation is primarily defined by intention. The main physical mechanisms of unintentional (acci-dental) injuries are motor vehicle accidents, falls, poisoning, drowning, and burns. Intentional injuries (or violence) can be divided into the categories of self-directed violence (suicide or self harm), interpersonal violence (e.g. against children, intimate partner, elder persons, acquaintances, or strangers), collective violence (in war and by gangs) and other intentional injuries (including injuries due to legal intervention). Injuries due to medical interventions are not taken into account in the given context. In addition to intention and cause, injuries can also be described according to the setting in which they occur – such as home, leisure time, sports, education, workplace or road transport.
Figure 1.1: The cycle of action for injury prevention.
Injury data are important in order to (see Figure 1.1):
y enable proper assessment of the health burden of injury at regional, national- and EU-level;
y identify risks related to specific age-groups, activities, settings or environments, and responsible policy or legal domains;
y facilitate decision making on priority issues and target groups to address; y identify the proper mix of prevention measures that tackle the actual risk
factors and target audiences; and to y measure whether the targets of prevention policies and actions are being met.
Injury data are relevant for a wide range of decision makers and organisations, such as: the European Commission services and national governmental departments and agencies; European and national standardization and certification bodies; health and social insurers; professionals in the public health sector; care and social services providers; manufacturers and designers; hospitality service providers; and civil society organisations.
In the fields of work safety and road safety, the need for injury information has been acknowledged long ago and dedicated reporting systems have been in place for a number of decades and are used at the EU-level. For work safety, accident reports from public, social or private insurance organisations and labour inspectorates provide the basis for the European statistics on accidents at work (ESAW) [4]. For road traffic injuries, in all member states information is being collected by police and these police reports provide the basis for the data shared through the Community database on Accidents on the Roads in Europe (CARE) [5].
These sources of data are most helpful, but far from complete as many accidents still go un-reported. For instance, studies based on data from emergency departments reveal that police statistics seriously underestimate the true number of road injury victims as they cover less than half of the pedestrian and bicycle injuries that are actually treated in emergency departments.

5
INJURIES IN THE EUROPEAN UNION
As for home and leisure accidents, which are the predominant causes of injury-related hospitalisation and emergency care, the picture is even bleaker. In many countries in Europe only meagre information is available on the magnitude and characteristics of this important category of injury causes. Thus, governments in these countries are still in the dark over how to address the increasing contribution of injuries to rising health care expenditures and to decline in productivity.
Fortunately, some national initiatives have been taken to start with collecting injury data from emergency departments at hospitals and to exchange data at a European level.
EU-concern
Under the Treaty, Article 168 [6], EU actions aim to improve public health, prevent human illness and diseases, and identify sources of danger to human health. More specifically to injury prevention, the Council Recommendation on the Prevention of Injury and the Promotion of Safety [7] issued in 2007, explicitly highlights the socio-economic burden of injuries in Europe. It invites member states, amongst others, ‘to develop a national injury surveillance and reporting system, which should provide comparable information on injuries, monitors the evolution of injury risks and the effects of prevention measures over time and assesses the needs for introducing additional initiatives on product and service safety’.
The Regulation on Community statistics on public health [8] also identifies ‘accidents and injuries’ as one of the core subjects to be included in the European Statistical System of Eurostat. The ECHI (European Community Health Indicators) project has specified which indicators should be provided by all member states and how this should be done. Regarding home, leisure and school injuries (ECHI-29), detailed monitoring in emergency departments of hospitals as well as general capture in the European Health Interview System (EHIS) is recommended [9,10].
More specifically related to consumer product safety, the Regulation on requirements for accreditation and market surveillance of the marketing of products [11] requires member states ‘to establish adequate procedures in order to monitor accidents and harm to health which are suspected to have been caused by products’.
Over the past years, the European Commission stimulated several projects with a view to facilitate EU-level exchange of injury data. In 2010, twelve member states had developed a monitoring system in emergency departments in a sample of hospitals. This resulted in the European Injury Data Base (IDB), which allows for deriving incidence rates of injuries according to place of occurrence, e.g. home, transportation, school, sport and leisure activities [12]. It also delivers data, in line with the so-called IDB-methodology and ECHI indicator 29b requirements [10], for uploading to the Commission’s web-site (DG Sanco section) [2].
Joint action of MSs
In 2010, competent governmental authorities from 22 countries signed up for a Joint Action for Injury Monitoring in Europe (JAMIE) aiming to have by 2015 one common hospital-based injury data collection system in their countries. They were joined by two more countries at later stage. By the end of the action, at least 22 countries are expected to report IDB-data in a sustainable manner and in accordance with a harmonised methodology [3]. Such a system is intended to become integrated part of the existing programme for exchange of Community Statistics on Public Health. By 2013, the number of countries collecting data according to the IDB-methodology has been raised to 25, although at quite varying level of quality and sustainability. Owing to the JAMIE project the IDB is now making progress in achieving full EU-coverage in the coming years.
IDB report - 5th edition
In this report, the most recent IDB data from the currently participating member states are being presented in combination with European injury data made publicly accessible through Eurostat and WHO.
Chapter 2 presents the broader picture of the total number of injuries according to severity, i.e. fatal injuries, hospital admissions and treatment in Emergency Departments (ED’s), and according to main categories of injury. In the chapters 3-12 the report presents a snapshot picture of the eight priority topics for injury prevention that are highlighted in the Council Recommendation on Injury Prevention and Safety Promotion of 2007 [7].These are the eight priority areas for injury prevention, which are related to prime age-groups at risk (children, adolescents and older people), specific risk settings (vulnerable road users, sports environment and the use of products and services) and to violence and self-harm.
The final chapter concludes on the value of injury data collection and the way ahead in view of ensuring continued EU-level exchange of vital injury data with an increasing number of participating countries from 2015 onwards.

6
Source: WHO – mortality database, WHO – Health for All Database, Eurostat – hospital discharge statistics, EU IDB. See Annex “List of figures and tables” for more details.
The EU injury pyramid – additional facts
y The direct medical cost of injuries treated in accident and emergency rooms including hospitalization, rehabilitation and additional care facilities, is estimated at € 78 billion [14, 15, 16]. This is 7.8% of total curative care costs in the EU-28 of 1003 billion [13].
y The cost due to loss of earnings, loss of productivity, quality of life damage and property damage adds greatly to the total societal costs related to injuries [15, 16].
y Currently, every year injuries leave an estimated 1 million people permanently disabled in the EU [17, 18].
y In addition to hospital treatments, many injuries are treated by general practitioners and paramedical staff without being referred to a hospital. In the Netherlands for instance, about one third of all injury patients are treated in hospitals and two thirds are seeking consultation in the office of a general practitioner [15]. The European Health Interview Survey (EHIS) [19] may help to provide in due course an estimate as for the total number of injuries reported by respondents over a period of twelve months. However, due to severe underreporting of injuries in household surveys [20] and different definitions concerning the type of treatment needed, the data from EHIS are not yet comparable with those from IDB.
Figure 2.1: The injury pyramid for the European Union
THE BIGGER PICTURE
35 700 000Hospital Outpatients
5 400 000Hospital Admissions
238 000Fatalities
Injuries due to accidents and violence are a major public health problem, killing about 240 000 people in the EU-28 each year (annual average 2010-2012) and disabling an estimated number of one million people in the region. Injuries are the fourth most common cause of death, after cardiovascular diseases, cancer, and respiratory diseases.
Every two minutes one EU-citizen dies of an injury. For each fatal injury case, 23 people across the EU are admitted to hospital, 150 are treated as hospital outpatients and many more seek treatment elsewhere, e.g. by family doctors. This means that each year a staggering 5.4 million people are admitted to hospital and 35.7 million people are treated as hospital outpatients as a result of an accident or violence related injury (see figure 2.1).
Every
2 minutessomeone dies of an injury in the EU-28

7
INJURIES IN THE EUROPEAN UNION
Comprehensive view on injury
The responsibility for injury prevention is quite dispersed over a variety of policy sectors - depending on the setting in which they occur and the circumstances. Table 2.2 depicts the key figures of the main unintentional and intentional injury categories according to place of occurrence and injury outcomes in terms of severity (death, hospital admission or outpatient treatment). This “comprehensive view of injuries” provides a common view for the stakeholders of the main domains of prevention and indicates potential synergies between sectors.
y Unintentional injuries are responsible for about two thirds of all injury deaths and intentional injuries for about one-quarter (for the rest the intent is undetermined).
y Self-harm and road accidents have the highest risk of leading to death (lethality), indicated by the relation of fatalities to hospital treatments.
y Most of the severe injuries in the EU are treated in hospitals making emergency departments the proper places for injury surveillance.
y With 74% of all hospital treated injuries, home, leisure and sports have by far the biggest share, which is in contrast to the fact, that home and leisure injury prevention programmes appear as far less resourced than programmes for road and work-place safety. In general, the tangible and intangible consequences of home, leisure, and sport injuries are also less well covered by insurance systems compared to the compensation schemes for road and work accidents [21].
y The EU-IDB estimates that road injuries account for 11% of all hospital treated injuries or a total of 4.5 million victims annually. Compared to just 1.7 million injuries reported by the police, this indicates a significant underreporting of the problem in official road traffic statistics and the need for complementary information on road injuries treated in health facilities [5, 22].
y Injury data collected by the health sector provide comparable indicators for other sectors responsible for prevention, and valuable additional information to sectorial monitoring systems e.g. operated by police, justice, labour inspections and consumer safety authorities.
Fatal injuries
y There are enormous differences in the rate of fatal injuries throughout the EU (Table 2.3). It is estimated that almost 100 000 lives could be saved each year if every country in the EU-28 reduced its injury mortality rate to the same level as in the Netherlands or Spain which currently have the lowest rate of fatal injuries in the EU.
y There are also huge differences between EU countries as to the main causes of injury deaths, which is of course related to geographic circumstances (the abundant presence of open water for instance) and are relevant for considering national priorities in injury prevention (Table 2.4).
y Suicides, road accidents and falls are the three main causes of fatal injuries, together representing 59% of all injury deaths (Figure 2.5).
y In almost all age groups, males bear a considerably higher risk of fatal injury than females. Injuries are a leading cause of death for young people, from early childhood until middle age. Although the relative percentage of fatal injuries is decreasing in higher ages, their absolute number increases sharply from an age of about 75 years (Figure 2.6).
y Homicides, fatal road and work-place accidents show the most favourable trends over the past years. Much less impressive is the decrease of suicides and home and leisure accidents (Table 2.7).
y The number of fatal home and leisure injuries, mainly attributed to falls among the elderly, is increasing at a faster rate than demographic trends.
Home, leisure and sports injuries account
for
74% of all hospital treated
injuries
Road traffic Work-place School Sports Home,leasure
Total of unintentional
injuries
Homicide, assault
Suicide, self-harm
Total of all injuries
Fatalites 36 895 15%
4 616 2%
1 154 0,5%
7 000 3%
104 381 44%
154 064 65%
4 568 2%
59 920 25%
238 122 100%
Hospital admissions
655 000 12%
241 000 4%
38 000 1%
402 000 7%
3 633 000 67%
4 968 000 92%
202 000 4%
212 000 4%
5 382 000 100%
Hospital outpatients
3 792 000 11%
3 260 000 9%
740 000 2%
5 750 000 16%
20 801 000 58%
34 342 000 96%
1 167 000 3%
190 000 1%
35 700 000 100%
All hospital patients
4 494 000 11%
3 360 000 8%
737 000 2%
5 890 000 14%
24 712 000 60%
39 193 000 95%
1 384 000 3%
500 000 1%
41 081 000 100%
Table 2.2: Comprehensive view on injuries in EU-28 by injury prevention domain
Source: WHO – mortality database, WHO – Health for All database, Eurostat – hospital discharge statistics, EU IDB. See Annex “List of figures and tables” for more details.

8
Source: WHO MDB, Eurostat COD. See Annex 2 “List of figures and tables” for more details.
Figure 2: Leading causes of death and causes of fatal injuries in children up to 14 years
HOTSPOT CHILDREN
Behind the numbersFügen, Austria; August 2009 – „A three-year old girl is lucky to be alive after falling into a swimming pool at a campsite resort in Fügen, in the western part of Austria. The three-year old girl was on holiday with her family from the Netherlands when she fell into a 1.4 meter deep pool and was rescued by another swimmer who dragged her out of the water. The girl was unconscious and no longer breathing. The father managed to resuscitate his daughter and she was then flown immediately to hospital. According to information from the doctors treating the child her condition was “quite good, given the circumstances of the incident and she is recovering well. Judging from her current state of recovery the doctors do not expect any permanent damage to her brain. She should be able to leave the hospital in two or three days. The young Dutch girl had “enor-mous luck,” the responsible physician reported to the Austrian Press Agency.
Figure 2.3: Fatal injuries in EU countries: Standardized death rate per 100 000 inhabitants and percentage of injury deaths
Country
All causes of death (A00-Y89)
excluding S00-T98
External causes of morbidity
and mortality (V01-Y89)
Injury deaths as % of all cases of
death
Lithuania 1 300 141 11%Latvia 1 652 106 6%
Estonia 1 422 95 7%Slovenia 1 115 85 8%Finland 1 041 81 8%Croatia 1 474 78 5%
Hungary 1 534 78 5%Poland 1 371 70 5%
Belgium 1 048 65 6%Czech Republic 1 332 65 5%
Romania 1 595 64 4%Slovakia 1 515 62 4%France 894 60 7%
Luxembourg 981 55 6%Austria 1 012 53 5%Sweden 982 51 5%
Denmark 1 194 48 4%Cyprus 1 022 47 5%
Bulgaria 1 694 47 3%Portugal 1 093 44 4%Ireland 1 052 44 4%
Germany 1 045 39 4%Netherlands 1 022 39 4%
Italy 913 37 4%Malta 1 037 37 4%
United Kingdom 1 037 36 3%Spain 916 32 3%
Greece 1 074 31 3%Average EU-28 1 080 50 5%
Source: Eurostat – cause of death statistics. See Annex “List of figures and tables” for more details.
80 +60-7940-59< 40
Road traffic Poisoning Falls Fires Drowning Self-inflicted Interpersonal violence Other causes
EU-28 17% 7% 18% 2% 3% 24% 3% 26%
Lowest 8% (FI) 1% (AT) 8% (LV) 1% (LU) 1% (LU) 6% (GR) 1% (SI) 10% (HR)
Highest 51% (GR) 21% (EE) 35% (SI) 6% (LV) 8% (LV) 35% (HU) 7% (LV) 44% (IT)
Table 2.4: Fatal injuries by causes of death: Lowest and highest percentage of fatal injuries by country
Source: WHO – mortality database. See Annex “List of figures and tables” for more details.
Figure 2.5: Fatal injuries by causes of death in the EU-28
Drowning 3%
Falls 18%
Fires 2%
Other causes 29%
Poisoning 5%
Self-inflicted 25%
Interpersonalviolence 2%
Road traffic injuries 16%
Source: WHO – mortality database. See Annex “List of figures and tables” for more details.

9
INJURIES IN THE EUROPEAN UNION
Figure 2.6: Injury death rate (per 100 000 persons) and relative injury mortality (injury deaths in % of all causes of death) in the EU-28 by age groups and gender
Source: Eurostat – cause of death statistics. See Annex “List of figures and tables” for more details.
0,0
100,0
200,0
300,0
400,0
500,0
600,0
0-4
5-9
10-1
4
15-1
9
20-2
4
25-2
9
30-3
4
35-3
9
40-4
4
45-4
9
50-5
4
55-5
9
60-6
4
65-6
9
70-7
4
75-7
9
80-8
4
85+
0,00%
10,00%
20,00%
30,00%
40,00%
50,00%
60,00%
70,00%
80,00%
Injury Deaths per 100 000 - Male
Injury Deaths per 100 000 - Female
Relative Injury Mortality - Male
Relative Injury Mortality - Female
Figure 2.7: Fatal injury trends by injury prevention domain (1998–2011, 1998 = 100%) in the EU-28
Source: WHO – Health for All database. See Annex “List of figures and tables” for more details.
40%
50%
60%
70%
80%
90%
100%
1998 1999 2000 2001 2002 2003 2004 2005 2006 2007 2008 2009 2010 2011
SuicideHomicide
TransportHome and leisure
Work

10
Figure 2.8: Hospital discharges for injuries per 100 000 inhabitants and percentage of injury related discharges
Country Rate of injury admissions
% of all admissions
Malta 1.032 15,0Austria 3.130 12,4Poland 1.074 12,0
Germany 2.347 9,8Belgium 1.627 9,8
United Kingdom 1.273 9,4Finland 1.841 9,2
Denmark 1.458 9,0Sweden 1.440 8,9Slovenia 1.520 8,8
Netherlands 1.040 8,7Czech Republic 1.706 8,3
Italy 1.074 8,3Ireland 1.212 8,2France 1.361 8,0Spain 878 7,8
Slovakia 1.416 7,6Lithuania 1.682 7,2
Latvia 1.657 7,0Croatia 1.072 6,9Estonia 1.177 6,8
Luxembourg 1.052 6,8Hungary 1.399 6,7Romania 1.221 5,2Bulgaria 1.359 5,2Portugal 684 4,0
Average of 26 EU countries 1.413 8,3
Source: Eurostat – Hospital discharge statistics. See Annex “List of figures and tables” for more details.
Hospital admissions
A total of more than 48 million hospital days is being spent in the EU each year for treating injury patients, which represents 8% of all hospital days [23].
Days of hospital care is the most prominent cost bearer in European health systems. The absolute numbers of days in hospital care are a less meaningful indicator for morbidity as these numbers highly depend on the organisation of national health care systems and geographical conditions. Nevertheless, the percentage of injuries of all admissions (so-called discharges) can serve as rough indicator for injury burden to the health system. There is an enormous difference in the percentage of injury related admissions throughout the EU (Figure 2.8).
Unfortunately, neither Eurostat hospital discharge statistics nor the WHO Health for All database allow for further analyses of the causes of injury as provided for fatalities (figure 2.5). Due to data gaps it is also not possible to establish time series with a similar validity as for fatalities (figure 2.7). Therefore, for most of the further analysis the EU Injury Data Base (IDB) data has been used, which comprises admissions as well as ambulatory treatments.
Injuries treated in emergency departments
While death is the most tragic result of an injury, non-fatal injuries impose a huge burden to health care and social costs and often result in disabilities and a significant reduction in quality of remaining life.
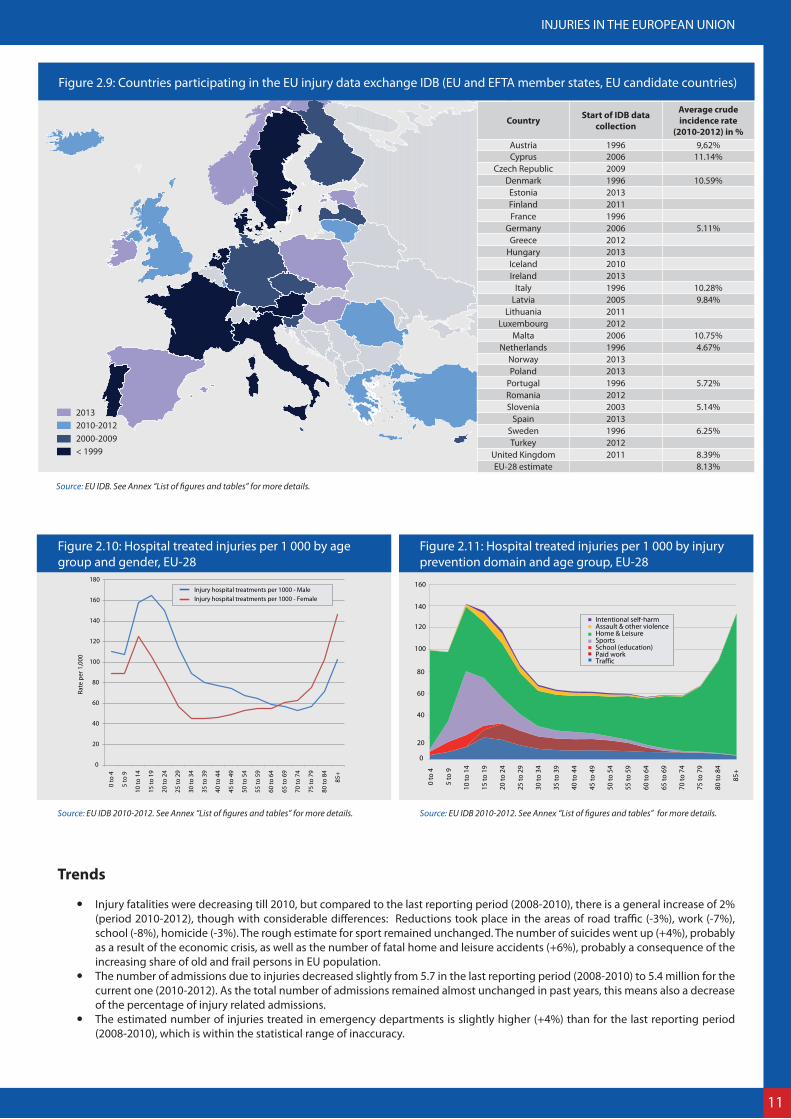
Increasingly more European countries are therefore collecting injury data in emergency departments using a common methodology in order to analyse and compare injury data for policy purposes and to develop more effective prevention programmes. Figure 2.9 shows the IDB data providing countries.
y An estimated total number of 41 million people have to receive hospital treatment for injuries each year - more than 115 000 people each day, of which 5.4 million have to be admitted for severe injuries (Figure 2.1).
y The number of disabled people is expected to rise as a consequence of improved emergency services, treatment and care, which lowers the overall injury lethality but leave more survivors with long-term impairments.
y The injury risk for males exceeds the risk for females in younger ages. Nevertheless from about 65 years onward, women bear the higher risk (mainly due to falls) (figure 2.10).
y Children, adolescents, and persons in advanced age bear the highest risk for injury (figure 2.11).
>10% 9% 8% 7%< 7%
11
INJURIES IN THE EUROPEAN UNION
Figure 2.9: Countries participating in the EU injury data exchange IDB (EU and EFTA member states, EU candidate countries)
Country Start of IDB data collection
Average crude incidence rate
(2010-2012) in %Austria 1996 9,62%Cyprus 2006 11.14%
Czech Republic 2009Denmark 1996 10.59%Estonia 2013Finland 2011France 1996
Germany 2006 5.11%Greece 2012
Hungary 2013Iceland 2010Ireland 2013
Italy 1996 10.28%Latvia 2005 9.84%
Lithuania 2011Luxembourg 2012
Malta 2006 10.75%Netherlands 1996 4.67%
Norway 2013Poland 2013
Portugal 1996 5.72%Romania 2012Slovenia 2003 5.14%
Spain 2013Sweden 1996 6.25%Turkey 2012
United Kingdom 2011 8.39%EU-28 estimate 8.13%
Source: EU IDB. See Annex “List of figures and tables” for more details.
Trends
y Injury fatalities were decreasing till 2010, but compared to the last reporting period (2008-2010), there is a general increase of 2% (period 2010-2012), though with considerable differences: Reductions took place in the areas of road traffic (-3%), work (-7%), school (-8%), homicide (-3%). The rough estimate for sport remained unchanged. The number of suicides went up (+4%), probably as a result of the economic crisis, as well as the number of fatal home and leisure accidents (+6%), probably a consequence of the increasing share of old and frail persons in EU population.
y The number of admissions due to injuries decreased slightly from 5.7 in the last reporting period (2008-2010) to 5.4 million for the current one (2010-2012). As the total number of admissions remained almost unchanged in past years, this means also a decrease of the percentage of injury related admissions.
y The estimated number of injuries treated in emergency departments is slightly higher (+4%) than for the last reporting period (2008-2010), which is within the statistical range of inaccuracy.
20132010-20122000-2009< 1999
Figure 2.10: Hospital treated injuries per 1 000 by age group and gender, EU-28
Figure 2.11: Hospital treated injuries per 1 000 by injury prevention domain and age group, EU-28
0
20
40
60
80
100
120
140
160
180
0 to
4
5 to
9
10 to
14
15 to
19
20 to
24
25 to
29
30 to
34
35 to
39
40 to
44
45 to
49
50 to
54
55 to
59
60 to
64
65 to
69
70 to
74
75 to
79
80 to
84
85+
Injury hospital treatments per 1000 - MaleInjury hospital treatments per 1000 - Female
Rate
per
1,0
00
0
20
40
60
80
100
120
140
160
0 to
4
5 to
9
10 to
14
15 to
19
20 to
24
25 to
29
30 to
34
35 to
39
40 to
44
45 to
49
50 to
54
55 to
59
60 to
64
65 to
69
70 to
74
75 to
79
80 to
84
85+
Traffic
Intentional self-harmAssault & other violenceHome & LeisureSportsSchool (education)Paid work
Source: EU IDB 2010-2012. See Annex “List of figures and tables” for more details. Source: EU IDB 2010-2012. See Annex “List of figures and tables” for more details.

12
HOTSPOT CHILDREN
Behind the numbersRožnov, Czech Republic. A woman became an eye-witness of a dramatic scene. In an open window on the first floor of the neighbouring house stood a small child, trying to sit down but then standing up again. It slipped with one foot from the window sill and fell down from a twenty foot height.
Neighbours took care of the crying child, called the emergency service, and contacted the mother and grandmother who had not noticed the accident. Paramedics brought the two-year old boy to the hospital, where he remained hospitalized for observation. “He was extremely lucky as he fell on dense grass. There were some abrasions but otherwise he seems to be fine”, said a police spokeswoman. “I thought he would be dead”, said the eye-witness.
Figure 3.1: Leading causes of fatal injuries in children up to 14 years
Road traffic injuries 32%
Other injury causes 29%
Accidental Drowning 14%
Interpersonal
violence 7%
Accidental Falls 5%
Self-inflicted 5%
Accidental Fires 5%
Accidental Poisoning 3%
Source: WHO MDB. See Annex “List of figures and tables” for more details.
Rank order Cause of death for children 1-14 years (ICD-10 codes)
% of all causes of deaths
1 External causes of morbidity and mortality (V01-Y89): injuries 28
2 Malignant neoplasms (C00-C97) 19
3Congenital malformations,
deformations and chromosomal abnormalities (Q00-Q99)
11
4 Diseases of the nervous system and the sense organs (G00-H95) 10
5 Diseases of the respiratory system (J00-J99) 7
Table 3.2: Rank order of causes of death of children 1-14 years
Source: Eurostat COD. See Annex “List of figures and tables” for more details.
Facts & impacts In this age group in particular, an injury and its disabling consequences have a tremendous impact on the child, the child’s family and society at large.
For children older than 1 year of age, injuries are the main cause of death.
Fatal injuries
y Around 3000 children die from injury each year in the EU leaving parents, relatives and friends in deep sorrow and grief. Fortunately, the number of fatal child accidents has decreased substantially in past years but there is still much room for improvement.
y Injury is the leading cause of childhood death in the EU, accounting for 28 % of all deaths of children between 1 and 14 years of age.
y Five types of accidents – road traffic, drowning, violence and neglect, falls (from height), and fires – account for two-third of all fatal child injuries up to 14 years of age (Figure 3.1).
y These five main causes are known to be preventable by appropriate measures, e.g. improving parenting skills and a wider application of child restraint systems, pool fencing, smoke alarms and window guards [24].
y Starting from birth, boys are at a higher risk of incurring a fatal injury than girls. Boys at the age of 14 are almost twice as much at risk of incurring a fatal injury than girls.
y There are considerable differences in the injury fatality rates of children between EU member states. While the average percentage of injury fatalities of all child deaths in the EU is about 10%, it is staggering 25% in Estonia, 23% in Lithuania and 22% in Greece. The important question to research is to what extent are these differential rates due to serious disparities in implementing good practices such as the ones mentioned above?
1Rank order of injuries
as cause of death in children in the EU.*
*Children 1-14 years of age
13
INJURIES IN THE EUROPEAN UNION
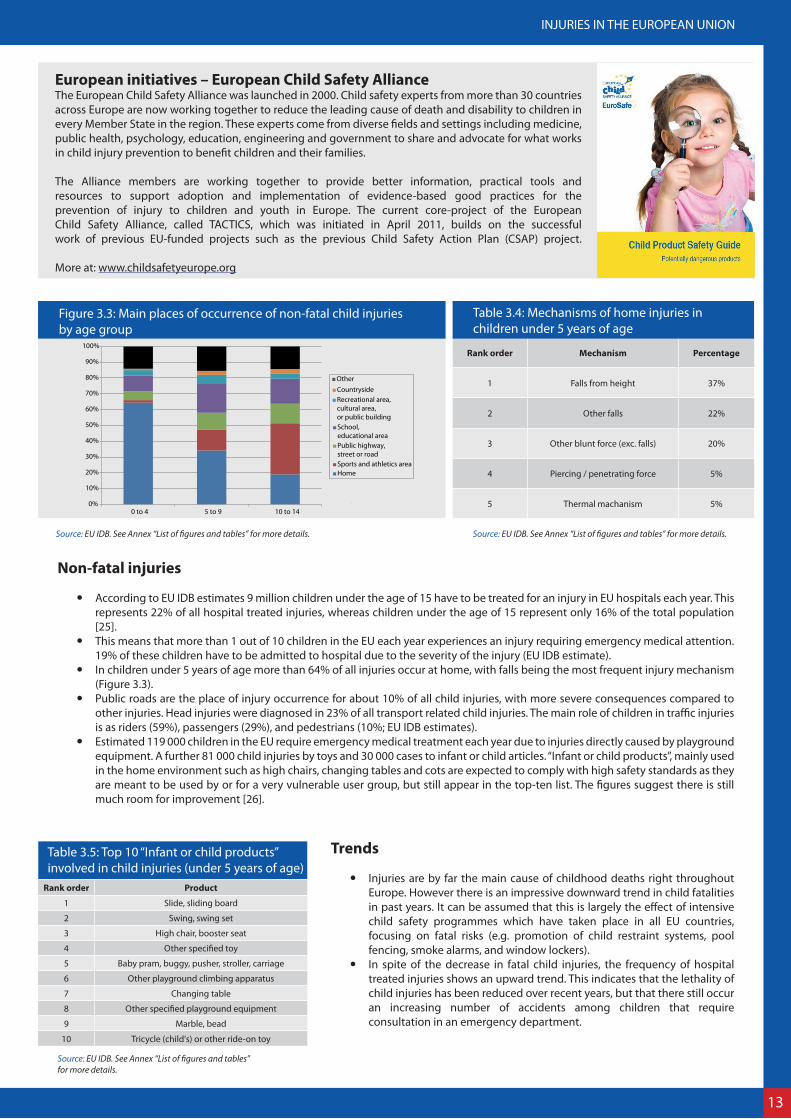
Figure 3.3: Main places of occurrence of non-fatal child injuries by age group
OtherCountrysideRecreational area, cultural area, or public buildingSchool, educational areaPublic highway, street or roadSports and athletics areaHome
0%
10%
20%
30%
40%
50%
60%
70%
80%
90%
100%
0 to 4 5 to 9 10 to 14
Source: EU IDB. See Annex “List of figures and tables” for more details.
European initiatives – European Child Safety AllianceThe European Child Safety Alliance was launched in 2000. Child safety experts from more than 30 countries across Europe are now working together to reduce the leading cause of death and disability to children in every Member State in the region. These experts come from diverse fields and settings including medicine, public health, psychology, education, engineering and government to share and advocate for what works in child injury prevention to benefit children and their families.
The Alliance members are working together to provide better information, practical tools and resources to support adoption and implementation of evidence-based good practices for the prevention of injury to children and youth in Europe. The current core-project of the European Child Safety Alliance, called TACTICS, which was initiated in April 2011, builds on the successful work of previous EU-funded projects such as the previous Child Safety Action Plan (CSAP) project.
More at: www.childsafetyeurope.org
Non-fatal injuries
y According to EU IDB estimates 9 million children under the age of 15 have to be treated for an injury in EU hospitals each year. This represents 22% of all hospital treated injuries, whereas children under the age of 15 represent only 16% of the total population [25].
y This means that more than 1 out of 10 children in the EU each year experiences an injury requiring emergency medical attention. 19% of these children have to be admitted to hospital due to the severity of the injury (EU IDB estimate).
y In children under 5 years of age more than 64% of all injuries occur at home, with falls being the most frequent injury mechanism (Figure 3.3).
y Public roads are the place of injury occurrence for about 10% of all child injuries, with more severe consequences compared to other injuries. Head injuries were diagnosed in 23% of all transport related child injuries. The main role of children in traffic injuries is as riders (59%), passengers (29%), and pedestrians (10%; EU IDB estimates).
y Estimated 119 000 children in the EU require emergency medical treatment each year due to injuries directly caused by playground equipment. A further 81 000 child injuries by toys and 30 000 cases to infant or child articles. “Infant or child products”, mainly used in the home environment such as high chairs, changing tables and cots are expected to comply with high safety standards as they are meant to be used by or for a very vulnerable user group, but still appear in the top-ten list. The figures suggest there is still much room for improvement [26].
Rank order Mechanism Percentage
1 Falls from height 37%
2 Other falls 22%
3 Other blunt force (exc. falls) 20%
4 Piercing / penetrating force 5%
5 Thermal machanism 5%
Table 3.4: Mechanisms of home injuries in children under 5 years of age
Source: EU IDB. See Annex “List of figures and tables” for more details.
Rank order Product
1 Slide, sliding board
2 Swing, swing set
3 High chair, booster seat
4 Other specified toy
5 Baby pram, buggy, pusher, stroller, carriage
6 Other playground climbing apparatus
7 Changing table
8 Other specified playground equipment
9 Marble, bead
10 Tricycle (child's) or other ride-on toy
Table 3.5: Top 10 “Infant or child products” involved in child injuries (under 5 years of age)
Source: EU IDB. See Annex “List of figures and tables” for more details.
Trends
y Injuries are by far the main cause of childhood deaths right throughout Europe. However there is an impressive downward trend in child fatalities in past years. It can be assumed that this is largely the effect of intensive child safety programmes which have taken place in all EU countries, focusing on fatal risks (e.g. promotion of child restraint systems, pool fencing, smoke alarms, and window lockers).
y In spite of the decrease in fatal child injuries, the frequency of hospital treated injuries shows an upward trend. This indicates that the lethality of child injuries has been reduced over recent years, but that there still occur an increasing number of accidents among children that require consultation in an emergency department.

14
HOTSPOT ADOLESCENTS
Behind the numbersRimini, Italy. An 18 year old tourist from Germany suffered severe head and spine injuries, when he jumped from the cliffs at a beach resort close to Rimini, Italy. His head hit the rocky seafloor. Other tourists rescued him quickly when he emerged floating unconsciously. After first aid he was brought to a hospital in Rimini where he was taken into intensive care, according to a police-spokesman.
Eye-witnesses reported that the young man actually may not have intended to jump, but was exploring the dangerous cliffs by foot and may have lost balance at some stage. At the date of the report, it was not yet known whether the young man would remain permanently disabled.
Figure 4.1: Leading causes of fatal injuries in adolescents betweeen 15-24 years
Other causes 13%Road traffic injuries 46%
AccidentalPoisoning 5%
Accidental Falls 3%Accidental Fires 1%Interpersonal violence 3%
AccidentalDrowning 4%
Self-inflicted 25%
Source: WHO MDB. See Annex “List of figures and tables” for more details.
Rank order Cause of death for adolescents 15-24 years (ICD 10 codes)
% of all causes of deaths
1 External causes of morbidity and mortality (V01-Y89): injuries 62
2 Malignant neoplasms (C00-C97) 10
3 Diseases of the circulatory system (I00-I99) 6
4 Diseases of the nervous system and the sense organs (G00-Q99) 5
5Symptoms, signs and abnormal
clinical and laboratory findings, not elsewhere classified (R00-R99)
5
Table 4.2: Leading causes of death in adolescents between 15-24 years
Source: Eurostat COD. See Annex “List of figures and tables” for more details.
Facts & impacts Compared to early childhood, adolescents are expanding their radius of action significantly wider in all dimensions. This is also reflected by the diversity of activities and settings in which injuries among young people tend to occur, e.g. in school, at work, in traffic, at home and in leisure time activities. As this is also the age when young people start to participate in motor vehicle traffic and in work environments, injury rates peak between the age of 15 and 24.Injuries are by far the number one killer in this age group.
Fatal injuries
y Annually, 18.400 young people between 15 and 24 years of age die due to an injury. Statistically, this translates to 31 deaths per 100 000 or 1 injury-death per 3 200 adolescents each year.
y These dramatic statistics make injury the leading cause of death among adolescents, accounting for 57% of all deaths in this age group in terms of relative injury mortality.
y The risk of a fatal injury increases significantly after the age of 14, especially for boys, and leads to a relative injury mortality rate of 69% in males between 20 to 24 years of age, and 45% for females (figure 2.6).
y Two main causes account for 71% of all fatal injuries among adolescents: road injuries (46%) and suicides (25%; Figure 4.1).
y For both causes the rates per 100 000 adolescents are approximately 4 times higher for boys. y Poisoning, mainly through medication and alcohol, ranks third on the cause of death list for
adolescents. The share of 5% represents around 800 victims annually. This does not include deaths due to psychotropic drugs that are often classified under the categories for “mental and behavioural disorders” of the WHO ICD-10 cause of death catalogue.
y There are considerable differences between countries in the injury fatality rates for adolescents. For example, injury in young people between the age of 15 and 24 accounts for 63% in the average of all EU countries, but for 77% in Estonia and 76% in Finland, while only for 48% in Portugal and 50% in Bulgaria.
67%Percentage of deaths
among adolescent boys and young men in the EU that are caused
by injuries.*
*Male adolescents between 15 and 24 years of age
15
INJURIES IN THE EUROPEAN UNION
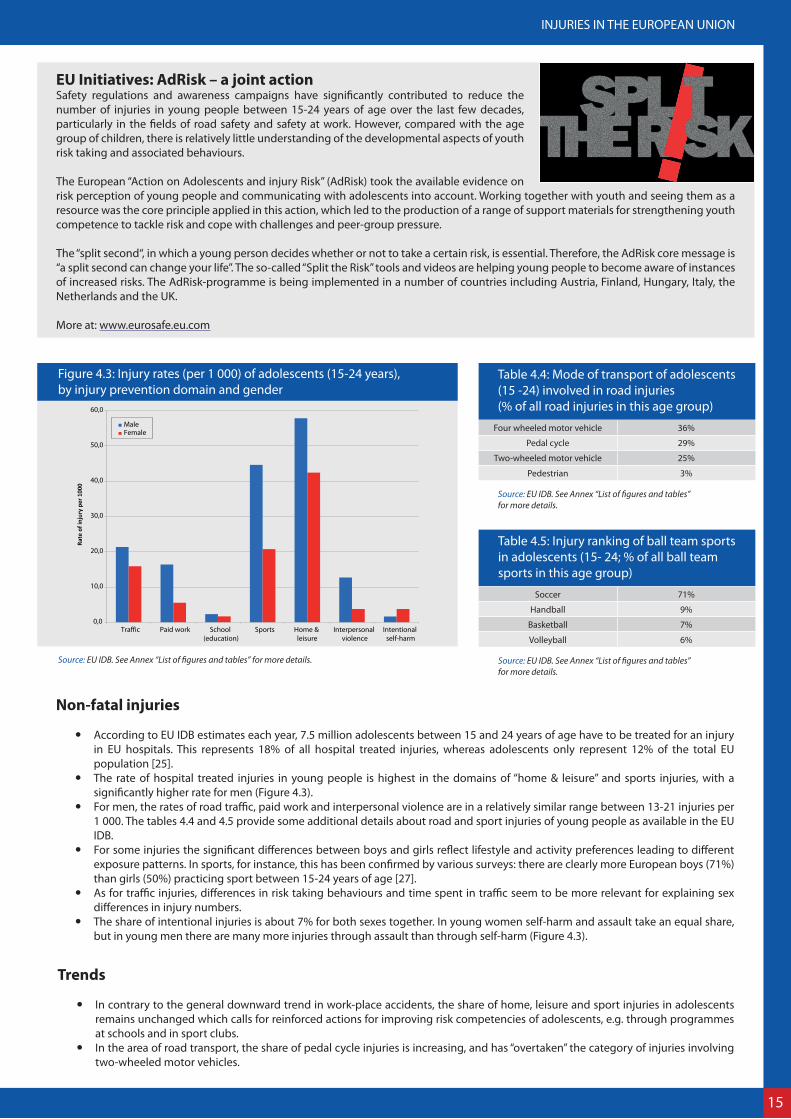
EU Initiatives: AdRisk – a joint action Safety regulations and awareness campaigns have significantly contributed to reduce the number of injuries in young people between 15-24 years of age over the last few decades, particularly in the fields of road safety and safety at work. However, compared with the age group of children, there is relatively little understanding of the developmental aspects of youth risk taking and associated behaviours.
The European “Action on Adolescents and injury Risk” (AdRisk) took the available evidence on risk perception of young people and communicating with adolescents into account. Working together with youth and seeing them as a resource was the core principle applied in this action, which led to the production of a range of support materials for strengthening youth competence to tackle risk and cope with challenges and peer-group pressure.
The “split second“, in which a young person decides whether or not to take a certain risk, is essential. Therefore, the AdRisk core message is “a split second can change your life”. The so-called “Split the Risk” tools and videos are helping young people to become aware of instances of increased risks. The AdRisk-programme is being implemented in a number of countries including Austria, Finland, Hungary, Italy, the Netherlands and the UK.
More at: www.eurosafe.eu.com
Figure 4.3: Injury rates (per 1 000) of adolescents (15-24 years), by injury prevention domain and gender
MaleFemale
0,0
10,0
20,0
30,0
40,0
50,0
60,0
Traffic Paid work School (education)
Sports Home & leisure
Interpersonal violence
Intentional self-harm
Rate
of i
njur
y pe
r 100
0
Source: EU IDB. See Annex “List of figures and tables” for more details.
Trends
y In contrary to the general downward trend in work-place accidents, the share of home, leisure and sport injuries in adolescents remains unchanged which calls for reinforced actions for improving risk competencies of adolescents, e.g. through programmes at schools and in sport clubs.
y In the area of road transport, the share of pedal cycle injuries is increasing, and has “overtaken” the category of injuries involving two-wheeled motor vehicles.
Four wheeled motor vehicle 36%
Pedal cycle 29%
Two-wheeled motor vehicle 25%
Pedestrian 3%
Table 4.4: Mode of transport of adolescents (15 -24) involved in road injuries (% of all road injuries in this age group)
Source: EU IDB. See Annex “List of figures and tables” for more details.
Soccer 71%
Handball 9%
Basketball 7%
Volleyball 6%
Table 4.5: Injury ranking of ball team sports in adolescents (15- 24; % of all ball team sports in this age group)
Source: EU IDB. See Annex “List of figures and tables” for more details.
Non-fatal injuries
y According to EU IDB estimates each year, 7.5 million adolescents between 15 and 24 years of age have to be treated for an injury in EU hospitals. This represents 18% of all hospital treated injuries, whereas adolescents only represent 12% of the total EU population [25].
y The rate of hospital treated injuries in young people is highest in the domains of “home & leisure” and sports injuries, with a significantly higher rate for men (Figure 4.3).
y For men, the rates of road traffic, paid work and interpersonal violence are in a relatively similar range between 13-21 injuries per 1 000. The tables 4.4 and 4.5 provide some additional details about road and sport injuries of young people as available in the EU IDB.
y For some injuries the significant differences between boys and girls reflect lifestyle and activity preferences leading to different exposure patterns. In sports, for instance, this has been confirmed by various surveys: there are clearly more European boys (71%) than girls (50%) practicing sport between 15-24 years of age [27].
y As for traffic injuries, differences in risk taking behaviours and time spent in traffic seem to be more relevant for explaining sex differences in injury numbers.
y The share of intentional injuries is about 7% for both sexes together. In young women self-harm and assault take an equal share, but in young men there are many more injuries through assault than through self-harm (Figure 4.3).

16
HOTSPOT OLDER PEOPLE
Behind the numbersLondon Borough of Richmond. A 72-year-old woman fell and broke her hip. She slipped near a large tree where the roots had pushed up the path and caused it to slope. A witness, 40, who waited until the ambulance arrived, said the woman was on her way to visit her new-born great-grandchild when she had the accident.
A neighbour said she wrote to the Council last month complaining that the pavement was dangerous as broken tiles forced wheelchair users and mothers with pushchairs to go into the road in order to get along. A council spokeswoman said: “we inspect all residential roads and pavements on a regular basis and any defects that are deemed hazardous or dangerous are repaired by the council’s highway teams within specified timescales”.
Figure 5.1: Fatal injuries amongst older people (60+) by causes of death
Figure 5.2: Fatal injuries amongst older people (60+) by causes of death and gender
Other injurycauses 39%
AccidentalPoisoning 2%
AccidentalDrowning 2% Interpersonal violence 1%
Road traffic injuries 9%
Accidental Fires 2%
Falls 29%
Self-inflicted 16%
0,00 5,00 10,00 15,00 20,00 25,00 30,00 35,00
Accidental falls
Self-inflicted
Road traffic injuries
Accidental poisoning
Accidental drowning
Accidental fires
Interpersonal violence
FemaleMale
Source: WHO MDB. See Annex “List of figures and tables” for more details. Source: WHO MDB, Eurostat COD. See Annex “List of figures and tables” for more details.
Facts & impacts The highest injury mortality rates relate to people at age 60 and above, falls being a major cause of these deaths. Fall ¬injuries also account for a higher than average hospitalisation rate and an excess share in the direct medical cost due to injuries in this age group.
A “greying” Europe calls for increased investments in injury prevention for older people as indicated by the following figures.
Fatal injuries
y Annually, about 123 000 people in the EU aged 60 and above die from the consequences of injuries, which represents 52% of all injury deaths. Nevertheless, the 123 000 fatalities represent only 3% of all deaths in this age group.
y The injury fatality rates (per 100 000) rise sharply after the age of 70 for both women (from 40 to 137 in the age group 80 to 85) and men (from 95 to 229; Figure 2.6).
y Falls are the main cause (29%) of fatal injuries among older people, in particular for women. Suicides (16%) and road traffic (9%) rank second and third (Figure 5.1).
y More than one quarter of all people suffering a hip fracture die within a year of falling and another 50 percent never return to their prior level of mobility and independence [28].
y Also in the senior population differences exist in injury fatality between the EU member states - e.g. the share of injury deaths to all deaths of people above 65 years of age ranges from 1% in Greece to 6% in Slovenia).
82%The percentage of victims of fatal fall injuries that are 60
years and older.
17
INJURIES IN THE EUROPEAN UNION
European initiatives: Falls Prevention NetworkThe EU-Strategic Plan for Innovation Partnership on Active and Healthy Ageing has been launched by the Commission in 2012. This plan contains various elements, one of them aiming to have by 2015 validated and operational programmes for early diagnosis and prevention of falls implemented in at least 15 different regions of the EU. These programmes should use innovation in organisation, delivery and business models, injury risk registers and services. The ultimate objective of the EU-innovation plan is to add an average of two active healthy life years to the lives of European citizens by 2020. The ProFouND-project, “Prevention of Falls Network for Dissemination”, is one of the projects supported by the EC in this framework. This project raises awareness of the importance of the issue and will enhance the availability of ‚proven‘ tools and guidance for multidisciplinary care, early diagnosis (risk assessment) and falls prevention management. It will support Member States, regions/municipalities, care organisations and insurance companies to invest in their individual programmes by providing guidelines, toolkits and evidence-based standards of care.
Website: www.fallsprevention.eu
Non-fatal injuries
y The total of older people (60 years of age and plus) that have to be treated for an injury in EU hospitals is estimated to be 8.5 million each year. The burden of treatment, rehabilitation and care is tremendous, both for society and the respective families.
y According to EU IDB estimates a hospital contact for an injury is required each year by 70 of 1 000 persons in the age of 60 or above. From an age of about 70 years, the rate increases considerably for both sexes, but faster for women. Women between 80 to 84 years bear a risk which is 50% higher than that of men of the same age (figure 2.9).
y About one third of all hospital contacts after an injury lead to admission (EU IDB estimate). As the average length of stay in hospital increases with age (by 1 day for every 5-year age group from 60 years onwards), older people “consume” 74% of all injury related hospital days [23]. For women this share is even higher at 78%, their share in the total population is 23% [25].
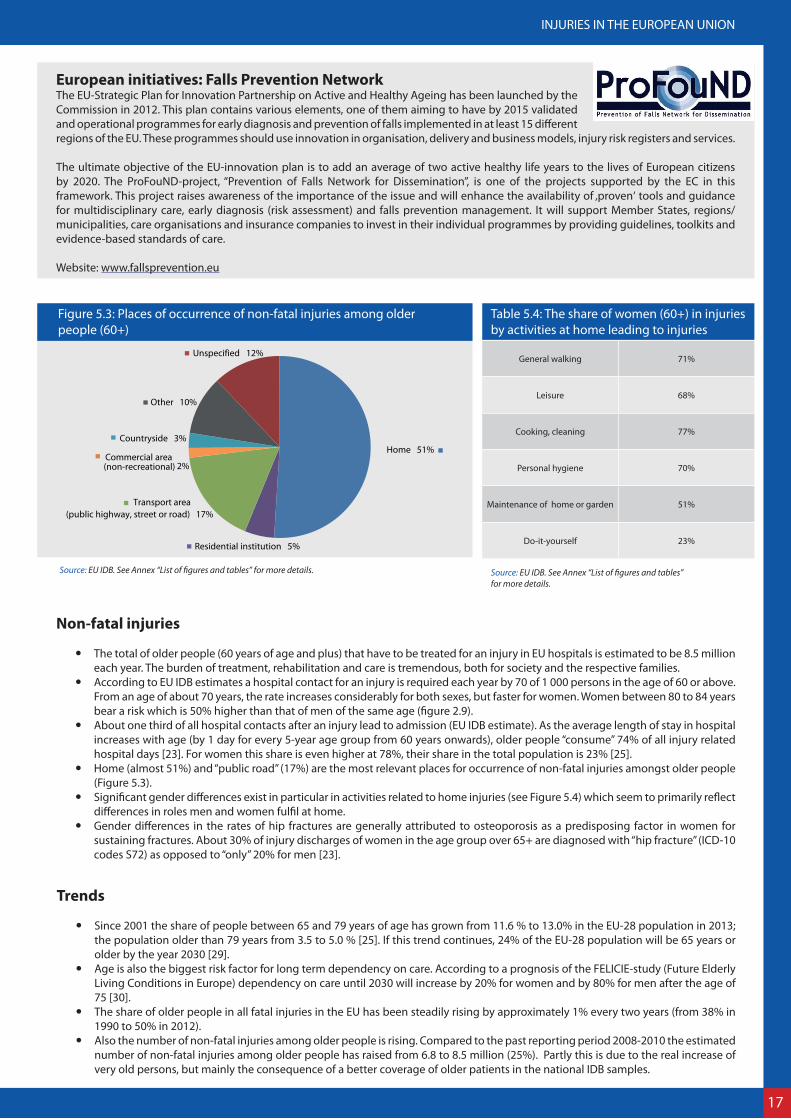
y Home (almost 51%) and “public road” (17%) are the most relevant places for occurrence of non-fatal injuries amongst older people (Figure 5.3).
y Significant gender differences exist in particular in activities related to home injuries (see Figure 5.4) which seem to primarily reflect differences in roles men and women fulfil at home.
y Gender differences in the rates of hip fractures are generally attributed to osteoporosis as a predisposing factor in women for sustaining fractures. About 30% of injury discharges of women in the age group over 65+ are diagnosed with “hip fracture” (ICD-10 codes S72) as opposed to “only” 20% for men [23].
Figure 5.3: Places of occurrence of non-fatal injuries among older people (60+)
Home 51%
Residential institution 5%
Transport area (public highway, street or road) 17%
Commercial area(non-recreational) 2%
Countryside 3%
Other 10%
Unspecified 12%
Source: EU IDB. See Annex “List of figures and tables” for more details.
General walking 71%
Leisure 68%
Cooking, cleaning 77%
Personal hygiene 70%
Maintenance of home or garden 51%
Do-it-yourself 23%
Table 5.4: The share of women (60+) in injuries by activities at home leading to injuries
Source: EU IDB. See Annex “List of figures and tables” for more details.
Trends
y Since 2001 the share of people between 65 and 79 years of age has grown from 11.6 % to 13.0% in the EU-28 population in 2013; the population older than 79 years from 3.5 to 5.0 % [25]. If this trend continues, 24% of the EU-28 population will be 65 years or older by the year 2030 [29].
y Age is also the biggest risk factor for long term dependency on care. According to a prognosis of the FELICIE-study (Future Elderly Living Conditions in Europe) dependency on care until 2030 will increase by 20% for women and by 80% for men after the age of 75 [30].
y The share of older people in all fatal injuries in the EU has been steadily rising by approximately 1% every two years (from 38% in 1990 to 50% in 2012).
y Also the number of non-fatal injuries among older people is rising. Compared to the past reporting period 2008-2010 the estimated number of non-fatal injuries among older people has raised from 6.8 to 8.5 million (25%). Partly this is due to the real increase of very old persons, but mainly the consequence of a better coverage of older patients in the national IDB samples.
18
HOTSPOT VULNERABLE ROAD USERS
Behind the numbersBaia Mare, Romania. A 45 year old male car driver was not attentive when he turned left and hit a 22 year old cyclist who fell and hit the ground. The victim suffered multiple injuries and was transported by ambulance to the Emergency Department.
The car driver declared that he didn’t see the cyclist due the fact that his vision was impaired by sun glare. “I did not see the cyclist. I do not know where he came from. From the road, the sidewalk, I just do not know. I drove extremely carefully. He came and jumped over me” declared the car driver. “He failed to give the right of way to a bicyclist who drove according to traffic rules on the opposite lane. The car driver was tested for alcohol and the results were negative” declared a representative of the Traffic Police Department.
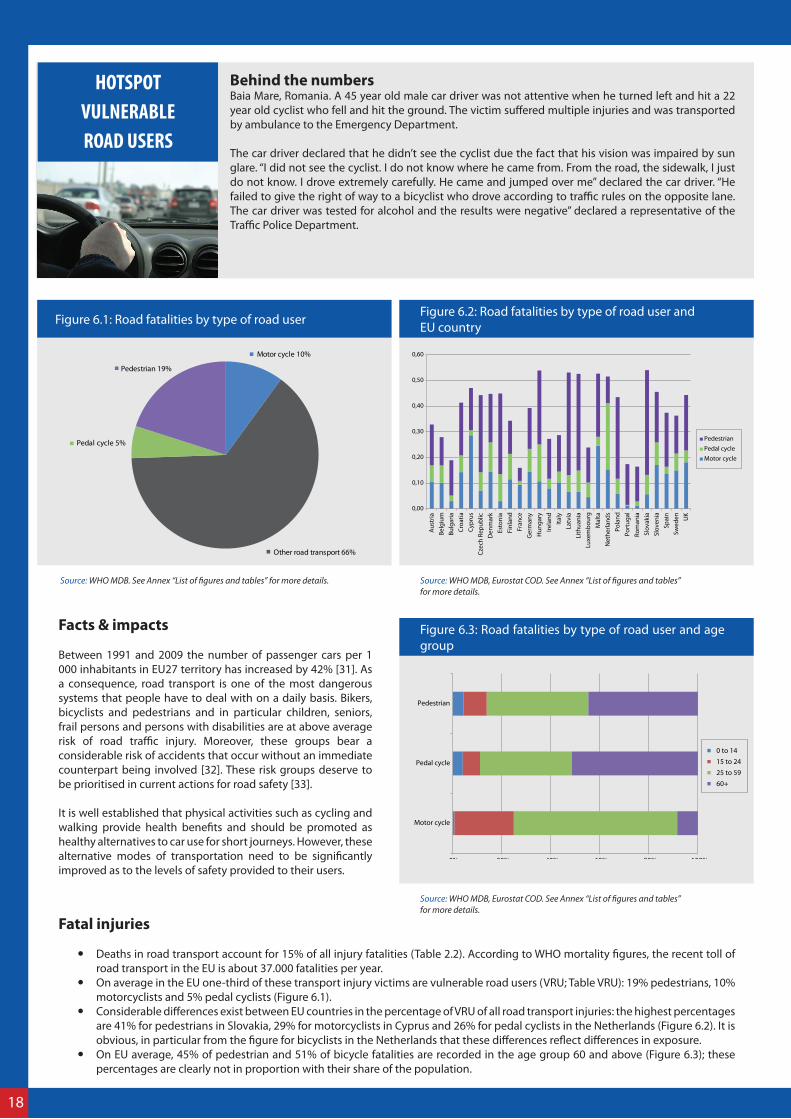
Figure 6.1: Road fatalities by type of road user Figure 6.2: Road fatalities by type of road user and EU country
Figure 6.3: Road fatalities by type of road user and age group
Motor cycle 10%
Other road transport 66%
Pedal cycle 5%
Pedestrian 19%
0,00
0,10
0,20
0,30
0,40
0,50
0,60
Aus
tria
Belg
ium
Bulg
aria
Croa
tiaCy
prus
Czec
h Re
publ
icD
enm
ark
Esto
nia
Finl
and
Fran
ceG
erm
any
Hun
gary
Irela
ndIta
lyLa
tvia
Lith
uani
aLu
xem
bour
gM
alta
Net
herla
nds
Pola
ndPo
rtug
alRo
man
iaSl
ovak
iaSl
oven
iaSp
ain
Swed
en UK
Pedestrian
Pedal cycle
Motor cycle
0% 20% 40% 60% 80% 100%
Motor cycle
Pedal cycle
Pedestrian
0 to 14
15 to 24
25 to 59
60+
Source: WHO MDB. See Annex “List of figures and tables” for more details. Source: WHO MDB, Eurostat COD. See Annex “List of figures and tables” for more details.
Source: WHO MDB, Eurostat COD. See Annex “List of figures and tables” for more details.
Facts & impacts
Between 1991 and 2009 the number of passenger cars per 1 000 inhabitants in EU27 territory has increased by 42% [31]. As a consequence, road transport is one of the most dangerous systems that people have to deal with on a daily basis. Bikers, bicyclists and pedestrians and in particular children, seniors, frail persons and persons with disabilities are at above average risk of road traffic injury. Moreover, these groups bear a considerable risk of accidents that occur without an immediate counterpart being involved [32]. These risk groups deserve to be prioritised in current actions for road safety [33].
It is well established that physical activities such as cycling and walking provide health benefits and should be promoted as healthy alternatives to car use for short journeys. However, these alternative modes of transportation need to be significantly improved as to the levels of safety provided to their users.
Fatal injuries
y Deaths in road transport account for 15% of all injury fatalities (Table 2.2). According to WHO mortality figures, the recent toll of road transport in the EU is about 37.000 fatalities per year.
y On average in the EU one-third of these transport injury victims are vulnerable road users (VRU; Table VRU): 19% pedestrians, 10% motorcyclists and 5% pedal cyclists (Figure 6.1).
y Considerable differences exist between EU countries in the percentage of VRU of all road transport injuries: the highest percentages are 41% for pedestrians in Slovakia, 29% for motorcyclists in Cyprus and 26% for pedal cyclists in the Netherlands (Figure 6.2). It is obvious, in particular from the figure for bicyclists in the Netherlands that these differences reflect differences in exposure.
y On EU average, 45% of pedestrian and 51% of bicycle fatalities are recorded in the age group 60 and above (Figure 6.3); these percentages are clearly not in proportion with their share of the population.
19
INJURIES IN THE EUROPEAN UNION
EU Initiatives: EU Transport Safety PolicyThe new EU road safety policy aims to cut European road deaths by 50% by 2020 compared to 2010. To do so, it seeks to make users, vehicles and infrastructure safer through a mix of measures – national cooperation, sharing best practices, research and studies, awareness campaigns and possibly regulation. More specifically this would involve: creating a European road safety education and training strategy; implementing EU-wide road safety legislation to ensure all EU nationals are treated equally when traffic rules are broken; making vulnerable road users safer by improving communication; and improving tools for collecting and analysing accidents [34]. The European Transport Safety Council, which counts around fifty transport safety knowledge centres across Europe, serves as an important source of expert advice on transport safety matters to countries and the EC. It seeks to identify and promote effective measures on the basis of international scientific research and best practice in areas which offer the greatest potential for a reduction in transport crashes and casualties. It provides factual information, in the form of scientific reports, fact sheets and newsletters, in support of high safety standards in EU harmonisation, the implementation of best practices and transport safety research.
More at: www.etsc.eu
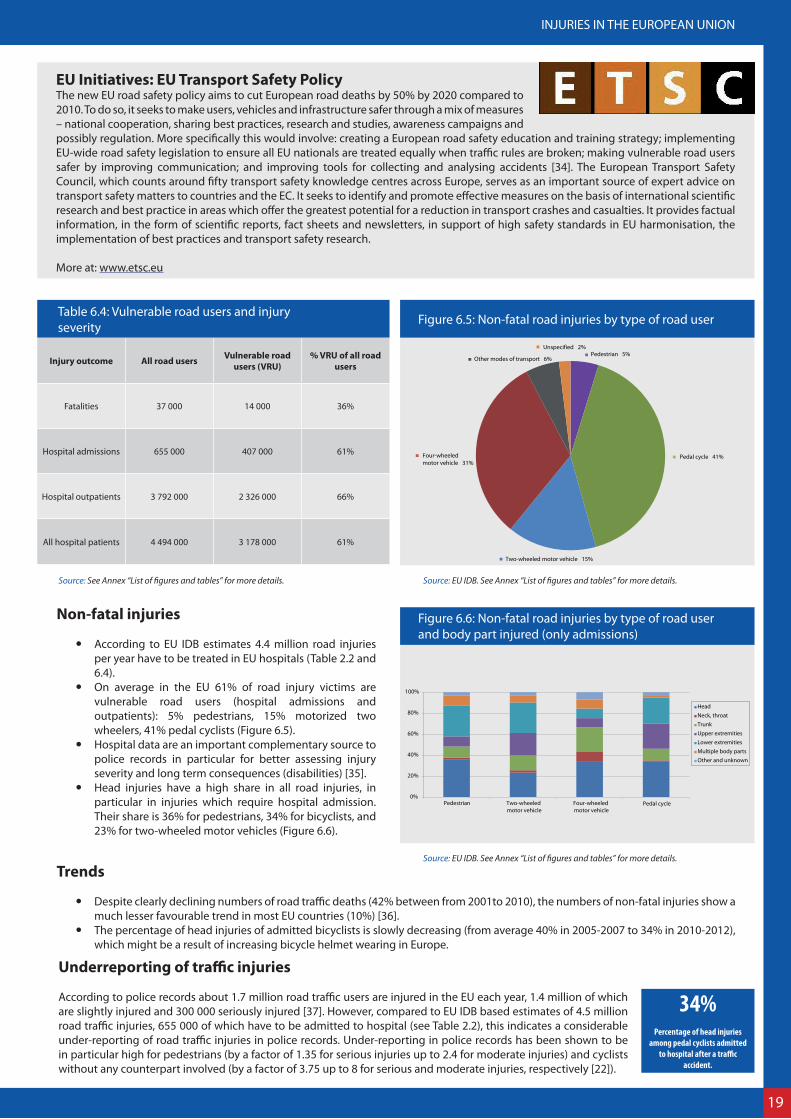
Injury outcome All road users Vulnerable road users (VRU)
% VRU of all road users
Fatalities 37 000 14 000 36%
Hospital admissions 655 000 407 000 61%
Hospital outpatients 3 792 000 2 326 000 66%
All hospital patients 4 494 000 3 178 000 61%
Table 6.4: Vulnerable road users and injury severity
Source: See Annex “List of figures and tables” for more details.
Figure 6.5: Non-fatal road injuries by type of road user
Pedestrian 5%
Pedal cycle 41%
Two-wheeled motor vehicle 15%
Four-wheeled motor vehicle 31%
Other modes of transport 6%
Unspecified 2%
Source: EU IDB. See Annex “List of figures and tables” for more details.
Figure 6.6: Non-fatal road injuries by type of road user and body part injured (only admissions)
HeadNeck, throatTrunkUpper extremitiesLower extremitiesMultiple body partsOther and unknown
0%
20%
40%
60%
80%
100%
Pedestrian Two-wheeled motor vehicle
Four-wheeled motor vehicle
Pedal cycle
Source: EU IDB. See Annex “List of figures and tables” for more details.
Non-fatal injuries
y According to EU IDB estimates 4.4 million road injuries per year have to be treated in EU hospitals (Table 2.2 and 6.4).
y On average in the EU 61% of road injury victims are vulnerable road users (hospital admissions and outpatients): 5% pedestrians, 15% motorized two wheelers, 41% pedal cyclists (Figure 6.5).
y Hospital data are an important complementary source to police records in particular for better assessing injury severity and long term consequences (disabilities) [35].
y Head injuries have a high share in all road injuries, in particular in injuries which require hospital admission. Their share is 36% for pedestrians, 34% for bicyclists, and 23% for two-wheeled motor vehicles (Figure 6.6).
Trends
y Despite clearly declining numbers of road traffic deaths (42% between from 2001to 2010), the numbers of non-fatal injuries show a much lesser favourable trend in most EU countries (10%) [36].
y The percentage of head injuries of admitted bicyclists is slowly decreasing (from average 40% in 2005-2007 to 34% in 2010-2012), which might be a result of increasing bicycle helmet wearing in Europe.
Underreporting of traffic injuries
According to police records about 1.7 million road traffic users are injured in the EU each year, 1.4 million of which are slightly injured and 300 000 seriously injured [37]. However, compared to EU IDB based estimates of 4.5 million road traffic injuries, 655 000 of which have to be admitted to hospital (see Table 2.2), this indicates a considerable under-reporting of road traffic injuries in police records. Under-reporting in police records has been shown to be in particular high for pedestrians (by a factor of 1.35 for serious injuries up to 2.4 for moderate injuries) and cyclists without any counterpart involved (by a factor of 3.75 up to 8 for serious and moderate injuries, respectively [22]).
34%Percentage of head injuries
among pedal cyclists admitted to hospital after a traffic
accident.
20
Behind the numbersErp, the Netherlands. For more than forty years a 66 year old man in the south of the Netherlands, used to entertain neighbours and friends with fireworks at new year’s eve, without any problem… until last time. “Last time, I was lightning my rockets as usual. One rocket did not go off; I thought the fuse had not ignited. When I went in for a closer look, the thing went off directly into my face.”
The fractured cheekbone and broken nose healed within a couple of weeks, but in his right eye socket they had to implant an artificial eye. “I cannot judge distances anymore. Backward parking has become difficult. Recently in a supermarket I stumbled over a rack”. This year the poor man will celebrate New Year’s Eve quietly at home with his wife. “Of course I would prefer to join the outdoor party and watch the fireworks, but I better take care of the one eye I have left”, he comments.
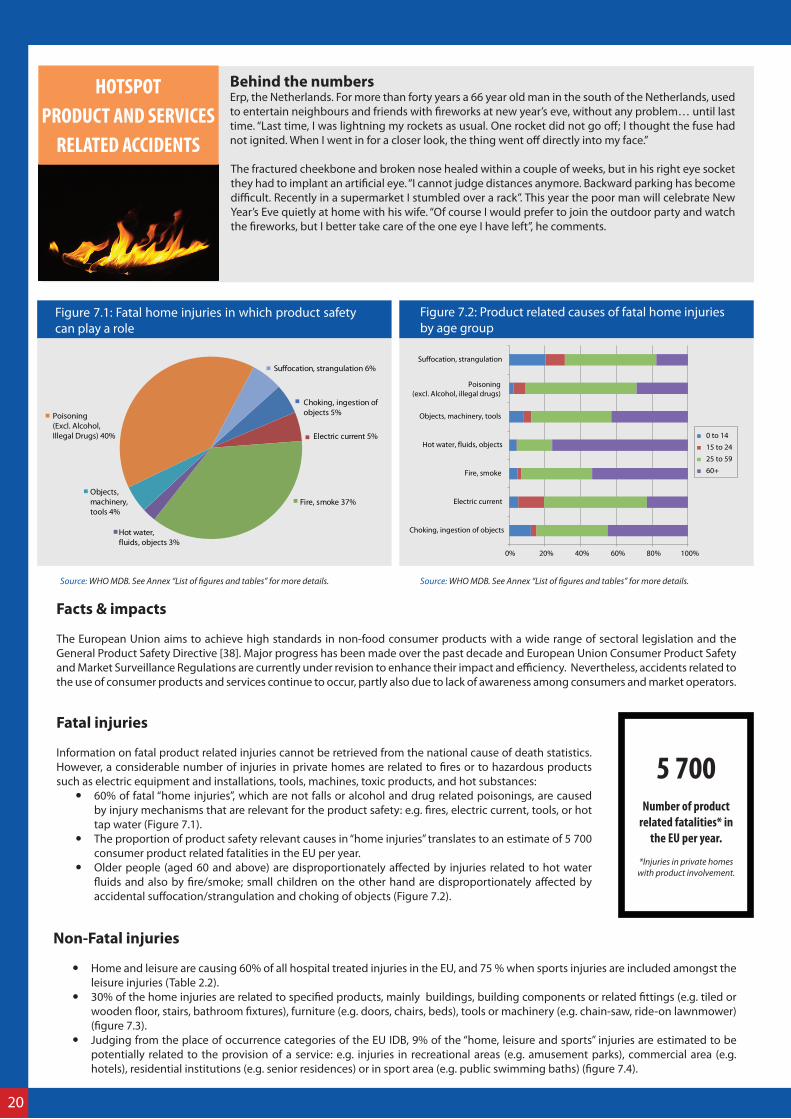
Figure 7.1: Fatal home injuries in which product safety can play a role
Figure 7.2: Product related causes of fatal home injuries by age group
Choking, ingestion of objects 5%
Fire, smoke 37%
Poisoning (Excl. Alcohol, Illegal Drugs) 40%
Suffocation, strangulation 6%
Electric current 5%
Hot water, fluids, objects 3%
Objects, machinery, tools 4%
0% 20% 40% 60% 80% 100%
Choking, ingestion of objects
Electric current
Fire, smoke
Hot water, fluids, objects
Objects, machinery, tools
Poisoning(excl. Alcohol, illegal drugs)
Suffocation, strangulation
0 to 14
15 to 24
25 to 59
60+
Source: WHO MDB. See Annex “List of figures and tables” for more details. Source: WHO MDB. See Annex “List of figures and tables” for more details.
Facts & impacts The European Union aims to achieve high standards in non-food consumer products with a wide range of sectoral legislation and the General Product Safety Directive [38]. Major progress has been made over the past decade and European Union Consumer Product Safety and Market Surveillance Regulations are currently under revision to enhance their impact and efficiency. Nevertheless, accidents related to the use of consumer products and services continue to occur, partly also due to lack of awareness among consumers and market operators.
Non-Fatal injuries
y Home and leisure are causing 60% of all hospital treated injuries in the EU, and 75 % when sports injuries are included amongst the leisure injuries (Table 2.2).
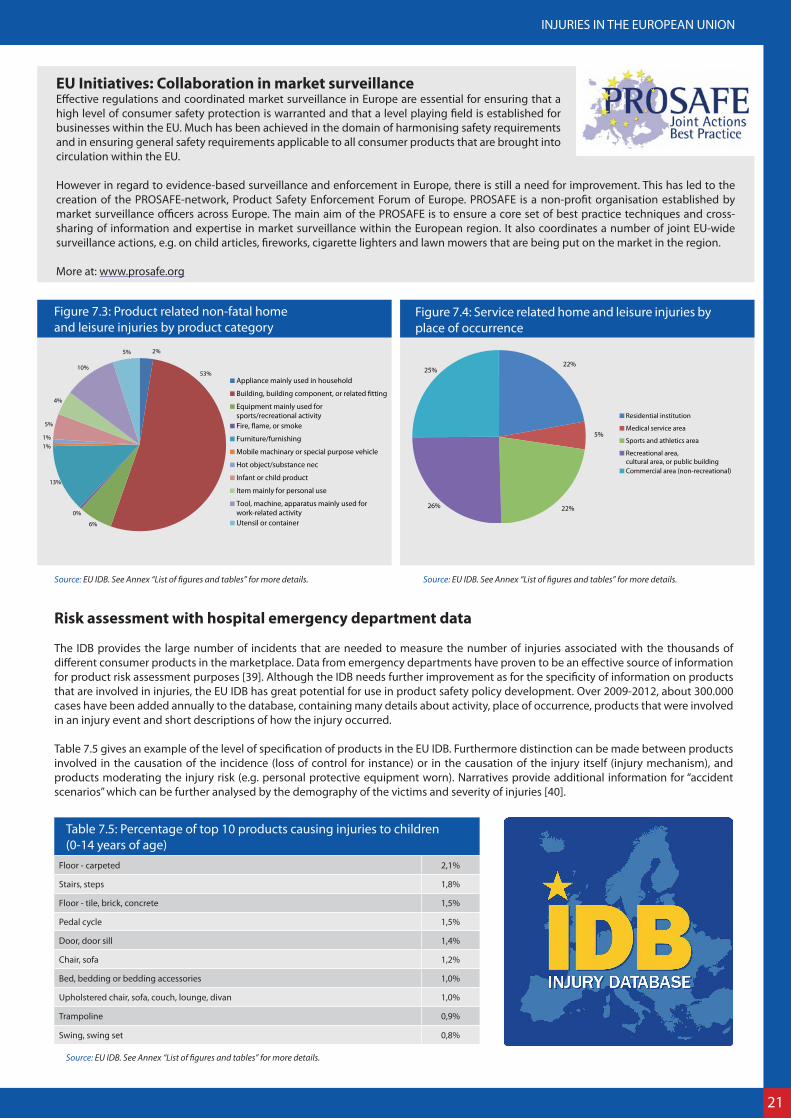
y 30% of the home injuries are related to specified products, mainly buildings, building components or related fittings (e.g. tiled or wooden floor, stairs, bathroom fixtures), furniture (e.g. doors, chairs, beds), tools or machinery (e.g. chain-saw, ride-on lawnmower) (figure 7.3).
y Judging from the place of occurrence categories of the EU IDB, 9% of the “home, leisure and sports” injuries are estimated to be potentially related to the provision of a service: e.g. injuries in recreational areas (e.g. amusement parks), commercial area (e.g. hotels), residential institutions (e.g. senior residences) or in sport area (e.g. public swimming baths) (figure 7.4).
Fatal injuries Information on fatal product related injuries cannot be retrieved from the national cause of death statistics. However, a considerable number of injuries in private homes are related to fires or to hazardous products such as electric equipment and installations, tools, machines, toxic products, and hot substances:
y 60% of fatal “home injuries”, which are not falls or alcohol and drug related poisonings, are caused by injury mechanisms that are relevant for the product safety: e.g. fires, electric current, tools, or hot tap water (Figure 7.1).
y The proportion of product safety relevant causes in “home injuries” translates to an estimate of 5 700 consumer product related fatalities in the EU per year.
y Older people (aged 60 and above) are disproportionately affected by injuries related to hot water fluids and also by fire/smoke; small children on the other hand are disproportionately affected by accidental suffocation/strangulation and choking of objects (Figure 7.2).
5 700Number of product
related fatalities* in the EU per year.
*Injuries in private homes with product involvement.
HOTSPOT PRODUCT AND SERVICES
RELATED ACCIDENTS
21
INJURIES IN THE EUROPEAN UNION
Risk assessment with hospital emergency department data The IDB provides the large number of incidents that are needed to measure the number of injuries associated with the thousands of different consumer products in the marketplace. Data from emergency departments have proven to be an effective source of information for product risk assessment purposes [39]. Although the IDB needs further improvement as for the specificity of information on products that are involved in injuries, the EU IDB has great potential for use in product safety policy development. Over 2009-2012, about 300.000 cases have been added annually to the database, containing many details about activity, place of occurrence, products that were involved in an injury event and short descriptions of how the injury occurred.
Table 7.5 gives an example of the level of specification of products in the EU IDB. Furthermore distinction can be made between products involved in the causation of the incidence (loss of control for instance) or in the causation of the injury itself (injury mechanism), and products moderating the injury risk (e.g. personal protective equipment worn). Narratives provide additional information for “accident scenarios” which can be further analysed by the demography of the victims and severity of injuries [40].
EU Initiatives: Collaboration in market surveillance Effective regulations and coordinated market surveillance in Europe are essential for ensuring that a high level of consumer safety protection is warranted and that a level playing field is established for businesses within the EU. Much has been achieved in the domain of harmonising safety requirements and in ensuring general safety requirements applicable to all consumer products that are brought into circulation within the EU.
However in regard to evidence-based surveillance and enforcement in Europe, there is still a need for improvement. This has led to the creation of the PROSAFE-network, Product Safety Enforcement Forum of Europe. PROSAFE is a non-profit organisation established by market surveillance officers across Europe. The main aim of the PROSAFE is to ensure a core set of best practice techniques and cross-sharing of information and expertise in market surveillance within the European region. It also coordinates a number of joint EU-wide surveillance actions, e.g. on child articles, fireworks, cigarette lighters and lawn mowers that are being put on the market in the region.
More at: www.prosafe.org
Figure 7.3: Product related non-fatal home and leisure injuries by product category
Source: EU IDB. See Annex “List of figures and tables” for more details.
Figure 7.4: Service related home and leisure injuries by place of occurrence
Residential institution
Medical service area
Sports and athletics area
Recreational area, cultural area, or public buildingCommercial area (non-recreational)
22%
5%
22%26%
25%
Residential institution
Medical service area
Sports and athletics area
Recreational area, cultural area, or public buildingCommercial area (non-recreational)
22%
5%
22%26%
25%
Appliance mainly used in household
Building, building component, or related fitting
Equipment mainly used for sports/recreational activityFire, flame, or smoke
Furniture/furnishing
Mobile machinary or special purpose vehicle
Hot object/substance nec
Infant or child product
Item mainly for personal use
Tool, machine, apparatus mainly used for work-related activityUtensil or container
2%
53%
6%
0%
13%
1%1%
5%
4%
10%
5%
Source: EU IDB. See Annex “List of figures and tables” for more details.
Table 3.5: Top 10 “Infant or child products” involved in child injuries (under 5 years of age)
Floor - carpeted 2,1%
Stairs, steps 1,8%
Floor - tile, brick, concrete 1,5%
Pedal cycle 1,5%
Door, door sill 1,4%
Chair, sofa 1,2%
Bed, bedding or bedding accessories 1,0%
Upholstered chair, sofa, couch, lounge, divan 1,0%
Trampoline 0,9%
Swing, swing set 0,8%
Table 7.5: Percentage of top 10 products causing injuries to children (0-14 years of age)
Source: EU IDB. See Annex “List of figures and tables” for more details.
Appliance mainly used in household
Building, building component, or related fitting
Equipment mainly used for sports/recreational activityFire, flame, or smoke
Furniture/furnishing
Mobile machinary or special purpose vehicle
Hot object/substance nec
Infant or child product
Item mainly for personal use
Tool, machine, apparatus mainly used for work-related activityUtensil or container
2%
53%
6%
0%
13%
1%1%
5%
4%
10%
5%

22
HOTSPOT SPORTS INJURIES
Behind the numbersKitzbühel, Austria. For a 5 year old boy from Tyrol a skiing school class ended with severe injuries. The boy was travelling in a group of eight children when he was run over by an unknown adult male skier.
According to the police, the boy was skiing directly behind his instructor. The skier drove through both in fast and uncontrolled manner and also toppled. He did not care about the child and did not identify himself.
The boy remained unconscious for several minutes and was brought to the city hospital by rescue helicopter. He suffered a double jaw fracture and cuts on his face. Owing to wearing skiing helmet more serious head injuries such as brain injuries were prevented.
Figure 8.1: Fatal sports injuries by type of sports (excluding swimming)
Figure 8.2: Fatal sports injuries by type of sports (excluding swimming) and age group
Aero (non-motored) sports 13%
Boating sports 15%
Ice or snow sports(avalanche) 9%
Individual water sports(divind, jumping) 4%
Mountaineering, climbing 25%
Bicycling - non-traffic 16%
Equestrian activities 11%
Ice or snow sports 7%
0% 20% 40% 60% 80% 100%
Aero (non-motored)sports
Bicycling - non-traffic
Boating sports
Equestrian activities
Ice or snow sports
Ice or snow sports (avalanche)
Individual water sports(diving, jumping)
Mountaineering, climbing
0 to 1415 to 2425 to 5960+
Source: WHO MDB. See Annex “List of figures and tables” for more details. Source: WHO MDB. See Annex “List of figures and tables” for more details.
Facts & impacts Physical exercise is an essential component of a healthy lifestyle leading to important health gains. However, a sizable proportion of the expected health gains are lost due to sport injuries [41]. As safety concerns are a factor in the decision whether or not to participate, anticipated injury risks are a significant barrier for people to getting involved in sports.
Unfortunately, the usual health statistics poorly cover the incidence of sports injuries. For non-fatal injuries, the EU IDB proves to be a rich source of information on the frequency and patterns of non-fatal sports injuries due to a specific “IDB sports module” [42].
Fatal injuries
y As a conservative estimate, about 900 unintentional fatal injuries per year can definitively be related to sport activities (Figure 8.1). These sports categories are derived from WHO ICD mortality codes like “hang-glider accident” (aero sports), “fall from cliff” (climbing), or “fall involving ice-skates, skis” (ice or snow sports). When certain types of drowning (in natural water and swimming pools) and off road bicycle accidents are included in the estimate, about 5 in 1 000 unintentional injuries can be related to recrea¬tional and sports activities. This rate translates in to an estimate of 7 000 fatalities per year in the EU-28 (about 85% of cases being related to swimming and drowning).
y Figure 8.2 illustrates that adolescents between 15 and 24 years of age are over-represented particularly in “ice or snow sports” and “individual water sports” (e.g. diving), a fact that should be taken in to consideration when targeting injury prevention among adolescents (see also hotspot “Adolescents”).
y Elderly sportspersons (60+) are over-represented particularly in bicycling and equestrian activities. A main target group for the prevention of drowning while swimming (in natural water and swimming pools), should be people above the age of 60 as they account for 27% of all swimming related fatalities (children 1-14: 7%; adolescents 15-24: 12%).
7 000Estimate of annual
fatalities in the EU-28 during sports and
recreational activities like swimming and off-road bicycling.

23
INJURIES IN THE EUROPEAN UNION
Figure 8.4: EU-28 estimates of hospital treated sports injuries by type of sports and participation (organised / not organised)
0 1.000.000 2.000.000
Team ball sports
Ice or snow sports
Acrobatic sports
Team bat or stick sports
Equestrian activities
Wheeled non-motored…
Combative sports
Individual athletic activities
Wheeled motor sports
Individual water sports
Organised
Not organised
Source: EU IDB. See Annex “List of figures and tables” for more details.
Figure 8.5: EU-28 estimates of hospital treated sport injuries by sports and gender
FemaleMale
0 1000000 2000000
Team ball sports
Ice or snow sports
Acrobatic sports
Wheeled non-motored sports
Team bat or stick sports
Equestrian activities
Combative sports
Individual athletic activities
Wheeled motor sports
Individual water sports
Source: EU IDB. See Annex “List of figures and tables” for more details.
EU Initiatives: Safety in Sports NetworkRegular physical activity is essential for keeping fit and staying in good health. However participating in sports also carries a risk of being injured. Fortunately, there are many possibilities to prevent sports injuries, e. g. through making sports infrastructures safer, using protective equipment and focussing training and coaching practices explicitly on injury prevention. As governing bodies of sports organisations have a major responsibility for identifying and managing the risks sports men and women are exposed to, they play a key role in implementing available research evidence and best practices.
The EU-“Safety in Sports” network aims to share knowledge on the prevention of acute and overexertion sports injuries and to enhance exchange among European experts from science and practice. It is developing and pilot testing programmes for safety management in a wide range of sport activities, such as snow sports and ball sports and supports the wider implementation of good practices by local, national and EU-level sport organisations.
More at: www.safetyinsports.eu
Playing sports in the EU [27]
• 4 out of 10 Europeans aged 15 years and over participate in sport at least once a week.• To improve health is the most common
reason for practicing sport (6 out of 10 sportspersons), followed by improving fitness and relaxing.• Men exercise more than women: 43% of
men interviewed claim they participate in sport at least once a week, while the proportion of women is 37%. • �The main reasons for not participating
in any sport are lack of time (45%), disability or illness (13%) and a general dislike of competitive activities (7%).• �While 61% of the 15-24 old age group
participate in sport at least once a week, the proportion decreases to 33% for the 55-69 category.
Non-fatal injuries
y Annually, about 6.2 million people are being treated in hospital for a sports injury as defined by the EU IDB catalogue of sports [42]. Of those about 7% (or 402 000 cases) have to be admitted for further treatment.
y 33% of sports injuries affect adolescents and young adults (15-24 years of age): see also box for figures about “playing sports” for this age group.
y ”Team ball sports” account for about 42% of all (specified) hospital treated sports injuries (Figure 8.4); by specific type of ball sports the ranking is: Soccer (71%), Handball (9%), Basketball (6%), Volleyball (6%).
y One half of sports injuries result from participation in organised sports, while the other half occur during individual (not organised) sporting (Figure 8.4).
y For most types of sports more men are injured than women (Figure 8.5); notable exceptions are acrobatic sports (56% women) and horse riding (91% women). This of course reflects gender preferences as to in the type of sports to engage.
y The specific injury patterns for each type of sport are important to know in order to adequately address for instance the issue of wearing personal protection equipment in sports, e.g. helmets. As an example, Figure 8.3 ranks the main type of sports by their share of head injuries.
Team bat or stick sports 22%
Individual water sports 19%
Target/precision sports 16%
Equestrian activities 13%
Wheeled non-motored sports 12%
Combative sports 12%
Racquet sports 10%
Power sports 10%
Ice and snow sports 10%
Team ball sports 7%
Source: EU IDB. See Annex “List of figures and tables” for more details.
Table 8.3: 10 popular sports with the highest share of head injuries by type of sports
Trends
y Injuries in organised sport (e.g. team sports) are decreasing and injuries in individual sport activities are increasing, while the total number of sport related injuries did hardly change over the past years.
y The share of women injured in sports injuries did steadily increase in the previous years (e.g. 26% in 1996 to 36% in 2010), but in current years no further increase took place (now 35%).

24
HOTSPOT INTERPERSONAL
VIOLENCE
Behind the numbersDublin, Ireland. Nine people were stabbed during a show of a popular electro house band at Phoenix Park. A 23-year old man was arrested. According to a news agency he is only one of a number of suspects that the police are searching for in the stabbing spree, which was part of what officials are calling a „significant number“ of unprovoked attacks at the show. Investigators believe the suspect in custody stabbed as many as four people and that the other victims‘ injuries were a result of fights with knives and broken bottles.
A spokesman for the event said that closed-circuit TV footage had been handed over to police, adding that ticket holders were subject to searches before entering the site. „Every precaution, as far as possible, was taken to ensure the safety and security of the audience at all times“. An Irish newspaper reported that three men remained in hospital, with two in serious but stable condition. The sister of one of the men said that her brother had been stabbed four times in the back by the still unknown assailant and later suffered a collapsed lung.
Figure 9.1: Fatalities through interpersonal violence by means of assault
Figure 9.3: Fatalities through interpersonal violence by means of assault and age group
Figure 9.2: Fatalities through interpersonal violence by gender and age group
Blunt object 10%
Chemical or noxioussubstance 1%
Sharp object 34% Bodily force 10%
Firearm discharge 19%
Hanging, strangulation,suffocation 8%
Maltreatment, neglect 2%
Other or unknownmeans 16%
0% 20% 40% 60% 80% 100%
Blunt object
Bodily force
Chemical or noxioussubstance
Firearm discharge
Hanging, strangulation,suffocation
Maltreatment, neglect
Sharp object
0 to 14
15 to 24
25 to 59
60+
0,00
0,20
0,40
0,60
0,80
1,00
1,20
1,40
1,60
1,80
<1
1 to
4
5 to
9
10 to
14
15 to
19
20 to
24
25 to
29
30 to
34
35 to
39
40 to
44
45 to
49
50 to
54
55 to
59
60 to
64
65 to
69
70 to
74
75 to
79
80 to
84
85+
Dea
th ra
te p
er 1
00,0
00 in
habi
tant
s
FemaleMale
Source: WHO MDB. See Annex “List of figures and tables” for more details.
Source: WHO MDB. See Annex “List of figures and tables” for more details.
Source: WHO MDB. See Annex “List of figures and tables” for more details.
Facts & impacts Interpersonal violence is an issue of growing public concern and includes domestic violence, child abuse, elder abuse and youth violence. Interpersonal violence takes many forms (physical, mental and sexual) and occurs in different environments (in the family, between intimate partners, in the community, in institutions and at work). It undermines the social and economic conditions in society. Addressing violence requires collaboration across all sectors, including health, education, labour, justice, and human rights. One role the public health sector can play is in making data available about violence-related injuries from routine data systems.
Fatal injuries
y About 2% of all fatal injuries in the EU-28, or about 4 600 cases annually, that are recorded in the national cause of death registers are related to homicide (Table 2.2).
y The homicide rate in the EU is highest in the Baltic region (between 5.2 and 6.7 per 100 000 in the three countries); among the other EU member states the rate ranges from to 2.2 in Romania to 0.3 in the United Kingdom.
y The average rate of homicide is 1.3 per 100 000 for males and 0.7 for females (the average for both sexes is 1.0).
y The most common means in homicides are sharp objects as knives (Figure 9.1). y The peak in homicide rate for babies (under one year of age) of both sexes highlights the grave and
pervasive problem of severe child maltreatment (Figure 9.2). y The highest proportion of adolescent homicide victims (15 to 24 years) can be found in the categories
that involve “sharp objects” (14%) and “firearm” (13%) (Figure 9.3). y To enhance mortality data coverage, it would be useful to link homicide data with other complementary
data (police, media, etc.), and to improve homi¬cide coding practice [43].
70fatalities of children
younger than one year in the EU due to
neglect and other forms of violence. The age-group 0-1 year bears
the highest death rate due to interpersonal
violence.

25
INJURIES IN THE EUROPEAN UNION
Non-fatal injuries
Data from hospital emergency departments provide valuable insight into the current problems of interpersonal violence owing to the specific “IDB violence module” [42]:
y The average proportion of intentional injuries due to interpersonal violence in the EU IDB sample is about 3% (IDB categories “assault” or “other violence”; Table 2.2); and it ranges from 1% (Austria) to 10% (Latvia) among the eight IDB countries that use the “IDB violence module”.
y Altercation (“violent dispute”) is the most frequently specified context of assault (Figure 9.4). Within this category, as well as in all other categories, adolescent victims between 15 and 24 years are with a share of 24% clearly over-represented compared to their share of 12% of the population (Figure 9.5).
y Except for sexual assault (in which category 98% of victims are women), the vast majority of interpersonal violence victims are male (Figure 9.6).
y Also the perpetrators of “violent disputes” are predominately male (92 %). 24% of the perpetrators are adolescents (15-24 years) and 68% are adults.
EU Initiatives: Violence Prevention AllianceThe Violence Prevention Alliance (VPA) is a global network of WHO Member States and civil society organizations working to prevent violence. VPA members share an evidence-based public health approach that targets the risk factors leading to violence and promotes multi-sectoral cooperation. The Alliance aims to unify the efforts of the main actors in international violence prevention and identify a set of priorities for the field with a view to prioritize violence prevention within the global public health agenda; to build strong foundations for on-going violence prevention efforts; and to promote the implementation of evidence-informed violence prevention strategies on parenting, life-skills, social norms, alcohol, the risks of firearm-related deaths and injuries and services for victims. As part of their contribution to the Alliance, the UK-Centre for Public Health at Liverpool John Moores University has developed a web based resource. The purpose of this website is to provide a violence prevention resource for policy makers, practitioners and others working to tackle and prevent violence. The website includes abstracts of systematically reviewed literature providing evidence of measures that can work to prevent violence, including key publications and resources on violence prevention.
More at: www.preventviolence.info
Figure 9.4: Hospital treated cases of interpersonal violence by context of assault
Altercation 82%
Illegal acquisition or attemptedillegal acquisition of money orproperty 8%
Drug-related incident 1%Sexual assault 2%
Gang-related incident 5% Other crime 2%
Figure 9.6: Hospital treated cases of interpersonal violence by context of assault and gender of victim
0%
10%
20%
30%
40%
50%
60%
70%
80%
90%
100%
Altercation Illegal acquisition or attempted
illegal acquisition of money or property
Drug-related incident
Sexual assault
Gang-related incident
Other crime
FemaleMale
Source: EU IDB. See Annex “List of figures and tables” for more details.
Source: EU IDB. See Annex “List of figures and tables” for more details.
Figure 9.5: Hospital treated cases of interpersonal violence by context of assault and age
Underreporting of violence
There is abundant evidence of the substantial extent to which injuries due to violence are neither investigated nor reported by the police [44]. The UK government, for in¬stance, has therefore decided to tackle com¬munity violence increasingly on injury data derived from emergency departments and not just on informa¬tion about offences only. The results of the IDB “violence module” reveal that information about some aspects of interpersonal violence such as “violent dispute” can be quite well obtained in the emergency room setting. On the other hand, details about the “context of assault” and “age and sex of perpetrator”, for instance, were obtained only in about 22% of cases of interpersonal violence collected through IDB. This situation could certainly be improved through a better training of staff in extracting this information from patients, as well as increased awareness among the public of the violence issue and willingness to provide contextual information.
Source: EU IDB. See Annex “List of figures and tables” for more details.
Alte
rcat
ion
Illeg
al a
cqui
sitio
nor
att
empt
ed il
lega
lac
quis
ition
of m
oney
or p
rope
rty
Dru
g-re
late
din
cide
nt
Sexu
al a
ssau
lt
Gan
g-re
late
din
cide
nt
Oth
er c
rimin
alac
tivity
0%
10%
20%
30%
40%
50%
60%
70%
80%
90%
100%
60+
25 to 59
15 to 24
0 to 14
Trends
y While the injuries due to violence across the board have declined, injuries as a consequence of abuse have increased significantly from 4% in the previous reporting period to 14% in the current one (figure 10.4). This reflects probably a substantial change in the readiness of victims and hospital staff to report abuse.

26
HOTSPOTSUICIDE AND SELF-HARM
Behind the numbersJanuary 2013, Dunaújváros, Hungary. The second tallest building in Dunaújváros, the 10 floor high city hall was chosen by a 53 years old teacher for committing suicide. An eye-witness saw the woman preparing to jump and immediately called the emergency number. Only a few minutes later the police appeared on the scene but were not able to prevent the tragedy.
“She did not want to talk to anybody and appeared very determined. When I came up, she sat back on the windowsill with her back toward the open window”, said the police witness, “Before we reached her, she let herself fall. The elementary school teacher was described as in love with life, highly competent and well-liked by children and parents”. “Although she experienced some disappointments and expressed herself sometimes bitterly, there was no sign that something was substantially wrong in her life”, said a colleague.
Figure 10.1: Suicides by means of self-harm Figure 10.2: Suicide rate (per 100 000 inhabitants) by age group and gender
Source: WHO MDB. See Annex “List of figures and tables” for more details.
Figure 10.3: Suicides by means of self-harm and gender
Male
Female
0% 20% 40% 60% 80% 100%
Drowning and submersion
Firearm discharge
Hanging, strangulationand suffocation
Intentional self-poisoning
Jumping from a high place
Jumping or lyingbefore moving object
Sharp object
Source: WHO MDB. See Annex “List of figures and tables” for more details.
Source: WHO MDB. See Annex “List of figures and tables” for more details.
Facts & impacts
Suicide and self-harm are important causes of premature death and hospitalisation. Suicidal behaviour is often the consequence of a number of factors that have interacted, including acute stressors and negative life events (e.g. bereavement, job loss, divorce, illness), symptoms associated with an acute episode of mental illness or substance use disorder (e.g., psychosis, depression, intoxication), personality characteristics, social and/or economic circumstances. While not itself a mental disorder, suicidal behaviour is highly correlated to mental illness and addiction. Studies indicate that more than 90% of suicide victims have a diagnosable mental illness or substance use disorder [45].
Fatal injuries
y Suicide in the EU is among the three leading causes of death in the age group 15-44 for both men and women.
y 25% of all fatal injuries, or about 60 000 cases annually, recorded in the national cause of death registers in the EU-28 are related to suicides (Table 2.2).
y The majority of suicides are committed by strangulation, hanging or suffocation (58%) followed by self-poisoning (13%; Table 10.1)
y The average rate of suicides is 18 per 100 000 for males and 5 for females (the average for both sexes combined is 12 per 100 000; Figure 10.2)
y For both sexes the rate of suicides is increasing with the age. There is a first peak in the age of 50-54, and a second one in the old age of 85+ (Figure 10.2).
y In general, the suicide rate is higher in most of the EU new member states, while southern EU countries together with the United Kingdom have the lowest suicide rates. The current suicide rate is highest in Lithuania (33), Hungary (25) and Latvia (22). The lowest suicide rates were registered in Greece (3), Cyprus (4), Italy and Malta (6).
y Marked sex differences exist in the choice of the methods of suicide (Figure 10.3).
Drowning and submersion3%
Firearm discharge8%
Hanging, strangulation and suffocation
58%
Intentional self - poisoning13%
Jumping from a high place8%
Jumping or lying before moving object
4%
Sharp object2%
Other and unknown means4%
0,00
10,00
20,00
30,00
40,00
50,00
60,00
<1
1 to
4
5 to
9
10 to
14
15 to
19
20 to
24
25 to
29
30 to
34
35 to
39
40 to
44
45 to
49
50 to
54
55 to
59
60 to
64
65 to
69
70 to
74
75 to
79
80 to
84
85+
Dea
ths
per 1
00,0
00 in
habi
tant
sMaleFemale
60 000Number of suicides
commited in the EU-28 every year.

27
INJURIES IN THE EUROPEAN UNION
Trends
y Until 2007 the suicide rate in the EU had been steadily declining. Since 2008, most probably due to the economic crises, the rate has increased again. For instance, the figures from the Irish Central Statistics Office confirm that suicides among men in Ireland rose sharply as the economy went into severe recession in 2008
EU Initiatives: Suicide prevention, a joint actionOSPI-Europe - Optimised Suicide Prevention Programmes and their Implementation in Europe - aims to review and evaluate current strategies for suicide prevention in order to develop and implement multifaceted suicide prevention intervention programmes across Europe.
OSPI-Europe is a collaborative research project. The groundwork for OSPI-Europe has been laid through implementation of a multifaceted intervention programme for suicide prevention in Nuremberg, Germany: the Nuremberg Alliance Against Depression. The Nuremberg intervention resulted in a significant reduction of the number of suicidal acts. The OSPI-action delivers an evidence based prevention concept and best practice-tools for a wider application of the available evidence by professionals across the EU.
More at: www.ospi-europe.com
Non-fatal injuries
Data from hospital emergency departments provide additional insights in to the problem of self-injury and suicide attempt, for instance, by identifying the basic epidemiological patterns. Here are some results of the EU IDB “intentional self-harm module” [42]:
y The share of intentional self-harm cases of all EU IDB cases is 1% (Table 2.2). This proportion translates in to an EU estimate of 402.000 people that have to be treated in hospital for intentional self-harm (0.8 hospital-treated injury per 1 000 inhabitants). A relatively high proportion of these cases (53% or 212 000 cases) have to be admitted for further treatment as in-patients.
y 61% of self-harm victims are female; the female share among adolescents is even higher than 69% (Figure 10.5).
y According to the EU IDB, especially adolescents between 15 and 24 years of age (31%) are over-represented in the recorded cases as compared to their share of the population of only 12%.
y Poisoning accounts for the vast majority of injuries diagnosed as intentional self-harm (71% in men as well as women), apparently reflecting a lower lethality of self-poisoning compared to other means.
y The use of “piercing/penetrating force”, resulting in open wounds, ranks second. The latter type of injuries (open wounds) are more likely to be cases of “self-harm” rather than suicidal acts, a distinction which is not yet clearly defined within the EU IDB “intentional self-harm module”.
y “Psychological/psychiatric condition” and “conflict in relationships” are stated as being potentially linked to the act of self-harm (so called “proximal risk-factor”; Figure 10.4).
y 59 in 100 patients were reported to have experienced a previous episode of intentional self-harm.
The IDB intentional self-harm module
The results of the IDB “intentional self-harm module” [42] indicate the potential of this surveillance tool for obtaining broader evidence about the problem of self-injury and suicide attempt. Still, specific information about the “proximal risk-factor” and also “previous intentional self-harm”, for instance, could be obtained only in a limited number of hospitals representing about 9% of cases of intentional self-harm reported through IDB.The confidentiality of information on patient history as well as the inappropriateness of the ED-setting to establish social and psychological diagnoses in the early stages of the emergency are important barriers to enrich the data collection. Sensitization and training of the persons working in EDs and increased collaboration with mental health and social care staff might help to enhance the informative value of data collected.
Figure 10.4: Non-fatal injuries through self-harm by proximal risk-factor
Death of a relative, partner, or friend 2%
Physical problem 2%Psychological/psychiatriccondition 49%
Legal system encounter 2%Abuse 14%
Income related/financial problem 1%
Conflict in relationship with family member, partner or friend 24%
Other specified proximal risk factor5%
Figure 10.6: Self-harm injuries by mechanism of injury and gender
Male
Female
0,00%20,00%
40,00%60,00%
80,00%
Exposure to chemical or othersubstance
Piercing/penetrating force
Blunt force
Threat to breathing
Thermal mechanism
Source: EU IDB. See Annex “List of figures and tables” for more details.
Figure 10.5: Intentional self-harm by gender and age group
Male
Female
0%
5%
10%
15%
20%
25%
30%
35%
40%
0 to 14 15 to 24 25 to 59 60+
28
CONCLUSIONS AND THE WAY AHEAD
Accidents and injuries place a huge burden on societies and individuals in the Community. In addition to the immense human costs in terms of premature death and years of life lived with disability, a substantial proportion of annual health care costs are related to injuries and European growth and prosperity are being threatened as a result of lost productivity.
Challenges
A number of European and national initiatives have been taken in the past to reduce the frequency of injuries due to accidents and violence. We have been particularly successful in reducing road fatalities, workplace accidents, chemical accidents and some categories of consumer product-related injuries, as for instance is the case for electrical appliances and for toxic household products. Also pre-hospital and hospital trauma care have improved significantly over the past decades and resulted in a sharp decline in death due to injury trauma.
However, the development of non-fatal injuries and long-term disabilities due to injuries has been much less favourable. There is still scope for more effective action to reduce the huge social toll of accidents and injuries, in particular by addressing risk settings that have until now received less attention, such as those occurring at home or in leisure time and those affecting high risk groups such as adolescents and older people.
The current report identifies a few trends in home and leisure accident statistics since the report in 2009. y In particular injury-related deaths in children decreased significantly over the past few years. This certainly is the result of enhanced
child safety programmes and campaigns carried out in all EU-countries, focussing in particular on the most serious and life threatening accidents in childhood. Hopefully these efforts will, in due course, also lead to decreasing injury morbidity in children.
y However, the number of injuries in adolescents and the number of sport injuries seems to have risen over the past five years. This is certainly due to the increased popularity of sports and other leisure outdoor activities, which in itself is an encouraging development. It is evident that the health gains of sports and physical activities can be optimised by proper safety promotion measures.
y The share of the older population in fatal accidents and non-fatal injuries also increased over the past five years. This reflects of course the process of our population growing older, in particular the share of those 75 years and above.
The significant differences in accident and injury rates between member states and within their populations also indicate that there is still great potential for reducing the burden of injuries in countries and in the Community as a whole. Therefore, we need better data for countries to assess the actual health and economic burden and, in that way, to assist them in developing proper prevention policies. These data should be collected in a harmonised manner in order to allow comparability between countries, identify trends and assess the impact of various policies and actions.
A particular challenge is that the political responsibility for injury prevention is vested in diverse policy domains. Thus, while injury is an important determinant of ill health, there are other policy domains, such as consumer protection, sports, education, welfare, transport, employment, justice and research that carry most of the responsibilities for preventive action. Nevertheless, the health sector has responsibility for health information and for health protection, giving it an important role to play in injury prevention, complementary to other policy sectors [46].
Injury data: a health sector priority
The health sector plays a key role in injury prevention as: y the health sector’s mandate includes preventing and responding to all major health threats and causes of mortality and morbidity
including injury; and as y a substantial proportion of direct cost related to injury is absorbed by the health sector
The health sector is uniquely positioned to collect data, analyse risk factors and to generate multi-sector prevention efforts across a range of sectors.
It is obvious that emergency departments at hospitals provide the best setting for collecting information as this information relates to severe cases, while less severe cases are treated by family doctors or school nurses for instance. Information can also be obtained easily in hospitals on a large number of cases and at low cost. Household surveys, for instance, are more expensive and suffer serious deficiencies and significant underreporting due to memory decay and non-response. Technological developments in medical administration and data linkage, also offer new opportunities for recording information that is relevant for injury prevention.
When looking into the costs of injury data collection, one has to come to the conclusion that the additional costs are only marginally compared to the overall direct medical costs as a result of these injuries [46]. When a comprehensive set of information about causes and circumstances is being collected from a representative sample of injury patients treated in Emergency Departments (EDs), the total direct medical cost of treating injuries will increase by only a marginal 0.2-0.3 pro mille per annum. While at the same time the mere availability of these data will spark off significant injury reduction initiatives and the benefits from such actions will exceed multiple times the additional marginal cost of data collection!

29
INJURIES IN THE EUROPEAN UNION
The way ahead
The JAMIE-methodology [3] allows countries to collect accident and injury data from a representative sample of emergency departments and to use a standardized classification for coding the circumstances of the injury-event and its outcome. It complements existing data sources such as the routine causes of death statistics, hospital discharge registers and data sources specific to injury areas, including road accidents and work related accidents.
The two-level system introduced by the JAMIE-project involves the implementation of emergency department datasets at different levels of sophistication:
y the Full injury surveillance Data Set (FDS), previously implemented as the IDB data set; and y the new Minimum Data Set (MDS).
The combination of much larger amounts of cases at a lower level of detail as to the injury circumstances with data at high levels of detail from a relatively small number of hospitals provides information for a wide range of policy makers and health, transportation and consumer protection authorities.
The MDS is designed to be implemented in many different ways, by using check boxes in existing or newly designed patient records. The simple MDS for Europe supports the development of high level EU and member state injury indicators, being feasible to implement in member states with wide variation in existing practice. The proposed Full Data Set (FDS) reflects the responsibility of a wide variety of agencies and bodies involved in prevention, maximizing the potential to support prevention and research.
It is envisaged that by the end of the Joint Action JAMIE by mid-2014, in at least 22 countries IDB data will be collected in a sustainable manner. Four more countries are expected to have implementation plans in place endorsed by the competent authorities.
However, this requires a strong political commitment from EU-institutions and member states governments and preferably a binding arrangement for all countries to provide ED-based injury data, in order to ensure a continued EU-level exchange of vital injury data from mid-2014 onwards.
In recent Council conclusions [47] the Commission and Member States are invited to cooperate with a view to establishing a sustainable and integrated EU health information system, built on what has been already achieved through different groups and projects, which includes the platform for injury surveillance and ECHI indicator 29b. This offers hopefully opportunities for sustained data collection in countries and their co-ordination at EU-level in line with the methodology and principles developed under the JAMIE-project.
30
REFERENCES
1. European statistics on hospital discharges: Eurostat, statistics database, population and social conditions, health, public health, health care activities, hospital discharges by diagnoses. http://epp.eurostat.ec.europa.eu/portal/page/portal/statistics/search_database. See also: European Community Health Indicators (ECHI): Hospital inpatient discharges (ECHI No. 67). http://ec.europa.eu/health/indicators/echi/list/index_en.htm.
2. European Injury Data Base (IDB): DG Health and Consumers, “Health in Europe - Information and Data Interface” (HEIDI): http://ec.europa.eu health/data_collection/databases/idb/. See also European Community Health Indicators (ECHI): Injuries at home, school, and during leisure activities (ECHI No. 29). http://ec.europa.eu/health/indicators/echi/list/index_en.htm.
3. Eurosafe (2013). IDB-JAMIE Manual. Version October 2013. Amsterdam: European Association for Injury Prevention and Safety Promotion). http:/ www.eurosafe.eu.com/csi/eurosafe2006.nsf/wwwAssets/D5FC1077E7DC33FCC1257C120038002B/$file/IDB-JAMIE%20Manual%20OCT%202013 pdf
4. European statistics of accidents at work: Eurostat, statistics database, population and social conditions, health, health and safety at work, accidents at work (rates per 100 000 employees). http://epp.eurostat.ec.europa.eu/portal/page/portal/statistics/search_database. See also: European Community Health Indicators (ECHI): Injuries at workplace (ECHI No. 31). http://ec.europa.eu/health/indicators/echi/list/echi_31 html#main?KeepThis=true&TB_iframe=true&height=650&width=920.
5. European statistics on road accidents: DG Mobility and Transport, Road Safety Observatory, EU road fatalities. http://ec.europa.eu/transport/road safety/specialist/statistics/index_en.htm. See also European Community Health Indicators (ECHI): Injuries at workplace (ECHI No. 30). http:/ ec.europa.eu/health/indicators/echi/list/euhi_30b.html#main?KeepThis=true&TB_iframe=true&a30amp;height=650&width=920.
6. Consolidated version of the Treaty on the functioning of the European Union, OJ C326/47, 26.10.2012. http://eur-lex.europa.eu/resource html?uri=cellar:ccccda77-8ac2-4a25-8e66-a5827ecd3459.0010.02/DOC_1&format=PDF.
7. Council Recommendation on the prevention of injury and the promotion of safety. OJ C 164/1, 18.7.2007. http://eur-lex.europa.eu/LexUriServ LexUriServ.do?uri=OJ:C:2007:164:0001:0002:EN:PDF.
8. Regulation on Community statistics on public health and health and safety at work, OJ L 354/70, 31.12.2008. http://eur-lex.europa.eu/LexUriServ LexUriServ.do?uri=OJ:L:2008:354:0070:0081:EN:PDF.
9. ECHI indicator 29(a) “Injuries: home, leisure, school – self reported incidence. http://www.healthindicators.eu/healthindicators/object_document o6010n29136.html.
10. ECHI indicator 29(b) “Injuries: home, leisure, school – register based incidence. http://www.healthindicators.eu/healthindicators/object_document o6088n29136.html.
11. Regulation on setting out the requirements for accreditation and market surveillance, OJ L 218/30, 13.8.2008, http://eur-lex.europa.eu/LexUriServ LexUriServ.do?uri=OJ:L:2008:218:0030:0047:en:PDF.
12. Kisser R, Latarjet J, Bauer R, Rogmans W (2009). Injury data needs and opportunities in Europe. International Journal of Injury Control and Safety Promotion, 16, 103-112.
13. European statistics on health care expenditure: Eurostat, statistics database, population and social conditions, health, public health, health care expenditure by function (services of curative care). http://epp.eurostat.ec.europa.eu/portal/page/portal/statistics/search_database.
14. Polinder S, Meerding JW, Toet H, van Baar M, Mulder S, van Beek E. A surveillance based assessment of medical costs of injury in Europe (phase 2), Erasmus University & Consumer Safety Institute, Amsterdam, 2004. http://www.eurosafe.eu.com/csi/eurosafe2006.nsf/wwwAssets/AF93BF4556 FD7ECC125768600519B8B/$file/A%20surveillance%20based%20assessment%20of%20medical%20costs%20of%20injury%20Phase%202.pdf.
15. Veiligheid NL: Letsels - Kerncijfers 2011 (Injuries: Key figures 2011, in Dutch). Amsterdam: Veiligheid NL (Consumer Safety Institute), 2012, Factsheet No. 28. (http://www.veiligheid.nl/csi/veiligheidnl.nsf/content/37FDA3DFB5357093C1257AD10046D84C/$file/Factsheet%20kerncijfers%2 2011%20incl%20cover%20voor%20site.pdf.
16. Macey S, Jones SL, Pinder L, Humphreys C, Price T, Evans L, Hughes R, Lyons RA. Wales Burden of Injury Study. Injury Prevention, 2012,18, Supplement 1, A40.
17. Haagsma J, Belt E, Polinder S, Lund J, Atkinson M, Macey S, Lyons RA, van Beeck EF. Integris WP5 injury disability indicators: towards a standardised methodology for measuring the burden of disability due to injury. Injury Prevention, 2010, 16, A139.
18. Belt E, Polinder S, Haagsma JA, van Beek EF, Lyons RA, Macey S, Atkinson M, Lund J. WP5 Injury disability indicators. Research report of the project “Integration of European Injury Statistics (INTEGRIS)”. http://www.eurosafe.eu.com/csi/eurosafe2006.nsf/wwwAssets/7A0E220588591323C12578 7003DBDA9/$file/INTEGRIS%20indicators%20for%20disabilities_upload%20Febr2013.pdf.
19. European health interview survey (EHIS 2008): Eurostat, statistics, database, population and social conditions, health, health status, injuries from accidents, people reporting having had an accident. http://ec.europa.eu/health/indicators/echi/list/index_en.htm#id2. See also: European Community Health Indicators (ECHI): Injuries at workplace (ECHI No. 29a). http://ec.europa.eu/health/indicators/echi/list/echi_29a html#main?KeepThis=true&TB_iframe=true&height=650&width=920.
20. Mock Ch, Acheampong F, Adjei S, Koepsell T: The effect of recall on estimation of incidence rates for injury in Ghana. Int. Journal of Epidemiology 1999, 28, 750-755.
21. Münchener Rückversicherungs-Gesellschaft (Munich Re): Assessing disability – an international comparison of workers’ compensation systems. Munich: Munich Re, 2004. www.munichre.com/publications/302-04093_en.pdf.
22. Austrian Road Safety Board (KFV): Injuries to vulnerable road users, including falls in pedestrians in the EU - a data report. Research report of the project “Strategies and best practices for the reduction of injuries” (APOLLO). Vienna: KFV, 2009. http://www.eurosafe.eu.com/csi/eurosafe2006 nsf/wwwAssets/BFFD10F801EACC59C125787000608BA1/$file/Apollo_InjuryDataReport.pdf.

31
INJURIES IN THE EUROPEAN UNION
23. European statistics on hospital discharges: Eurostat, statistics database, population and social conditions, public health, health, health care, health care activities, hospital discharges. http://epp.eurostat.ec.europa.eu/portal/page/portal/statistics/search_database.
24. MacKay M, Vincenten J, Brussoni M, Towner L. Child Safety Good Practice Guide: Good investments in unintentional child injury prevention and safety promotion. Amsterdam: European Child Safety Alliance, Eurosafe, 2006. http://www.childsafetyeurope.org/publications/goodpracticeguide info/good-practice-guide.pdf.
25. European population statistics: Eurostat, statistics database, population and social conditions, population, demography, population at 1 January. http:/ epp.eurostat.ec.europa.eu/portal/page/portal/population/data/database.
26. Product Safety Guide: Sengölge M, Vincenten J (2013). Child Safety Product Guide: potentially dangerous products. Birmingham: European Child Safety Alliance. http://www.childsafetyeurope.org/publications/info/product-safety-guide.pdf.
27. Eurobarometer 2009 : Sport and physical activity (Eurobarometer 72.3). Brussels : TNS Opinion & Social on request of DG Education and Culture, 2010. http://www.ehfa.eu.com/sites/ehfa.eu.com/files/research/Eurobarometer%20on%20Sports%20and%20PA.pdf.
28. O’Brien Sh : More seniors face injury and death from falling down. http://seniorliving.about.com/od/healthnutrition/a/fallstudy.htm.
29. European population statistics: Eurostat, statistics database, population and social conditions, population, population projections. http://epp.eurostat ec.europa.eu/portal/page/portal/population/data/database.
30. Gaymu J, Festy P, Poulain M, Beets G (Eds.). Future Elderly Living Conditions in Europe. Paris: Institut national d’études démographiques, 2009.
31. European transport statistics: Eurostat, statistics database, transport, road transport, motorisation rate (cars per 1 000 inhabitants). http://epp.eurostat ec.europa.eu/portal/page/portal/transport/data/database.
32. OECD, Directorate for science, technology and industry: Safety of vulnerable road users. Paris: OECD, 1998. http://www.oecd.org/sti/transport roadtransportresearch/2103492.pdf.
33. European Transport Safety Council (ETSC): Vulnerable road user organisations in cooperation across Europe (VOICE) – a Europe-wide campaign to protect vulnerable road users: Final report. http://www.etsc.eu/Voice.php.
34. Communication from the Commission “Towards a European road safety area: policy orientations on road safety 2011-2020”. COM 389 of 20.7.2010. http://eur-lex.europa.eu/LexUriServ/LexUriServ.do?uri=COM:2010:0389:FIN:EN:PDF.
35. Polinder S, Haagsma JA, Belt E, Lyons RA, Erasmus V, Lund J, van Beek E: A systematic review of studies measuring health-related quality of life of general injury populations. BMC Public Health, 2010, 10, 783. http://www.ncbi.nlm.nih.gov/pmc/articles/PMC3019196/.
36. European Transport Safety Council (ETSC). Set targets for serious injury reduction in Europe. Road Safety PIN Flash No. 15, 2009. http://www.etsc.eu documents/copy_of_copy_of_copy_of_copy_of_copy_of_PIN%20Flash%2015.pdf.
37. Brandstätter C et al. (2012). Annual Statistical Report 2012. European Road Safety Observatory. http://ec.europa.eu/transport/road_safety/pdf statistics/dacota/dacota-3.5-asr-2012.pdf.
38. Directive 2001/95/EC on general product safety, OJ L11/4, 15.1.2002. http://eur-lex.europa.eu/LexUriServ/LexUriServ.do?uri=OJ:L:2002:011:0004:0017 EN:PDF.
39. National Electronic Injury Surveillance System (NEISS) – research and statistics. Bethesda, MD: U.S. Consumer product safety Commission. http://www cpsc.gov/en/Research--Statistics/.
40. Consumer Safety Institute: Improving the product and service dimension in the IDB – a feasibility study. Project report. Amsterdam: Consumer Safety Institute. http://ec.europa.eu/consumers/cons_safe/serv_safe/datacollect/rep_idb2006_en.pdf.
41. Kisser R, Bauer R. The burden of sport injuries in the European Union. Report of the “Safety in Sports”-project. Vienna: Austrian Road Safety Board (KFV), 2012. http://www.safetyinsports.eu/upload/downloads/Report_Burden_of_Sport_Injuries.pdf.
42. The Injury Data Base (IDB) Coding Manual, Version 1.1 – June 2005. http://www.eurosafe.eu.com/csi/eurosafe2006.nsf/wwwAssets/11498398F0475D 5C1257A010052C0BE/$file/B.%20IDB%20Full%20data%20Set-Coding%20manual%20(FDS).pdf.
43. Institut de Veille Sanitaire (INVS). Analysis of injury related mortality in Europe (ANAMORT). Final implementation report of the ANAMORT-project. Paris : INVS, 2008. http://www.invs.sante.fr/publications/2008/anamort/rap_anamort_120808_eng.pdf.
44. Warburton AL, Shepherd JP : Development, utilisation, and importance of accident and emergency department derived assault data in violence management. Emergency Medicine Journal, 2004, 21, 473-477. http://emj.bmj.com/content/21/4/473.full.
45. Brian LM, Chagnon F: Understanding the relationsship between mental illness and suicide and the implication for suicide prevention. In : Rory C, O’Connor, Platt St, Gordon J (Eds.) : International handbook of suicide prevention – reserach, policy and practice. Chichester : John Wiley & Sons, 2011.
46. WHO: Preventing injuries and violence: a guide for ministries of health. Geneva: World Health Organisation, 2007. http://whqlibdoc.who.int publications/2007/9789241595254_eng.pdf.
47. Council of the European Union: Concil conclusions on the “Reflection process on modern, responsive and sustainable health systems”. Brussels: Employment, social policy, health and consumer affairs Council meeting, 10 December 2013. http://www.consilium.europa.eu/uedocs/cms_data/docs pressdata/en/lsa/140004.pdf
Please note: All web-links have been checked in April 2014.

32
ANNEX: LIST OF FIGURES AND TABLES
Please note: y Eurostat COD: Eurostat Cause of Deaths statistics at http://epp.eurostat.ec.europa.eu/portal/page/portal/eurostat/home/. y Eurostat HDS: Eurostat Hospital Discharge Statistics at http://epp.eurostat.ec.europa.eu/portal/page/portal/eurostat/home/. y Eurostat POP: Eurostat Population Statistics at http://epp.eurostat.ec.europa.eu/portal/page/portal/eurostat/home/. (population
on 1 January). y WHO MDB: WHO Mortality Data Base, causes of death at http://www.who.int/healthinfo/statistics/mortality_rawdata/en/. y WHO HFA: WHO European Health for All Data Base at http://data.euro.who.int/hfadb/. y EU IDB: European Injury Data Base at http://ec.europa.eu/health/data_collection/databases/idb/. y Data from COD, HDS, WHO MDB or WHO HFA: As 2012 data was not available at time of analysis, 2009-2011 was used as the 3-years
period when possible. Otherwise, the three most recent years were used. y Codes regarding to COD, HDS, WHO MDB, WHO HFA are referring to ICD-10 (International Classification of Diseases, 10th revision),
chapter XIX “Injury, poisoning and other consequences of external causes” or chapter XX “External causes of morbidity and mortality” or equivalent ICD-9 when ICD-10 is not available.
y Data from IDB 2010-2012: All valid EU IDB records (full data sets FDS) from Austria, Cyprus, Czech Republic, Germany, Denmark, Greece, Italy, Latvia, Malta, Netherlands, Romania, Sweden, Slovenia, Turkey (years 2010, 2011, 2012) as available by 7 March, 2014 were used (909.671 records).
y Codes regarding to IDB are referring to IDB Coding Manual 1.1 (2009) [42].
Figure 2.1: The injury pyramid for the European UnionFatal injuries: WHO MDB, 3 years average of latest available years, EU-28, ICD-10 V01-Y98. Absolute numbers rounded to 1 000.Non-fatal injuries (all hospital patients): EU IDB, 2011-2012. Rounded estimated total number of injury patients treated in emergency departments of hospitals of EU-28: The estimate of 41,081.000 is based on the average incidence rates of injuries from Austria, Cyprus, Germany, Denmark, Italy, Latvia, Malta, Netherlands, Portugal, Sweden, Slovenia, UK for the years 2010-2012 (8.125%) and the average population of EU-28 in the same period (505,613.899). Hospital Admissions: EU IDB, 2011-2012. Rounded estimated number of admissions after ED treatments in EU-28. The estimate is based on the average of the hospitalization rates from Austria, Cyprus, Germany, Denmark, Greece, Iceland, Italy, Latvia, Luxembourg, Malta, Netherlands, Portugal, Romania, Sweden, Slovenia, Turkey, UK (13.1%), applied to the estimated total number of all hospital patients.Hospital Outpatients: EU IDB 2011-2012. Rounded estimated number of ambulatory treatments in EDs in EU-28. The estimate is based on the average of outpatient rates from Austria, Cyprus, Germany, Denmark, Greece, Iceland, Italy, Latvia, Luxembourg, Malta, Netherlands, Portugal, Romania, Sweden, Slovenia, Turkey, UK (86.9%), applied to the estimated total number of all hospital patients.
Table 2.2: Comprehensive view on injuries by injury prevention domainFatal injuries: Total: WHO MDB, 3 years average of latest available years, EU-28, ICD-10 V01-Y98. Road traffic: WHO MDB (V01-V89, V99, Y850); workplace: WHO HFA-DB, deaths due to work-related accidents; assault/homicide: WHO MDB (X85-Y09, X871); suicide/self-harm: WHO MDB (X60-X84, Y870); school: WHO MDB, place of occurrence = 2; sports: WHO MDB (V100-V189, V800, V904-909, V914-919, V924-929, V934-938, V944-949, W020-029, W158-159, W168-169, X368-369, V951, V960-969, V972, W698-699, W708-709, W738-739, W748-749); home & leisure: total of fatal injuries (238 122) minus cases of all other categories, minus cases of undetermined intent (20 330).Non-fatal injuries (hospital admissions, hospital outpatients, all hospital patients): EU IDB as for figure 2.1. Road traffic: transport injury event = yes; workplace: activity when injured = paid work; assault: intent = assault or other violence; self-harm: intent = intentional self-harm; school: activity when injured = education except school sport; sports: activity when injured = sports or exercise during leisure time or school sports; home & leisure: total of estimated average number of ED treatments minus road traffic, workplace, assault, self-harm, school, sports. Estimates rounded to 1 000.
Figure 2.3: Fatal injuries in EU countries: Standardized death rate per 100 000 inhabitants and percentage of injury deathsEurostat COD, 2009-2011, EU-28, ICD-10. All causes of death (A00-Y89) and external causes of injury and poisoning (V01-Y89) per region. Standardized death rates per 100 000 inhabitants, percentages of injury deaths of all fatalities (all causes of death A00-Y87 excluding S00-T89).
Table 2.4: Fatal injuries by causes of death: Lowest and highest percentage of fatal injuries by countryWHO MDB, EU-28, 3 years average of latest available years, ICD-10: External causes of injury and poisoning (V01-Y89): road traffic injuries (V01-V89, V99, Y850), poisoning (X40-X49), falls (W00-W19), fires (X00-X09), drowning (W65-W74), other unintentional injuries (V90-V98, W20-W64, W75-W99, X10-X39, X50-X59, Y40-Y86, Y88, Y89), self-inflicted (X60-X84, Y870), interpersonal violence (X85-Y09, X871), other injuries (other codes of external causes of injury and poisoning). ICD-9: external causes of injury and poisoning (B47-B56) road traffic injuries (B47), poisoning (B48), falls (B50), fires (B51), drowning (B521), self-inflicted (B54), interpersonal violence (B55), other injuries (other codes of external causes of injury and poisoning). Percentages of all injury deaths by country.
Figure 2.5: Fatal injuries by causes of death in the EU-28WHO MDB, EU-28, 3 years average of latest available years.ICD-10. Categories as in Table 2.4. Percentages based on absolute numbers. Figure 2.6: Injury death rate (per 100 000 persons) and relative injury mortality (injury deaths in % of all causes of death) in the EU-28 by age groups and genderEurostat COD, 2009-2011, EU-28, ICD-10. Injury death rates per 100 000 inhabitants (external causes of injury and poisoning, V01-Y89) by age group and sex; shares of injury fatalities (relative injury mortality) of all fatalities (all causes of death A00-Y87 excluding S00-T98).
33
INJURIES IN THE EUROPEAN UNION
Figure 2.7: Fatal injury trends by injury prevention domain (1998–2011, 1998 = 100%) in the EU-28WHO HFA-DB, 1998-2011 (1998=index), EU-28, ICD-10. Suicide: suicide and self-inflicted injury (X60-X84). Homicide: homicide and intentional injury (X85-X99, Y00-Y09). Transport: transport accidents (V01-V99). Work: deaths due to work-related accidents. Home and leisure: standardised death rate for home and leisure accidents is estimated as the remainder to all external causes of injury and poisoning (V00-V99, W00-W99, X00-X99) minus the above defined injury prevention domains (all injuries minus suicides minus homicide minus road fatalities minus fatal work place accidents). Standardised death rates per 100 000 inhabitants.
Figure 2.8: Hospital discharges for injuries per 100 000 inhabitants and percentage of injury related dischargesEurostat HDS, EU-28, 3 years average of latest available years, ICD-10. All hospital discharges (A00-Z99) and hospital discharges due to injuries, poisoning and certain other consequences of external causes (S00-T98) per country. Rates per 100 000 inhabitants and percentages of injury related discharges,
Figure 2.9: Countries participating in the EU injury data exchange IDB (EU and EFTA member states, EU candidate countries) and average crude injury incidence rateEU IDB, 1996-2012. First year, in which IDB data was delivered to the EU IDB; average crude injury incidence rates 2010-2012 as notified by data providers.
Figure 2.10: Hospital treated injuries per 1 000 by age group and gender, EU-28EU IDB, 2010-2012, & Eurostat POP, average population 2010-2012, EU-28. IDB cases per 1 000 inhabitants by age group and gender.
Figure 2.11: Hospital treated injuries per 1 000 by injury prevention domain and age group, EU-28EU IDB, 2010-2012, & Eurostat POP, average population 2010-2012, EU-28. IDB cases by age-group and prevention domain. Road traffic: transport injury event = yes; workplace: activity when injured = paid work; assault: intent = assault or other violence; self-harm: intent = intentional self-harm; school: activity when injured = education except school sport; sports: activity when injured = sports or exercise during leisure time or school sports; home & leisure: total of estimated average number of ED treatments minus road traffic, workplace, assault, self-harm, school, sports. IDB cases per 1 000 inhabitants by age-group.
Figure 3.1: Leading causes of fatal injuries in children up to 14 yearsWHO MDB, EU-28, 3 years of latest available years, ICD-10. Cases with age = 0-14. External causes of injury and poisoning (V01-Y89). Road traffic injuries (V01-V89, V99, Y850--traffic-related subcategories only), poisoning (X40-X49), falls (W00-W19), fires (X00-X09), drowning (W65-W74), self-inflicted (X60-X84, Y870), interpersonal violence (X85-Y09, X871), other causes (other codes of external causes of injury and poisoning). ICD-9: external causes of injury and poisoning (B47-B56) road traffic injuries (B47), poisoning (B48), falls (B50), fires (B51), drowning (B521), self-inflicted (B54), interpersonal violence (B55), other injuries (other codes of external causes of injury and poisoning). Percentages of absolute numbers.
Table 3.2: Rank order of cause of death of children 1 – 14 yearsEurostat COD, EU-28, 2009-2011, ICD-10. Cases with age = 1-14 by ICD-10 main chapters. Percentages based on absolute numbers.
Figure 3.3: Main places of occurrence of non-fatal child injuries by age groupEU IDB, 2010-2012. Cases with age = 0-14, by age group and places of occurrence. Percentages based on absolute numbers.
Table 3.4: Mechanisms of home injuries in children under 5 years of ageEU IDB, 2010-2012. Cases with age = 0-4 by mechanisms of injury. Percentages based on absolute numbers.
Table 3.5: Top 10 “Infant or child products” involved in child injuries (under 5 years of age)EU IDB, 2010-2012. Cases with age = 0-4 and product involved = infant or child product. Percentages based on absolute numbers.
Figure 4.1: Leading causes of fatal injuries in adolescents between 15–24 yearsWHO MDB, EU-28, 3 years of latest available years, ICD-10. Age = 15-24, ICD codes as in figure 3.1. Percentages based on absolute numbers. Table 4.2: Leading causes of deaths in adolescents between 15-24 yearsEurostat COD, EU-28, 2009-2011, ICD-10. All causes of deaths (A00-Y89) by ICD-10 main chapters, age = 15-24. Percentages based on absolute numbers.
Figure 4.3: Injury rates (per 1 000) of adolescents (15-24 years), by injury prevention domain and genderEU IDB and Eurostat POP, EU-28, 2010-2012. Cases with age = 15-24, by domain and gender. For IDB codes for domains see figure 2.11. Rates per 1 000 inhabitants.
Table 4.4: Mode of transport of adolescents (15 -24) involved in road injuries (% of all road injuries in this age group)EU IDB, 2010-2012. Cases with age = 15-24 by mode of transport (transport module). Percentages based on absolute numbers.
Table 4.5: Injury ranking of ball team sports in adolescents (15- 24; % of all ball team sports in this age group)EU IDB, 2010-2012. Cases with age = 15-24 and type of sport (sport module) = 1 (team ball sport), selected four types of sport with the highest numbers of injuries. Percentages based on absolute numbers.
Figure 5.1: Fatal injuries amongst older people (60+) by causes of deathWHO MDB, EU-28, 3 years of latest available years, ICD-10. Age = 60+. ICD codes as in Figure 3.1. Percentage of absolute numbers.
Figure 5.2: Fatal injuries amongst older people (60+) by causes of death and gender WHO MDB, EU-28, 3 years of latest available years, ICD-10. Age = 60+, by gender. ICD codes as in Figure 3.1. Percentages of absolute numbers.

34
Figure 5.3: Places of occurrence of non-fatal injuries among older people (60+)EU IDB, 2010-2012. Age = 60+, by place of occurrence. Percentages based on absolute numbers.
Table 5.4: The share of women (60+) in injuries by activities at home leading to injuriesEU IDB, 2010-2012. Age = 60+ and place of occurrence = home, by gender and activity. Percentages based on absolute numbers.
Figure 6.1: Road fatalities by type of road userWHO MDB, EU-28, 3 years of latest available years, ICD-10. Transport injuries (V01- V89, V99, Y85) by means of transport. Pedestrian (V01-V09), pedal cycle (V10-V19), motor cycle (V20-V29), other road transport (V30-V89, V99, Y85), traffic-related subcategories only. Percentages of absolute numbers.
Figure 6.2: Road fatalities by type of road user and EU countryWHO MDB, EU-28, 3 years of latest available years, ICD-10. Transport injuries (V01- V89, V99, Y85) by means of transport and country. Pedestrian (V01-V09), pedal cycle (V10-V19), motor cycle (V20-V29), other road transport (V30-V89, V99, Y85), traffic-related subcategories only. Percentages of absolute numbers. Only countries with ICD-10 data:.
Figure 6.3: Road fatalities by type of road user and age groupWHO MDB, EU-28, 3 years of latest available years, ICD-10. Transport injuries (V01- V89, V99, Y85) by means of transport and age group. Pedestrian (V01-V09), pedal cycle (V10-V19), motor cycle (V20-V29), other road transport (V30-V89, V99, Y85), traffic-related subcategories only. Percentages of absolute numbers.
Table 6.4: Vulnerable road users and injury severityFor column “all road users” see table 2.2. Column “vulnerable road users”: Fatal injuries: WHO MDB, EU-28, 3 years of latest available years, ICD-10. Pedestrian (V01-V09), pedal cycle (V10-V19), motor cycle (V20-V29), other road transport (V30-V89, V99, Y85). Percentages of absolute numbers. All hospital patients: EU IDB, 2010-2012. Cases with place of occurrence = public road, by mode of transport (transport module). Percentages and accordingly estimated absolute numbers for EU-28.Hospital admissions, hospital outpatients: EU IDB, 2010-2012. Cases as described above, by admission module (yes/no). Percentages and accordingly estimated absolute numbers for EU-28.
Figure 6.5: Non-fatal road injuries by type of road userEU IDB, 2010-2012. Cases with place of occurrence = public road, by mode of transport (transport module). Percentages based on absolute numbers.
Figure 6.6: Non-fatal road injuries by type of road user and body part injured (only admissions)EU IDB, 2010-2012. Cases with place of occurrence = public road, by mode of transport (transport module) and injured body part. Percentages based on absolute numbers.
Figure 7.1: Product and non-product related causes of fatal home injuriesWHO MDB, EU-28, 3 years of latest available years, ICD-10. Cases where fourth digit (place of occurrence) = 0 (home), by selected groups of product related external causes: Suffocation, strangulation (W75, W76), choking, ingestion (W80, W81, W83, W84), electric current (W85-W87), fire, smoke (X00-X09), hot water, fluids (X10-X19), machinery, tools (W21-W29). Percentage of absolute numbers.
Figure 7.2: Product related causes of fatal home injuries by age groupWHO MDB, EU-28, 3 years of latest available years, ICD-10. ICD codes as in Figure 7.1. Percentage of absolute numbers.
Figure 7.3: Product related non-fatal home and leisure injuries by product categoryEU IDB, 2010-2012. Cases without transport module, violence module, self-harm module and without activity = 1 (paid work), by product causing injury, selected groups of products. Percentages based on absolute numbers.
Figure 7.4: Service related home and leisure injuries by place of occurrenceEU IDB, 2010-2012. Cases with selected places of occurrence, which are probably involving services: 2 (residential institution), 3 (medical service area), 5 (sport area), 10 (recreational or cultural area), 11 (commercial area). Percentages based on absolute numbers.
Table 7.5: Percentage of top 10 products causing injuries to children (0-14 years of age)EU IDB, 2010-2012. Cases with age 0-14 and any infant or child product involved (direct, underlying or intermediate), by product. Percentages based on absolute numbers.
Figure 8.1: Fatal sports injuries by type of sports (excluding swimming)WHO MDB, EU-28, 3 years of latest available years, ICD-10. Selected categories for non-traffic bicycling (V100-V189, non-traffic subcategories only), equestrian activities (V800), boating (V904-909, V914-919, V924-929, V934-939, V944-949), ice/snow (W020-029), mountaineering/climbing (W158-159), diving (W168-169), avalanche (X368-369), aero (V951, V960-969, V972). Excluded categories for swimming (W698-699, W708-709, W738-739, W748-749). This leads only to rough approximations of sports fatalities, as the categories do not refer specifically to sports. Percentages based on absolute numbers.
Figure 8.2: Fatal sports injuries by type of sports (excluding swimming) and age groupWHO MDB, EU-28, 3 years of latest available years, ICD 10. Selected sport-related categories as defined for figure 8.1 by age group. Percentages based on absolute numbers.

35
INJURIES IN THE EUROPEAN UNION
Table 8.3: 10 popular sports with the highest shares of head injuries by type of sportsEU IDB, 2010-2012. Cases with sports module and part of body injured = head, by type of sport (sport module). Percentages based on absolute numbers.
Figure 8.4: EU-28 estimates of hospital treated sports injuries by type of sports and participation (organised / not organised)EU IDB, 2010-2012. Cases with sports module by type of sport and activity = 3.1 and 4.1 (organised sport) vs. 4.8 (other sports). Percentages based on absolute numbers.
Figure 8.5: EU-28 estimates of hospital treated sport injuries by sports and genderEU IDB, 2010-2012. Cases with sports module by type of sports and gender. Percentages based on absolute numbers.
Figure 9.1: Fatalities through interpersonal violence by means of assaultWHO MDB, EU-28, 3 years of latest available years, ICD-10. Assaults (X85-99, Y00-Y09, Y871). Sharp object (X99), Firearm discharge (X93-X95), Bodily Force (Y04, Y05), Blunt object (Y00), Hanging, strangulation, suffocation (X91), maltreatment, neglect (Y06, Y07), Chemical or noxious substance (X85-X90), Other (any other assault codes). Percentages based on absolute numbers.
Figure 9.2: Fatalities through interpersonal violence by gender and age groupWHO MDB, EU-28, 3 years of latest available years, ICD-10. Assaults (X85-99, Y00-Y09, Y871) by gender and age group. Rates per 100 000 inhabitants.
Figure 9.3: Fatalities through interpersonal violence by means of assault and age groupWHO MDB, EU-28, 3 years of latest available years, ICD-10. ICD codes as in Figure 9.1. Percentages of absolute numbers.
Figure 9.4: Hospital treated cases of interpersonal violence by context of assaultEU IDB, 2010-2012. Cases with violence module by context of assault. Percentages based on absolute numbers.
Figure 9.5: Hospital treated cases of interpersonal violence by context of assault and ageEU IDB, 2010-2012. Cases with violence module by context and age group. Percentages based on absolute numbers.
Figure 9.6: Hospital treated cases of interpersonal violence by context of assault and gender of victimEU IDB, 2010-2012. Cases with violence module by context and gender of victim. Percentages based on absolute numbers.
Figure 10.1: Suicides by means of self-harmWHO MDB, EU-28, 3 years of latest available years, ICD-10. Intentional self-harm (X60-X84, Y870). Sharp object (X78), Firearm discharge (X72-X74), Intentional self-poisoning (X60-X69), Hanging strangulation and suffocation (X70), Jumping or lying before moving object (X81), Drowning (X71), Jumping from a high place (X80), other (any other intentional self-harm code). Percentage of absolute numbers.
Figure 10.2: Suicide rate (per 100 000 inhabitants) by age group and genderWHO MDB, EU-28, 3 years of latest available years, ICD-10. Intentional self-harm (X60-X84, Y870) by age group and gender. Percentages based on absolute numbers.
Figure 10.3: Suicides by means of self-harm and genderWHO MDB, EU-28, 3 years of latest available years, ICD-10. ICD codes as in Figure 10.1. Percentages based on absolute numbers.
Figure 10.4: Non-fatal injuries through self-harm by proximal risk-factorEU IDB, 2010-2012. Cases with self-harm module by proximal risk factor. Percentages based on absolute numbers.
Figure 10.5: Intentional self-harm by gender and age groupEU IDB, 2010-2012. Cases with self-harm module by gender and age group. Percentages based on absolute numbers.
Figure 10.6: Self-harm injuries by mechanism of injury and genderEU IDB, 2010-2012. Cases with self-harm module by mechanism of injury and gender. Percentages based on absolute numbers.

36
http://ec.europa.eu/health/data_collection/databases/idb/


This report is the fifth edition of a series of annual summaries of key figures on injuries in the European Union, combining available data on mortality and morbidity. It provides a comprehensive view about this important public health problem, in particular for health policy makers, researchers in the area of public health and safety, and safety practitioners.
This publication has been produced with financial support from the European Commission, Executive Agency for Health and Consumers.