Embed Size (px)
DESCRIPTION
Real Estate Market trends and statistics for Riverside and San Bernardino Counties. Every city, every piece of information you need to be an informed buyer or seller.
Citation preview

OCTOBER 2015
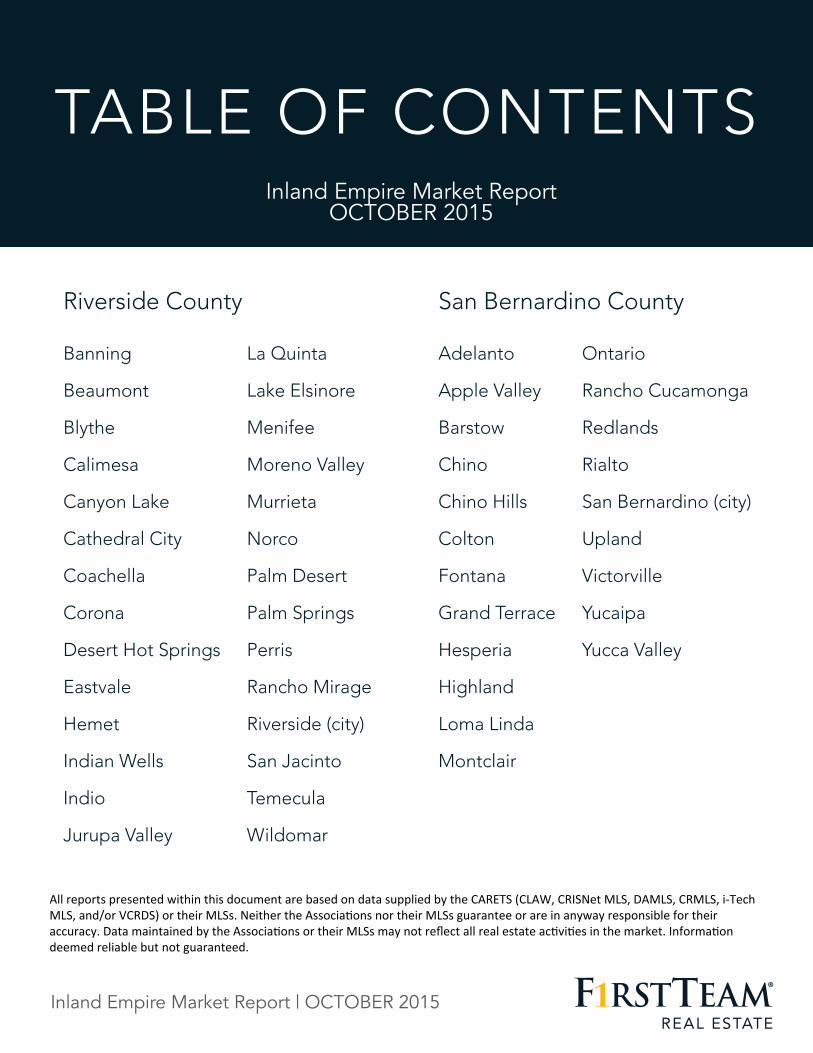
Inland Empire Market Report OCTOBER 2015
Riverside County San Bernardino County
Banning La Quinta Adelanto Ontario
Beaumont Lake Elsinore Apple Valley Rancho Cucamonga
Blythe Menifee Barstow Redlands
Calimesa Moreno Valley Chino Rialto
Canyon Lake Murrieta Chino Hills San Bernardino (city)
Cathedral City Norco Colton Upland
Coachella Palm Desert Fontana Victorville
Corona Palm Springs Grand Terrace Yucaipa
Desert Hot Springs Perris Hesperia Yucca Valley
Eastvale Rancho Mirage Highland
Hemet Riverside (city) Loma Linda
Indian Wells San Jacinto Montclair
Indio Temecula
Jurupa Valley Wildomar
TABLE OF CONTENTS
All reports presented within this document are based on data supplied by the CARETS (CLAW, CRISNet MLS, DAMLS, CRMLS, i-‐Tech MLS, and/or VCRDS) or their MLSs. Neither the AssociaGons nor their MLSs guarantee or are in anyway responsible for their accuracy. Data maintained by the AssociaGons or their MLSs may not reflect all real estate acGviGes in the market. InformaGon deemed reliable but not guaranteed.
Inland Empire Market Report | OCTOBER 2015
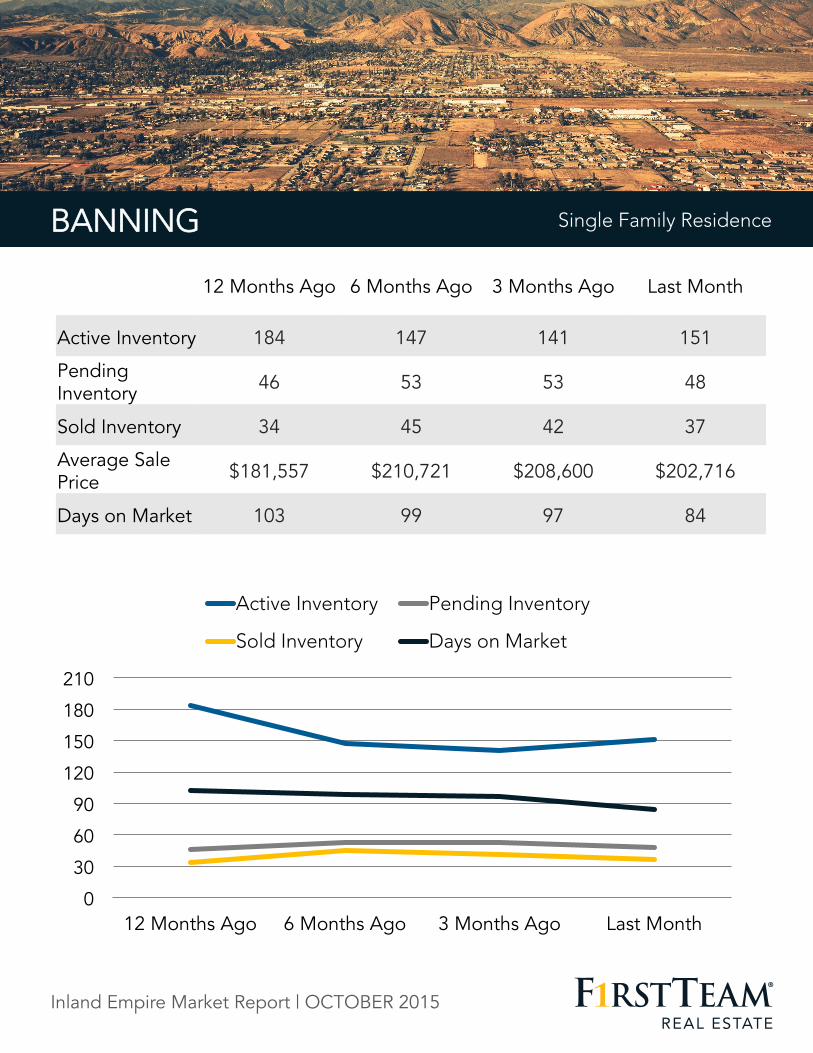
BANNING Single Family Residence
BANNING
0
30
60
90
120
150
180
210
12 Months Ago 6 Months Ago 3 Months Ago Last Month
Active Inventory Pending Inventory
Sold Inventory Days on Market
Single Family Residence
12 Months Ago 6 Months Ago 3 Months Ago Last Month
Active Inventory 184 147 141 151
Pending Inventory 46 53 53 48
Sold Inventory 34 45 42 37
Average Sale Price $181,557 $210,721 $208,600 $202,716
Days on Market 103 99 97 84
Inland Empire Market Report | OCTOBER 2015
BEAUMONT
View homes for sale in Aliso Viejo >>
0
40
80
120
160
200
240
280
12 Months Ago 6 Months Ago 3 Months Ago Last Month
Active Inventory Pending Inventory
Sold Inventory Days on Market
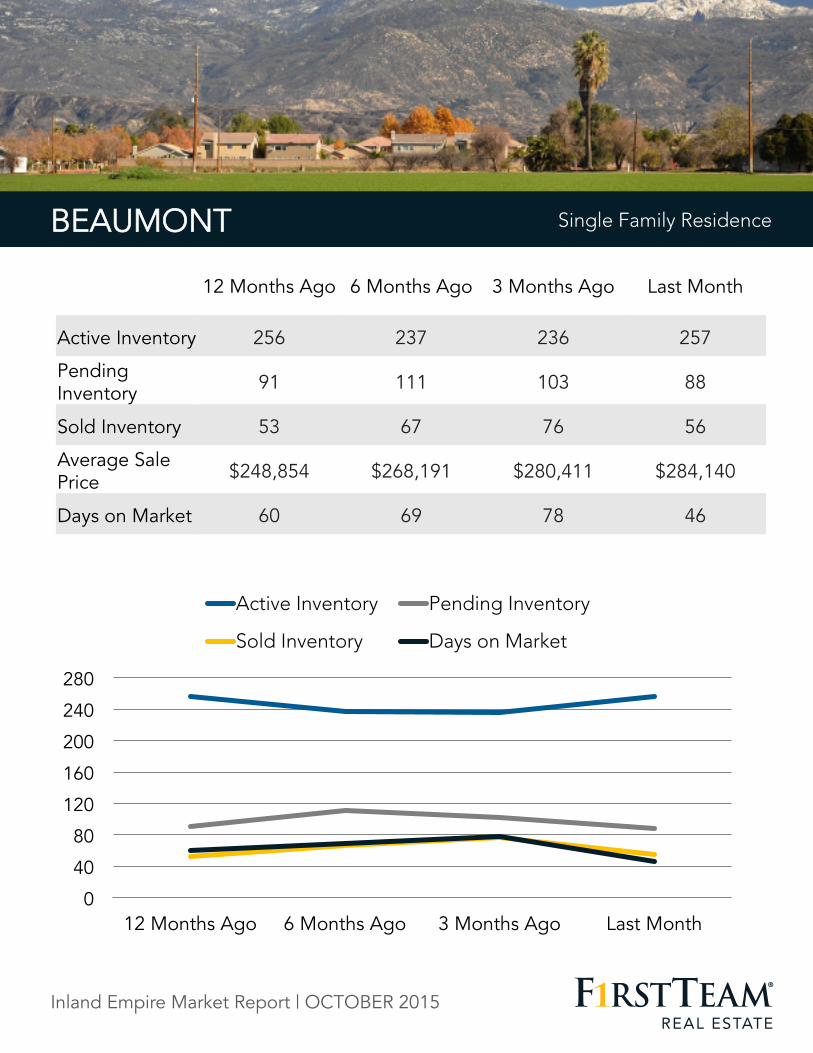
Single Family Residence BEAUMONT
12 Months Ago 6 Months Ago 3 Months Ago Last Month
Active Inventory 256 237 236 257
Pending Inventory 91 111 103 88
Sold Inventory 53 67 76 56
Average Sale Price $248,854 $268,191 $280,411 $284,140
Days on Market 60 69 78 46
Inland Empire Market Report | OCTOBER 2015
BLYTHE
View homes for sale in Aliso Viejo >>
0
25
50
75
100
125
150
175
12 Months Ago 6 Months Ago 3 Months Ago Last Month
Active Inventory Pending Inventory
Sold Inventory Days on Market
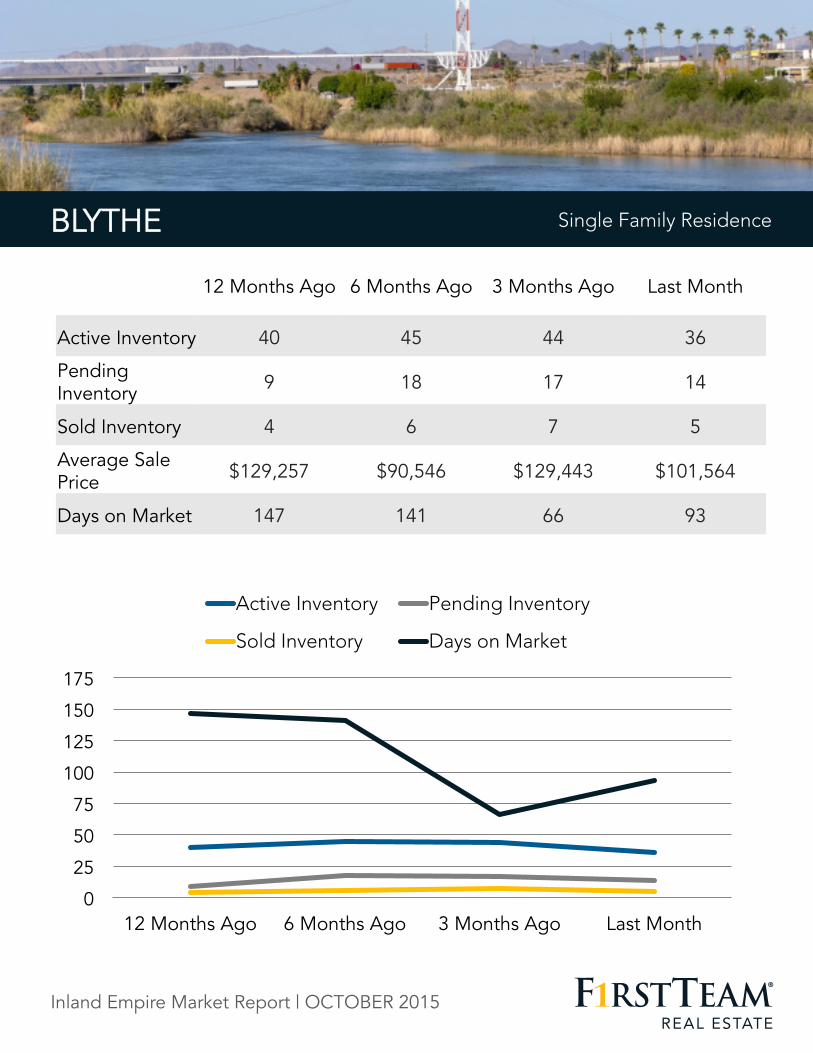
BLYTHE Single Family Residence
12 Months Ago 6 Months Ago 3 Months Ago Last Month
Active Inventory 40 45 44 36
Pending Inventory 9 18 17 14
Sold Inventory 4 6 7 5
Average Sale Price $129,257 $90,546 $129,443 $101,564
Days on Market 147 141 66 93
Inland Empire Market Report | OCTOBER 2015
CALIMESA
0
20
40
60
80
100
12 Months Ago 6 Months Ago 3 Months Ago Last Month
Active Inventory Pending Inventory
Sold Inventory Days on Market
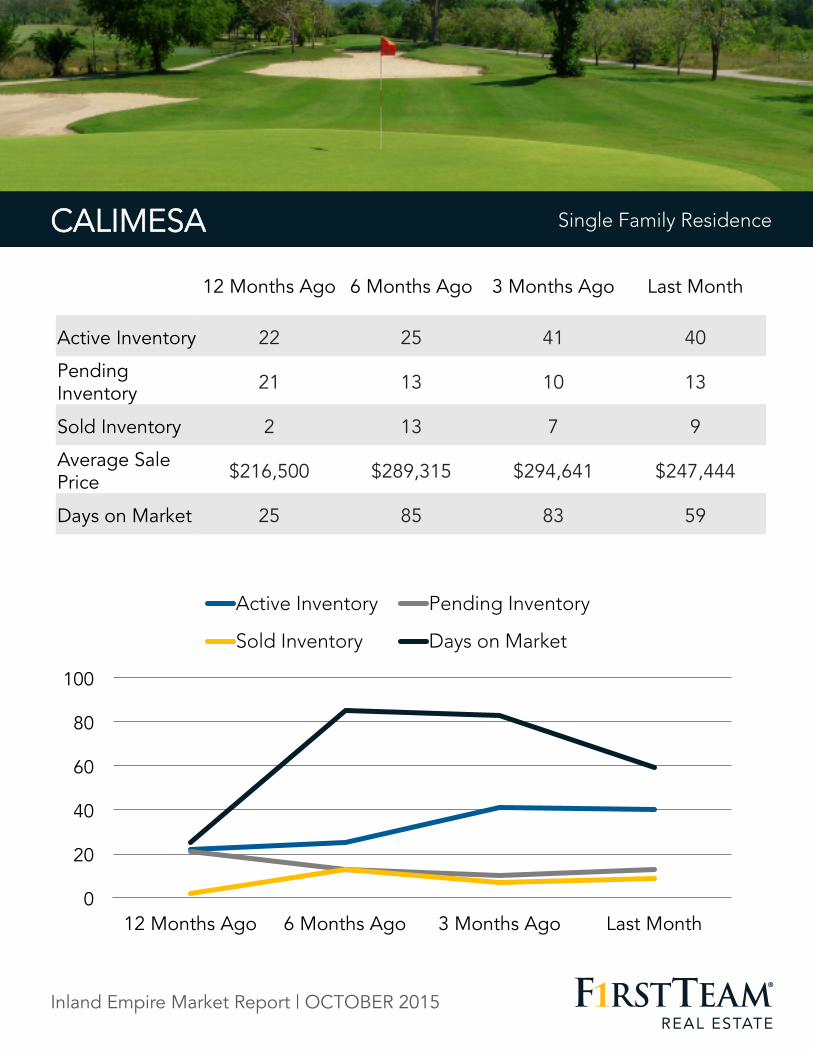
CALIMESA Single Family Residence
12 Months Ago 6 Months Ago 3 Months Ago Last Month
Active Inventory 22 25 41 40
Pending Inventory 21 13 10 13
Sold Inventory 2 13 7 9
Average Sale Price $216,500 $289,315 $294,641 $247,444
Days on Market 25 85 83 59
Inland Empire Market Report | OCTOBER 2015
CANYON LAKE
0
30
60
90
120
150
180
210
12 Months Ago 6 Months Ago 3 Months Ago Last Month
Active Inventory Pending Inventory
Sold Inventory Days on Market
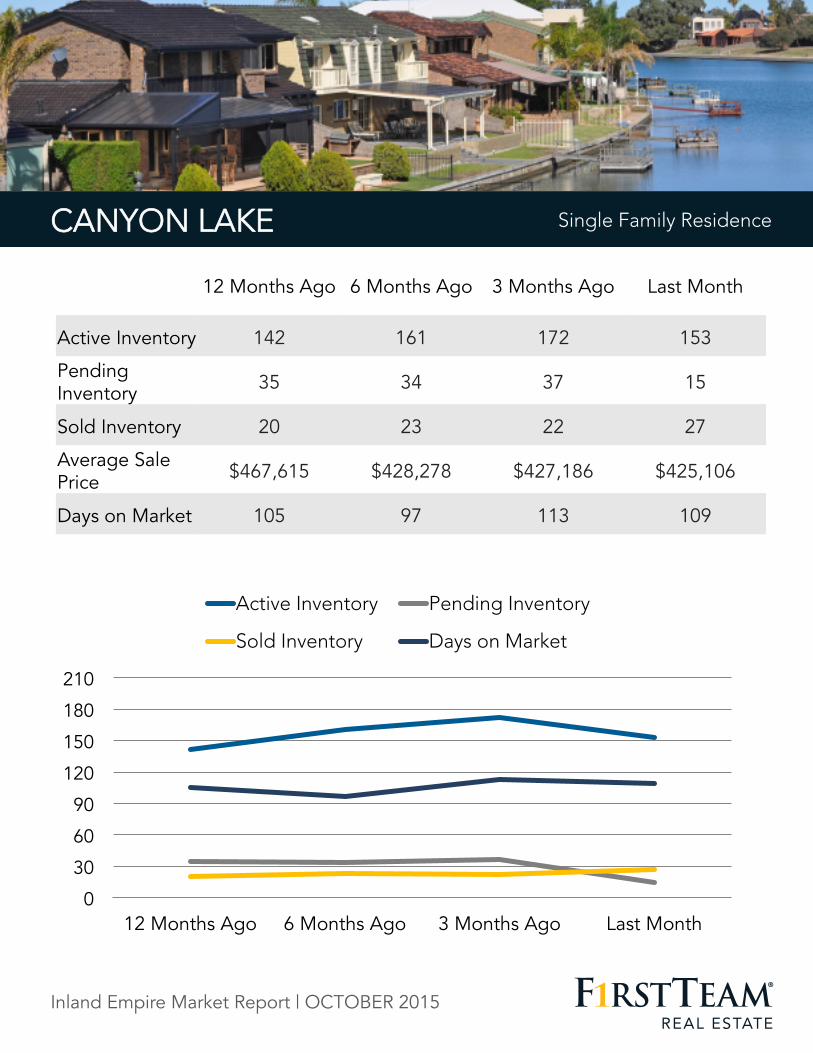
CANYON LAKE Single Family Residence
12 Months Ago 6 Months Ago 3 Months Ago Last Month
Active Inventory 142 161 172 153
Pending Inventory 35 34 37 15
Sold Inventory 20 23 22 27
Average Sale Price $467,615 $428,278 $427,186 $425,106
Days on Market 105 97 113 109
Inland Empire Market Report | OCTOBER 2015
CATHEDRAL CITY
0
50
100
150
200
250
300
12 Months Ago 6 Months Ago 3 Months Ago Last Month
Active Inventory Pending Inventory
Sold Inventory Days on Market
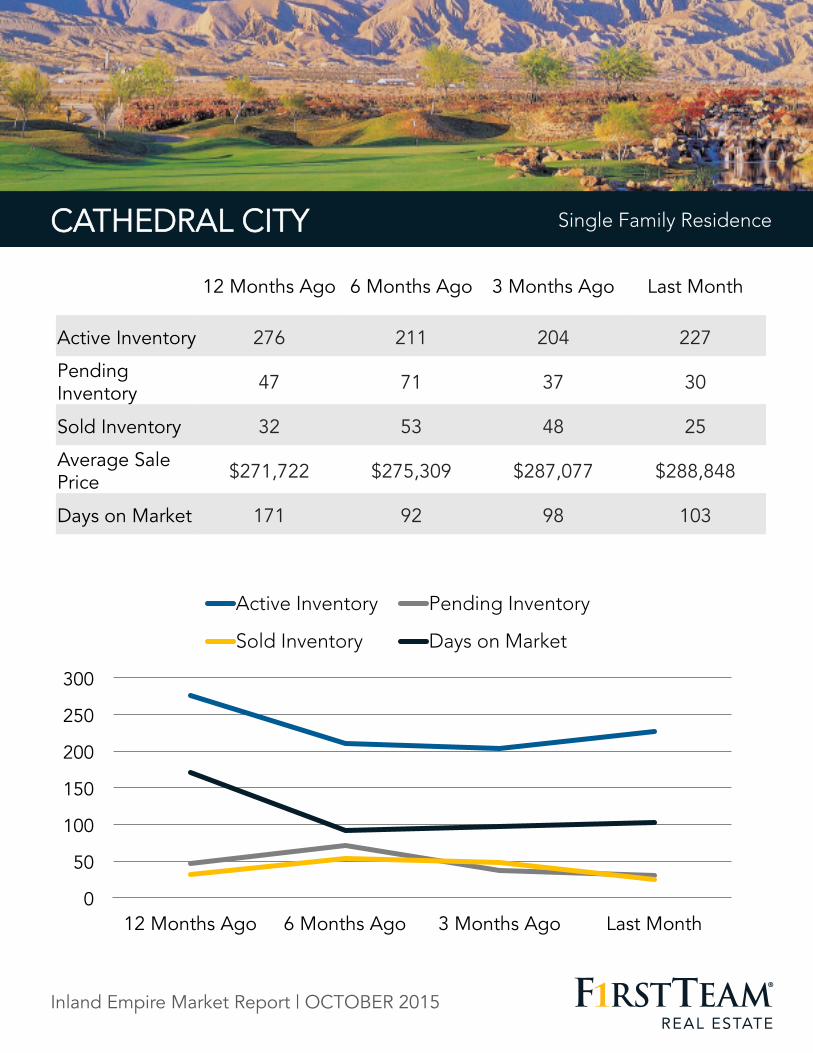
Single Family Residence CATHEDRAL CITY Single Family Residence
12 Months Ago 6 Months Ago 3 Months Ago Last Month
Active Inventory 276 211 204 227
Pending Inventory 47 71 37 30
Sold Inventory 32 53 48 25
Average Sale Price $271,722 $275,309 $287,077 $288,848
Days on Market 171 92 98 103
Inland Empire Market Report | OCTOBER 2015
COACHELLA
0
20
40
60
80
100
120
12 Months Ago 6 Months Ago 3 Months Ago Last Month
Active Inventory Pending Inventory
Sold Inventory Days on Market
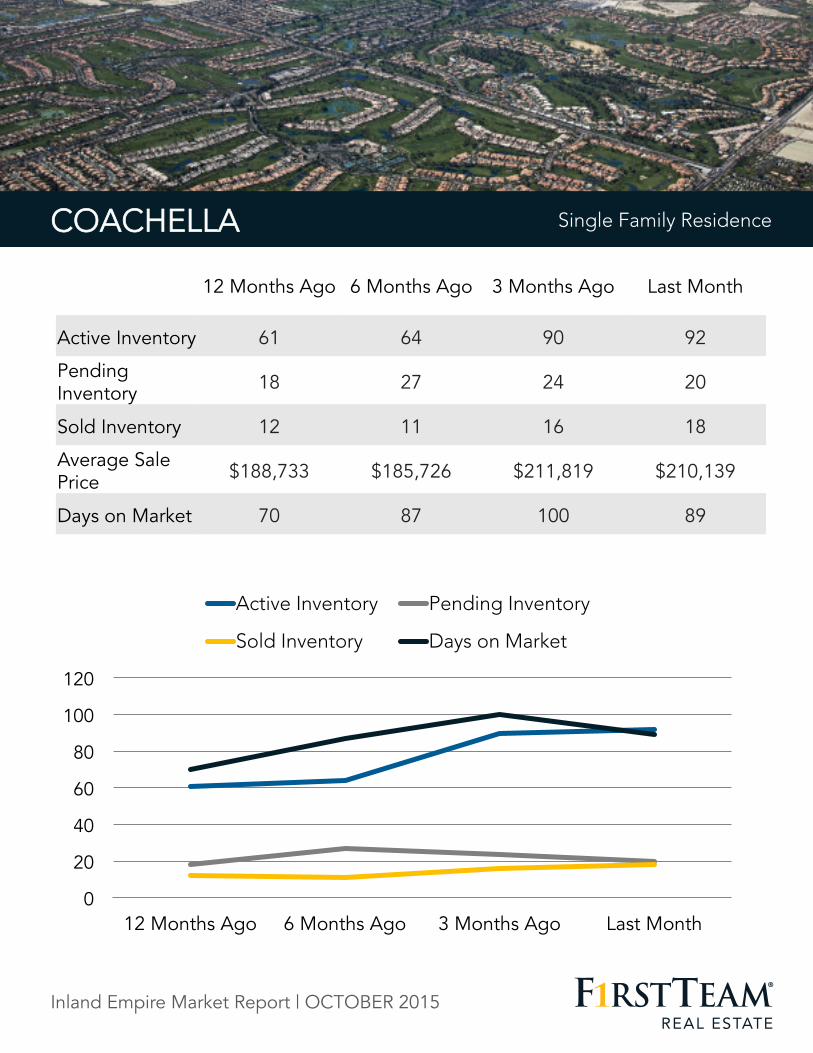
Single Family Residence COACHELLA Single Family Residence
12 Months Ago 6 Months Ago 3 Months Ago Last Month
Active Inventory 61 64 90 92
Pending Inventory 18 27 24 20
Sold Inventory 12 11 16 18
Average Sale Price $188,733 $185,726 $211,819 $210,139
Days on Market 70 87 100 89
Inland Empire Market Report | OCTOBER 2015
CORONA
0 100 200 300 400 500 600 700 800 900
12 Months Ago 6 Months Ago 3 Months Ago Last Month
Active Inventory Pending Inventory
Sold Inventory Days on Market
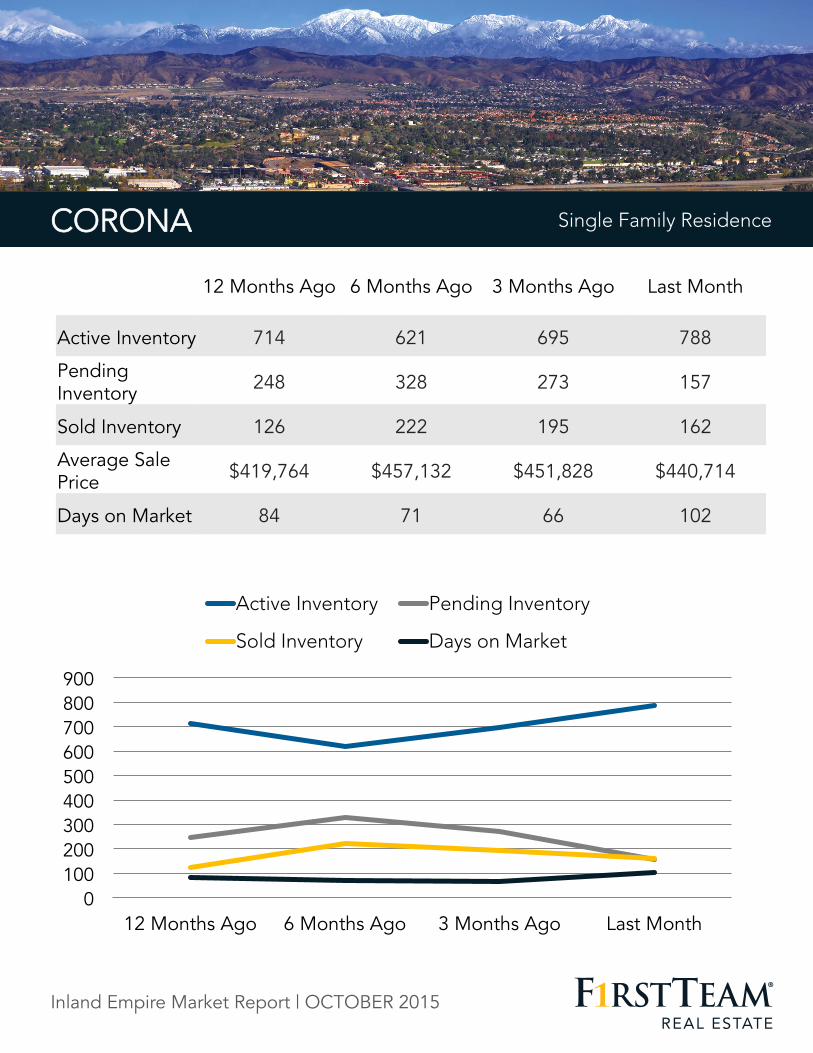
CORONA Single Family Residence
12 Months Ago 6 Months Ago 3 Months Ago Last Month
Active Inventory 714 621 695 788
Pending Inventory 248 328 273 157
Sold Inventory 126 222 195 162
Average Sale Price $419,764 $457,132 $451,828 $440,714
Days on Market 84 71 66 102
Inland Empire Market Report | OCTOBER 2015
DESERT HOT SPRINGS
0
50
100
150
200
250
300
350
12 Months Ago 6 Months Ago 3 Months Ago Last Month
Active Inventory Pending Inventory
Sold Inventory Days on Market
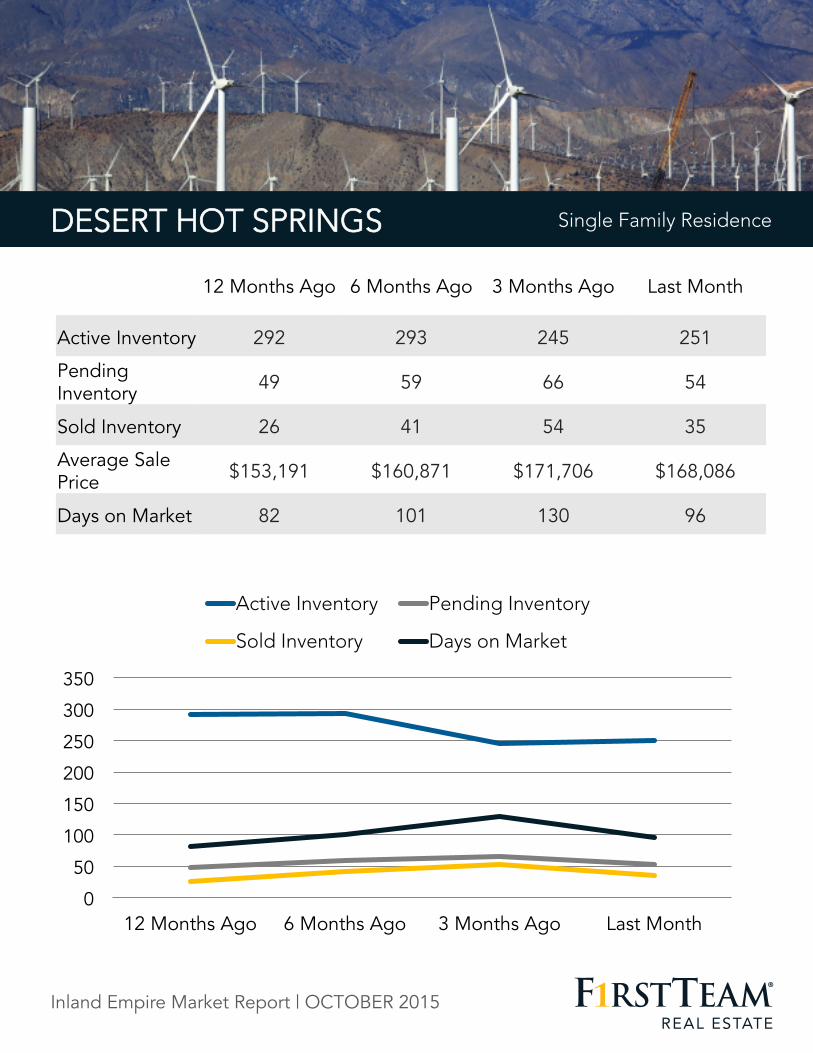
DESERT HOT SPRINGS Single Family Residence
12 Months Ago 6 Months Ago 3 Months Ago Last Month
Active Inventory 292 293 245 251
Pending Inventory 49 59 66 54
Sold Inventory 26 41 54 35
Average Sale Price $153,191 $160,871 $171,706 $168,086
Days on Market 82 101 130 96
Inland Empire Market Report | OCTOBER 2015
EASTVALE
0
40
80
120
160
200
240
12 Months Ago 6 Months Ago 3 Months Ago Last Month
Active Inventory Pending Inventory
Sold Inventory Days on Market
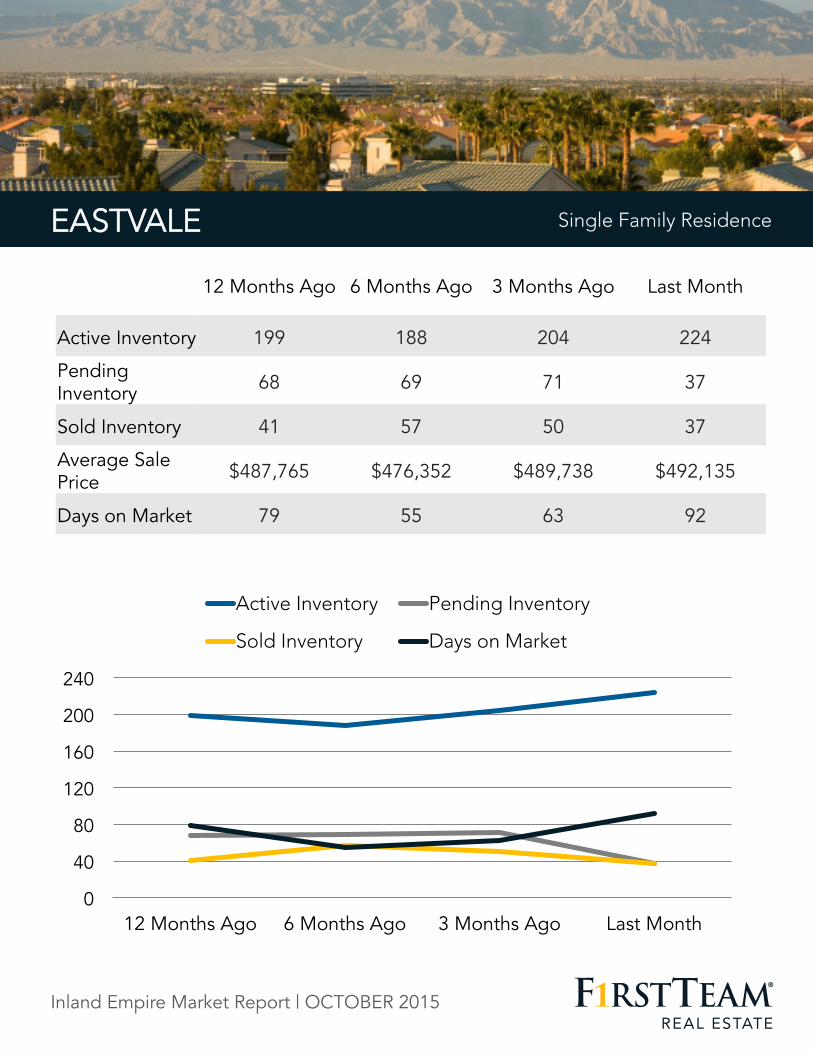
Single Family Residence EASTVALE Single Family Residence
12 Months Ago 6 Months Ago 3 Months Ago Last Month
Active Inventory 199 188 204 224
Pending Inventory 68 69 71 37
Sold Inventory 41 57 50 37
Average Sale Price $487,765 $476,352 $489,738 $492,135
Days on Market 79 55 63 92
Inland Empire Market Report | OCTOBER 2015
HEMET
0
100
200
300
400
500
600
700
12 Months Ago 6 Months Ago 3 Months Ago Last Month
Active Inventory Pending Inventory
Sold Inventory Days on Market
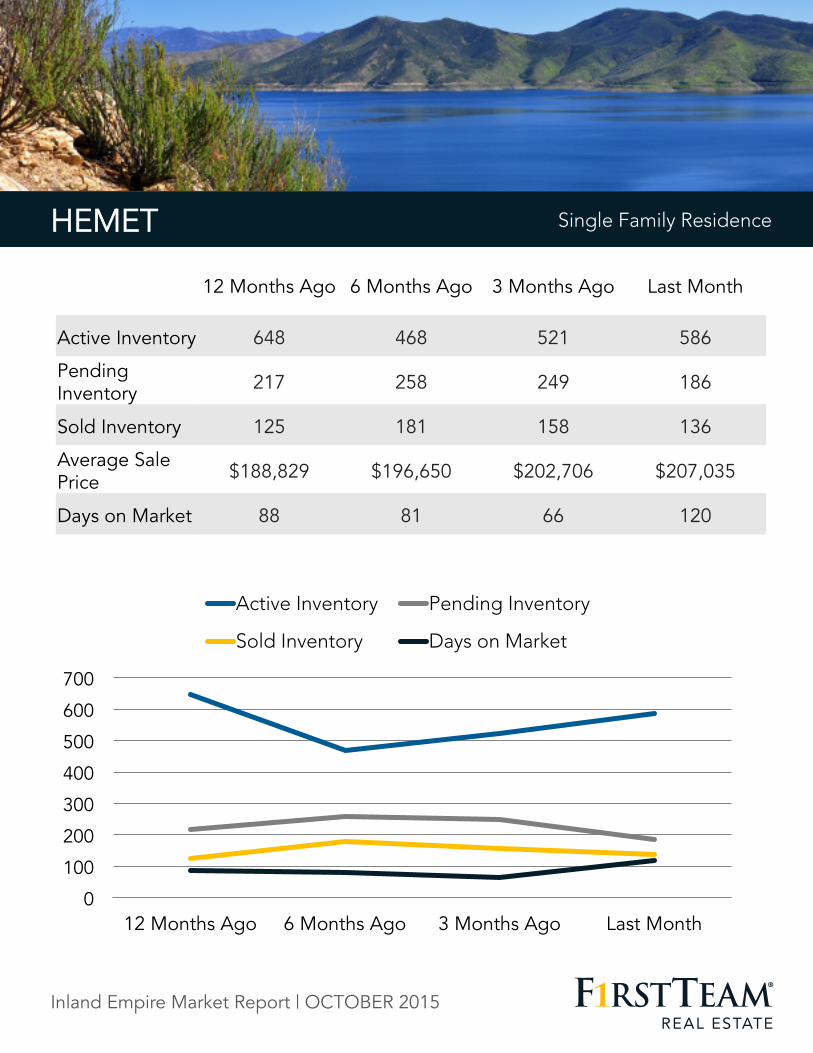
Single Family Residence HEMET Single Family Residence
12 Months Ago 6 Months Ago 3 Months Ago Last Month
Active Inventory 648 468 521 586
Pending Inventory 217 258 249 186
Sold Inventory 125 181 158 136
Average Sale Price $188,829 $196,650 $202,706 $207,035
Days on Market 88 81 66 120
Inland Empire Market Report | OCTOBER 2015
INDIAN WELLS
0 30 60 90
120 150 180 210 240
12 Months Ago 6 Months Ago 3 Months Ago Last Month
Active Inventory Pending Inventory
Sold Inventory Days on Market
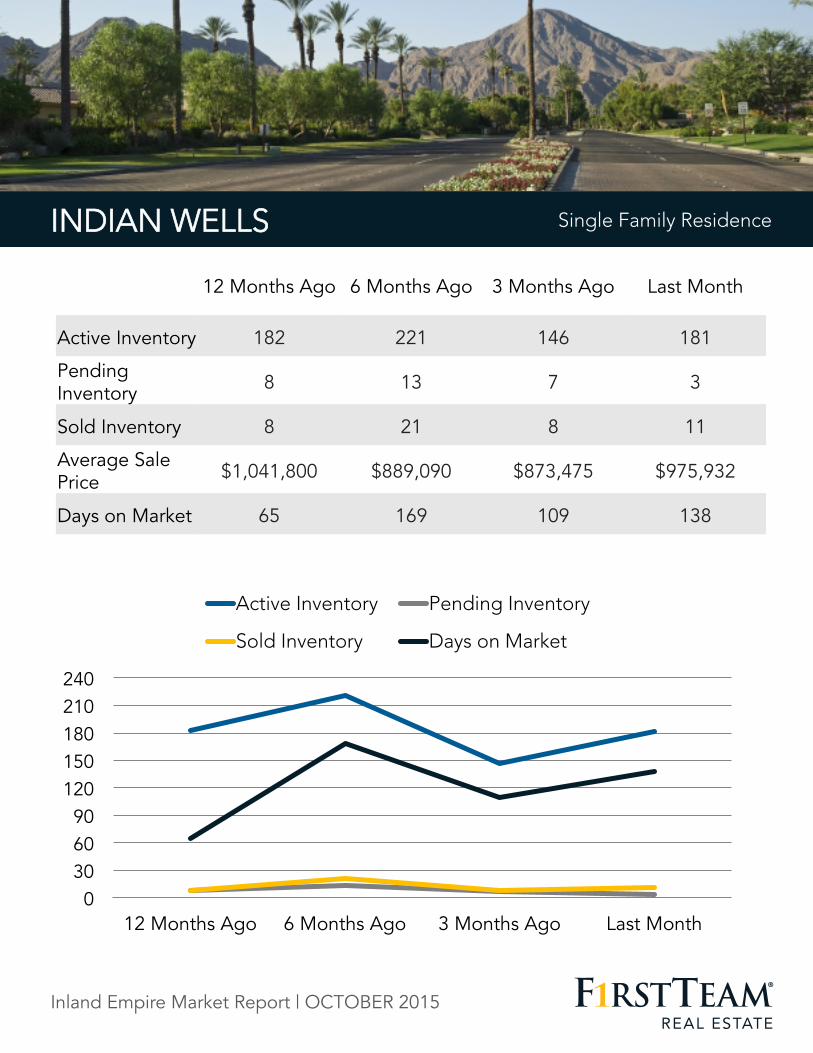
Single Family Residence INDIAN WELLS Single Family Residence
12 Months Ago 6 Months Ago 3 Months Ago Last Month
Active Inventory 182 221 146 181
Pending Inventory 8 13 7 3
Sold Inventory 8 21 8 11
Average Sale Price $1,041,800 $889,090 $873,475 $975,932
Days on Market 65 169 109 138
Inland Empire Market Report | OCTOBER 2015
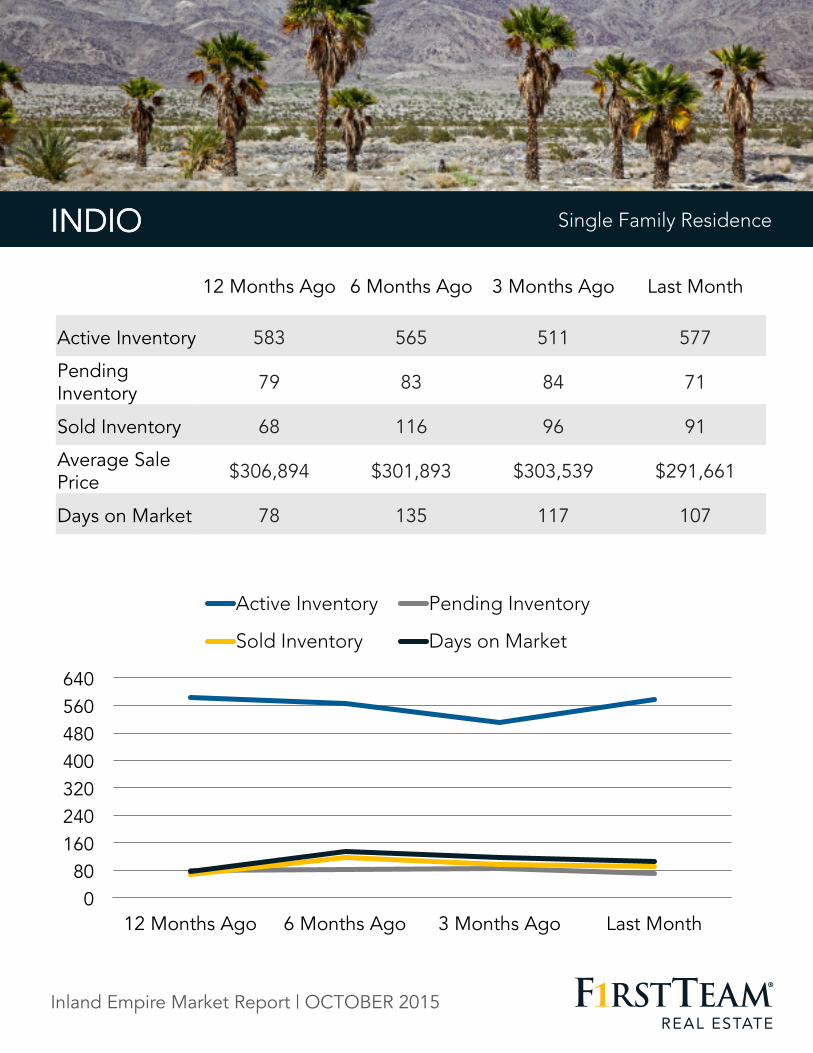
INDIO
0 80
160 240 320 400 480 560 640
12 Months Ago 6 Months Ago 3 Months Ago Last Month
Active Inventory Pending Inventory
Sold Inventory Days on Market
Single Family Residence INDIO Single Family Residence
12 Months Ago 6 Months Ago 3 Months Ago Last Month
Active Inventory 583 565 511 577
Pending Inventory 79 83 84 71
Sold Inventory 68 116 96 91
Average Sale Price $306,894 $301,893 $303,539 $291,661
Days on Market 78 135 117 107
Inland Empire Market Report | OCTOBER 2015
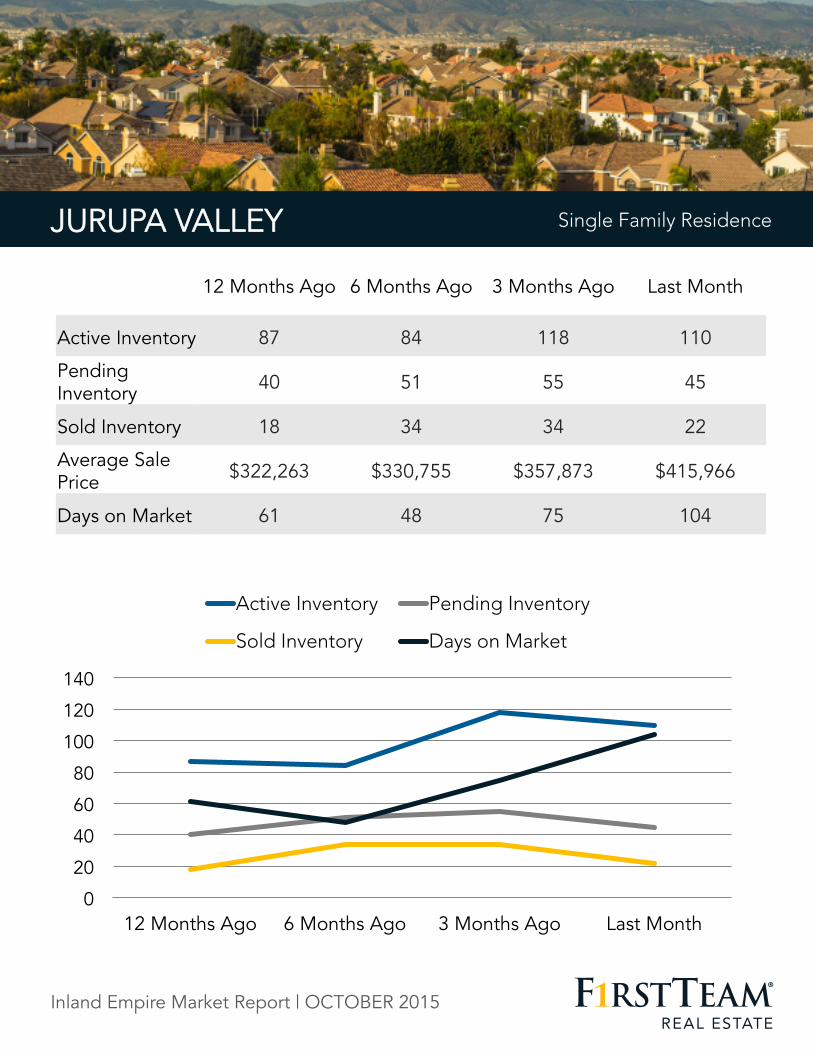
JURUPA VALLEY
0
20
40
60
80
100
120
140
12 Months Ago 6 Months Ago 3 Months Ago Last Month
Active Inventory Pending Inventory
Sold Inventory Days on Market
Single Family Residence JURUPA VALLEY Single Family Residence
12 Months Ago 6 Months Ago 3 Months Ago Last Month
Active Inventory 87 84 118 110
Pending Inventory 40 51 55 45
Sold Inventory 18 34 34 22
Average Sale Price $322,263 $330,755 $357,873 $415,966
Days on Market 61 48 75 104
Inland Empire Market Report | OCTOBER 2015
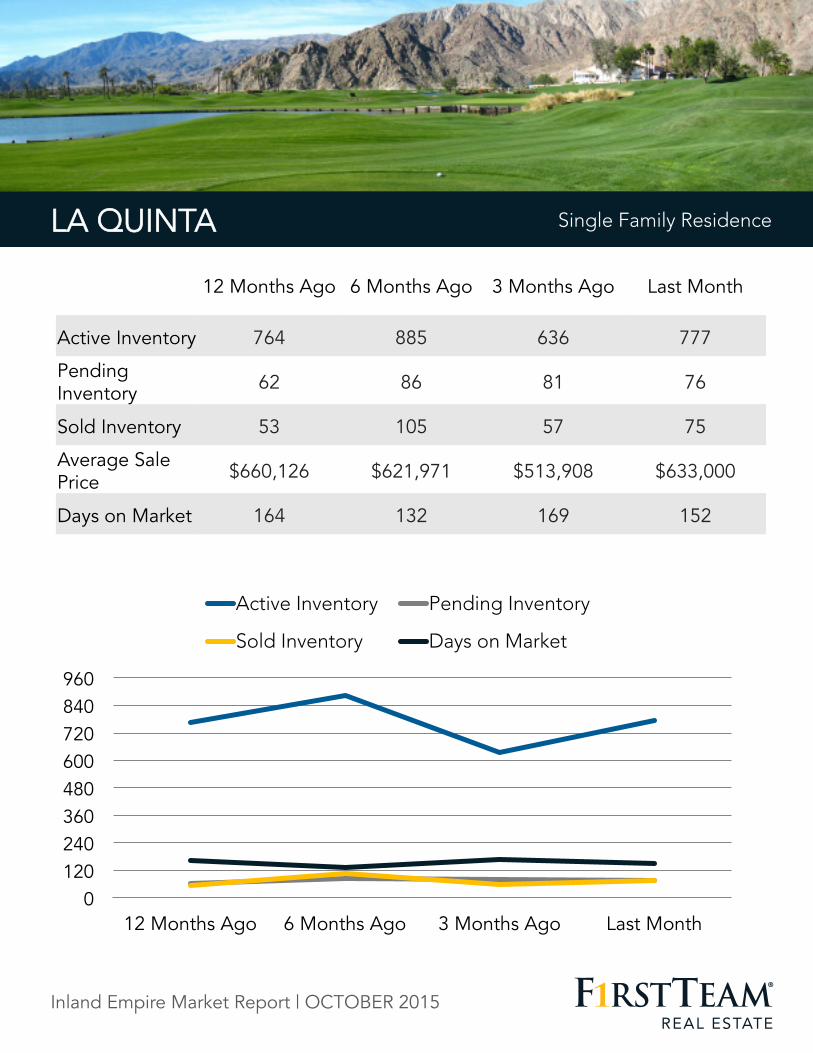
LA QUINTA
0 120 240 360 480 600 720 840 960
12 Months Ago 6 Months Ago 3 Months Ago Last Month
Active Inventory Pending Inventory
Sold Inventory Days on Market
Single Family Residence LA QUINTA Single Family Residence
12 Months Ago 6 Months Ago 3 Months Ago Last Month
Active Inventory 764 885 636 777
Pending Inventory 62 86 81 76
Sold Inventory 53 105 57 75
Average Sale Price $660,126 $621,971 $513,908 $633,000
Days on Market 164 132 169 152
Inland Empire Market Report | OCTOBER 2015
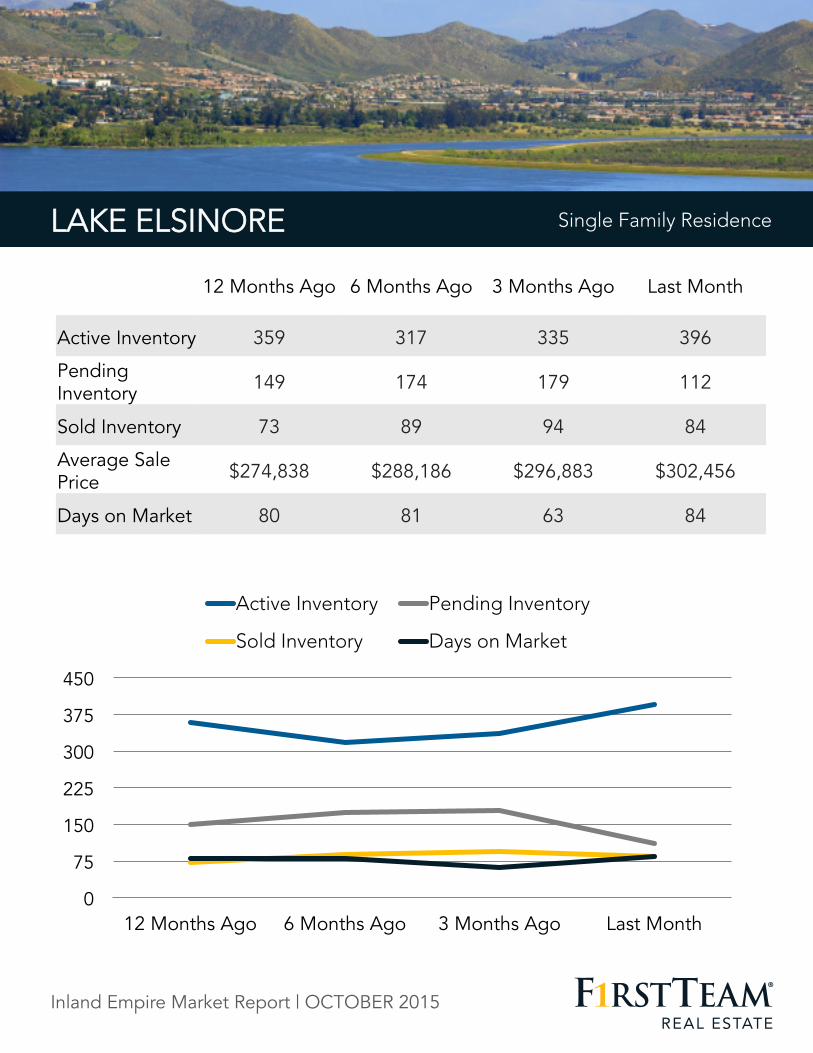
LAKE ELSINORE
0
75
150
225
300
375
450
12 Months Ago 6 Months Ago 3 Months Ago Last Month
Active Inventory Pending Inventory
Sold Inventory Days on Market
Single Family Residence LAKE ELSINORE Single Family Residence
12 Months Ago 6 Months Ago 3 Months Ago Last Month
Active Inventory 359 317 335 396
Pending Inventory 149 174 179 112
Sold Inventory 73 89 94 84
Average Sale Price $274,838 $288,186 $296,883 $302,456
Days on Market 80 81 63 84
Inland Empire Market Report | OCTOBER 2015
MENIFEE
0
75
150
225
300
375
450
12 Months Ago 6 Months Ago 3 Months Ago Last Month
Active Inventory Pending Inventory
Sold Inventory Days on Market
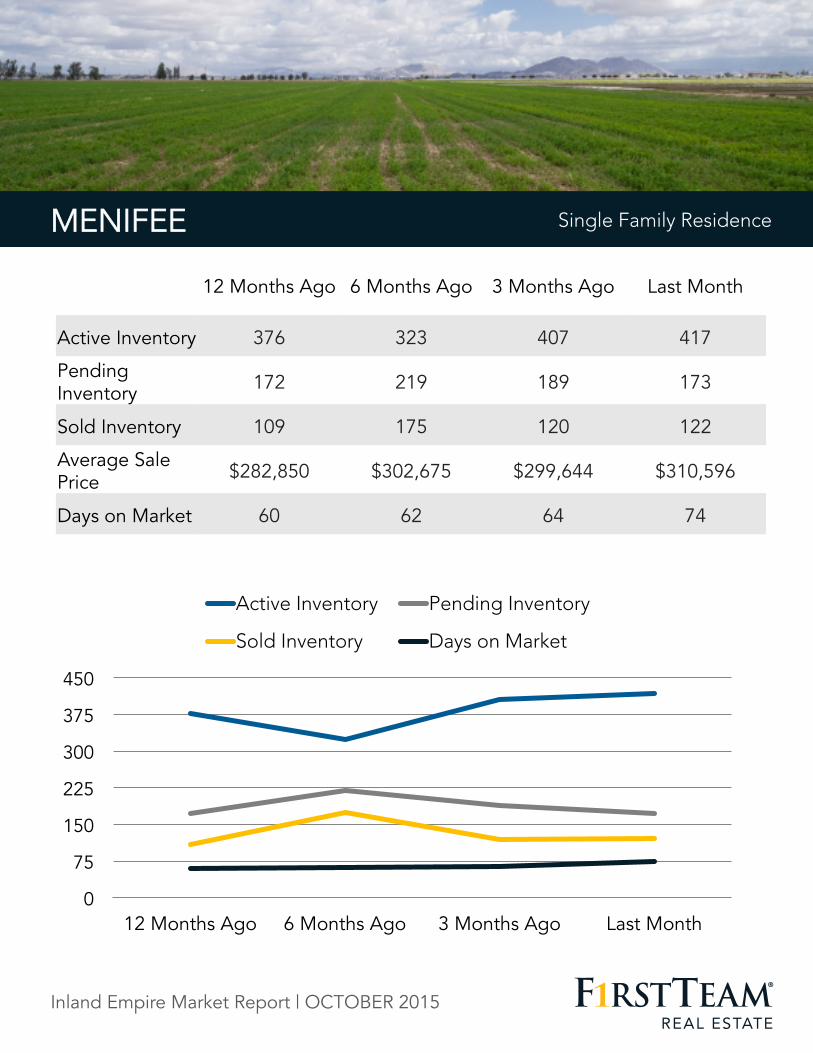
Single Family Residence MENIFEE Single Family Residence
12 Months Ago 6 Months Ago 3 Months Ago Last Month
Active Inventory 376 323 407 417
Pending Inventory 172 219 189 173
Sold Inventory 109 175 120 122
Average Sale Price $282,850 $302,675 $299,644 $310,596
Days on Market 60 62 64 74
Inland Empire Market Report | OCTOBER 2015
MORENO VALLEY
0
100
200
300
400
500
600
700
12 Months Ago 6 Months Ago 3 Months Ago Last Month
Active Inventory Pending Inventory
Sold Inventory Days on Market
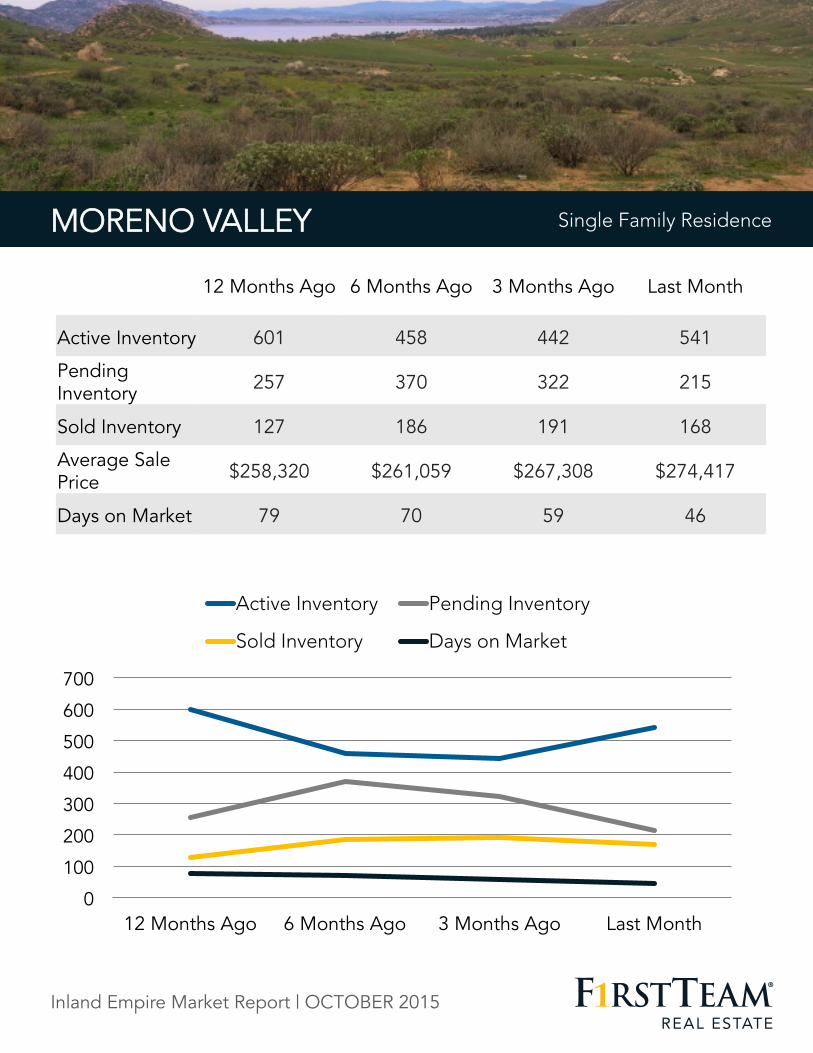
Single Family Residence MORENO VALLEY Single Family Residence
12 Months Ago 6 Months Ago 3 Months Ago Last Month
Active Inventory 601 458 442 541
Pending Inventory 257 370 322 215
Sold Inventory 127 186 191 168
Average Sale Price $258,320 $261,059 $267,308 $274,417
Days on Market 79 70 59 46
Inland Empire Market Report | OCTOBER 2015
MURRIETA
0 100 200 300 400 500 600 700 800
12 Months Ago 6 Months Ago 3 Months Ago Last Month
Active Inventory Pending Inventory
Sold Inventory Days on Market
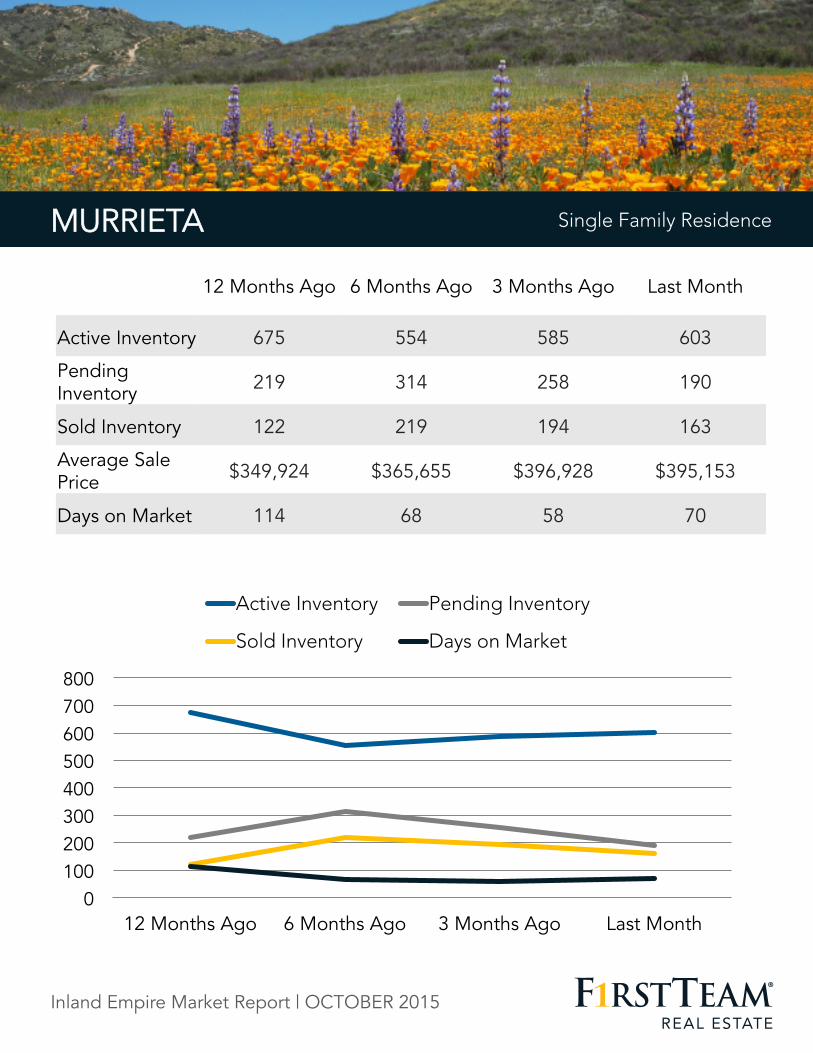
Single Family Residence MURRIETA Single Family Residence
12 Months Ago 6 Months Ago 3 Months Ago Last Month
Active Inventory 675 554 585 603
Pending Inventory 219 314 258 190
Sold Inventory 122 219 194 163
Average Sale Price $349,924 $365,655 $396,928 $395,153
Days on Market 114 68 58 70
Inland Empire Market Report | OCTOBER 2015
NORCO
0
20
40
60
80
100
120
140
12 Months Ago 6 Months Ago 3 Months Ago Last Month
Active Inventory Pending Inventory
Sold Inventory Days on Market
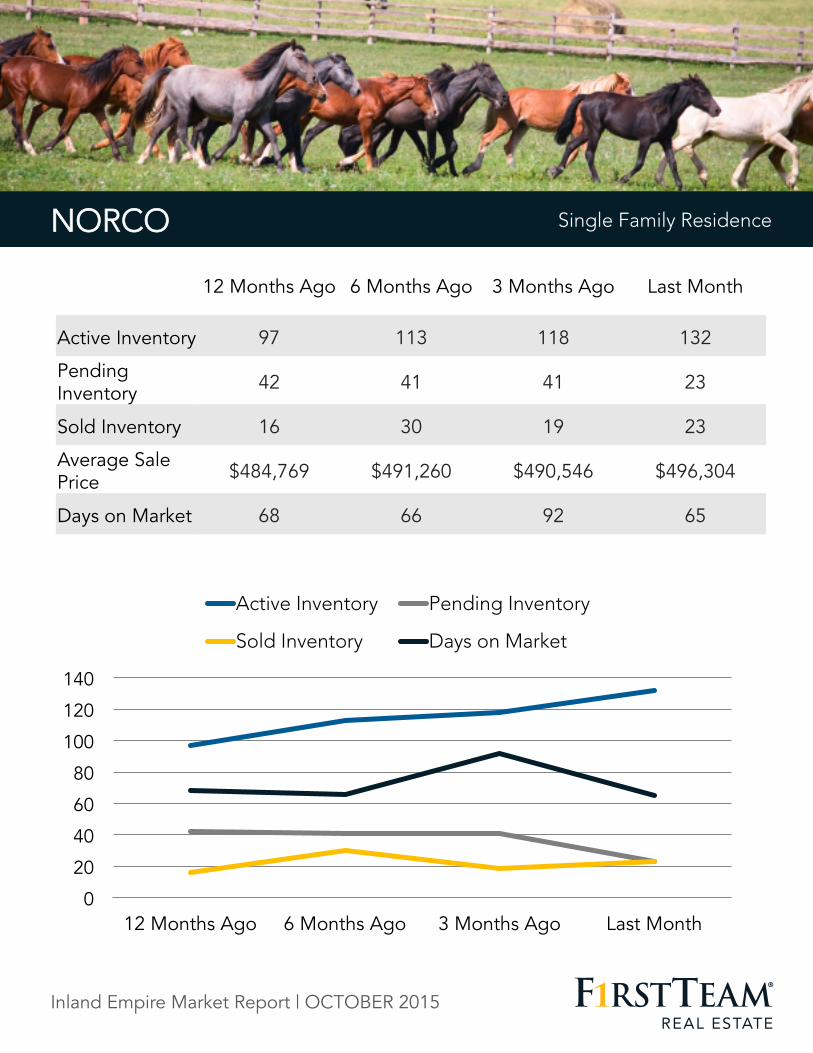
Single Family Residence NORCO Single Family Residence
12 Months Ago 6 Months Ago 3 Months Ago Last Month
Active Inventory 97 113 118 132
Pending Inventory 42 41 41 23
Sold Inventory 16 30 19 23
Average Sale Price $484,769 $491,260 $490,546 $496,304
Days on Market 68 66 92 65
Inland Empire Market Report | OCTOBER 2015
PALM DESERT
0
100
200
300
400
500
600
700
12 Months Ago 6 Months Ago 3 Months Ago Last Month
Active Inventory Pending Inventory
Sold Inventory Days on Market
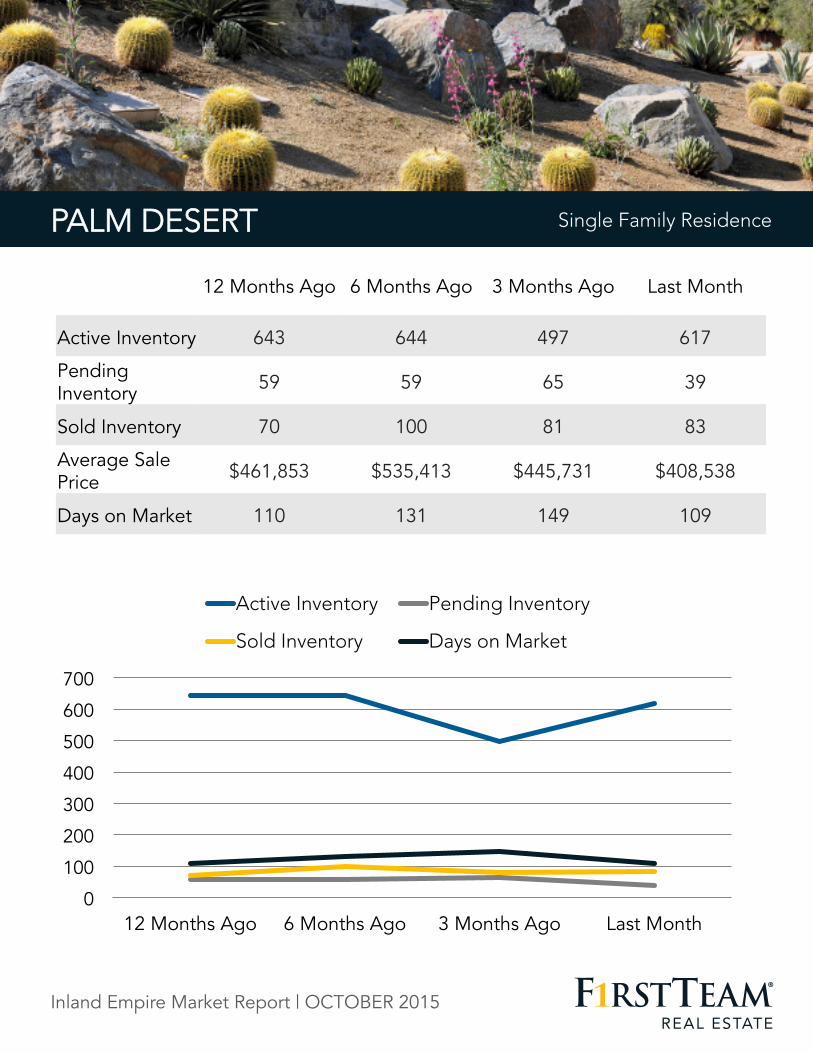
Single Family Residence PALM DESERT Single Family Residence
12 Months Ago 6 Months Ago 3 Months Ago Last Month
Active Inventory 643 644 497 617
Pending Inventory 59 59 65 39
Sold Inventory 70 100 81 83
Average Sale Price $461,853 $535,413 $445,731 $408,538
Days on Market 110 131 149 109
Inland Empire Market Report | OCTOBER 2015
PALM SPRINGS
0
75
150
225
300
375
450
525
12 Months Ago 6 Months Ago 3 Months Ago Last Month
Active Inventory Pending Inventory
Sold Inventory Days on Market
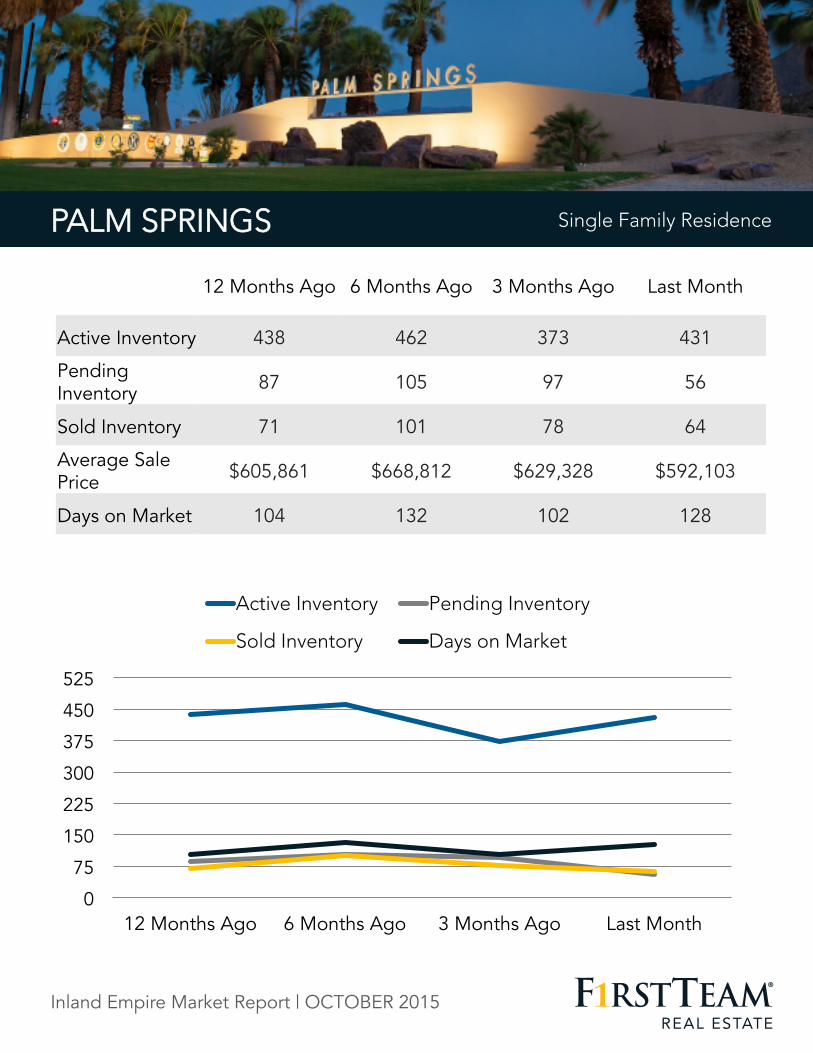
Single Family Residence PALM SPRINGS Single Family Residence
12 Months Ago 6 Months Ago 3 Months Ago Last Month
Active Inventory 438 462 373 431
Pending Inventory 87 105 97 56
Sold Inventory 71 101 78 64
Average Sale Price $605,861 $668,812 $629,328 $592,103
Days on Market 104 132 102 128
Inland Empire Market Report | OCTOBER 2015
PERRIS
0
50
100
150
200
250
300
350
12 Months Ago 6 Months Ago 3 Months Ago Last Month
Active Inventory Pending Inventory
Sold Inventory Days on Market
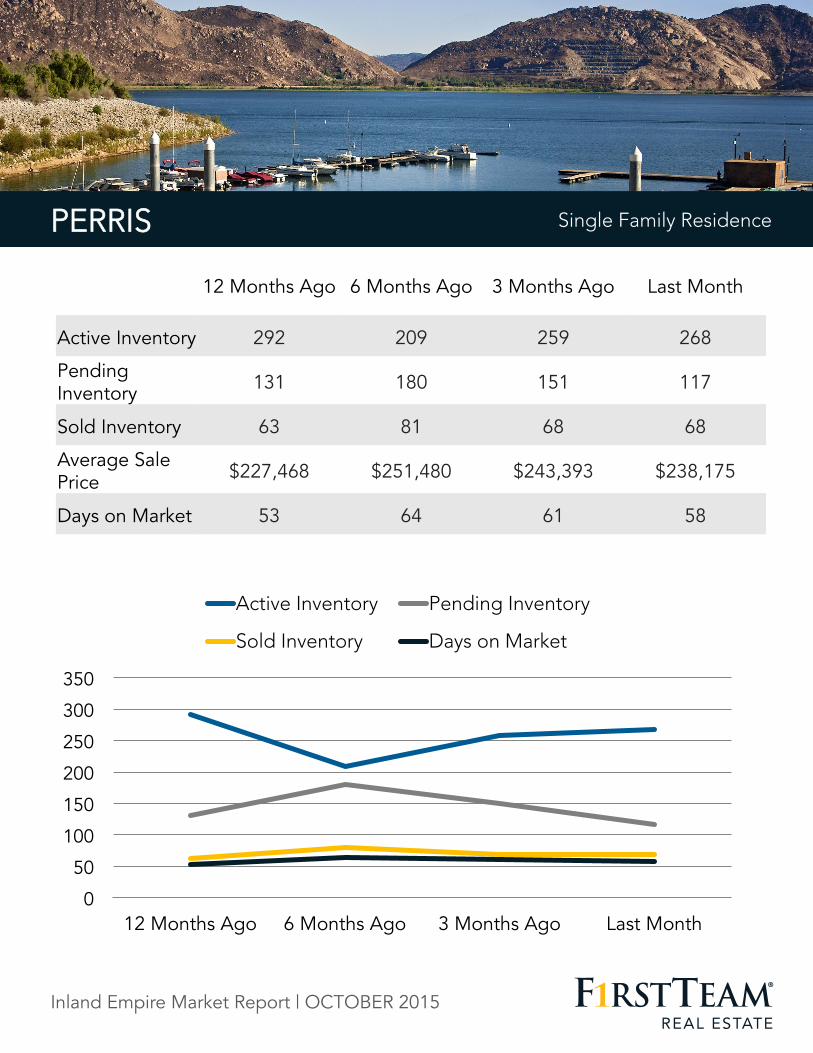
Single Family Residence PERRIS Single Family Residence
12 Months Ago 6 Months Ago 3 Months Ago Last Month
Active Inventory 292 209 259 268
Pending Inventory 131 180 151 117
Sold Inventory 63 81 68 68
Average Sale Price $227,468 $251,480 $243,393 $238,175
Days on Market 53 64 61 58
Inland Empire Market Report | OCTOBER 2015
RANCHO MIRAGE
0
75
150
225
300
375
450
12 Months Ago 6 Months Ago 3 Months Ago Last Month
Active Inventory Pending Inventory
Sold Inventory Days on Market
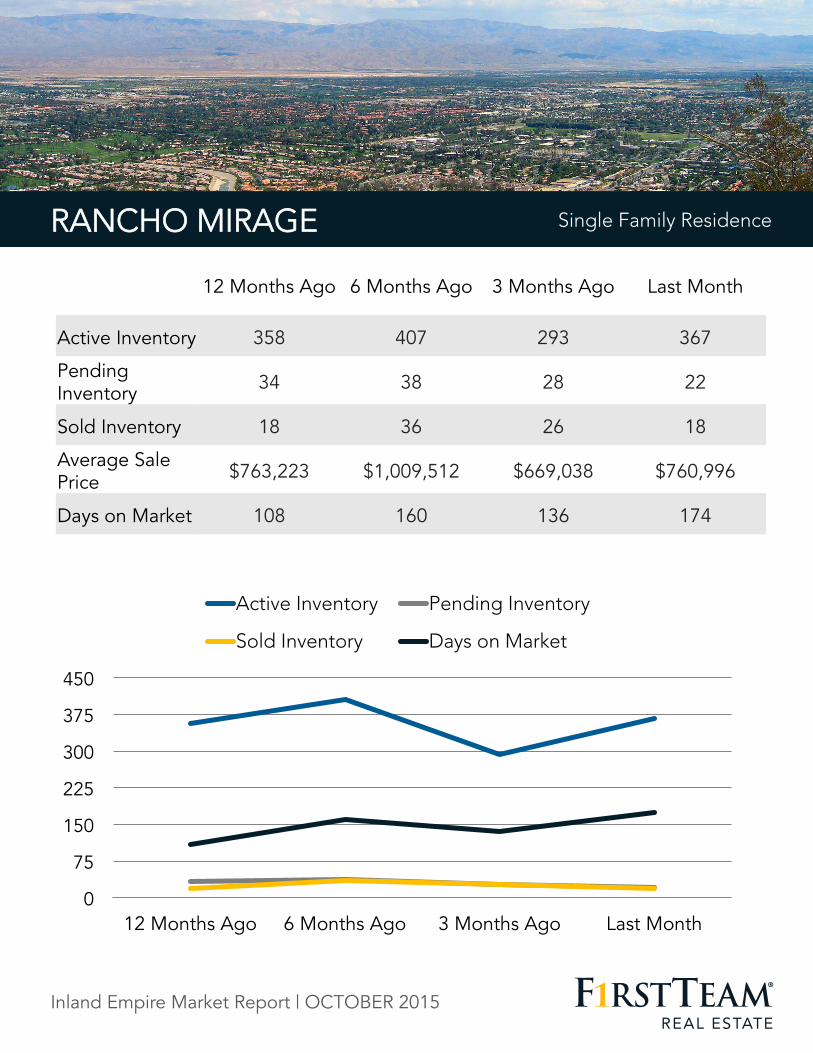
Single Family Residence RANCHO MIRAGE Single Family Residence
12 Months Ago 6 Months Ago 3 Months Ago Last Month
Active Inventory 358 407 293 367
Pending Inventory 34 38 28 22
Sold Inventory 18 36 26 18
Average Sale Price $763,223 $1,009,512 $669,038 $760,996
Days on Market 108 160 136 174
Inland Empire Market Report | OCTOBER 2015
RIVERSIDE (city)
0 150 300 450 600 750 900
1050 1200
12 Months Ago 6 Months Ago 3 Months Ago Last Month
Active Inventory Pending Inventory
Sold Inventory Days on Market
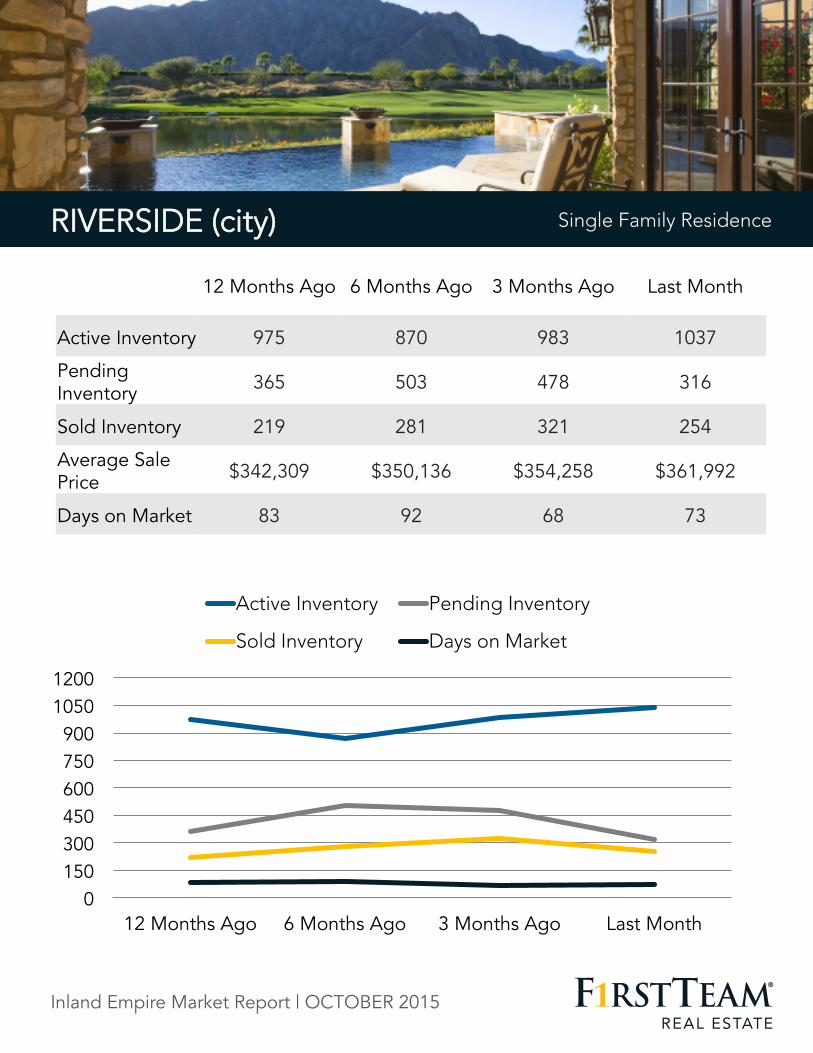
Single Family Residence RIVERSIDE (city) Single Family Residence
12 Months Ago 6 Months Ago 3 Months Ago Last Month
Active Inventory 975 870 983 1037
Pending Inventory 365 503 478 316
Sold Inventory 219 281 321 254
Average Sale Price $342,309 $350,136 $354,258 $361,992
Days on Market 83 92 68 73
Inland Empire Market Report | OCTOBER 2015
SAN JACINTO
0
40
80
120
160
200
240
280
12 Months Ago 6 Months Ago 3 Months Ago Last Month
Active Inventory Pending Inventory
Sold Inventory Days on Market
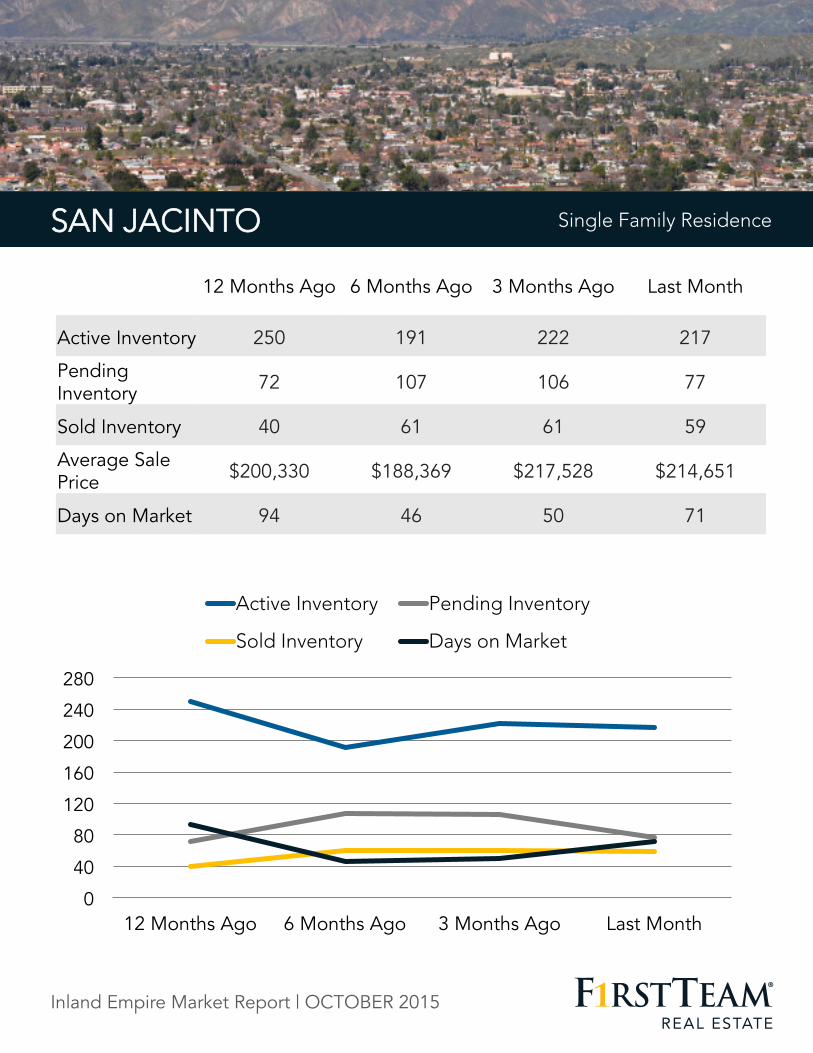
Single Family Residence SAN JACINTO Single Family Residence
12 Months Ago 6 Months Ago 3 Months Ago Last Month
Active Inventory 250 191 222 217
Pending Inventory 72 107 106 77
Sold Inventory 40 61 61 59
Average Sale Price $200,330 $188,369 $217,528 $214,651
Days on Market 94 46 50 71
Inland Empire Market Report | OCTOBER 2015
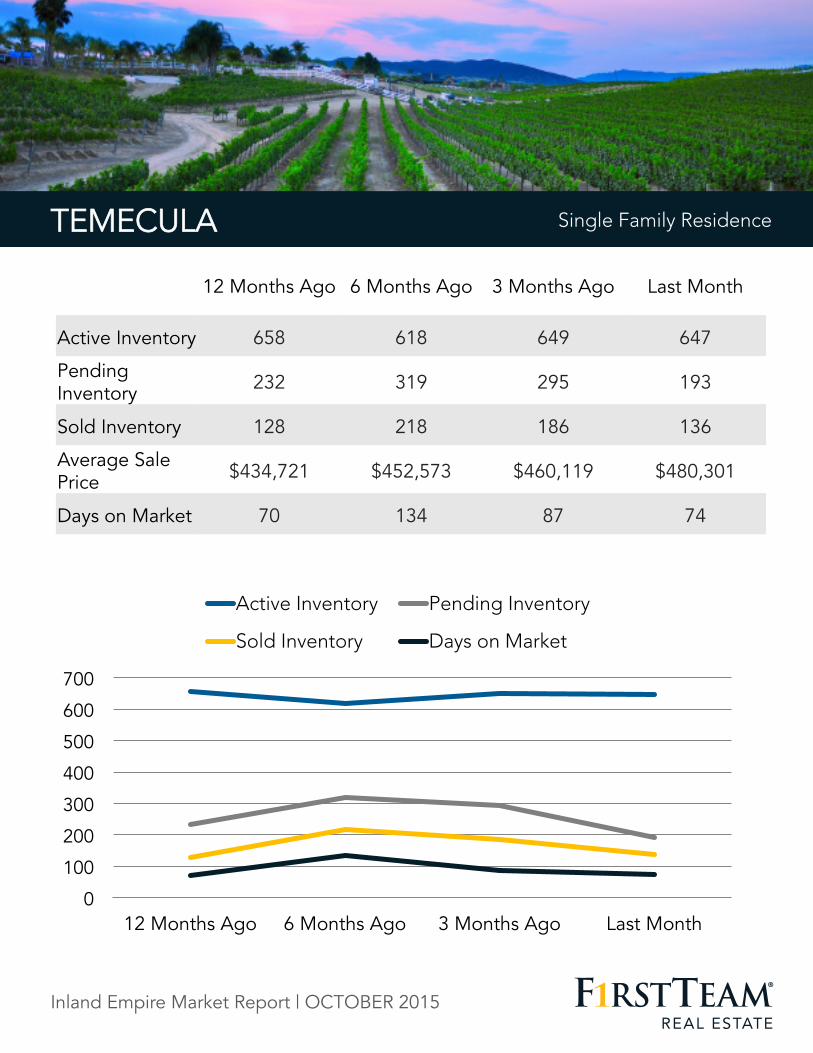
TEMECULA TEMECULA
0
100
200
300
400
500
600
700
12 Months Ago 6 Months Ago 3 Months Ago Last Month
Active Inventory Pending Inventory
Sold Inventory Days on Market
Single Family Residence
12 Months Ago 6 Months Ago 3 Months Ago Last Month
Active Inventory 658 618 649 647
Pending Inventory 232 319 295 193
Sold Inventory 128 218 186 136
Average Sale Price $434,721 $452,573 $460,119 $480,301
Days on Market 70 134 87 74
Inland Empire Market Report | OCTOBER 2015
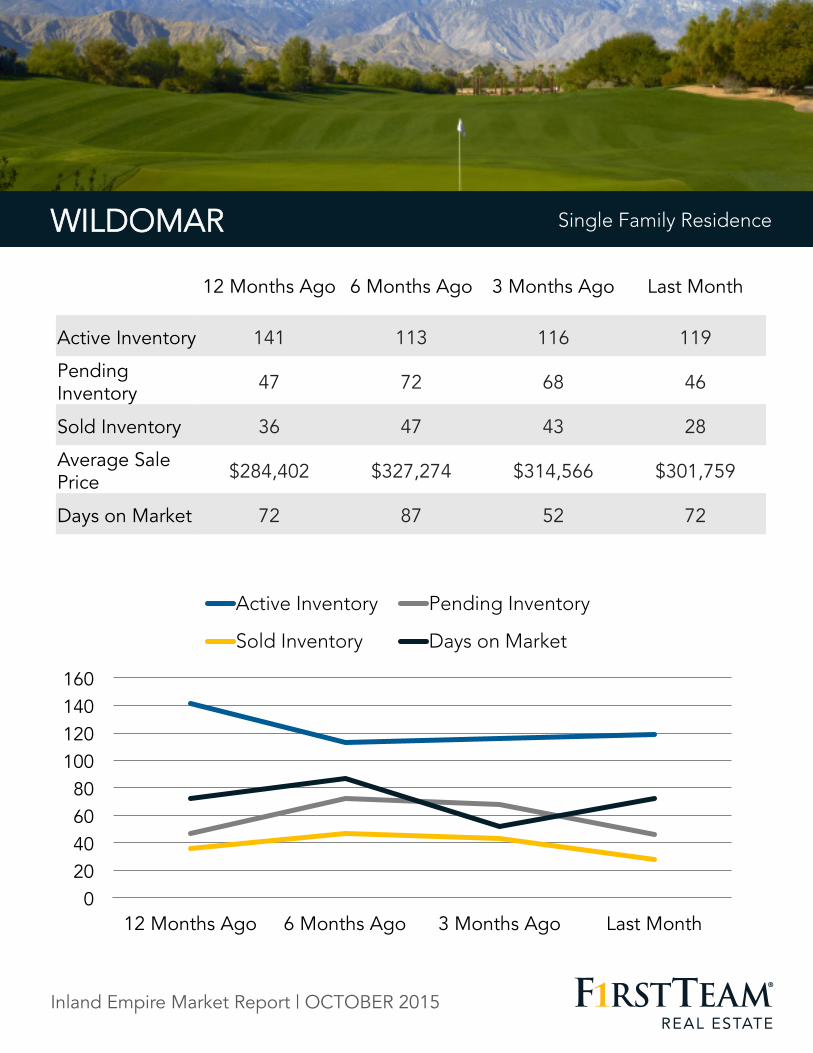
WILDOMAR WILDOMAR
0 20 40 60 80
100 120 140 160
12 Months Ago 6 Months Ago 3 Months Ago Last Month
Active Inventory Pending Inventory
Sold Inventory Days on Market
Single Family Residence
12 Months Ago 6 Months Ago 3 Months Ago Last Month
Active Inventory 141 113 116 119
Pending Inventory 47 72 68 46
Sold Inventory 36 47 43 28
Average Sale Price $284,402 $327,274 $314,566 $301,759
Days on Market 72 87 52 72
Inland Empire Market Report | OCTOBER 2015
ADELANTO
0
20
40
60
80
100
120
140
12 Months Ago 6 Months Ago 3 Months Ago Last Month
Active Inventory Pending Inventory
Sold Inventory Days on Market
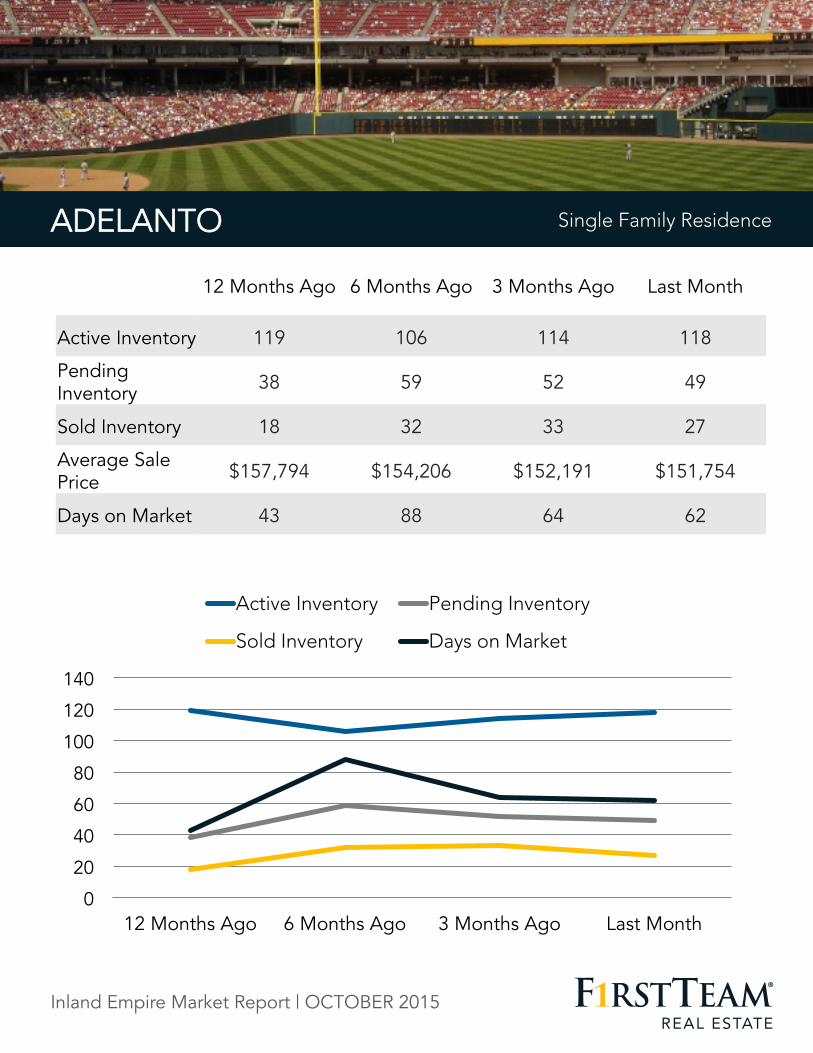
Single Family Residence ADELANTO Single Family Residence
12 Months Ago 6 Months Ago 3 Months Ago Last Month
Active Inventory 119 106 114 118
Pending Inventory 38 59 52 49
Sold Inventory 18 32 33 27
Average Sale Price $157,794 $154,206 $152,191 $151,754
Days on Market 43 88 64 62
Inland Empire Market Report | OCTOBER 2015
APPLE VALLEY
0 50
100 150 200 250 300 350 400
12 Months Ago 6 Months Ago 3 Months Ago Last Month
Active Inventory Pending Inventory
Sold Inventory Days on Market
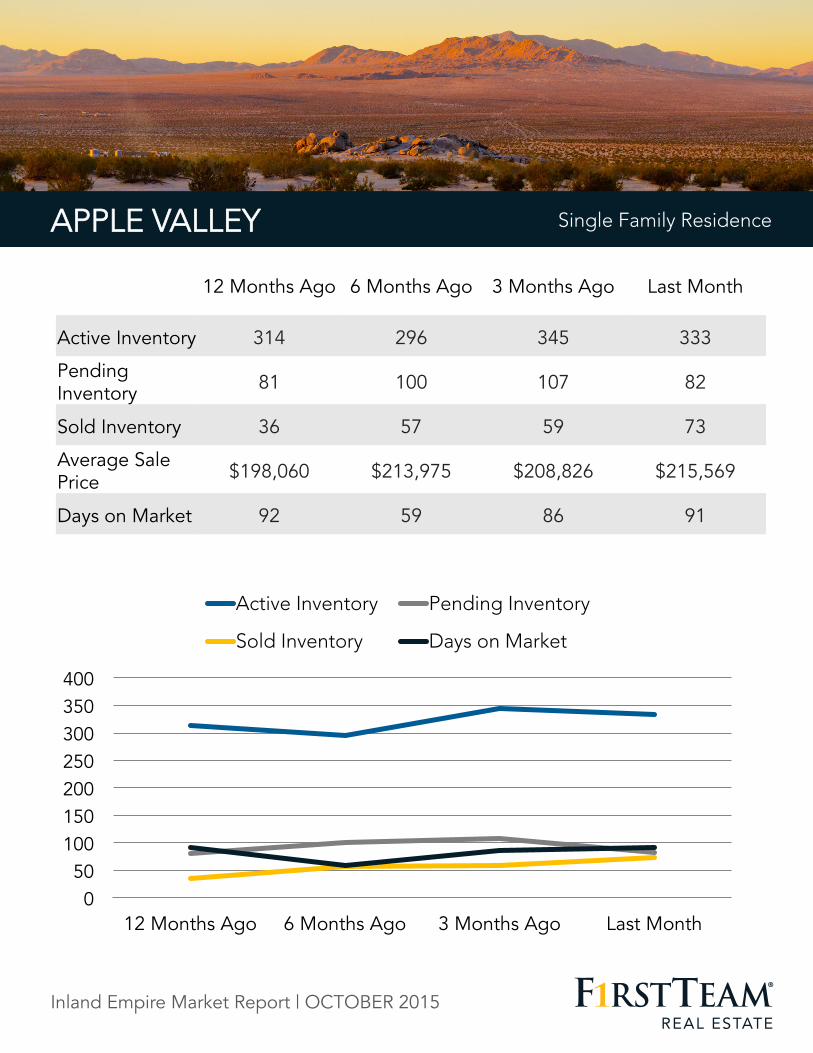
Single Family Residence APPLE VALLEY Single Family Residence
12 Months Ago 6 Months Ago 3 Months Ago Last Month
Active Inventory 314 296 345 333
Pending Inventory 81 100 107 82
Sold Inventory 36 57 59 73
Average Sale Price $198,060 $213,975 $208,826 $215,569
Days on Market 92 59 86 91
Inland Empire Market Report | OCTOBER 2015
BARSTOW
0
40
80
120
160
200
240
280
12 Months Ago 6 Months Ago 3 Months Ago Last Month
Active Inventory Pending Inventory
Sold Inventory Days on Market
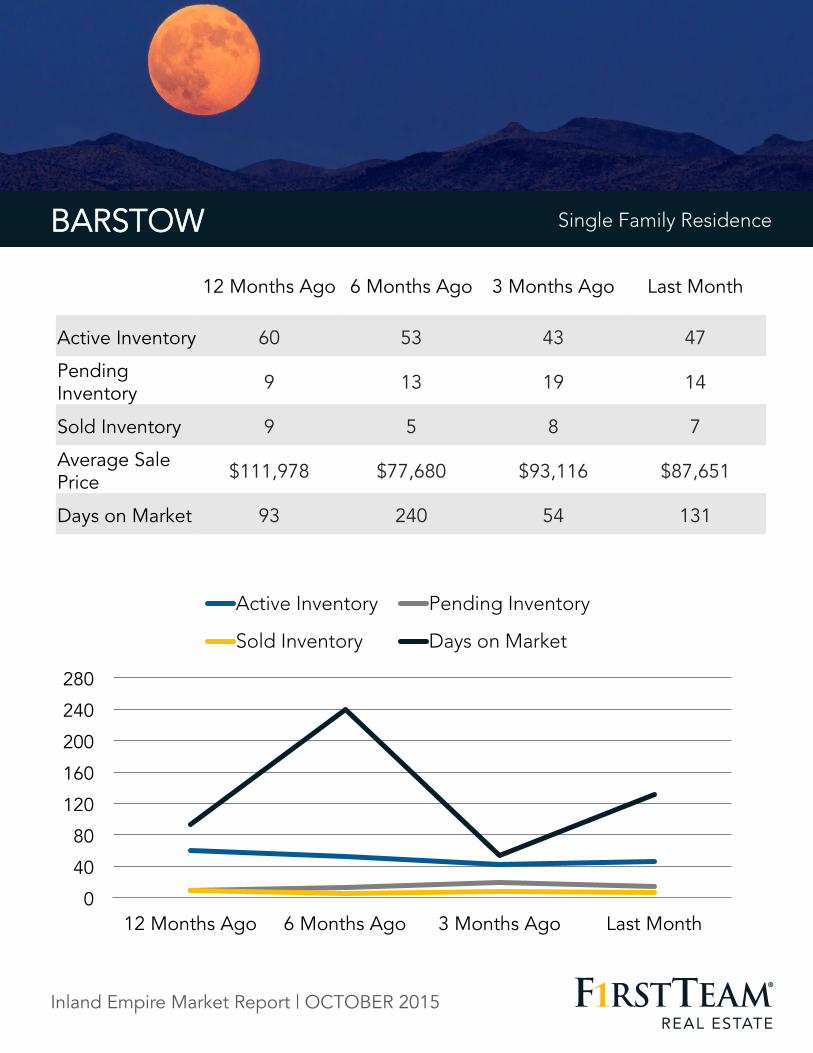
Single Family Residence BARSTOW Single Family Residence
12 Months Ago 6 Months Ago 3 Months Ago Last Month
Active Inventory 60 53 43 47
Pending Inventory 9 13 19 14
Sold Inventory 9 5 8 7
Average Sale Price $111,978 $77,680 $93,116 $87,651
Days on Market 93 240 54 131
Inland Empire Market Report | OCTOBER 2015
CHINO
0
45
90
135
180
225
270
12 Months Ago 6 Months Ago 3 Months Ago Last Month
Active Inventory Pending Inventory
Sold Inventory Days on Market
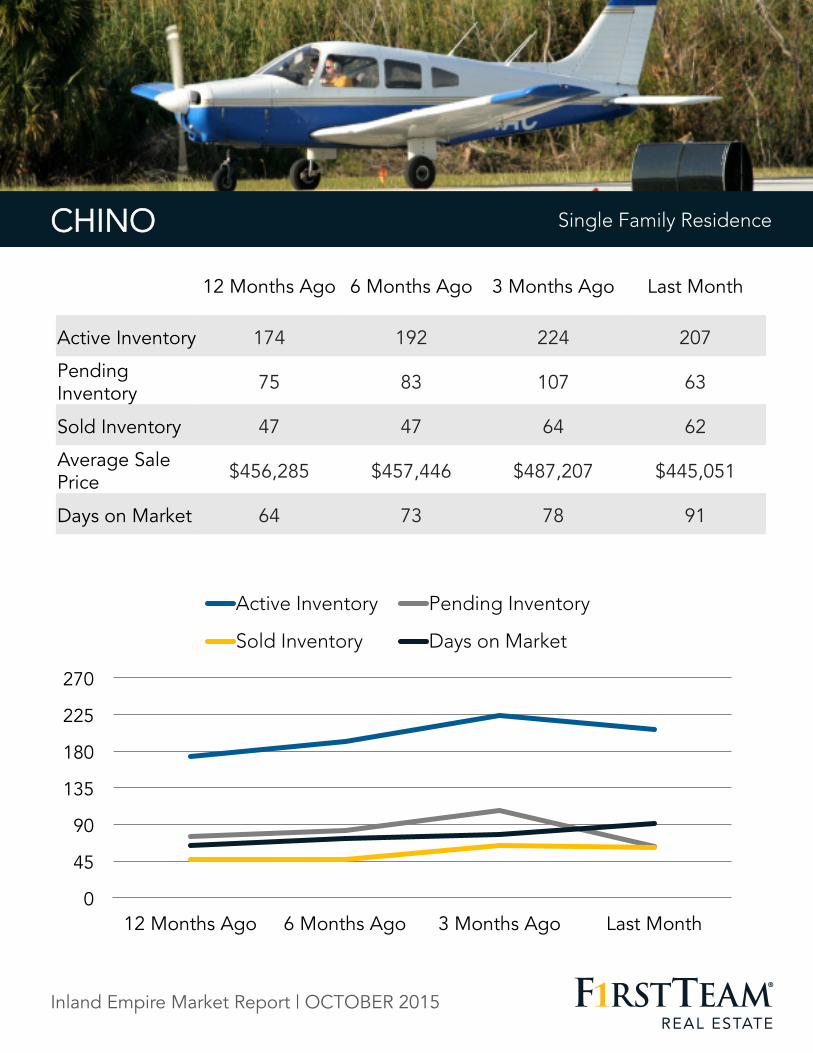
Single Family Residence CHINO Single Family Residence
12 Months Ago 6 Months Ago 3 Months Ago Last Month
Active Inventory 174 192 224 207
Pending Inventory 75 83 107 63
Sold Inventory 47 47 64 62
Average Sale Price $456,285 $457,446 $487,207 $445,051
Days on Market 64 73 78 91
Inland Empire Market Report | OCTOBER 2015
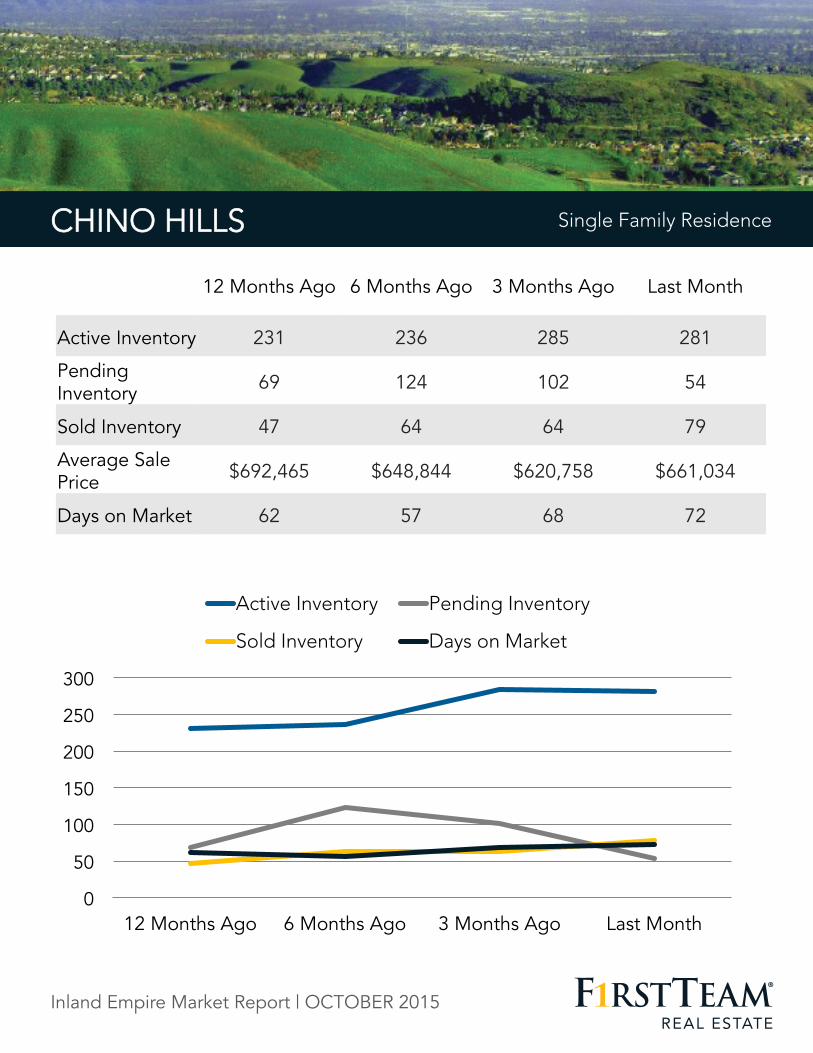
CHINO HILLS
0
50
100
150
200
250
300
12 Months Ago 6 Months Ago 3 Months Ago Last Month
Active Inventory Pending Inventory
Sold Inventory Days on Market
Single Family Residence CHINO HILLS Single Family Residence
12 Months Ago 6 Months Ago 3 Months Ago Last Month
Active Inventory 231 236 285 281
Pending Inventory 69 124 102 54
Sold Inventory 47 64 64 79
Average Sale Price $692,465 $648,844 $620,758 $661,034
Days on Market 62 57 68 72
Inland Empire Market Report | OCTOBER 2015
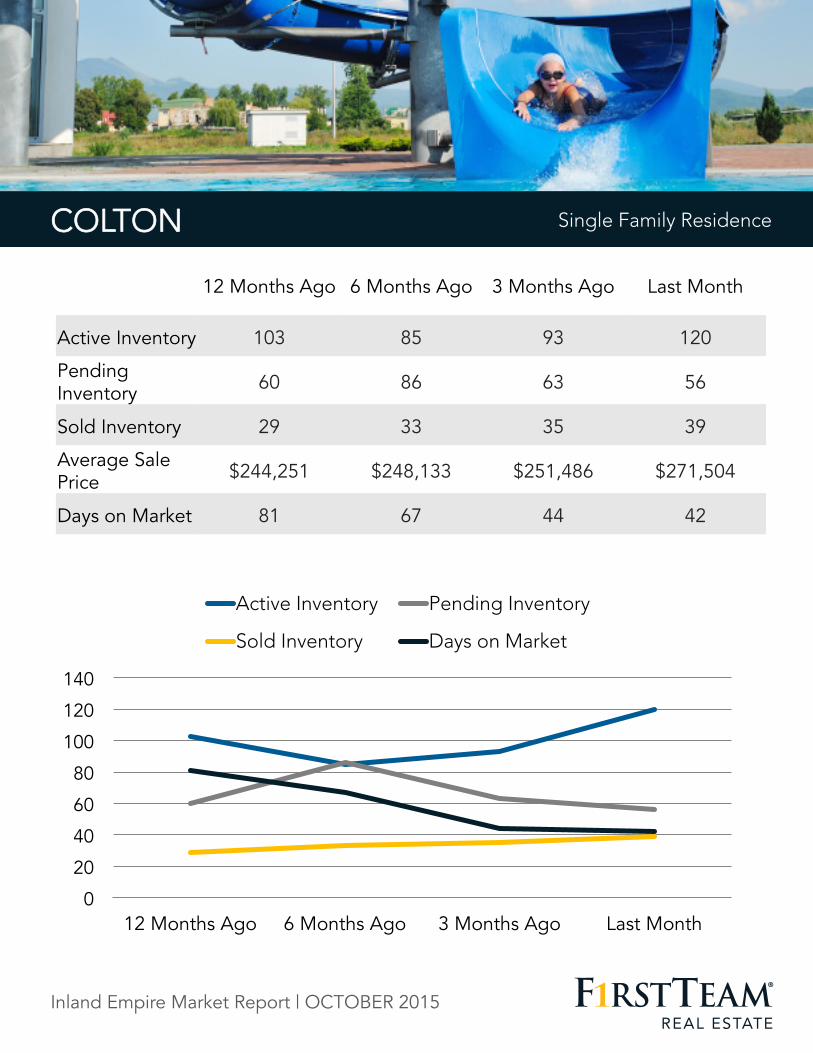
COLTON
0
20
40
60
80
100
120
140
12 Months Ago 6 Months Ago 3 Months Ago Last Month
Active Inventory Pending Inventory
Sold Inventory Days on Market
Single Family Residence COLTON Single Family Residence
12 Months Ago 6 Months Ago 3 Months Ago Last Month
Active Inventory 103 85 93 120
Pending Inventory 60 86 63 56
Sold Inventory 29 33 35 39
Average Sale Price $244,251 $248,133 $251,486 $271,504
Days on Market 81 67 44 42
Inland Empire Market Report | OCTOBER 2015
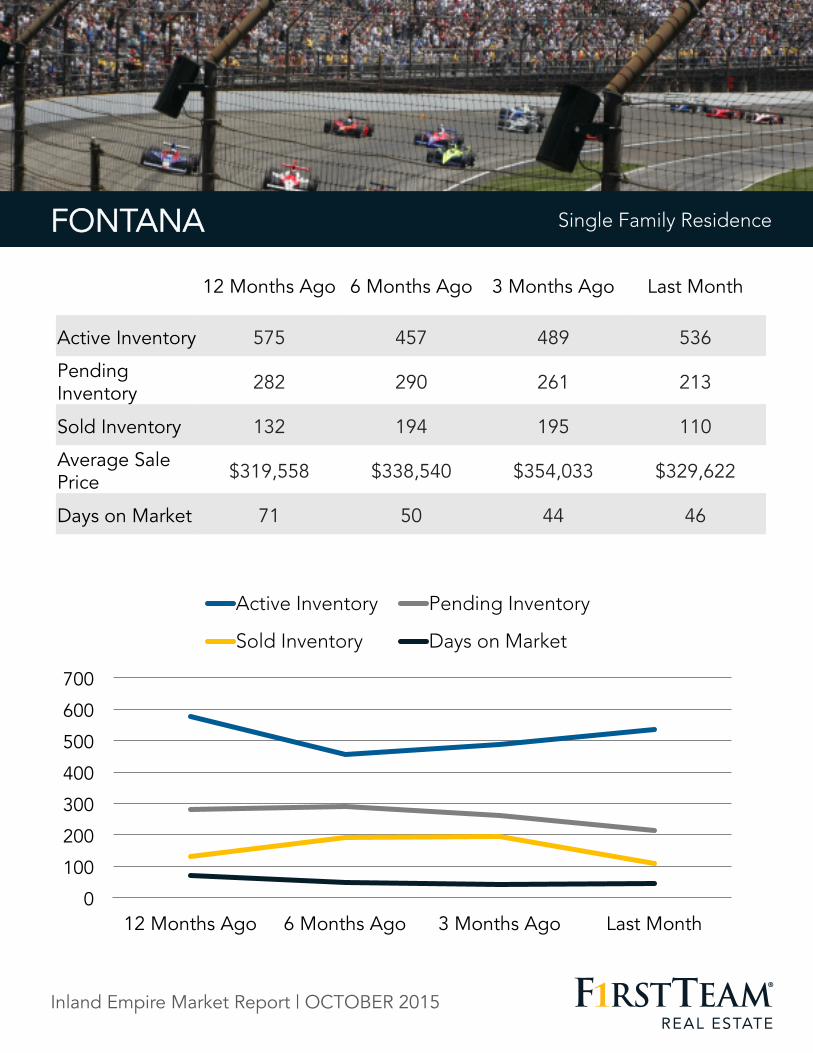
FONTANA
0
100
200
300
400
500
600
700
12 Months Ago 6 Months Ago 3 Months Ago Last Month
Active Inventory Pending Inventory
Sold Inventory Days on Market
Single Family Residence FONTANA Single Family Residence
12 Months Ago 6 Months Ago 3 Months Ago Last Month
Active Inventory 575 457 489 536
Pending Inventory 282 290 261 213
Sold Inventory 132 194 195 110
Average Sale Price $319,558 $338,540 $354,033 $329,622
Days on Market 71 50 44 46
Inland Empire Market Report | OCTOBER 2015
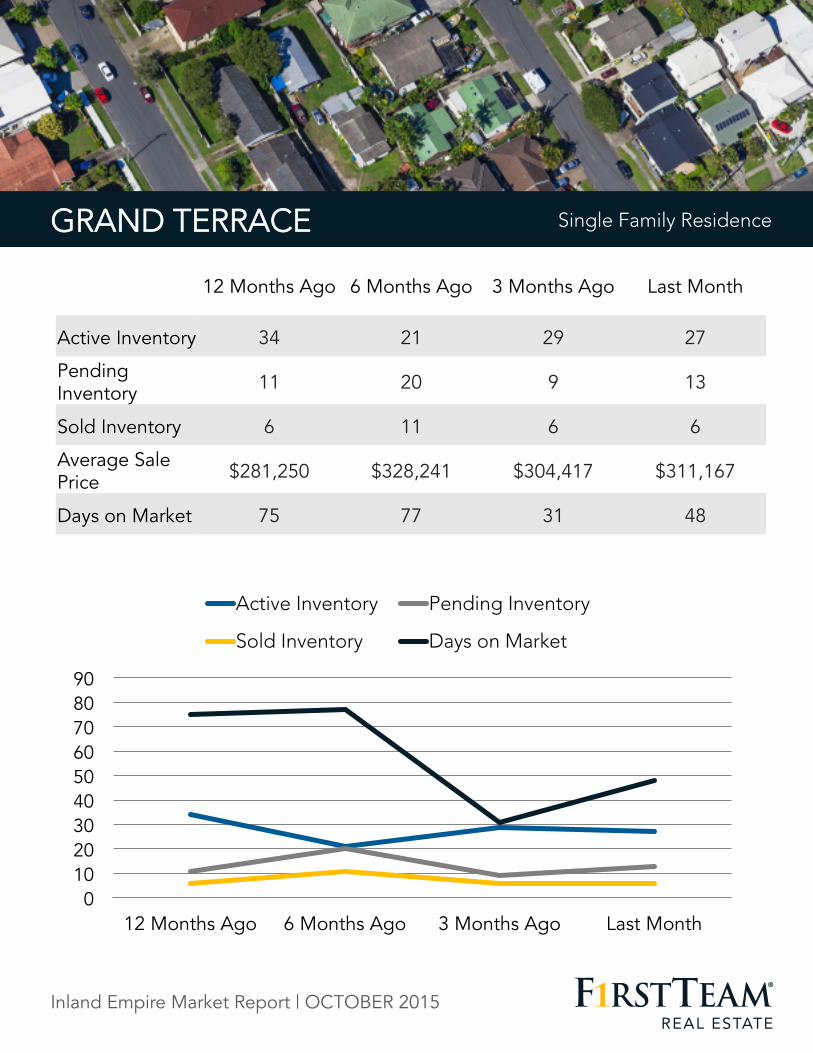
GRAND TERRACE
0 10 20 30 40 50 60 70 80 90
12 Months Ago 6 Months Ago 3 Months Ago Last Month
Active Inventory Pending Inventory
Sold Inventory Days on Market
Single Family Residence GRAND TERRACE Single Family Residence
12 Months Ago 6 Months Ago 3 Months Ago Last Month
Active Inventory 34 21 29 27
Pending Inventory 11 20 9 13
Sold Inventory 6 11 6 6
Average Sale Price $281,250 $328,241 $304,417 $311,167
Days on Market 75 77 31 48
Inland Empire Market Report | OCTOBER 2015
HESPERIA
0 40 80
120 160 200 240 280 320
12 Months Ago 6 Months Ago 3 Months Ago Last Month
Active Inventory Pending Inventory
Sold Inventory Days on Market
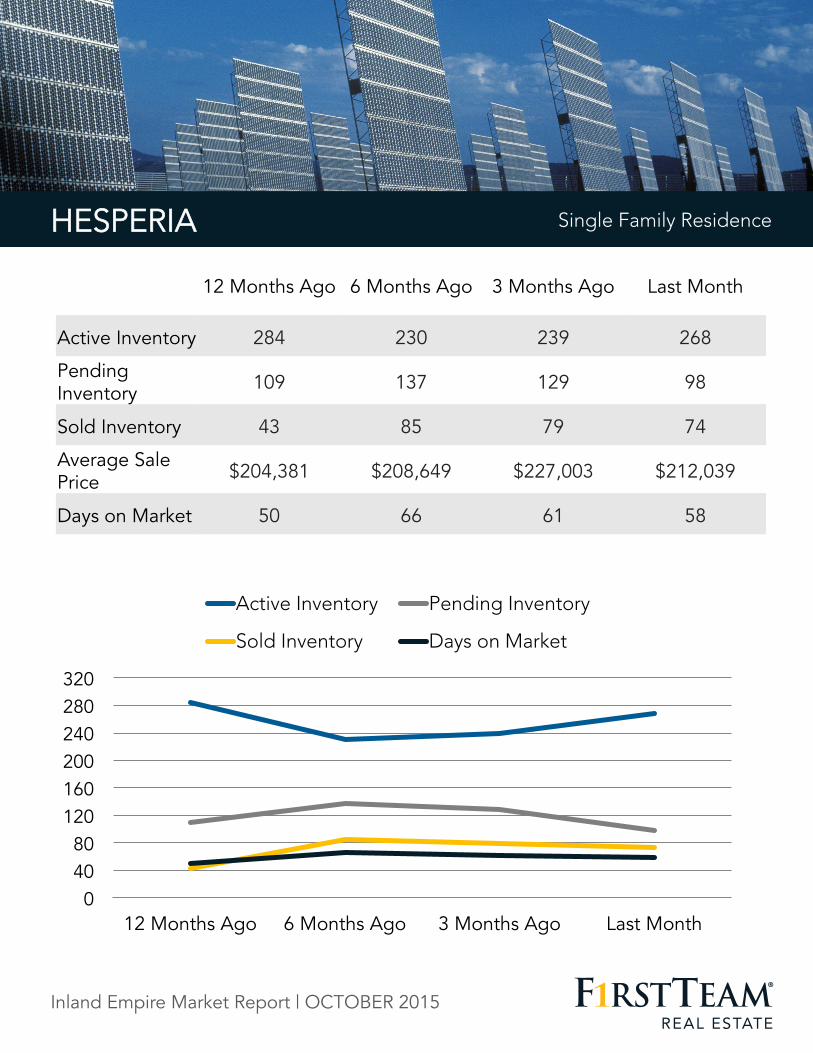
Single Family Residence HESPERIA Single Family Residence
12 Months Ago 6 Months Ago 3 Months Ago Last Month
Active Inventory 284 230 239 268
Pending Inventory 109 137 129 98
Sold Inventory 43 85 79 74
Average Sale Price $204,381 $208,649 $227,003 $212,039
Days on Market 50 66 61 58
Inland Empire Market Report | OCTOBER 2015
HIGHLAND
0 20 40 60 80
100 120 140 160
12 Months Ago 6 Months Ago 3 Months Ago Last Month
Active Inventory Pending Inventory
Sold Inventory Days on Market
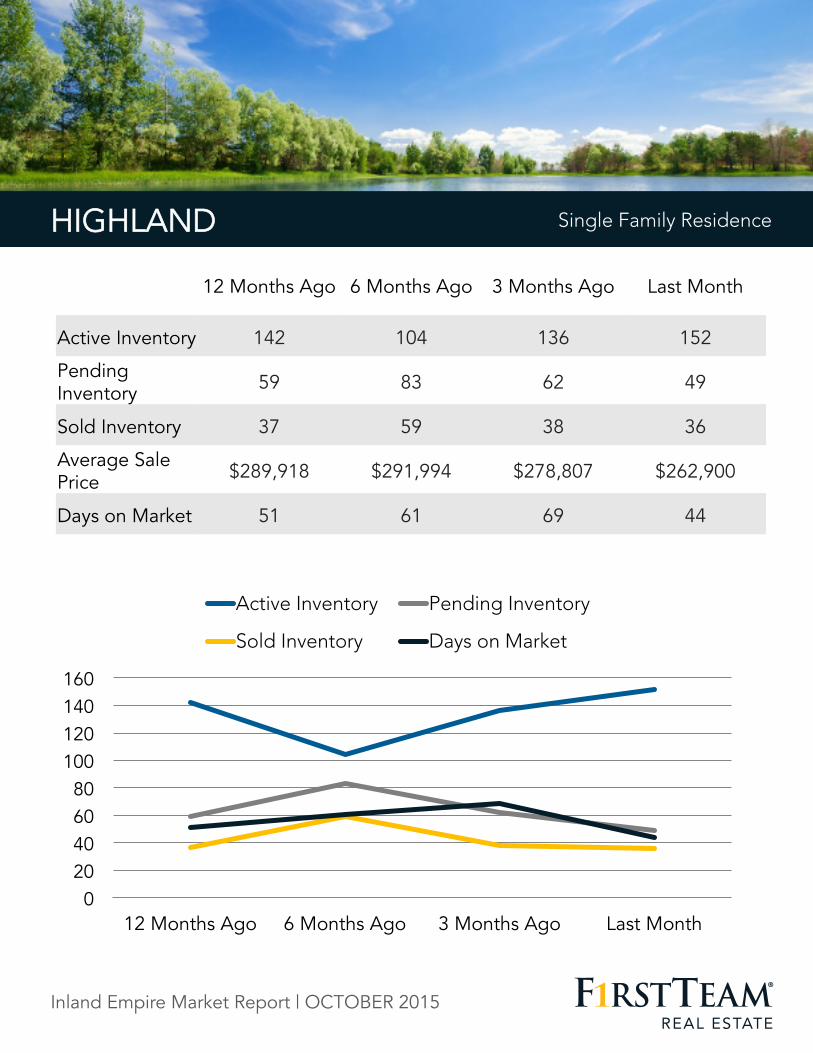
Single Family Residence HIGHLAND Single Family Residence
12 Months Ago 6 Months Ago 3 Months Ago Last Month
Active Inventory 142 104 136 152
Pending Inventory 59 83 62 49
Sold Inventory 37 59 38 36
Average Sale Price $289,918 $291,994 $278,807 $262,900
Days on Market 51 61 69 44
Inland Empire Market Report | OCTOBER 2015
LOMA LINDA
0 20 40 60 80
100 120 140 160
12 Months Ago 6 Months Ago 3 Months Ago Last Month
Active Inventory Pending Inventory
Sold Inventory Days on Market
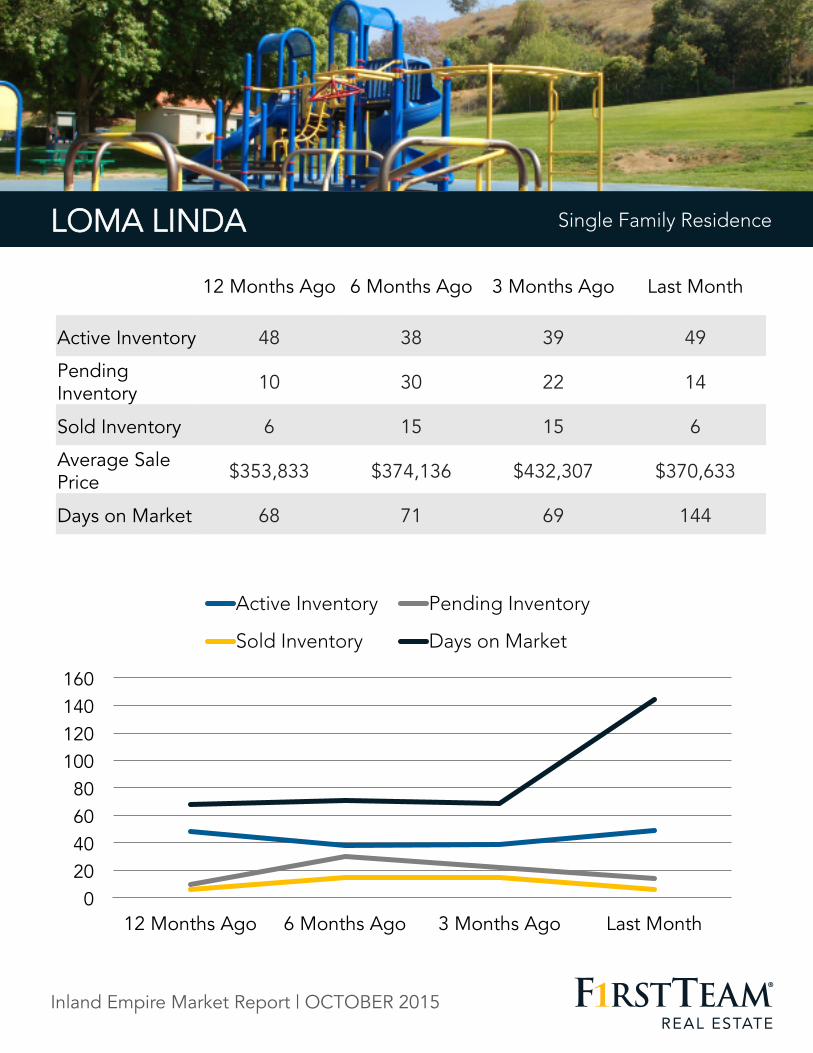
Single Family Residence LOMA LINDA Single Family Residence
12 Months Ago 6 Months Ago 3 Months Ago Last Month
Active Inventory 48 38 39 49
Pending Inventory 10 30 22 14
Sold Inventory 6 15 15 6
Average Sale Price $353,833 $374,136 $432,307 $370,633
Days on Market 68 71 69 144
Inland Empire Market Report | OCTOBER 2015
MONTCLAIR
0 10 20 30 40 50 60 70 80
12 Months Ago 6 Months Ago 3 Months Ago Last Month
Active Inventory Pending Inventory
Sold Inventory Days on Market
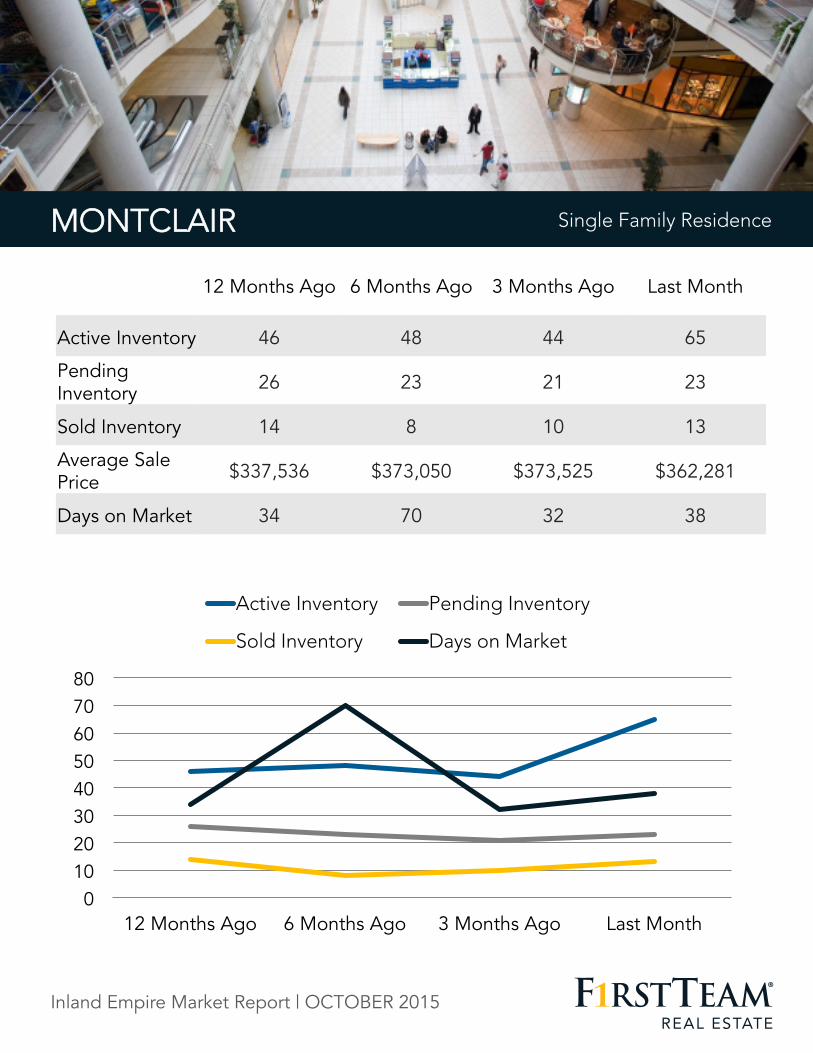
Single Family Residence MONTCLAIR Single Family Residence
12 Months Ago 6 Months Ago 3 Months Ago Last Month
Active Inventory 46 48 44 65
Pending Inventory 26 23 21 23
Sold Inventory 14 8 10 13
Average Sale Price $337,536 $373,050 $373,525 $362,281
Days on Market 34 70 32 38
Inland Empire Market Report | OCTOBER 2015
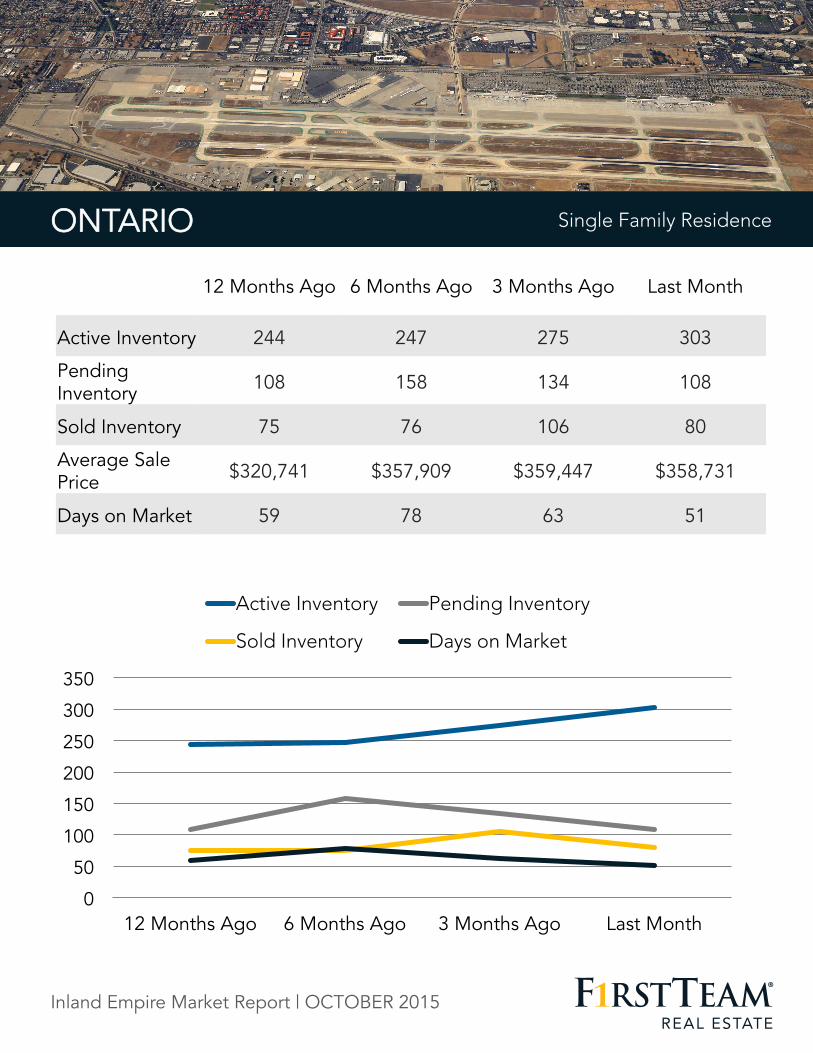
ONTARIO
0
50
100
150
200
250
300
350
12 Months Ago 6 Months Ago 3 Months Ago Last Month
Active Inventory Pending Inventory
Sold Inventory Days on Market
Single Family Residence ONTARIO Single Family Residence
12 Months Ago 6 Months Ago 3 Months Ago Last Month
Active Inventory 244 247 275 303
Pending Inventory 108 158 134 108
Sold Inventory 75 76 106 80
Average Sale Price $320,741 $357,909 $359,447 $358,731
Days on Market 59 78 63 51
Inland Empire Market Report | OCTOBER 2015
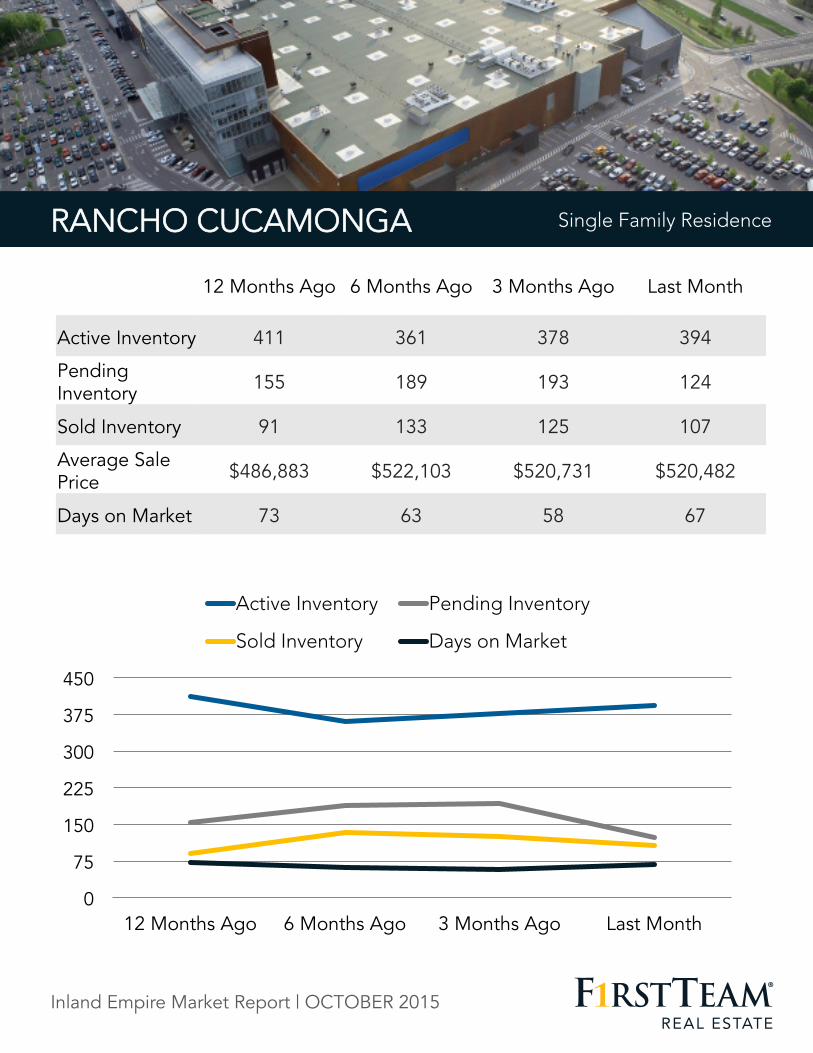
RANCHO CUCAMONGA
0
75
150
225
300
375
450
12 Months Ago 6 Months Ago 3 Months Ago Last Month
Active Inventory Pending Inventory
Sold Inventory Days on Market
Single Family Residence RANCHO CUCAMONGA Single Family Residence
12 Months Ago 6 Months Ago 3 Months Ago Last Month
Active Inventory 411 361 378 394
Pending Inventory 155 189 193 124
Sold Inventory 91 133 125 107
Average Sale Price $486,883 $522,103 $520,731 $520,482
Days on Market 73 63 58 67
Inland Empire Market Report | OCTOBER 2015
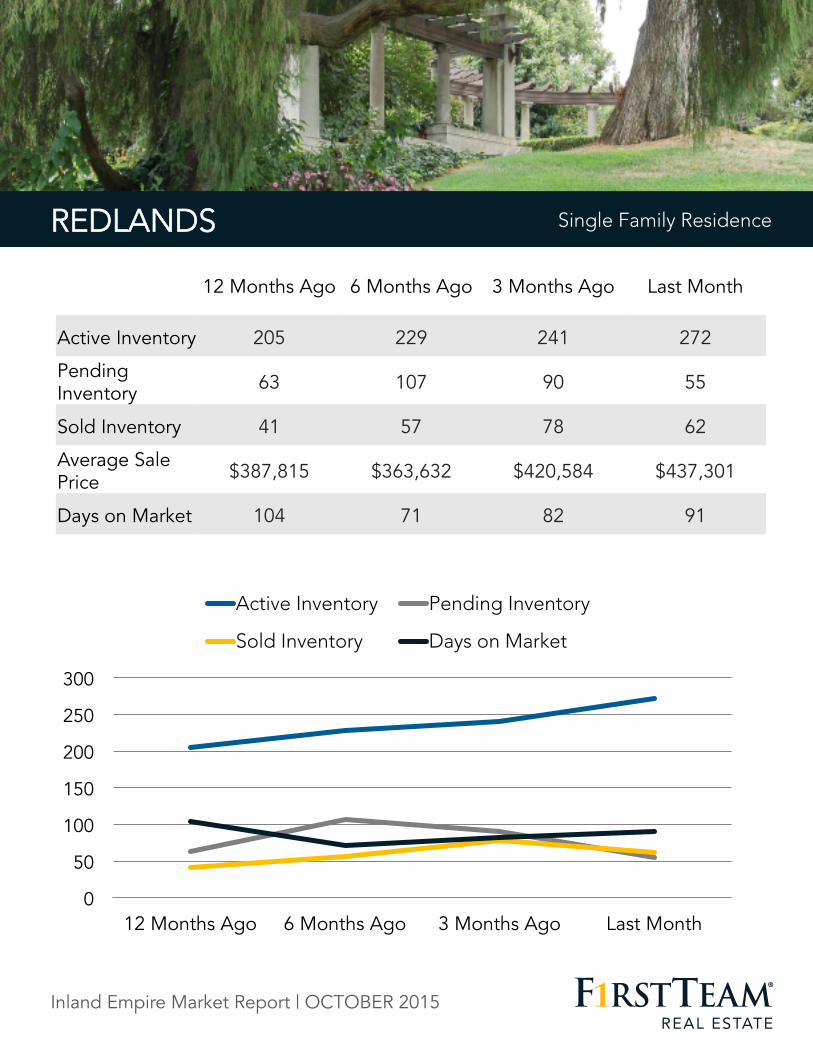
REDLANDS
0
50
100
150
200
250
300
12 Months Ago 6 Months Ago 3 Months Ago Last Month
Active Inventory Pending Inventory
Sold Inventory Days on Market
Single Family Residence REDLANDS Single Family Residence
12 Months Ago 6 Months Ago 3 Months Ago Last Month
Active Inventory 205 229 241 272
Pending Inventory 63 107 90 55
Sold Inventory 41 57 78 62
Average Sale Price $387,815 $363,632 $420,584 $437,301
Days on Market 104 71 82 91
Inland Empire Market Report | OCTOBER 2015
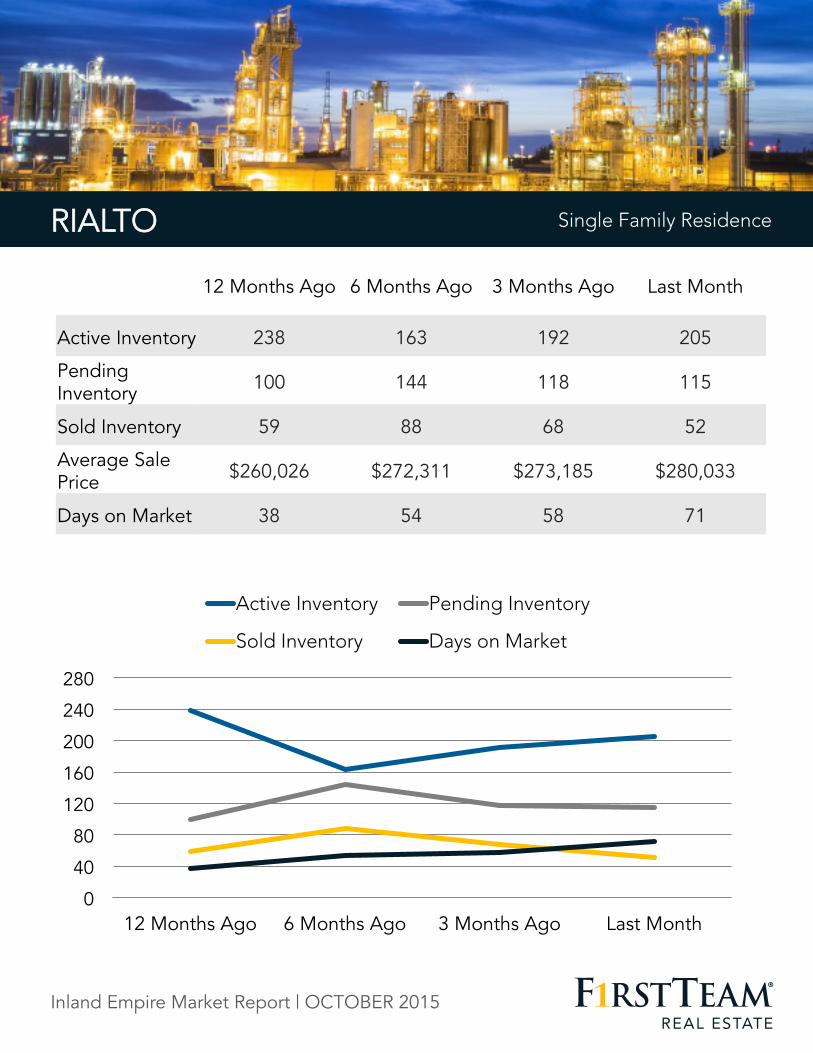
RIALTO
0
40
80
120
160
200
240
280
12 Months Ago 6 Months Ago 3 Months Ago Last Month
Active Inventory Pending Inventory
Sold Inventory Days on Market
Single Family Residence RIALTO Single Family Residence
12 Months Ago 6 Months Ago 3 Months Ago Last Month
Active Inventory 238 163 192 205
Pending Inventory 100 144 118 115
Sold Inventory 59 88 68 52
Average Sale Price $260,026 $272,311 $273,185 $280,033
Days on Market 38 54 58 71
Inland Empire Market Report | OCTOBER 2015
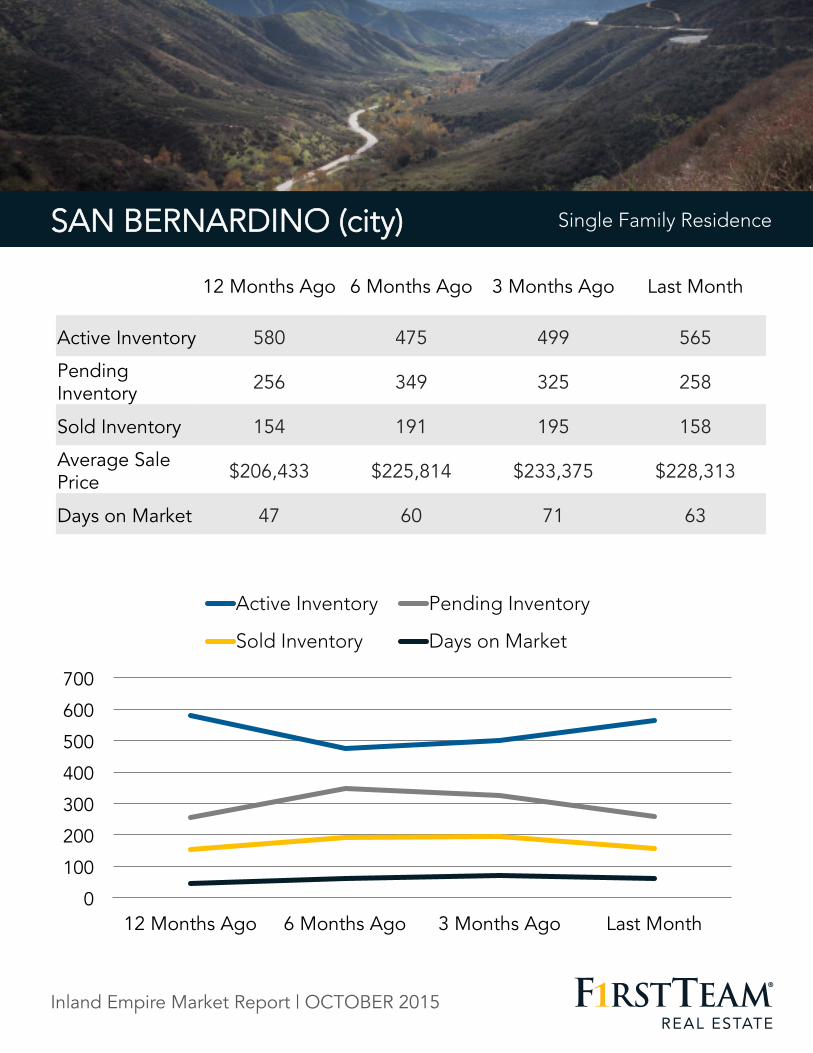
SAN BERNARDINO (city)
0
100
200
300
400
500
600
700
12 Months Ago 6 Months Ago 3 Months Ago Last Month
Active Inventory Pending Inventory
Sold Inventory Days on Market
Single Family Residence SAN BERNARDINO (city) Single Family Residence
12 Months Ago 6 Months Ago 3 Months Ago Last Month
Active Inventory 580 475 499 565
Pending Inventory 256 349 325 258
Sold Inventory 154 191 195 158
Average Sale Price $206,433 $225,814 $233,375 $228,313
Days on Market 47 60 71 63
Inland Empire Market Report | OCTOBER 2015
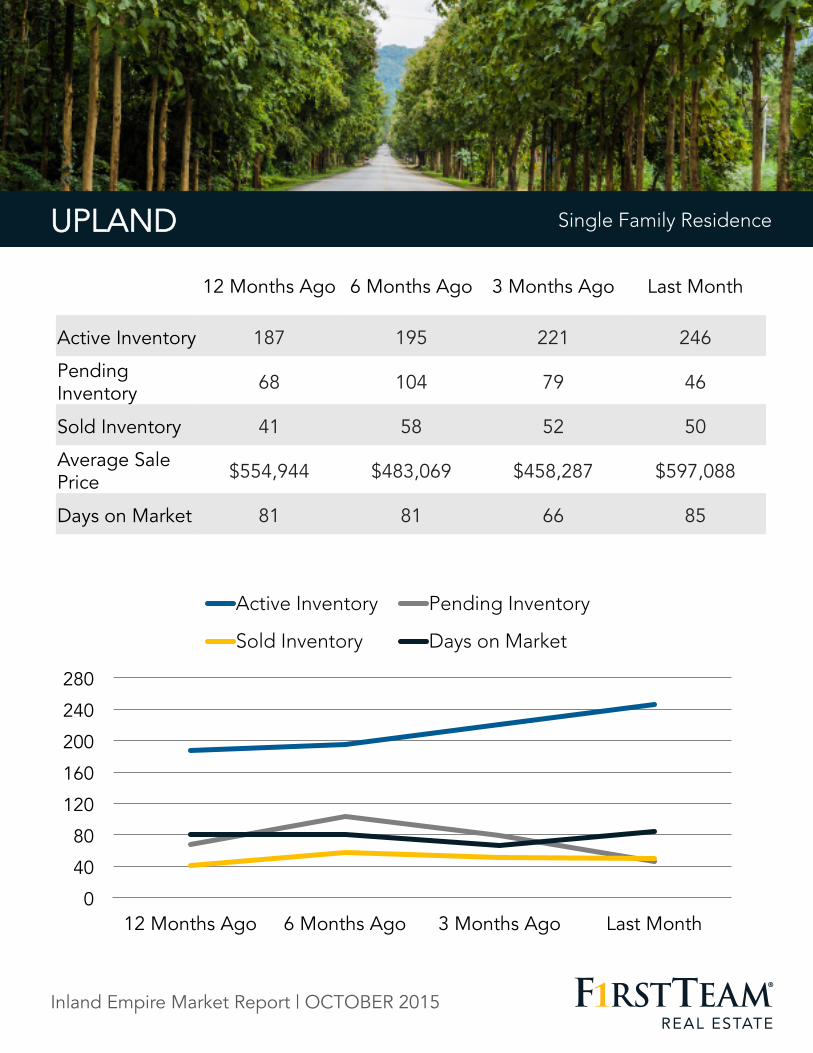
UPLAND
0
40
80
120
160
200
240
280
12 Months Ago 6 Months Ago 3 Months Ago Last Month
Active Inventory Pending Inventory
Sold Inventory Days on Market
Single Family Residence UPLAND Single Family Residence
12 Months Ago 6 Months Ago 3 Months Ago Last Month
Active Inventory 187 195 221 246
Pending Inventory 68 104 79 46
Sold Inventory 41 58 52 50
Average Sale Price $554,944 $483,069 $458,287 $597,088
Days on Market 81 81 66 85
Inland Empire Market Report | OCTOBER 2015
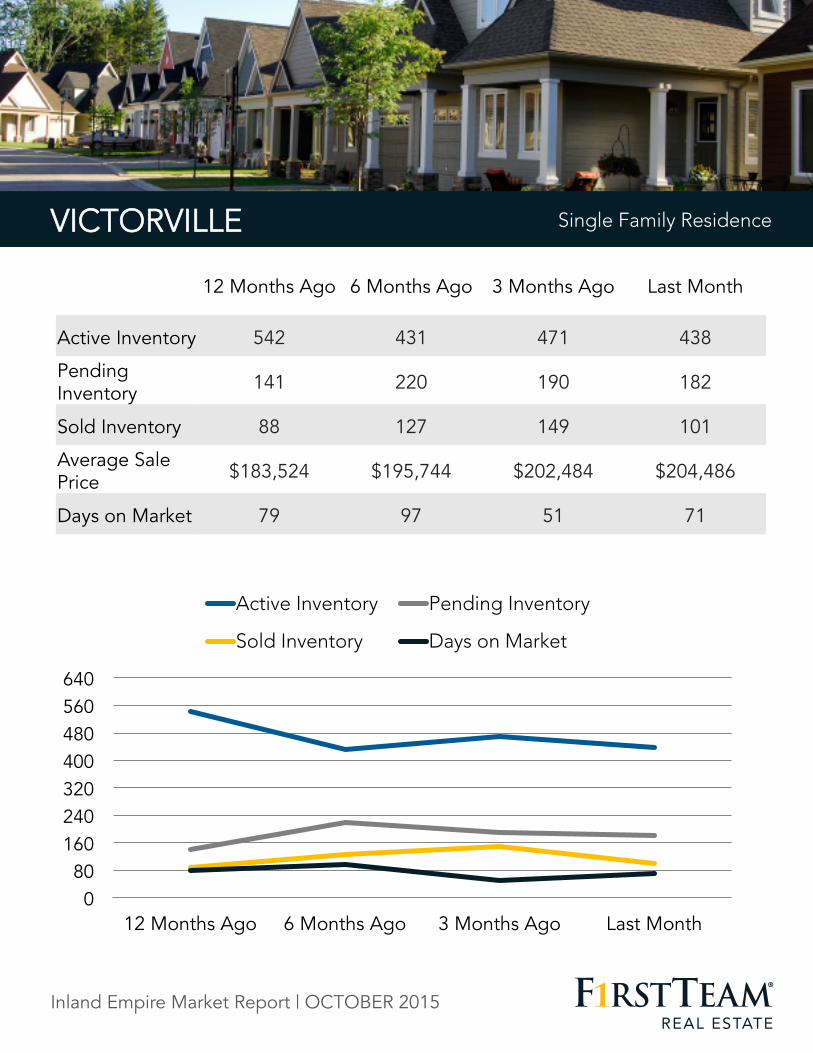
VICTORVILLE
0 80
160 240 320 400 480 560 640
12 Months Ago 6 Months Ago 3 Months Ago Last Month
Active Inventory Pending Inventory
Sold Inventory Days on Market
Single Family Residence VICTORVILLE Single Family Residence
12 Months Ago 6 Months Ago 3 Months Ago Last Month
Active Inventory 542 431 471 438
Pending Inventory 141 220 190 182
Sold Inventory 88 127 149 101
Average Sale Price $183,524 $195,744 $202,484 $204,486
Days on Market 79 97 51 71
Inland Empire Market Report | OCTOBER 2015
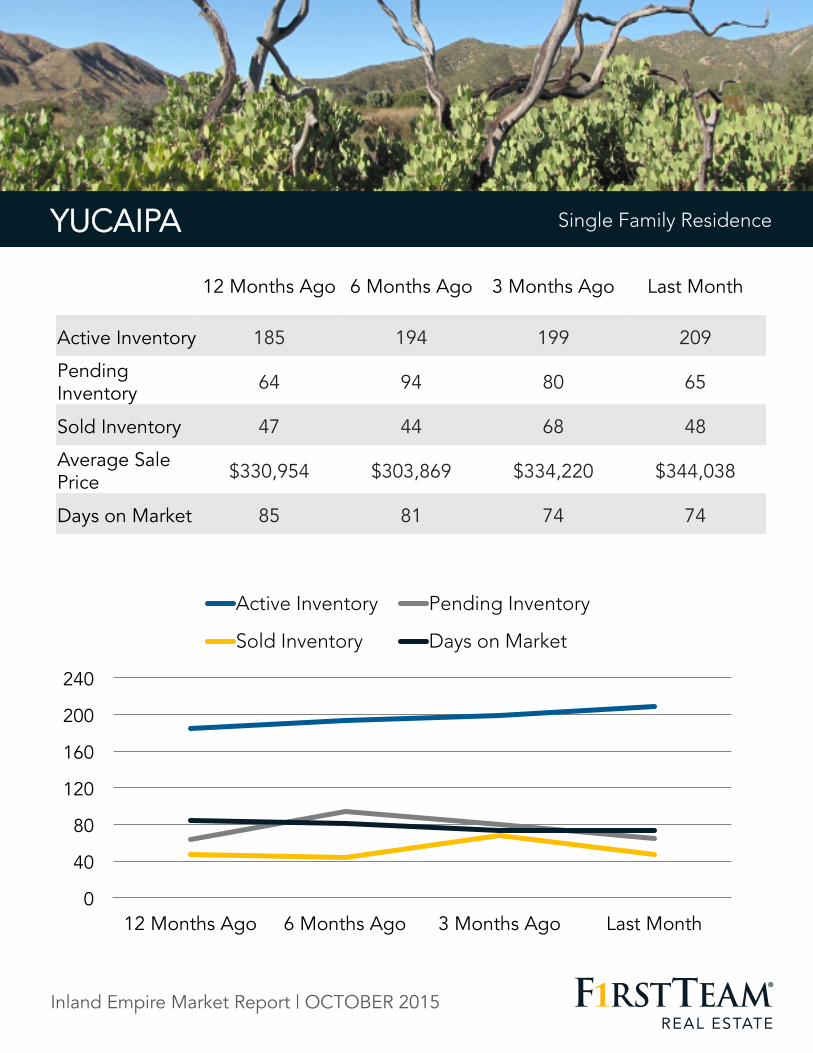
YUCAIPA
0
40
80
120
160
200
240
12 Months Ago 6 Months Ago 3 Months Ago Last Month
Active Inventory Pending Inventory
Sold Inventory Days on Market
Single Family Residence YUCAIPA Single Family Residence
12 Months Ago 6 Months Ago 3 Months Ago Last Month
Active Inventory 185 194 199 209
Pending Inventory 64 94 80 65
Sold Inventory 47 44 68 48
Average Sale Price $330,954 $303,869 $334,220 $344,038
Days on Market 85 81 74 74
Inland Empire Market Report | OCTOBER 2015
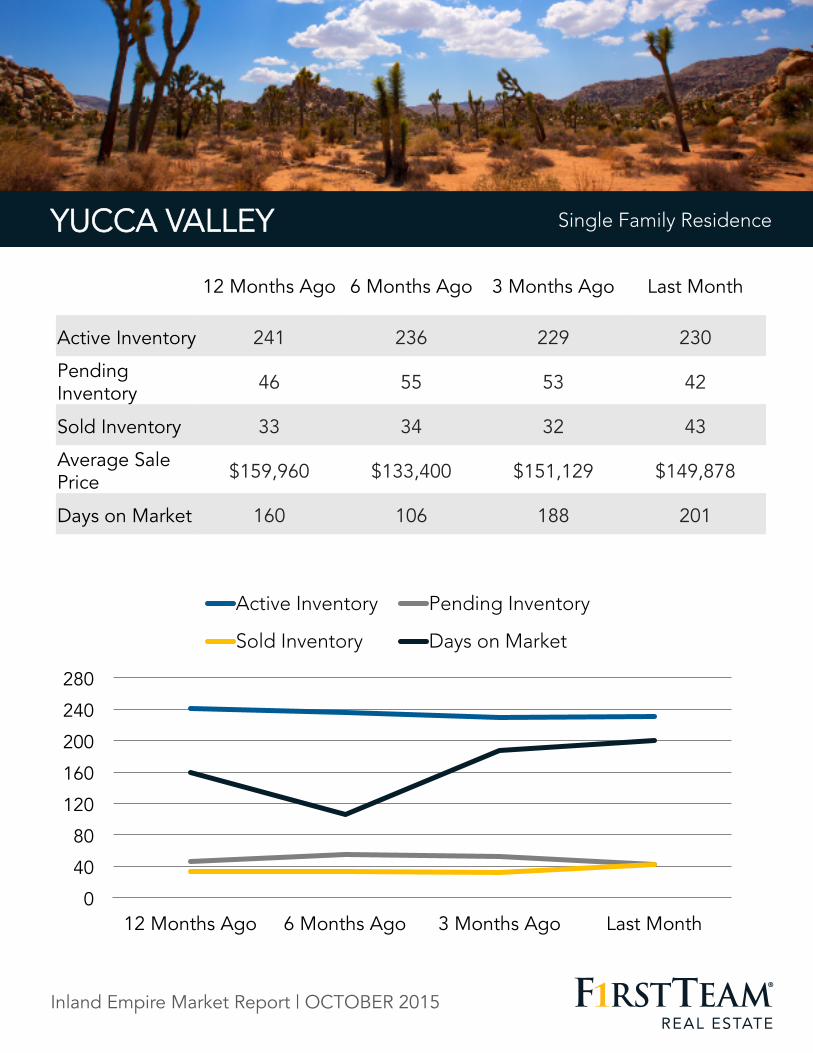
YUCCA VALLEY
0
40
80
120
160
200
240
280
12 Months Ago 6 Months Ago 3 Months Ago Last Month
Active Inventory Pending Inventory
Sold Inventory Days on Market
Single Family Residence YUCCA VALLEY Single Family Residence
12 Months Ago 6 Months Ago 3 Months Ago Last Month
Active Inventory 241 236 229 230
Pending Inventory 46 55 53 42
Sold Inventory 33 34 32 43
Average Sale Price $159,960 $133,400 $151,129 $149,878
Days on Market 160 106 188 201
Inland Empire Market Report | OCTOBER 2015

Contact one of our local neighborhood experts for more exclusive market data, or to help you get started with buying or selling your next home.
Email: [email protected]
Phone: 888-870-1142
Web: FirstTeam.com
Connect With Us!
WANT MORE INFO?
Inland Empire Market Report | OCTOBER 2015