Embed Size (px)
Citation preview
REGIONAL INTELLIGENCE REPORT
1
REGIONAL INTELLIGENCE REPORTINLAND EMPIRE
Summer 2021
INLAND EMPIRE | REGIONAL INTELLIGENCE REPORT
2
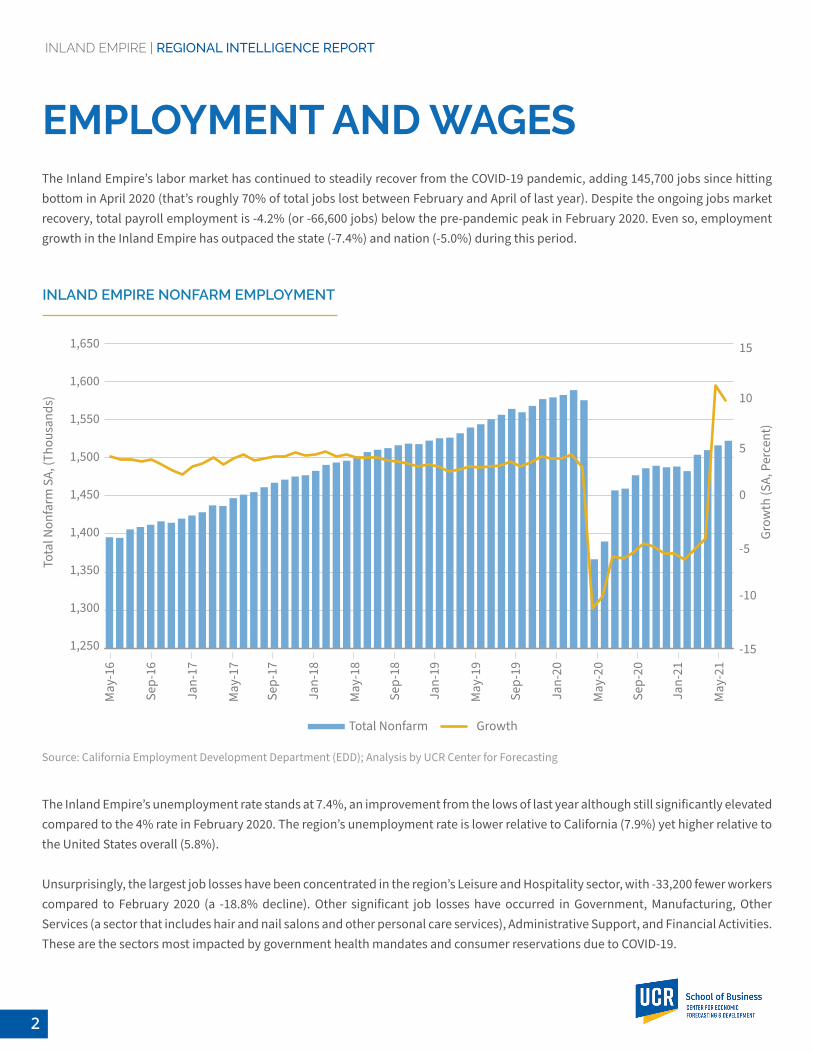
The Inland Empire’s labor market has continued to steadily recover from the COVID-19 pandemic, adding 145,700 jobs since hitting bottom in April 2020 (that’s roughly 70% of total jobs lost between February and April of last year). Despite the ongoing jobs market recovery, total payroll employment is -4.2% (or -66,600 jobs) below the pre-pandemic peak in February 2020. Even so, employment growth in the Inland Empire has outpaced the state (-7.4%) and nation (-5.0%) during this period.
The Inland Empire’s unemployment rate stands at 7.4%, an improvement from the lows of last year although still significantly elevated compared to the 4% rate in February 2020. The region’s unemployment rate is lower relative to California (7.9%) yet higher relative to the United States overall (5.8%).
Unsurprisingly, the largest job losses have been concentrated in the region’s Leisure and Hospitality sector, with -33,200 fewer workers compared to February 2020 (a -18.8% decline). Other significant job losses have occurred in Government, Manufacturing, Other Services (a sector that includes hair and nail salons and other personal care services), Administrative Support, and Financial Activities. These are the sectors most impacted by government health mandates and consumer reservations due to COVID-19.
EMPLOYMENT AND WAGES
1,250
Tota
l Non
farm
SA,
(Tho
usan
ds)
May
-16
Jan-
17
Jan-
18
Jan-
19
Jan-
20
Jan-
21
Sep-
16
Sep-
17
Sep-
18
Sep-
19
Sep-
20
May
-17
May
-18
May
-19
May
-20
May
-21
1,650
1,600
1,500
1,400
1,300
1,550
1,450
1,350
Grow
th (S
A, P
erce
nt)
15
10
5
-5
0
-10
-15
INLAND EMPIRE NONFARM EMPLOYMENT
Source: California Employment Development Department (EDD); Analysis by UCR Center for Forecasting
Total Nonfarm Growth
INLAND EMPIRE | REGIONAL INTELLIGENCE REPORT
3
Still, it’s important to remember that people stopped eating at restaurants and attending events and conventions in 2020 not because they couldn’t afford it, but because they weren’t allowed. As a result, there is significant pent-up demand in the economy which should drive growth in the industries most impacted by the pandemic in the coming months. In addition, as of June 15, restrictions are lifted at most businesses in the state, and Californians fully vaccinated for COVID-19 can go without masks in most settings. With businesses returning to normal operations, these sectors should experience significant job gains as companies ramp up production to meet surging consumer demand. However, with many businesses struggling to hire workers, it may take some time for many industries to return to pre-pandemic employment levels.
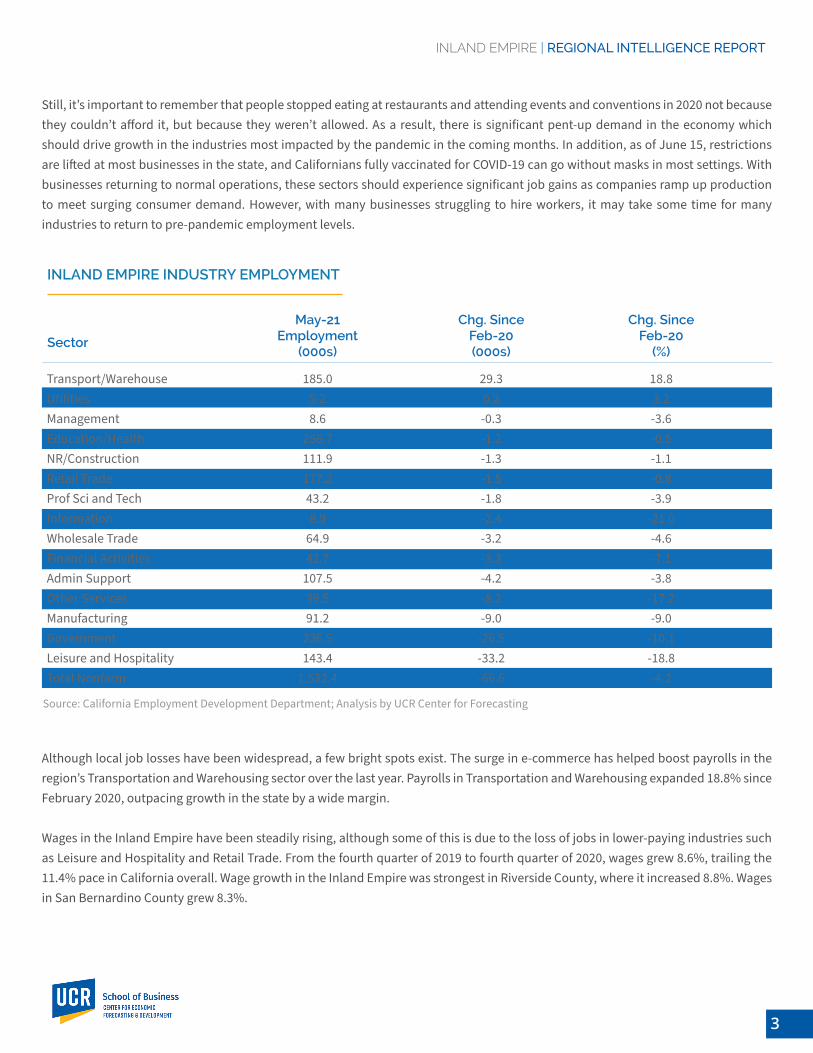
Although local job losses have been widespread, a few bright spots exist. The surge in e-commerce has helped boost payrolls in the region’s Transportation and Warehousing sector over the last year. Payrolls in Transportation and Warehousing expanded 18.8% since February 2020, outpacing growth in the state by a wide margin.
Wages in the Inland Empire have been steadily rising, although some of this is due to the loss of jobs in lower-paying industries such as Leisure and Hospitality and Retail Trade. From the fourth quarter of 2019 to fourth quarter of 2020, wages grew 8.6%, trailing the 11.4% pace in California overall. Wage growth in the Inland Empire was strongest in Riverside County, where it increased 8.8%. Wages in San Bernardino County grew 8.3%.
INLAND EMPIRE INDUSTRY EMPLOYMENT
Sector
May-21Employment
(000s)
Chg. SinceFeb-20 (000s)
Chg. SinceFeb-20
(%)
Transport/WarehouseUtilitiesManagementEducation/HealthNR/ConstructionRetail TradeProf Sci and TechInformationWholesale TradeFinancial ActivitiesAdmin SupportOther ServicesManufacturingGovernmentLeisure and HospitalityTotal Nonfarm
185.05.28.6
256.7111.9177.243.28.9
64.942.7
107.539.591.2
236.5143.4
1,522.4
29.30.2-0.3-1.2-1.3-1.5-1.8-2.4-3.2-3.3-4.2-8.2-9.0
-26.5-33.2-66.6
18.83.2-3.6-0.5-1.1-0.8-3.9
-21.0-4.6-7.1-3.8
-17.2-9.0
-10.1-18.8-4.2
Source: California Employment Development Department; Analysis by UCR Center for Forecasting

INLAND EMPIRE | REGIONAL INTELLIGENCE REPORT
4
Continuing to contain COVID-19 cases will be essential to sustaining the economic recovery in the Inland Empire and the nation. In the middle of June, the seven-day moving average for new daily COVID-19 cases in the Inland Empire was under 100, a significant improvement from the more than 7,000 new daily COVID-19 cases earlier this year. These improvements have led state officials to lift restrictions at most businesses, and issue guidance that fully vaccinated Californians can go without masks in most settings.
COVID-19 TRENDS AND BUSINESS ACTIVITY

INLAND EMPIRE | REGIONAL INTELLIGENCE REPORT
5
Tota
l New
COV
ID-1
9 Ca
ses
(7-D
ay A
vera
ge)
3/24
/20
7/24
/20
11/2
4/20
3/24
/21
4/24
/20
4/24
/21
8/24
/20
12/2
4/20
5/24
/20
5/24
/21
9/24
/20
1/24
/21
6/24
/20
10/2
4/20
2/24
/21
6000
5000
3000
1000
4000
2000
0
INLAND EMPIRE TOTAL NEW COVID-19 CASES
Source: Los Angeles Times, California Department of Public Health (CDPH); Analysis by UCR Center for Forecasting
San Bernardino County Riverside County
Tota
l Dos
es
2/15
/21
3/15
/21
12/1
5/20
5/15
/21
4/15
/21
1/15
/21
2,500,000
2,000,000
1,000,000
500,000
1,500,000
0
INLAND EMPIRE CUMULATIVE VACCINATION DOESES
Source: Los Angeles Times, California Department of Public Health (CDPH); Analysis by UCR Center for Forecasting
San Bernardino County Riverside County

INLAND EMPIRE | REGIONAL INTELLIGENCE REPORT
6
INLAND EMPIRE SALES TAX RECEIPTS
CategoryQ4-20
($ Thousands)1-Year
Change (%)
County & State Pool
Building and Construction
Food and Drugs
Autos and Transportation
Business and Industry
General Consumer Goods
Restaurants and Hotels
Fuel and Service Stations
Total
42,917
24,397
10,873
37,068
39,494
36,470
18,607
14,987
224,118
46.5
15.5
12.6
8.4
4.4
-5.5
-16.4
-25.5
5.5
Source: HdL Cos.; Analysis by UCR Center for Forecasting
Vaccinations have played a key role in the Inland Empire and California’s re-opening efforts in the recent months. As of June 14, the Inland Empire had supplied over 3.5 million doses of the COVID-19 vaccine. This amounts to 42% of San Bernardino County and 45% of Riverside County’s individual populations receiving at least one dose of the vaccine. While these aren’t the levels needed for the region to reach herd immunity, the decline in COVID-19 cases has still allowed restrictions to be lifted at most businesses.
From the fourth quarter of 2019 to fourth quarter of 2020, taxable receipts in the Inland Empire increased 5.5%. The pandemic has led to a surge in spending at some locations. E-commerce has surged during the pandemic, with spending up 46.5% year-over-year for the county and state pool (the category collecting taxes for e-commerce sales).
The Inland Empire’s Construction sector has also been aided by the pandemic. As people spend more time at home, many have started or finished home upgrades in recent months, with spending at Building and Construction stores growing 15.5% year-over-year. More people eating meals at home has also led to an increase in spending at Food and Drug Stores, which is up 12.6% over the last year.
Declines were most pronounced at Fuel and Service Stations, which fell -25.4%. This is due to less car travel during the pandemic. Declines were also pronounced at Restaurants and Hotels, which fell -16.4% over the last year. This shouldn’t come as a surprise given that these were the sectors most impacted by stay-at-home orders and public health mandates. General Consumer Goods (-5.5%) also declined over this period.

INLAND EMPIRE | REGIONAL INTELLIGENCE REPORT
7
0
Med
ian
Pric
e (S
A, T
hous
ands
)
500
250
450
200
400
150
50
350
100
300
Sale
s (SA
, Tho
usan
ds)
25
5
20
0
15
INLAND EMPIRE SINGLE-FAMILY HOME PIRCES AND SALES
The housing market was by far the brightest spot of the Inland Empire’s economy in 2020 and is booming in 2021. Strong performance is likely driven by three factors. First, typical homebuyers (higher-income earners) have been less affected by the labor market downturn. Second, mortgage rates are at historically low levels, spurring purchase activity. Third, inventories are near historic lows. These factors have pushed offers far over the asking price even as buyers waive inspections and other contingencies in an attempt to get a leg-up on the competition.
With this backdrop, home prices in the Inland Empire continue to increase rapidly. From the first quarter of 2020 to first quarter of 2021, the median single-family home price rose 18.5%. This was stronger growth relative to other parts of Southern California, with Los Angeles (17.8%), Orange (12.2%), and San Diego (15.4%) counties also posting sizable gains.
Part of the reason the Inland Empire is seeing more rapid growth is because it is one of the last markets for relatively affordable housing in Southern California. At a median price of $455,000, its existing single-family homes are significantly more affordable than those in Los Angeles ($800,000), Orange ($932,000), and San Diego ($760,000) counties.
After sales dropped during the second quarter of 2020 due to the pandemic, demand surged in the second half of 2020 and has continued growing into 2021. With demand remaining strong, existing single-family home sales increased 24.3% in the Inland Empire from the first quarter of 2020 to first quarter of 2021, outpacing growth in Los Angeles (22.6%), San Diego (13.4%), and Orange (22.0%) counties.
RESIDENTIAL REAL ESTATEQ
1-05
Q1-
08
Q1-
11
Q1-
14
Q1-
17
Q1-
20
Q4-
05
Q4-
08
Q4-
11
Q4-
14
Q4-
17
Q4-
20
Q3-
06
Q3-
09
Q3-
12
Q3-
15
Q3-
18
Q2-
07
Q2-
10
Q2-
13
Q2-
16
Q2-
19
Source: CoreLogic; Analysis by UCR Center for Forecasting
Median Price Sales
INLAND EMPIRE | REGIONAL INTELLIGENCE REPORT
8
Economic stimulus and low interest rates have increased demand for housing throughout California; however, supply has not increased to meet these demands. In April 2021, there were just 1.6 months of housing supply in Riverside County and 2 months of supply in San Bernardino County. For context, a balanced market typically equates to 6 - 7 months of supply. Moreover, a buyer’s market is seven months of supply and above, and a seller’s market is six months of supply and under. 1 The strong fundamentals at the start of this hot market imply there is still some headroom for the markets to grow. And with inventory so low, it will take years for builders to catch up as demand also remains high. If inflation begins to heat up consistently, mortgage rates will take a similar jump and the market could downshift rapidly. But these effects, if they occur, are unlikely within the next two years.
The apartment market in the Inland Empire also experienced a solid year. The apartment vacancy rate fell to 3.4%, a -0.1 percentage-point decrease from a year ago. In addition, the number of occupied units in the region grew 1.4% over the last year. Asking rents grew 3.1% to $1,487 per-unit per month, but that figure still keeps the Inland Empire more affordable than Los Angeles ($1,974), Orange ($1,973), and San Diego ($1,859) counties.
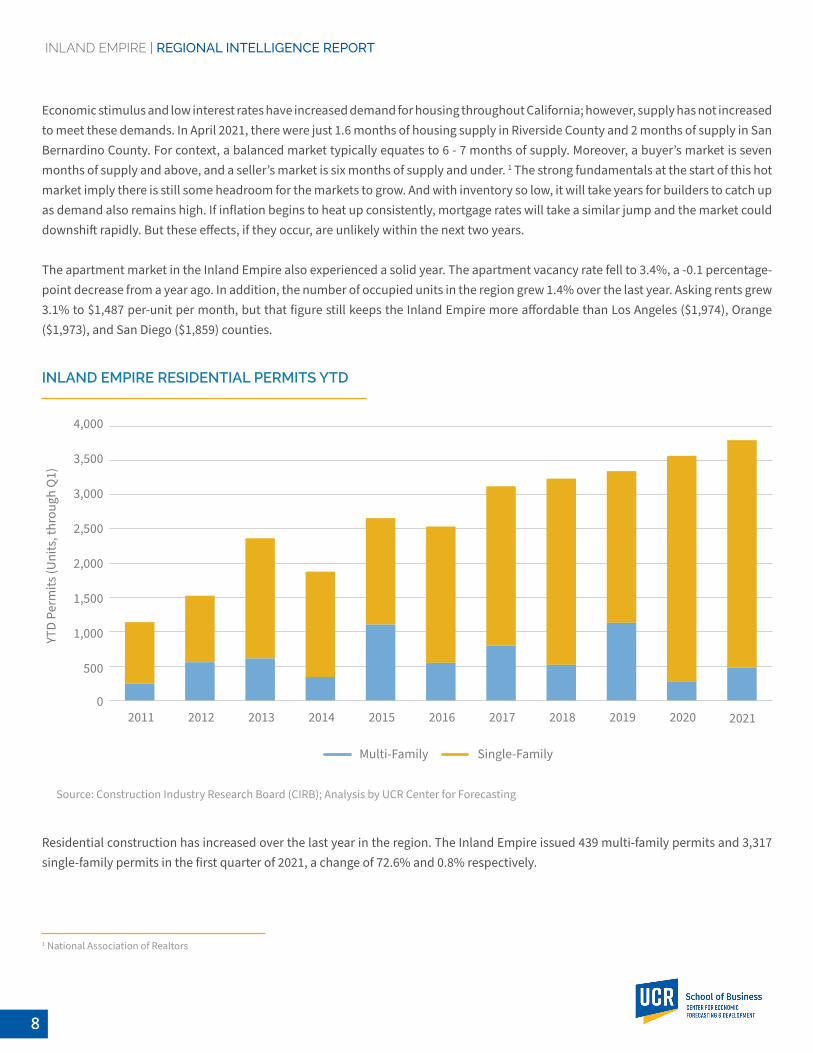
Residential construction has increased over the last year in the region. The Inland Empire issued 439 multi-family permits and 3,317 single-family permits in the first quarter of 2021, a change of 72.6% and 0.8% respectively.
1 National Association of Realtors
YTD
Perm
its (U
nits
, thr
ough
Q1)
2012 20172014 20192011 20162013 20182015 2020 2021
4,000
3,500
2,500
1,500
500
1,000
3,000
2,000
0
INLAND EMPIRE RESIDENTIAL PERMITS YTD
Source: Construction Industry Research Board (CIRB); Analysis by UCR Center for Forecasting
Multi-Family Single-Family

INLAND EMPIRE | REGIONAL INTELLIGENCE REPORT
9
The vacancy rate for warehouse properties in the Inland Empire fell to 9.7% in the first quarter of 2021, a -0.5 percentage-point decrease from a year earlier. This vacancy decline came as 10 million square feet of new space opened over the last year, a 2.4% increase to the available stock in the region. In addition, asking rents grew a modest 1.6% over the last year to an average annual rate of $5.87 per square foot, but that still keeps warehouse space in the Inland Empire more affordable than Los Angeles ($8.04), Orange ($7.66), and San Diego ($9.31) counties.
In contrast, demand for office properties has fallen over the last year in the Inland Empire. The office vacancy rate hit 17.9% in the first quarter of 2021, up 1.2 percentage points from a year earlier. This vacancy increase was driven by a -0.8% decrease in occupied stock over the last year (less users). Still, asking rents grew a modest 1.5% over the last year to an annual rate of $23.69 per square foot, keeping office space in the Inland Empire more affordable than Los Angeles ($40.79), Orange ($34.05), and San Diego ($34.47) counties.
COMMERCIAL REAL ESTATE
INLAND EMPIRE | REGIONAL INTELLIGENCE REPORT
10
Perm
it Va
lues
(SA,
Mill
ions
)
800 120
300
20
-20
0 -80
700 100
60080
500
60
-60
200
0
400
40
-40
100
Grow
th (S
A, %
)
INLAND EMPIRE NON-RESIDENTIAL PERMITS
Permit Values Growth
Q4-
11
Q4-
15
Q4-
18
Q4-
13
Q4-
17
Q4-
20
Q2-
10
Q2-
14
Q2-
12
Q2-
16
Q2-
19
Q4-
10
Q4-
14
Q4-
12
Q4-
16
Q4-
19
Q2-
11
Q2-
15
Q2-
18
Q2-
13
Q2-
17
Q2-
20
Source: Construction Industry Research Board (CIRB); Analysis by UCR Center for Forecasting
The vacancy rate for flex/research and development (R&D) properties in the Inland Empire grew to 5.4% in the first quarter of 2021, a 0.6 percentage-point increase from a year earlier. Asking rents grew a modest 1.4% over the last year to an annual rate of $8.95 per square foot, keeping flex/R&D space in the Inland Empire more affordable than Los Angeles ($13.29), Orange ($12.27), and San Diego ($14.67) counties.
Demand for retail space in the Inland Empire has fallen over the last year as a result of government health mandates and consumer reservations amid the COVID-19 pandemic. The vacancy rate held steady at 9.8% in the first quarter of 2021, unchanged from a year earlier. However, asking rents fell -3.1% to an annual rate of $22.56 per square foot, which keeps retail space in the Inland Empire more affordable than Los Angeles ($33.47), Orange ($34.21), and San Diego ($32.29) counties.
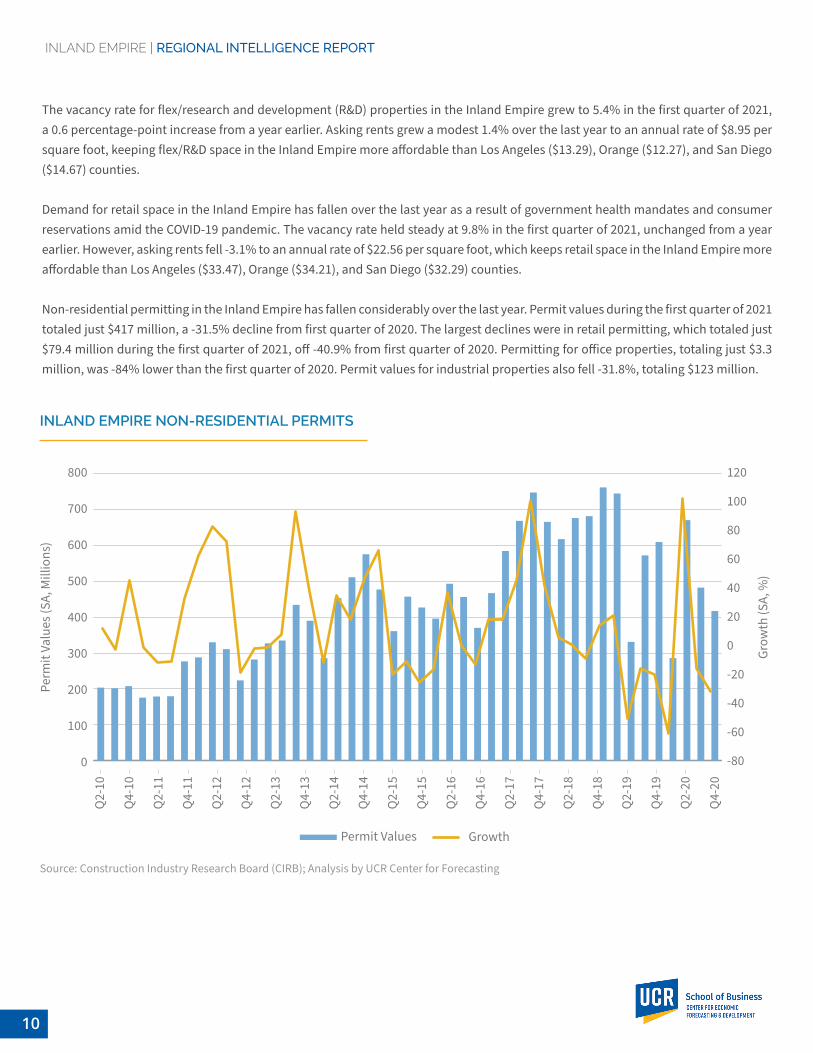
Non-residential permitting in the Inland Empire has fallen considerably over the last year. Permit values during the first quarter of 2021 totaled just $417 million, a -31.5% decline from first quarter of 2020. The largest declines were in retail permitting, which totaled just $79.4 million during the first quarter of 2021, off -40.9% from first quarter of 2020. Permitting for office properties, totaling just $3.3 million, was -84% lower than the first quarter of 2020. Permit values for industrial properties also fell -31.8%, totaling $123 million.
INLAND EMPIRE | REGIONAL INTELLIGENCE REPORT
11
951-827-2792
UCREconomicForecast.org
Questions or Comments?Please email [email protected]
900 University Ave.Anderson Hall 0162Riverside, CA 92521