Embed Size (px)
Citation preview
INM/CIM Project CLOSEDOWN REPORT
Page 2 of 73
INM/CIM Project CLOSEDOWN REPORT
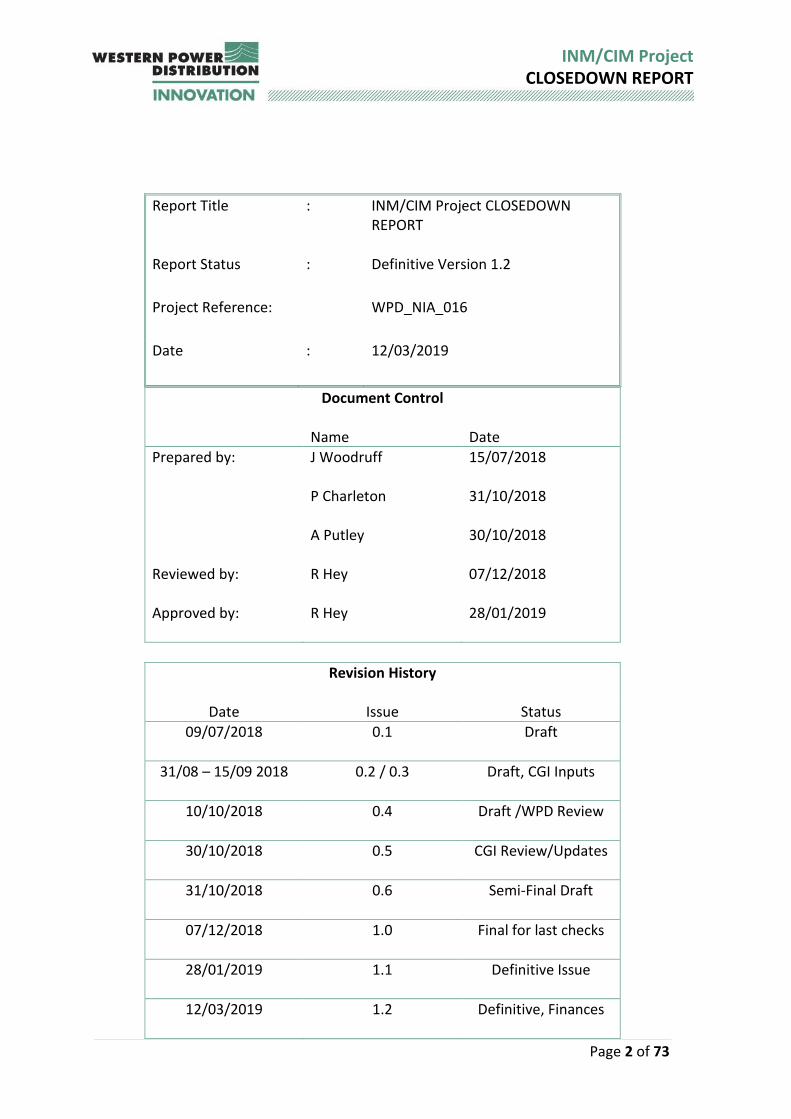
Document Control
Name Date
Prepared by: J Woodruff
P Charleton
A Putley
15/07/2018
31/10/2018
30/10/2018
Reviewed by: R Hey 07/12/2018
Approved by: R Hey 28/01/2019
Revision History
Date Issue Status
09/07/2018 0.1 Draft
31/08 – 15/09 2018 0.2 / 0.3 Draft, CGI Inputs
10/10/2018 0.4 Draft /WPD Review
30/10/2018 0.5 CGI Review/Updates
31/10/2018 0.6 Semi-Final Draft
07/12/2018 1.0 Final for last checks
28/01/2019 1.1 Definitive Issue
12/03/2019 1.2 Definitive, Finances
Report Title : INM/CIM Project CLOSEDOWN REPORT
Report Status : Definitive Version 1.2
Project Reference: WPD_NIA_016
Date : 12/03/2019

Page 3 of 73
INM/CIM Project CLOSEDOWN REPORT
Contents
Executive Summary ........................................................................................................ 5
1 Project Background................................................................................................ 6
2 Scope and Objectives ............................................................................................. 7
3 Success Criteria ...................................................................................................... 8
4 Details of the Work Carried Out ............................................................................. 9
4.1 Overview of approach ........................................................................................... 9
4.2 Data sets incorporated .......................................................................................... 15
4.3 CIM extracts produced .......................................................................................... 16
4.4 Model Validation ................................................................................................... 25
4.5 Data Dissemination and Evaluation ....................................................................... 27
4.6 Host Platform Set-up ............................................................................................. 28
5 Performance Compared to Original Aims, Objectives and Success Criteria .............. 29
5.1 INM implementation ............................................................................................. 29
5.2 CIM Data Exchange Assessment (External third-parties) ...................................... 29
6 Required Modifications to the Planned Approach during the Course of the Project 30
7 Project Costs .......................................................................................................... 31
8 Lessons Learnt for Future Projects ......................................................................... 32
9 The Outcomes of the Project .................................................................................. 34
9.1 Build of INM Production Capability ....................................................................... 34
9.2 Data Generation and Validation ............................................................................ 35
9.3 Third Party Liaison and Feedback .......................................................................... 36
9.4 Model Extension and Rollout ................................................................................ 38
10 Data Access Details ................................................................................................ 39
10.1 Onward systems linkage .................................................................................... 39
11 Foreground IPR ...................................................................................................... 40
12 Planned Implementation ....................................................................................... 41
12.1 Business Assessment ......................................................................................... 41
12.2 Potential INM/CIM Applications ........................................................................ 41
13 Other Comments ................................................................................................... 46
14 Contact .................................................................................................................. 47
Glossary ......................................................................................................................... 48
Reference Documents .................................................................................................... 50
Appendix A – Detailed Project Outcomes ........................................................................ 51
Appendix B – Trial Infrastructure .................................................................................... 63
Appendix C – Specific Data-user Feedback ...................................................................... 64
Appendix D – Summary User Feedback (Graphics) .......................................................... 67
Page 4 of 73
INM/CIM Project CLOSEDOWN REPORT
Table of Figures
Figure 1 – Overview of INM approach .............................................................................. 10
Figure 2 - Node-breaker vs bus-branch models ................................................................ 18
Figure 3 - Discrete measurement linked to circuit breaker in a CIM EQ file .................... 19
Figure 4 - Operational limits associated with AC line segment in a CIM EQ file .............. 20
Figure 5 - Names associated with a circuit breaker in a CIM EQ file ................................ 21
Figure 6 - Location objects in CIM GL file linked to CIM EQ conducting equipment ........ 23
Figure 7 - Diagram objects in CIM DL file linked to CIM EQ file ........................................ 24
Figure 8 - Secondary substation PowerOn data example................................................. 52
Figure 9 - Matched 11kV network example ...................................................................... 55
Figure 10 - Trial Infrastructure, High Level Architecture .................................................. 64
Figure 11 - Responding Organisations by Type ................................................................ 67
Figure 12 - CIM Model Intended Purpose of Respondent ................................................ 68
Figure 13 - Is the Respondent Already a User of WPD Data ............................................. 68
Figure 14 - What WPD Data Sources Do Respondents Already Use ................................ 68
Figure 15 - Respondent Current Mode of Data Use ......................................................... 69
Figure 16 - Respondent Existing Use of CIM Data ............................................................ 69
Figure 17 - Other Data Formats Already Used by Respondents ....................................... 69
Figure 18 - Respondent Interest by Voltage Level ............................................................ 70
Figure 19 - Respondent Interest by Asset Type ................................................................ 70
Figure 20 - Respondent Interest in Modelled Components for Modelling Now .............. 71
Figure 21 - Respondent Interest in Modelled Components for Future Modelling ........... 72
DISCLAIMER Neither WPD, nor any person acting on its behalf, makes any warranty, express or implied, with respect to the use of any information, method or process disclosed in this document or that such use may not infringe the rights of any third party or assumes any liabilities with respect to the use of, or for damage resulting in any way from the use of, any information, apparatus, method or process disclosed in the document. © Western Power Distribution 2019 No part of this publication may be reproduced, stored in a retrieval system or transmitted, in any form or by any means electronic, mechanical, photocopying, recording or otherwise, without the written permission of the Future Networks Manager, Western Power Distribution, Herald Way, Pegasus Business Park, Castle Donington. DE74 2TU. Telephone +44 (0) 1332 827446. E-mail [email protected]

Page 5 of 73
INM/CIM Project CLOSEDOWN REPORT
Executive Summary
Data is becoming increasingly central to DNO operations and while “Islanded” datasets located within specific business systems remain entirely functional, the DNO (DSO) runs the risk of missing out on the opportunities afforded by taking a coordinated approach to “master data management”. The Integrated Network model implemented in this project assembles several such independently maintained “island” datasets into a single holistic view of the WPD network. It is important that this capability is seen as augmenting the existing source business systems, it is not seeking to replace them – the source systems remain authoritative but in a process of continual iterative improvement can be adjusted in response to detected inconsistencies as the INM conducts its cross system analysis. Furthermore, by implementing the Common Information Model for Electricity as the method by which this new view of the data is organised, we provide the facility to export and share this data with other interested parties both internally and externally to the organisation. This project is therefore a significant enabler for onward systems implementations while allowing a radical new way to examine and work with the WPD network. The initial proof of concept conducted during the FALCON innovation project between 2012 and 2015 paved the way for the current INM/CIM project. FALCON assembled an Integrated Network Model for the Milton Keynes distribution area at 11kV. The INM/CIM project chose the South West WPD operating region as the main target network area for the current pilot implementation. Based on the success of this activity, the project has now been handed on into the business to expand the model in breadth (geographically to all WPD regions) and depth (to all voltage levels). The project was successfully delivered broadly on time and within the overall budget with the delays that were experienced by the project being caused by external factors beyond our control1. Internally the South West area model has been assessed by business users, and in line with the project plan, the data has been disseminated to a variety of interested third parties. We are continuing to assess the results of this activity.
1 Initially the project was delayed by the supplier recall of key equipment. In the final project activity, the gathering of timely feedback from third parties involved in the dissemination and assessment provided some challenges.

Page 6 of 73
INM/CIM Project CLOSEDOWN REPORT
1 Project Background
DNOs typically have asset data residing in several separate systems. The data held supports the function of each system, typically asset management, geographical representation or network control. The systems will differ in the assets that are included and may not reference the same asset with the same unique reference. Additionally, there may be a reliance on manual processes to keep systems aligned. This leads to the following problems:
1) It is difficult to identify and rectify data quality issues; 2) A dataset that is rich enough to support complex analysis cannot be exported
from any one system; 3) Individual data formats slow the adoption of new software as the custom
tailoring of data is expensive and time consuming; 4) Exchanging data with third parties is also time-consuming and may not
provide all the data required. The Common Information Model for electricity is an international standard developed to support exchange of electrical network information. It forms a useful basis to support the information layer of the CENELEC Smart Grid Architecture Model (SGAM). A previous WPD innovation Project, FALCON, successfully combined data for the 11kV network from key systems to create an Integrated Network Model. This allowed FALCON to use that data for a complex network simulation and also to build on that work to create a comprehensive, accurate and portable network model in CIM format. This project also explored the benefits of having data in the CIM format to determine whether there is a business case to convert and maintain data in this format and also whether there is a future requirement for our software to support CIM format. The project scale was that required to obtain the relevant learning. 132KV networks were included to enable data exchange with National Grid. The network area selected will result in a network model being available for other projects. The project was initially intended to cover a specific and limited region (Cornwall) within WPDs South West operating region to act as an initial feasibility study. This would then be extended to other areas within the South West to widen the variety of assets included and reflect a variety of legacy data but the initial proof of concept has sufficient scale to test the hypothesis. The project very rapidly expanded the geographic area covered by this initial work to cover the full South West DNO area.

Page 7 of 73
INM/CIM Project CLOSEDOWN REPORT
2 Scope and Objectives
The main areas of work within the project were:
1. Extending the process of matching data from the various systems at 11 kV, to 33kV, 66kV and 132 kV networks;
2. To test the benefits of having a network model in CIM format network in terms of software adoption and integration. i.e. test the hypothesis that having a CIM format model greatly simplifies the process of adopting a different planning tool, supporting a suite of niche planning tools, or creating interfaces and providing data services between systems;
3. To test the benefits of having a network model in CIM format in terms of data exchange with third parties. i.e. data exchange over DNO boundaries, with National Grid or IDNOs, Local Authorities, Academic bodies etc.;
4. To test the benefits of having CIM format network models when creating system interfaces.
The project duration was extended to cater for the delayed availability of the supporting system host hardware which had been recalled by the manufacturer. This necessitated a delay to the project, but did not change cost or outputs. At the outset, the project expected there would be financial gain associated with the benefits listed below. These are particularly hard to measure and quantify but we have provided more information on these: 1) Improved data quality; 2) Improved data sharing; 3) Reduced software adoption costs; 4) Improved reporting; 5) Supporting competition in network connection and connection planning. The learning from the CIM analysis work will be transferable to all other DNOs, and we intend to proactively engage with them around the results on an ongoing basis. The developers CGI are also taking the INM/CIM proposition to other DNOs for the wider realisation of available benefits. Should other DNO’s implement this solution across their own licence areas, we believe that this will prepare the way for cost savings for their businesses, ultimately benefiting their customers directly through cost savings, better customer service and more widely through improved information sharing. WPD will implement the INM/CIM solution across our own four licence areas to bring these benefits to both the business and ultimately our customers.
Page 8 of 73
INM/CIM Project CLOSEDOWN REPORT
Objective Status
To extend the existing Integrated Network Model for 11kV to export data in CIM format
To create a replicable process to combine data for 33kV and 66kV and 132kV networks to identify data quality issues and provide a CIM format output
To test the benefits that arise from creating a CIM format network model in terms of software adoption, information exchange and system interfaces
3 Success Criteria
Success Criteria Status
A specification is written and tested for the network area
A usable CIM format model has been produced to include 33kV, 66KV and 132kV networks
The format model will then be shared with interested 3rd parties
Feedback Questions provided to third parties and the responses returned are used to further inform next steps.
Page 9 of 73
INM/CIM Project CLOSEDOWN REPORT
4 Details of the Work Carried Out
4.1 Overview of Approach
The project developed and deployed a full-scale prototype baseline of Integrated Network Model (INM) software and used this to produce CIM representations of the South West distribution region network data. The deployed model covered the entire South West region and included all of the higher-voltage network from super-grid transformers down to the transformer tails at secondary substations.
Electricity network topology and asset master data was extracted from WPD’s main IT systems and fed into the Integrated Network Model (INM) software solution. After validating and transforming the data, INM made it available as a number of CIM-compliant extract files.
As the core INM software modules became available, they were proven by feeding the South West network data through them and iterating the configuration settings until the desired output data was produced.
4.1.1 The INM Solution
INM is a Master Data Management solution which,
a. Creates a single, canonical, reconciled version of electricity network asset master
data that is mastered across a number of discrete systems and makes this
available to other applications via data services; and
b. Tracks data anomalies, mismatches and other discrepancies while doing so and
reports these to data stewards so the offending source data can be corrected.
INM thus supports cost-effective systems integration whilst avoiding the need for large-scale up-front data cleansing activities, enabling data issues to be addressed in the business’ own timescales in accordance with their impacts and priorities.
Page 10 of 73
INM/CIM Project CLOSEDOWN REPORT
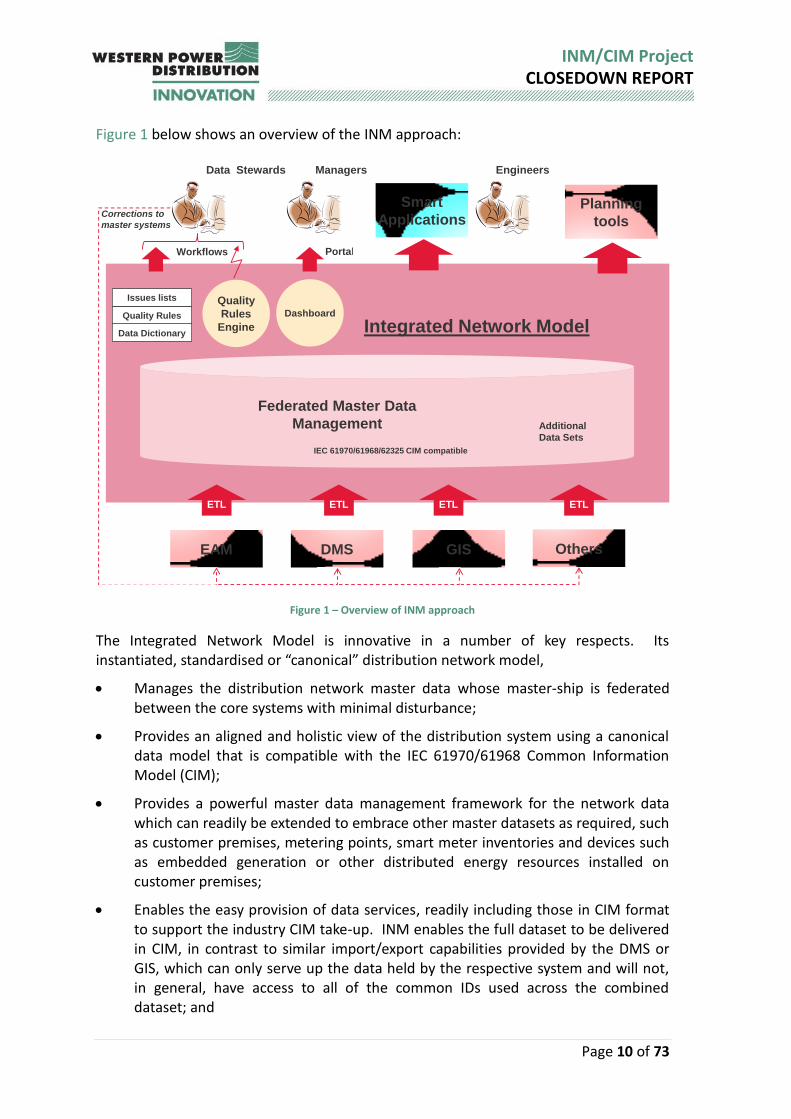
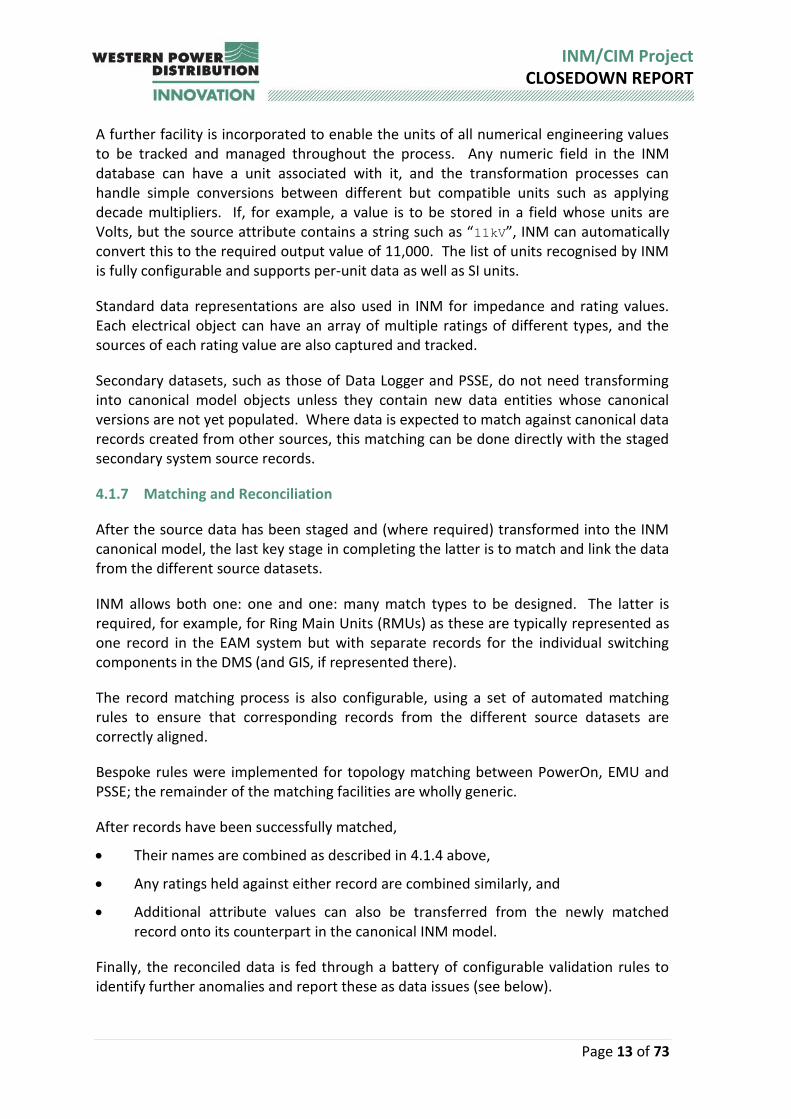
Figure 1 below shows an overview of the INM approach:
Figure 1 – Overview of INM approach
The Integrated Network Model is innovative in a number of key respects. Its instantiated, standardised or “canonical” distribution network model,
Manages the distribution network master data whose master-ship is federated between the core systems with minimal disturbance;
Provides an aligned and holistic view of the distribution system using a canonical data model that is compatible with the IEC 61970/61968 Common Information Model (CIM);
Provides a powerful master data management framework for the network data which can readily be extended to embrace other master datasets as required, such as customer premises, metering points, smart meter inventories and devices such as embedded generation or other distributed energy resources installed on customer premises;
Enables the easy provision of data services, readily including those in CIM format to support the industry CIM take-up. INM enables the full dataset to be delivered in CIM, in contrast to similar import/export capabilities provided by the DMS or GIS, which can only serve up the data held by the respective system and will not, in general, have access to all of the common IDs used across the combined dataset; and
DMS GIS
Integrated Network Model
EAM
Federated Master Data
Management
ETL ETL ETL
Planning
tools
Quality
Rules
EngineQuality Rules
Issues lists
Data Dictionary
Data Stewards
Corrections to
master systems
Engineers
Workflows
Dashboard
Managers
Portal
IEC 61970/61968/62325 CIM compatible
Smart
Applications
Others
Additional
Data Sets
ETL
Page 11 of 73
INM/CIM Project CLOSEDOWN REPORT
Underpins a more flexible data integration approach than that offered by CIM format and ESB middleware either alone or in sole combination, and is substantively different from a traditional data warehouse or data lake.
4.1.2 INM’s Canonical Data Model
INM’s canonical data model is designed to be CIM compatible without diverging too radically from the data models used by existing BaU DNO systems.
The CIM data model is structured into objects and associations, with the objects organised into a rigid, formal class hierarchy but the associations having no additional data attribution. A number of key CIM classes, such as PowerSystemResource, ConductingEquipment, Asset, Terminal, Name, NameType, Transformer, TransformerEnd and VoltageLevel have therefore been directly incorporated into the INM canonical model.
But there are some respects in which the majority of existing DNO applications take different approaches from CIM with their data models:
Many applications, for example PowerOn, GISes and most network modelling software, distinguish more strictly between “point” components and “linear” ones (conductors such as cables/lines), so this distinction is also made in INM.
Some applications, such as PowerOn and packaged Enterprise Asset Management (EAM) solutions such as SAP, allow user-defined custom data attribution to be configured for their data objects.
A big advantage of INM’s database is that every entity in it – both vertices and edges – are managed as document classes. The database still supports a normal class hierarchy (including multiple inheritance), but also allows
Other classes and/or arrays to be nested within record structures, and
Arbitrary custom attributes to be added to individual records without these having to be rigidly defined in the class definitions.
As a result of its rigid class hierarchy, which is necessary to support interface messaging, the CIM model contains many hundreds of classes. But the flexibility of its database allows INM to function with far fewer, as more generic classes can be used with fields which define the actual types of each object and the additional data attributes created on individual records as and when required.
INM also applies the concept of network location containers for point assets more widely than other systems. In particular, it includes the concepts of overhead pole/tower and underground joint locations in addition to conventional substations. This is necessary as it is a key element of how the topology reconciliation inference rules work. It is not a problem for wider integration as these locations can easily be filtered out of extracted datasets where they are not needed.
Page 12 of 73
INM/CIM Project CLOSEDOWN REPORT
4.1.3 Data Dictionary
INM incorporates a data dictionary (DD) in which all of the data structures used for the whole process – both canonical and staging data – are defined. All the other INM configuration data is also closely integrated with the DD.
4.1.4 IDs and Names
Each source record will have one or more IDs that the source system or the DNO business use to identify it. In CIM, these are termed names. Both INM and CIM allow any data record (CIM NamedObject) to have as many names as required. Each different type of name is identified by a name type; these are configured into INM as each source dataset is incorporated.
Each source record’s names are marshalled into the required INM structure during the initial staging process, together with provenance information such as the identity of the source system. The object’s associated names are then carried with it through the entire INM reconciliation process. Whenever data obtained from one source systems is matched to that derived from another, their two sets of names are combined so the resulting record now carries all of them, and they are all included in the resulting CIM exports (see 4.3.1.1.10 below).
4.1.5 Data Staging Processes
Source system data is transferred into the INM environment and loaded into staging tables. Secondary staging views for the data are then created, incorporating some basic initial transformations to
Convert lookup value IDs to their corresponding business values,
Re-structure some items, such as names and ratings, into the formats needed by INM, and
Report a limited number of data issues where these could easily be identified directly from the source data using relatively straightforward SQL queries.
4.1.6 Transformation Process
After their data has been staged, the principal datasets are then transformed into the INM canonical representation.
The INM software is mostly generic and has to be configured with the source system data structure formats (see 4.1.3 above) and the rules to be applied in order to transform these into the canonical INM representation.
Often some data items are held in free-text fields by the source systems or the source systems are not able to perform comprehensive validation, so INM’s data transformation process supports flexible and configurable attribute value manipulation that enables source values to easily be tidied or parsed where necessary, validated, and anomalies filtered out and reported.
Page 13 of 73
INM/CIM Project CLOSEDOWN REPORT
A further facility is incorporated to enable the units of all numerical engineering values to be tracked and managed throughout the process. Any numeric field in the INM database can have a unit associated with it, and the transformation processes can handle simple conversions between different but compatible units such as applying decade multipliers. If, for example, a value is to be stored in a field whose units are Volts, but the source attribute contains a string such as “11kV”, INM can automatically convert this to the required output value of 11,000. The list of units recognised by INM is fully configurable and supports per-unit data as well as SI units.
Standard data representations are also used in INM for impedance and rating values. Each electrical object can have an array of multiple ratings of different types, and the sources of each rating value are also captured and tracked.
Secondary datasets, such as those of Data Logger and PSSE, do not need transforming into canonical model objects unless they contain new data entities whose canonical versions are not yet populated. Where data is expected to match against canonical data records created from other sources, this matching can be done directly with the staged secondary system source records.
4.1.7 Matching and Reconciliation
After the source data has been staged and (where required) transformed into the INM canonical model, the last key stage in completing the latter is to match and link the data from the different source datasets.
INM allows both one: one and one: many match types to be designed. The latter is required, for example, for Ring Main Units (RMUs) as these are typically represented as one record in the EAM system but with separate records for the individual switching components in the DMS (and GIS, if represented there).
The record matching process is also configurable, using a set of automated matching rules to ensure that corresponding records from the different source datasets are correctly aligned.
Bespoke rules were implemented for topology matching between PowerOn, EMU and PSSE; the remainder of the matching facilities are wholly generic.
After records have been successfully matched,
Their names are combined as described in 4.1.4 above,
Any ratings held against either record are combined similarly, and
Additional attribute values can also be transferred from the newly matched record onto its counterpart in the canonical INM model.
Finally, the reconciled data is fed through a battery of configurable validation rules to identify further anomalies and report these as data issues (see below).
Page 14 of 73
INM/CIM Project CLOSEDOWN REPORT
4.1.8 Relational Database Storage
The reconciled and validated dataset is then baselined in the database. This process is entirely automated and controlled wholly from the INM data dictionary that has been created (see 4.1.3 above).
4.1.9 Data Issue Reporting
During its transformation process, INM carries out a range of (mostly configurable) checks for data validity. Whenever any data records are found to fail these checks, INM not only registers a data issue instance but also
Links this to the offending records and any ‘container’ entities within which these are grouped, and
Records details of the relevant record identifiers and field values specific to the issue type against the issue instance.
These additional steps enable the issue instances to be presented to the data stewards in an easily understandable format, with most of the key information included to save the need for unnecessary source system lookups.
In a future BAU implementation, when the master versioned dataset is then updated, the lists of issue instances generated in the new snapshot will also be compared with their counterparts from the previous run, and:
Any new issue instances not previously present will be flagged for reporting to the data stewards (subject to the reporting dead-bands that can be configured for the respective issue types); and
The statuses of any previously present issue instances that are no longer reported in the latest snapshot will be updated to Resolved.
4.1.10 Data Steward Facilities
The following data steward facilities are included in the initial INM implementation:
The ability to view the issue dashboard and/or details of individual issue instances.
A facility for viewing basic attribute value profiles for most of the source extract fields and key ones of the transformed INM dataset. For each field, the numbers of blank, non-blank and distinct values are reported, together with (where applicable) the lengths of the longest and shortest values and/or the average, maximum and minimum values.
A manual matching screen that allows tentative matches to be reviewed, and/or manual matches made, for any sets of records between which matching has been configured into INM. Fifteen types of matching were defined while reconciling the South West region network data; fourteen of these were configured to allow manual matching to supplement the automated matches.
Page 15 of 73
INM/CIM Project CLOSEDOWN REPORT
A fix-up facility that allows special transformations to be applied to specific instances within the source data. In a few places, the source datasets were not fully consistent about which components belonged to which substations, especially at major sites having separate 132kV, 33kV and 11kV compounds. These facilities allowed specific sites from particular source systems to be merged, or specific components to be reallocated to different sites.
4.2 Data Sets Incorporated
Data from the following WPD source systems was incorporated into INM:
PowerOn, WPD’s Distribution Management System (DMS),
EMU, WPD’s GIS,
CROWN, WPD’s EAM solution,
Data Logger (DL), the SCADA historian, and
PSSE, which is used for EHV planning studies.
4.2.1 PowerOn
The EHV and HV network topology and connectivity set from PowerOn was the key starting point for the INM reconciliation process. As was done on FALCON, the PowerOn data is used as the key master topology and connectivity dataset at these voltage levels. As the PowerOn data has to be maintained to a very high quality to ensure safe operation of the network, doing this maximises the likelihood of producing a reconciled dataset with accurate asset contents and connectivity.
The schematic diagram coordinates of its “point” components were also included in the extract, but not the internal vertices of connectors. The schematic end points of each connector were available from the coordinates of the two components it connects between.
PowerOn’s SCADA measurement point master data was also incorporated into the INM model.
4.2.2 EMU
EMU is a GIS system based on an advanced Computer-Aided Design (CAD) platform, with its feature attribution included in its diagram tile files rather than using a central relational database. WPD have an existing process where the data can be extracted into Microsoft Access databases. A limitation of this extract is that it only includes the end points of linear assets such as cables and overhead lines, and not their intermediate vertices, but this was not considered to be a problem for the purposes of this project.
The geographical representations of the EHV and HV networks were incorporated and matched to the PowerOn topology using the available common IDs and an updated version of the inference rules that had previously been developed on FALCON.
Page 16 of 73
INM/CIM Project CLOSEDOWN REPORT
EMU is in the process of being replaced by WPD by GE’s Electric Office system.
4.2.3 CROWN
CROWN is a proprietary EAM system that uses an Oracle database. Like most EAM systems its data model incorporates a Location-Equipment hierarchy, and some data structures that identify which of the data attributes it can hold apply to which classes of asset. All of the relevant equipment and location data was incorporated into INM, extracted using a set of SQL queries developed jointly by the project team and its system maintainers.
4.2.4 Data Logger
DataLogger is a SCADA historian where historical network measurement time series are stored. INM is not intended to replicate the function of a historical data store, but the catalogue of measurement points for which DL holds historical values is a key part of the integrated dataset, so was extracted into an Excel spreadsheet and then incorporated into INM.
4.2.5 PSSE
PSSE is the network modelling tool WPD use for planning changes and investments on the EHV network. Its database was made available in Access format and incorporated into the INM model.
4.3 CIM Extracts Produced
CIM extracts compliant with the most relevant three CIM profiles, based on version 16 (subversion 29) of the CIM standard, were produced. This version forms the basis of ENTSOE’s Common Grid Model Exchange Standard (CGMES), and has therefore been tested in an industrial environment by major TSOs and vendors.
INM’s CIM Export uses configurable views that can be adapted to different versions of the model as well as to different CIM profiles. For instance, the views could be adapted to comply with IEC 61968-13, which defines the equipment profile for distribution systems. The reason why IEC 61970-452 was chosen instead of IEC 61968-13 for the first CIM export is because the former standard is more mature than the latter, whose second edition is yet to be published – it is expected by May 2019.
4.3.1 CIM Profiles
A CIM profile is a subset of CIM classes, attributes and relationships that cover data of a particular functional of interest. The standard profiles supported by INM’s CIM export are described in the following table indicating the DNO core systems that typically provide the source data to build an instance model of a particular profile:
Page 17 of 73
INM/CIM Project CLOSEDOWN REPORT
CIM Profile Description DNO Source Systems
Exchange Format
Equipment Profile (EQ) IEC 61970-452
Core network model including equipment (with electrical characteristics), connectivity, containership relationships (e.g. switch belongs to substation), as well as measurements and operational limits linked to the network model.
DMS (PowerOn) GIS (EMU) EAM (CROWN)
CIM/XML
Diagram Layout Profile (DL) IEC 61970-453
Description of diagram layout allowing rendering of network model visualisations
DMS (PowerOn) CIM/XML
Geographical Location (GL)
Representation of the geocodes (geographical locations) associated with power system resources described in the network model
GIS (EMU) DMS (PowerOn)
CIM/XML
4.3.1.1 CIM EQ Files
CIM EQ files are compliant with the standard IEC 61970-452 and represent network models including equipment (with electrical characteristics), connectivity, containership relationships (e.g. switch belongs to substation), as well as measurements and operational limits linked to the network model.
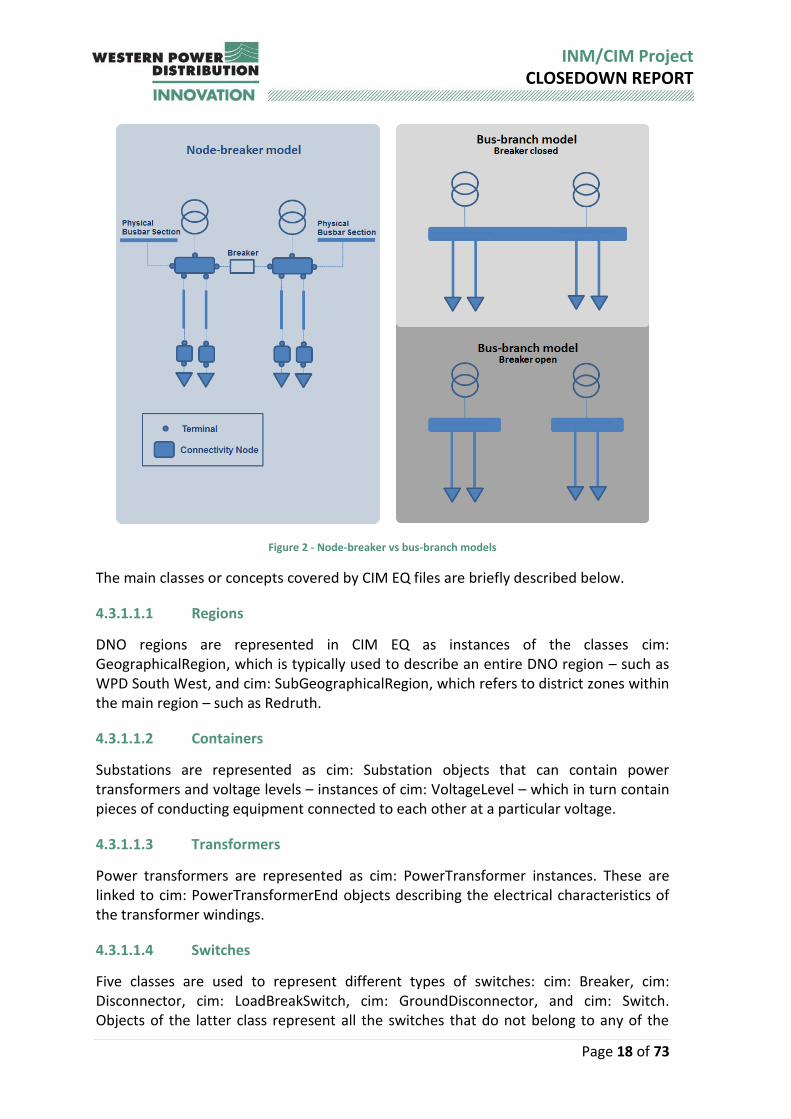
CIM EQ network models are node-breaker representations of the network which, as opposed to the simplified bus-branch models used by most planning tools, include switches connected to other pieces of conducting equipment through terminals linked via logical connectivity nodes. Figure 2 below compares the node-breaker representation used by CIM EQ files with its bus-branch equivalent. The same node-breaker model can have different bus-branch equivalents depending on switch positions.
Page 18 of 73
INM/CIM Project CLOSEDOWN REPORT
Figure 2 - Node-breaker vs bus-branch models
The main classes or concepts covered by CIM EQ files are briefly described below.
4.3.1.1.1 Regions
DNO regions are represented in CIM EQ as instances of the classes cim: GeographicalRegion, which is typically used to describe an entire DNO region – such as WPD South West, and cim: SubGeographicalRegion, which refers to district zones within the main region – such as Redruth.
4.3.1.1.2 Containers
Substations are represented as cim: Substation objects that can contain power transformers and voltage levels – instances of cim: VoltageLevel – which in turn contain pieces of conducting equipment connected to each other at a particular voltage.
4.3.1.1.3 Transformers
Power transformers are represented as cim: PowerTransformer instances. These are linked to cim: PowerTransformerEnd objects describing the electrical characteristics of the transformer windings.
4.3.1.1.4 Switches
Five classes are used to represent different types of switches: cim: Breaker, cim: Disconnector, cim: LoadBreakSwitch, cim: GroundDisconnector, and cim: Switch. Objects of the latter class represent all the switches that do not belong to any of the
Page 19 of 73
INM/CIM Project CLOSEDOWN REPORT
previous classes, e.g. fuses. It would be possible to use other CIM classes, such as cim: Fuse, but this would mean that the export would not be fully compliant with the IEC 61970-452 profile. If it were necessary, however, the export could be reconfigured to create cim: Fuse objects.
4.3.1.1.5 Lines
Lines outside substations are represented as cim: ACLineSegment instances, which include electrical characteristics.
4.3.1.1.6 Busbar Sections
Busbar sections are represented as cim: BusbarSection objects.
4.3.1.1.7 Energy Consumers & Sources
Energy consumers and sources are represented with the generic classes cim: EnergyConsumer and cim: EnergySource, respectively.
4.3.1.1.8 Measurements
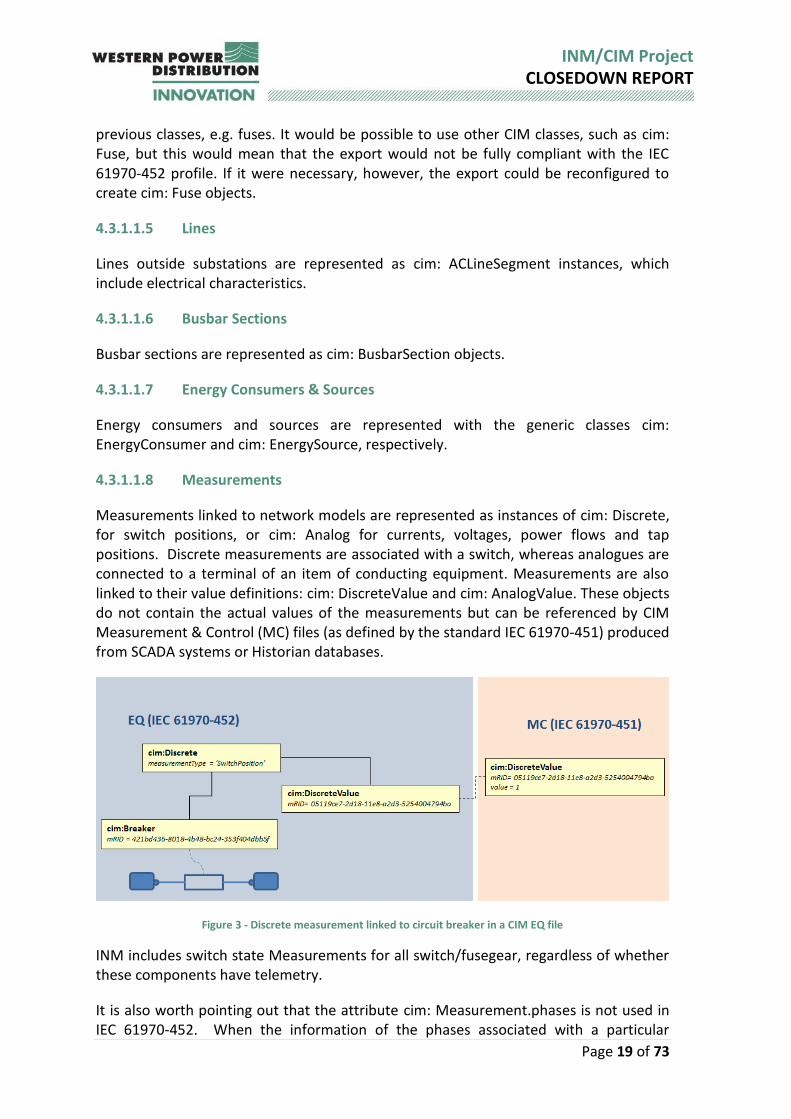
Measurements linked to network models are represented as instances of cim: Discrete, for switch positions, or cim: Analog for currents, voltages, power flows and tap positions. Discrete measurements are associated with a switch, whereas analogues are connected to a terminal of an item of conducting equipment. Measurements are also linked to their value definitions: cim: DiscreteValue and cim: AnalogValue. These objects do not contain the actual values of the measurements but can be referenced by CIM Measurement & Control (MC) files (as defined by the standard IEC 61970-451) produced from SCADA systems or Historian databases.
Figure 3 - Discrete measurement linked to circuit breaker in a CIM EQ file
INM includes switch state Measurements for all switch/fusegear, regardless of whether these components have telemetry.
It is also worth pointing out that the attribute cim: Measurement.phases is not used in IEC 61970-452. When the information of the phases associated with a particular
Page 20 of 73
INM/CIM Project CLOSEDOWN REPORT
measurement is available in the source system, INM currently adds it to the measurement’s name. For example, a cim: Analog with name = ‘ALIAS-1234-d_Phase_A’ and type = ‘LineCurrent’ refers to the current measurement associated with phase A of the conducting equipment ALIAS-1234-d.
4.3.1.1.9 Operational Limits
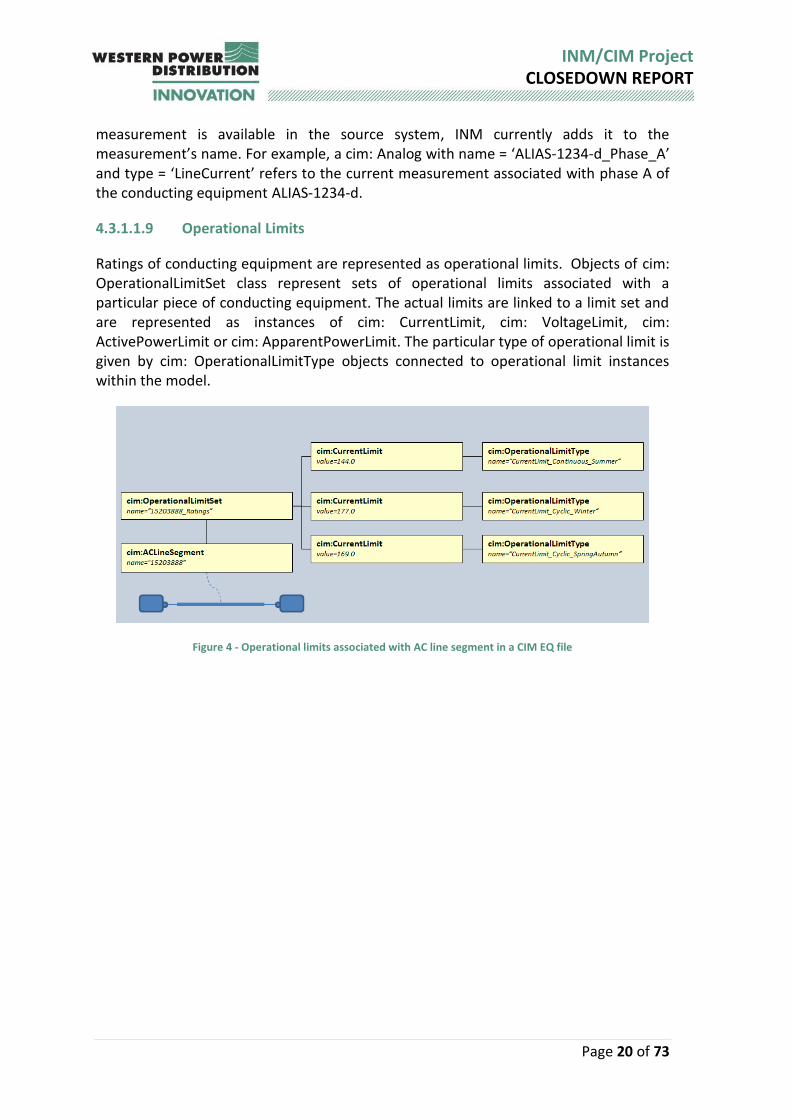
Ratings of conducting equipment are represented as operational limits. Objects of cim: OperationalLimitSet class represent sets of operational limits associated with a particular piece of conducting equipment. The actual limits are linked to a limit set and are represented as instances of cim: CurrentLimit, cim: VoltageLimit, cim: ActivePowerLimit or cim: ApparentPowerLimit. The particular type of operational limit is given by cim: OperationalLimitType objects connected to operational limit instances within the model.
Figure 4 - Operational limits associated with AC line segment in a CIM EQ file
Page 21 of 73
INM/CIM Project CLOSEDOWN REPORT
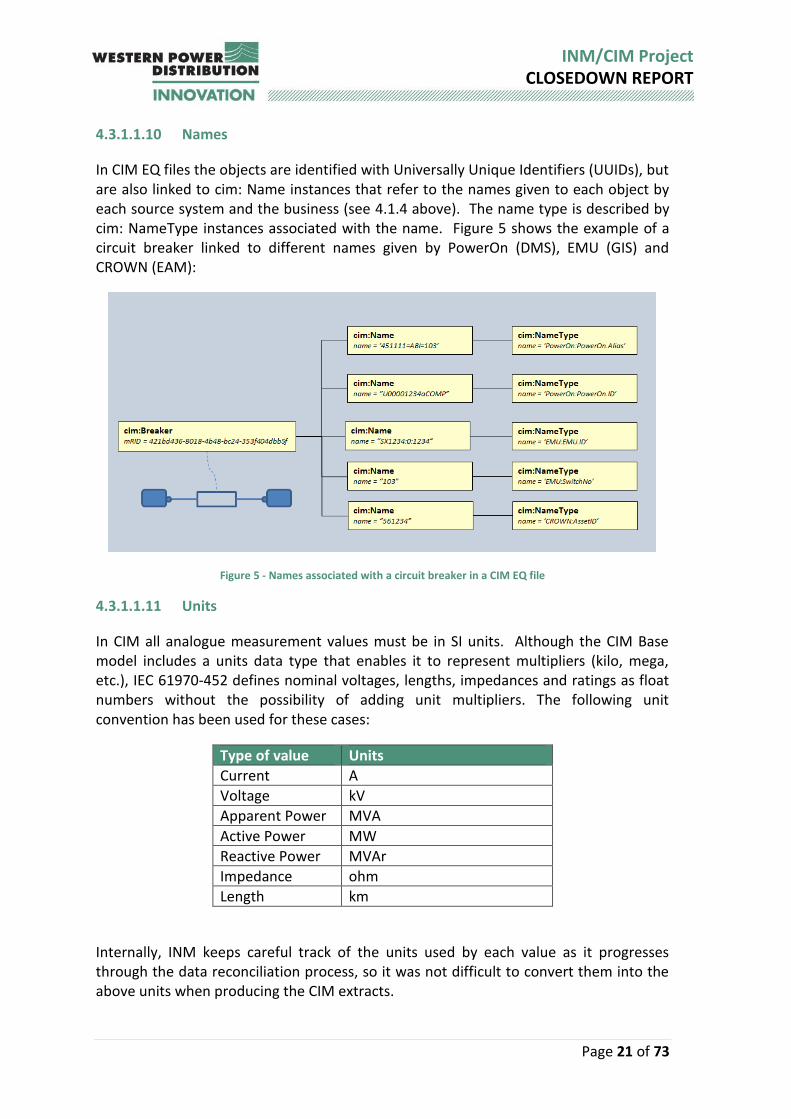
4.3.1.1.10 Names
In CIM EQ files the objects are identified with Universally Unique Identifiers (UUIDs), but are also linked to cim: Name instances that refer to the names given to each object by each source system and the business (see 4.1.4 above). The name type is described by cim: NameType instances associated with the name. Figure 5 shows the example of a circuit breaker linked to different names given by PowerOn (DMS), EMU (GIS) and CROWN (EAM):
Figure 5 - Names associated with a circuit breaker in a CIM EQ file
4.3.1.1.11 Units
In CIM all analogue measurement values must be in SI units. Although the CIM Base model includes a units data type that enables it to represent multipliers (kilo, mega, etc.), IEC 61970-452 defines nominal voltages, lengths, impedances and ratings as float numbers without the possibility of adding unit multipliers. The following unit convention has been used for these cases:
Type of value Units
Current A
Voltage kV
Apparent Power MVA
Active Power MW
Reactive Power MVAr
Impedance ohm
Length km
Internally, INM keeps careful track of the units used by each value as it progresses through the data reconciliation process, so it was not difficult to convert them into the above units when producing the CIM extracts.
Page 22 of 73
INM/CIM Project CLOSEDOWN REPORT
4.3.1.1.12 Header
The header of CIM EQ files – md: FullModel object – provides metadata on the network model exchanged, including: date when the model was created, a description of model, references to the namespaces of the CIM profiles used by the model, the version of the model, the date of the scenario represented by the model and a reference to the model authority set – in this case WPD.
4.3.1.2 CIM GL Files
ENTSOE’s CGMES (CIM for Grid Models Exchange) Geographical Location (GL) profile allows the representation of geographical locations associated with power system resources as described in CIM EQ network models.
The main classes used by ENTSOE CGMES GL profile are described below.
4.3.1.3 Coordinate System
cim: CoordinateSystem represents the coordinate reference system used by a CIM GL model. The attribute cim: CoordinateSystem.crsUrn points to the Uniform Resource Name (URN) of the coordinate reference system. The reference system used by the INM CIM export is OSGB36 (easting, northing) with URN urn:ogc:def:crs:EPSG::2770.
4.3.1.3.1 Location
cim: Location is defined by the CIM standards as “the place, scene, or point of something where someone or something has been, is, and/or will be at a given moment in time”. As shown in Figure 6, locations must be linked to power system resources of a CIM EQ model and to position points.
Page 23 of 73
INM/CIM Project CLOSEDOWN REPORT
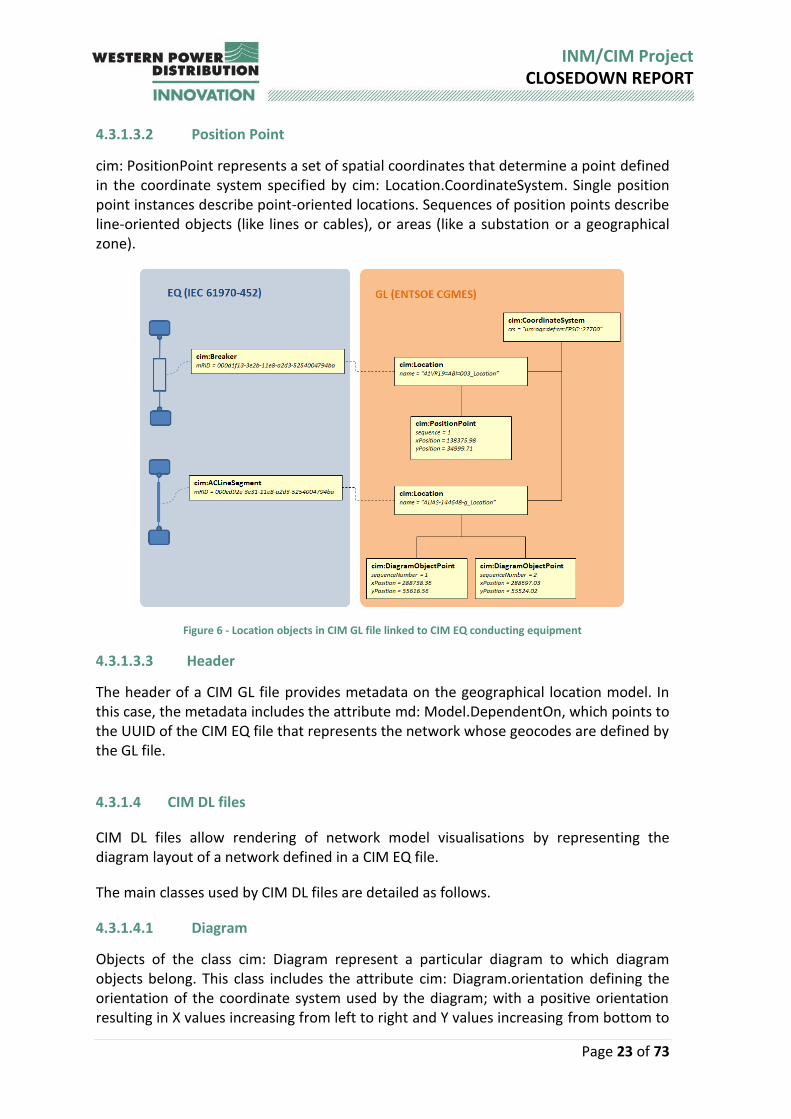
4.3.1.3.2 Position Point
cim: PositionPoint represents a set of spatial coordinates that determine a point defined in the coordinate system specified by cim: Location.CoordinateSystem. Single position point instances describe point-oriented locations. Sequences of position points describe line-oriented objects (like lines or cables), or areas (like a substation or a geographical zone).
Figure 6 - Location objects in CIM GL file linked to CIM EQ conducting equipment
4.3.1.3.3 Header
The header of a CIM GL file provides metadata on the geographical location model. In this case, the metadata includes the attribute md: Model.DependentOn, which points to the UUID of the CIM EQ file that represents the network whose geocodes are defined by the GL file.
4.3.1.4 CIM DL files
CIM DL files allow rendering of network model visualisations by representing the diagram layout of a network defined in a CIM EQ file.
The main classes used by CIM DL files are detailed as follows.
4.3.1.4.1 Diagram
Objects of the class cim: Diagram represent a particular diagram to which diagram objects belong. This class includes the attribute cim: Diagram.orientation defining the orientation of the coordinate system used by the diagram; with a positive orientation resulting in X values increasing from left to right and Y values increasing from bottom to
Page 24 of 73
INM/CIM Project CLOSEDOWN REPORT
top, and a negative orientation resulting in X values increasing from left to right and Y values increasing from top to bottom. By default, all CIM DL diagram objects created by INM CIM Export module have a negative orientation.
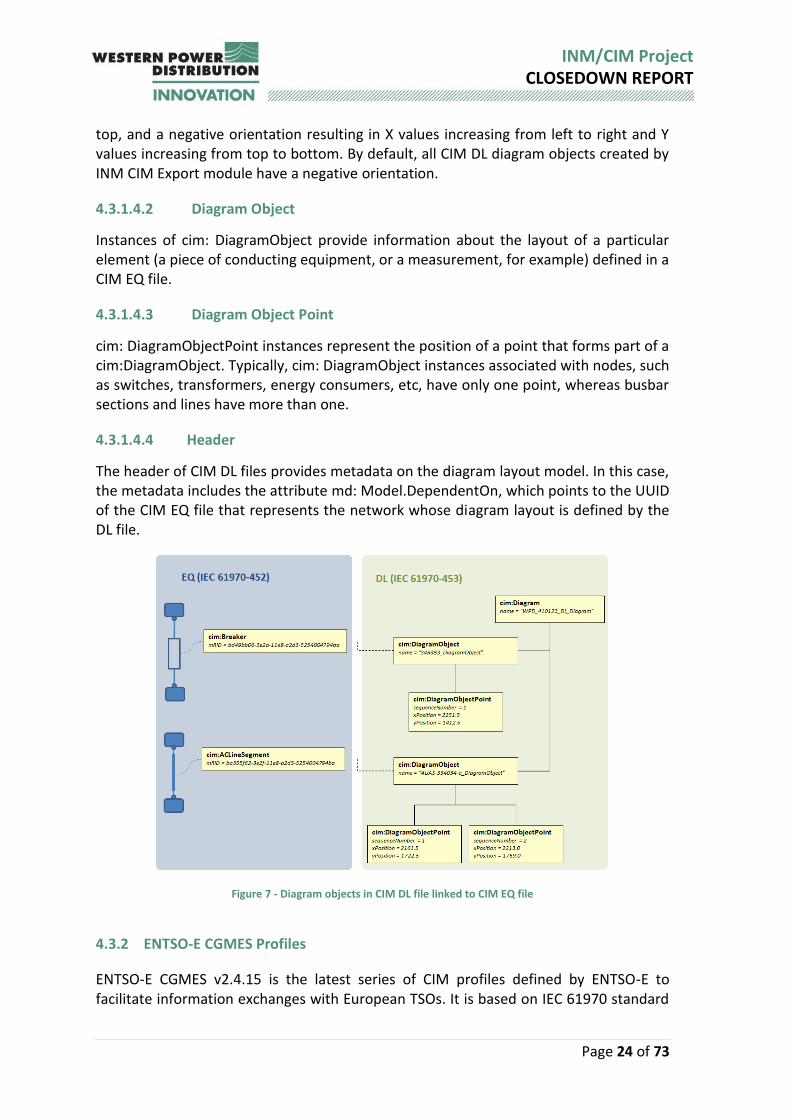
4.3.1.4.2 Diagram Object
Instances of cim: DiagramObject provide information about the layout of a particular element (a piece of conducting equipment, or a measurement, for example) defined in a CIM EQ file.
4.3.1.4.3 Diagram Object Point
cim: DiagramObjectPoint instances represent the position of a point that forms part of a cim:DiagramObject. Typically, cim: DiagramObject instances associated with nodes, such as switches, transformers, energy consumers, etc, have only one point, whereas busbar sections and lines have more than one.
4.3.1.4.4 Header
The header of CIM DL files provides metadata on the diagram layout model. In this case, the metadata includes the attribute md: Model.DependentOn, which points to the UUID of the CIM EQ file that represents the network whose diagram layout is defined by the DL file.
Figure 7 - Diagram objects in CIM DL file linked to CIM EQ file
4.3.2 ENTSO-E CGMES Profiles
ENTSO-E CGMES v2.4.15 is the latest series of CIM profiles defined by ENTSO-E to facilitate information exchanges with European TSOs. It is based on IEC 61970 standard
Page 25 of 73
INM/CIM Project CLOSEDOWN REPORT
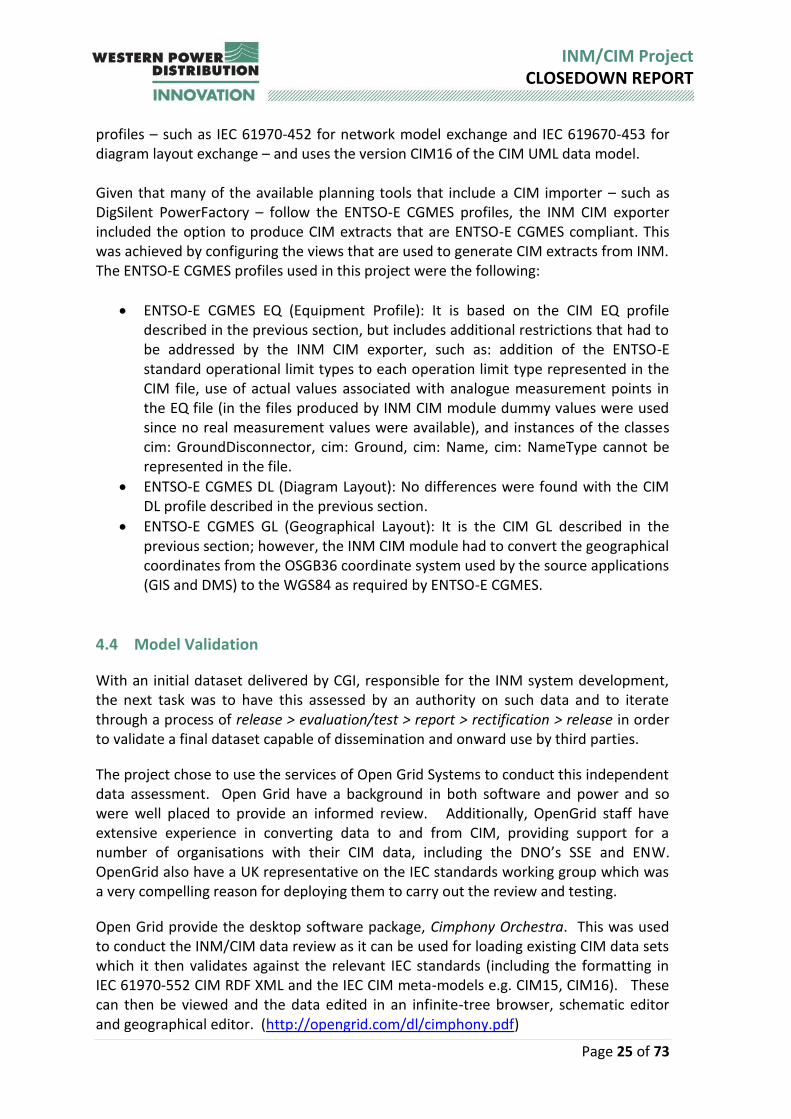
profiles – such as IEC 61970-452 for network model exchange and IEC 619670-453 for diagram layout exchange – and uses the version CIM16 of the CIM UML data model. Given that many of the available planning tools that include a CIM importer – such as DigSilent PowerFactory – follow the ENTSO-E CGMES profiles, the INM CIM exporter included the option to produce CIM extracts that are ENTSO-E CGMES compliant. This was achieved by configuring the views that are used to generate CIM extracts from INM. The ENTSO-E CGMES profiles used in this project were the following:
ENTSO-E CGMES EQ (Equipment Profile): It is based on the CIM EQ profile described in the previous section, but includes additional restrictions that had to be addressed by the INM CIM exporter, such as: addition of the ENTSO-E standard operational limit types to each operation limit type represented in the CIM file, use of actual values associated with analogue measurement points in the EQ file (in the files produced by INM CIM module dummy values were used since no real measurement values were available), and instances of the classes cim: GroundDisconnector, cim: Ground, cim: Name, cim: NameType cannot be represented in the file.
ENTSO-E CGMES DL (Diagram Layout): No differences were found with the CIM DL profile described in the previous section.
ENTSO-E CGMES GL (Geographical Layout): It is the CIM GL described in the previous section; however, the INM CIM module had to convert the geographical coordinates from the OSGB36 coordinate system used by the source applications (GIS and DMS) to the WGS84 as required by ENTSO-E CGMES.
4.4 Model Validation
With an initial dataset delivered by CGI, responsible for the INM system development, the next task was to have this assessed by an authority on such data and to iterate through a process of release > evaluation/test > report > rectification > release in order to validate a final dataset capable of dissemination and onward use by third parties.
The project chose to use the services of Open Grid Systems to conduct this independent data assessment. Open Grid have a background in both software and power and so were well placed to provide an informed review. Additionally, OpenGrid staff have extensive experience in converting data to and from CIM, providing support for a number of organisations with their CIM data, including the DNO’s SSE and ENW. OpenGrid also have a UK representative on the IEC standards working group which was a very compelling reason for deploying them to carry out the review and testing.
Open Grid provide the desktop software package, Cimphony Orchestra. This was used to conduct the INM/CIM data review as it can be used for loading existing CIM data sets which it then validates against the relevant IEC standards (including the formatting in IEC 61970-552 CIM RDF XML and the IEC CIM meta-models e.g. CIM15, CIM16). These can then be viewed and the data edited in an infinite-tree browser, schematic editor and geographical editor. (http://opengrid.com/dl/cimphony.pdf)
Page 26 of 73
INM/CIM Project CLOSEDOWN REPORT
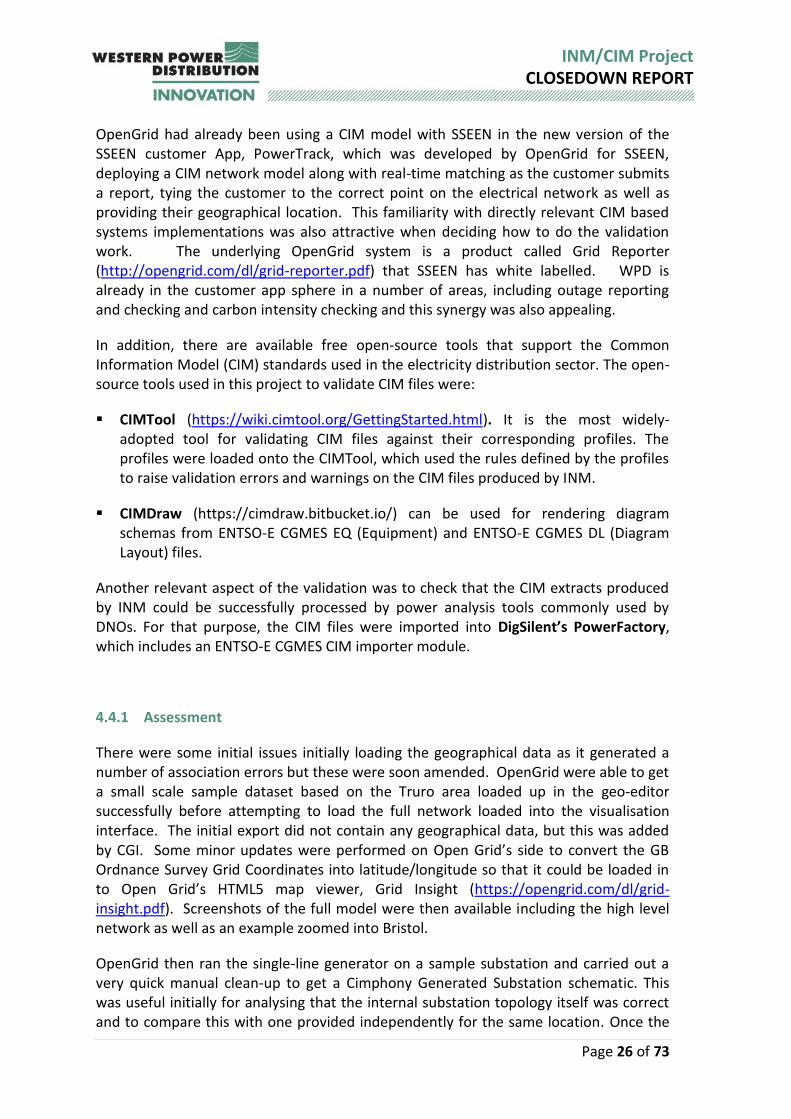
OpenGrid had already been using a CIM model with SSEEN in the new version of the SSEEN customer App, PowerTrack, which was developed by OpenGrid for SSEEN, deploying a CIM network model along with real-time matching as the customer submits a report, tying the customer to the correct point on the electrical network as well as providing their geographical location. This familiarity with directly relevant CIM based systems implementations was also attractive when deciding how to do the validation work. The underlying OpenGrid system is a product called Grid Reporter (http://opengrid.com/dl/grid-reporter.pdf) that SSEEN has white labelled. WPD is already in the customer app sphere in a number of areas, including outage reporting and checking and carbon intensity checking and this synergy was also appealing.
In addition, there are available free open-source tools that support the Common Information Model (CIM) standards used in the electricity distribution sector. The open-source tools used in this project to validate CIM files were:
CIMTool (https://wiki.cimtool.org/GettingStarted.html). It is the most widely-adopted tool for validating CIM files against their corresponding profiles. The profiles were loaded onto the CIMTool, which used the rules defined by the profiles to raise validation errors and warnings on the CIM files produced by INM.
CIMDraw (https://cimdraw.bitbucket.io/) can be used for rendering diagram schemas from ENTSO-E CGMES EQ (Equipment) and ENTSO-E CGMES DL (Diagram Layout) files.
Another relevant aspect of the validation was to check that the CIM extracts produced by INM could be successfully processed by power analysis tools commonly used by DNOs. For that purpose, the CIM files were imported into DigSilent’s PowerFactory, which includes an ENTSO-E CGMES CIM importer module.
4.4.1 Assessment
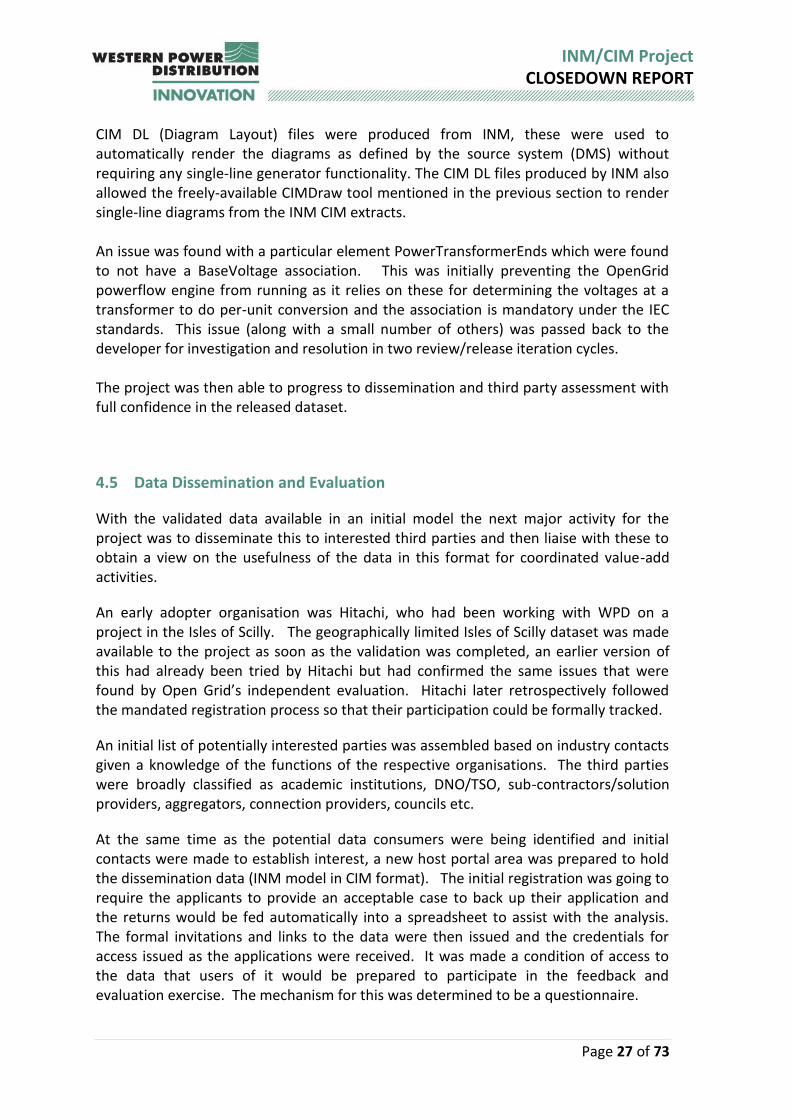
There were some initial issues initially loading the geographical data as it generated a number of association errors but these were soon amended. OpenGrid were able to get a small scale sample dataset based on the Truro area loaded up in the geo-editor successfully before attempting to load the full network loaded into the visualisation interface. The initial export did not contain any geographical data, but this was added by CGI. Some minor updates were performed on Open Grid’s side to convert the GB Ordnance Survey Grid Coordinates into latitude/longitude so that it could be loaded in to Open Grid’s HTML5 map viewer, Grid Insight (https://opengrid.com/dl/grid-insight.pdf). Screenshots of the full model were then available including the high level network as well as an example zoomed into Bristol.
OpenGrid then ran the single-line generator on a sample substation and carried out a very quick manual clean-up to get a Cimphony Generated Substation schematic. This was useful initially for analysing that the internal substation topology itself was correct and to compare this with one provided independently for the same location. Once the
Page 27 of 73
INM/CIM Project CLOSEDOWN REPORT
CIM DL (Diagram Layout) files were produced from INM, these were used to automatically render the diagrams as defined by the source system (DMS) without requiring any single-line generator functionality. The CIM DL files produced by INM also allowed the freely-available CIMDraw tool mentioned in the previous section to render single-line diagrams from the INM CIM extracts. An issue was found with a particular element PowerTransformerEnds which were found to not have a BaseVoltage association. This was initially preventing the OpenGrid powerflow engine from running as it relies on these for determining the voltages at a transformer to do per-unit conversion and the association is mandatory under the IEC standards. This issue (along with a small number of others) was passed back to the developer for investigation and resolution in two review/release iteration cycles. The project was then able to progress to dissemination and third party assessment with full confidence in the released dataset.
4.5 Data Dissemination and Evaluation
With the validated data available in an initial model the next major activity for the project was to disseminate this to interested third parties and then liaise with these to obtain a view on the usefulness of the data in this format for coordinated value-add activities.
An early adopter organisation was Hitachi, who had been working with WPD on a project in the Isles of Scilly. The geographically limited Isles of Scilly dataset was made available to the project as soon as the validation was completed, an earlier version of this had already been tried by Hitachi but had confirmed the same issues that were found by Open Grid’s independent evaluation. Hitachi later retrospectively followed the mandated registration process so that their participation could be formally tracked.
An initial list of potentially interested parties was assembled based on industry contacts given a knowledge of the functions of the respective organisations. The third parties were broadly classified as academic institutions, DNO/TSO, sub-contractors/solution providers, aggregators, connection providers, councils etc.
At the same time as the potential data consumers were being identified and initial contacts were made to establish interest, a new host portal area was prepared to hold the dissemination data (INM model in CIM format). The initial registration was going to require the applicants to provide an acceptable case to back up their application and the returns would be fed automatically into a spreadsheet to assist with the analysis. The formal invitations and links to the data were then issued and the credentials for access issued as the applications were received. It was made a condition of access to the data that users of it would be prepared to participate in the feedback and evaluation exercise. The mechanism for this was determined to be a questionnaire.
Page 28 of 73
INM/CIM Project CLOSEDOWN REPORT
Within WPD, the ENTSO-E CGMES CIM files produced by INM were shared with the Network Strategy Team to check that these files could be successfully loaded into DigSilent’s PowerFactory. While the lack of real measurement values did not allow to run power flow analysis automatically from the files, the team saw great value in the possibility of importing data directly from source systems. Thus, tests were carried out that showed that:
PowerFactory successfully imported the ENTSO-CGMES EQ & GL files produced by INM.
Once loaded into PowerFactory, the files were successfully validated by the tool’s CIM validation module.
The CIM models loaded into PowerFactory were then converted into PowerFactory Grid models.
The PowerFactory Grid models generated from the CIM files were used to render a geographical representation of the network models on a map and to inspect the electrical characteristics of selected pieces of equipment.
4.6 Host Platform Set-up
The production of the INM model also included the establishment of a host system located on premise at WPD Tipton, but isolated from all the WPD business systems for the duration of the initial project. The systems were established as three servers and loaded with the INM core software and then the development systems were replicated to reproduce the INM, effectively in-house. Going forward, these systems may be further utilised to provide system demonstration and training capabilities.
Refer to Appendix B for more information.
Page 29 of 73
INM/CIM Project CLOSEDOWN REPORT
5 Performance Compared to Original Aims, Objectives and Success Criteria
5.1 INM Implementation
The project successfully delivered an integrated and reconciled network model dataset. A range of CIM extracts were produced and several lists of data issues were reported back to the data stewards.
The project had originally intended to process three sequential cuts of data from the source systems, with the most important data anomalies being reported back to WPD’s data stewards and corrected for the following cut. In the event, the most urgent and obvious data corrections – principally those needed for correct topology reconciliation in the key focus area of Cornwall – were fed into INM manually by the project team.
This did, however, provide a good demonstration of the manual correction and fix-up facilities that INM incorporates (see 4.1.10 above) to allow data stewards to apply ‘in-flight’ data corrections in cases where it may not be practical to cleanse data immediately in the source systems. These facilities were used to address a few hundred source data anomalies that would otherwise have prevented correct matching of data.
See section 0 below for more detail on our findings in the area of source data quality and INM’s ability to reconcile the datasets.
The data evaluation by third parties also had to be foreshortened due to overruns in the schedule. It proved difficult to first sign up the trial/testing organisations and then pursue them for feedback.
Nevertheless, the project proved to be a highly successful technical operation, with the principal contractor CGI performing very well against plan and budget to produce a very useful working INM model and CIM format exchange.
5.2 CIM Data Exchange Assessment (External Third-Parties)
This area of the project proved to be challenging as it involved liaising with third parties to achieve the objectives. Whilst the tasks were all followed as intended, the eventual availability of the final full data assessment feedback was lacking by the time this Report had to be produced and therefore this version only contains the initial user feedback gathered at registration (see Section 9 below).
Page 30 of 73
INM/CIM Project CLOSEDOWN REPORT
6 Required Modifications to the Planned Approach during the Course of the Project
The initial scope of the network coverage for the pilot region was set to be Cornwall. This was changed part way through the project, expanding out to cover the whole of the South West DNO region which is one of four which WPD operates. Early on, there had been a number of project propositions around Bristol that looked like they would benefit from having a CIM model available. These were third party projects that did not in the end materialise.
There was some initial project delay necessitated by the recall of the host hardware by suppliers Dell. A further delay was incurred at the end of the project resulting from the requirement to gather and analyse feedback from third party data consumers. The project did not allow sufficient time for the final work package, at the end of other activities, to compile third party assessment feedback returns into the report. The parties that had been approached were mainly DNOs and other industry bodies, all of whom are naturally busy with their own priority work, so the whole process of CIM export/import assessment was actually quite a long drawn out process and the project did not wish to press these participants unnecessarily. We now expect to maintain a log of participant feedback to supplement this final report and to inform our strategy. An additional external validation activity was carried out following the delivery by INM/CIM subcontractor CGI of the production dataset for the South West region. The data was sent to OpenGrid who not only have a product which can import in CIM format, they also have considerable expertise in the CIM subject matter area. This validation activity used the Cimphony product and resulted in 2 complete release-test-update cycles to chase down and rectify the issues that were observed. The intention of the activity was to remove the potential for external release by WPD of a dataset which did not match data consumer expectations. We also allowed access, in parallel to the above activity, for Hitachi who had a pressing need to obtain the network data for the Isles of Scilly. This allowed us to pilot user test the data request and dissemination process before again inviting the full set of initially contacted data consumers to apply via the WPD data dissemination portal. It had been hoped to match the PSSE branches to those from PowerOn so that PSSE’s EHV conductor-type information could be incorporated into the core model. But this proved more challenging than originally anticipated. Thus, a simpler approach was adopted for providing this information in the output datasets. A manual mapping was done between PSSE’s table of EHV conductor types and the available EMU conductor type data, so that each distinct type found at EHV in EMU was mapped to a corresponding PSSE type. This led to a small loss of accuracy as PSSE’s categorisation takes account of the physical layouts of the conductors whereas EMU’s does not.

Page 31 of 73
INM/CIM Project CLOSEDOWN REPORT
7 Project Costs
Activity Budget Actual
WPD Project Management/Oversight £69,605 £69,605
WPD Technical Oversight/Subcontract management £102,000 £97,344
CGI Contract including Change Request £542,518 £554,993
Independent Data Validation (external) £7,200 £7,200
Equipment (WPD CFI) £22,000 £20,611
The total budget for this project was £751,744. The actual spend was £749,753 representing an under spend of 0.3%. CGI contract costs were higher than expected due to the need for extra work to find and correct the errors in an early version of the output reported by Hitachi, and because of the delays due to the recall of the Dell servers, however these additional costs were offset by the small underspends in technical oversight costs and equipment costs, i.e. the cost of the servers, being lower than budgeted.

Page 32 of 73
INM/CIM Project CLOSEDOWN REPORT
8 Lessons Learnt for Future Projects
Expected learning foreseen at the project outset included:
1) The number of data discrepancies in existing systems; 2) The processes required to create CIM format data models; 3) The benefits of CIM format data models; 4) Whether it is worth spending time and money on a CIM, i.e. does it actually
deliver something that delivers measurable value to the business? 5) Does having a standard format actually just lead to excessive customisation? 6) What is the existing level of data quality? (And how can the business
measure quality?) 7) What is the best way to perform text matching on non-identical items? i.e.
same words but not necessarily in the right order? 8) How can we improve data quality by identifying discrepancies between
datasets? (How do we measure existing vs new); 9) How much simpler is the process of importing data into planning tools using
CIM? (improving the options to adopt better planning tools or support multiple planning tools);
10) What value do third parties put on having CIM data available for their use? Does it simplify data exchange with third parties;
11) Can the use of CIM format data improve the options to support local control algorithms?
12) Does the use of CIM format data simplify the creation of interfaces between systems either as point to point interfaces or message based?
Page 33 of 73
INM/CIM Project CLOSEDOWN REPORT
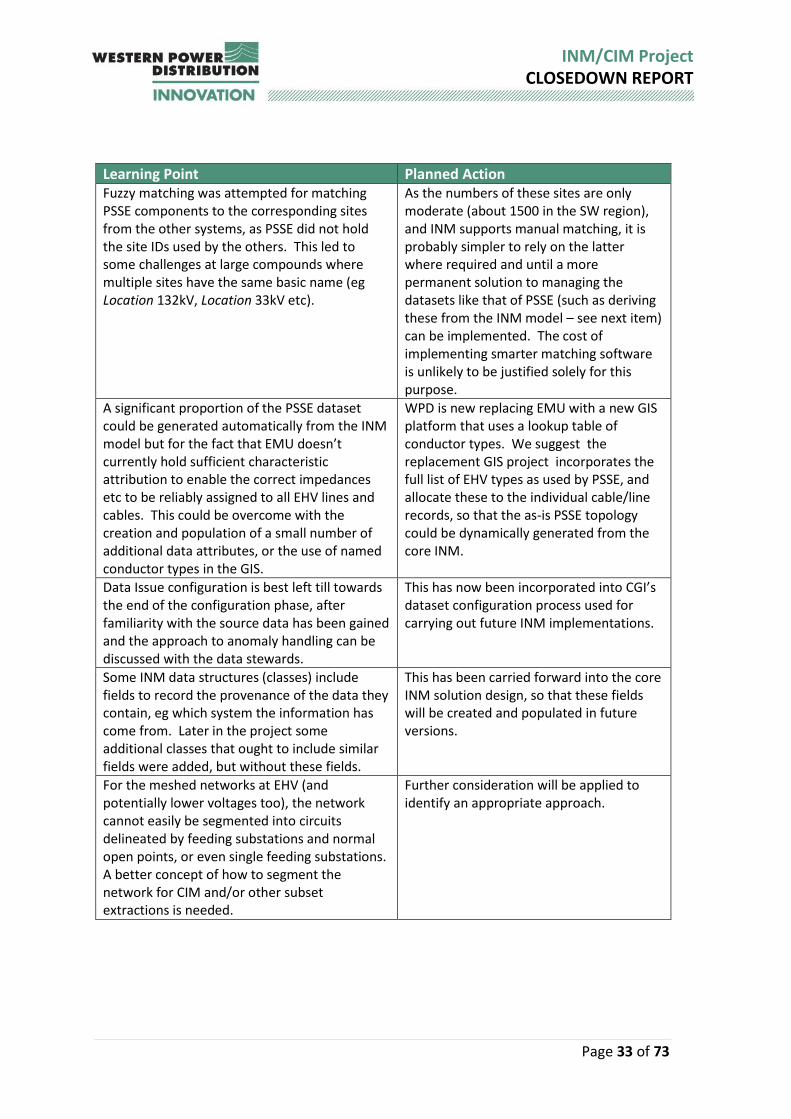
Learning Point Planned Action Fuzzy matching was attempted for matching PSSE components to the corresponding sites from the other systems, as PSSE did not hold the site IDs used by the others. This led to some challenges at large compounds where multiple sites have the same basic name (eg Location 132kV, Location 33kV etc).
As the numbers of these sites are only moderate (about 1500 in the SW region), and INM supports manual matching, it is probably simpler to rely on the latter where required and until a more permanent solution to managing the datasets like that of PSSE (such as deriving these from the INM model – see next item) can be implemented. The cost of implementing smarter matching software is unlikely to be justified solely for this purpose.
A significant proportion of the PSSE dataset could be generated automatically from the INM model but for the fact that EMU doesn’t currently hold sufficient characteristic attribution to enable the correct impedances etc to be reliably assigned to all EHV lines and cables. This could be overcome with the creation and population of a small number of additional data attributes, or the use of named conductor types in the GIS.
WPD is new replacing EMU with a new GIS platform that uses a lookup table of conductor types. We suggest the replacement GIS project incorporates the full list of EHV types as used by PSSE, and allocate these to the individual cable/line records, so that the as-is PSSE topology could be dynamically generated from the core INM.
Data Issue configuration is best left till towards the end of the configuration phase, after familiarity with the source data has been gained and the approach to anomaly handling can be discussed with the data stewards.
This has now been incorporated into CGI’s dataset configuration process used for carrying out future INM implementations.
Some INM data structures (classes) include fields to record the provenance of the data they contain, eg which system the information has come from. Later in the project some additional classes that ought to include similar fields were added, but without these fields.
This has been carried forward into the core INM solution design, so that these fields will be created and populated in future versions.
For the meshed networks at EHV (and potentially lower voltages too), the network cannot easily be segmented into circuits delineated by feeding substations and normal open points, or even single feeding substations. A better concept of how to segment the network for CIM and/or other subset extractions is needed.
Further consideration will be applied to identify an appropriate approach.
Page 34 of 73
INM/CIM Project CLOSEDOWN REPORT
9 The Outcomes of the Project
In summary, the project outcomes can be stated as follows:
The Integrated Network Model capability was built and data for a selected WPD operating region was assembled into an actual working model. Key statistics were generated from this: assets included, errors identified. These are summarised here and presented in more detail in Appendix A;
The model was loaded into third party software and validated and this also showed how data can be exchanged using the CIM format;
Feedback from third parties thought likely to benefit from access to WPD operational network model data was sought;
The decision was made to extend the initial system and model and roll this out into the business.
Further work is still required, including for us to follow-up with the third parties who have yet to respond.
These main points are expanded on further in the sections below.
9.1 Build of INM Production Capability
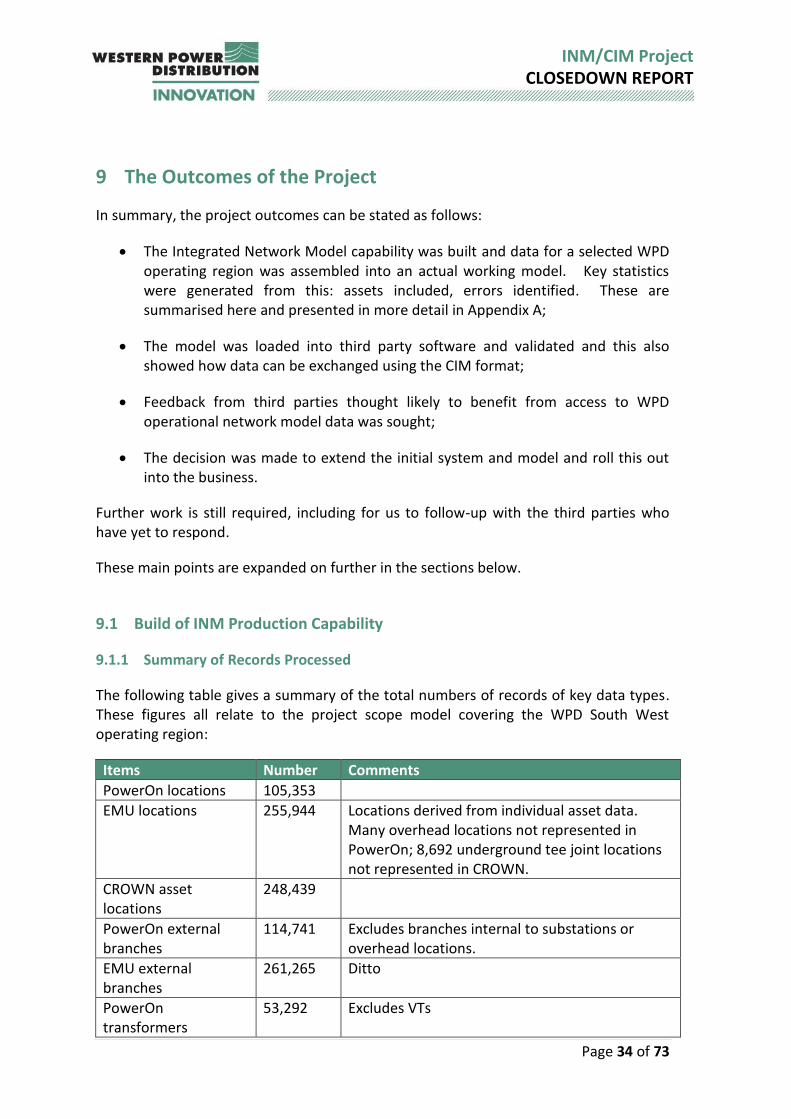
9.1.1 Summary of Records Processed
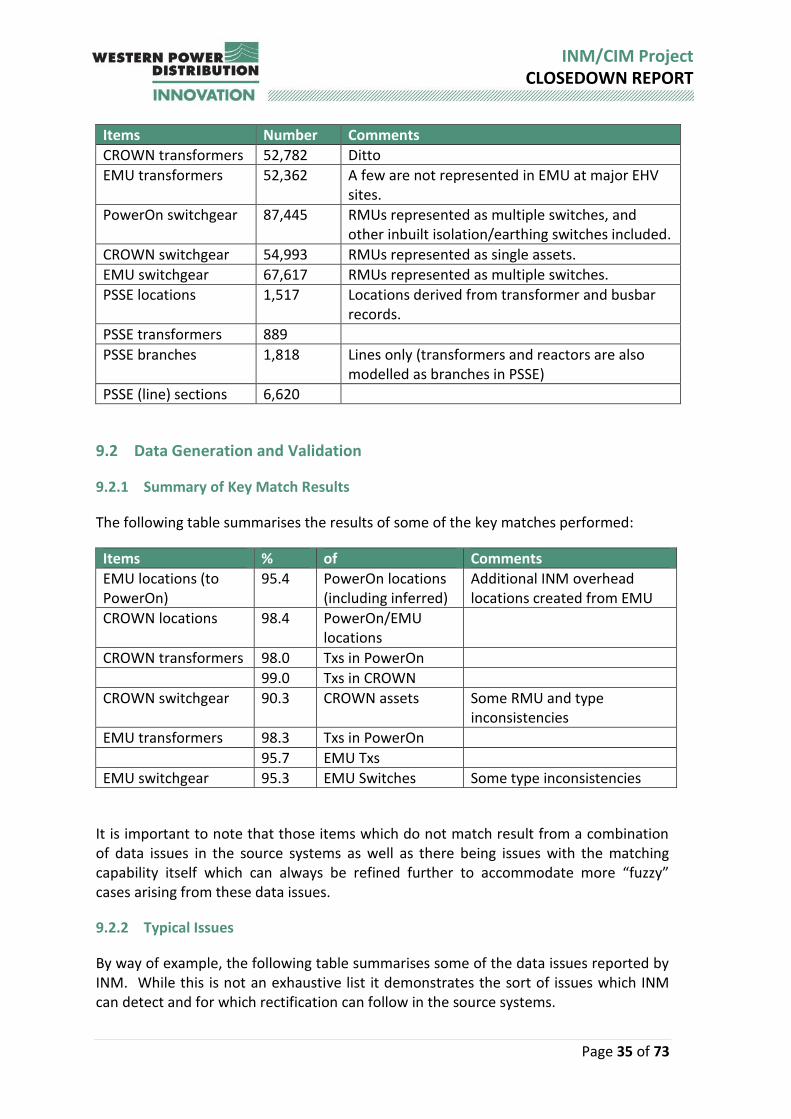
The following table gives a summary of the total numbers of records of key data types. These figures all relate to the project scope model covering the WPD South West operating region:
Items Number Comments
PowerOn locations 105,353
EMU locations 255,944 Locations derived from individual asset data. Many overhead locations not represented in PowerOn; 8,692 underground tee joint locations not represented in CROWN.
CROWN asset locations
248,439
PowerOn external branches
114,741 Excludes branches internal to substations or overhead locations.
EMU external branches
261,265 Ditto
PowerOn transformers
53,292 Excludes VTs
Page 35 of 73
INM/CIM Project CLOSEDOWN REPORT
Items Number Comments
CROWN transformers 52,782 Ditto
EMU transformers 52,362 A few are not represented in EMU at major EHV sites.
PowerOn switchgear 87,445 RMUs represented as multiple switches, and other inbuilt isolation/earthing switches included.
CROWN switchgear 54,993 RMUs represented as single assets.
EMU switchgear 67,617 RMUs represented as multiple switches.
PSSE locations 1,517 Locations derived from transformer and busbar records.
PSSE transformers 889
PSSE branches 1,818 Lines only (transformers and reactors are also modelled as branches in PSSE)
PSSE (line) sections 6,620
9.2 Data Generation and Validation
9.2.1 Summary of Key Match Results
The following table summarises the results of some of the key matches performed:
Items % of Comments
EMU locations (to PowerOn)
95.4 PowerOn locations (including inferred)
Additional INM overhead locations created from EMU
CROWN locations 98.4 PowerOn/EMU locations
CROWN transformers 98.0 Txs in PowerOn
99.0 Txs in CROWN
CROWN switchgear 90.3 CROWN assets Some RMU and type inconsistencies
EMU transformers 98.3 Txs in PowerOn
95.7 EMU Txs
EMU switchgear 95.3 EMU Switches Some type inconsistencies
It is important to note that those items which do not match result from a combination of data issues in the source systems as well as there being issues with the matching capability itself which can always be refined further to accommodate more “fuzzy” cases arising from these data issues.
9.2.2 Typical Issues
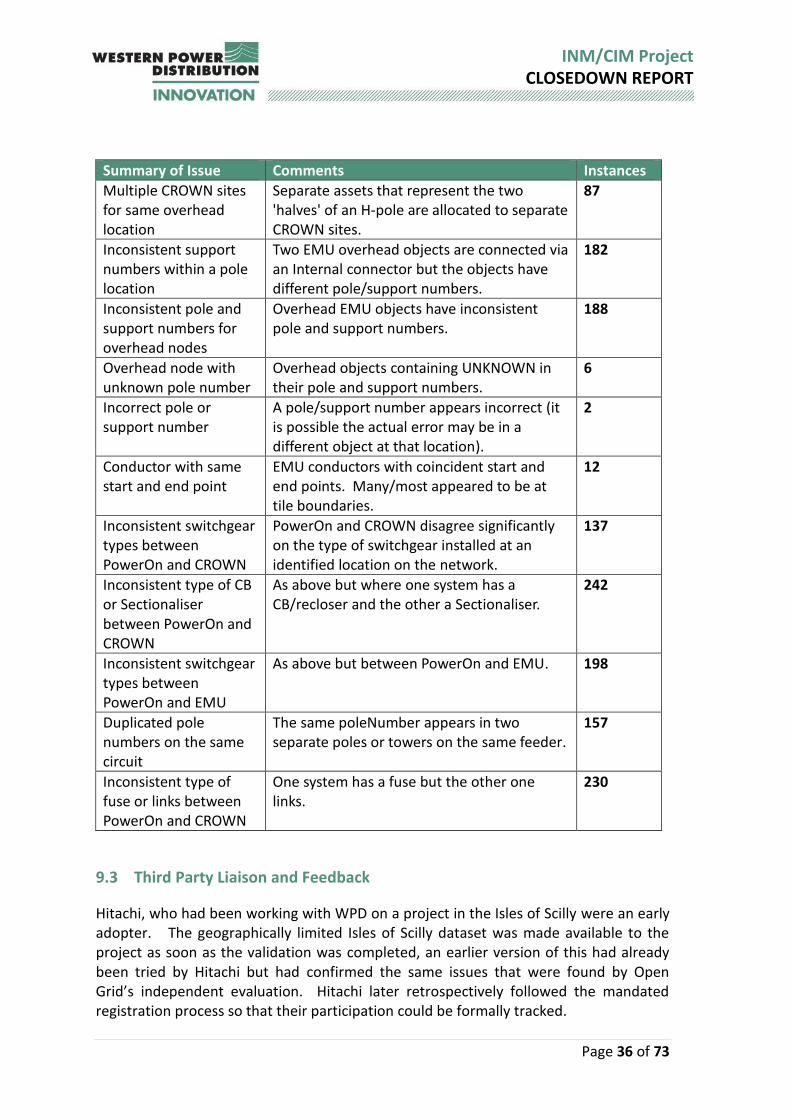
By way of example, the following table summarises some of the data issues reported by INM. While this is not an exhaustive list it demonstrates the sort of issues which INM can detect and for which rectification can follow in the source systems.
Page 36 of 73
INM/CIM Project CLOSEDOWN REPORT
Summary of Issue Comments Instances
Multiple CROWN sites for same overhead location
Separate assets that represent the two 'halves' of an H-pole are allocated to separate CROWN sites.
87
Inconsistent support numbers within a pole location
Two EMU overhead objects are connected via an Internal connector but the objects have different pole/support numbers.
182
Inconsistent pole and support numbers for overhead nodes
Overhead EMU objects have inconsistent pole and support numbers.
188
Overhead node with unknown pole number
Overhead objects containing UNKNOWN in their pole and support numbers.
6
Incorrect pole or support number
A pole/support number appears incorrect (it is possible the actual error may be in a different object at that location).
2
Conductor with same start and end point
EMU conductors with coincident start and end points. Many/most appeared to be at tile boundaries.
12
Inconsistent switchgear types between PowerOn and CROWN
PowerOn and CROWN disagree significantly on the type of switchgear installed at an identified location on the network.
137
Inconsistent type of CB or Sectionaliser between PowerOn and CROWN
As above but where one system has a CB/recloser and the other a Sectionaliser.
242
Inconsistent switchgear types between PowerOn and EMU
As above but between PowerOn and EMU. 198
Duplicated pole numbers on the same circuit
The same poleNumber appears in two separate poles or towers on the same feeder.
157
Inconsistent type of fuse or links between PowerOn and CROWN
One system has a fuse but the other one links.
230
9.3 Third Party Liaison and Feedback
Hitachi, who had been working with WPD on a project in the Isles of Scilly were an early adopter. The geographically limited Isles of Scilly dataset was made available to the project as soon as the validation was completed, an earlier version of this had already been tried by Hitachi but had confirmed the same issues that were found by Open Grid’s independent evaluation. Hitachi later retrospectively followed the mandated registration process so that their participation could be formally tracked.

Page 37 of 73
INM/CIM Project CLOSEDOWN REPORT
In addition to this, the ENTSO-E CGMES CIM EQ & DL files produced by INM were successfully imported into and processed by one of the planning tools used within WPD’s Network Strategy Team, the DigSilent PowerFactory. PowerFactory was able to successfully load and validate the files, and to convert the CIM models into PowerFactory models that were then used to render the network models on a map and to inspect electrical characteristics of selected pieces of equipment. The team saw the value of one of the potential uses of the INM/CIM applications (see 12.2.5 and 12.2.6); that is, the ability to automatically import complete models generated from WPD core systems. At the point of dissemination, other likely parties, which had previously been contacted, were invited to register to access and use the data and to submit their details (organisation, planned uses, interests etc.) via a webform. The initial list of potentially interested parties was assembled based on industry contacts given a knowledge of the functions of the respective organisations. The third parties were broadly classified as academic institutions, DNO/TNO, subcontractors/solution providers, aggregators, connection providers, councils etc. These invitations to participate in the assessment of the WPD South West area network data in CIM format were issued to around 25 organisations in early July 2018 once the data had been independently validated externally. 14 of these organisations responded by completing the data dissemination portal webform registration process which required completion of a series of questions on which the following preliminary analysis was based. The questions were intended to provide a pre-use survey of current similar data uses and expectations for CIM. The results of this small scale pre-use survey are presented below. At the same time as the potential data consumers were being identified and initial contacts were made to establish interest, a new host portal area was prepared to hold the dissemination data (INM model in CIM format). The initial registration was going to require the applicants to provide an acceptable case to back up their application and the returns would be fed automatically into a spreadsheet to assist with the analysis. The details from these registration responses are reproduced below. The formal invitations and links to the data were then issued and the credentials for access issued as the applications were received. It was made a condition of access to the data that users of it would be prepared to participate in the feedback and evaluation exercise. The mechanism for this was determined to be a final questionnaire. The project overestimated our ability to obtain third party feedback on data usage in time for this report. All of the organisations approached were initially keen to be involved but all clearly have their own work priorities which are not necessarily aligned to the INM/CIM project timescales. Collation of results from a planned comprehensive feedback questionnaire following data access and use therefore remains an outstanding action of the project. As noted above, the project was unable to garner sufficient

Page 38 of 73
INM/CIM Project CLOSEDOWN REPORT
returns from the organisations in time, even on following-up after a three month grace period. Please refer to Appendix C, for the summary results in graphical format, where it is readily seen that around 60% of respondents do not currently use CIM format data. Data uses in whatever format are diverse and cover most assets, data types and voltage levels. There was a roughly 50/50 split by respondents who answered the question regarding their mode of use as one-off/custom or repeating, either of which are readily supported by the INM providing data in CIM format. Clearly pre-defined repeatable exports are to be preferred to the servicing of custom requests. Such repeatable reports may answer many custom requests if they are comprehensive enough.
9.4 Model Extension and Rollout
This is now following in a new WPD BAU project timed to start in early 2019 and forming part of the DSO transition activities to help provide a major component of the data layer in the DSO architecture.

Page 39 of 73
INM/CIM Project CLOSEDOWN REPORT
10 Data Access Details
This project has been principally concerned with the derivation of a major new dataset relating to the WPD network. The project included a major activity to disseminate INM data, making it available via a company external data portal to approved third parties in the portable CIM format.
To register to use the data, potential data consumers were asked to visit:
https://www.westernpower.co.uk/Innovation/Projects/Current-Projects/Common-Information-Model/CIM-Questionnaire.aspx
from where, once the user credentials had been emailed to the supplied email address, the data will be accessible via the data portal (the Partners portal)vat:
https://www.westernpower.co.uk/Partners/WPD-Integrated-Network-Model-Data.aspx
The following also provides a link to project data page on innovation website www.westernpower.co.uk/Innovation/Contact-us-and-more/Project-Data.aspx)
10.1 Onward Systems Linkage
In addition to providing master data management the Integrated Network Model can orchestrate data services to a range of applications. Driven forward by the new DSO requirements, the applications can be upgraded versions of existing systems or new smart applications. DSO internal applications to benefit from such a data service can include infrastructure, distribution, and operational planning, and supporting the exchange of data with the TSO. Future applications that can also be supported from a data service perspective, include digital twin for asset analytics, planned outage coordination and third party information provision for example to DER customers.
Furthermore, by making the WPD network data model available in the portable CIM format, the project acts as an enabler for a more complete and integrated overall business systems implementation, providing this rich dataset for use by downstream data analysis, presentation and visualisation tools within the business as well as supporting third party data import and export. Onward tools that can be used with the WPD CIM format INM dataset include:
Standard database data manipulation tools to facilitate direct dataset import by third parties;
Visualisation and analysis tools such as Open Grid Cimphony (which was used on the project to assess the data prior to dissemination), or CIMTool;

Page 40 of 73
INM/CIM Project CLOSEDOWN REPORT
11 Foreground IPR
The project created two main elements of IPR:
1. An initial dataset for this region which is already being disseminated and used by third parties (see the link above where the data is also described). The dataset would be of interest to any organisation with an interest in the fine details of the WPD networks. The initial dataset is fairly static in the sense that it is not being refreshed, so will age as the source systems accept operational updates;
2. An INM data model creation capability for the South West operating region of WPD, expandable to the other regions and also down to LV. Only WPD and its contractors would be expected to operate this facility and the contracted developers, CGI IT UK Limited, retains all intellectual property rights in such material including rights to market and further develop the design solution for their own commercial purposes. However, in accordance with the NIA funding mechanism, CGI intend to include the innovation project specific foreground IPR in related CGI offerings and will provide a royalty free licence to other DNOs where such IPR is provided to the DNO as part of a wider solution.

Page 41 of 73
INM/CIM Project CLOSEDOWN REPORT
12 Planned Implementation
Capitalising on the success of the INM/CIM project implementation described in this report, WPD is currently establishing a follow on project based in BaU to establish an Integrated Network Model for the whole of the WPD networks. This next phase will expand the initial INM/CIM project scope in both breadth (across all geographies) and depth (eventually down to LV). This activity was originally planned to commence after successful delivery of the initial INM, sometime after July 2018. Initial business discussions and WPD Information Resources inputs are currently being progressed in order to achieve this strategic aim which will be part of the DSO transition programme.
12.1 Business Assessment
As part of the project, once the implementation had been completed and running concurrently with the external dissemination activity, a small number of business areas were approached to assess the INM, some of which are expanded on below. Additionally, the INM data issues report created from the process of merging the source datasets (to yield the proof of concept INM dataset for the South West operating region) was passed to the team conducting the migration of the EMU GIS system across to the new Electric Office GIS system. This was to support the data cleansing activity being conducted by that migration.
12.2 Potential INM/CIM Applications
There are a range of possible downstream system implementations which are facilitated by the availability of INM data in CIM format, some of which are already evidenced by developments undertaken within the industry. This section is intended to list those which have become known to us or which can perhaps be anticipated at this stage. This section has been enhanced in discussion with OpenGrid Solutions whose work on the project, based on their own CIM based commercial offerings, has been described in the sections above. Broadly speaking, the high level capabilities which follow from the implementation of the INM are:
Consistent presentation of consolidated rich network data information – for display, analytics and/or linkage to a variety of downstream systems;
As a result of compiling this consistent view, generation of contributing dataset errors/mismatches (data cleansing support capability);
Versioning and differences capability –tracking of changes to the complete dataset between issues of the network model;
Open data exchange – inside the organisation and/or for WPD export/third party import;
Page 42 of 73
INM/CIM Project CLOSEDOWN REPORT
12.2.1 Network Visualisation
The network can be visualised and even animated using third party tools. While such visualisation is possible within the source data systems (PowerON, EMU etc) these are specialised applications and do not have the full set of data elements available in an INM. Existing CIM based network visualisation examples include the Open system CIMView and the OpenGrid commercial software package Cimphony Orchestra. As detailed above, this latter package was used to conduct the INM/CIM data review as it can be used for loading existing CIM data sets which can then be checked for compliance to the standard and also viewed and the data edited in an infinite-tree browser, schematic editor and geographical editor. OpenGrid also provide a HTML5 map viewer, Grid Insight (see https://opengrid.com/dl/grid-insight.pdf and https://opengrid.com/dl/cimphony.pdf). IDNO’s and connection providers may find such capabilities useful. 12.2.2 Network Localisation (Pinning a “user” to the Network)
Open Grid use a CIM model with SSEEN in the new version of their customer facing App, PowerTrack, which was developed by Open Grid for SSEEN, deploying a CIM network model along with real-time matching as the customer submits reports, tying the customer to the correct point on the electrical network as well as providing their geographical location. The underlying Open Grid system is a product called Grid Reporter (https://opengrid.com/dl/grid-reporter.pdf) that SSEEN has white labelled. WPD has to date used other localisation mechanisms in simple customer facing apps2 such as the Carbon Tracer – where SQL spatial lookups are conducted within supply area geographic polygons which have themselves been prepared in advance and whose outline implicitly includes the network topological extent information needed to carry out the localisation function. These lookups however are based on a defined geographic area, so localising a position to a feeder rather than a substation (the current lowest level of analysis for the ESA polygons currently being the primaries) would require the more complete capabilities of a network model utility or the further (and somewhat onerous) extension of the polygon analysis to lower levels. This level of analysis is expected to become highly relevant for deploying future customer utility apps or other capabilities for example: managing optimum times for EV charging. 12.2.3 Power Analysis Systems Linkage
Much effort is expended in maintaining electrical models for the network in systems such as IPSA, PSSE and DINIS and the network data and associated measurements must be prepared first before the models can be prepared. Ongoing maintenance in respect
2 In such apps a small level of error is more acceptable in a trade-off for simplicity. Tests of polygon versus feeder tracing lookups reveals an accuracy of 96.6% for the polygon mechanism, with the errors being in “edge cases” around polygon boundaries, and on the coasts where the complex polygon outline needed to follow the coast precisely has not been implemented accurately enough to date.
Page 43 of 73
INM/CIM Project CLOSEDOWN REPORT
of tracking changes becomes an issue. Linking the power analysis tools to the CIM version of the network data would offer a better route to setting up and running such systems with significant potential for time savings for the analysts who use these power analysis systems. The project included the PSSE model in the South West INM, and supported a partial CIM data import into the PSSE software which was concluded successfully to demonstrate the capability for such onward linkage to support business processes. This area was still being worked on actively as this report was being prepared for publication. 12.2.4 Regulatory and Other Reporting
There are several regulatory reporting requirements which DNOs have to meet and the supporting data that facilitates this process must be assembled on an ongoing basis by the reporting teams at the present time. The Long Term Development Strategy (LTDS) is one such example which requires considerable ongoing, often manual data management to compile the necessary detail. While such processes also tend to require data not necessarily included in the INM itself, the INM dataset itself is naturally richer than the source systems and linkage to additional data can be included. The other advantage of the INM is that the dataset should be more self-consistent, assuming that the INM creation process has previously chased out for correction reported consistency issues during previous iterations. 12.2.5 Planner Role
The role of the Planner in WPD often requires the various systems to be consulted and request specific data to be assembled when conducting an investigation and this can sometimes be an onerous, time consuming distraction from the main planning process. The systems consulted do need to be providing the current most up to data system view, so to service planners an INM would need to be capable of meeting this requirement which implies the operation of an overnight INM reference compilation.
12.2.6 Strategic Network Studies and Analysis Functions
WPD prepares a set of regional strategy analysis papers in an ongoing cycle. The most recently completed one in July 2018 [Ref 1] is that for the WPD South West operating region. The INM network data and potential to tie this to “measurement” points and access analogue data for such measurements would support the Strategic analysis function. This is currently being assessed internally by the Strategic Studies team. 12.2.7 Support for Innovation Projects
The need for an integrated network model for a specific network trials area created the conditions, formal requirement and budget for the first version of INM3 on the FALCON
3 The FALCON INM was called the ANM at that time (appearing as such in the FALCON documentation), standing for Authorised Network Model. This term has subsequently been avoided due to the clash with the unrelated acronym Active Network Management.
Page 44 of 73
INM/CIM Project CLOSEDOWN REPORT
project in 2012. At that time, FALCON was developing a network evolutionary modelling tool called SIM (Scenario Investment Model) which could postulate different scenarios for how the network might evolve out to 2030 and how resulting downstream constraints might be mitigated by different engineering and commercial techniques that could be applied as necessary. The SIM required a complete network model (the ANM precursor to the INM) and power flow analysis (based on the TNEI software modelling tool IPSA).
The sort of network view provided by INM/CIM is likely to be a recurrent requirement during the implementation of innovation projects, and the availability of an INM model and CIM data export/import route that becomes available through the operation of a production INM capability clearly offers the potential to minimise time spent having to prepare the enabling data on such projects. The clear additional benefit is that this also minimises the time input required from the Information Resources teams responsible for managing the main operational business systems. While such projects are not regularly occurring events, data requirements are likely to become more demanding as innovation projects become more complex, and when they do occur, can therefore be additional work-load to the business.
Current examples of innovation projects already using the CIM data include the Hitachi/Isles of Scilly project mentioned earlier in this document, and the Cornwall local Energy Market (LEM) where we are likely to use the CIM to support the means of “pinning” a participant onto the network and through the incorporation of network hierarchy and constraints. The LEM is a commercial market platform (currently in trials) allowing WPD to select and match generation/load adjustment offers by participating organisations, to network constraints. 12.2.8 Future App Support
As noted in the Section above, rich backing dataset support for both future internal as well as external apps becomes much more feasible with an INM model already being available in a portable CIM format. In this case, app designers can be more confident that they will have the necessary standard network data support “off the shelf” without having to assemble the basic elements themselves, and indeed, with established data structures there may even be reusable code modules already available (these resulting from multiple app implementations) for manipulating this data and therefore available to the general app production process. The possibilities are manifold for what apps may be required to do, so there will almost certainly always be requirements for bespoke data elements for use in apps as well as additional supporting objects as exampled by the supply area polygons used within the WPD Carbon Tracer app. Such additional elements and bespoke datasets still need to have linkage to the INM/CIM via suitable keys (for example the Network Reference ID from Crown).

Page 45 of 73
INM/CIM Project CLOSEDOWN REPORT
12.2.9 General Data Exchange Applications
The capability to provide (and receive where applicable) network data by exchanging it with third parties is a clear application of the CIM portable data concept. This has already been explored by the project as part of the dissemination and assessment/feedback process undertaken following completion of the SW model development. Not only does this mechanism support the free flow of network information for academic, regulatory and other reporting purposes, it also acts as an enabler for onwards systems linkage and even new systems developments by solution providers.
12.2.10 National Grid Coordinated Reporting
This is a specialised and already identifiable data exchange application for the WPD Network data provided in CIM format to National Grid. The use of CIM as a means to supply the network data under the WPD Grid code Wk24 requirements is a possible option to be explored in the future, and WPD has looked at this with National Grid as part of this project with an extended discussion. The preliminary conclusion was that there are a number of ways in which the INM could support the evolution of T/D data exchange and the aspiration for a shared access national and regional network model. Enhancement areas and considerations that could be delivered in the future include:
• Importantly, the current version of the INM model is for the network “as is”, whereas the wk24 process requires a level of forward projection. This is already identified as a possible enhancement/extension. Such an extension would need to incorporate certain pending network changes and the mechanisms for achieving this would need to be explored.
• The existing INM model is a proof of concept pilot, currently covers only one of the four WPD DNO regions, and needs extending geographically (as well as down to LV for other applications).
• The full extent of the wk24 dataset is not met by the INM output dataset alone as the network topology is enriched with a range of additional data.
• No other DNO’s are currently preparing their submissions in a CIM format, meaning that there would be multiple import processes were WPD to lead the way even if this were immediately possible.
To continue the process of assessing the level and degree of change needed, the following broad activities could be undertaken:
Assess the data provided in the CIM models;
Review to rationalize this to include only the necessary data to be compliant;
Definition of interface points. (In CGMES these are known as X-nodes);
Conduct a trial / parallel run;
Consideration of RDf Id management and persistency under the European code requirements.
Page 46 of 73
INM/CIM Project CLOSEDOWN REPORT
Another point to be considered is how to ensure diagrams could be transferred as part of this process. The current CIM version being used for model export to Europe does not include diagrams. This may change in the future. The increased use of CIM as a means of supporting WPD’s production of its Week 24 grid code requirements is a positive aspiration with INM being a key future enabler.
13 Other Comments
Some other DNOs have indicated that they have concentrated data enhancement effort to date on their individual core systems rather than, as they currently perceive it, creating a further data layer which requires yet more management. This tactical pattern of activity is encouraged by the availability of a CIM import/export capability in individual systems. Limited bilateral system comparisons, incomplete data services and the tendency to duplicate data in core systems rather than maintaining a federated master data set are all observed short-comings of this approach.
In contrast for WPD, the INM is fully recognised and understood as an abstraction layer, which is not actively maintained as a separate data entity in itself, but is derived from source systems which provide a federated master dataset. In forming a new INM model version, the consistency reports allow the data custodians to take a view on how, and in which, source systems any consistency issues need to be addressed. Without the INM there is a missing capability to apply cross multiple core systems consistency, and avoid the consequent loss of data accuracy. With the onset of the Distribution Operator role, the INM is a key enabler of not only master data management, but the provision of data services to new and existing applications, and critically delivering the required integration enablement to both internal enterprise and external stakeholders.

Page 47 of 73
INM/CIM Project CLOSEDOWN REPORT
14 Contact
Further details on replicating the project can be made available from the following points of contact: Innovation Team Western Power Distribution, Pegasus Business Park, Herald Way, Castle Donington, Derbyshire DE74 2TU Email: [email protected]
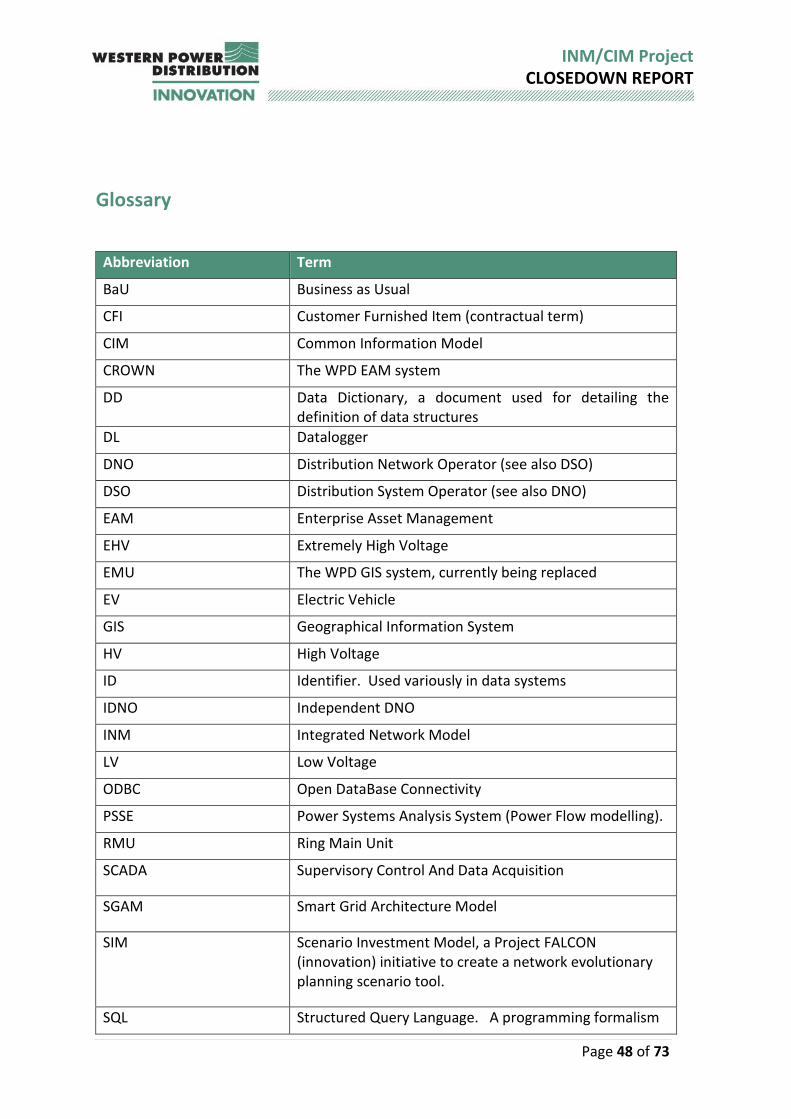
Page 48 of 73
INM/CIM Project CLOSEDOWN REPORT
Glossary
Abbreviation Term
BaU Business as Usual
CFI Customer Furnished Item (contractual term)
CIM Common Information Model
CROWN The WPD EAM system
DD Data Dictionary, a document used for detailing the definition of data structures
DL Datalogger
DNO Distribution Network Operator (see also DSO)
DSO Distribution System Operator (see also DNO)
EAM Enterprise Asset Management
EHV Extremely High Voltage
EMU The WPD GIS system, currently being replaced
EV Electric Vehicle
GIS Geographical Information System
HV High Voltage
ID Identifier. Used variously in data systems
IDNO Independent DNO
INM Integrated Network Model
LV Low Voltage
ODBC Open DataBase Connectivity
PSSE Power Systems Analysis System (Power Flow modelling).
RMU Ring Main Unit
SCADA Supervisory Control And Data Acquisition
SGAM Smart Grid Architecture Model
SIM Scenario Investment Model, a Project FALCON (innovation) initiative to create a network evolutionary planning scenario tool.
SQL Structured Query Language. A programming formalism

Page 49 of 73
INM/CIM Project CLOSEDOWN REPORT
Abbreviation Term
used to extract information directly from databases at the level of the database manager/developer. Data may also be accessed by users via database forms and/or programmatically at defined interface screens.
Tx Transformer (as in Tx1, Tx2 etc). Also in comms: Transmit as opposed to Rx (Receive).
UUID Universally Unique Identifier
`

Page 50 of 73
INM/CIM Project CLOSEDOWN REPORT
Reference Documents
1. SW Regional Studies Report. Report and supporting information and files available at: www.westernpower.co.uk/netstratswest

Page 51 of 73
INM/CIM Project CLOSEDOWN REPORT
Appendix A – Detailed Project Outcomes
A.1 Loading Data from the Control System (Power On) The entire PowerOn network component dataset was extracted and loaded. In PowerOn, the data attributes of network components are held in a separate database table from the one containing the main component records. (The same approach is also used by a number of systems used by DNOs, including commonly used commercial EAM solutions such as SAP.) These attribute details were therefore re-attached to their parent records within the INM.
The active components in the live networks, including measurement points, were then identified by running a sequence of network traces in the INM database. Starting from super-grid transformers at Grid Supply Points (GSPs), each voltage level in the network was traced and the locations and components found transformed into the canonical INM representation while doing so.
These initial traces identified all of the transformers at the next level down (in the initial case, the transformers at the Bulk Supply Points (BSPs). The (33kV) network below these transformers was then traced, and the whole process repeated until all of the network, including the LV stubs that PowerOn incorporates below distribution transformers, had been included.
Figure 8 below shows an example of the transformed data for the internals of a secondary substation:
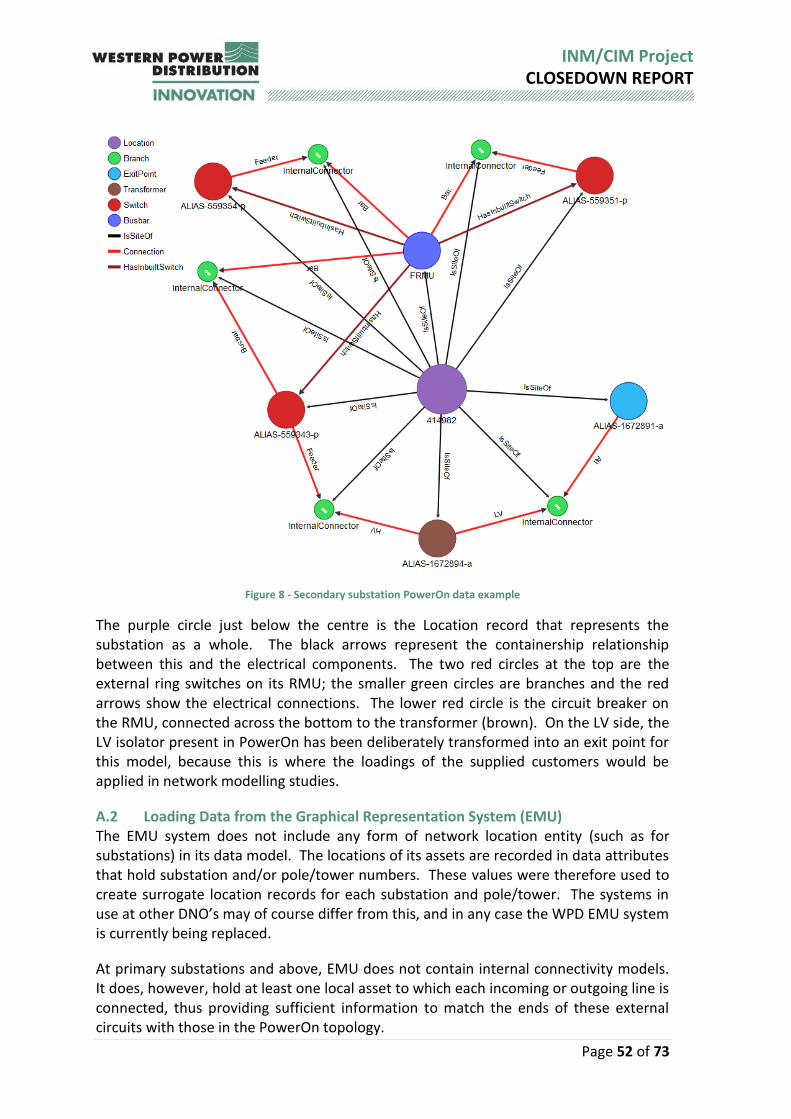
Page 52 of 73
INM/CIM Project CLOSEDOWN REPORT
Figure 8 - Secondary substation PowerOn data example
The purple circle just below the centre is the Location record that represents the substation as a whole. The black arrows represent the containership relationship between this and the electrical components. The two red circles at the top are the external ring switches on its RMU; the smaller green circles are branches and the red arrows show the electrical connections. The lower red circle is the circuit breaker on the RMU, connected across the bottom to the transformer (brown). On the LV side, the LV isolator present in PowerOn has been deliberately transformed into an exit point for this model, because this is where the loadings of the supplied customers would be applied in network modelling studies.
A.2 Loading Data from the Graphical Representation System (EMU) The EMU system does not include any form of network location entity (such as for substations) in its data model. The locations of its assets are recorded in data attributes that hold substation and/or pole/tower numbers. These values were therefore used to create surrogate location records for each substation and pole/tower. The systems in use at other DNO’s may of course differ from this, and in any case the WPD EMU system is currently being replaced.
At primary substations and above, EMU does not contain internal connectivity models. It does, however, hold at least one local asset to which each incoming or outgoing line is connected, thus providing sufficient information to match the ends of these external circuits with those in the PowerOn topology.

Page 53 of 73
INM/CIM Project CLOSEDOWN REPORT
Some bespoke software was also required to stage the EMU data into the database and then to transform this into INM’s canonical GIS representation. This was necessary because
in some cases, separate objects are used to represent the individual phases of three-phase cables but there is no direct data linkage between them,
as EMU has no location entities, some tracing had to be done to identify which components were within each surrogate location, and
the connectivity has to be deduced from the coordinates of line endpoints’ matching those of other objects.
A.3 Loading Data from the Asset Management System (Crown) Asset equipment and location records were extracted from the CROWN database using a set of SQL queries. After staging this data, it was then transformed into INM’s canonical EAM data classes. No bespoke software was needed to stage or transform the CROWN data.
A.4 Loading Data from Data Logger A list of the historical streams held by DL was extracted into a CSV file and loaded first into a staging table and then an INM staging class. No further transformation of this data was needed as its purpose was to be matched against the measurement points identified in the PowerOn data.
The DL measurement points are grouped under “loggers”, with each logger containing a number of points from a common substation site. The source data was therefore staged into two linked classes – loggers and measurement points.
A.5 Loading Data from PSSE The master PSSE data is held in an Access database, with fifteen tables containing network topology and asset model. This was easily extracted, staged and transformed.
Like EMU, PSSE does not hold explicit substation records. In fact, the only references to substations in the PSSE data are substation names that are encoded in free-text name fields of busbar and transformer records, but these fields also contain other useful information such as the voltage level, transformer/busbar identities (eg “SGT1” or “J BAR”) and, in a few cases, pole/tower IDs. The contents of these name fields were therefore parsed to extract each of these values into separate fields.
An additional surrogate PSSE site class was also created in the INM database by grouping on the substation names parsed from in PSSE’s busbar and transformer records.
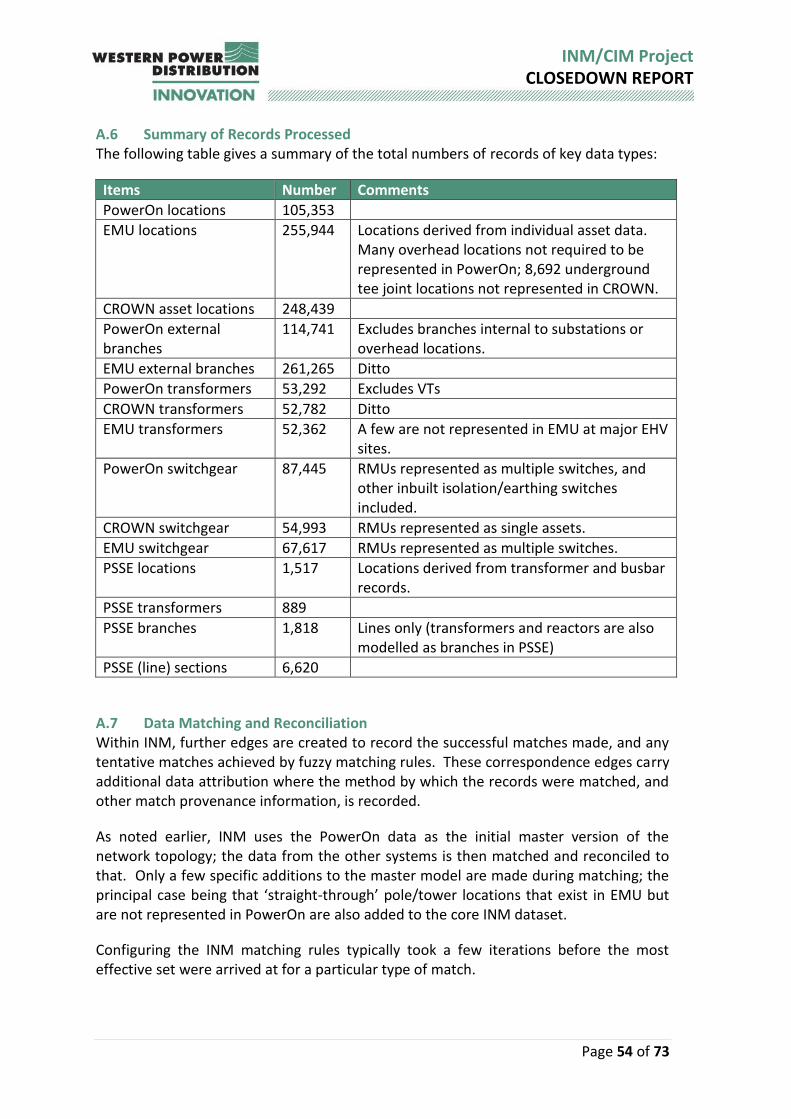
Page 54 of 73
INM/CIM Project CLOSEDOWN REPORT
A.6 Summary of Records Processed The following table gives a summary of the total numbers of records of key data types:
Items Number Comments
PowerOn locations 105,353
EMU locations 255,944 Locations derived from individual asset data. Many overhead locations not required to be represented in PowerOn; 8,692 underground tee joint locations not represented in CROWN.
CROWN asset locations 248,439
PowerOn external branches
114,741 Excludes branches internal to substations or overhead locations.
EMU external branches 261,265 Ditto
PowerOn transformers 53,292 Excludes VTs
CROWN transformers 52,782 Ditto
EMU transformers 52,362 A few are not represented in EMU at major EHV sites.
PowerOn switchgear 87,445 RMUs represented as multiple switches, and other inbuilt isolation/earthing switches included.
CROWN switchgear 54,993 RMUs represented as single assets.
EMU switchgear 67,617 RMUs represented as multiple switches.
PSSE locations 1,517 Locations derived from transformer and busbar records.
PSSE transformers 889
PSSE branches 1,818 Lines only (transformers and reactors are also modelled as branches in PSSE)
PSSE (line) sections 6,620
A.7 Data Matching and Reconciliation Within INM, further edges are created to record the successful matches made, and any tentative matches achieved by fuzzy matching rules. These correspondence edges carry additional data attribution where the method by which the records were matched, and other match provenance information, is recorded.
As noted earlier, INM uses the PowerOn data as the initial master version of the network topology; the data from the other systems is then matched and reconciled to that. Only a few specific additions to the master model are made during matching; the principal case being that ‘straight-through’ pole/tower locations that exist in EMU but are not represented in PowerOn are also added to the core INM dataset.
Configuring the INM matching rules typically took a few iterations before the most effective set were arrived at for a particular type of match.
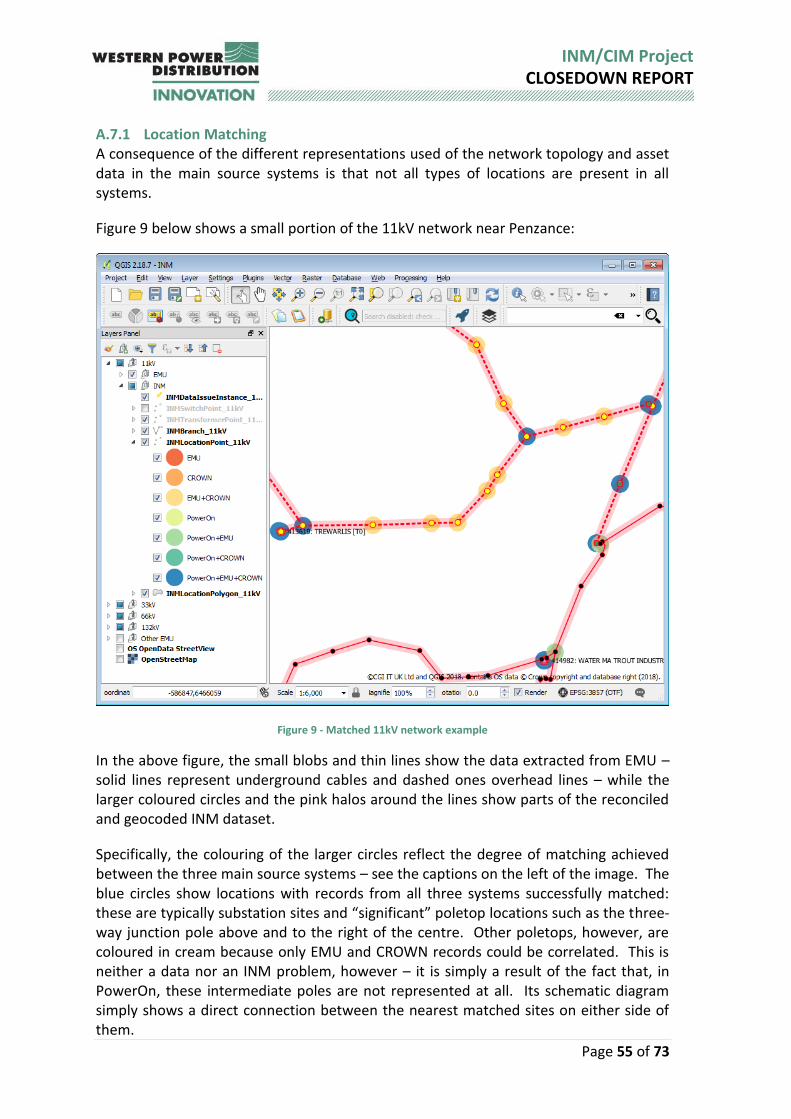
Page 55 of 73
INM/CIM Project CLOSEDOWN REPORT
A.7.1 Location Matching A consequence of the different representations used of the network topology and asset data in the main source systems is that not all types of locations are present in all systems.
Figure 9 below shows a small portion of the 11kV network near Penzance:
Figure 9 - Matched 11kV network example
In the above figure, the small blobs and thin lines show the data extracted from EMU – solid lines represent underground cables and dashed ones overhead lines – while the larger coloured circles and the pink halos around the lines show parts of the reconciled and geocoded INM dataset.
Specifically, the colouring of the larger circles reflect the degree of matching achieved between the three main source systems – see the captions on the left of the image. The blue circles show locations with records from all three systems successfully matched: these are typically substation sites and “significant” poletop locations such as the three-way junction pole above and to the right of the centre. Other poletops, however, are coloured in cream because only EMU and CROWN records could be correlated. This is neither a data nor an INM problem, however – it is simply a result of the fact that, in PowerOn, these intermediate poles are not represented at all. Its schematic diagram simply shows a direct connection between the nearest matched sites on either side of them.
Page 56 of 73
INM/CIM Project CLOSEDOWN REPORT
Similarly, underground tee joint locations such as the one near substation 414982 appear in cyan because they are only represented in PowerOn and EMU. Underground joints do not require inspection or maintenance so they are of no interest to the EAM system.
EMU to PowerOn The inference rules developed for location matching on FALCON were refined and implemented within the INM software, and then used to match the EMU locations to PowerOn. 95.4% of the PowerOn locations were soon matched using a combination of common location identifiers and inferencing. The unmatched balance to 100% reflects a combination of issues with the source data and/or incompleteness in the matching process.
This process was facilitated by the fact that pole/tower numbers were accurately populated into both systems for the majority of the poles and towers represented on the PowerOn diagrams. There were, however, a number of cases where PowerOn is only populated with an abbreviated form of this. The full format includes an old two-digit district number as its first two characters, but these two digits had been omitted from some of these overhead locations in PowerOn. The matching rules were therefore refined to locations to be matched automatically on the shorter form of the pole/tower number subject to appropriate conditions.
155 manual matches were also identified and entered by the project team to improve the site matching in the Cornwall area.
After the matching process had completed, 147,187 additional location records in the core INM dataset were then created for the remaining EMU-only overhead locations. This ensured that all locations were available in the core dataset for matching to the CROWN asset locations.
Crown to PowerOn 98.4% of the CROWN asset locations were successfully matched to the PowerOn/EMU data using substation or pole/tower IDs.
A7.2 EMU and PowerOn Branches After matching the locations the next step was to match the EMU branches to those from PowerOn. This is another example of many:one matching as each PowerOn branch will typically match several EMU conductors. It is also more complex because the EMU data contains intermediate features such as joints and poles/towers that are not included in PowerOn as they contain no junctions or other significant equipment. In these cases, the matching software traverses over these intermediate nodes and links all of the corresponding EMU lines to the respective PowerOn circuit. In these cases, a single PowerOn circuit will match to multiple EMU cables or overhead line sections. As it matches up the EMU conductors, INM allocates appropriate conductor type names to each one and compiles an array of spans for each INM branch. Adjacent EMU conductors of the same type are aggregated into a single span so the INM branch only has as many spans as there are changes of conductor type along its route.
Page 57 of 73
INM/CIM Project CLOSEDOWN REPORT
Overhead locations that have cable terminations, i.e. where an underground cable connects to an overhead line section, are always represented in PowerOn and hence have corresponding location records in the INM dataset, so normally a PowerOn circuit will not end up matched to a combination of both overhead and underground EMU lines.
After matching the EMU circuits to their PowerOn counterparts, the relevant characteristic data, such as span lengths and conductor types, from the former is compiled into arrays held within the core INM branch records, thus making this data directly available in the CIM extracts and other output datasets.
93.2% of the PowerOn circuits between locations, and 89.9% of those from EMU, were successfully matched. Some refinements to the matching process were made to correctly deal with tower runs where two circuits are carried along the same route. In these places there are two lines between each tower and it is obviously important that these are correctly allocated to the two corresponding PowerOn circuits.
A7.3 Network Asset Matching After matching the network topology as described above, the next stage was to match the “point” assets such as transformers and switchgear between the systems.
INM carries out asset record matching on a location-by-location basis so that equipment at different sites is never matched erroneously.
Crown Transformers
99.0% of the CROWN transformer records, corresponding to 98.0% of those in PowerOn, were successfully matched either via their common identifiers or using an elimination rule which allows equipment records to be matched where there is only one item of that type at the location in question, even if the records don’t have common matching IDs.
Crown Switchgear
90.3% of the CROWN switchgear were successfully matched to PowerOn components via a combination of common identifier matches, elimination rules, and 65 manual matches made by the project team. This was not quite as good a result as for some of the other matches, as two main issues were identified within the source data:
1. It was not always straightforward to identify from the PowerOn data which secondary substations have RMUs as opposed to extensible switchboards. INM incorporates special logic to cater for RMUs as they require each CROWN asset to be matched to four PowerOn components – three switches and the internal “busbar” node. The rules for identifying these were refined to cater for a number of variations of representation but even after doing this a number of these remained unaccounted for.
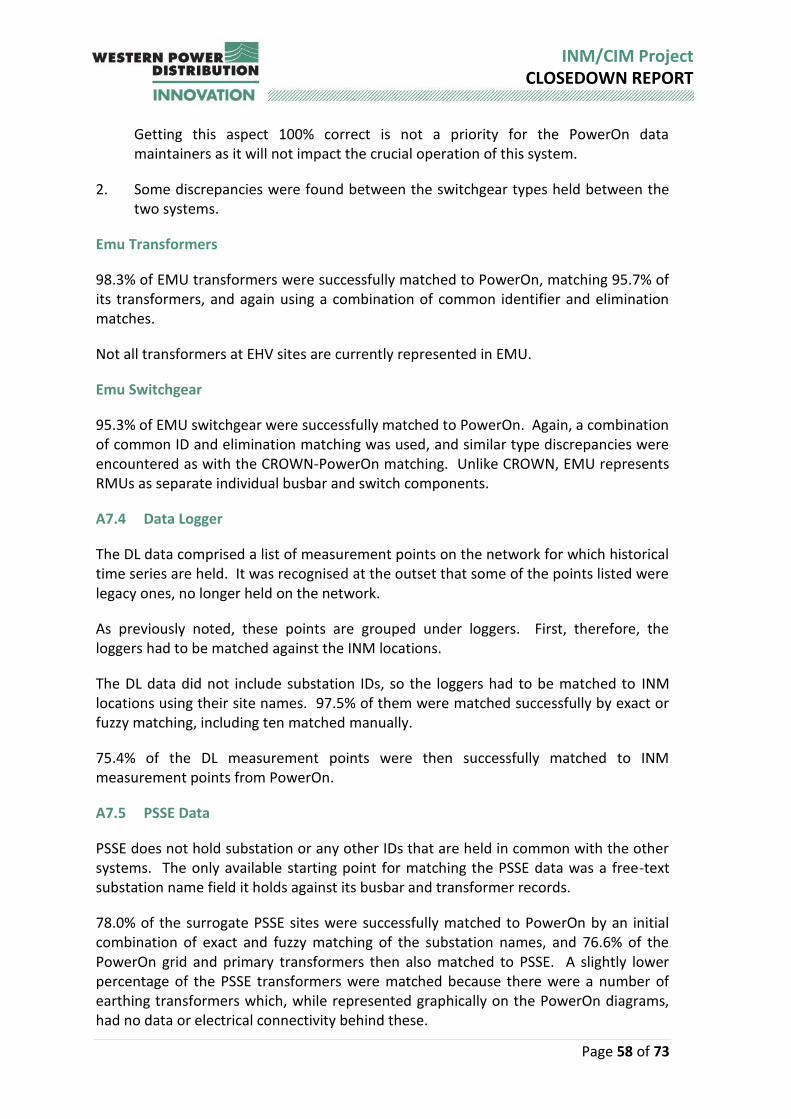
Page 58 of 73
INM/CIM Project CLOSEDOWN REPORT
Getting this aspect 100% correct is not a priority for the PowerOn data maintainers as it will not impact the crucial operation of this system.
2. Some discrepancies were found between the switchgear types held between the two systems.
Emu Transformers
98.3% of EMU transformers were successfully matched to PowerOn, matching 95.7% of its transformers, and again using a combination of common identifier and elimination matches.
Not all transformers at EHV sites are currently represented in EMU.
Emu Switchgear
95.3% of EMU switchgear were successfully matched to PowerOn. Again, a combination of common ID and elimination matching was used, and similar type discrepancies were encountered as with the CROWN-PowerOn matching. Unlike CROWN, EMU represents RMUs as separate individual busbar and switch components.
A7.4 Data Logger
The DL data comprised a list of measurement points on the network for which historical time series are held. It was recognised at the outset that some of the points listed were legacy ones, no longer held on the network.
As previously noted, these points are grouped under loggers. First, therefore, the loggers had to be matched against the INM locations.
The DL data did not include substation IDs, so the loggers had to be matched to INM locations using their site names. 97.5% of them were matched successfully by exact or fuzzy matching, including ten matched manually.
75.4% of the DL measurement points were then successfully matched to INM measurement points from PowerOn.
A7.5 PSSE Data
PSSE does not hold substation or any other IDs that are held in common with the other systems. The only available starting point for matching the PSSE data was a free-text substation name field it holds against its busbar and transformer records.
78.0% of the surrogate PSSE sites were successfully matched to PowerOn by an initial combination of exact and fuzzy matching of the substation names, and 76.6% of the PowerOn grid and primary transformers then also matched to PSSE. A slightly lower percentage of the PSSE transformers were matched because there were a number of earthing transformers which, while represented graphically on the PowerOn diagrams, had no data or electrical connectivity behind these.

Page 59 of 73
INM/CIM Project CLOSEDOWN REPORT
Some other challenges, listed below, were met when attempting to match the remaining data to PowerOn. These could have been addressed, and the above match rates improved, by a combination of manual matching, refining the transformation and matching rules, and some further enhancements to the topology matching software. But when the position was reviewed it was decided that the benefits of this, in terms of improvements they would achieve for the resulting dataset, did not justify the additional cost of this work. As the EMU data did not hold all of the necessary line/cable characteristics to enable these to be uniquely matched to PSSE’s conductor catalogue, each combination of EMU characteristics was manually mapped to one of the compatible PSSE conductor types so that approximately correct impedances and ratings for the EHV cables were available in the integrated dataset, which already included the PSSE values for the successfully matched transformers.
The additional matching work that would have been required arose because:
1. Each network branch in the PSSE model has an associated list of sections in the database. This is designed to allow the details of the individual conductor spans within the branch, namely their construction types, sizes, materials and lengths, to be stored so that ratings can be looked up and impedances calculated using reference data in a further table. In this data, though, entries were also found which represented the ratings of switchgear components along these branches. Unfortunately the entries contain no data that would allow these items to be practicably matched individually to the PowerOn or EMU data.
2. It was also found that PSSE often has a single representation of an EHV busbar that actually comprises two or more separate sections in PowerOn, with intervening busbar-section circuit breakers. Matching these would have required some further enhancements to the software.
3. The surrogate PSSE sites created always had the voltage levels in their names, while some of their PowerOn counterparts didn’t. Fuzzy matching was not found to be particularly effective in this situation; with the modest numbers of records it would have been more cost-effective simply to match these manually.
The key learning points from this exercise have been described in section 8 above.
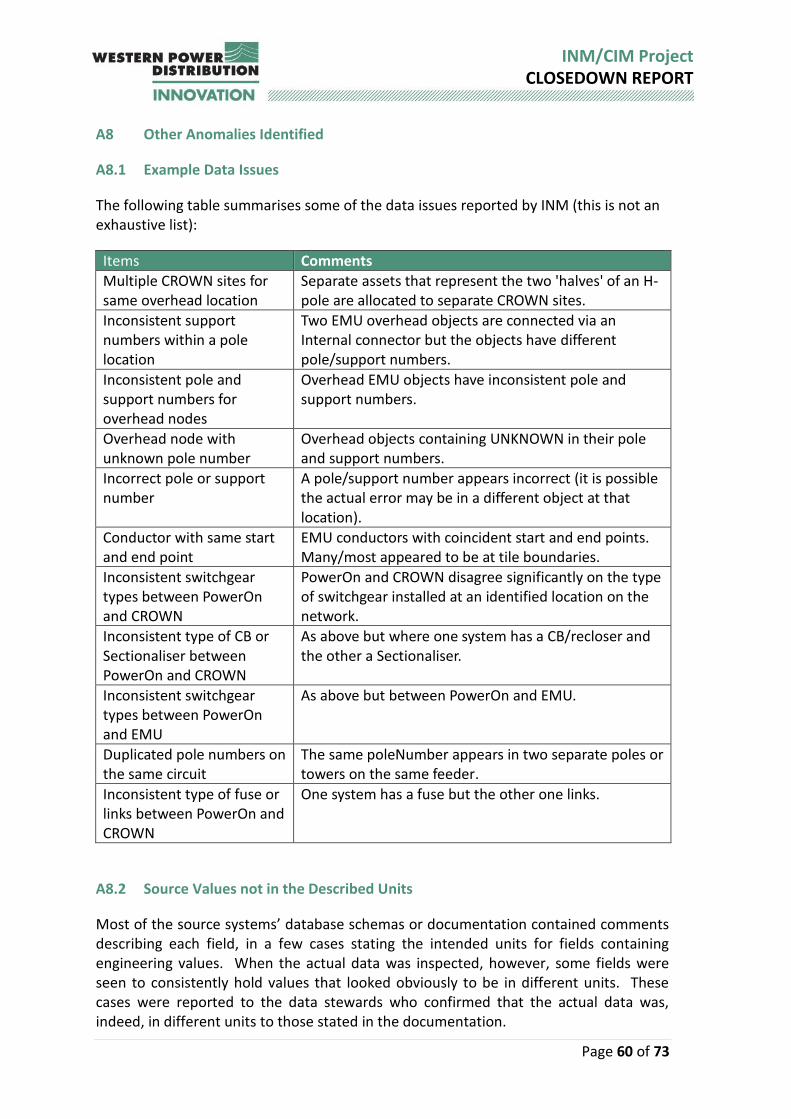
Page 60 of 73
INM/CIM Project CLOSEDOWN REPORT
A8 Other Anomalies Identified
A8.1 Example Data Issues
The following table summarises some of the data issues reported by INM (this is not an exhaustive list):
Items Comments
Multiple CROWN sites for same overhead location
Separate assets that represent the two 'halves' of an H-pole are allocated to separate CROWN sites.
Inconsistent support numbers within a pole location
Two EMU overhead objects are connected via an Internal connector but the objects have different pole/support numbers.
Inconsistent pole and support numbers for overhead nodes
Overhead EMU objects have inconsistent pole and support numbers.
Overhead node with unknown pole number
Overhead objects containing UNKNOWN in their pole and support numbers.
Incorrect pole or support number
A pole/support number appears incorrect (it is possible the actual error may be in a different object at that location).
Conductor with same start and end point
EMU conductors with coincident start and end points. Many/most appeared to be at tile boundaries.
Inconsistent switchgear types between PowerOn and CROWN
PowerOn and CROWN disagree significantly on the type of switchgear installed at an identified location on the network.
Inconsistent type of CB or Sectionaliser between PowerOn and CROWN
As above but where one system has a CB/recloser and the other a Sectionaliser.
Inconsistent switchgear types between PowerOn and EMU
As above but between PowerOn and EMU.
Duplicated pole numbers on the same circuit
The same poleNumber appears in two separate poles or towers on the same feeder.
Inconsistent type of fuse or links between PowerOn and CROWN
One system has a fuse but the other one links.
A8.2 Source Values not in the Described Units
Most of the source systems’ database schemas or documentation contained comments describing each field, in a few cases stating the intended units for fields containing engineering values. When the actual data was inspected, however, some fields were seen to consistently hold values that looked obviously to be in different units. These cases were reported to the data stewards who confirmed that the actual data was, indeed, in different units to those stated in the documentation.
Page 61 of 73
INM/CIM Project CLOSEDOWN REPORT
A9 Electrical/Thermal Characteristics Data Incorporated in the Model
A9.1 Cables and Lines
EMU holds lengths, conductor sizes and other relevant attributes for each cable at all voltage levels. The process for obtaining impedance and ratings for these differs between voltage levels as described below.
HV
WPD have a mapping table which maps the various existing combinations of HV conductor characteristics to a conductor type catalogue used by DINIS, which is WPD’s distribution planning tool. The catalogue contains per-length impedances and current ratings. This catalogue, and the EMU mapping table, were incorporated into the INM dataset and the corresponding catalogue entry names were assigned to the appropriate EMU and INM branches. INM also calculated the aggregated impedances for each branch and each of its spans, and assigns them ratings according to the catalogue entries.
EHV
The DINIS conductor catalogue does not contain any data for EHV lines/cables. A similar catalogue is available from PSSE, however the type information in EMU was not sufficient to uniquely identify the correct PSSE catalogue entry for each type. A manual mapping table was therefore created for these conductors so they could be mapped onto approximately the right catalogue entries, and then the same process as used for HV conductors was followed.
A.9.2 Transformers and Switchgear
Various sets of ratings for ‘point’ asset types was available from CROWN, though none of the available fields were populated across all of the assets. All of the valid and populated ratings for each asset were incorporated into the INM dataset.
CROWN also holds impedance data for some transformers, which was also used.
PSSE rating and impedance data was also incorporated for the EHV transformers that were successfully matched from this system.
A.9 CIM Extracts
A small number of less-than-ideal features of the CIM profiles and tools used were identified:
CIM EQ profile originally developed for transmission networks: the standard used in the project for representing core network models was the IEC 61970-452 “CIM Static Transmission Network Model Profiles” which, as explained previously, was preferred to the distribution profile (IEC 61968-13) because the former is much more mature; the first and only edition of the latter dates back to 2008 and
Page 62 of 73
INM/CIM Project CLOSEDOWN REPORT
was based on a very old version of the CIM. However, the only practical consequence identified in the project was that fuses had to be represented with the generic cim: Switch class instead of the existing cim: Fuse class, which is not included in the current version of IEC 61970-452. In fact, one of the reasons why the second edition of IEC 61968-13 has been delayed – it is now expected by May 2019 – is due to ongoing discussions within the CIM community about the possibility of using IEC 61970-452 as the only standard profile for representing core models for both transmission and distribution networks. That is, rather than creating another standard profile for distribution network models the idea would be to extend the current version of IEC 61970-452.
CIM applications based on ENTSO-E profiles: the ENTSO-E CGMES are the CIM profiles used by European TSOs and, for that reason, have been adopted by many applications as their default (or even only) CIM import format. For example, the power analysis tool DigSilent’s PowerFactory and the open-source application used in the project to render substation schematic diagrams from CIM EQ and CIM DL files – the CIMDraw4 – import ENTSO-E CGMES files, which require actual values to be included for digital and analogue measurement points in the EQ file. For this reason, INM CIM module had to include an option to produce CIM extracts valid against the ENTSOE CGMES profiles.
Geographical profile is not an IEC 61970 standard yet: the IEC 61970 standard series do not include an international standard profile for exchanging geographical location data. Therefore, the project had to use the ENTSO-E CGMES GL profile to export geographical locations in CIM.
Asset data: the first and only edition of IEC 61968-13 allowed the exchange of asset data linked to the core network model. However, IEC 619670-452 does not include CIM asset classes. To exchange detailed asset data existing in INM (coming from the EAM system) it would be necessary to export additional CIM files following the IEC 61968-4 standard, which dates back to 2007 and which, compared with CIM EQ, CIM DL and CIM GL, has not been widely adopted within the CIM community.
Isolated nodes: CIM connectivity nodes are logical nodes for representing a connection between two or more pieces of conducting equipment. Connectivity nodes should therefore be linked to at least two conducting equipment terminals. Isolated nodes are those that are connected to less than two terminals. Although isolated nodes do not make CIM files invalid they might lead to errors in some CIM applications; in fact, the CIMTool5 – the most widely-adopted validating tool in the CIM community – generates warning messages for isolated nodes. In the PowerOn data, a number of spare switches that are physically present at the sites but not connected to anything (and locked out of use) are included, resulting in CIM isolated nodes. To achieve CIMTool compliance it turned out to be easiest to
4 https://bitbucket.org/danielePala/cimdraw
5 http://wiki.cimtool.org/index.html
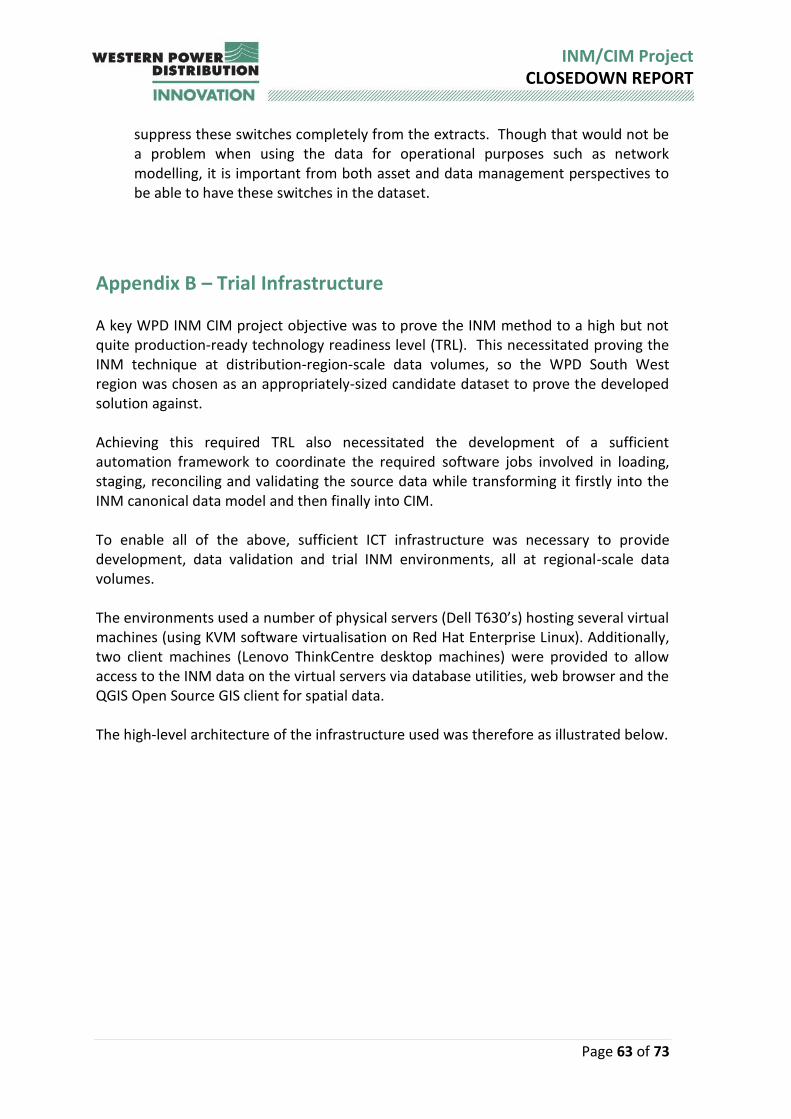
Page 63 of 73
INM/CIM Project CLOSEDOWN REPORT
suppress these switches completely from the extracts. Though that would not be a problem when using the data for operational purposes such as network modelling, it is important from both asset and data management perspectives to be able to have these switches in the dataset.
Appendix B – Trial Infrastructure
A key WPD INM CIM project objective was to prove the INM method to a high but not quite production-ready technology readiness level (TRL). This necessitated proving the INM technique at distribution-region-scale data volumes, so the WPD South West region was chosen as an appropriately-sized candidate dataset to prove the developed solution against. Achieving this required TRL also necessitated the development of a sufficient automation framework to coordinate the required software jobs involved in loading, staging, reconciling and validating the source data while transforming it firstly into the INM canonical data model and then finally into CIM. To enable all of the above, sufficient ICT infrastructure was necessary to provide development, data validation and trial INM environments, all at regional-scale data volumes. The environments used a number of physical servers (Dell T630’s) hosting several virtual machines (using KVM software virtualisation on Red Hat Enterprise Linux). Additionally, two client machines (Lenovo ThinkCentre desktop machines) were provided to allow access to the INM data on the virtual servers via database utilities, web browser and the QGIS Open Source GIS client for spatial data. The high-level architecture of the infrastructure used was therefore as illustrated below.
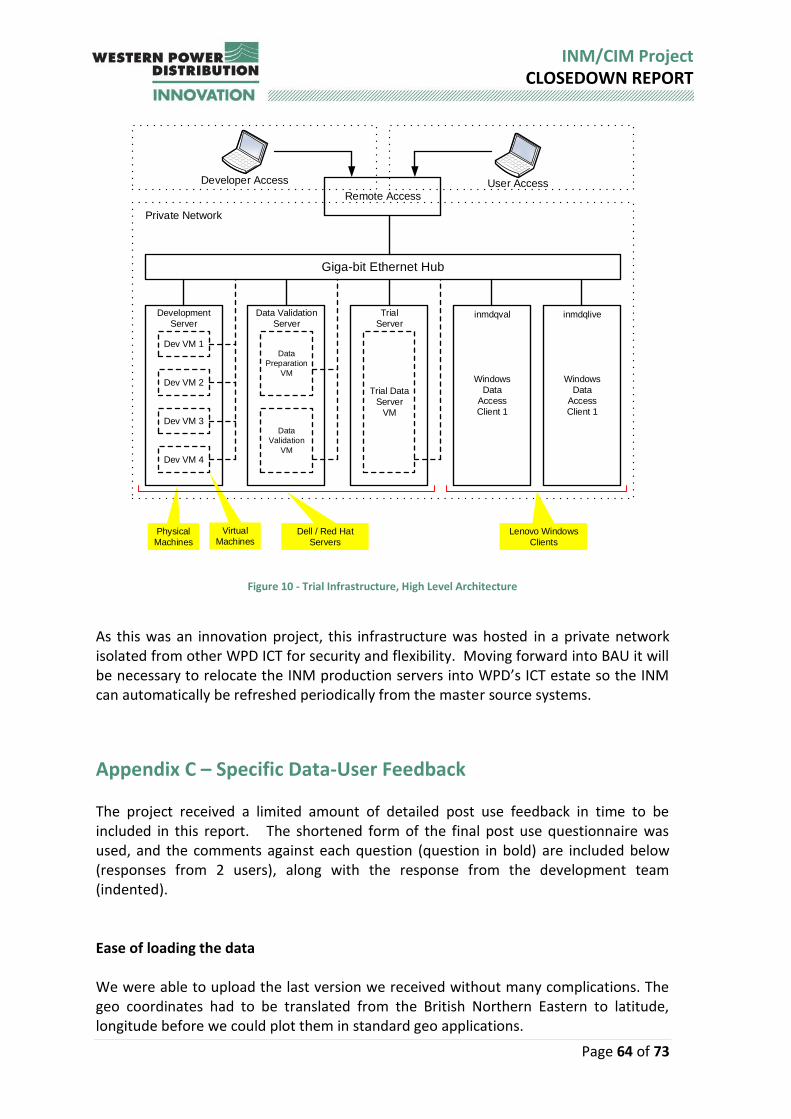
Page 64 of 73
INM/CIM Project CLOSEDOWN REPORT
Remote Access
Giga-bit Ethernet Hub
Private Network
Development
Server
Dev VM 1
Dev VM 2
Dev VM 3
Dev VM 4
Data Validation
Server
Trial
Serverinmdqval inmdqlive
Physical
Machines
Virtual
Machines Dell / Red Hat
Servers
Lenovo Windows
Clients
Data
Preparation
VM
Data
Validation
VM
User Access
Trial Data
Server
VM
Developer Access
Windows
Data
Access
Client 1
Windows
Data
Access
Client 1
Figure 10 - Trial Infrastructure, High Level Architecture
As this was an innovation project, this infrastructure was hosted in a private network isolated from other WPD ICT for security and flexibility. Moving forward into BAU it will be necessary to relocate the INM production servers into WPD’s ICT estate so the INM can automatically be refreshed periodically from the master source systems.
Appendix C – Specific Data-User Feedback
The project received a limited amount of detailed post use feedback in time to be included in this report. The shortened form of the final post use questionnaire was used, and the comments against each question (question in bold) are included below (responses from 2 users), along with the response from the development team (indented). Ease of loading the data
We were able to upload the last version we received without many complications. The geo coordinates had to be translated from the British Northern Eastern to latitude, longitude before we could plot them in standard geo applications.

Page 65 of 73
INM/CIM Project CLOSEDOWN REPORT
More advanced extract facilities could possibly offer a choice of coordinate schemes.
The default CIM files produced by INM used the same coordinate system as the source GIS (EMU) – i.e. OSGB36. However, the more recent ENTSO-E CGMES files produced by INM represent geo coordinates in WGS84 (latitude, longitude), proving that INM CIM can perform conversions between coordinate systems.
For electrical lines made up of segments we could not find the order of the different segments that made up the line. We came up with our own process.
ACLineSegments are associated with Locations linked to PositionPoints. Each position point includes the attribute PositionPoint.sequenceNumber referring to the order of the point within the location. For instance, the line ALIAS-199863-p includes 6 points, with the point (88041.9, 15000.0) being the second one and (87978.95, 14923.36) the fifth one.
Unfortunately acLineSegment does not have a “position within Line” attribute.
Tools used to view / use the data We developed our own scripts to process the data, and to upload it into database tables, and excel spreadsheets. We were also able to represent the distribution network diagram embedded in your CIM model in geographic representation. We used HERE maps.
Your view of the quality of the dataset and its ability to meet your needs
The electrical phases are missing.
They don’t say where in the network, but I suspect this is because we didn’t find anything in the source data. Probably the most relevant place would be for 1-phase 11kV overhead spurs, but I have a recollection we didn’t know the phases of them when we did EME NMS.
I’m not sure what kind of information about the phases is missing. Just note that the standard IEC 61970-452 represents three-phase components and that the only information about phases is the optional Terminal.phases attribute which by default is set to ABC.
The energy consumers geo coordinates were on top of the distribution transformers.
I think most of these were in PowerOn but not EMU, so only had site coordinates. This could be improved subject to available source data (see next point below).

Page 66 of 73
INM/CIM Project CLOSEDOWN REPORT
Correct; energy consumers not in EMU, so INM used the site coordinates as given by PowerOn.
The electrical parameters of the connection from energy consumers to distribution transformers (low voltage) is missing. For our voltage/reactive power calculations we need also the low voltage grid and parameters.
Not really possible to provide this without incorporating the LV network, or some separate data source which summarises that. The energy consumers node at secondary substations is therefore just a single “load point” that summarise the presence of all the customers connected below the transformer. What, if anything, you would change about the data – good and bad features The fact that the electrical parameters are included for middle voltage AC segments is very good. We usually have to compute them in other projects. Add ordering of the different segments that make up a line. We came up with a very complicated algorithm to figure out the ordering based on distance.
As mentioned above, the order is given by PositionPoint.sequenceNumber.
Analog measurements are included per phase. We do not have any other phase information to make use of them.
Assume this means measurement (points), not values. Again, goes back to what’s available in the source data.
Only line currents have information about the phase within the name, and I don’t see how that hinders the association with the model. Line currents (as all the other analogs) are associated with a component (e.g. a Breaker) and a terminal; that’s how the CIM (IEC 61970-452) links measurements to the network model.
Onward use of the data that you will be making Situational awareness of Distributed Energy Resources. Power flow, including low voltage distribution, and voltage regulation and reactive power flow.
Congestion Management Visualization.
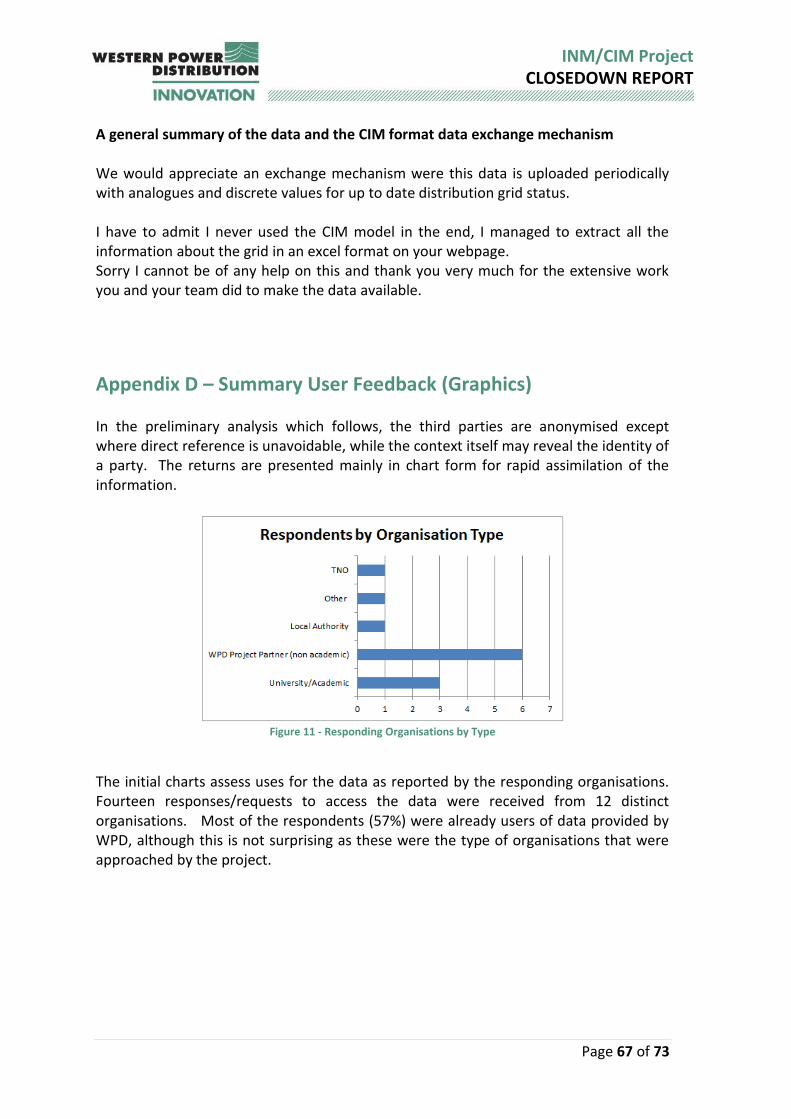
Page 67 of 73
INM/CIM Project CLOSEDOWN REPORT
A general summary of the data and the CIM format data exchange mechanism We would appreciate an exchange mechanism were this data is uploaded periodically with analogues and discrete values for up to date distribution grid status. I have to admit I never used the CIM model in the end, I managed to extract all the information about the grid in an excel format on your webpage. Sorry I cannot be of any help on this and thank you very much for the extensive work you and your team did to make the data available.
Appendix D – Summary User Feedback (Graphics)
In the preliminary analysis which follows, the third parties are anonymised except where direct reference is unavoidable, while the context itself may reveal the identity of a party. The returns are presented mainly in chart form for rapid assimilation of the information.
Figure 11 - Responding Organisations by Type
The initial charts assess uses for the data as reported by the responding organisations. Fourteen responses/requests to access the data were received from 12 distinct organisations. Most of the respondents (57%) were already users of data provided by WPD, although this is not surprising as these were the type of organisations that were approached by the project.

Page 68 of 73
INM/CIM Project CLOSEDOWN REPORT
Figure 12 - CIM Model Intended Purpose of Respondent
Figure 13 - Is the Respondent Already a User of WPD Data
Figure 14 - What WPD Data Sources Do Respondents Already Use
Page 69 of 73
INM/CIM Project CLOSEDOWN REPORT
Figure 15 - Respondent Current Mode of Data Use
Figure 16 - Respondent Existing Use of CIM Data
Figure 17 - Other Data Formats Already Used by Respondents
Respondent’s particular interests are presented in the following 2 charts.

Page 70 of 73
INM/CIM Project CLOSEDOWN REPORT
Figure 18 - Respondent Interest by Voltage Level
Figure 19 - Respondent Interest by Asset Type
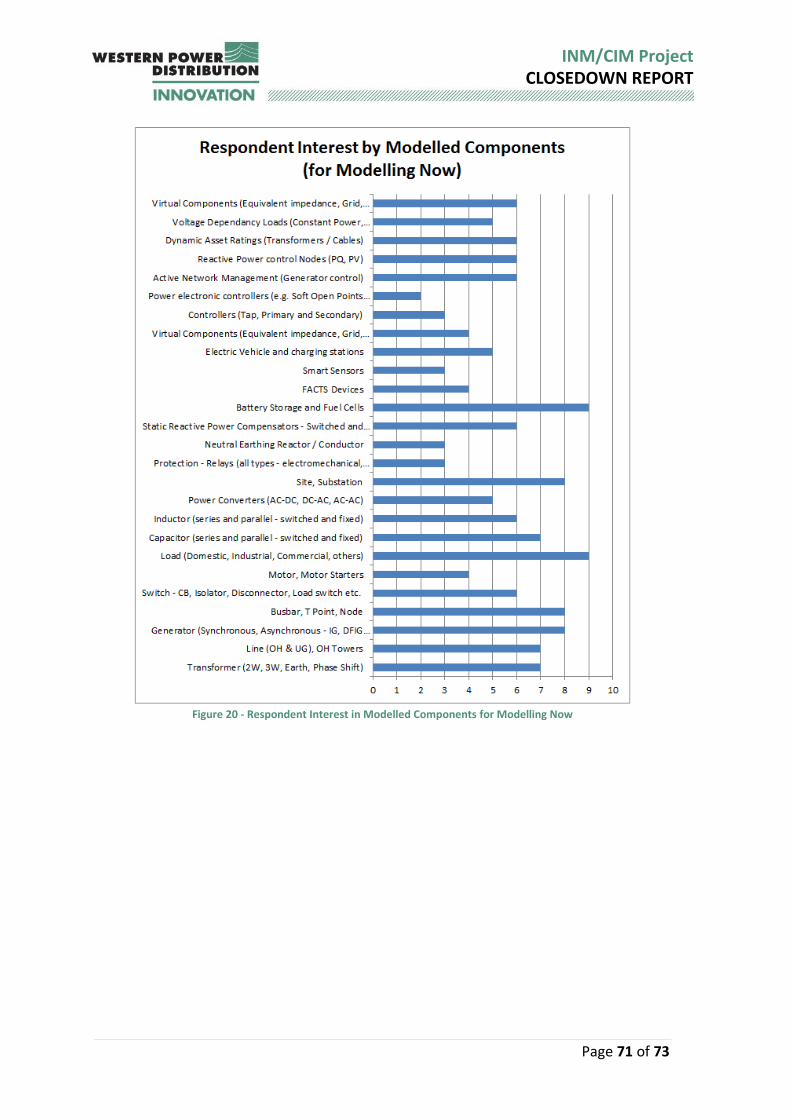
Page 71 of 73
INM/CIM Project CLOSEDOWN REPORT
Figure 20 - Respondent Interest in Modelled Components for Modelling Now
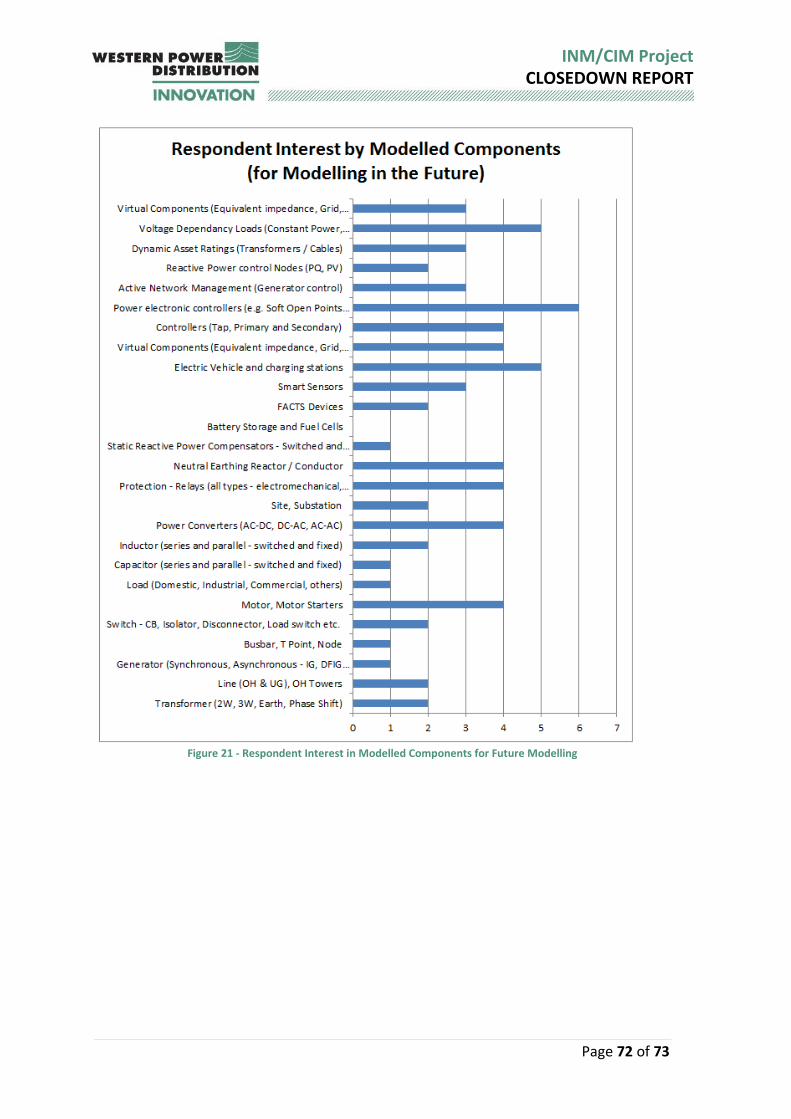
Page 72 of 73
INM/CIM Project CLOSEDOWN REPORT
Figure 21 - Respondent Interest in Modelled Components for Future Modelling