Embed Size (px)
Citation preview
IINNNNEERR--CCIITTYY CCOORRRRIIDDOORR
EECCOONNOOMMIICC DDEEVVEELLOOPPMMEENNTT FFEEAASSIIBBIILLIITTYY SSTTUUDDYY
Prepared for:
Charlotte Mecklenburg Development Corporation
by:
Center for Real Estate and
Metropolitan Studies and Extended Academic Programs The University of North Carolina at Charlotte
February 2007


Page i
TABLE OF CONTENTS
List of Figures ................................................................................................................................. ii List of Tables ................................................................................................................................. iii UNC Charlotte Research Team .......................................................................................................1 Study Background............................................................................................................................2 Project Goals....................................................................................................................................3 Research Method and Data ..............................................................................................................4 Corridor Identification .....................................................................................................................5 Corridor Evaluation Analysis ........................................................................................................11 Real Estate Development Potential Process ..................................................................................22 Corridor Real Estate Development Analysis: Synopsis.................................................................23 Proposed Investment and Financial Analysis ................................................................................30 Conclusions....................................................................................................................................37 Appendix A: Study Variables Descriptions Appendix B: Corridor Segment Profiles
Page ii
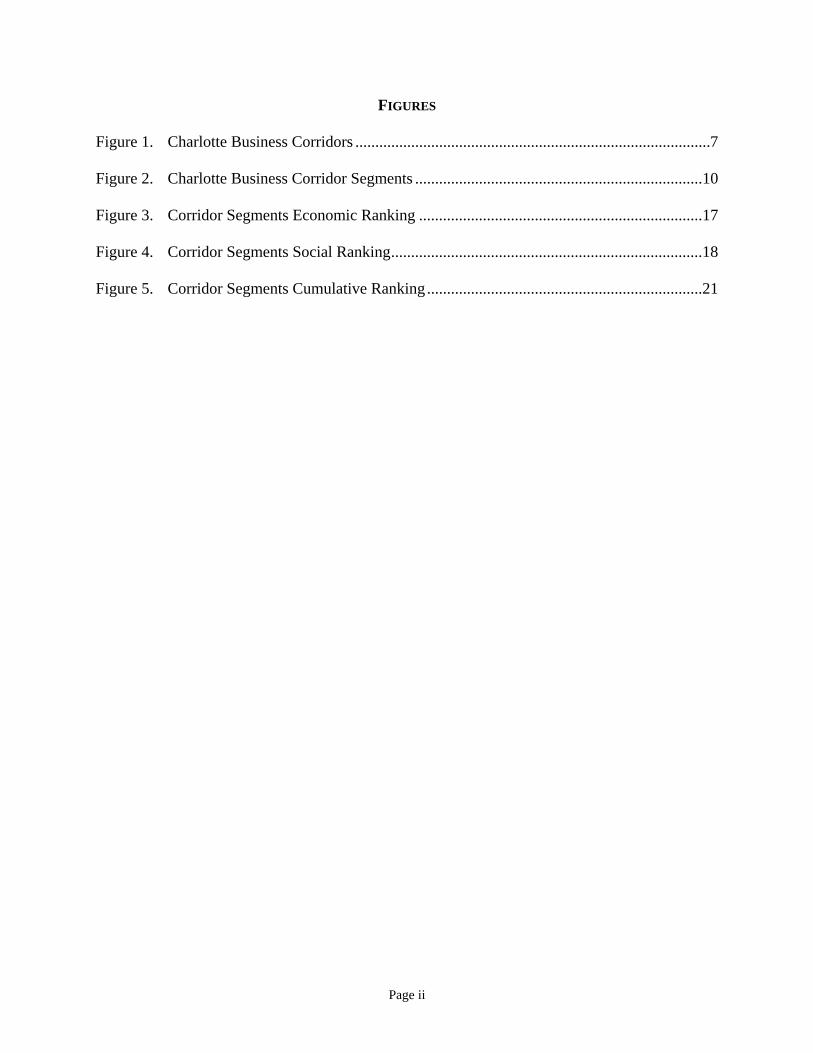
FIGURES
Figure 1. Charlotte Business Corridors .........................................................................................7 Figure 2. Charlotte Business Corridor Segments ........................................................................10 Figure 3. Corridor Segments Economic Ranking .......................................................................17 Figure 4. Corridor Segments Social Ranking..............................................................................18 Figure 5. Corridor Segments Cumulative Ranking .....................................................................21
Page iii
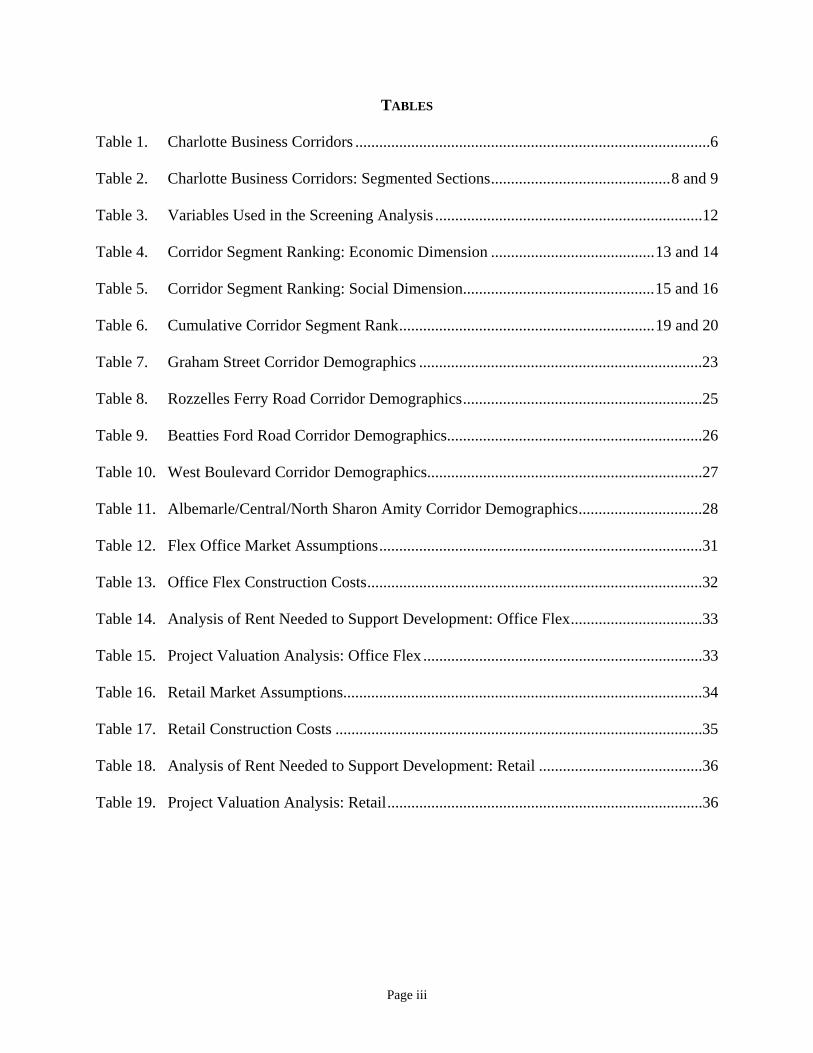
TABLES
Table 1. Charlotte Business Corridors .........................................................................................6 Table 2. Charlotte Business Corridors: Segmented Sections.............................................8 and 9
Table 3. Variables Used in the Screening Analysis ...................................................................12 Table 4. Corridor Segment Ranking: Economic Dimension .........................................13 and 14 Table 5. Corridor Segment Ranking: Social Dimension................................................15 and 16 Table 6. Cumulative Corridor Segment Rank................................................................19 and 20 Table 7. Graham Street Corridor Demographics .......................................................................23 Table 8. Rozzelles Ferry Road Corridor Demographics............................................................25 Table 9. Beatties Ford Road Corridor Demographics................................................................26 Table 10. West Boulevard Corridor Demographics.....................................................................27 Table 11. Albemarle/Central/North Sharon Amity Corridor Demographics...............................28 Table 12. Flex Office Market Assumptions.................................................................................31 Table 13. Office Flex Construction Costs....................................................................................32 Table 14. Analysis of Rent Needed to Support Development: Office Flex.................................33 Table 15. Project Valuation Analysis: Office Flex ......................................................................33 Table 16. Retail Market Assumptions..........................................................................................34 Table 17. Retail Construction Costs ............................................................................................35 Table 18. Analysis of Rent Needed to Support Development: Retail .........................................36 Table 19. Project Valuation Analysis: Retail...............................................................................36

Page 1
UNC CHARLOTTE RESEARCH TEAM Dr. Owen J. Furuseth, AICP Dr. Steven H. Ott Associate Provost for Metropolitan Studies Director, Center for Real Estate and Extended Academic Programs Belk College of Business Administration University of North Carolina at Charlotte University of North Carolina at Charlotte Mr. Thomas M. Ludden Mr. Dustin C. Read, Esq. GIS Analyst, Metropolitan Studies and Ph.D. Program in Public Policy Extended Academic Programs University of North Carolina at Charlotte University of North Carolina at Charlotte
Page 2
STUDY BACKGROUND The Charlotte-Mecklenburg Development Corporation (CMDC) is a non-profit community development organization founded in 1997. Established under the leadership of John E. Crosland, Jr., the CMDC is a partnership between the City of Charlotte, Mecklenburg County, and the Charlotte Chamber of Commerce. The primary mission of CMDC “…is to identify opportunities and to revitalize distressed, inner-city corridors through the development or re-development of commercial projects that will then provide a catalyst for future development, serving neighborhood residents and enhancing business development in areas that would otherwise remain void of new activity”.1 In working to meet its mission, the CMDC provides leadership and acts as a change agent for the economic stimulation of inner-city neighborhoods through joint public and private real estate development activities. The original geographic focus of the CMDC was the 73 City Within a City (CWAC) neighborhoods, but as conditions have changed, the geographic scope of CMDC has expanded to include other older ‘middle ring’ neighborhoods that face challenges of economic and social decline. The new areas include a number of corridors in Eastside Charlotte and West Charlotte. The strategic vision of CMDC encompasses assembling land, re-mediating projects, building business parks and other commercial centers, attracting businesses and jobs to inner city neighborhoods, and, in general, creating a positive environment for business activity in Charlotte’s most distressed communities. The Wilkinson Park Business Center is a recent example of the CMDC programming. Built in July 2003, the Center is a $7.21 million investment in one of Charlotte’s most challenged neighborhoods. The business center has attracted support from Duke Energy, Wachovia, BB&T, and other local businesses. Already, property tax valuation for the center has grown from $3.6 million to $4.6 million, and 55 new jobs have been created. Building upon the success of the Wilkinson Park Business Center, the CMDC selected the research team from UNC Charlotte to revise and update the City Within a City Business Park report that was used to guide the selection of the Wilkinson Boulevard location for the business center. This report outlines that research process and presents the research findings. 1 “Charlotte Mecklenburg Development Corporation, “Potential Development Opportunities Study, Request for Proposal,” July 1, 2006.

Page 3
PROJECT GOALS Working and consulting with the CMDC staff and Committee Members, the UNC Charlotte research team accomplished five project goals:
1. To revise and expand the inner-city corridors that are targets for CMDC economic revitalization activities.
2. To compile and develop a statistical database that identifies the social, economic, and
physical needs and opportunities for the original inner-city corridors and the new corridors.
3. To design an expanded evaluation matrix that permits the CMDC to assess the economic
and social assets and liabilities for business stimulation and commercial development in each corridor. This research tool, along with the corridor database, are robust and open ended products. Thus, they can be updated and used by the CMDC for future corridor evaluation projects.
4. To carry out a corridor-level analysis of the physical opportunities, economic strengths,
and social needs for potential commercial development projects in inner-city Charlotte roadway corridors.
5. To evaluate the economic development potential for the five most highly ranked corridors
as identified in the first phase analysis of this study.
6. To recommend the most economically feasible and socially productive real estate development opportunities in the selected corridors.
7. To prepare a financial analysis for the recommended real estate development strategies in
the targeted corridors based on the best proposed uses in the selected corridors.
8. To estimate the following based on the best proposed uses in the selected corridors: • Total estimated project costs (hard and soft costs) • Sources and uses of funds. • Costs of debt and equity financing. • Time to construction completion. • Stabilization period after completion needed to achieve market occupancy. • Projected rent and expenses (net operating income) of the completed project. • Valuation of the completed and stabilized project. • The amount and type of public capital necessary, if any, for the project to provide
the market rate of return necessary to induce private sector development of the project in the short-term.

Page 4
RESEARCH METHOD AND DATA The UNC Charlotte research team reviewed the City Within a City Business Park report,2 as well as, other corridor plans prepared by the Charlotte-Mecklenburg Planning Commission. These included the Eastside Strategic Plan: Shaping the Future of Charlotte’s Eastside, Volume 1: Concept Plan (2001) and the Westside Strategic Plan, Volume 1: Concept Plan (2000). In addition, the City of Charlotte’s Economic Development department’s “Sustainability Index” was consulted for information and guidance regarding site-scale locational criteria. Community-scale information was derived from the Charlotte Neighborhood Quality of Life Study (2006). The Quality of Life Study captures and analyzes a variety of locally derived information from the City of Charlotte and Mecklenburg County government organizations. Within the report, 20 analytical and eight profile variables are collected and geocoded for 173 neighborhood statistical areas (NSAs). For this project, the NSA data were extracted and restructured to fit the corridor boundaries. Consequently, all of the variable information was potentially available for the CMDC analysis. The corridor ranking process used an evaluation matrix framework that ranked individual roadway segments using social and economic need measures. The quantitative findings were reviewed by the CMDC staff and committee members. This process narrowed the number of corridor segments for an economic development feasibility analysis. Five corridors were chosen for this second phase analysis. In carrying out the analysis of real estate development options and detailed financial feasibility studies in the targeted corridors, the process relied upon the expertise of the UNC Charlotte Center for Real Estate, data sets from the Center, and consultation from local real estate experts. Specifically, the corridor-scale analysis included driving each corridor, evaluating the condition of the real estate sub-market, interviewing local real estate professionals active in these corridors and in other Charlotte submarkets, analyzing demographic data and other data sets from the Center. Based on the information gathered, a financial analysis of proposed projects in the three chosen corridors was done to determine the financial feasibility and the amount of subsidies required to stimulate development at the present time.
2 Charlotte Chamber of Commerce, City Within a City Business Park, prepared by Michael Gallis & Associates, 1997.

Page 5
CORRIDOR IDENTIFICATION
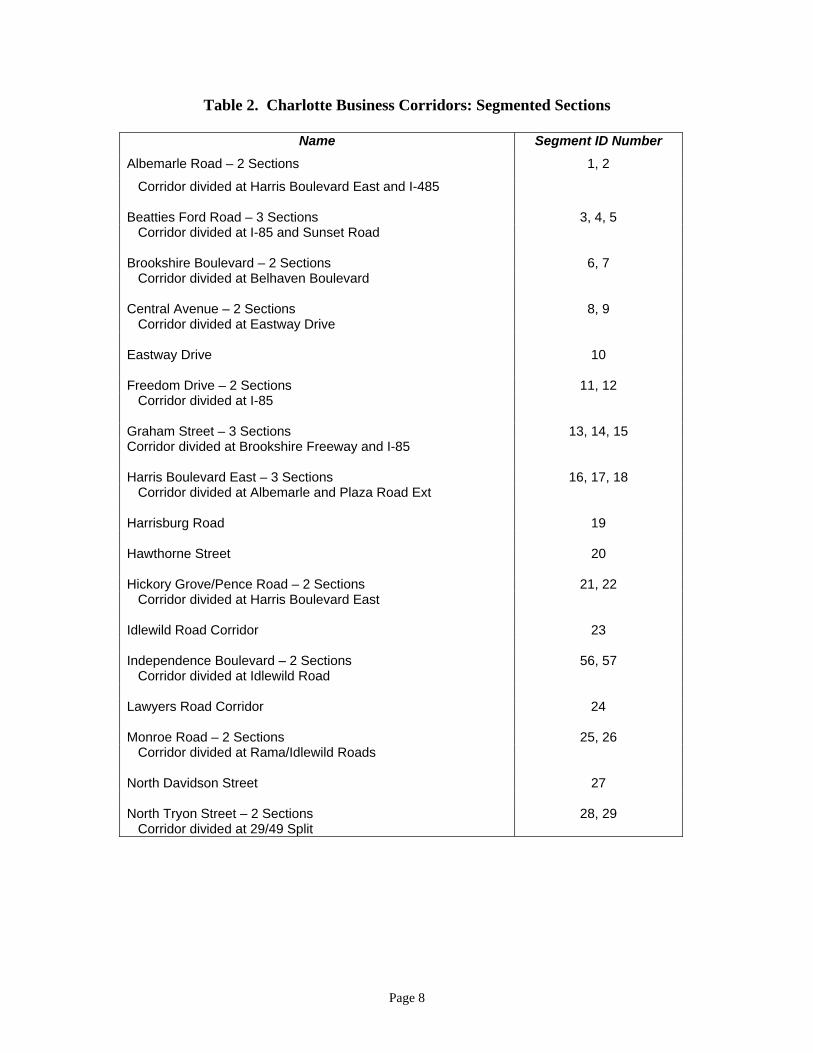
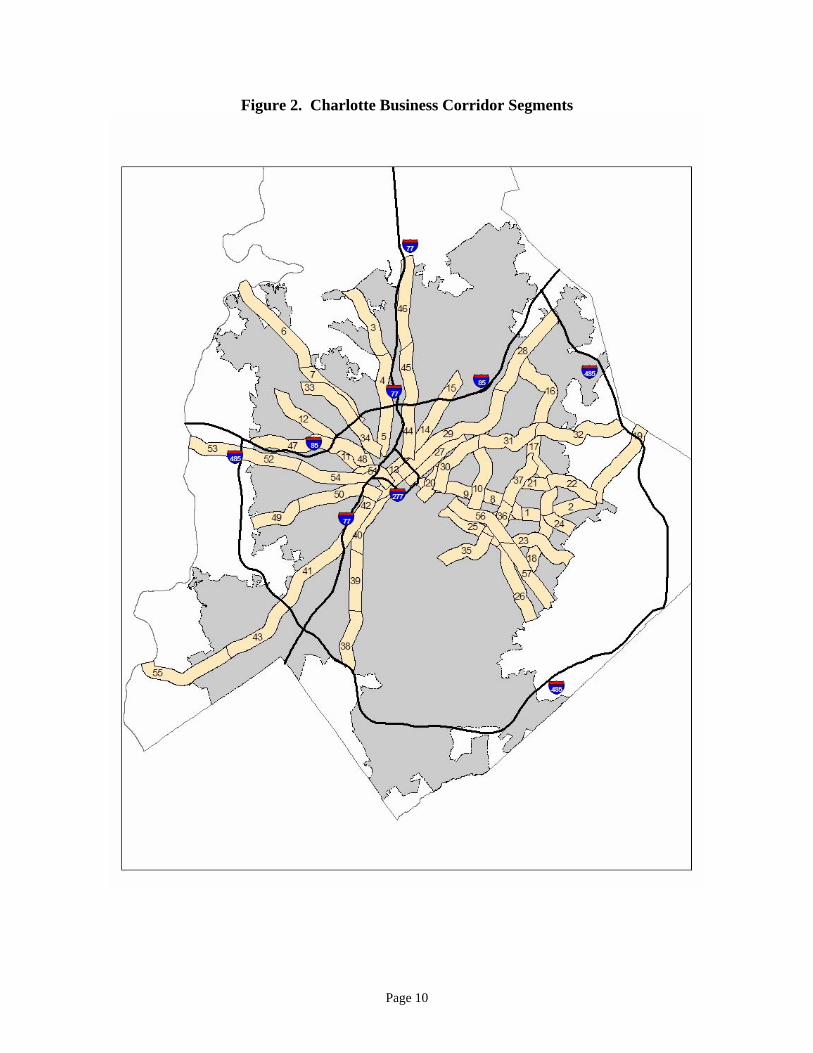
Using the City Within a City Business Park report and the Charlotte-Mecklenburg Planning Commission’s Eastside and Westside Strategic Plans, 29 inner-city road corridors were initially included in the analysis (Table 1 and Figure 1). Three corridors included in the 1997 study were deleted from the study owing to the improving economic character of these roadways. The excluded corridors were Park Road, Randolph Road, and Providence Road. More critically, nine new corridors were included in the analysis. These additional corridors were chosen because they exhibited growing levels of economic and social need. Most of the new corridors were located in the “middle ring” suburban areas of Eastside and West Charlotte. They included Albemarle Road, Harris Boulevard East, Harrisburg Road, Hawthorne Lane, Hickory Grove/Pence Roads, Idlewild Road, Lawyers Road, West Morehead Road, and York Road. Following the final selection of the road corridors, most roads were subdivided in corridor segments. The decision to subdivide roads was based on the length of the street, land use, and community diversity of corridors. In particular, roads with multi-mile lengths contained differing degrees of real estate development, social and economic need, and opportunities for economic activity. Subdividing the corridors into homogenous segments permitted a more accurate analysis. As a result of the subdivision process, the 29 inner-city corridors were transformed into 57 road segments. The geographies for these units are presented on Table 2 and Figure 2. Each road segment was included in the corridor evaluation analysis.

Page 6
Table 1. Charlotte Business Corridors
Albemarle Road
Beatties Ford Road
Brookshire Boulevard
Central Avenue
Eastway Drive
Freedom Drive
Graham Street
Harris Boulevard East
Harrisburg Road
Hawthorne Lane
Hickory Grove/Pence Road
Idlewild Road Corridor
Independence Boulevard
Lawyers Road Corridor
Monroe Road
North Davidson Street
North Tryon street
Plaza/Plaza Extension
Rozzelles Ferry Road
Sharon Amity Road
South Boulevard
South Tryon Street
Statesville Avenue
Statesville Road
Tuckaseegee Road
West Boulevard
West Morehead Street
Wilkinson Boulevard
York Road

Page 7
Figure 1. Charlotte Business Corridors
Page 8
Table 2. Charlotte Business Corridors: Segmented Sections
Name Segment ID Number Albemarle Road – 2 Sections 1, 2
Corridor divided at Harris Boulevard East and I-485 Beatties Ford Road – 3 Sections 3, 4, 5 Corridor divided at I-85 and Sunset Road Brookshire Boulevard – 2 Sections 6, 7 Corridor divided at Belhaven Boulevard Central Avenue – 2 Sections 8, 9 Corridor divided at Eastway Drive Eastway Drive 10 Freedom Drive – 2 Sections 11, 12 Corridor divided at I-85 Graham Street – 3 Sections 13, 14, 15 Corridor divided at Brookshire Freeway and I-85 Harris Boulevard East – 3 Sections 16, 17, 18 Corridor divided at Albemarle and Plaza Road Ext Harrisburg Road 19 Hawthorne Street 20 Hickory Grove/Pence Road – 2 Sections 21, 22 Corridor divided at Harris Boulevard East Idlewild Road Corridor 23 Independence Boulevard – 2 Sections 56, 57 Corridor divided at Idlewild Road Lawyers Road Corridor 24 Monroe Road – 2 Sections 25, 26 Corridor divided at Rama/Idlewild Roads North Davidson Street 27 North Tryon Street – 2 Sections 28, 29 Corridor divided at 29/49 Split
Page 9
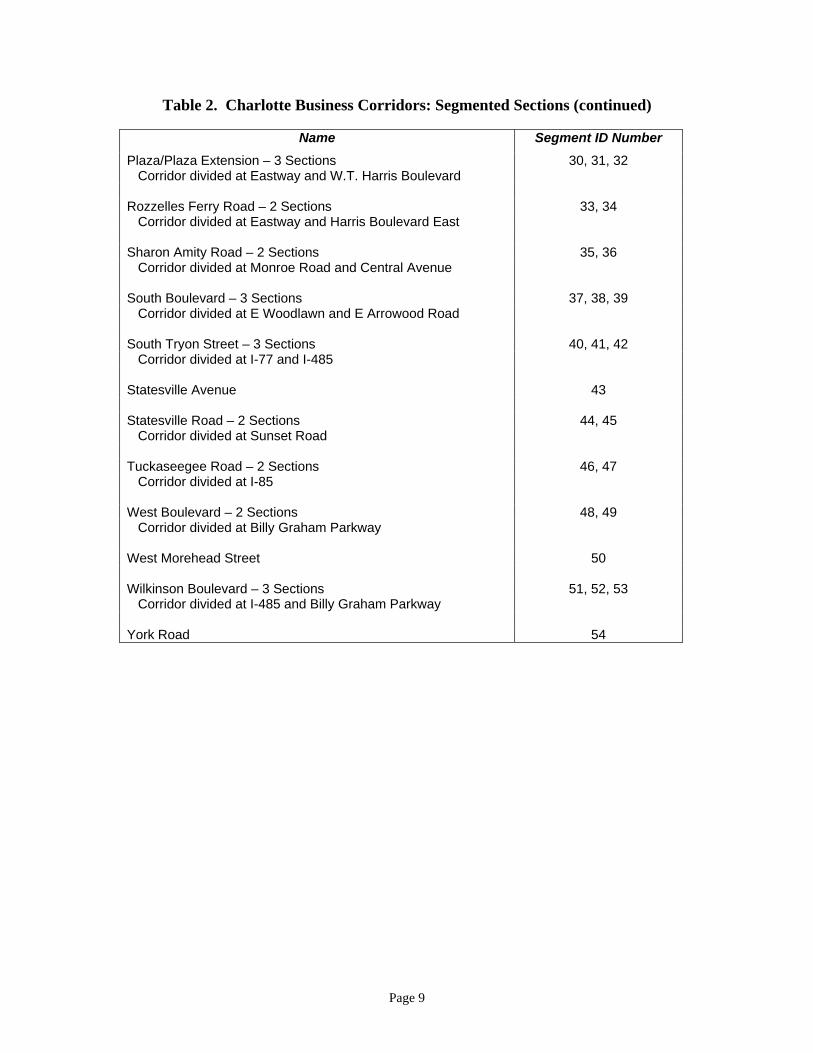
Table 2. Charlotte Business Corridors: Segmented Sections (continued)
Name Segment ID Number Plaza/Plaza Extension – 3 Sections 30, 31, 32 Corridor divided at Eastway and W.T. Harris Boulevard
Rozzelles Ferry Road – 2 Sections 33, 34 Corridor divided at Eastway and Harris Boulevard East Sharon Amity Road – 2 Sections 35, 36 Corridor divided at Monroe Road and Central Avenue South Boulevard – 3 Sections 37, 38, 39 Corridor divided at E Woodlawn and E Arrowood Road South Tryon Street – 3 Sections 40, 41, 42 Corridor divided at I-77 and I-485 Statesville Avenue 43 Statesville Road – 2 Sections 44, 45 Corridor divided at Sunset Road Tuckaseegee Road – 2 Sections 46, 47 Corridor divided at I-85 West Boulevard – 2 Sections 48, 49 Corridor divided at Billy Graham Parkway West Morehead Street 50 Wilkinson Boulevard – 3 Sections 51, 52, 53 Corridor divided at I-485 and Billy Graham Parkway York Road 54
Page 10
Figure 2. Charlotte Business Corridor Segments
Page 11
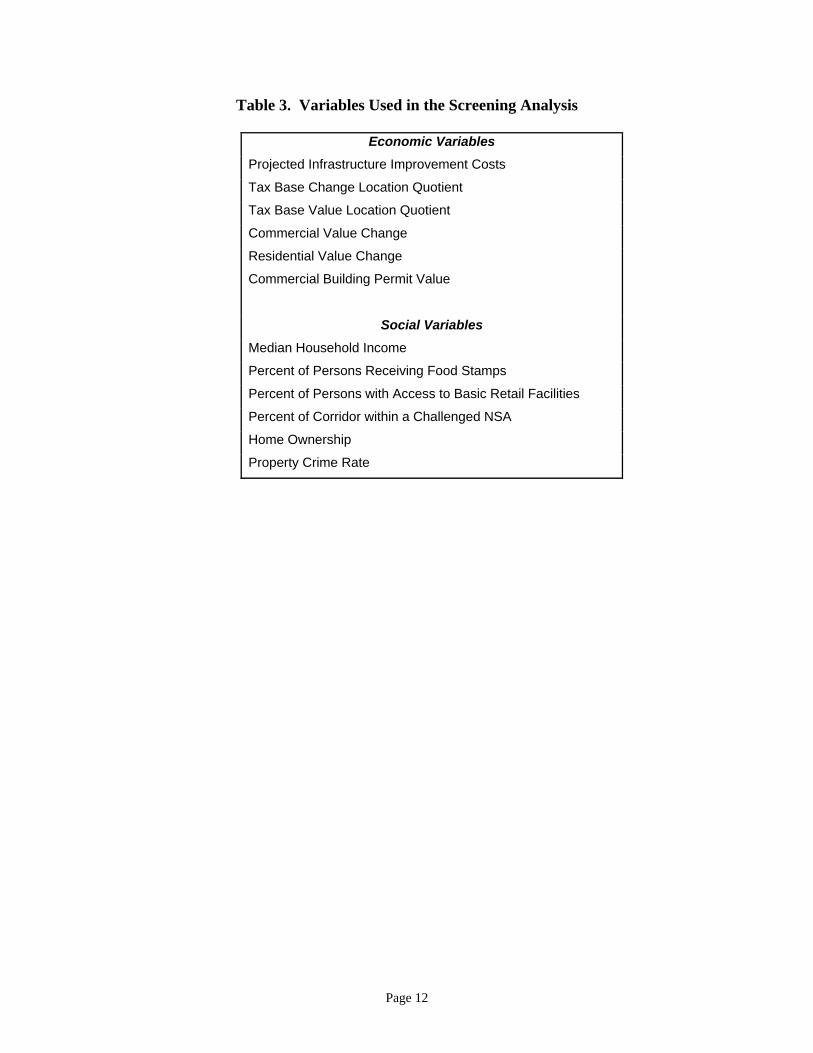
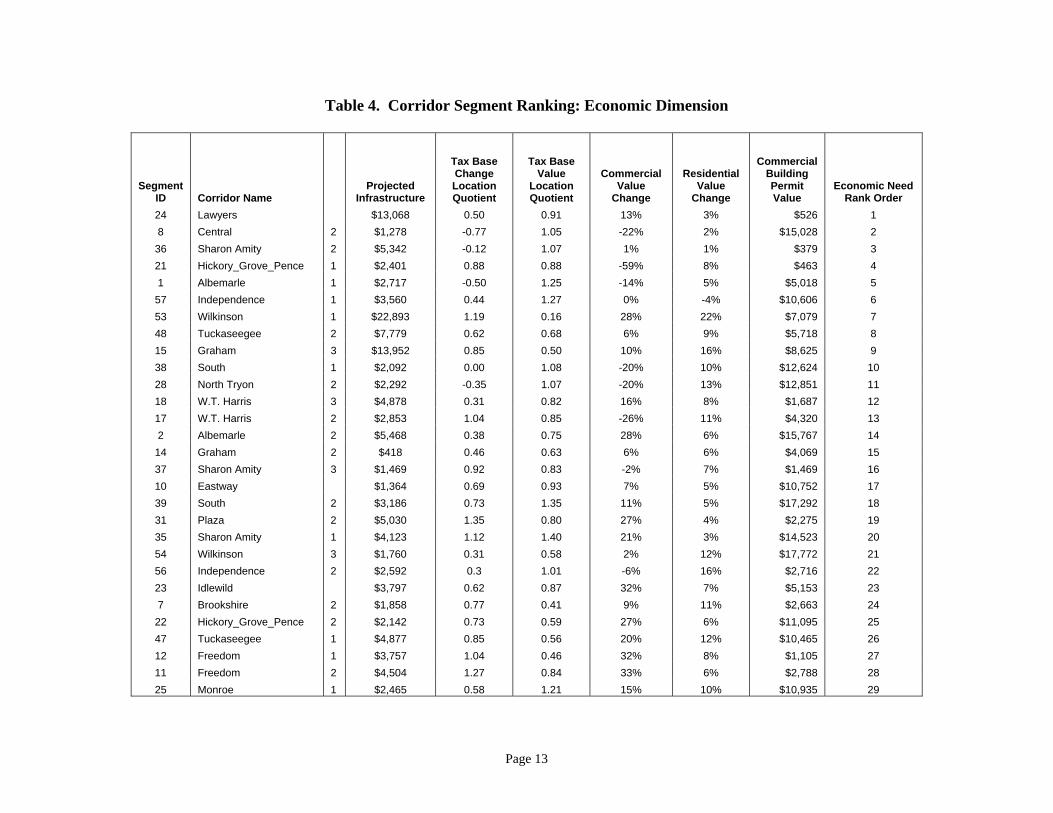
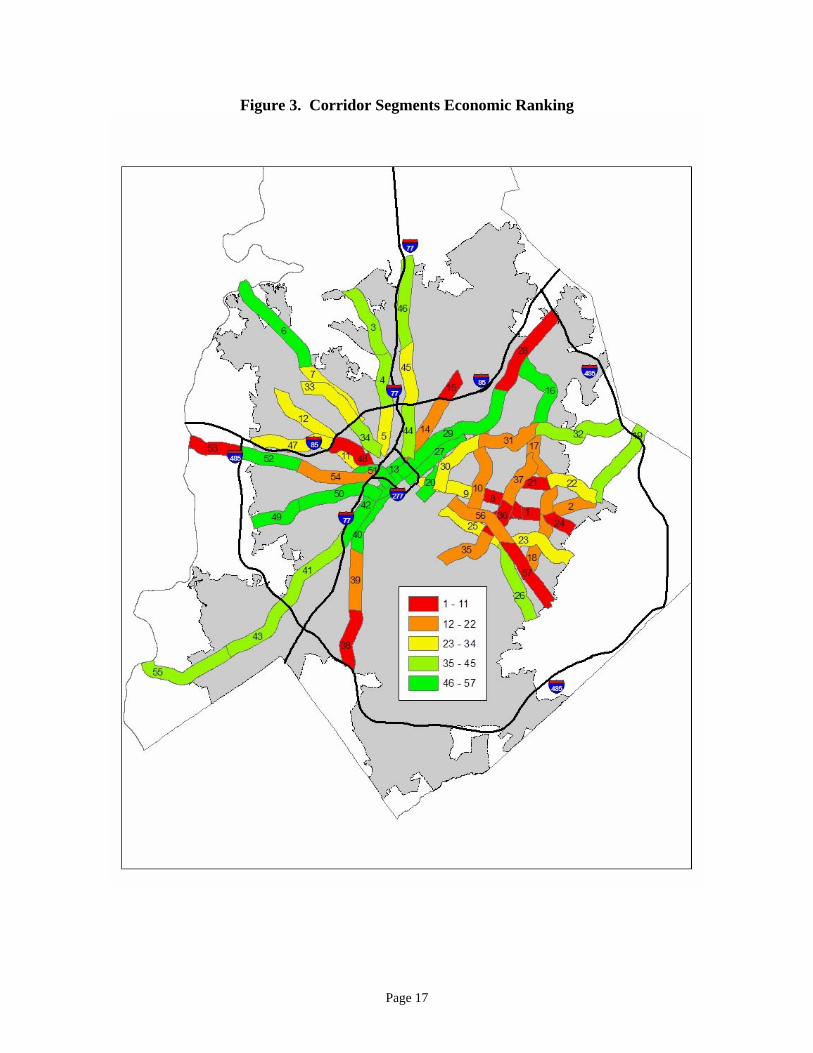
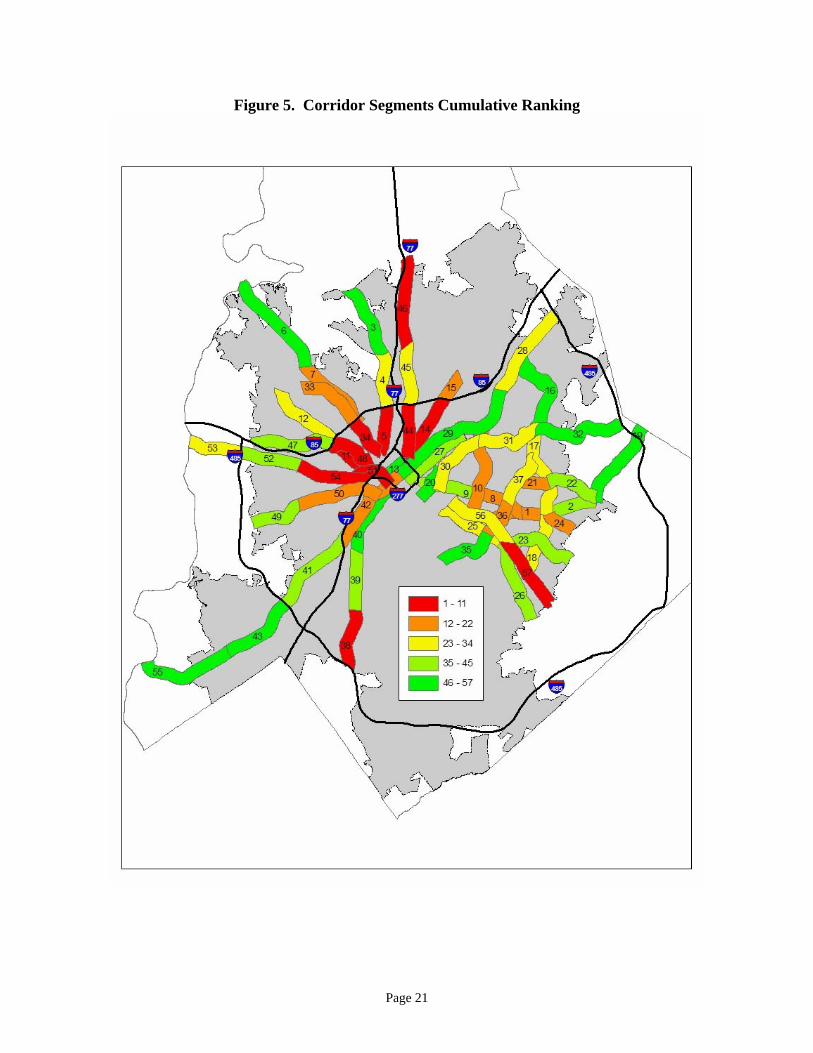
CORRIDOR EVALUATION ANALYSIS In order to assess the relative need for economic stimulation by the CMDC, the 57 corridor road segments were evaluated using social, economic, demographic, and infrastructure variables. Most of these screening variables were derived from current public source data providers in Charlotte or Mecklenburg County. The 2006 Charlotte Neighborhood Quality of Life Study was a major secondary data source. The evaluation process was framed around six economic measures and six social measures compiled for each corridor segment. These variables are listed on Table 3. A variable description and data source are also presented in Appendix A. In addition to the analytical variables, four background variables were developed for each corridor segment. The background variables offer a broader perspective on each corridor segment. They are described in Appendix A. Based upon the scores of the individual variables, the corridor segments were rank ordered along economic and social dimensions. As a result, each roadway segment is rated on a scale, ranging from 1 to 57 for each dimension. Using this method, the higher the rank, the greater the economic or social need. Tables 4 and 5 present the economic and social dimension ranking results, respectively. These same findings are mapped on Figures 3 and 4. For clarity purposes, on the maps, the segment ranks are grouped into five categories by level of need so that the highest level of need group, represented in red, includes corridor segments ranked 1 through 11; and the lowest level of need, presented in green, encompasses corridor segments ranked 46 through 57. Following the individual economic and social rank order process, the results were combined into a cumulative measurement of need. These results followed the same protocol and mapping scheme used in the previous analyses. The findings of the cumulative ranking process are shown on Table 6 and Figure 5. As a part of this project, an individual corridor segment profile sheet has been created for all 57 roadway segments. These profiles are intended to provide the CMDC staff and committee members, economic developers, community residents, and other interested parties with a “snapshot” of the corridor segment. They offer insights into corridor assets, liabilities, and potential real estate opportunities. The profiles are one page in size and complementary to the full research findings. The corridor profiles are contained in Appendix B of this report. Digital copies of these materials are available from the Charlotte Mecklenburg Development Corporation.
Page 12
Table 3. Variables Used in the Screening Analysis
Economic Variables Projected Infrastructure Improvement Costs
Tax Base Change Location Quotient
Tax Base Value Location Quotient
Commercial Value Change
Residential Value Change
Commercial Building Permit Value
Social Variables Median Household Income
Percent of Persons Receiving Food Stamps
Percent of Persons with Access to Basic Retail Facilities
Percent of Corridor within a Challenged NSA
Home Ownership
Property Crime Rate
Page 13
Table 4. Corridor Segment Ranking: Economic Dimension
Segment ID Corridor Name
Projected Infrastructure
Tax Base Change Location Quotient
Tax Base Value
Location Quotient
Commercial Value
Change
Residential Value
Change
Commercial Building Permit Value
Economic Need Rank Order
24 Lawyers $13,068 0.50 0.91 13% 3% $526 1 8 Central 2 $1,278 -0.77 1.05 -22% 2% $15,028 2
36 Sharon Amity 2 $5,342 -0.12 1.07 1% 1% $379 3 21 Hickory_Grove_Pence 1 $2,401 0.88 0.88 -59% 8% $463 4 1 Albemarle 1 $2,717 -0.50 1.25 -14% 5% $5,018 5
57 Independence 1 $3,560 0.44 1.27 0% -4% $10,606 6 53 Wilkinson 1 $22,893 1.19 0.16 28% 22% $7,079 7 48 Tuckaseegee 2 $7,779 0.62 0.68 6% 9% $5,718 8 15 Graham 3 $13,952 0.85 0.50 10% 16% $8,625 9 38 South 1 $2,092 0.00 1.08 -20% 10% $12,624 10 28 North Tryon 2 $2,292 -0.35 1.07 -20% 13% $12,851 11 18 W.T. Harris 3 $4,878 0.31 0.82 16% 8% $1,687 12 17 W.T. Harris 2 $2,853 1.04 0.85 -26% 11% $4,320 13 2 Albemarle 2 $5,468 0.38 0.75 28% 6% $15,767 14
14 Graham 2 $418 0.46 0.63 6% 6% $4,069 15 37 Sharon Amity 3 $1,469 0.92 0.83 -2% 7% $1,469 16 10 Eastway $1,364 0.69 0.93 7% 5% $10,752 17 39 South 2 $3,186 0.73 1.35 11% 5% $17,292 18 31 Plaza 2 $5,030 1.35 0.80 27% 4% $2,275 19 35 Sharon Amity 1 $4,123 1.12 1.40 21% 3% $14,523 20 54 Wilkinson 3 $1,760 0.31 0.58 2% 12% $17,772 21 56 Independence 2 $2,592 0.3 1.01 -6% 16% $2,716 22 23 Idlewild $3,797 0.62 0.87 32% 7% $5,153 23 7 Brookshire 2 $1,858 0.77 0.41 9% 11% $2,663 24
22 Hickory_Grove_Pence 2 $2,142 0.73 0.59 27% 6% $11,095 25 47 Tuckaseegee 1 $4,877 0.85 0.56 20% 12% $10,465 26 12 Freedom 1 $3,757 1.04 0.46 32% 8% $1,105 27 11 Freedom 2 $4,504 1.27 0.84 33% 6% $2,788 28 25 Monroe 1 $2,465 0.58 1.21 15% 10% $10,935 29

Page 14
Table 4. Corridor Segment Ranking: Economic Dimension (continued)
Segment ID Corridor Name
Projected Infrastructure
Tax Base Change Location Quotient
Tax Base Value
Location Quotient
Commercial Value
Change
Residential Value
Change
Commercial Building Permit Value
Economic Need Rank Order
33 Rozzelles Ferry 1 $815 1.04 0.50 12% 9% $3,733 30 5 Beatties Ford 3 $1,088 0.88 0.97 -5% 12% $11,201 31
30 Plaza 1 $1,109 1.58 1.05 13% 4% $4,257 32 9 Central 1 $457 1.23 1.20 19% 5% $2,700 33
45 Statesville Road 1 $3,351 0.96 0.65 23% 13% $2,194 34 4 Beatties Ford 2 $7,391 1.54 0.44 13% 16% $28,650 35
41 South Tryon 3 $3,945 1.50 1.04 26% 10% $9,110 36 32 Plaza 3 $4,662 2.12 0.29 58% 4% $1,464 37 55 York $16,983 2.88 0.47 55% 15% $13,664 38 26 Monroe 2 $4,725 0.81 1.21 38% 12% $24,785 39 34 Rozzelles Ferry 2 $761 1.08 0.58 23% 14% $644 40 43 South Tryon 1 $1,974 1.27 1.05 7% 13% $34,587 41 3 Beatties Ford 1 $3,595 1.73 0.44 50% 11% $2,053 42
46 Statesville Road 2 $2,166 0.31 0.67 7% 26% $20,999 43 19 Harrisburg $2,746 1.88 0.37 55% 9% $1,261 44 44 Statesville Avenue $300 1.38 0.63 24% 15% $6,252 45 51 West Morehead $1,499 1.50 2.70 32% 10% $9,190 46 40 South 3 $1,099 2.23 2.52 47% 5% $23,656 47 50 West 2 $702 1.77 0.62 52% 16% $7,021 48 42 South Tryon 2 $309 0.62 4.74 8% 12% $81,252 49 52 Wilkinson 2 $22 0.77 1.04 19% 26% $34,732 50 16 W.T. Harris 1 $2,580 3.15 1.19 25% 15% $29,433 51 49 West 1 $3,753 2.27 0.91 60% 18% $21,345 52 20 Hawthorne $662 1.58 2.88 36% 8% $103,791 53 29 North Tryon 1 $1,700 1.69 2.46 31% 16% $100,941 54 6 Brookshire 1 $3,429 4.12 0.32 52% 18% $11,008 55
27 Davidson $405 3.08 1.72 72% 15% $9,053 56 13 Graham 1 $0 2.38 14.36 49% 10% $279,666 57

Page 15
Table 5. Corridor Segment Ranking: Social Dimension
Segment
ID Corridor Name
Median Household
Income
Percent of Persons Receiving Food
Stamps
Percent of Persons with
Access to Basic Retail
Percent of Corridor that
Falls in a Challenged
NSA Homeownership
Rate
Property Crime Rate
Social Need Rank Order
46 Statesville Road 2 $60,809 77% 0% 50% 48% 5.27 1 51 West Morehead $40,007 14% 0% 29% 27% 5.85 2 34 Rozzelles Ferry 2 $23,400 17% 0% 86% 31% 1.14 3 44 Statesville Avenue $22,680 18% 0% 49% 15% 1.83 4 42 South Tryon 2 $29,177 15% 27% 38% 19% 4.62 5 48 Tuckaseegee 2 $30,332 24% 21% 75% 34% 1.88 6 11 Freedom 2 $31,969 24% 30% 73% 41% 3.04 7 50 West 2 $26,116 25% 19% 49% 26% 1.62 8 54 Wilkinson 3 $30,558 27% 19% 36% 35% 2.61 9 14 Graham 2 $24,735 24% 26% 35% 45% 2.53 10 27 Davidson $29,080 17% 7% 23% 36% 2.15 11 5 Beatties Ford 3 $27,224 19% 23% 53% 35% 1.12 12
33 Rozzelles Ferry 1 $35,889 15% 0% 43% 36% 1.22 13 7 Brookshire 2 $39,696 17% 0% 39% 35% 1.03 14
52 Wilkinson 2 $33,912 39% 0% 0% 38% 0.01 15 49 West 1 $38,765 7% 0% 7% 1% 1.08 16 29 North Tryon 1 $34,451 17% 35% 17% 22% 2.21 17 38 South 1 $45,207 9% 11% 26% 15% 1.55 18 4 Beatties Ford 2 $42,765 18% 5% 17% 52% 1.93 19
40 South 3 $41,505 7% 36% 16% 31% 2.37 20 56 Independence 2 $39,794 14% 19% 0% 38% 1.72 21 57 Independence 1 $45,744 9% 19% 0% 14% 1.26 22 13 Graham 1 $43,116 4% 64% 0% 27% 4.84 23 10 Eastway $40,168 11% 18% 0% 28% 1.28 24 45 Statesville Road 1 $41,492 9% 0% 16% 63% 1.81 25 25 Monroe 1 $38,791 15% 49% 0% 23% 1.86 26 21 Hickory Grove/Pence 1 $37,461 11% 25% 0% 41% 1.62 27 20 Hawthorne $46,935 9% 10% 0% 39% 1.69 28 12 Freedom 1 $45,752 13% 6% 10% 56% 1.48 29 30 Plaza 1 $39,179 15% 41% 10% 43% 1.67 30 37 Sharon Amity 3 $37,755 13% 38% 0% 32% 1.19 31 26 Monroe 2 $47,589 7% 13% 0% 33% 1.32 32 15 Graham 3 $51,319 17% 5% 0% 54% 1.25 33

Page 16
Table 5. Corridor Segment Ranking: Social Dimension (continued)
Segment ID Corridor Name
Median Household
Income
Percent of Persons Receiving Food
Stamps
Percent of Persons with
Access to Basic Retail
Percent of Corridor that
Falls in a Challenged
NSA Homeownership
Rate
Property Crime Rate
Social Need Rank Order
9 Central 1 $45,768 12% 49% 0% 28% 1.78 34 28 North Tryon 2 $50,783 4% 39% 0% 11% 1.35 35 47 Tuckaseegee 1 $50,046 10% 26% 1% 38% 1.37 36 23 Idlewild $48,450 15% 10% 0% 57% 0.98 37 8 Central 2 $39,391 9% 66% 0% 16% 1.33 38
41 South Tryon 3 $48,580 5% 31% 0% 29% 1.38 39 53 Wilkinson 1 $46,222 17% 0% 0% 78% 1.05 40 31 Plaza 2 $41,002 11% 43% 0% 41% 1.28 41 36 Sharon Amity 2 $41,632 13% 59% 0% 32% 1.41 42 17 W.T. Harris 2 $44,502 12% 43% 0% 34% 1.02 43 16 W.T. Harris 1 $52,869 3% 31% 0% 23% 0.92 44 39 South 2 $46,845 8% 47% 0% 33% 1.29 45 2 Albemarle 2 $49,350 9% 26% 0% 48% 1.12 46 1 Albemarle 1 $39,764 10% 88% 0% 12% 1.48 47
18 W.T. Harris 3 $46,361 10% 29% 0% 52% 1.12 48 24 Lawyers $52,353 12% 25% 0% 55% 0.93 49 22 Hickory Grove/Pence 2 $50,023 12% 16% 0% 80% 0.93 50 35 Sharon Amity 1 $57,937 4% 32% 0% 52% 0.88 51 43 South Tryon 1 $60,800 2% 40% 0% 30% 0.36 52 3 Beatties Ford 1 $62,530 8% 12% 0% 78% 0.83 53
19 Harrisburg $61,585 8% 5% 0% 81% 0.46 54 6 Brookshire 1 $65,846 8% 31% 0% 57% 0.74 55
55 York $74,712 2% 12% 0% 54% 0.33 56 32 Plaza 3 $76,503 6% 2% 0% 82% 0.46 57
Page 17
Figure 3. Corridor Segments Economic Ranking

Page 18
Figure 4. Corridor Segments Social Ranking
Page 19
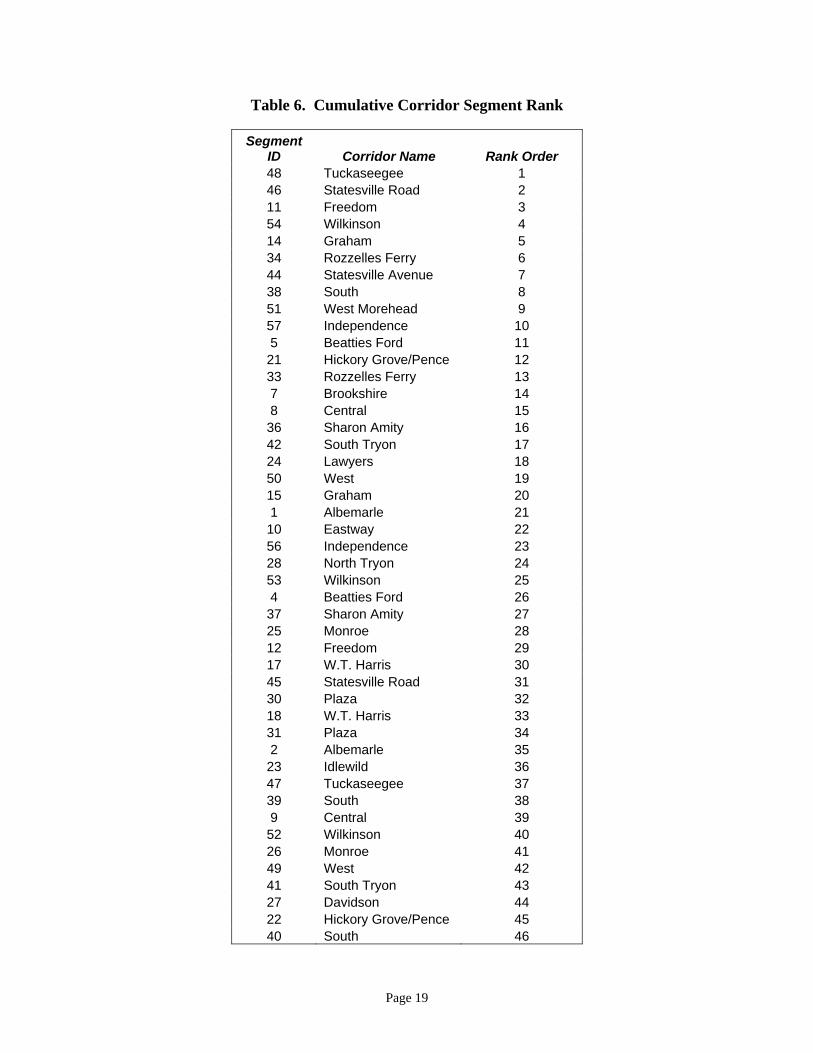
Table 6. Cumulative Corridor Segment Rank
Segment ID Corridor Name Rank Order 48 Tuckaseegee 1 46 Statesville Road 2 11 Freedom 3 54 Wilkinson 4 14 Graham 5 34 Rozzelles Ferry 6 44 Statesville Avenue 7 38 South 8 51 West Morehead 9 57 Independence 10 5 Beatties Ford 11 21 Hickory Grove/Pence 12 33 Rozzelles Ferry 13 7 Brookshire 14 8 Central 15 36 Sharon Amity 16 42 South Tryon 17 24 Lawyers 18 50 West 19 15 Graham 20 1 Albemarle 21 10 Eastway 22 56 Independence 23 28 North Tryon 24 53 Wilkinson 25 4 Beatties Ford 26 37 Sharon Amity 27 25 Monroe 28 12 Freedom 29 17 W.T. Harris 30 45 Statesville Road 31 30 Plaza 32 18 W.T. Harris 33 31 Plaza 34 2 Albemarle 35 23 Idlewild 36 47 Tuckaseegee 37 39 South 38 9 Central 39 52 Wilkinson 40 26 Monroe 41 49 West 42 41 South Tryon 43 27 Davidson 44 22 Hickory Grove/Pence 45 40 South 46
Page 20
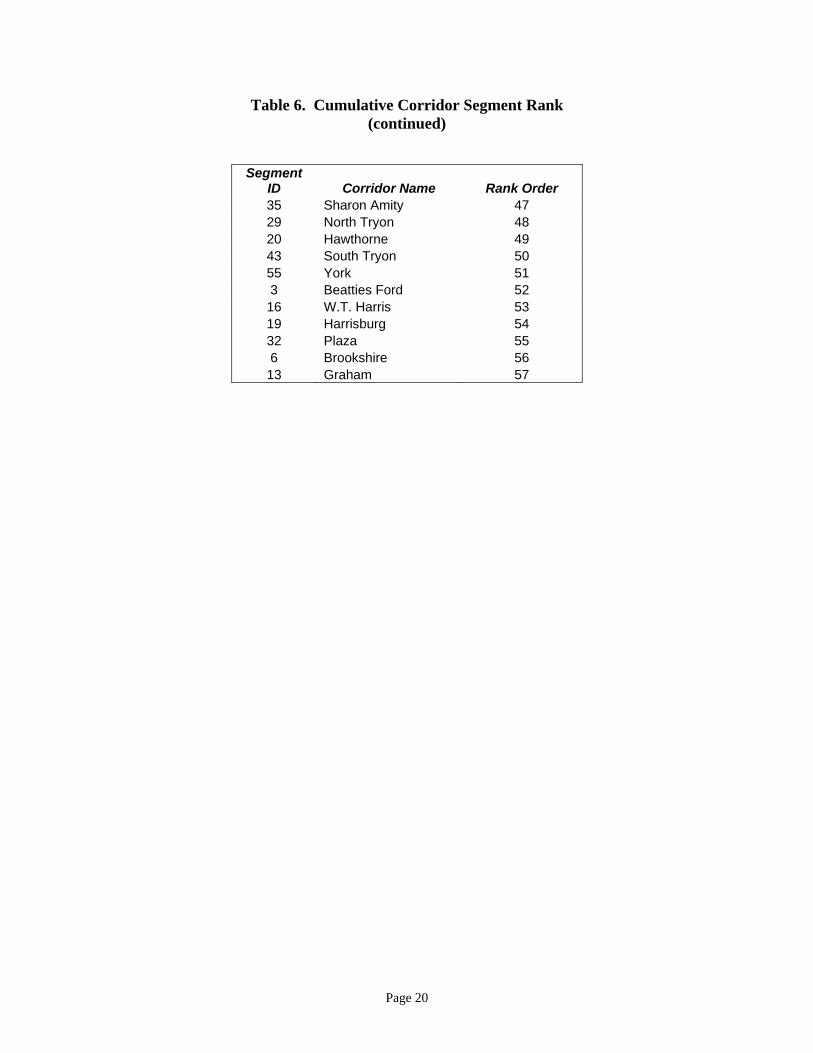
Table 6. Cumulative Corridor Segment Rank (continued)
Segment ID Corridor Name Rank Order 35 Sharon Amity 47 29 North Tryon 48 20 Hawthorne 49 43 South Tryon 50 55 York 51 3 Beatties Ford 52 16 W.T. Harris 53 19 Harrisburg 54 32 Plaza 55 6 Brookshire 56 13 Graham 57
Page 21
Figure 5. Corridor Segments Cumulative Ranking
Page 22
REAL ESTATE DEVELOPMENT POTENTIAL PROCESS
On October 19, 2006, the UNC Charlotte research team met with the CMDC and their staff to review the findings of the evaluation matrix analyses and determine the next phase of the project. Following a discussion of the corridor segment rank order results, there was agreement that a limited number of corridor segments should be evaluated for more detailed economic development potential. Guided by the results of the combined economic and social needs analysis, five corridors are chosen for the real estate evaluation and assessment. The selection process was guided by a variety of concerns. These included the restricted funding options available to the CMDC, the potential for success balanced against risks in the most disadvantaged corridors, and the growing economic distress in Eastside Charlotte. The corridor segments chosen included the following:
• Graham Street, between Interstate 277 and Interstate 85 (Corridor Segment 14). • Rozzelles Ferry Road, between Interstate 77 and Interstate 85 (Corridor Segment 34).
• Beatties Ford Road between Interstate 85 and the Brookshire Freeway (Corridor
Segment 5).
• West Boulevard between Interstate 77 and Billy Graham Parkway (Corridor Segment 50).
• Albemarle Road/Central Avenue/North Sharon Amity, near Eastland Mall (Corridor
Segments 1, 8, 36).

Page 23
CORRIDOR REAL ESTATE DEVELOPMENT ANALYSIS: SYNOPSIS This economic development analysis was structured by examining the demographic composition of each corridor and the condition of the real estate sub-market. Based upon these findings, Graham Street, Rozzelles Ferry Road, and West Boulevard were selected as the most feasible for economic development investment at the present time. Retail and flex-office were identified as the most beneficial types of commercial development in all three of these corridors and a financial analysis was completed to determine the subsidy required to stimulate development. The results of the analysis and the supporting assumptions are presented below. Corridor Analysis: Graham Street Corridor Demographics Three locations along Graham Street were selected to represent the demographic composition of the corridor. Commercial land uses dominate the north section near the Interstate 85 interchange and residential housing is limited. Population density increases moving towards the central business district. The highest concentrations of poverty appear to exist in the central section of the corridor. The median household income is under $28,000 and home values are considerably lower than the other sections represented. Over 97 percent of the central section is composed of minority residents.
Table 7. Graham Street Corridor Demographics
One Mile Radius: 2006 Estimates
South (435 W Liddell St.)
Central (700 W 28th St.)
North (4420 N. Graham St.)
Total Population 10,320 7,305 4,260 Black Population 67.9% 84.5% 67.1% Hispanic Population 5.7% 12.6% 13.0% Median Household Income $33,954 $27,921 $38,664 Median Home Value $144,231 $77,043 $98,558 Renter-Occupied Housing 60% 59.9% 53.2%
Real Estate Market The Graham Street corridor is primarily composed of older industrial/distribution facilities. The real estate sub-market has remained relatively stable over the last few years due to convenient access to the interstate system and the availability of I-2 zoned land near the center city. Occupancy levels remain above 90 percent, but new development in the corridor is generally limited to owner-users. Beacon Partners owns and manages Atando Industrial Park, which contains over 1,000,000 square feet (SF) of leaseable space in the corridor. The park currently operates at 95-98 percent occupancy and offers multi-tenant small bay warehouse, bulk distribution space, and single tenant facilities ranging from 10,000 to 20,000 SF. The park has experienced an increase in

Page 24
demand for small warehouse space (1,200-5,000 SF) over the last year and annual rental rates range from $4.50-7.00 SF of triple net leases (NNN). Taxes, insurance and common area maintenance expenses are currently estimated at $1.08 SF for this space.
Bulk distribution space ranges from $3.25-3.75 SF of NNN with pass-through expenses of $.80 SF. Rental rates for single-tenant buildings range from $4.25-7.00 SF of NNN depending on the amount of land available for outside storage. Three to five year lease terms are common throughout the park, with some seven to ten year leases in single tenant buildings. Beacon Partners offers the only professionally managed industrial park environment in the corridor, therefore lease rates are somewhat lower in other locations. Commercial brokers active in the area estimate lower quality bulk distribution space is available from $2.75-3.00 SF.
Land values throughout the corridor vary greatly depending on the topography of the site. Beacon Partners recently sold land within the Atando Industrial Park and estimates flat and cleared I-2 zoned land trades for approximately $150,000 per acre. Commercial appraisers active in the area suggest sites with more challenging topography sell for considerably less, ranging from $70,000 to $90,000 per acre. Market prices for existing facilities also vary greatly based on the quality and the amount of land included. The Ferguson Supply and Box Company building was purchased for $900,000 in March of 2006. The property includes a 55,580 SF distribution facility and 3.11 acres of land. Haz-Mat Transportation and Supply also purchased an industrial building approximately 30,000 SF in size on 5.59 acres of land in the same month for $412,500.
The corridor is served by only one strip retail center. It is composed of a local grocer, a national discount store, and several smaller tenants. The center has high occupancy, but shows signs of significant deferred maintenance. Market rents are estimated between $4.00 and $8.00 SF depending on tenant credit, lease term, and size. Several stand-alone restaurants are also located throughout the corridor to serve the industrial employment base. Office space is nearly non-existent in the market. Industrial facilities located in the corridor do not offer a flex space product and office build-out is typically limited to 200-400 SF.
Prospective Economic Development Activity Industrial development is likely to occur in the corridor over time due to the availability of I-2 zoned land near the center city. Industrial facilities are the most appropriate commercial land use, but market-oriented retail and flex space could provide amenity benefits and diversify the existing tenant base. Petty crime in the area appears to be a significant impediment to these uses in the central section of the corridor. Subsidies reducing retail and flex lease rates could potentially increase the probability of development. The subsidy may need to reduce the lease rate of a retail anchor tenant to $4.00-$6.00 SF of NNN and small shop lease rates to $10.00-$12.00 SF of NNN. Flex space lease rates must be reduced to a blended $7.00-$9.00 SF to be competitive. However, this space may potentially compete with small bay industrial space already available in the corridor at similar rates.

Page 25
Corridor Analysis: Rozzelles Ferry Road Demographics Population density is reasonably consistent throughout the Rozzelles Ferry Road corridor. The highest concentrations of poverty are located in the central section. The median household income in this section is below $28,000 and over 92 percent of the population is composed of minority residents. Approximately half of the housing throughout the entire corridor is owner-occupied.
Table 8. Rozzelles Ferry Road Corridor Demographics
One Mile Radius: 2006 Estimates
South (140 N. Brun Ave.)
Central (2801 Rozzelles
Ferry)
North (3608 Rozzelles
Ferry) Total Population 10,144 11,338 8,876 Black Population 85.4% 89.1% 78.3% Hispanic Population 2.9% 3.5% 4.3% Median Household Income $31,537 $27,749 $30,721 Median Home Value $96,236 $78,247 $78,594 Renter-Occupied Housing 51.3% 54.2% 51.0%
Real Estate Market The Rozzelles Ferry Road corridor is predominately composed of older industrial and bulk distribution facilities. A number of single tenant buildings exist along both sides of the road and multi-tenant space is available within the Chemway Industrial Park. Large bay warehouse with 16-18 ff clear heights is readily available. Lease rates range from $2.00-3.50 SF of NNN. Office build-out is generally limited to 200-400 square feet in this space. Pass-through expenses are estimated at a relatively low $.50/SF due to limited amenities and landscaping throughout the corridor. Occupancy rates remain relatively high in the submarket, but three year leases are common and rental rates have not yet encouraged significant new development. A number of pending transportation improvements may generate industrial development in the future. The completion of Interstate 485, the widening of Highway 16, and construction of Fred Alexander Boulevard will increase connectivity in the area. Land prices have responded and brokers active in the area estimate flat and cleared I-2 zoned land trades for approximately $125,000 acre. Sites with more challenging topography commonly sell from $60,000 to $90,000 acre. New retail and office development has emerged in response to residential construction near Highway 16. Retail/Service-Retail rental rates are above $18.00/SF of NNN in new projects will strong locations.
Prospective Economic Development Activity Industrial development is the most appropriate commercial land use in the Rozzelles Ferry corridor and it is likely to occur over time due to transportation improvements and the
Page 26
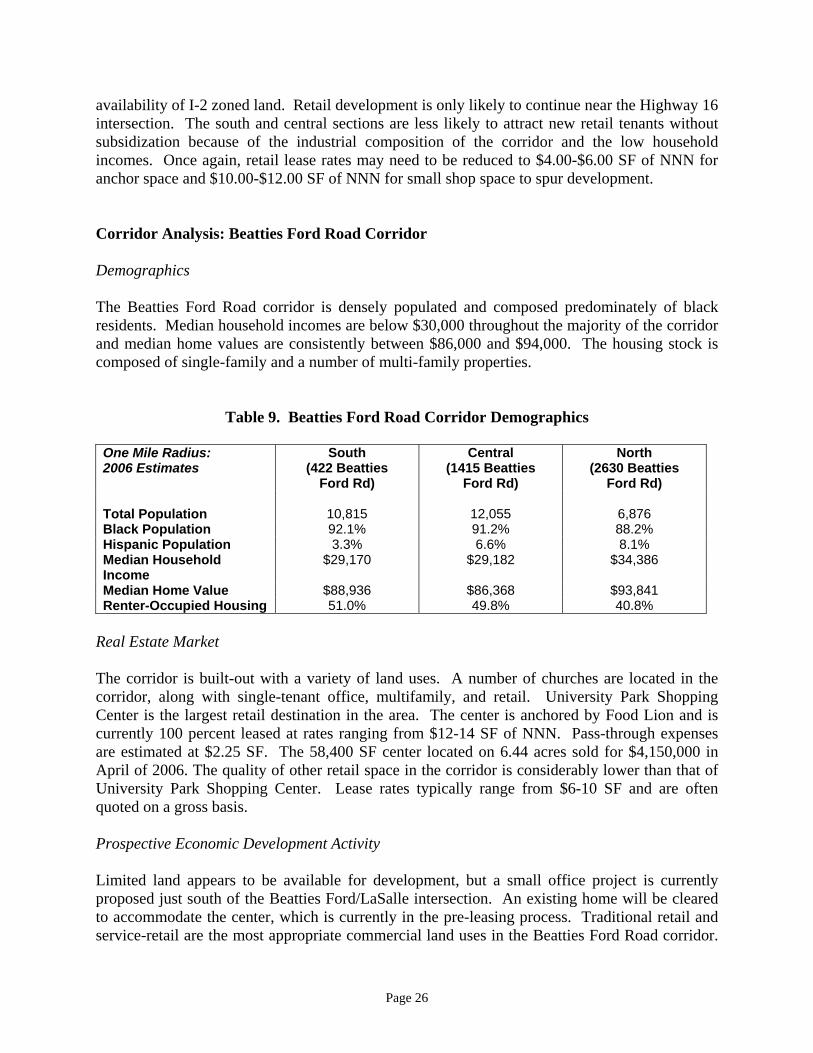
availability of I-2 zoned land. Retail development is only likely to continue near the Highway 16 intersection. The south and central sections are less likely to attract new retail tenants without subsidization because of the industrial composition of the corridor and the low household incomes. Once again, retail lease rates may need to be reduced to $4.00-$6.00 SF of NNN for anchor space and $10.00-$12.00 SF of NNN for small shop space to spur development. Corridor Analysis: Beatties Ford Road Corridor Demographics The Beatties Ford Road corridor is densely populated and composed predominately of black residents. Median household incomes are below $30,000 throughout the majority of the corridor and median home values are consistently between $86,000 and $94,000. The housing stock is composed of single-family and a number of multi-family properties.
Table 9. Beatties Ford Road Corridor Demographics
One Mile Radius: 2006 Estimates
South (422 Beatties
Ford Rd)
Central (1415 Beatties
Ford Rd)
North (2630 Beatties
Ford Rd) Total Population 10,815 12,055 6,876 Black Population 92.1% 91.2% 88.2% Hispanic Population 3.3% 6.6% 8.1% Median Household Income
$29,170 $29,182 $34,386
Median Home Value $88,936 $86,368 $93,841 Renter-Occupied Housing 51.0% 49.8% 40.8%
Real Estate Market The corridor is built-out with a variety of land uses. A number of churches are located in the corridor, along with single-tenant office, multifamily, and retail. University Park Shopping Center is the largest retail destination in the area. The center is anchored by Food Lion and is currently 100 percent leased at rates ranging from $12-14 SF of NNN. Pass-through expenses are estimated at $2.25 SF. The 58,400 SF center located on 6.44 acres sold for $4,150,000 in April of 2006. The quality of other retail space in the corridor is considerably lower than that of University Park Shopping Center. Lease rates typically range from $6-10 SF and are often quoted on a gross basis. Prospective Economic Development Activity Limited land appears to be available for development, but a small office project is currently proposed just south of the Beatties Ford/LaSalle intersection. An existing home will be cleared to accommodate the center, which is currently in the pre-leasing process. Traditional retail and service-retail are the most appropriate commercial land uses in the Beatties Ford Road corridor.

Page 27
Existing development in the area suggest such development is feasible at lease rates between $12.00-$14.00 SF of NNN without subsidies. However, future development may require assistance to reduce the cost of land assemblage because the corridor is largely built-out. Corridor Analysis: West Boulevard Corridor Demographics The demographic composition of the West Boulevard corridor changes dramatically moving from east to west. Home values in the east section reflect gentrification brought on by rapid economic growth in Charlotte’s South End community. The population is ethnically diverse and the median home value is relatively high. Median household income and home prices decrease dramatically in the central and west sections of the corridor. The population of these two sections is largely composed of minority residents. Additionally, a noticeable Hispanic population has settled in the west section.
Table 10. West Boulevard Corridor Demographics
One Mile Radius: 2006 Estimates
East (221 W. Worthington)
Central (1842 West Blvd.)
West (3119 West Blvd.)
Total Population 8,841 6,989 5,347 Black Population 52.2% 93.2% 84.5% Hispanic Population 1.8% 1.9% 7.9% Median Household Income $42,269 $29,112 $28,063 Median Home Value $215,304 $82,783 $76,269 Renter-Occupied Housing 56.5% 51.1% 65.9%
Real Estate Market
Retail, residential, and industrial land uses exist along the West Boulevard corridor. Construction of the New City West Commons Shopping Center has created retail activity at the corner of West Boulevard and Remount Road. The center is fully leased and attracts rates ranging from $13-15 SF of NNN. Residential investment activity has followed at the intersection with the sale of a 163 apartment complex in June of 2006. The property sold for $3,000,000. Industrial land uses become more common along the corridor closer to the airport. These are predominately single-tenant facilities. Several large tracts of industrial land are available in the area that could potentially be developed. Industrial brokers active in the area estimate I-2 zoned land trades for $80,000 to $100,000 per acre. Speculative development in the West Boulevard corridor has been limited by two factors. Brokers active in the area note that crime problems continue to discourage tenants. The completion of Interstate 485 and new residential/retail development in the southwest quadrant of the city has also drawn industrial development away from West Boulevard. However, the corridor is not completely stagnant. A new YMCA facility is currently under construction, which may spur retail activity.
Page 28
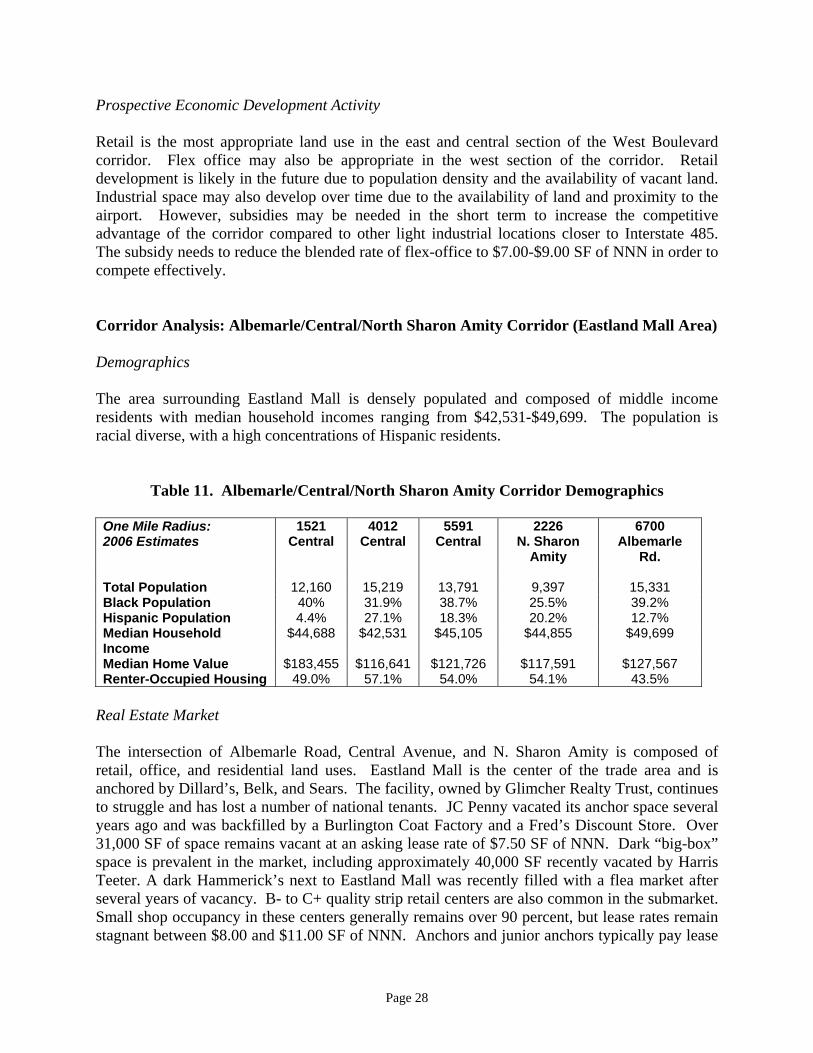
Prospective Economic Development Activity Retail is the most appropriate land use in the east and central section of the West Boulevard corridor. Flex office may also be appropriate in the west section of the corridor. Retail development is likely in the future due to population density and the availability of vacant land. Industrial space may also develop over time due to the availability of land and proximity to the airport. However, subsidies may be needed in the short term to increase the competitive advantage of the corridor compared to other light industrial locations closer to Interstate 485. The subsidy needs to reduce the blended rate of flex-office to $7.00-$9.00 SF of NNN in order to compete effectively. Corridor Analysis: Albemarle/Central/North Sharon Amity Corridor (Eastland Mall Area) Demographics The area surrounding Eastland Mall is densely populated and composed of middle income residents with median household incomes ranging from $42,531-$49,699. The population is racial diverse, with a high concentrations of Hispanic residents.
Table 11. Albemarle/Central/North Sharon Amity Corridor Demographics
One Mile Radius: 2006 Estimates
1521 Central
4012 Central
5591 Central
2226 N. Sharon
Amity
6700 Albemarle
Rd. Total Population 12,160 15,219 13,791 9,397 15,331 Black Population 40% 31.9% 38.7% 25.5% 39.2% Hispanic Population 4.4% 27.1% 18.3% 20.2% 12.7% Median Household Income
$44,688 $42,531 $45,105 $44,855 $49,699
Median Home Value $183,455 $116,641 $121,726 $117,591 $127,567 Renter-Occupied Housing 49.0% 57.1% 54.0% 54.1% 43.5%
Real Estate Market The intersection of Albemarle Road, Central Avenue, and N. Sharon Amity is composed of retail, office, and residential land uses. Eastland Mall is the center of the trade area and is anchored by Dillard’s, Belk, and Sears. The facility, owned by Glimcher Realty Trust, continues to struggle and has lost a number of national tenants. JC Penny vacated its anchor space several years ago and was backfilled by a Burlington Coat Factory and a Fred’s Discount Store. Over 31,000 SF of space remains vacant at an asking lease rate of $7.50 SF of NNN. Dark “big-box” space is prevalent in the market, including approximately 40,000 SF recently vacated by Harris Teeter. A dark Hammerick’s next to Eastland Mall was recently filled with a flea market after several years of vacancy. B- to C+ quality strip retail centers are also common in the submarket. Small shop occupancy in these centers generally remains over 90 percent, but lease rates remain stagnant between $8.00 and $11.00 SF of NNN. Anchors and junior anchors typically pay lease

Page 29
rates closer to $4.00-$6.00 SF of NNN. Pass-through expenses range from $1.00-$1.50 SF. A 17,000 SF Bi-Lo shadow-anchored center located at the corner of Albemarle and Farm Pond Road sold in December of 2004 for $1,850,000. Industrial uses are uncommon in the corridor, but the market does contain over 500,000 SF of older office product in the Charlotte East Business Park. Federal, state, and local government tenants make up 60 percent of the park’s occupancy. Space is currently available ranging from 200-70,000 SF at asking rates ranging from $14.00-15.00 SF. Deals are currently being done closer to $12-13 SF on a full service basis with limit up-fit allowances. While the park is currently operating at 70 percent occupancy, the property is under contract with a value-add investor who anticipates stabilizing lease rates and decreasing vacancy over the next 24 months. Multi-family investment activity has continued in the market with the sale of two large complexes. A 192 unit complex located on 15 acres at 6600 Yateswood Road sold for $4,590,000 in April of 2006. A 358 unit complex located on 27 acres at 5411 Albemarle Road also sold for $7,826,000 in December of 2005.
Prospective Economic Development Activity Retail is the most appropriate commercial land use in the corridor. Single-tenant facilities have been constructed in the last two years for fast food tenants and a discount grocer (Aldi). National discount retailers also continue to locate in the area to take advantage of high traffic counts, population density, and the corridor’s “blue collar” composition. However, the corridor is currently over-retailed and several big boxes are available. Occupancy rates for small-shop space remain high, but rents have been stagnant over the last 2-3 years. The planned development of a Wal-Mart on Independence Boulevard may also pull retail activity away from the corridor in the future. Subsidies may fail to provide an advantage for the corridor because they are likely to create additional competition for existing facilities without generating net economic growth. Redevelopment of an existing big-box or strip retail center may be an appropriate project. Redeveloped anchor space could be competitive at a lease rate between $4.00-$6.00 SF of NNN, while small shop space could potentially attract $12.00-$15.00 SF of NNN. Office development in the corridor is unlikely without subsidies. Charlotte East Business Park has a large amount of space available for tenants of various sizes. The rates are very competitive for both small and large users. The limited connectivity of the corridor may also limit its attractiveness for future office development. Tenants are more likely to locate in submarkets with convenient interstate access.
Page 30
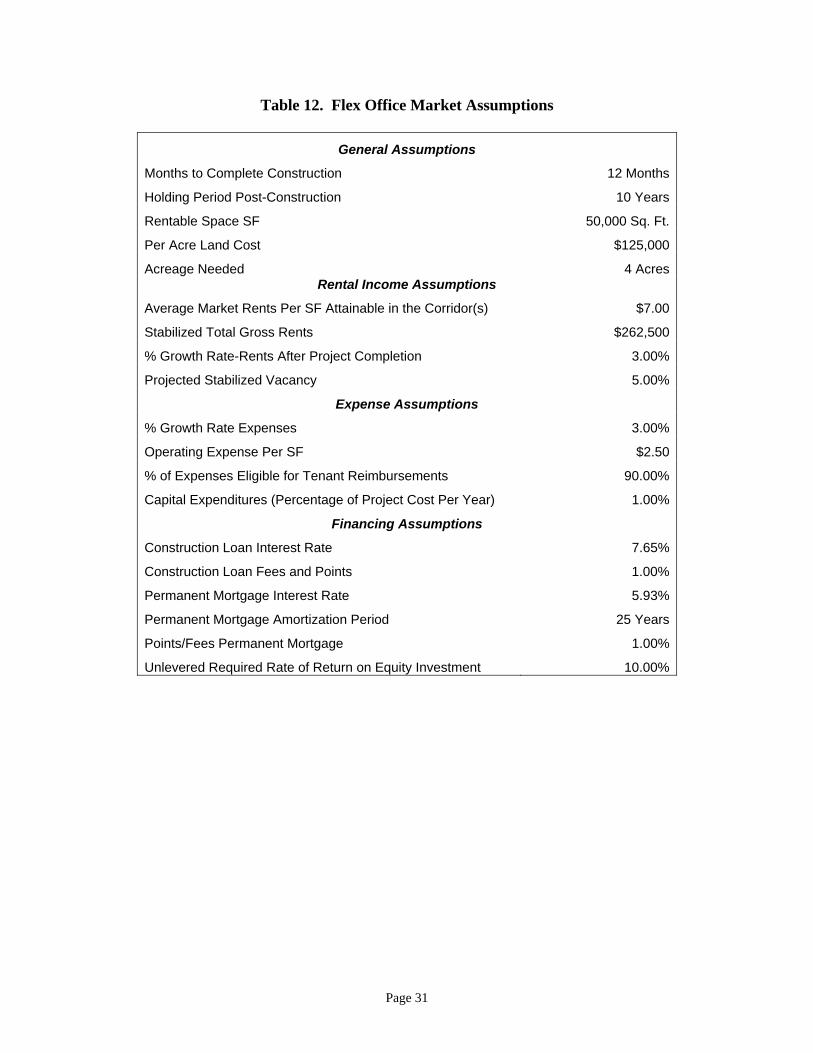
PROPOSED INVESTMENT AND FINANCIAL ANALYSIS Graham Street, Rozzelles Ferry Road, and West Boulevard were chosen as the most suitable locations for economic development investment after reviewing the real estate fundamentals in each sub-market. Retail and flex-office were also identified as the most beneficial land uses in each corridor. A number of factors influenced the decision. First, vacant land is available for development in all three corridors. Second, additional retail development is needed to serve the low-income residents in these areas and it will provide an amenity benefit for the existing industrial tenants. Third, flex office development may diversify the tenant base and create employment opportunities in these corridors without directly competing with industrial buildings already in the market. Fourth, the Beatties Ford Road corridor and the Eastland Mall area are predominately built out and the costs of assembling a large site for development are prohibitive. Flex Office Development A single financial analysis was completed to examine the feasibility of flex office development in the three corridors because they are all face similar market conditions. The market assumptions and construction costs estimates used to complete the analysis are outlined in Tables 12 and 13. The assumptions are based on information provided by commercial real estate brokers, appraisers, and developers active in the Charlotte area.
Page 31
Table 12. Flex Office Market Assumptions
General Assumptions
Months to Complete Construction 12 Months
Holding Period Post-Construction 10 Years
Rentable Space SF 50,000 Sq. Ft.
Per Acre Land Cost $125,000
Acreage Needed 4 Acres Rental Income Assumptions
Average Market Rents Per SF Attainable in the Corridor(s) $7.00
Stabilized Total Gross Rents $262,500
% Growth Rate-Rents After Project Completion 3.00%
Projected Stabilized Vacancy 5.00%
Expense Assumptions
% Growth Rate Expenses 3.00%
Operating Expense Per SF $2.50
% of Expenses Eligible for Tenant Reimbursements 90.00%
Capital Expenditures (Percentage of Project Cost Per Year) 1.00%
Financing Assumptions
Construction Loan Interest Rate 7.65%
Construction Loan Fees and Points 1.00%
Permanent Mortgage Interest Rate 5.93%
Permanent Mortgage Amortization Period 25 Years
Points/Fees Permanent Mortgage 1.00%
Unlevered Required Rate of Return on Equity Investment 10.00%

Page 32
Table 13. Office Flex Construction Costs
Total Cost Per Sq. Ft.
Construction Hard Costs:
On-Site Improvements $500,000 $10.00
Building Shell 2,000,000 40.00
Tenant Improvements 500,000 10.00
Construction Contingency 90,000 1.80
Sub-total Construction Hard Costs $3,090,000 $61.80 Soft Costs
Architectural, Engineering 108,150 2.16
Leasing Costs 105,000 2.10
Marketing 30,900 0.62
Permits, Fees 30,900 0.62
Closing Costs, Title 20,000 0.40
Accounting & Legal 55,000 1.10
R/E taxes during construction 15,625 0.31
Insurance, Miscellaneous 36,000 0.72
Sub-total Soft Costs $401,575 $8.03
Sub-total Hard and Soft Costs $3,491,575 $69.83
Developer's Fee & Overhead 174,579 3.49
Land Cost 500,000 10.00 Total Project Costs $4,166,154 $83.32
Financed with Debt 80% 3,124,615
Financed with Equity 20% 1,041,538 Total $4,166,154
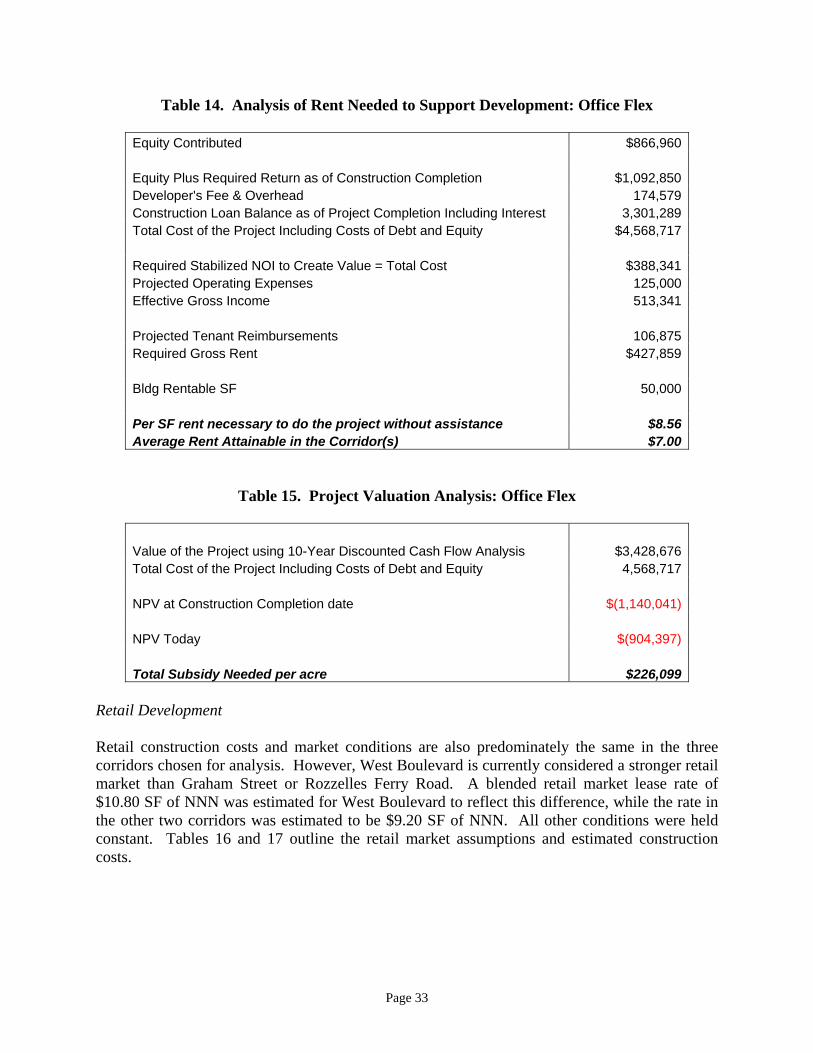
Table 14 represents the results of an analysis completed to estimate the rental rate needed to support flex office development under current market conditions. A new flex office project developed in any of the three corridors chosen for the analysis would require a rental rate of $8.56 of NNN to provide investors with a market rate of return. However, the existing market rate is estimated to be $7.00 SF of NNN and a subsidy is required to encourage development. The project valuation analysis presented in Table 15 estimates a subsidy of approximately $226,000 per acre is required to stimulate development.
Page 33
Table 14. Analysis of Rent Needed to Support Development: Office Flex
Equity Contributed $866,960 Equity Plus Required Return as of Construction Completion $1,092,850 Developer's Fee & Overhead 174,579 Construction Loan Balance as of Project Completion Including Interest 3,301,289 Total Cost of the Project Including Costs of Debt and Equity $4,568,717 Required Stabilized NOI to Create Value = Total Cost $388,341 Projected Operating Expenses 125,000 Effective Gross Income 513,341 Projected Tenant Reimbursements 106,875 Required Gross Rent $427,859 Bldg Rentable SF 50,000 Per SF rent necessary to do the project without assistance $8.56 Average Rent Attainable in the Corridor(s) $7.00
Table 15. Project Valuation Analysis: Office Flex
Value of the Project using 10-Year Discounted Cash Flow Analysis $3,428,676 Total Cost of the Project Including Costs of Debt and Equity 4,568,717 NPV at Construction Completion date $(1,140,041) NPV Today $(904,397) Total Subsidy Needed per acre $226,099
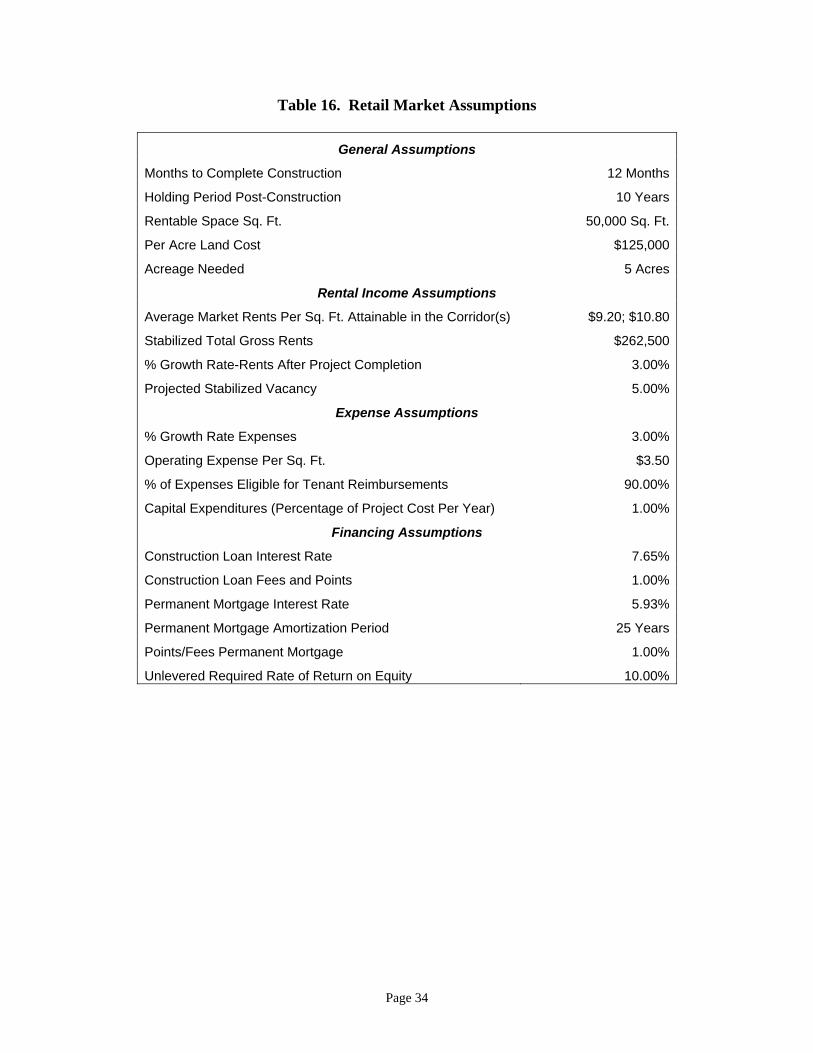
Retail Development Retail construction costs and market conditions are also predominately the same in the three corridors chosen for analysis. However, West Boulevard is currently considered a stronger retail market than Graham Street or Rozzelles Ferry Road. A blended retail market lease rate of $10.80 SF of NNN was estimated for West Boulevard to reflect this difference, while the rate in the other two corridors was estimated to be $9.20 SF of NNN. All other conditions were held constant. Tables 16 and 17 outline the retail market assumptions and estimated construction costs.
Page 34
Table 16. Retail Market Assumptions
General Assumptions
Months to Complete Construction 12 Months
Holding Period Post-Construction 10 Years
Rentable Space Sq. Ft. 50,000 Sq. Ft.
Per Acre Land Cost $125,000
Acreage Needed 5 Acres
Rental Income Assumptions
Average Market Rents Per Sq. Ft. Attainable in the Corridor(s) $9.20; $10.80
Stabilized Total Gross Rents $262,500
% Growth Rate-Rents After Project Completion 3.00%
Projected Stabilized Vacancy 5.00%
Expense Assumptions
% Growth Rate Expenses 3.00%
Operating Expense Per Sq. Ft. $3.50
% of Expenses Eligible for Tenant Reimbursements 90.00%
Capital Expenditures (Percentage of Project Cost Per Year) 1.00%
Financing Assumptions
Construction Loan Interest Rate 7.65%
Construction Loan Fees and Points 1.00%
Permanent Mortgage Interest Rate 5.93%
Permanent Mortgage Amortization Period 25 Years
Points/Fees Permanent Mortgage 1.00%
Unlevered Required Rate of Return on Equity 10.00%

Page 35
Table 17. Retail Construction Costs
Total Cost Per Sq. Ft. Construction Hard Costs:
On-Site Improvements $500,000 $10.00
Building Shell 3,500,000 70.00
Tenant Improvements 500,000 10.00
Construction Contingency 135,000
2.70
Sub-total Construction Hard Costs $4,635,000 $92.70
Soft Costs
Architectural, Engineering $278,100 $ 5.56
Leasing Costs 138,000 2.76
Marketing 46,350 0.93
Permits, Fees 46,350 0.93
Closing Costs, Title 20,000 0.40
Accounting & Legal 55,000 1.10
R/E taxes during construction 19,531 0.39
Insurance, Miscellaneous 36,000 0.72
Sub-total Soft Costs $639,331 $12.79
Sub-total Hard and Soft Costs $5,274,331 $105.49
Developer's Fee & Overhead 263,717 5.27
Land Cost 625,000 12.50
Total Project Costs Excluding Costs of Capital $6,163,048 $123.26 Financed with Debt $4,622,286
Financed with Equity $1,540,762
Total $6,163,048
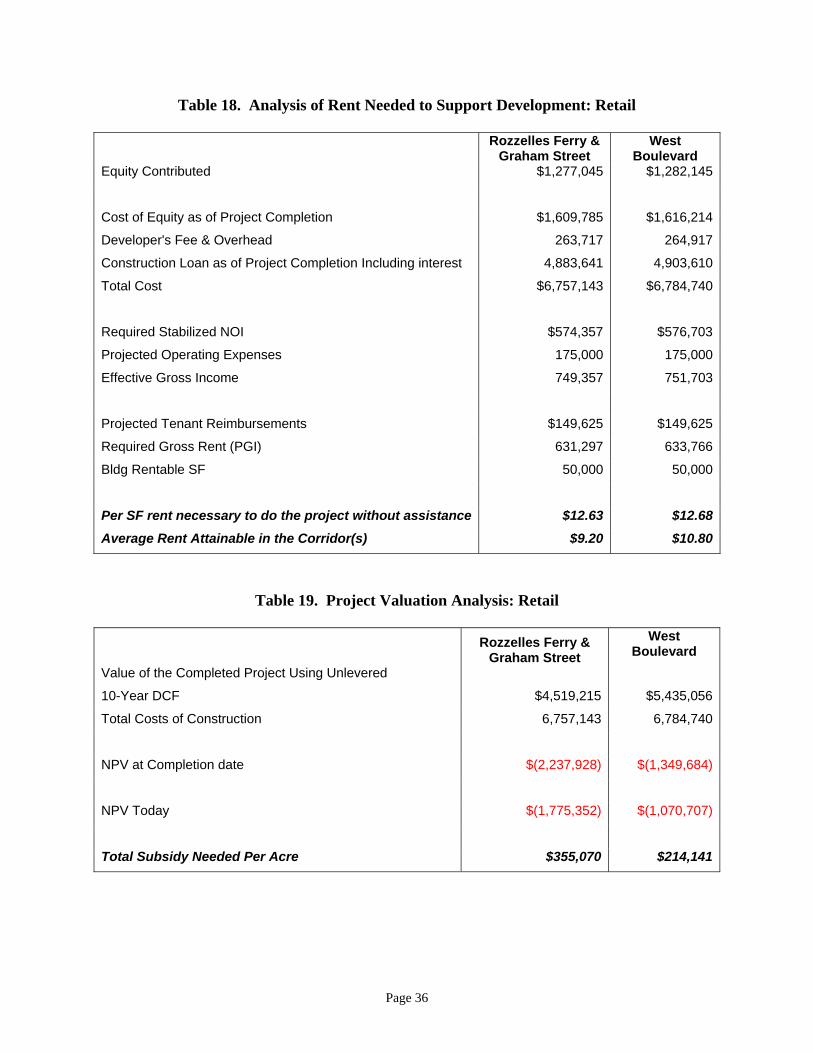
Table 18 represents the results of an analysis completed to estimate the rental rate needed to support retail development under current market conditions. A new retail project developed in the Rozzelles Ferry or Graham Street corridor would require a rental rate of $12.63 SF of NNN to provide investors with a market rate of return. However, the existing market rate is estimated to be $9.20 SF of NNN and a subsidy is required to encourage development. The project valuation analysis presented in Table 19 estimates a subsidy of approximately $355,070 per acre is required to stimulate development. The results are more promising for West Boulevard. The existing market lease rate is still below that necessary to stimulate development, but the required subsidy is only $214,141 per acre because of the strength of the market.
Page 36
Table 18. Analysis of Rent Needed to Support Development: Retail
Rozzelles Ferry & Graham Street
West Boulevard
Equity Contributed $1,277,045 $1,282,145
Cost of Equity as of Project Completion $1,609,785 $1,616,214
Developer's Fee & Overhead 263,717 264,917
Construction Loan as of Project Completion Including interest 4,883,641 4,903,610
Total Cost $6,757,143 $6,784,740
Required Stabilized NOI $574,357 $576,703
Projected Operating Expenses 175,000 175,000
Effective Gross Income 749,357 751,703
Projected Tenant Reimbursements $149,625 $149,625
Required Gross Rent (PGI) 631,297 633,766
Bldg Rentable SF 50,000 50,000
Per SF rent necessary to do the project without assistance $12.63 $12.68 Average Rent Attainable in the Corridor(s) $9.20 $10.80
Table 19. Project Valuation Analysis: Retail
Rozzelles Ferry & Graham Street
West Boulevard
Value of the Completed Project Using Unlevered
10-Year DCF $4,519,215 $5,435,056
Total Costs of Construction 6,757,143 6,784,740
NPV at Completion date $(2,237,928) $(1,349,684)
NPV Today $(1,775,352) $(1,070,707)
Total Subsidy Needed Per Acre $355,070 $214,141

Page 37
CONCLUSIONS The results of the financial analysis show a subsidy is required to stimulate flex office or retail development in the Graham Street, Rozzelles Ferry Road, and West Boulevard corridors at the present time. Retail development on West Boulevard requires the smallest subsidy, but such a project may not generate the greatest social benefit. Market fundamentals suggest retail development may occur more quickly in this area without a subsidy when compared to the other corridors included in the analysis. Flex office development in any of the three corridors requires the second smallest subsidy. This type of development may also be suboptimal because a flex office project may compete with existing industrial facilities. Retail on Graham Street or Rozzelles Ferry Road requires the largest subsidy. However, this type of project potentially provides the greatest benefit. Necessity retail would serve the low income population of these areas and avoid competition with existing facilities.