Embed Size (px)
Citation preview
Innis Lecture: Explorations in Medium Run
Macroeconomics
Paul Beaudry ∗
University of British Columbia
May 2005
∗The author would like to thank Jacob Wong for research assistance, and David Green for very helpful
discussions.
1
— Abstract —
Medium run macroeconomics refers to aggregate economic phenomena that manifests
itself over periods of 10 to 25 years. This area of research has emerged over the last
decade as a new and distinct field of inquiry. In this paper, I overview a set of personal
attempts aimed at understanding certain medium run phenomena such as: changes in
the wage structure, changes in the world distribution of income-per-capita and changes
in growth patterns across OECD countries. The goal of the paper is to extract general
lessons from these experiences. In particular, I will discuss why models of endogenous
technological choice may be a good starting point for studying medium run phenomena.
Key Words: Macroeconomics, Technological Change, Globalization.
JEL Class.: E00, O00
Paul BeaudryDepartment of EconomicsUniversity of British Columbia997-1873 East MallVancouver, B.C.Canada, V6T 1Z1
Introduction
Macroeconomics has traditionally focused on two main issues. On the one hand, it has
searched to understand fluctuations in economic activity that reoccur every 6 to 10 years.
This line of research is generally referred to as business cycles analysis. On the other
hand, macroeconomics has also been interested in long term growth, which involves the
analysis of economic patterns that arise over periods of several decades and sometimes
arise even over entire centuries. More recently, there has been substantial interest in
aggregate issues that do not easily fit into either of these two sub-areas. For example,
there is now a huge literature aimed at understanding changes in the income distribution
that arose in the 1980s and 1990s in North America. This type of phenomena should
naturally fall under the heading of macroeconomics since it is interested in an aggregate
outcome, but nonetheless it does not easily categorize itself as either a business cycle or
a growth phenomena. Another example is the change in the shape of the cross-country
distribution of income-per-capita that has been documented by Jones (1997) and Quah
(1993). While understanding overall differences in income across countries is central to
growth theory, changes in the shape of this distribution that arise over a few decades may
reflect an entirely different process and thereby may require different tools for analysis.
Blanchard (1997) has suggested naming macroeconomic changes that unfold over periods
of 15 to 30 years as medium run phenomena.
In this paper, I will selectively overview aspects of my research on medium run phenomena
with the aim of highlighting the general lessons that I take away from these explorations.
I see medium run macroeconomics as an emerging area of research with an associated set
of methodological questions which I believe are ripe for discussion. For example, what
type of models should be used for medium run macro analysis? Should one build upon
models close to those used in business cycle analysis or preferably import elements from
endogenous growth theory? Are market imperfections a key component for understanding
medium run phenomena, or do they simply complicate matters? How best should one
evaluate theories of medium run phenomena: calibration, estimation, case studies? While
I will not be able to answer any of these questions fully, I will use my forays in this area
to propose elements that may help constitute stepping stones for future work.
1
The three medium run phenomena that have attracted my attention are: the observed
changes in the returns to education, the differential growth patterns observed among
OECD countries since the mid-seventies, and the recent changes in the cross-country
distribution of income-per-capita. At the outset, let me stress that David Green of UBC
and Fabrice Collard of Toulouse have been my close collaborators on these inquires, and
accordingly my thoughts on these issues have been shaped by their ideas and reasonings.
Moreover, as will become clear, my explorations into medium run questions has involved
a constant interaction between empirical observation and theory. In particular, in several
circumstances, challenging empirical observations have led me to reassess and modify
theoretical explanations, which in turn have motivated further empirical work. This
interplay between theory and empirical work will be evident throughout my discussion
and will be used to motivate how I arrived at certain positions or inferences.
I will begin this lecture by discussing my research related to changes in the returns to
education. This area of inquiry is used to introduce models of endogenous technological
choice and to argue that such models offer a useful and tractable framework for analyzing
medium run phenomena. I will also discuss how such models can be empirically evaluated
and how demographic differences across countries may offer data variation that allows
identification and testing of such models. As a second example of medium run phenomena,
I will look at changes in the determinants of labour productivity over the period 1980 to
2000 relative to the period of the 1960s and 1970s. I will use the observations derived from
this comparison to argue that labour market imperfections may be key to understanding
medium run phenomena. In particular, I will emphasize how the models of endogenous
technological choice can be extended to allow for wage differentials between workers using
different technologies, and argue that such an extension greatly enhances the range of
phenomena that can be explained by this framework. Finally, I will discuss the similarity
between models of endogenous technological adoption and models of trade liberalization,
and I will highlight the difficulties I have faced in trying to differentiate the two. Since,
in my own work, I have not been able to convince myself of the relative importance of
trade versus technology in explaining key economic developments observed over the last
20 to 30 years, I present this important question as an ongoing challenge for future work.
2
1 Changes in the Returns to Education
It is widely known that in the 1980s the returns to education in the US increased sub-
stantially. 1 This observation has attracted enormous interest and induced researchers to
examine whether similar changes took place in other countries and whether such patterns
continued into the 1990s and past 2000. For Canada, most researchers have found that
the returns to education stayed relatively constant in the 1980s and started to increase
since 1995. One exception is my work with David Green (Beaudry and Green (2000))
which argues that it is most appropriate to look at young workers and that, by doing so,
one observes an increase in the returns to education in Canada that is quite similar to
the US observations. Since there is disagreement on this point, I will not focus here on
the Canadian experience and instead I will concentrate on the US experience and com-
pare it with developments in Europe, especially Germany. There are two observations I
want to single out. First, in the case of the US, the returns to education continued to
increase in the 1990s but at a much slower rate than was the case in the 1980s. Second,
in most of continental Europe, the returns to education are less than in the US and did
not change very substantially over the 1980s or 1990s. Ideally, one would like an explana-
tion that would both shed light on the US time series observations and the cross country
observations.
The most commonly accepted explanation for the observed increase in the returns to
education is the one proposed by Katz and Murphy (1992). According to this explanation,
the US economy has been subject to exogenous but stable skill bias technological change
(i.e. technological change that favors higher educated workers) for a long period of time,
and that the different outcomes observed across time mainly reflect changes in supply
patterns. I find this explanation very unsatisfactory. First, in the case of the US time series
experience, this type of explanation – which emphasizes the negative effect of increased
educational attainment on the returns to education – has failed in prediction twice. In
the mid seventies, such a view was used to predict that the returns to education would
fall in the late 70s and in the eighties as the more educated baby boom cohort entered
in mass into the labour market. As we know, the opposite happened, the returns to
education increased substantially just as large cohorts of educated workers entered the
3
work force. Then in the early 1990s, it was predicted that the increase in the returns
to education observed in the 1980s would accelerate in the 1990 due to the slowdown in
increased educational attainment of the workforce (due again largely to demographics).
Once again, the prediction was wrong: as the outcome was a deceleration in the returns to
education as opposed to the predicted acceleration. Second, if supply puts such downward
pressure on the returns to education, it is difficult to explain why the return to education
are lower in most of continental Europe and has not increased much over the last 25 years.
At first pass, it may appear that such patterns are very difficult to explain, and that an
explanation may require a important departure from neo-classical economics since the
aforementioned increases in returns to education have arisen precisely when and where
supply of educated workers is strong. It is at this point that I would like to introduce
models of endogenous technological adoption. In particular, I want to emphasize that al-
though such models have a neo-classical structure (i.e., convex technological opportunities,
absence of externalities and consistent with perfect competition), they are nevertheless
consistent with observing increases in the return to a factor precisely when the supply of
this factor is high. In my view, such a feature makes this framework potentially attractive
for analyzing puzzling medium run outcomes.
A model of endogenous technological choice takes as a starting point an environment
where there can be more than one way of producing a good, that is, an environment where
individuals need to choose between different techniques of production when deciding how
to produce. Medium run analysis in such a framework revolves around the effects of adding
a new technology to the pre-existing set. Note that in an endogenous technological choice
model, the arrival of a new technology is taken as exogenous, which distinguishes it from
endogenous growth theory (where the development of new technologies are endogenous).
Moreover, the new technology is not assumed to be unambiguously better that the older
technologies in the sense that iso-quants are allowed to cross, and for this reason the
speed and extent of adoption of a new technology becomes endogenous, as it responds
to comparative advantage principles. When considering medium run phenomena across
different units of analysis, such as countries or cites, it can be generally assumed that the
arrival of the new technological possibility is common across units. In such a case, it is
the interaction between unit specific factors and the arrival of the new technology which
4
generates different outcomes.
To introduce a model of endogenous technological adoption, let us consider an environment
with only one produced good denoted by Y , and assume that initially there is only one
technology to produce the good. Let us denote this pre-existing (old) technology by
the function FO(X,L), where L is the amount of labour used in production of Y and
X is the amount of another factor. This additional factor could for example be either
physical capital, human capital or natural resources. The function F (·) is assumed to
be homogenous of degree one and concave. In this case, the return to the factor X is a
decreasing function of the ratio XL. Now consider introducing a new technology into this
environment, where this new technology is denoted by FN(X,L) and is also homogenous
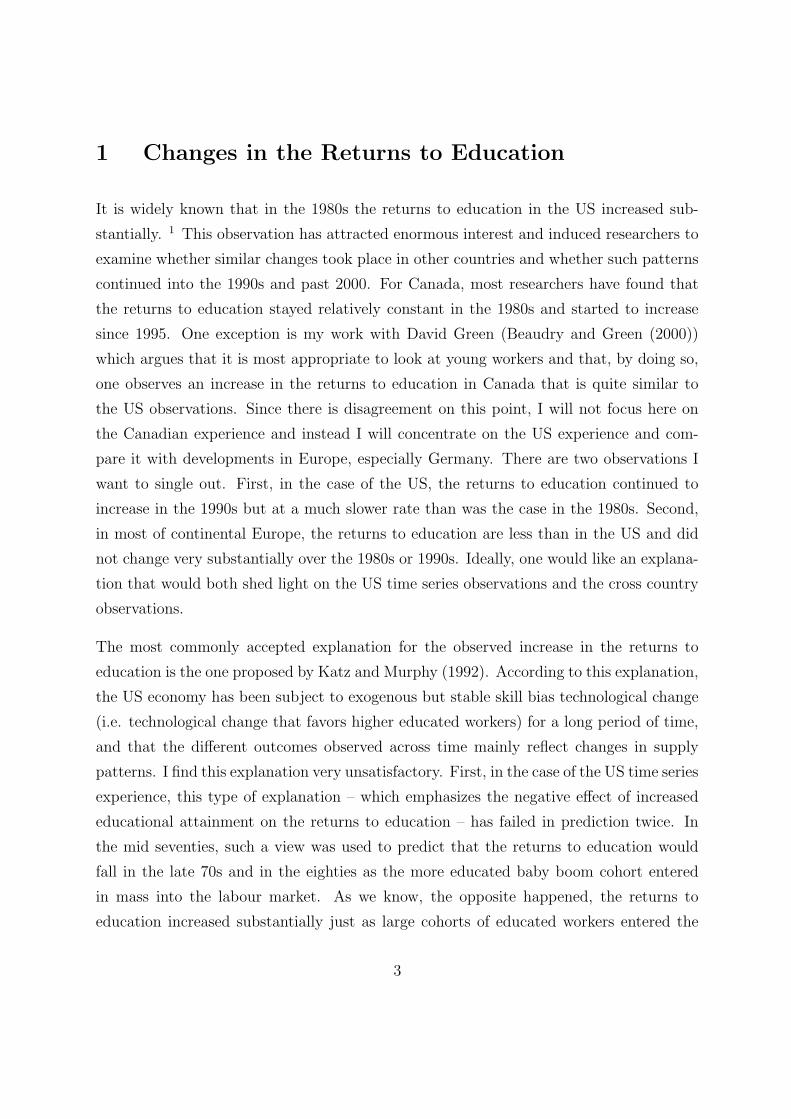
of degree one and concave. Suppose this new technology is biased in favor of factor
X, in the sense that the production functions (or unit cost curve) cross, with the new
technology being preferable when the XLis abundant. This configuration is illustrated
in Figure 1. In this case, the efficient market outcome would be to :(1) not adopt the
new technology if X/L is sufficiently low, (2) use both the new and old technology, as
to render the aggregate technology set convex, if XLis in an intermediate range, and (3)
abandon the old technology and fully adopt the new technology if XLis sufficiently high. If
an outside observer witnesses the outcome of such a process across different countries (or
some other unit of analysis) he would note the following interesting pattern: the return
to factor X (which is given by the slope of the production function in Figure 1) increased
most in countries where factor X is most abundant! At first pass, this pattern may sound
counter-intuitive; however, as shown by this simple example, it is a pattern that is easy
to understand with an endogenous technological adoption model.
With this example at hand, let us now return to the issue of changes in the return to
education. In particular, I want to ask whether the previous model can explain the
different patterns observed in the US versus West Germany during the 1980s, whereby
the US experienced a large increase in the returns to education while no such increase
was apparent in West Germany? If the US labour force were substantially more educated
that the West German labour force, the above model could help explain the difference by
arguing that as a skill (education) biased technology became available during this period,
it was adopted only by the more educated country, leading to an increase in the return
5
6Y/L
-X/L
OLD
NEW
��
��
��
��
��
��
��
s
s
Figure 1: Arrival of X biased Technology
6
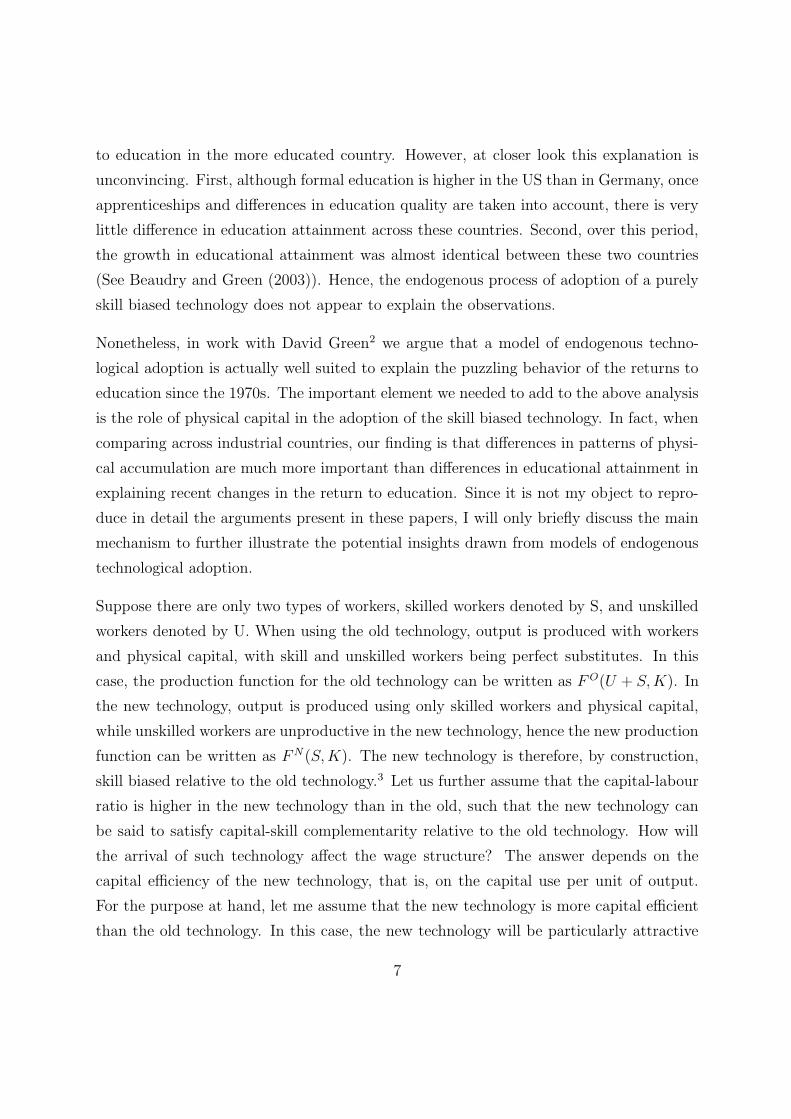
to education in the more educated country. However, at closer look this explanation is
unconvincing. First, although formal education is higher in the US than in Germany, once
apprenticeships and differences in education quality are taken into account, there is very
little difference in education attainment across these countries. Second, over this period,
the growth in educational attainment was almost identical between these two countries
(See Beaudry and Green (2003)). Hence, the endogenous process of adoption of a purely
skill biased technology does not appear to explain the observations.
Nonetheless, in work with David Green2 we argue that a model of endogenous techno-
logical adoption is actually well suited to explain the puzzling behavior of the returns to
education since the 1970s. The important element we needed to add to the above analysis
is the role of physical capital in the adoption of the skill biased technology. In fact, when
comparing across industrial countries, our finding is that differences in patterns of physi-
cal accumulation are much more important than differences in educational attainment in
explaining recent changes in the return to education. Since it is not my object to repro-
duce in detail the arguments present in these papers, I will only briefly discuss the main
mechanism to further illustrate the potential insights drawn from models of endogenous
technological adoption.
Suppose there are only two types of workers, skilled workers denoted by S, and unskilled
workers denoted by U. When using the old technology, output is produced with workers
and physical capital, with skill and unskilled workers being perfect substitutes. In this
case, the production function for the old technology can be written as F O(U + S,K). In
the new technology, output is produced using only skilled workers and physical capital,
while unskilled workers are unproductive in the new technology, hence the new production
function can be written as FN(S,K). The new technology is therefore, by construction,
skill biased relative to the old technology.3 Let us further assume that the capital-labour
ratio is higher in the new technology than in the old, such that the new technology can
be said to satisfy capital-skill complementarity relative to the old technology. How will
the arrival of such technology affect the wage structure? The answer depends on the
capital efficiency of the new technology, that is, on the capital use per unit of output.
For the purpose at hand, let me assume that the new technology is more capital efficient
than the old technology. In this case, the new technology will be particularly attractive
7
to a country with either substantial skill or a low capital-labour ratio, that is, a country
with a high ratio of human to physical capital will have a comparative advantage in the
adoption of the new technology . Now let us consider a situation with two initially similar
countries, where both countries adopt the new technology but still maintain use of the old
technology since it offers employment possibilities for unskilled workers. Suppose the two
countries then experience different accumulation paths, with one country experiencing a
large influx of skilled workers and a limited increase in physical capital, while the other
country experiences a smaller influx of skilled workers but a greater increase in physical
capital per worker. The result in this case is that the first country adopts the new skill
biased technology aggressively and experiences a large increase in the returns to skill. In
contrast, the second country adopts the new technology less aggressively and accordingly
experience little or no increase in the returns to skill. Coming back to the US versus West
German experience, such a model nicely captures the main observed data patterns as West
Germany experienced a much greater increase in its capital-labour ratio over the 1980s
than the US, and experienced much less increase in wage inequality. In fact, this type
of model explains endogenously why the degree of skill-biased technological change could
be lower in West Germany than in the US over such a period even though both countries
likely had access to the same sets of technologies. Furthermore, this type of model can
potentially explain why the returns to education increased less in the 1990s in the US in
comparison to the 1980s. Since in the 1990s the capital-labour ratio in the US increased
faster than in the 1980s, there was less pressure to adopt the skill-biased capital-efficient
technology and therefore there was endogenously less skill biased technological change
during this later period.4
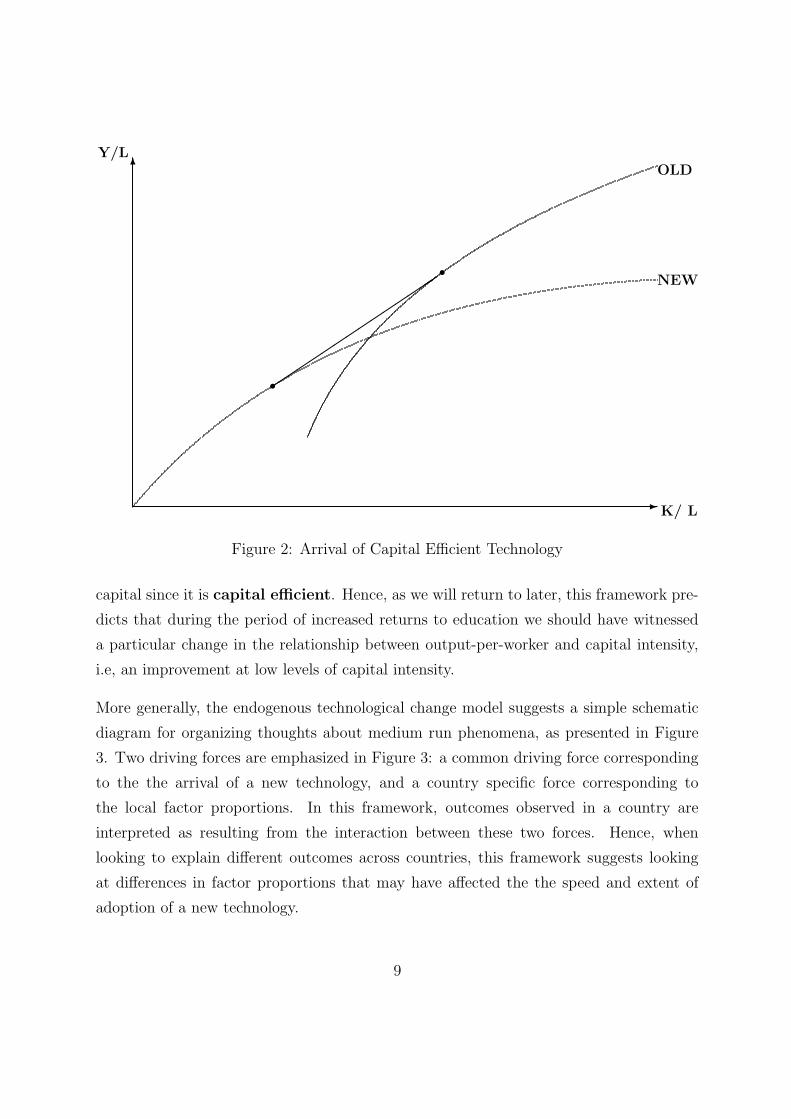
The purpose of the above example is to illustrate both how models of endogenous techno-
logical adoption can explain different outcomes across countries, and to highlight the po-
tential role of physical capital accumulation in understanding recent medium run patterns
across countries and across time. In particular, when the US-West Germany experience
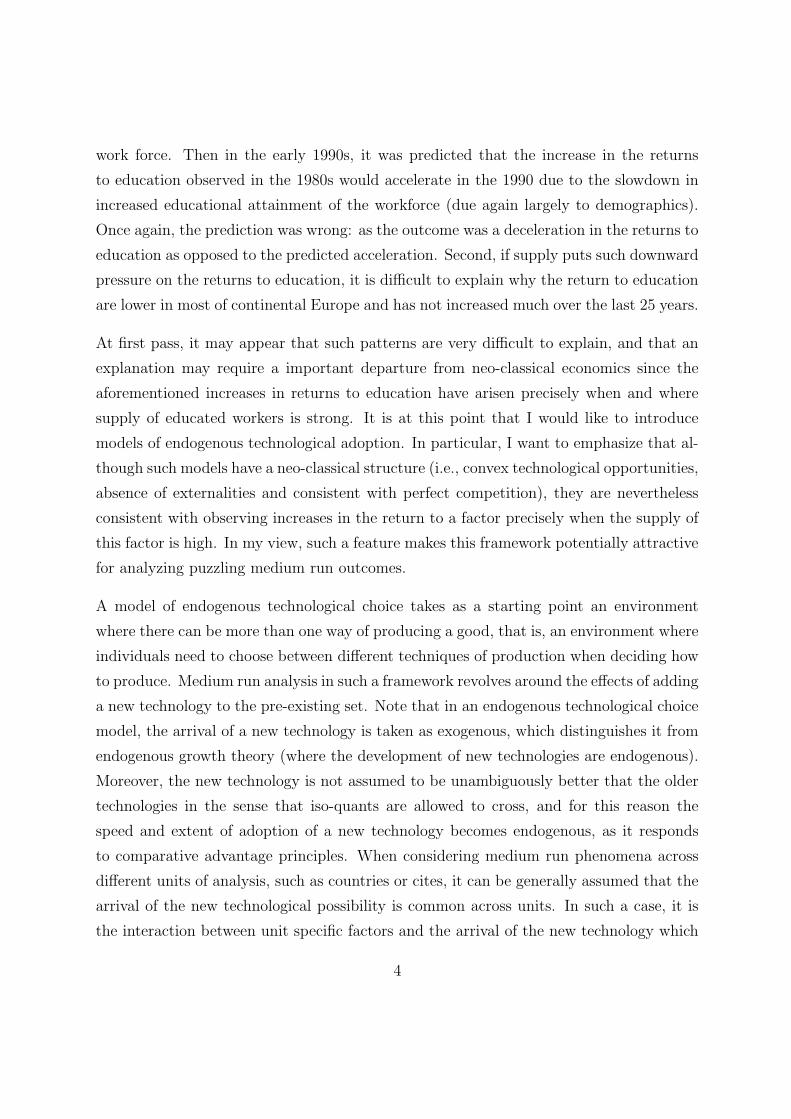
is interpreted in the context of an endogenous technological adoption model, it suggests
that the relevant depiction of the change in the production possibility set induced by the
arrival of the new skill biased technology can be represented as in Figure 2. Note that in
Figure 2, the new technology moves out the production possibility at low levels of physical
8
6Y/L
-K/ L
NEW
OLD
��
��
��
��
��
��
��
s
s
Figure 2: Arrival of Capital Efficient Technology
capital since it is capital efficient. Hence, as we will return to later, this framework pre-
dicts that during the period of increased returns to education we should have witnessed
a particular change in the relationship between output-per-worker and capital intensity,
i.e, an improvement at low levels of capital intensity.
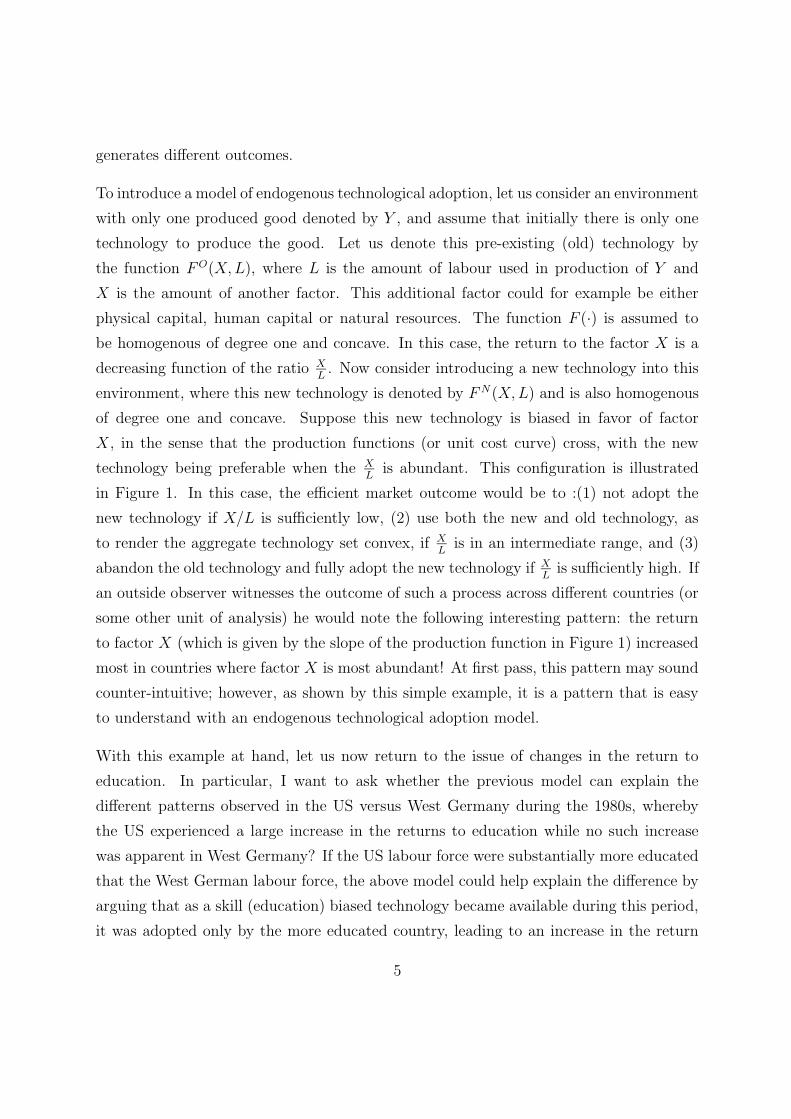
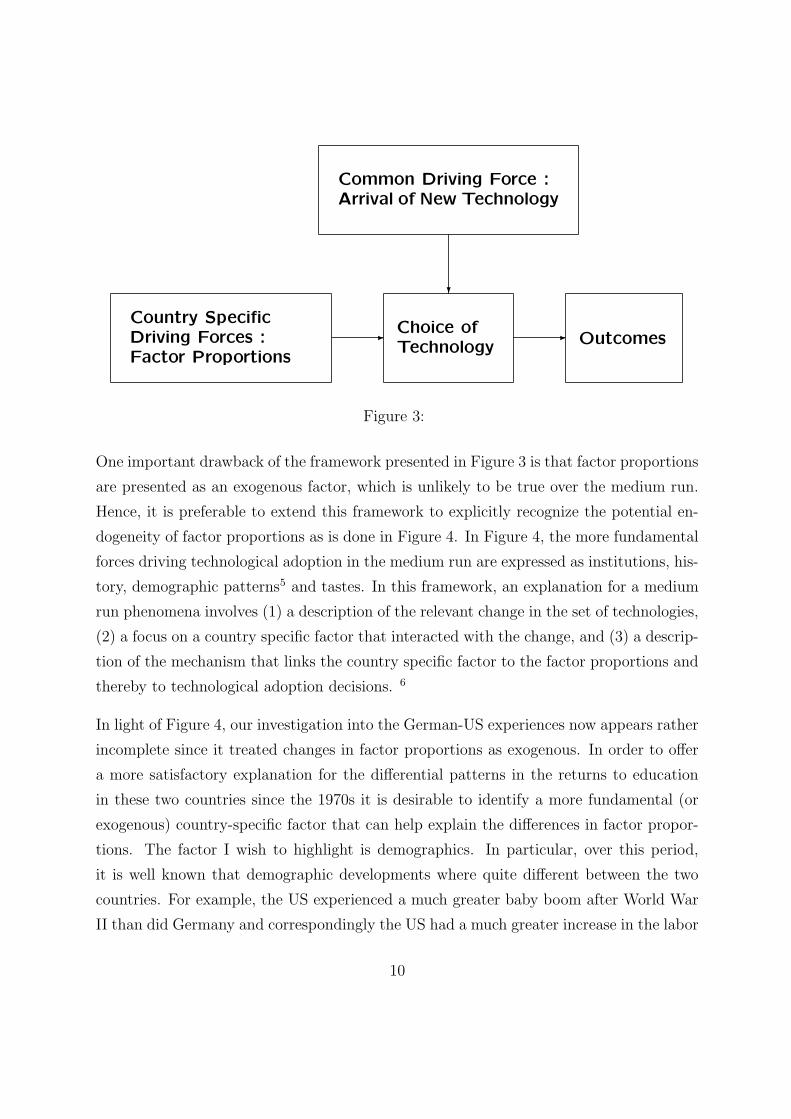
More generally, the endogenous technological change model suggests a simple schematic
diagram for organizing thoughts about medium run phenomena, as presented in Figure
3. Two driving forces are emphasized in Figure 3: a common driving force corresponding
to the the arrival of a new technology, and a country specific force corresponding to
the local factor proportions. In this framework, outcomes observed in a country are
interpreted as resulting from the interaction between these two forces. Hence, when
looking to explain different outcomes across countries, this framework suggests looking
at differences in factor proportions that may have affected the the speed and extent of
adoption of a new technology.
9
Country Specific
Driving Forces :
Factor Proportions
-Choice of
Technology- Outcomes
?
Common Driving Force :
Arrival of New Technology
Figure 3:
One important drawback of the framework presented in Figure 3 is that factor proportions
are presented as an exogenous factor, which is unlikely to be true over the medium run.
Hence, it is preferable to extend this framework to explicitly recognize the potential en-
dogeneity of factor proportions as is done in Figure 4. In Figure 4, the more fundamental
forces driving technological adoption in the medium run are expressed as institutions, his-
tory, demographic patterns5 and tastes. In this framework, an explanation for a medium
run phenomena involves (1) a description of the relevant change in the set of technologies,
(2) a focus on a country specific factor that interacted with the change, and (3) a descrip-
tion of the mechanism that links the country specific factor to the factor proportions and
thereby to technological adoption decisions. 6
In light of Figure 4, our investigation into the German-US experiences now appears rather
incomplete since it treated changes in factor proportions as exogenous. In order to offer
a more satisfactory explanation for the differential patterns in the returns to education
in these two countries since the 1970s it is desirable to identify a more fundamental (or
exogenous) country-specific factor that can help explain the differences in factor propor-
tions. The factor I wish to highlight is demographics. In particular, over this period,
it is well known that demographic developments where quite different between the two
countries. For example, the US experienced a much greater baby boom after World War
II than did Germany and correspondingly the US had a much greater increase in the labor
10
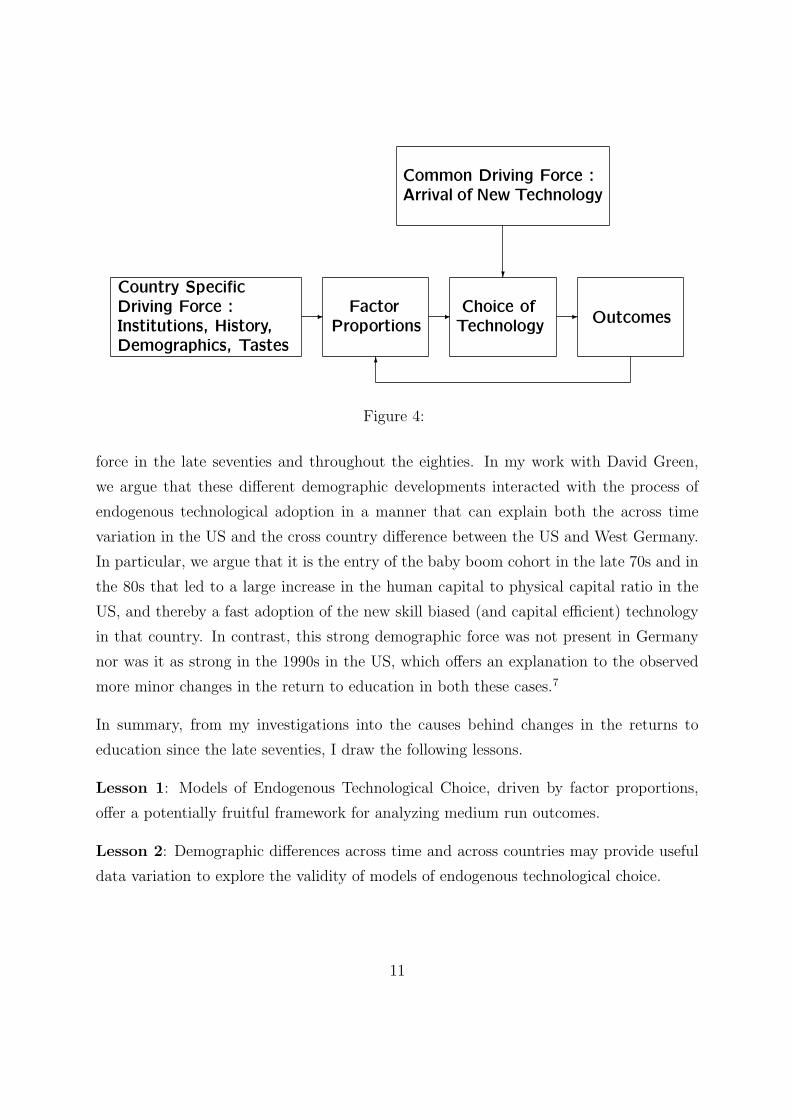
Country Specific
Driving Force :
Institutions, History,
Demographics, Tastes
- Factor
Proportions- Choice of
Technology- Outcomes
6
?
Common Driving Force :
Arrival of New Technology
Figure 4:
force in the late seventies and throughout the eighties. In my work with David Green,
we argue that these different demographic developments interacted with the process of
endogenous technological adoption in a manner that can explain both the across time
variation in the US and the cross country difference between the US and West Germany.
In particular, we argue that it is the entry of the baby boom cohort in the late 70s and in
the 80s that led to a large increase in the human capital to physical capital ratio in the
US, and thereby a fast adoption of the new skill biased (and capital efficient) technology
in that country. In contrast, this strong demographic force was not present in Germany
nor was it as strong in the 1990s in the US, which offers an explanation to the observed
more minor changes in the return to education in both these cases.7
In summary, from my investigations into the causes behind changes in the returns to
education since the late seventies, I draw the following lessons.
Lesson 1: Models of Endogenous Technological Choice, driven by factor proportions,
offer a potentially fruitful framework for analyzing medium run outcomes.
Lesson 2: Demographic differences across time and across countries may provide useful
data variation to explore the validity of models of endogenous technological choice.
11
2 Patterns of Labour Productivity Growth
The patterns of labour productivity growth over the last 30 years have been quite variable
and puzzling. For example, in the case of the US and Canada, there was a substantial
slow down in labour productivity growth that started in the seventies and lasted until the
nineties. After 1995, there was a substantial pick-up, especially in the US. In contrast,
during the 1980s, labour productivity growth was much higher in most of continental
Europe than in North America. However, since 1995, there has not been a major pick up
in productivity growth in Europe. As for the case of changes in the returns to education,
these observations are a medium run phenomena and therefore may warrant a similar
explanation. Accordingly, it seems natural to ask whether the type of model of endoge-
nous technological choice presented above may be useful for explaining the differential
behaviour of labour productivity across countries over the last 30 years. As previously
indicated, my research on the returns to education suggested that the observed changes
may have reflected the introduction of a capital efficient technology that was aggressively
adopted by countries facing a relative shortage in physical capital (due mainly to demo-
graphic developments). If this were the case, it suggests that over this period, we should
have witnessed particular changes in the relationship between labour productivity growth
and capital intensity. In this section, I will begin by using the endogenous technological
adoption framework to derive predictions regarding how the introduction of a capital effi-
cient technology affects the relationship between capital intensity and labour productivity.
I will then compare these predictions with those found in the data. Since the predictions
will match-up with the data only partially, I discuss modifications that could explain the
discrepancies. This will lead me to my third “Lesso”. In this discussion, I will abstract
from the skill biased aspect of the new technology and focus exclusively on the capital
efficiency aspect since it allows a simpler exposition.
Consider a case where the original (old) technology is given by the following :
Yi = Kαi (θiLi)
1−α
where K is capital, L is labour and θ is the efficiency of a unit of labour. The index i
12
represents different countries. Note that I will consider the case where θ, the measure of
labour efficiency, may differ across countries by a fixed amount, but will grow at a similar
rate. Now consider the introduction at time t of a new technology given by
Yi = Kβi (θiLi)
1−β, β < α
The important aspect of the new technology is that is is more capital efficient in the sense
that β < α. Hence, the introduction of this new technology corresponds to a change in the
production possibility set similar to that depicted in Figure 2. Furthermore, assume that
θi grows at the common rate g, and that labour grows at the country specific rate rate
ηi. In this case, how does the relationship betweenYLand capital intensity change due to
the introduction of the new technology? Before answering this question, it is necessary
to discuss how to choose an appropriate measure for capital intensity. One possibility
would be to use capital-per-effective worker, KθL, as a measure of capital intensity. The
empirical drawback with this measure is that it requires estimating θi to get a measure
of capital intensity. A good alternative, if one is looking over long periods, is to focus
on the determinants of the steady state capital-output ratio.8 If capital is accumulated
according to the relationship Kt+1 = (1 − δ)Kt + It, where δ is the rate of depreciation
and It is the level of investment, then the steady state capital output ratio (denoted ν) is
given by:
IY i
g + ηi + δ= νi
Note that it is common, even standard in growth theory, to do as we do here and use the
capital-output ratio (ν) as the measure of a country’s capital intensity. We can now focus
on how the arrival of the new technology affects the relationship between (log) labour
productivity, YL i, νi and θi.
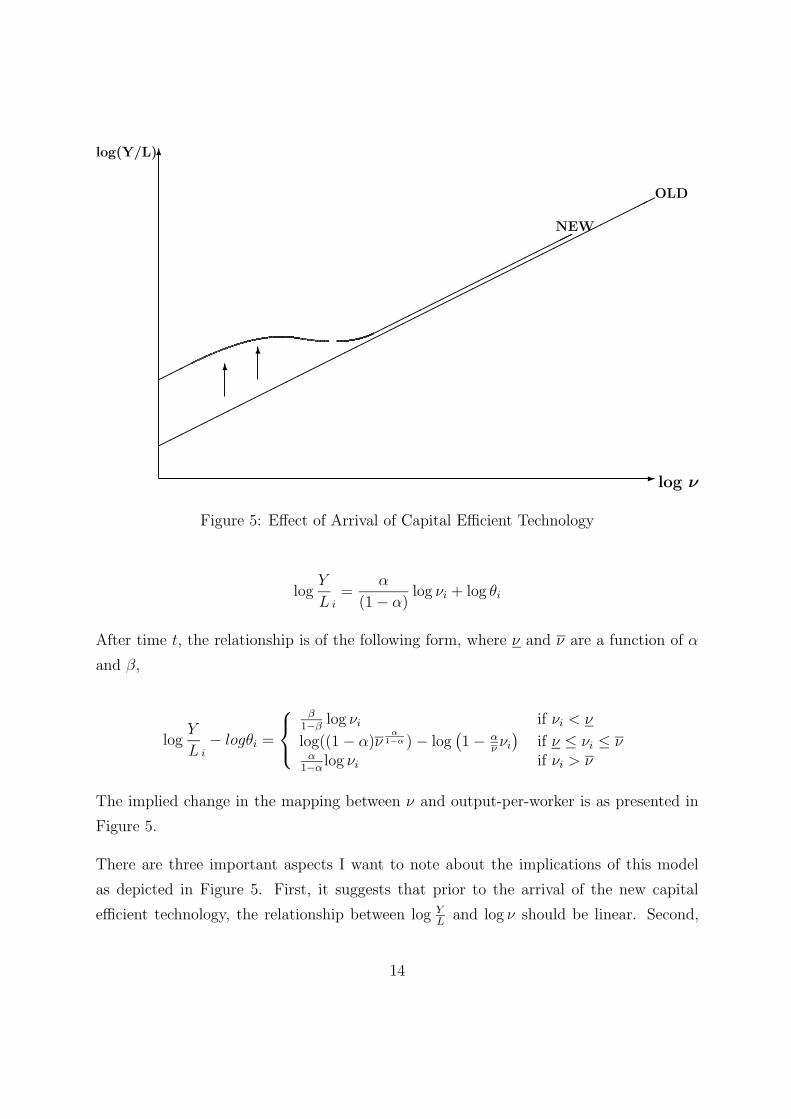
Prior to time t, it is easy to verify that the steady state relationship between log( YL) and
log ν is given by
13
6log(Y/L)
- log ν
�������������������������������������������OLD
���
������������������NEW
66
Figure 5: Effect of Arrival of Capital Efficient Technology
logY
L i=
α
(1− α)log νi + log θi
After time t, the relationship is of the following form, where ν and ν are a function of α
and β,
logY
L i− logθi =
β
1−βlog νi if νi < ν
log((1− α)να
1−α )− log(
1− αννi)
if ν ≤ νi ≤ να
1−αlog νi if νi > ν
The implied change in the mapping between ν and output-per-worker is as presented in
Figure 5.
There are three important aspects I want to note about the implications of this model
as depicted in Figure 5. First, it suggests that prior to the arrival of the new capital
efficient technology, the relationship between log YLand log ν should be linear. Second,
14
the introduction of the new technology is predicted to change the shape of the relationship
between YLand ν. Thirdly, assuming that the new technology is capital efficient, the model
implies that it is only the countries with low capital intensities, as measured by ν, that
experience a gain due to the introduction of the new technology. The countries with very
high values of ν are not predicted to see a gain since they do not find it attractive to
adopt such a technology. Hence, this simple model predicts that over the same period as
when we witnessed an increase in the returns to educations (i.e., since the late seventies),
we should have witnessed a change in the relationship between labour productivity and
capital intensity, with a shifting up of the relation at low values of ν.
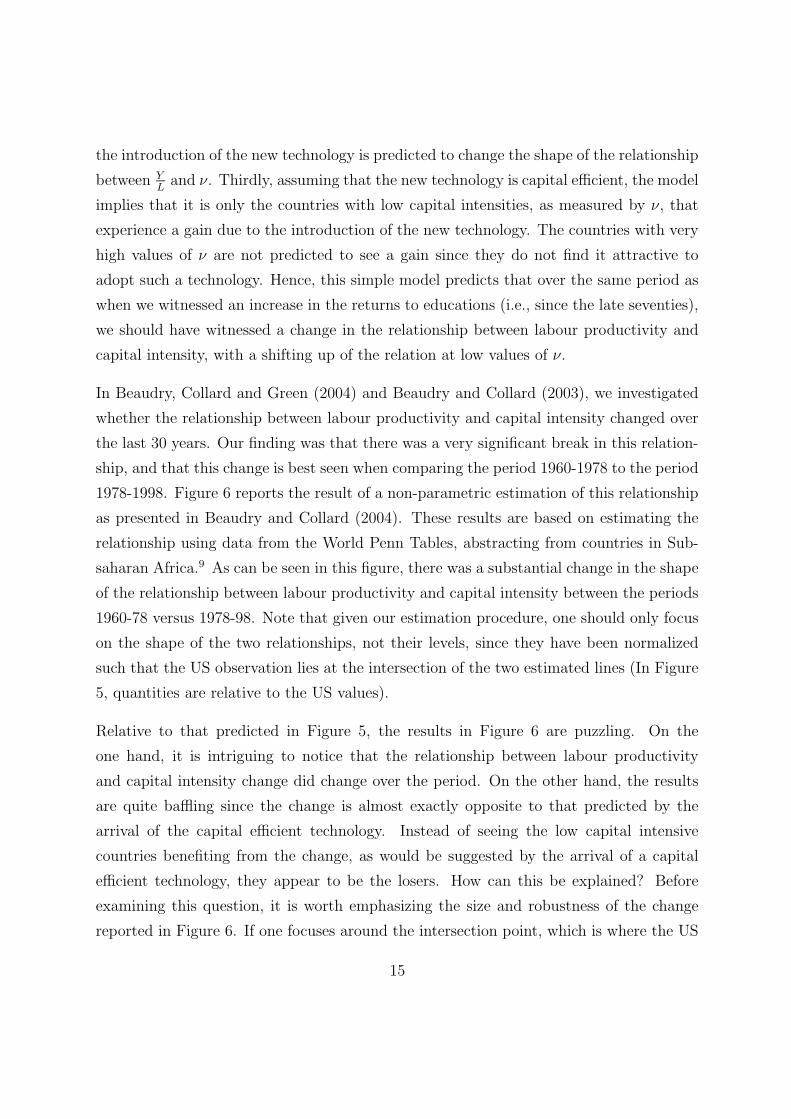
In Beaudry, Collard and Green (2004) and Beaudry and Collard (2003), we investigated
whether the relationship between labour productivity and capital intensity changed over
the last 30 years. Our finding was that there was a very significant break in this relation-
ship, and that this change is best seen when comparing the period 1960-1978 to the period
1978-1998. Figure 6 reports the result of a non-parametric estimation of this relationship
as presented in Beaudry and Collard (2004). These results are based on estimating the
relationship using data from the World Penn Tables, abstracting from countries in Sub-
saharan Africa.9 As can be seen in this figure, there was a substantial change in the shape
of the relationship between labour productivity and capital intensity between the periods
1960-78 versus 1978-98. Note that given our estimation procedure, one should only focus
on the shape of the two relationships, not their levels, since they have been normalized
such that the US observation lies at the intersection of the two estimated lines (In Figure
5, quantities are relative to the US values).
Relative to that predicted in Figure 5, the results in Figure 6 are puzzling. On the
one hand, it is intriguing to notice that the relationship between labour productivity
and capital intensity change did change over the period. On the other hand, the results
are quite baffling since the change is almost exactly opposite to that predicted by the
arrival of the capital efficient technology. Instead of seeing the low capital intensive
countries benefiting from the change, as would be suggested by the arrival of a capital
efficient technology, they appear to be the losers. How can this be explained? Before
examining this question, it is worth emphasizing the size and robustness of the change
reported in Figure 6. If one focuses around the intersection point, which is where the US
15
−1 −0.5 0 0.5 1−2
−1.5
−1
−0.5
0
0.5
1
1.5
ν
1960−781978−98
Figure 6: Non–Parametric Estimate of relation between YLand ν relative to the US
and many OECD countries lie, we see that the slope of the relationship between labour
productivity and capital intensity increased substantially. In fact, the estimates of this
slope change indicate that it at least doubled over this period and may have even tripled.
In is important to note that such a observation is found to be very robust (see Beaudry
et al. (2004) and Beaudry and Collard (2004)) to the inclusion of additional variables and
to different estimation strategies.
2.1 In search of an explanation
In light of Figure 6, it is obvious that the patterns of labour productivity do not conform
to the predictions of a simple endogenous technological adoption model where the arrival
of the new technology is capital efficient relative to the old technology. However, the fact
that there is a change in the relationship between labour productivity and capital intensity,
and that the change involves a bending of the relationship, leads one to ask whether a
modified technological adoption story could explain the observations in Figure 6 while
simultaneously being consistent with the insight drawn from from observing changes in
the returns to education.
16
6log(Y/L)
- log ν
�������������������������������������������OLD
������������
��������� NEW
6
6
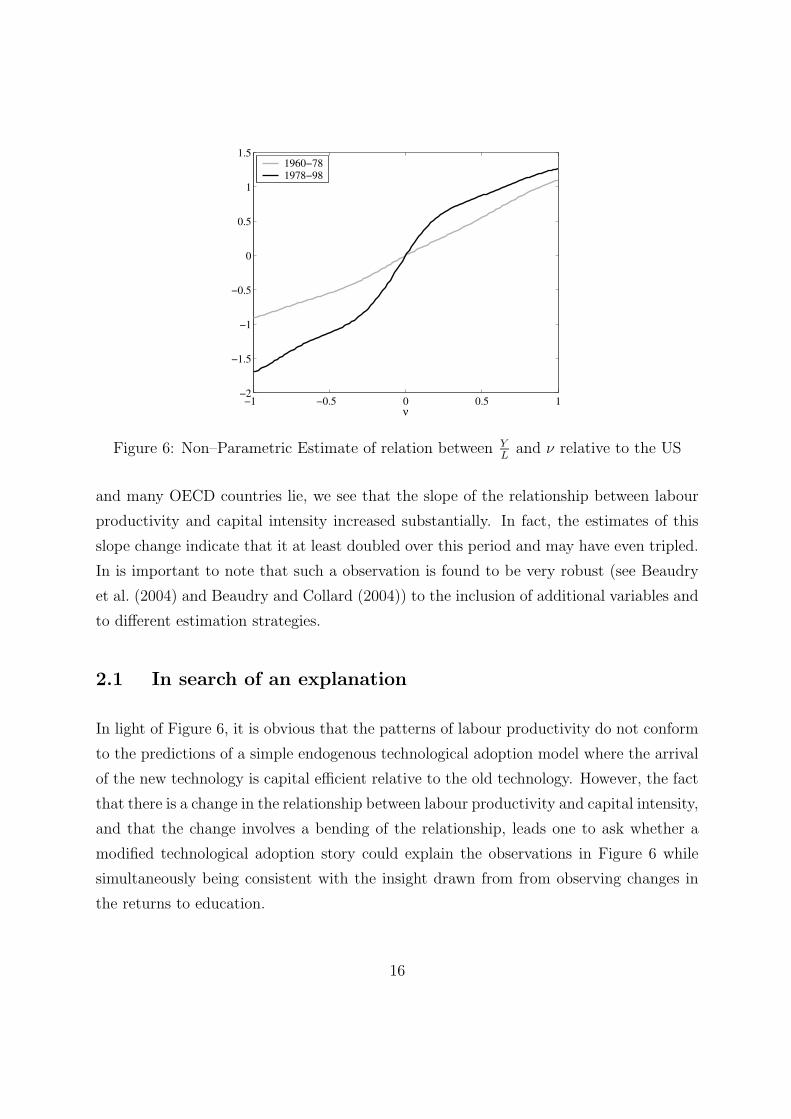
Figure 7: The arrival of a capital using technology
The simplest explanation for Figure 6 is that it reflects the arrival of a capital intensive
technology as opposed to a capital efficient technology as previous assumed. As can be
easily verified, the arrival of a capital intensive technology (in the sense of β > α) would
result in a change in the relationship between labour productivity and capital intensity as
presented in Figure 7. As seen in Figure 7, such a new technology would be adopted most
aggressively by the capital intensive countries and therefore it is those countries that would
benefit most. This idea was pursued in Beaudry and Collard (2003). However, there are
some very unappealing features of this explanation. In particular, it is very difficult to
reconcile with the cross country observations on changes in the returns to education, and
it suggests that countries in continental Europe have been adopting the new technology
faster than the US, which defies anecdotal evidence.
As second possible explanation is that there are substantial adjustment costs associated
with the adoption of the new technology. This possibility has been suggested in many
papers (example: Aghion and Howitt (1998), Greenwood and Yorukoglu (1997)and Help-
17
man and Trajtenberg (1998)). In such a case, countries that adopt the new technology
could do worse during the adjustment phase than countries that do not adopt the tech-
nology. If the new technology is capital efficient, and the 1980s and 1990s are a period
of adjustment, then such a story could explain the observations presented in Figure 6.
However, as discussed in Beaudry, Collard and Green (2005), this interpretation requires
an adjustment period of over twenty years which implies that the actors choosing such
a technology must be extremely patient and farsighted. While this is a possibility, it
appears very unlikely to me.
A third possibility is that the new technology is capital efficient, that it is individually at-
tractive for a firm to adopt this new technology if capital is relatively scarce in the country,
but that for some reason the massive adoption of such a technology was socially inefficient
and therefore reduced aggregate labour productivity in the adopting country. This ex-
planation may appear more implausible than the previous two. However, I want to argue
that it is not. In particular, I want to argue that the adoption of an inferior technology
can arise quite naturally in a decentralized environment (with profit maximizing agents)
if there are frictions in the labour market. The type of friction I have in mind is that
suggested by the efficiency wage literature whereby workers are not necessarily paid their
reservation value. Instead, workers in some circumstances may need to be paid more than
their reservation wage in order to provide incentives for effort. The only addition I want
to introduce here is that the incentive problems may be tied to particular technologies
and therefore a new technology may be attractive because it involves less of an incentive
problem than an old technology, even though it is not more productive. To illustrate this
idea most clearly, let me first abstract from capital and consider a case where both the
old and new technologies exhibit constant returns to labour. The difference between the
two technologies is that the first technology requires that workers be paid an efficiency
wage, that is, workers must be paid x% above their reservation wage to provide effort. In
contrast, the new technology does not require an efficiency wage payment (workers can be
paid their reservation wage), but the marginal product of labour in the new technology is
z% less in the new versus the old technology. Now suppose that x > z, that is, the wage
reduction available with the new technology is greater than the productivity loss. In this
case, is it profitable for a firm to switch to the new technology? What is the aggregate
18
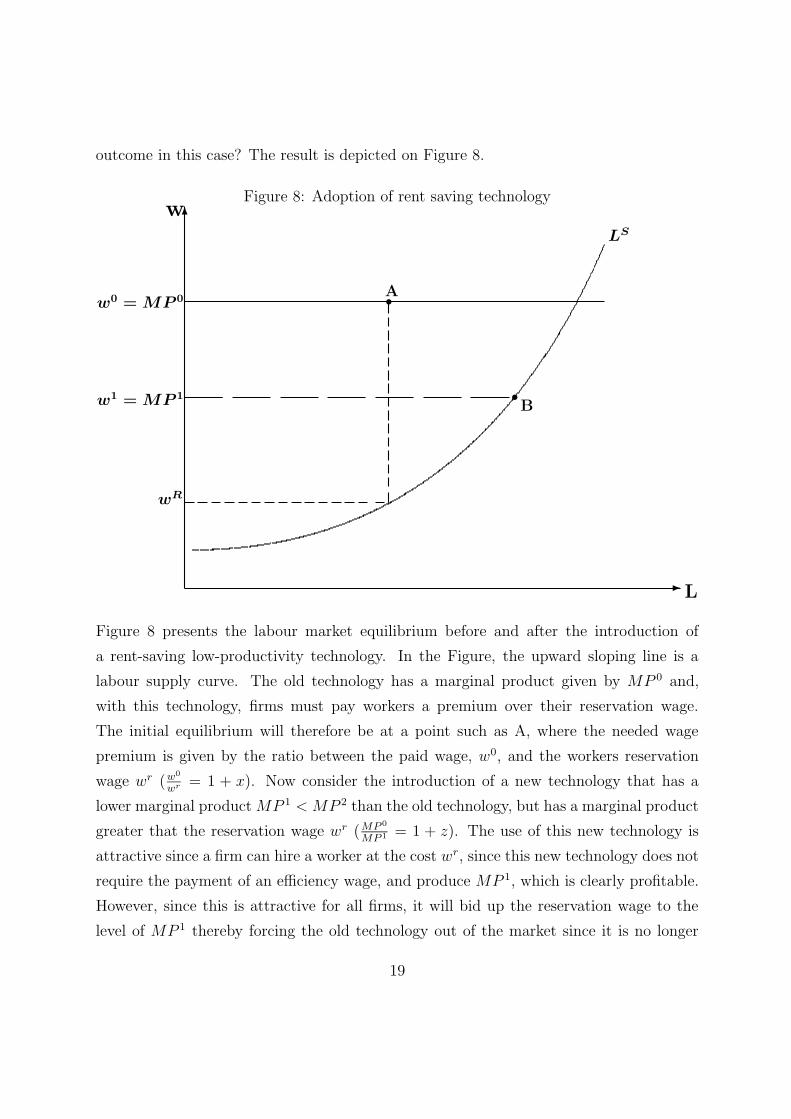
outcome in this case? The result is depicted on Figure 8.
Figure 8: Adoption of rent saving technology6w
-L
LS
w0
= MP0
s
Bw
1= MP
1
wR
sA
Figure 8 presents the labour market equilibrium before and after the introduction of
a rent-saving low-productivity technology. In the Figure, the upward sloping line is a
labour supply curve. The old technology has a marginal product given by MP 0 and,
with this technology, firms must pay workers a premium over their reservation wage.
The initial equilibrium will therefore be at a point such as A, where the needed wage
premium is given by the ratio between the paid wage, w0, and the workers reservation
wage wr (w0
wr= 1 + x). Now consider the introduction of a new technology that has a
lower marginal productMP 1 < MP 2 than the old technology, but has a marginal product
greater that the reservation wage wr (MP 0
MP 1 = 1 + z). The use of this new technology is
attractive since a firm can hire a worker at the cost wr, since this new technology does not
require the payment of an efficiency wage, and produce MP 1, which is clearly profitable.
However, since this is attractive for all firms, it will bid up the reservation wage to the
level of MP 1 thereby forcing the old technology out of the market since it is no longer
19
6log(Y/L)
- log ν
�������������������������������������������OLD
������������NEW
??
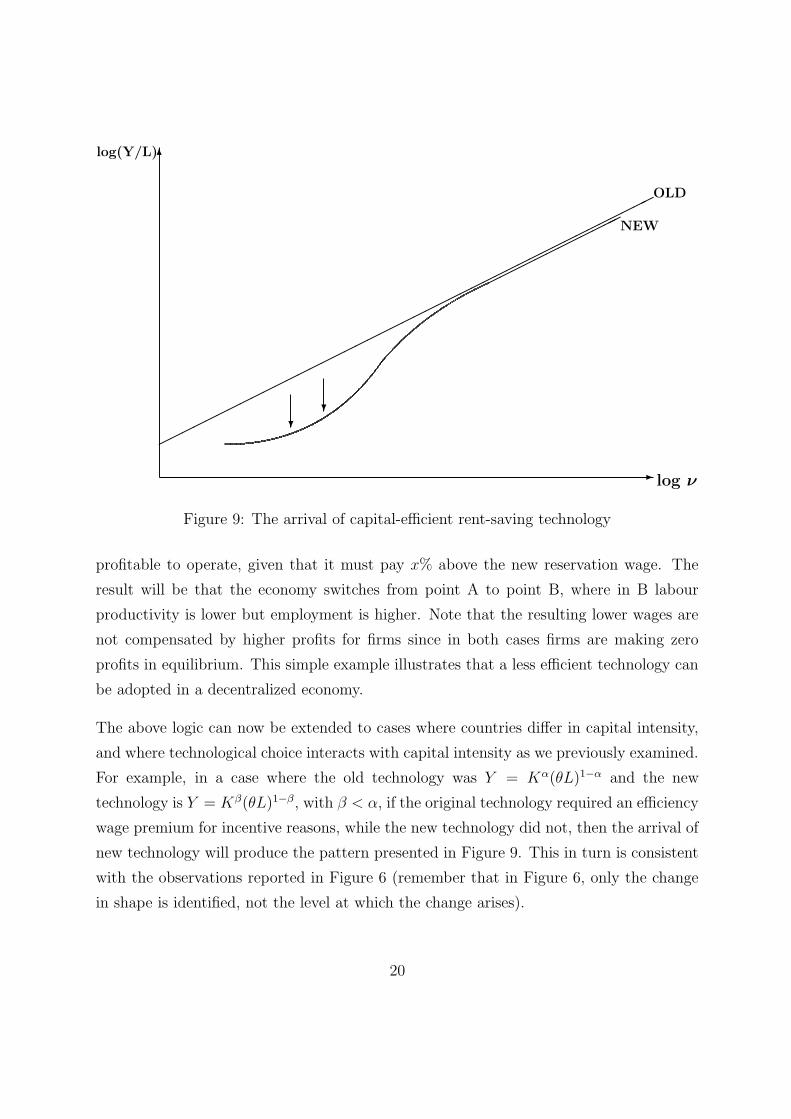
Figure 9: The arrival of capital-efficient rent-saving technology
profitable to operate, given that it must pay x% above the new reservation wage. The
result will be that the economy switches from point A to point B, where in B labour
productivity is lower but employment is higher. Note that the resulting lower wages are
not compensated by higher profits for firms since in both cases firms are making zero
profits in equilibrium. This simple example illustrates that a less efficient technology can
be adopted in a decentralized economy.
The above logic can now be extended to cases where countries differ in capital intensity,
and where technological choice interacts with capital intensity as we previously examined.
For example, in a case where the old technology was Y = Kα(θL)1−α and the new
technology is Y = Kβ(θL)1−β, with β < α, if the original technology required an efficiency
wage premium for incentive reasons, while the new technology did not, then the arrival of
new technology will produce the pattern presented in Figure 9. This in turn is consistent
with the observations reported in Figure 6 (remember that in Figure 6, only the change
in shape is identified, not the level at which the change arises).
20
In Figure 9, we see that the introduction of a rent-saving capital-efficient technology re-
sults in a downward shift in the relationship between labour productivity and capital
intensity at low levels of capital intensity. Note that the reason for this downward shift
is that the new technology is adopted most aggressively by countries with relative capital
scarcity as a way to save both on labour costs and capital costs, even if it is less produc-
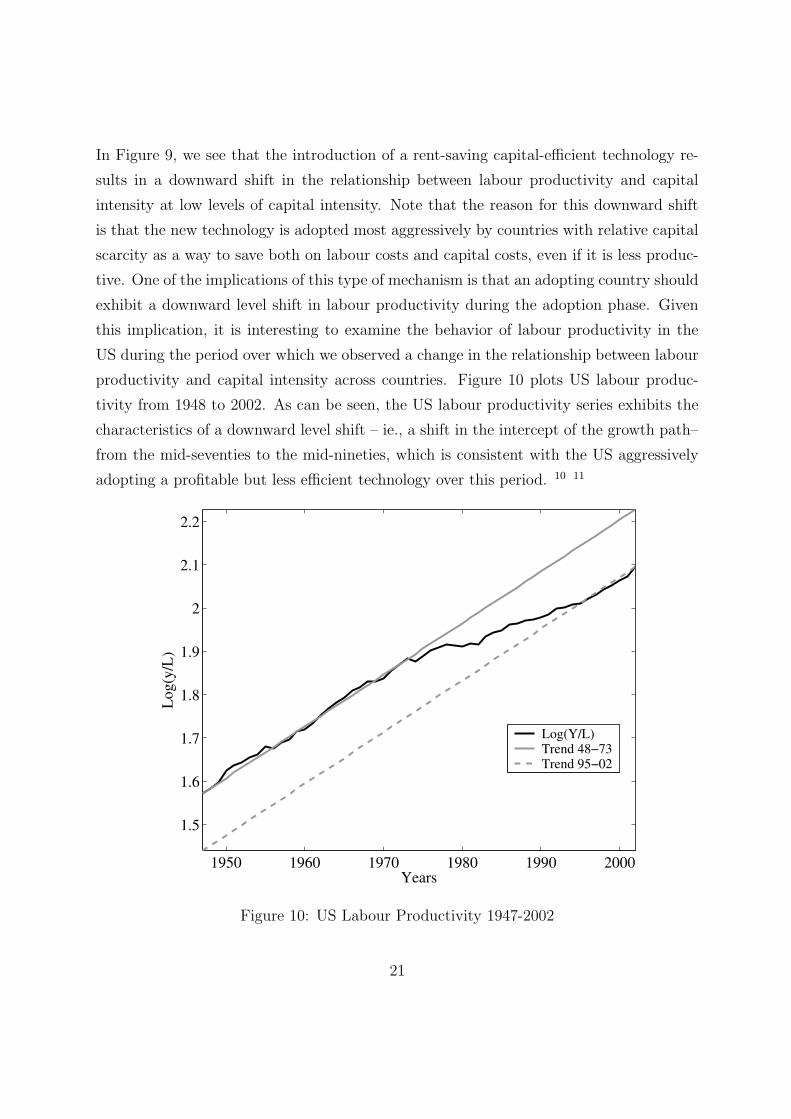
tive. One of the implications of this type of mechanism is that an adopting country should
exhibit a downward level shift in labour productivity during the adoption phase. Given
this implication, it is interesting to examine the behavior of labour productivity in the
US during the period over which we observed a change in the relationship between labour
productivity and capital intensity across countries. Figure 10 plots US labour produc-
tivity from 1948 to 2002. As can be seen, the US labour productivity series exhibits the
characteristics of a downward level shift – ie., a shift in the intercept of the growth path–
from the mid-seventies to the mid-nineties, which is consistent with the US aggressively
adopting a profitable but less efficient technology over this period. 10 11
1950 1960 1970 1980 1990 2000
1.5
1.6
1.7
1.8
1.9
2
2.1
2.2
Years
Log
(y/L
)
Log(Y/L)Trend 48−73Trend 95−02
Figure 10: US Labour Productivity 1947-2002
21
While the above discussion may be of interest in its own right, my primary goal here
not to focus on one particular episode, but is instead to extract general principles from
such inquiry. Accordingly, the main lesson I take from my explorations into medium
run productivity movements is that imperfection in the labour market may be central to
understanding such outcomes. In particular, I have found that extending the endogenous
technological adoption framework to the case where workers may be paid above their
reservation wage–depending, for example, on the technology they use– greatly expands
the ability of this class of models to shed light on medium run phenomena.
Lesson 3 : Labour market imperfections may play an important role in shaping medium
run outcomes, and such possibilities can be easily incorporated into models of endogenous
technological choice.
Corollary : The endogenous technological choice model extended to allow for wage
differentials across different technologies offers a coherent explanation for recent medium
differences across countries in output-per-worker patterns.
3 Trade versus Technology
In much of the debate surrounding changes in wage inequality and movements in pro-
ductivity, it is common to ask whether the observed changes are more likely a reflection
of increased international trade or a change in technological opportunities. Given that
I have suggested that models of endogenous technological adoption can provide a coher-
ent explanation for such phenomena, it is relevant to ask how such an explanation can
be differentiated from one based on international trade. In order to address this issue,
let me first stress the structural similarity between the two explanations. From a model
standpoint, the opening up of a trading opportunity is almost identical to the arrival of
a new technology since the new trading opportunity offers a new way of changing certain
inputs into a different set of outputs. Therefore, the two types of models can explain
very similar changes in the relationship between factor proportions and outcomes. This
implies that the type of evidence I have presented in support of models of endogenous
technological choice is not very informative regarding whether the observed changes are
22
6log(Y/L)
- log ν
�������������������������������������������OLD
NEW
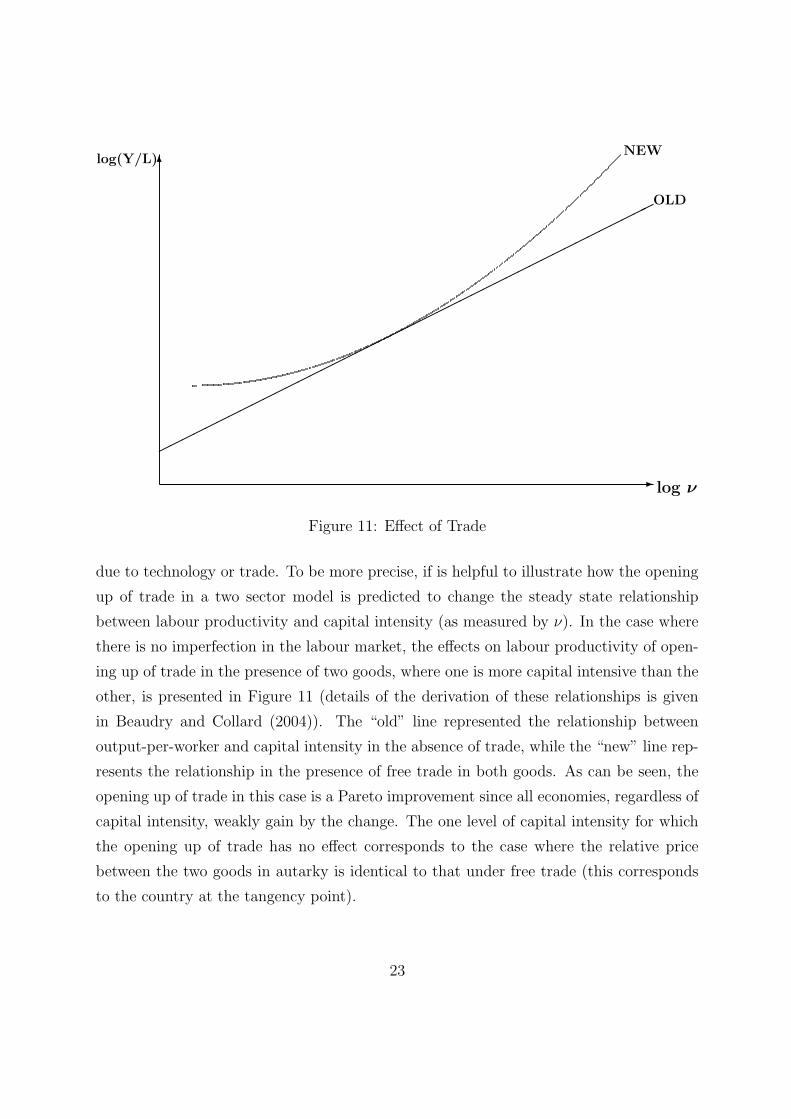
Figure 11: Effect of Trade
due to technology or trade. To be more precise, if is helpful to illustrate how the opening
up of trade in a two sector model is predicted to change the steady state relationship
between labour productivity and capital intensity (as measured by ν). In the case where
there is no imperfection in the labour market, the effects on labour productivity of open-
ing up of trade in the presence of two goods, where one is more capital intensive than the
other, is presented in Figure 11 (details of the derivation of these relationships is given
in Beaudry and Collard (2004)). The “old” line represented the relationship between
output-per-worker and capital intensity in the absence of trade, while the “new” line rep-
resents the relationship in the presence of free trade in both goods. As can be seen, the
opening up of trade in this case is a Pareto improvement since all economies, regardless of
capital intensity, weakly gain by the change. The one level of capital intensity for which
the opening up of trade has no effect corresponds to the case where the relative price
between the two goods in autarky is identical to that under free trade (this corresponds
to the country at the tangency point).
23
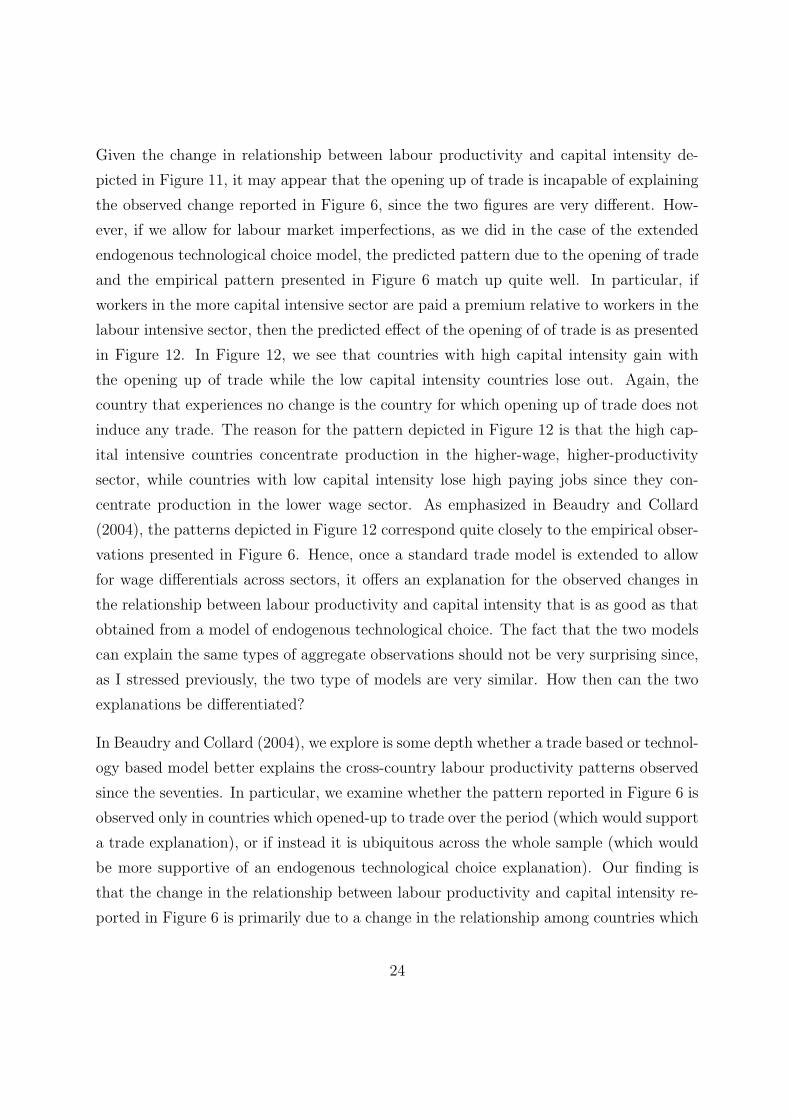
Given the change in relationship between labour productivity and capital intensity de-
picted in Figure 11, it may appear that the opening up of trade is incapable of explaining
the observed change reported in Figure 6, since the two figures are very different. How-
ever, if we allow for labour market imperfections, as we did in the case of the extended
endogenous technological choice model, the predicted pattern due to the opening of trade
and the empirical pattern presented in Figure 6 match up quite well. In particular, if
workers in the more capital intensive sector are paid a premium relative to workers in the
labour intensive sector, then the predicted effect of the opening of of trade is as presented
in Figure 12. In Figure 12, we see that countries with high capital intensity gain with
the opening up of trade while the low capital intensity countries lose out. Again, the
country that experiences no change is the country for which opening up of trade does not
induce any trade. The reason for the pattern depicted in Figure 12 is that the high cap-
ital intensive countries concentrate production in the higher-wage, higher-productivity
sector, while countries with low capital intensity lose high paying jobs since they con-
centrate production in the lower wage sector. As emphasized in Beaudry and Collard
(2004), the patterns depicted in Figure 12 correspond quite closely to the empirical obser-
vations presented in Figure 6. Hence, once a standard trade model is extended to allow
for wage differentials across sectors, it offers an explanation for the observed changes in
the relationship between labour productivity and capital intensity that is as good as that
obtained from a model of endogenous technological choice. The fact that the two models
can explain the same types of aggregate observations should not be very surprising since,
as I stressed previously, the two type of models are very similar. How then can the two
explanations be differentiated?
In Beaudry and Collard (2004), we explore is some depth whether a trade based or technol-
ogy based model better explains the cross-country labour productivity patterns observed
since the seventies. In particular, we examine whether the pattern reported in Figure 6 is
observed only in countries which opened-up to trade over the period (which would support
a trade explanation), or if instead it is ubiquitous across the whole sample (which would
be more supportive of an endogenous technological choice explanation). Our finding is
that the change in the relationship between labour productivity and capital intensity re-
ported in Figure 6 is primarily due to a change in the relationship among countries which
24
6log(Y/L)
- log ν
�������������������������������������������OLD
NEW
Figure 12: Effect of Trade with Wage Premium in Capital Intensive Sector
experienced a substantial increase in trade. This observation gives support to the view
that trade opening may be more relevant than technological change for understanding
recent medium run behavior of labour productivity. However, such a conclusion should
not be drawn too quickly since the trade based explanation has other difficulties. For ex-
ample, I have examined whether a reasonably calibrated two sector model could generate
the change in the relationship between labour productivity and capital intensity observed
in the data and I have found that the observed size is too big to be explained exclusively
by the expansion of trade. Such conflicting observations regarding the relevance of trade
versus technology in explaining recent medium run outcomes leave me to conclude that
further work is needed. Accordingly, the fourth lesson I take away form my research on
medium run macroeconomics is that convincingly distinguishing between effects due to
trade expansion versus technological change remains a challenge.12
Lesson 4: Decomposing medium run phenomena into changes induced by the opening
up of international trade versus the changes in technological opportunities remains a
challenge.
25
4 Conclusion
In this lecture I have discussed medium run macroeconomics, that is, the study of ag-
gregate economic phenomena that unravel over a period of 10 to 25 years, and I have
argued that it is a growing area of research with questions and methods that are distinct
from both those of business cycle theory and growth theory. In particular, I have high-
lighted how models of endogenous technological choice can offer a fruitful framework for
understanding certain medium run outcomes such as changes in the return to education
or changes in the determinants of labour productivity. The main element that defines
an endogenous technological choice model is the simultaneous presence of many available
technologies, with the actual technology in use reflecting an endogenous decision that
responds to economic conditions. The economic condition that I have focused upon as
potentially affecting technological choice is factor proportions, with particular attention
to the role played by capital intensity (and the ratio of human to physical capital). I
have illustrated how such models can explain puzzling outcomes such as why biased tech-
nological change may appear to be developing faster in one country versus another, or
why increases in the return to a factor may be observed where the factor is most abun-
dant. I have also emphasized that labour market imperfections may be key to understand
medium run developments and that extending an endogenous technological choice model
to allow for such a possibility greatly expands its explanatory power. Finally, in terms of
the debate regarding the role of technology versus trade in explaining recent medium run
outcomes, I have pointed out the close similarity between models of trade liberalization
and models of endogenous technological choice with the hope of clarifying why such ex-
planations are hard to distinguish. Therefore I finish by suggesting that more research is
need to understand the interaction between technology and trade in shaping medium run
macroeconomic outcomes.
26
References
Aghion, P. and P.W. Howitt, On the Macroeconomic Effects of Major Technological
Change, in E. Helpman, editor, General Purpose Technologies and Economic Growth,
Cambridge MA: MIT Press, 1998.
Beaudry, P. and D. Green, Cohort Patterns in Canadian Earnings: assessing the role of
skill premia in inequality trends, Canadian Journal of Economics, 2000, 33, 907–36.
and , Changes in U.S. Wages 1976–2000: Ongoing Skill Bias or Major Tech-
nological Change?, Forthcoming Journal of Labor Economics, 2001.
and , Population Growth, Technological Adoption and Economic Outcomes in
the Information Era, Review of Economic Dynamics, 2002, 5 (4), 749–774.
and , The Changing Structure of Wages in the US and Germany: What
Explains the Differences?, American Economic Review, 2003, 93 (3), 573–602.
and F. Collard, Recent Technological and Economic Change among Industrialized
Countries: Insights from Population Growth, Scandinavian Journal of Economics,
2003, 105 (3), 441–463.
and , Globalization, Returns to Accumulation and the World Distribution of
Output, Working Paper 10565, NBER 2004.
, , and D. Green, Decomposing the Twin Peaks: A Study of the Changing World
Distribution of output per worker, Working Paper 9240, NBER (Forthcoming Review
of Economics and Statistics) 2004.
, , and , Demographics and Recent Productivity Performanc: insights from
Cross-Country Comparisons, Canadian Journal of Economics, 2005, 38 (2), 309–344.
Blanchard, O.J., The Medium Run, in Brookings Papers on Economic Activity, Vol. 16,
Cambridge MA: MIT Press, 1997, chapter 1.
Caselli, F., Technological Revolutions, American Economic Review, 1999, 89, 78–102.
27
Greenwood, J. and M. Yorukoglu, 1974, Carnegie–Rochester Conference Series, 1997, 46,
49–95.
Helpman, E. and T. Trajtenberg, A Time to Sow and a Time to Reap: Growth Based on
General Purpose Technologies, in E. Helpman, editor, General Purpose Technologies
and Economic Growth, Cambridge MA: MIT Press, 1998.
Jones, C.I., On the Evolution of the World Income Distribution, Journal of Economic
Perspectives, 1997, 11 (3), 19–36.
Juhn, C., K.M. Murphy, and B. Pierce, Wage Inequality and the Rise in Returns to Skill,
Journal of Political Economy, 1993, 101 (3), 410–442.
Katz, L. and K.M. Murphy, Changes in Relative Wages, 1963-1987, Quarterly Journal
of Economics, 1992, pp. 35–78.
Krusell, P, L.E. Ohanian, J. V. Rios-Rull, and G.L.. Violante, Capital-Skill Complemen-
tarity and Inequality: A Macroeconomic Analysis, Econometrica, 2000, pp. 1029–
1055.
Quah, D., Empirical Cross–Section Dynamics in Economic Growth, European Economic
Review, 1993, 37 (2/3), 426–434.
28
Notes
1 See for example Juhn, Murphy and Pierce (1993)
2 See Beaudry and Green (2001), Beaudry and Green (2002) and Beaudry and Green(2003)
3 This model shares many similarities with that in Caselli (1999).
4Note that the implication of capital accumulation in this model of endogenous techno-logical adoption are opposite to those implied by the study of Krusell, Ohanian, Rios-Rulland Violante (2000), even though both adopt a notion of capital-skill complementarity.
5 In the long run, demographic patterns are likely endogenous to economic changes.However, over periods of 10 to 25 years, most demographic patterns affecting the labourforce can be reasonably consider to be exogenous to economic developments.
6 Note that in this framework, an explanation can be tested even if the actual change intechnology is non-observed. In fact, it is often necessary in practice to treat the commondriving force as an unobservable and uses its predicted interaction with country specificfactors as a means of testing the theory.
7 In Beaudry and Green (2002) we present theory and evidence supporting the idea thatdemographic differences across OECD country may explain the different wage outcomesobserved in these countries.
8Example: in Cobb-Douglas case, the return to capital satisfies the relationship r = αKY
for all countries regardless of θ.
9The introduction of the Sub-Saharan African countries does not change the patternsignificantly.
10If we augment this story to differentiate between skilled and unskilled workers, andview the new technology as saving on rents paid to less skilled workers in addition tobeing capital efficient, then the process of endogenous technological adoption can simul-taneously explain cross-country differences in the returns to education and productivityperformances since the mid-seventies.
11 Together these observations lead me to conjecture a unified explanation to the majormedium run developments since the 1970s, which may take the oil price shock of theearly seventies as a starting point. According to this conjecture, the oil shock of the earlyseventies favored the development of a new method of production that was both capitalsaving and rent (wage) saving. This type of new production paradigm was embraced
29

most aggressively by countries where the cost of capital was high, especially countrieswith big inflows into the labour market.These aggressive adopters experienced a period ofpoor growth, and increased wage inequality and, in the end, attained a more competitivelabour market.
12 I believe that trade and technology choice may be interacting in a manner that rendersa clear decomposition impossible. For example, if the opening up of trade changes factorprices, then this can affect technological choice in non-traded sectors. In this case, thefinal aggregate outcome is a result of both trade and technological change.
30