Embed Size (px)
Citation preview

Tropical Cyclone Larry, 2006
By Mr Jeff Callaghan
Retired Senior Severe Weather Forecaster, Bureau of Meteorology, Brisbane
Severe Tropical Cyclone Larry crossed the tropical north Queensland coast near Innisfail during the morning of 20 March, 2006. Larry reached Category 5 for a time just before landfall. As at 30 October 2006 there were 30,594 insurance claims for a total of 14,000 houses of which 500 were written off. Building costs were estimated at 1.5 billion 2006AUD. Sugar industry losses were around 200millionAUD with total crop losses exceeding 0.5 billion 2006AUD. The worst town affected being Silkwood with 99% of the houses damaged. Examples of the extreme wind damage were 4 high voltage transmission towers blown down along the Palmerston Highway and another north of Babinda. An Australian record wind gust of 293.7km/h was recorded on the eastern slope of Mt Bellenden Ker from a C.S.I.R.O. anemometer. Very large storm surges (debris lines to 5.2m above MSL) were measured in the Bingil Bay area. Fortunately Larry landed at low tide.
Figure 1 Larry (left) and Winifred (right) leading up to landfall (isobars drawn every 2hPa to 972hPa and red circle marks eyewall. Larry and Winifred Larry crossed the coast in much the same location that Winifred did some 20 years earlier. From Bureau of Meteorology (1986) the central pressure of tropical cyclone Winifred at landfall was 957hPa. Larry appears to have had a similar central pressure as it passed over Innisfail as the barograph at the official observation site which experienced the calm eye indicated a mean sea level pressure of 955hPa. From Figure 1 we see that Larry has many more isobars packed in closer to the centre than does Winifred and was obviously more intense. There are other reports of pressures around 930hPa, particularly near the southern intense rain band which is discussed below. These appear to be associated with short lived small circulations near the edge of the eye of the cyclone and are called meso scale vortices. A paper on the existence of these vortices is being prepared by Peter Otto of the Bureau of Meteorology in Brisbane.

Cyclone Larry, 2006
Data by J. Callaghan 22 September 2011
We show below that from other data that Larry was far more intense than Winifred. Central pressure is often a poor guide to tropical cyclone intensity. In Figure 1 in Courtney and Knaff (2009), the maximum ten-‐minute mean wind and minimum pressure relationship from reconnaissance-‐based best track data in the Atlantic basin between 1998 and 2007 shows the maximum wind vary from 65knots to 117knots for central pressures around 955hPa. Forest Damage The difference in severity and size between Larry and Winifred was borne out by Forest surveys by Turton (2008). In the case of Cyclone Larry, moderate and severe forest damage extended much further north, south and west than that reported for Cyclone Winifred, despite their similar paths across the landscape. However, slight forest damage for Cyclone Larry appeared to be less extensive than that reported for Cyclone Winifred. Insurance Costs From Lavin 2007 the costs associated with Larry were extremely large. This does not include crop damage which was extreme and the loss of the banana crop affected Australia’s CPI. As at October 2006 there were 30,594 insurance claims lodged involving damage to approximately 14,000 buildings of which approx. 500 were considered to be total losses. Costs are estimated by the Building Services Authority Queensland (BSA) at $1.5 billion 2006 dollars. For Winifred there were similar problems to Larry but the damage was less widespread. There were 50 homes in total destroyed with the estimated cost in 2006 dollars $425 million. Size of Larry at landfall Below in Figure 2 we compare Larry with two midgets (Ada and Tracy) and the very large circulation of tropical cyclone David. Ada is by far the tiniest and Larry is a little larger than Tracy and Larry had a larger eye as viewed from radar. The radar eye of Larry was around 30km in diameter as it neared the coast. The diameter of the radar eye of Ada contracted to 18km while the radar eye of Tracy at landfall was elliptical with a major axis of 12km and a minor axis of 8km. The concept of ‘midget’ tropical cyclones originated at the Joint Typhoon Warning Centre in the days of Chip Guard. The definition of a midget is when the radius of gales is 111km or less. Larry thus qualifies to be called a
midget. From Callaghan and Smith (1998) midgets have a much higher central pressure (in the order of 20hPa) for a given intensity compared with a large cyclone. Figure 2 Comparison of the structure of Larry with David, Ada and Tracy and all drawn to a similar scale.

Cyclone Larry, 2006
Data by J. Callaghan 22 September 2011
Intensification up to landfall Microwave images of tropical cyclone Larry were obtained courtesy of the US Navy Research Laboratory Monterey (California) Satellite Section at http://www.nrlmry.navy.mil/tc_pages/tc_home.html. These are placed in Figure 3, which indicated the increase in convective rain and thunderstorm activity (red areas) around the centre as Larry approaches the coast and makes landfall.
Figure 3 Microwave images of Larry from 2118 UTC 17 March to 2234UTC 19 March 2006.
Figure 4 Infrared image at 1733UTC 19 March 2006.

Cyclone Larry, 2006
Data by J. Callaghan 22 September 2011
The enhanced Infrared satellite images (example in Figure 4) of Larry approaching landfall indicated a tropical cyclone near the transition from Australian category four intensity to Australian category five intensity. The Satellite technique to calculate maximum sustained wind speed in a tropical cyclone for infrared imagery is relatively simple for tropical cyclones with an eye. In Figure 7 the sequence shows Larry leading up to landfall and the first four images are all rated T6.5 which signifies that Larry was at the lower end of the Australian Category 5 intensity. In this system the colder the cloud top temperatures surrounding the eye and the warmer the eye temperature, the more intense the system is. The temperature difference is a proxy for the strength of the up motion in the thunderstorms around the eye and the subsidence in the eye and correlates well with cyclone intensity. The red colour is very cold cloud tops (colder than -‐80degrees Celsius) and was generated by very strong thunderstorm activity around the eye wall and this can be seen to reduce in size near the centre up to 1833UTC 19 March (lower left frame). The dark blue (-‐76 to -‐80 degrees Celsius), light blue (-‐70 to -‐75degrees Celsius) and red areas have all weakened by 1933UTC and the rating drops to T 6.0 which is at the top of the Category 4 scale. Although there is a lag in the fall in intensity and it still would be rated as a Category 5 system under this technique. At landfall at 2033UTC there is another burst in thunderstorms which you can see by the red cloud top circulating around the southern and western sides of the eye. This band of intense convection on the southern side of the eye was associated with the worst wind damage and the largest storm surge.
Figure 5 Radar images from Mount Stuart radar near Townsville from 1930UTC to 2100UTC 19 March 2006. The red dot marks the position of Innisfail. In Figure 5 the centre of Larry was located more or less the same distance from the Townsville radar located on Mount Stuart so it is useful for determining signs of intensification. The light blue and yellow colours signify the heavier convective precipitation and over the period in Figure 5 Larry

Cyclone Larry, 2006
Data by J. Callaghan 22 September 2011
clearly intensified up to landfall as strong convective rain developed close to the centre around the eye. Notice that the strong southern band of convection is the same thunderstorm area evident in the infrared imagery in Figure 4. Also there was no strong convection on the western side of the eye at 2000UTC (top right frame) as it approached Innisfail. The southern band of convection wrapped around the western side of the eye after landfall virtually missing Innisfail. This is important in analysing the observations from the official observer at Innisfail. Around 5:20 am (1920UTC), the first report received at the Brisbane Tropical Cyclone Warning Centre of intense coastal winds from Larry was via a phone call from a yacht anchored at Mourilyan Harbour. The person on the yacht reported an anemometer measured wind gust of 225 km/h. From Figure 5 these winds occurred when the massive southern convective cloudband reached the coast. Mourilyan Harbour is located immediately south southeast of Innisfail in Figure 5 where the range-‐ ring crosses the coast. No further observations were possible, as the mast of the vessel snapped after this report. However 10 minutes later at 5:30 am a citizen at his home in Moresby (11 km west southwest of Mourilyan) recorded a southeasterly gust of 240km/h on his home weather station before his anemometer also failed. These instruments were unavailable for calibration and we are unable to comment on their accuracy.
Figure 6 Radar imagery received from Mount Stuart radar. This was at the time of the very large surge near Clump Point. The worst damage was associated with this southern eye wall.
In Figure 6 is a close up of the southern convective band. The strongest winds should be found just to the north of the strongest convection (yellowy green band) and this was where the worst storm surge and wind damage was found. Bingil Bay (located between Clump Point and Garners Beach) had storm surge driven debris levels 5.2metres above Australian Height Datum. Extreme vegetation damage was found in the area and a house on a cliff top at Garners Beach which was engineered for wind gusts of 82m/s was severely damaged. The location where 4 high voltage electricity towers were brought down is marked in Figure 6. Innisfail and South Johnstone observations sites are also marked by the red dots. Innisfail was calm at the time while South Johnstone had southerly winds gusting to 72knots in the rain free eye region with a QFE pressure of 957.2hPa. The corresponding mean sea level pressure was 959hPa.

Cyclone Larry, 2006
Data by J. Callaghan 22 September 2011
Figure 7 This radar sequence shows the eyewall convection moving around the eastern side of the eye and over the top of the Innisfail Observing site, which is marked by the red dot.
Below are the wind observations taken by the Official Observer at the Bureau of Meteorology’s Innisfail site local time 20 March 2006:-‐ 3.30am S/SSW25/30knots 4.50am S/SSW 120km/h 6.00am S/SSW 180km/h 6.30am S/SSW 200km/h gusts 270km/h 6.50am beginning of eye very still 7.20am 7.25am end of eye 7.30am N/NNE 200km/h 8.00am N/NNE 290km/h 8.10am N/NNE 290km/h gusts 310km/h -‐320km/h 8.30am 250km/h gusts 290km/h 9.00am 210km/h gusts 220-‐250km/h 10.00am NE 70km/h gusts 100-‐120km/h 11.00am NE 25knots gusts 30-‐40 knots 12.00pm NE 20knots gusts 25-‐30knots The wind speeds are estimated and like most people the observer would have had no way of estimating the extreme wind speeds associated with the eye of a tropical cyclone. However there is information from the relative wind speeds. From her observations there was much more damage associated with the stronger northerlies winds than the southerlies and this is consistent with radar observations. From Figure 5 Innisfail did not appear to be affected by a strong western eye wall which would contain the southerly flow. However in Figure 7 we can see the strong convection from a band of thunderstorms circulating around the eastern side of the eye pass over Innisfail which would have northerly winds.

Cyclone Larry, 2006
Data by J. Callaghan 22 September 2011
Figure 8 Cyclone Larry’s eye at 2050UTC 19 March. The wind direction at the South Johnstone AWS (red arrow) was a southerly at this time; however it was flowing over steep, forested terrain (red hatched area) just 200m upwind. South Johnstone Automatic Weather Station. Unfortunately there was only one Automatic Weather Station (AWS) in the region where the strongest winds passed over (see Figure 8) and this was located at South Johnstone in the lee of a mountain. This AWS recorded a peak gust of 98knots around this time which is far lower than would be expected. The mountain range behind the AWS suffered extreme vegetation damage whereas buildings around the AWS were only slightly damaged. Eight years of data was analysed from all current similar types of AWS over open Australian coastal terrain. From these results it was determined that the gust factor applicable for flow 10 metres above the ocean is around 1.26. By contrast, the gust factors associated with the southerly flow over the terrain and buildings at South Johnstone during cyclone Larry were far higher 1.8-‐2.2, averaging 2.0. This indicates how the terrain affected the flow over the AWS making it unrepresentative of the general flow around Larry in this part of the storm.
Cyclone Larry, 2006
Data by J. Callaghan 22 September 2011
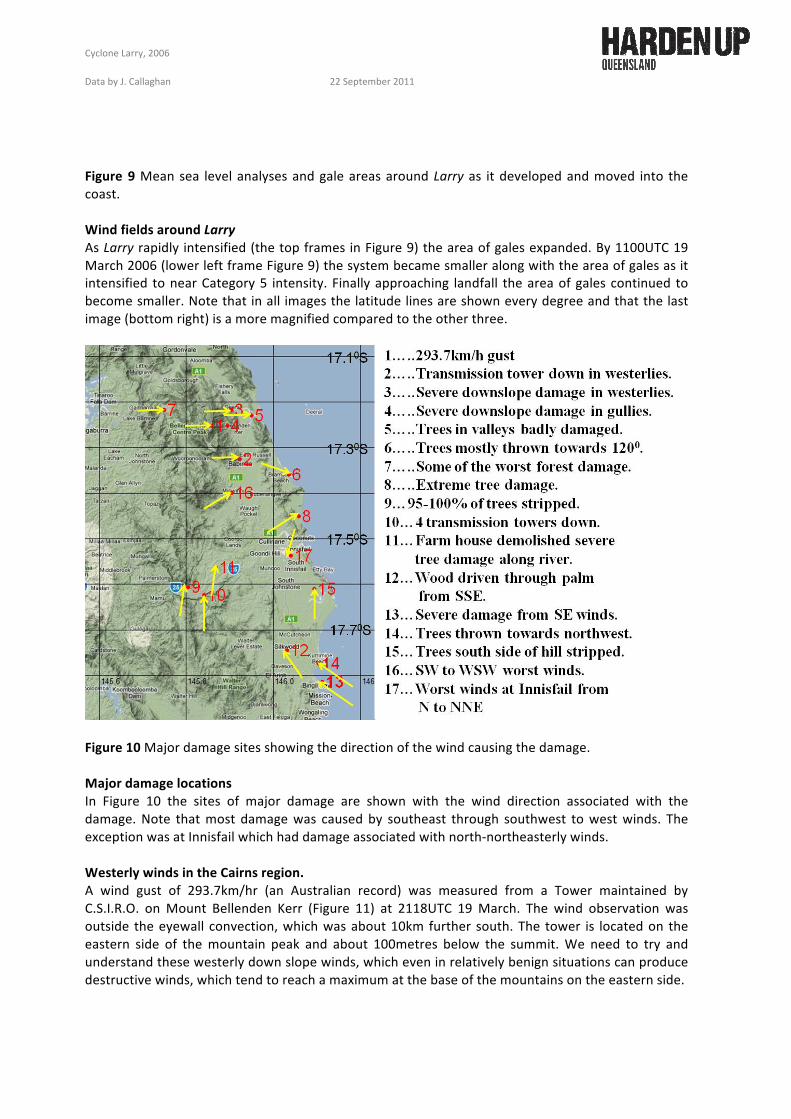
Figure 9 Mean sea level analyses and gale areas around Larry as it developed and moved into the coast. Wind fields around Larry As Larry rapidly intensified (the top frames in Figure 9) the area of gales expanded. By 1100UTC 19 March 2006 (lower left frame Figure 9) the system became smaller along with the area of gales as it intensified to near Category 5 intensity. Finally approaching landfall the area of gales continued to become smaller. Note that in all images the latitude lines are shown every degree and that the last image (bottom right) is a more magnified compared to the other three.
Figure 10 Major damage sites showing the direction of the wind causing the damage. Major damage locations In Figure 10 the sites of major damage are shown with the wind direction associated with the damage. Note that most damage was caused by southeast through southwest to west winds. The exception was at Innisfail which had damage associated with north-‐northeasterly winds. Westerly winds in the Cairns region. A wind gust of 293.7km/hr (an Australian record) was measured from a Tower maintained by C.S.I.R.O. on Mount Bellenden Kerr (Figure 11) at 2118UTC 19 March. The wind observation was outside the eyewall convection, which was about 10km further south. The tower is located on the eastern side of the mountain peak and about 100metres below the summit. We need to try and understand these westerly down slope winds, which even in relatively benign situations can produce destructive winds, which tend to reach a maximum at the base of the mountains on the eastern side.

Cyclone Larry, 2006
Data by J. Callaghan 22 September 2011
Westerly down slope winds in the Cairns region are notoriously destructive. An example was the so-‐called tropical Cyclone Agnes in March 1956, which crossed the coast directly over Townsville with a central pressure reading of 960hPa. Agnes had a very large circulation, which after landfall straddled the large mountainous areas south of Cairns. The westerly down slope winds from this cyclone caused more damage at Cairns than the wind damage around the eye at Townsville. Skyrail cableway north of Cairns (see Figure 12) recorded its highest wind speed during Cyclone Larry. A 178 km/h gust was registered at the fourth Tower between its Caravonica base and the first station Red
Peak. Tower 4 is at the base of the McAlister Range. Figure 11 Location of the Tower on eastern slopes of Mount Bellenden Kerr with the record wind observation. East is to the left of this Figure.
Figure 12 Locations of Skyrail and Mt Bellenden Kerr
Figure 13 Location of wind maxima in downslope wind situations.

Cyclone Larry, 2006
Data by J. Callaghan 22 September 2011
The balance between inertia and buoyancy determines the airflow over a mountain. The Froude Number can express this balance. This number can be written as U/Nh where U is the wind speed in ms-‐1, h is the height of the mountain in metres and N is the buoyancy frequency. N increases as the atmosphere becomes more stable. Large Froude numbers occur where there are strong winds, weak stratification and small hills. Large mountains contribute strongly to a low Froude number, which from Figure 13 leads to the wind maximum being located near the base of the mountain. The Skyrail data indicated strong downslope winds with low Froude numbers. The gust measured near the base of the mountain was 178km/h or 96 knots. The strongest winds around Cairns occurred at 9am local time around the time of the Cairns RAWIN flight. Cairns Airport Meteorological Station is not as badly affected by downslope winds as other suburbs closer to the mountains and the maximum wind gust at the airport was 59 knots. The winds from the RAWIN flight were 910hPa 325/42 knots, 850hPa 305/43knots, 785hPa 325/39 knots and 700hPa 335/50 knots. Therefore the Skyrail wind observations represented a strong increase in the ambient winds as it accelerated down the range. The tower where the Mount Bellenden Kerr wind was measured was located in an area where the wind speed would be rapidly decreasing if the flow conditions were associated with high Froude numbers. Either the peak winds on top of the mountain were significantly greater than 293.7 km/h or there was strong downslope flow down Mount Bellenden Kerr. Atherton Tablelands
Figure 14 Wind gusts recorded from the High Road wind farm at Ravenshoe on the Atherton tableland.
Wind readings were also received from anemometers attached to the tops of the Ravenshoe wind farm mills (20m above ground) located on the Atherton Tablelands, with a peak wind gust recorded at 187 km/hr which is also a category 3 gust (Figure 14). The wind direction, from radar evidence, showed that the peak winds to impact that area were from the south, with somewhat weaker winds from the east. At first glance this may seem unusually strong that far inland, however the recorded wind speeds at this site are supported by the observation that “extensive damage to upland forests as far inland as 100 km that normally escape the worst impacts of cyclones” (Turton 2008). There was also widespread power pole damage

Cyclone Larry, 2006
Data by J. Callaghan 22 September 2011
on the Atherton tablelands and many reports of significant damage to homes and property. The wind farm is situated on an excellent site to measure the southerly-‐southeasterly winds it experienced during this event. It is situated on a cleared plateau, well away from upstream obstructions to the south and east, and with terrain only to the north of the facility.
Figure 15 MSL analysis at 1800UTC 20 March 2006 Western extent of tropical cyclone intensity. Larry maintained tropical cyclone intensity well inland and in Figure 15 is the analysis of Larry shortly after it was downgraded to a tropical low.