Embed Size (px)
Citation preview

Innovating the Green Economy in California Regions
The Center for Community Innovation (CCI) at UC–Berkeley nurtures effective solutions that expand economic opportunity, diversify housing options, and strengthen connection to place. The Center builds the capacity of nonprofits and government by convening practitioner leaders, providing technical assistance and student interns, interpreting academic research, and developing new research out of practitioner needs.
University of California, Berkeley Center for Community InnovationInstitue for Urban & Regional Development316 Wurster Hall #1870Berkeley, CA 94720-1870
http://communityinnovation.berkeley.edu
AuthorsKaren Chapple and Malo Hutson, Principal Investigators, with Cynthia Kroll, T. William Lester, Larry Rosenthal, Emilio Martinez de Velasco, Ana Mileva, Sergio Montero, Anita Roth, and Laura Wiles
Cover PhotosPhotos courtesy of: (top row) Ben Shepard, Sky WindPower Corporation, www.skywindpower.com; Rubber Sidewalks, www.rubbersidewalks.com; (bottom row) REC Solar, www.recsolar.com; One-Cycle Control, Inc., www.onecyclecontrol.com, 400 to 24Vdc converter; Berkeley Recycling, www.berkeleyrecycling.org
Key SupportThis report was funded by the U.S. Economic Development Administration (Award #99-07-13863). Our deepest thanks go to: The student members of City and Regional Planning 228 and City and Regional Planning 268, Spring 2009 (Esther Kim, Jordan Klein, Cathy Kunkel, Sergio Montero, Ceara O’Leary, Melissa Smith, Oscar Sosa, Carlos Velasquez, Aaron Wilcher, and Laura Wiles); Graduate Student Researchers Ellen Avis and Alexander Brennan and Undergraduate Researchers Amanda Bradshaw, Rebecca Coleman, Esther Jung, and Ashley Marie Smith; and the members of the Technical Advisory Committee, all at the University of California-Berkeley: Michael Cohen, Associate Director for Engineering, Physical and Biosciences, Office of Technology Transfer; Jason Corburn, Associate Professor, Department of City and Regional Planning; Dan McGrath, Executive Director, Berkeley Institute of the Environment; Lisa McNeilly, Director, UC-Berkeley Office of Sustainability; Cymie Payne, Director, Global Commons Project, Associate Director, Center for Law, Energy, and the Environment, and Lecturer in Residence, Boalt Hall School of Law; Blas Perez-EnriquesExecutive Director, Center for Environmental Public Policy and Assistant Dean for Executive and International Programs, Goldman School of Public Policy; AnnaLee Saxenian, Dean and Professor, School of Information SystemsProfessor, Department of City and Regional Planning; David Winickoff, Assistant Professor of Bioethics and Society, Department of Environmental Science, Planning & Management and Co-Director, Berkeley Science, Technology and Society Center; and Catherine Wolfram, Associate Professor of Business and Co-Director, Energy Institute at Haas School of Business.
i
Table of Contents Table of Contents .............................................................................................................................. iTable of Figures ................................................................................................................................ iiTable of Tables ................................................................................................................................. iiiExecutive Summary ......................................................................................................................... v
E.1 Defining the Green Economy .................................................................................................................... vE.2 Overview of Green Economic Activity in California ...................................................................... viiE.3 Defining and Measuring Innovation ...................................................................................................... ixE.4 The Decision to Innovate: Evidence From a Survey of Green and Traditional Firms. ....... xiE.5 Regional Case Study Findings .................................................................................................................xiiE.6 Policies to Promote Innovation in the Green Economy ................................................................ xv
Chapter 1. Introduction .................................................................................................................. 1Chapter 2. Understanding the Green Economy and Innovation ............................................. 4
2.1 Overview of the Green Economy ........................................................................................................... 42.2 Measuring the Green Economy ............................................................................................................... 52.3 Measuring Green Innovation .................................................................................................................... 72.4 Triangulating with primary data: Surveys and interviews .......................................................... 8
Chapter 3. Overview of Innovation and the Green Economy ................................................. 113.1 The Central Role of Innovation in Competition and Economic Development ................... 113.2 Defining Innovation .................................................................................................................................. 123.3 Determinants of Innovation at the Regional Level ....................................................................... 133.4 The Systemic Nature of Innovation .................................................................................................... 143.5 Challenges and Current Efforts in Innovation Measurement ................................................... 163.6 Innovation Policy ....................................................................................................................................... 223.7 How Is (or Is Not) Green Innovation Different? ............................................................................ 24
Chapter 4: Statewide Trends and Innovation in California’s Green Economy .................. 284.1 Overview of California’s Green Economy .......................................................................................... 284.2 Measures of Innovation in the Green Economy ............................................................................. 314.3 Green Economic Activity and Innovation in California’s Metropolitan Regions ............... 434.4 Green Innovation: Six Cases .................................................................................................................. 51
Chapter 5. Survey of Businesses in the Green Economy ......................................................... 535.1 Survey Overview ......................................................................................................................................... 535.2 Green Innovation ........................................................................................................................................ 545.3 Green Practices and Activities ............................................................................................................... 575.4 Regional Assets ............................................................................................................................................ 605.5 Networks ........................................................................................................................................................ 655.6 Policy Perceptions and Impact .............................................................................................................. 725.7 Factors Underlying Green Innovation ................................................................................................ 845.8 Summary of Findings ................................................................................................................................ 87
Chapter 6. Comparing Green Innovation Across Regions ...................................................... 916.1 Overview of the Six Regions .................................................................................................................. 916.2 Measuring Innovation and the Green Economy in Case Study Regions ............................... 966.3 Characterizing the Six Regional Innovation Systems ................................................................ 1066.4 Policy Approaches ................................................................................................................................... 138

ii
Chapter 7. Conclusion ................................................................................................................. 153References ..................................................................................................................................... 156 Table of Figures Figure E-1 Defining the Green Economy ......................................................................................................... vi Figure E-2 Green Employment in California by Sector, 1990 and 2008 ........................................... vii Figure 2.1 Defining the Green Economy ........................................................................................................... 4 Figure 3.1 ASTRA’s Framework to Analyze .................................................................................................. 18 Figure 4.1 Green Establishments in California by Sector, 2008 ........................................................... 29 Figure 4.2 Green Employment in California by Sector, 1990 and 2008 ............................................ 30 Figure 4.3 Share of Green Sales, by Sector, 2007 ...................................................................................... 31 Figure 4.4 Index of Employment Change in California, Green Sectors vs. Overall, 1990-2008 ........................................................................................................................................................................................ 32 Figure 4.5 Index of Employment Change by Green Sector, 1990-2008 ............................................. 32 Figure 4.6 Total Patents and Cleantech Patents Issued in CA, 2000-08 ........................................... 34 Figure 4.7 Venture Capital Investments in Clean technologies and Overall, 2000-2008. .......... 37 Figure 4.8 Venture Capital Investments in Clean Technologies by Sector, 2000-2008 .............. 38 Figure 4.9 Green Startups by Year, 1990-2007.......................................................................................... 40 Figure 4.10 Total Green Startups by Sector, 2000-2007 ........................................................................ 41 Figure 4.11 Gazelles as Share of all Establishments ................................................................................ 42 Figure 4.12 Green Gazelles by Sector, 2008 (Relative to All Establishments) ............................... 43 Figure 4.13 Innovation Versus Growth in .................................................................................................... 51 Figure 5.1 Businesses Rating Green Practices as Very Important, by Firm Size ............................ 57 Figure 5.2 Types of Green Activity by Survey .............................................................................................. 58 Figure 5.3 Weekly/Monthly Interactions with Organizations by Survey ......................................... 71 Figure 5.4 Weekly/Monthly Interactions with Organizations (Innovative and Non-Innovative Green Firms ............................................................................................................................................................... 72 Figure 5.5 Weekly/Monthly Interaction with Organizations for Green Businesses by Company Size ............................................................................................................................................................................... 73 Figure 6.1 Product Versus Process Innovation for Firms in the Six Regions .................................. 98 Figure 6.2 Weekly/Monthly Interactions for Green Businesses by Region ................................... 113 Figure 6.3 Green Innovation Network in the East Bay .......................................................................... 120 Figure 6.4 Green Innovation Network in Silicon Valley ....................................................................... 123 Figure 6.5 Green Innovation Network in San Diego ............................................................................... 126 Figure 6.6 Green Innovation Network in Los Angeles........................................................................... 130 Figure 6.7 Green Innovation Network in the Inland Empire .............................................................. 132 Figure 6.8 Green Innovation Network in the Upper San Joaquin Valley ........................................ 135
iii
Table of Tables Table E-1 Top Ten Metropolitan Regions, Ranked by Green Jobs in 2008 ..................................... viiiTable E-2 Top Ten Metropolitan Regions, Ranked by Green/Cleantech Innovation 2000-2008
........................................................................................................................................................................................... xTable 3.1 Council for Competitiveness’ Innovation Metrics ................................................................. 19Table 3.2 Martin & Scott’s Typology of Innovation Modes, Sources of Sectoral Innovation Failure, and Policy Responses ............................................................................................................................ 25Table 4.1 Overview of California’s Green Economy .................................................................................. 29Table 4.2 Total Patents by Clean Technology Category, 2000-2008. ................................................ 35Table 4.3 Patent Assignees with 10 or More Patents, 2000-2008 ...................................................... 36Table 4.4 SBIR and STTR Grants by Cleantech Category ......................................................................... 392000-08 ...................................................................................................................................................................... 39Table 4.5 Innovation Measures by Region Ranked by Composite Cleantech Ranking ............... 45Table 4.6 Employment in Green Sectors by Region, 1990-2008 (Ranked by 2008 Employment) ............................................................................................................................................................ 47Table 5.1 New Green Product/ Service Introduced in Past 3 Years ................................................... 54Table 5.2 Green Firms that Introduced New Green Product/Service in Past 3 Years ................. 55Table 5.3 Selected Examples of product innovation ................................................................................. 55Table 5.4. Change in Operational Processes to Reduce Environmental Impact by Survey ........ 56Table 5.5 Growth Plans for the Next Year by Survey ................................................................................ 56Table 5.6 Importance of Green Business Practices ................................................................................... 57Table 5.7 Barriers to Incorporating Green Practices by Survey ........................................................... 59Table 5.8 Barriers to Incorporating Green Practices for Green Businesses by Firm Size .......... 60Table 5.9 Location Factors for Green Businesses ....................................................................................... 61Table 5.10 Location Factors for Innovative and Non-Innovative Green (in Top 3 factors) ....... 62Table 5.11 Location Factors for Green Businesses by Industry ........................................................... 63Table 5.12 Location Decision Factors for Green Businesses by Firm Size ....................................... 63Table 5.13 Primary Market Type by Survey ................................................................................................. 65Table 5.14 Primary Market Location by Survey ......................................................................................... 66Table 5.15 Combined Analysis (Market Type and Location) by Survey ........................................... 66Table 5.16 Location of Main Competitor ....................................................................................................... 67Table 5.17 Main Location of Competitors for Green Businesses by Industry ................................. 67Table 5.18 Main Location of Competitors by Company Size .................................................................. 68Table 5.19 Location of Main External Supplier ........................................................................................... 68Table 5.20 Location of Main Partner ............................................................................................................... 68Table 5.21 Membership in Professional Organizations for Green Businesses, Total and By Industry* .................................................................................................................................................................... 70Table 5.22 Perceived Positive/Negative Impact of Policies on Businesses by Survey ................ 73Table 5.23 Policy Impact by Level of Policy Survey* ................................................................................ 74Table 5.24 Perception of Policy Impact by Policy Level by Survey ..................................................... 74Table 5.25 AB32 Impact by Survey .................................................................................................................. 75Table 5.26 Effect of AB32 by Survey (open-ended question) ............................................................... 75

iv
Table 5.27 AB32 Impact for Green Businesses by Size ............................................................................ 76Table 5.28 ARRA Impact by Survey ................................................................................................................. 76Table 5.29 Effect of ARRA on Businesses by Survey (open-ended question) ................................. 76Table 5.32 Employee Training Source by Survey* .................................................................................... 77Table 5.30 ARRA Impact by Firm Size ............................................................................................................ 77Table 5.31 Impact of AB32 and ARRA, Innovative and Non-Innovative Green Businesses ...... 77Table 5.33 Employee Training by Industry .................................................................................................. 78Table 5.34 Employee Training by Size ........................................................................................................... 78Table 5.35 Need for Employee Training ........................................................................................................ 79Table 5.36 Specific Need for Specialized Employee Training by Survey* ........................................ 79Table 5.37 Training for Innovative vs. Non-Innovative Green Firms ................................................. 80Table 5.38 Regional Competitiveness Improvement by Survey ........................................................... 81Table 5.40 Regional Competitiveness Improvement for Green Businesses by Industry ............ 83Table 5.39 Regional Competitiveness, Innovative vs. Non-Innovative Green Businesses ......... 83Table 5.41 Regional Competitiveness Improvement by Firm Size ...................................................... 84Table 5.42 Factors Influencing Green Product or Service Innovation ............................................... 86Table 5.43 Factors Influencing Green Process Innovation ..................................................................... 88Table 6.1 Regional Sector Measures ............................................................................................................. 100Table 6.2 Green Economy Trends in Employment, Establishments, Sales and Diversity ....... 104Table 6.3 Main Location of Competitors for Green Businesses by Region ..................................... 113Table 6.4 Main Location of External Suppliers for Green Businesses by Region ....................... 114Table 6.5 Main Location of Partners for Green Businesses by Region ............................................. 114Table 6.6 Location Decision Factors for Green Businesses by Regio ............................................. 115Table 6.7 Location of Markets for Green Businesses ............................................................................ 116Table 6.8 Regional Competitiveness Improvement for Green Businesses by Region ............... 140Table 6.9 Regional Competitiveness Improvement for Traditional Businesses by Region ..... 140
List of Appendices Appendix 1 – List of “Green” 8-Digit SICs Appendix 2 – Survey and Interview Protocols Appendix 3 – Survey Methodology Appendix 4 – Survey Results Appendix 5 – East Bay Regional Report Appendix 6 – Inland Empire Regional Report Appendix 7 – Los Angeles Regional Report Appendix 8 – San Diego Regional Report Appendix 9 – Silicon Valley Regional Report Appendix 10 – Upper San Joaquin Valley Regional Report

v
Executive Summary
During periods of severe economic crisis, policy makers and citizens look towards the future to identify and support emerging industries that hold the promise of renewed growth in investments and employment opportunities. As unemployment remains high and as the environmental challenges brought on by global warming mount, the “green economy” has garnered significant attention as a potential solution to both problems. However, as with any new industry, the process of developing new products and reworking existing production processes begins with innovation, and the resultant economic growth depends on commercialization. Rather than evaluating the claims that the green economy will be a panacea for the current set of crises, in Innovating the Green Economy, we focus our attention specifically on the question of how much innovation is occurring in the green economy, and how it takes place at the regional scale.
At its most basic level, the green economy consists of economic activity that reduces energy use and/or improves environmental quality. It includes the four principal sectors of the clean energy economy: renewable energy and alternative fuels (e.g. solar, wind, geothermal, biofuels); green building and energy efficiency technology; energy efficient infrastructure and transportation; and recycling and waste-to-energy. The green economy is not just about the ability to produce clean energy,
but also the growing market for products which consume less energy, from fluorescent lightbulbs to organic and locally produced food. It also encompasses economic sectors that improve the environment, for instance through remediation of toxic sites or design of more compact cities. With an emerging consensus about the impacts of global climate change, there is new enthusiasm among governments, industries, nonprofits, and individual consumers for green processes and products.
This report investigates innovation in the green economy in California – and in so doing fills a large gap in the literature. Economists and planners have had little experience in measuring economic activity – let alone innovation -- in this nascent economic arena. In this executive summary we highlight our top-level findings from the chapters that follow.
E.1 Defining the Green Economy
The green economy encompasses both new and traditional sectors. Innovation in the green economy might thus occur through the creation of new products, the transformation of production processes, or the development of new markets. Energy provides a simple example. New industries, such as biofuels, may be innovating new products that reduce dependence on traditional or dirty sources of energy. Traditional industries, such as utilities, may be changing the way they source power, relying more on renewable energy and alternative fuels – i.e., innovating how they produce energy. And individual households might install
vi
solar photovoltaic panels, thus joining an emerging market of energy consumers.
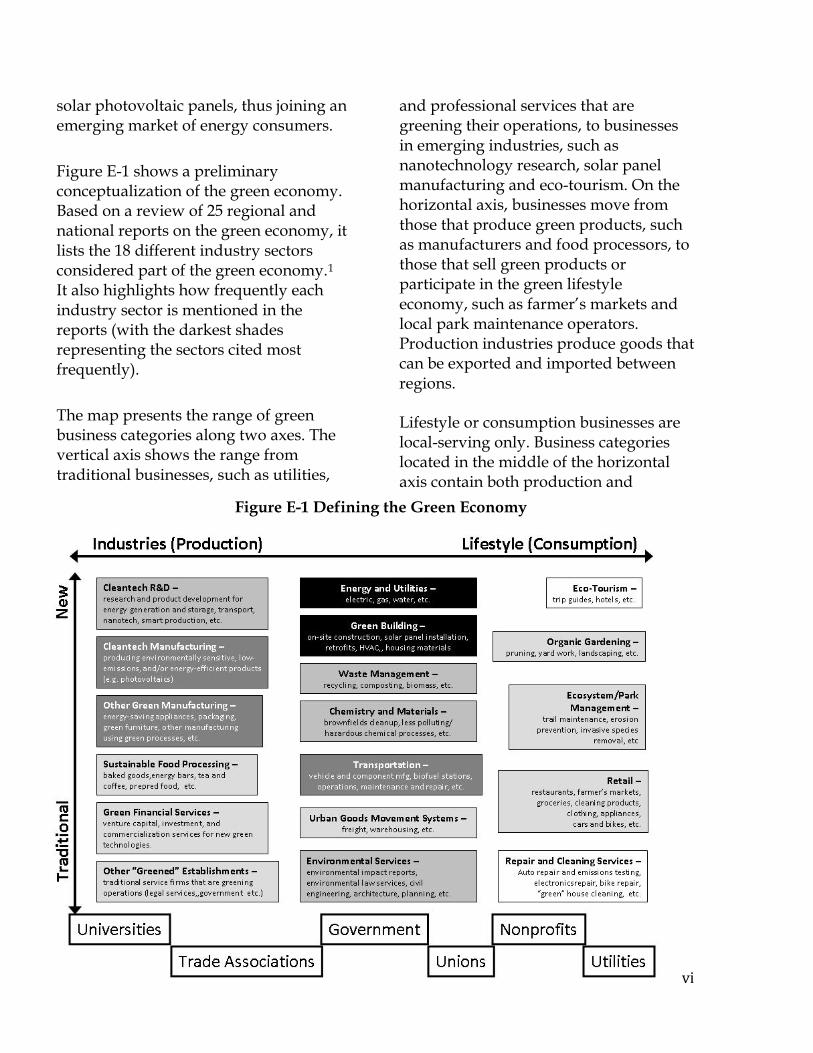
Figure E-1 shows a preliminary conceptualization of the green economy. Based on a review of 25 regional and national reports on the green economy, it lists the 18 different industry sectors considered part of the green economy.1
It also highlights how frequently each industry sector is mentioned in the reports (with the darkest shades representing the sectors cited most frequently).
The map presents the range of green business categories along two axes. The vertical axis shows the range from traditional businesses, such as utilities,
and professional services that are greening their operations, to businesses in emerging industries, such as nanotechnology research, solar panel manufacturing and eco-tourism. On the horizontal axis, businesses move from those that produce green products, such as manufacturers and food processors, to those that sell green products or participate in the green lifestyle economy, such as farmer’s markets and local park maintenance operators. Production industries produce goods that can be exported and imported between regions. Lifestyle or consumption businesses are local-serving only. Business categories located in the middle of the horizontal axis contain both production and
Figure E-1 Defining the Green Economy

vii
consumption aspects. Within the green economy, businesses interact with and are influenced by the government agencies, universities, non-profit organizations, unions, utilities and trade associations in the regional innovation system (shown at the bottom of the diagram). Innovation may occur in any industry; however, as we discuss in the next chapter, it is easier to measure and track in some than others. For instance, cleantech R&D may register new patents, a fuel cell manufacturer may commercialize its new product successfully, and green building firms may introduce innovative energy-reducing designs – but only the patents can be readily tracked. This measurement constraint limits the study of green innovation.
To operationalize this definition for the purposes of tracking job growth in the green economy, we use an establishment-
level dataset to categorize California’s green economic activity into six industry sectors: (1) energy research and services, (2) environmental services, (3) green building, (4) green manufacturing, (5) green transportation, and (6) recycling and remediation. These sectors are broadly defined in order to simplify the analysis, but also to be conservative, excluding industries that, though occasionally green, generally operate in a traditional manner (e.g., residential remodeling). Chapter 2 provides a more detailed discussion of our classification methodology and primary data sources.
E.2 Overview of Green Economic Activity in California
In 2008 there were 12,253 green establishments in the State of California, which collectively employed 163,616 workers across six distinct green economic sectors (see Figure E-2).
Energy research and
services
Environmental services
Green buildingGreen
manufacturingGreen
transportationRecycling
1990 15425 19229 9649 20319 31137 27235
2008 20742 38042 14641 20555 36107 33529
0
5000
10000
15000
20000
25000
30000
35000
40000
Gre
en E
mpl
oym
ent
Sources: USPTO; VentureExpert; US Small Business Administration; NETS. Calculations by the UCB Center for Community Innovation.
Figure E-2 Green Employment in California by Sector, 1990 and 2008

viii
As a share of the overall economy, green economic activity makes up a relatively small percentage of businesses, jobs, and total sales (with less than one percent of state employment). This is not surprising given our conservative green definition and given the size and diversity of California’s economy. Despite its small size, however, green economic activity is growing relatively rapidly (79% sales growth versus 47% overall) and tends to employ more workers per establishment (13.4 versus 7.6).
In terms of employment, the environmental services sector experienced the largest employment increase since 1990, increasing 98% to 38,042 in 2008. The green transportation sector—which includes large public transportation authorities, private vanpools, car sharing, as well as bicycle shops—employed the second largest number of workers (36,107) in California
in 2008. Though it has expanded by 52% since 1990, green building was the smallest sector statewide, employing just 14,641. However, since green building firms are particularly difficult to identify through SICs (where most are classified as residential remodelers), this is likely a very conservative estimate. Although energy research and services experienced robust growth since 1990, and employ 20,742 workers in highly-skilled positions, this figure is highly skewed by three nationally funded research labs in the East Bay, Lawrence Livermore National Lab, Sandia National Lab and Lawrence Berkeley National Lab, housed at UC Berkeley. Although much of the employment growth over the past 17 years has occurred in the research and development and service side of the green economy, there are relatively more jobs in green sectors such as recycling, transportation, manufacturing and building.
Table E-1 Top Ten Metropolitan Regions, Ranked by Green Jobs in 2008
Region
Green Jobs, 1990
Green Jobs, 2008
AAGR 1990-2008
Los Angeles 38,354 39,875 0.2% East Bay 23,312 30,876 1.6% San Diego 11,691 18,220 2.5% Orange County 9,151 13,551 2.2% Riverside-San Bernardino
6,818 11,781 3.1%
San Francisco-San Mateo-Marin
9,880 11,352 0.8%
Sacramento 4,544 8,834 3.8% Silicon Valley 4,151 6,121 2.2% Upper San Joaquin 1,716 3,015 3.2% Fresno 1,555 2,427 2.5% Statewide Total 122,994 163,616 1.6%

ix
Within California, green employment is concentrated in large metropolitan areas, with the top five regions garnering 70 percent of green jobs (Table E-1). Los Angeles leads the group with 39,875 jobs—with large concentrations of green transportation, recycling, and manufacturing—while the East Bay is second with 30,876 in 2008, a large portion of which are connected to the energy research sector led by Lawrence Berkeley, Sandia, and Livermore National Labs.
Despite this concentration, green job growth was higher in non-coastal metro regions such as Riverside and Sacramento. Also, although Silicon Valley has a large number of overall jobs in the State and remains a hotbed of innovation, this region ranks only 7th in terms of the number of green jobs. This is suggestive of a weak link between job growth and innovation; an issue we take up in more detail in Chapter 4. E.3 Defining and Measuring Innovation
In Chapter 3, we present a critical review of the literature on innovation and discuss the strengths and weaknesses of this work for our analysis of the green economy. To summarize, despite its recognized importance, the concept of innovation remains elusive and is often the subject of misinterpretation. Innovation is commonly associated with the capacity to develop new ideas or scientific discoveries. But for a good, service, or process to be considered an innovation it needs not only to be new or significantly different from whatever already exists, but also to be successfully introduced into the marketplace or
implemented into a production process. It is the realization of commercial value in the marketplace that distinguishes an innovation from an invention and an entrepreneur from an inventor. The knowledge, capabilities, skills, resources and attitudes required to realize commercial value out of a new idea are fundamentally different from the ones required to conceive it. For instance, the innovating person or organization may require production knowledge, skills and facilities, market knowledge, a well-functioning distribution system, sufficient financial resources, and so on.
We define innovation in this study as:
the implementation of a new or significantly improved product (good or service), or process, a new marketing method, or a new organizational method in business practices, workplace organization or external relations for the purpose of creating new value for customers and financial returns for the firm.
Under this definition, innovation activities are all scientific, technological, organizational, financial and commercial steps which actually, or are intended to, lead to the implementation of innovations.2
This definition goes beyond knowledge creation (invention) and emphasizes the many additional factors that drive the transformation of knowledge into value for society.

x
To provide an overview of recent innovation in the green economy we analyze data from a wide variety of data sources (see Chapter 3 for a full discussion) and document the spatial concentration of innovation within and across California’s metropolitan regions. Across each of our five measures of green innovation—patents, venture capital investments, SBIR and STTR grants, startups, and gazelles —we find that green innovation makes up a relatively small share of overall innovation taking place in California. However, there is evidence that clean technologies are rapidly increasing as a share of overall innovative activity. Based on these quantitative measures of innovation alone, it would be wrong to conclude that green innovation is not important for either the state’s environmental goals or for jump-starting job growth in an emerging industry. Rather these metrics point out that, while small in absolute terms, innovation is occurring in California’s green economy and that the state does posses the fundamental capacity to continue to innovate in this area.
However, as was the case in other innovative sectors (e.g., information technology and biotech), innovation in the green economy is highly concentrated in a select group of larger, coastal metropolitan regions (Table E-2). For example, Silicon Valley garnered 31% of total clean tech venture capital investments and 36% of overall VC in California. Los Angeles, the East Bay and San Diego also have large concentrations of other measures of cleantech innovation including patents, SBIR/STTR grants, firm startups, and green gazelles. Outside of these large, innovative regions, there is very little innovative activity—that can be measured with these broad metrics.
Because of our primary focus on innovation, we selected the top four innovative regions in the state for an in-depth surveys and case studies, which were conveniently grouped into pairs: two from the San Francisco Bay Area (the East Bay and Silicon Valley), and two from Southern California (Los Angeles and San Diego). We also chose two non-
Table E-2 Top Ten Metropolitan Regions, Ranked by Green/Cleantech Innovation 2000-2008
Clean-tech
% of State
Clean-tech
Clean-tech VC Funds
% of Clean-
tech VC
Clean-tech
Grants
% of State
Clean-tech
Total Green
Start-ups
% of State Green
Start-ups Green
Gazelles
% of State
Green Gazelles Overall
Clean-Tech
Los Angeles County 280 26.6 $404 15.0 15.5$ 33.2 1876 25.9 774 21.2 2 1Silicon Valley 245 23.2 $827 30.7 5.2$ 11.0 315 4.4 168 4.6 1 2East Bay 211 20.0 $441 16.4 1.5$ 3.2 605 8.4 415 11.4 6 3San Diego County 97 9.2 $130 4.8 8.3$ 17.8 622 8.6 330 9.0 3 4Orange County 66 6.3 $154 5.7 6.1$ 12.9 667 9.2 394 10.8 5 5SF-SM-Marin 48 4.6 $433 16.1 1.3$ 2.8 416 5.8 203 5.6 4 6Sacto-Ard.-Arc.-Roseville 30 2.8 $7 0.3 0.6$ 1.3 500 6.9 259 7.1 8 7Inland Empire 14 1.3 $0 0.0 -$ 0.0 704 9.7 266 7.3 7 8Sta Barbara-Sta Maria-Gol. 22 2.1 $1 0.0 2.9$ 6.1 100 1.4 51 1.4 10 9Oxnard-Thsnd Oaks-Vent. 3 0.3 $0 0.0 2.9$ 6.3 165 2.3 88 2.4 9 10
RankingPatent Activity,
2000-08
MSA Name
Investments 2000-
08 ($millions)SBIR/STTR Grants,
2000-08 ($millions)Green Startups,
2000-07Green Gazelles,
2008

xi
coastal regions from the distressed region group, Riverside-San Bernardino (the Inland Empire) and the Upper San Joaquin Valley (Merced, Stockton and Stanislaus counties). We selected these two because they had a certain minimum amount of employment across the different industry sectors. Although innovation levels are low in these metros (and distressed regions generally), it is important to include such cases in order to determine whether green innovation differs from traditional innovation in some way: Is it more likely to level the playing field? We turn to this question in more detail in Chapters 6 and 7.
E.4 The Decision to Innovate: Evidence From a Survey of Green and Traditional Firms.
We conducted surveys of 344 firms identified as “green,” 194 traditional firms, and 63 firms from the Environmental Protection Agency Toxic Release Inventory (TRI). Questions addressed both product and process innovation, as well as firm location and networking characteristics. The survey results show how broadly green innovation is spread throughout the economy. Innovation occurs in firms that are part of green industries but also occurs within large traditional firms and as part of the adaptation to environmental requirements by firms being monitored for toxic releases. Statistical analysis shows that new green products and services are more likely to come from green companies, especially those in manufacturing and in architecture, engineering and design. In contrast, process innovation is more
likely to occur in recycling firms, but also in TRI firms. Indeed, green firms are no more likely than traditional or TRI firms to make use of green practices in their operations. Cost, lack of demand from customers, and lack of information are, in that order, the main barriers to incorporating green practices, but firms that have made the investment in green practices are more likely to develop new green processes as well.
In addition to innovation, the survey addressed factors that influence firm location choice and growth prospects. Both the statistical models and the broader questions overwhelmingly pointed to the local embeddedness of green businesses. Green businesses, and particularly innovative businesses, are largely oriented to serve local markets. Local market orientation is also an important factor in innovation of green products and services.
Photo: Rubbersidewalks, Inc., rubber sidewalk installation, http://www.rubbersidewalks.com/
Although networks were not significant in the models of innovation, green businesses report making greater use of several types of local networks compared to other firms, including local nonprofits, local government, and similar businesses in the local area. Green innovative firms
xii
rely on local networks more than do other green firms. The importance of local assets varied by sector within the group of green industry respondents. In particular, across all green firms, contact frequency with universities and research labs is relatively low for both innovative and non-innovative green firms, suggesting that green product innovation is more likely to derive from frequent interaction with local and regional-based actors (non-profits, businesses, trade associations, chamber of commerce and local governments) than from frequent interaction with universities and/or research institutions. However, interactions with local universities and research organizations are of much greater importance to energy research firms.
Responses among all firms regarding location preferences were consistent with other firm location studies. The three primary factors mentioned, across firms, were the local market for the firm’s product or service, the executive’s place of residence (of particular importance for small firms), and the quality of life. The distinction between small and large green firms is significant and should be considered in planning any local economic development or support strategy. Smaller firms are characterized by a focus on the local market, and many choose a location close to the executive’s residence, while larger firms are more focused on the labor market and on access to financial capital in making a location choice. Green firms show more interest in using outside training, particularly certificate programs, than did other types of firms, another
opportunity for economic development strategies. The survey results also highlighted potential new policy directions for encouraging the growth of green businesses. Because of the local nature of many firms, there was wide agreement among respondents that standardization of policies across localities could ease the growth of the industry.
Distinctions between green firms and other types of firms were most striking in terms of the attitude towards a California location and towards public policy questions. Some respondents emphasized the California focus on environmental quality as a benefit to operating a green business in the area. Of the firms responding to the question of location choice should they move, two thirds of green firms would maintain a California location, as compared to one third of traditional firms and one sixth of TRI firms. When specific policies were discussed, green firms were much more likely to see new regulations and the taxation system (through incentives) as an opportunity, while traditional and TRI firms focused on the regulatory impacts of these policies on firm operations. This was reflected in the attitude toward AB32 as well.
E.5 Regional Case Study Findings
The six case study regions seem to be following three distinct paths in cleantech innovation and the green economy. Each path will likely lead to new innovation and economic growth, should current patterns continue.

xiii
The Innovation Stars The clear leaders in cleantech innovation are Silicon Valley and San Diego. San Diego trails Silicon Valley by a large margin in the composite innovation index, but it dominates product innovation (according to the survey). It has transformed its economy several times in recent decades, and local firms value its high quality of life and are optimistic about their prospects. Despite having a smaller green economy than some of the other regions, San Diego offers a high level of diversity across green sectors, balanced between services and manufacturing. Green transportation and recycling/remediation are growing particularly fast. Local firms compete globally, interacting with partners and suppliers nationally and internationally, and serving global markets. Its green innovation network is highly centralized and interconnected, suggesting a high degree of leadership and information flow.
Due to its local expertise, financial capital, labor pool and institutions, as well as excess capacity in manufacturing, Silicon Valley is a green innovation leader in California. Its small firms are particularly competitive in green building and manufacturing, and are growing quickly in green transportation and energy research. Of all regions, Silicon Valley’s firms are the most highly networked, particularly with other firms, trade associations, and nonprofits. Unlike regions following other paths, Silicon Valley couples local and global reach in terms of its competitors, partners, and suppliers. More than any other segment, local household markets
drive its green economy. Even more than San Diego’s network, Silicon Valley’s is dense, interconnected, and centralized, particularly around the several intermediaries that serve as green business conveners.
Though both San Diego and Silicon Valley concentrate cleantech innovation within their borders, neither yet dominate cleantech the way they do innovation overall. In a sense, they are coasting on their innovation laurels, benefiting from previous rounds of investment in an innovation infrastructure. Yet given their capacity for innovation and growth, it would not be surprising to see them both gain increasing shares of the cleantech and green markets over time.
The Green Economy Giants The all-around leaders of California’s green economy are Los Angeles and the East Bay. Los Angeles has almost as many jobs as the #3-5 regions combined (Orange County, San Diego, and Riverside-San Bernardino), and the East Bay has almost as many jobs as #5-7 combined (Riverside-San Bernardino, San Francisco-San Mateo-Marin, and Sacramento). Both regions are far more innovative in cleantech than they are generally, and when innovation is standardized by the size of the economy, then the East Bay ranks second only to Silicon Valley.
Los Angeles dominates cleantech innovation and the green economy due to its sheer size. City and county government policy and procurement can have a tremendous impact on energy

xiv
consumption. The vast research infrastructure, both in the form of universities and private R&D, makes it the leading region for cleantech idea generation. Los Angeles has a diverse green economy, dominated by large firms in transportation and manufacturing, with rapid growth in energy research and services. Local firms depend on local household markets, partners, and suppliers. Growth has slowed in recent years, making some firms pessimistic about the future. The regional network is high density, but has low connectivity: there are many centers of activity but not much interaction between them.
The East Bay is playing a new lead role in the green economy, particularly in biofuels and other alternative fuels. Of all regions, it has the best balance of idea generation, development, and commercialization. Its size stems from the presence of UC-Berkeley and two national labs, which make it highly specialized in energy research. The environmental services sector is the region’s fastest growing, while it is not competing well for green manufacturing. Firms are relatively rooted due in part to their appreciation of the local quality of life. They also work closely with local suppliers, partners, and household markets. However, compared to other regions, there is little interaction between firms and intermediaries such as nonprofits, trade associations, and chambers of commerce. Although the regional network is very dense (actors interact with many others), it has poor connectivity among different portions of the network, and no central point of
focus. Information does not flow easily and there is little leadership.
Thus, Los Angeles and the East Bay are likely to continue dominating California’s green economy due to their extensive assets and industry structure. However, their growth is slowing, and other regions not highlighted in this study may begin to catch up. In particular, the San Francisco-San Mateo-Marin metropolitan area, Orange County, and Sacramento County have similar profiles to these green giants and are likely to perform well in the future. The Rapid Green Growth Periphery Although the bulk of cleantech innovation and green economy jobs are located in the top four regions, many California regions are benefiting from the spillover of the green economy from these areas. State and local regulation plays a role here in leveling the playing field: firms may move out to more peripheral areas in order to lower costs, while many local businesses seem to be changing the way they operate in order to comply with environmental regulation.
With its strengths in manufacturing, construction, logistics, and natural resources, the Inland Empire has been well positioned to capture growth in the green economy. It has a disproportionate share of green startups and gazelles, as well as the firms engaging in process innovation. The region specializes in manufacturing and recycling, and is one of the state’s fastest growing regions in all sectors except energy. Its competitors and suppliers tend to be all over

xv
California, rather than local. Local firms are generally optimistic, despite the recent economic downturn and the lack of a supportive regional culture. The regional green innovation network resembles that of San Diego and Silicon Valley, with high density and connectivity. However, apart from a center of green activity in Riverside, there is little leadership, and much distance between stakeholders in different parts of this extensive region.
Though the scale of its green economy is very small, the Upper San Joaquin Valley is the fastest growing of all six regions in all of the sectors, with an average annual growth rate of 3.2 percent. Environmental regulation has proved challenging for local firms to cope with, given the extent of local environmental issues and the cost of complying. Yet in some cases, it has made economic sense to innovate new processes, and recycling and manufacturing have grown as a result. Local firms are highly rooted, serving local markets and interacting with local suppliers and partners (as well as those around California). Despite lacking a supportive culture for green innovation, the Upper San Joaquin Valley offers a promising future for its green sectors. E.6 Policies to Promote Innovation in the Green Economy
Recent trends in innovation policy bode well for green innovation. Government support for R&D and the research infrastructure is shifting to a more collaborative approach, emphasizing public/private partnerships, multidisciplinary projects, and open
innovation.3
State funders in particular are demanding more accountability. To obtain R&D funding, researchers may have to show that they have obtained matching venture capital funds and are on the way to commercialization. Or, government programs may give preference to innovation related to quality of life issues that are of prominent public concern.
But innovating the green economy also suggests that a slightly different set of policies might be added to the traditional strategies of investment in R&D and talent. There is scope for measures that take already developed innovations (such as wind and solar technologies) along the next step to commercialization. An innovation policy to support the green economy might best focus on four areas -- regulation and standards, business incentives, market building, and networking – while also continuing to invest heavily in the more traditional strategies to support talent and R&D. These policy approaches, particularly market building, are likely not only to foster innovation, but also to create some firm and job growth. Local government matters to cleantech innovation, particularly its commercialization, as well as to the green economy more generally; local climate action plans, building codes, financing schemes, and procurement can all help build a market for green products and processes. Thus, the more proactive local governments will likely emerge as the winners, at least initially, in the green economy. But the state remains the most important actor in promulgating cleantech innovation and green economy

xvi
growth. State regulation is helping to level the playing field across California regions; without it, we would unlikely see the relatively high levels of green job growth that have occurred in the Inland Empire and Upper San Joaquin Valley.
Photo : REC Solar, Inc., San Luis Obispo solar panel installation, http://www.recsolar.com

1
Chapter 1. Introduction
Researchers and policymakers have long recognized innovation–or the implementation of a new product, process, or marketing method for the purpose of creating new value—as a fundamental factor in the promotion of economic development. As firms face rising levels of uncertainty due to global competition, technological advances, and rapidly changing consumer tastes, they seek the capacity to innovate quickly in response. The capacity to innovate on an ongoing basis thus becomes crucial to the fate of firms, regions, and even countries. Because this capacity stems from the interaction of multiple actors and institutions--interaction fostered by proximity--regions are the fundamental building blocks of the competitive industry clusters that fuel the innovative economy.
Regional competitiveness comes from a collective process of experimentation, learning, and innovation, which help regions adapt to fast-changing markets and technologies.4 This collective process might best be understood as a regional innovation system, a system in which firms and other organizations (such as research institutes, universities, technology associations, chambers of commerce, banks, and economic development agencies), as well as their specialized workforces, are systematically engaged in interactive learning through an institutional milieu characterized by embeddedness in a particular region.5 These actors rely heavily on tacit knowledge, which is
difficult to exchange over long distances.6 Evidence of this in the world of practice is the emergence of public-private collaboratives, such as the Joint Venture: Silicon Valley Network, that pursue regional resilience by facilitating interaction of regional actors.7
One regional innovation system – partly emergent, partly long-established -- encompasses the green economy. At its most basic level, the green economy consists of economic activity that reduces energy use and/or improves environmental quality. It includes the four principal sectors of the clean energy economy: renewable energy and alternative fuels (e.g. solar, wind, geothermal, biofuels); green building and energy efficiency technology; energy efficient infrastructure and transportation; and recycling and waste-to-energy. But the green economy is not just about the ability to produce clean
Photo: Recycled pavement processes, www.condorearth.com

2
energy, but also the growing market for products that consume less energy, from fluorescent lightbulbs to organic and locally produced food. It also encompasses economic sectors that improve the environment, for instance toxic site remediation or design of more compact cities. With an emerging consensus about the impacts of global climate change, there is new enthusiasm among governments, industries, nonprofits, and individual consumers for green processes and products.8
This report investigates innovation in the green economy in California – and in so doing fills a large gap in the literature. Economists and planners have had little experience in measuring economic activity – let alone innovation -- in this nascent economic arena. Yet, by many accounts, the green economy and the cleantech innovation driving it will transform both production and consumption in the near future, pull the country out of recession, and drive future job growth over the long term. In other words, green innovation may be part of the next long wave of innovation, such as a Kondratieff wave, a 50-year cycle of transformation in the mode of production.
California is a near ideal laboratory for the study of regional innovation systems for three reasons. First, it hosts perhaps the most famous innovative milieu on the planet, Silicon Valley, a region that continues to generate lessons in innovation for regions throughout the world. Second, it has an entrepreneurial state government with some of the most stringent new climate change legislation
in the country, which has spurred the largest concentration of green innovation in the country.9
For instance, in 2006 the California Assembly passed AB32, the California Global Warming Solutions Act, which establishes the first comprehensive program of regulatory and market mechanisms to reduce greenhouse gases. Third, its regions, which include 34 metropolitan areas, range from some of the most affluent (e.g., San Francisco) to the most distressed (e.g., Imperial County) in the country. Thus, looking at California allows us to study how different types of regions, with different levels of resources, innovate under the same state economic development climate.
This report describes green and cleantech innovation across California, based upon economic data from secondary sources, surveys of almost 650 businesses, and interviews with almost 100 regional innovation system actors. As shown by previous research, such as the U.S. Economic Development Administration’s Measuring Regional Innovation report, using a mixed-methods approach is important to capture both the regional innovation inputs (assets, networks, and attitudes) and outputs (innovation, productivity, and prosperity); quantitative measures fall short particularly in measuring inputs such as regional networks and culture.10 Our in-depth analyses focus on the green innovation process in six diverse regions: Los Angeles, Riverside-San Bernardino, San Diego, Silicon Valley, the East Bay (of the San Francisco Bay Area), and the Upper San Joaquin Valley (the northern

3
part of the Central Valley from Merced to Stockton).
As in previous studies of innovation, we find that cleantech and green innovation is highly concentrated in California’s larger metropolitan regions where its research universities are located. Yet, the green innovation story is not simply about technology transfer and agglomeration economies. Though there has been a recent surge in idea generation and development related to cleantech (e.g., as evidenced by venture capital funding and patents), most innovation activity is focused on commercialization of existing or recently invented technologies. In the green economy, commercializing a technology – whether a new product or service – occurs most effectively through building a local market, and in turn, building strong network connections with competitors, suppliers, partners, intermediary organizations, and government, which can help lead to more exports. This focus on markets creates a more level playing field, since more distressed regions lacking a major university can still compete in the green economy by incentivizing local markets.
The next chapter defines the green economy and provides an overview of our methodological approach to understanding innovation within it. Chapter 3 surveys the academic and applied literature on innovation to help build a framework for understanding green innovation. Based upon innovation measures identified in Chapter 3, Chapter 4 analyzes the extent
of innovation across California, finding that it is highly concentrated in about less than ¼ of the state’s 34 metropolitan areas. Chapter 5 presents the findings from our survey of businesses (including both green businesses and comparison samples of traditional businesses), showing how innovative green businesses in particular rely on local markets. Chapter 6 examines the green economy, networks, and innovation in six regions in more depth. Chapter 7 concludes with policy implications for local, state, and federal policy.
Photo: Envitech Industrial Gas Cleaning Systems, industrial gas cleaning system, http://www.envitechinc.com/

4
Chapter 2. Understanding the Green Economy and Innovation
2.1 Overview of the Green Economy
Defined as economic activity that reduces energy consumption and/or improves environmental quality, the green economy encompasses both new and traditional sectors. Innovation in the green economy might thus occur through the creation of new products, the transformation of production processes, or the development of new markets. Energy provides a simple example. New industries, such as biofuels, may be
innovating new products that reduce dependence on traditional or dirty sources of energy. Traditional industries, such as utilities, may be changing the way they source power, relying more on renewable energy and alternative fuels – i.e., innovating how they produce energy. And individual households might install solar photovoltaic panels, thus joining an emerging market of energy consumers.
Figure 2.1 shows a preliminary conceptualization of the green economy. Based on a review of 25 regional and national reports on the green economy, it lists the 18 different industry sectors considered part of the green economy.11 It also highlights how frequently each
Figure 2.1 Defining the Green Economy

5
industry sector is mentioned in the reports (with the darkest shades representing the sectors cited most frequently).
The map presents the range of green business categories along two axes. The vertical axis shows the range from traditional businesses, such as utilities, and professional services that are greening their operations, to businesses in emerging industries, such as nanotechnology research, solar panel manufacturing and eco-tourism. On the horizontal axis, businesses move from those that produce green products, such as manufacturers and food processors, to those that sell green products or participate in the green lifestyle economy, such as farmer’s markets and local park maintenance operators. Production industries produce goods that can be traded between regions. Lifestyle or consumption businesses are local-serving only. Business categories located in the middle of the horizontal axis contain both production and consumption aspects. Within the green economy, businesses interact with and are influenced by the government agencies, universities, non-profit organizations, unions, utilities and trade associations in the regional innovation system (shown at the bottom of the diagram). Innovation may occur in any industry; however, as we discuss in the next chapter, it is easier to measure and track in some than others. For instance, cleantech R&D may register new patents, a fuel cell manufacturer may commercialize its new product successfully, and green building firms may attract new customers to innovative energy-reducing designs – but only the
patents can be readily tracked. This measurement constraint limits the study of green innovation. 2.2 Measuring the Green Economy
Although it seems that nearly every week brings a new study trumpeting the potential for green jobs, there have been few systematic attempts to measure local or regional economic activity in the green economy. Two notable exceptions are reports by the Pew Charitable Trust (The Clean Energy Economy: Repowering Jobs, Businesses and Investments across America, published in 2009) and the California Economic Strategy Panel (Clean Technology and the Green Economy: Growing Products, Services, Businesses and Jobs in California’s Value Network, published in 2008). Both studies were prepared by Collaborative Economics, which relied upon a private-sector generated time-series database of individual establishments, the National Employment Time-Series database (NETS), that combines annual Dun and Bradstreet entries into a time-series from 1990 through 2007. This database provides detailed data on individual establishments over time, from establishment births (beginning in 1989) through current operations or deaths. It also uses 8-digit Standard Industrial Classification codes (SICs), which provide much more detailed industry information than the 6-digit North American Industrial Classification codes (NAICs) do. For instance, while an 8-digit SIC (17110403) designates Solar Energy Contractors, the corresponding 6-digit NAICS code is much broader, including all Plumbing, Heating, and Air-Conditioning Contractors. SIC code

6
36219909, Windmills, Electric Generating, corresponds to NAICS 335312, Motor and Generator Manufacturing. Thus it is difficult to use the NAICS system to identify the sub-industries specifically engaged in activities that reduce energy consumption or improve environmental quality.
If green economy studies are thus wedded to Dun & Bradstreet, NETS, and similar proprietary data sources, it is important to consider their specific strengths and weaknesses. Because they provide data at the establishment level, rather than a geographic unit of analysis, these sources allow ready analysis of how individual establishments change over time: how they grow and shrink in employees and sales, where they move, and how they change their product lines. Looking specifically at innovation, the data makes it possible to examine adaptation of product lines, startup activity, and gazelles (or firms growing rapidly in sales). The primary weakness of using proprietary data, of course, is that it is costly and only available through private vendors. Another shortcoming is that there is no way to know if a firm is actually green; researchers generally include an industry as green if the 8-dgit SIC seems likely to reduce energy use. For instance some hybrid vehicles might make use of Battery Charging Alternators and Generators (36940100) – but traditional autos may as well. Water Heater Controls (38229917) are used in all types of water heaters, not just energy-efficient heaters. Finally, green firms may classify themselves under a variety of different codes; for instance, California biofuels
firms may be found under SIC 28690400 (Fuels), 49539905 (Recycling, Waste Materials), 36749901 (Fuel Cells, Solid State), and even 52110301 (Energy Conservation Products).
As in previous studies of the green economy, we started with the 8-digit SIC descriptions in the NETS, culling a list of green industries slightly more extensive than that used in previous studies. To the resultant NETS database of California businesses, we added lists of green businesses obtained from local cluster initiatives, city and county green certification programs, and the statewide green building trade association, Build It Green. We manually excluded businesses that are green certified for vanity reasons, rather than because of product or process (for instance, national banks that recycle paper). Next, we linked these businesses to the NETS database to determine their 8-digit SIC code. We then added these new SIC codes to our initial list, using them to identify more green businesses in the NETS in an iterative process.
In some cases, we excluded the new SIC codes identified through this inductive process. Many self-identified green businesses classify themselves under traditional industry codes. For instance, a large number of green building firms list themselves under SIC 15210100, Single-Family Home Remodeling, Additions, and Repairs. However, thousands of other, non-green businesses also classify themselves under this SIC. In cases like this, where the green firms are likely swamped by the traditional, we did not include the SIC.

7
As a result of this intensive culling process, our list of SICs related to the green economy includes 194 different industries, rather than 75 as in previous studies (see list in Appendix 1). We organized these industries into six sectors: green building, energy research and services, environmental services (including a variety of firms from environmental consultants to hazardous waste testing), recycling and remediation, green manufacturing (directly related to the improving the environment or reducing energy consumption, such as water filters and thermostats, rather than the manufacture of green products such as organic food), and green transportation (transit, electric vehicles, and non-motorized transport). This classification system includes the most-cited green economy sectors from Figure 2.1 (such as cleantech R&D and manufacturing, energy and utilities, green building, waste management, chemistry and materials, transportation, and environmental services). However, it is not readily possible to measure systematically many of the traditional sectors that are greening their production process or developing a new green market niche (e.g., green manufacturing, sustainable food processing, business and other services, urban goods movement systems, ecotourism, organic gardening, ecosystem/park management, retail, and repair and cleaning services).
2.3 Measuring Green Innovation
Little is known about the patterns and processes of innovation in the green economy, although much cleantech
innovation (e.g., wind and solar) occurred decades ago. One exception is the 2009 Green Innovation Index prepared by Collaborative Economics for Next10, a non-profit research organization based in Palo Alto.12
While there are a few innovation measures that this report and the Next Ten index share in common (e.g. patents and venture capital funding), our report differs as it adds additional innovation measures and disaggregates innovation by metropolitan region in California. In addition, we examine the link between measured innovation in the green economy and the growth of economic activity (e.g. new jobs and new business establishments).
In order to assess the level and characteristics of innovation in regions, we used a model from the Measuring Regional Innovation report that divides the innovation process into three interrelated phases: idea generation, idea development, and commercialization. We used data on cleantech patents to represent idea generation; Small Business Innovation Research Grants, Small Business Technology Transfer Grants, venture capital, and green startups to reflect idea development; and gazelles to represent commercialization. Chapter 4 discusses each of these data sources in more detail. To create a green innovation ranking for California regions, we created a composite index that weighted each of these three components of the innovation process as one-third of the total.

8
2.4 Triangulating with primary data: Surveys and interviews
The 2005 Measuring Regional Innovation report (discussed further in the next chapter), argues that in order to understand the relationship between innovation and economic development at the regional scale, researchers must not only examine metrics of regional innovation inputs and outputs, but also augment this approach with regional business surveys and interviews. Only through the qualitative research approach is it possible to understand the workings of the regional innovation system and the economic development potential of innovation.
Business survey
For this study, we conducted a business survey that focused on six study regions: Los Angeles, San Diego, Silicon Valley, the East Bay, the Inland Empire (Riverside and San Bernardino counties), and the Upper San Joaquin Valley, a three-county region extending from Stockton to Merced. These regions were selected to represent California’s four most innovative green regions, along with two distressed regions typical of California’s Central Valley (see Chapter 4). As it happened, due to inaccuracies in address, about 15% of our respondent sample actually came from outside these six regions, mostly from adjacent metropolitan areas such as San Francisco and Orange County. Thus the survey represents, broadly, California’s largest metropolitan areas as well as its inland valley, but likely underrepresents its coastal areas, mountain regions, and the far northern counties.
The survey consisted of three separate samples: green businesses, traditional businesses, and businesses listed in the U.S. Environmental Protection Agency’s Toxic Release Inventory (that emit significant amounts of greenhouse gases other than carbon dioxide). To develop the green survey sample, we began with a list of green establishments from the NETS (8-digit SIC code-based definition). We started by selecting all establishments that were active in 2007, the most recent year available in the NETS, with 5 or more employees. This narrowed the universe to 1,921 unique establishments, which were then linked to the OneSource database in order to obtain more detailed contract information. We then added 1,291 records from the Build it Green database of certified green businesses in California. We gathered email addresses for each record through web searching, obtaining information for 1,513 (35.4%) of the universe of green businesses.
For the traditional business survey, we developed a parallel or matched set of businesses not identified as green: for instance, we sampled a variety of regular construction and manufacturing firms, as well as other traditional sectors likely to be affected by environmental regulations, such as transportation and agriculture. We used a stratified random sampling procedure to select the businesses.
The Toxic Release Inventory (TRI) sample came from the EPA’s 2009 release, which includes facility public contact information. We sent the survey to the

9
full sample of businesses with email addresses available or readily obtainable.
All of the survey instruments followed the same structure (see Appendix 2):
• Consent to participate • Background information • Regional competitiveness • Orientation towards green activities • Impact of AB32 and Stimulus Plan
for non-green biz • Identification of green practices • Innovation • Training • Networks • Frequency of interactions • Thank you
However, the green businesses were asked more questions about their green practices, their professional networks and green practices support, and what attracted them to their current location. Green businesses were asked a total of 34 questions, while the traditional and toxic businesses were asked 29 questions. In addition to multiple-choice responses, both surveys provided extensive opportunities for open-ended responses.
A combination of email invitations, postcards and follow up phone calls were used to maximize the survey response rate. The principal method for survey collection, however, was the same for each of the three distribution types: an online survey tool, Surveymonkey.com. Each respondent was contacted three times over a period of three weeks, many through mixed modes. The entire survey took place over the course of three months, from April 15 until July 15, 2009.
A total of 5,273 businesses were emailed and asked to participate in the survey. In an effort to increase the response rate among green businesses while diversifying the survey sample, postcards invitations were sent to 2,382 additional businesses. Follow-up telephone phone calls were the last effort made to encourage businesses and organizations to participate in the survey. This method was targeted only at green businesses and in total, 273 businesses were called.
In total, 7,655 various businesses and organizations were surveyed for their thoughts and experiences regarding their region’s green economy. Of these, 369 surveys were either returned or not delivered. These businesses were removed from the total and create the survey universe (N), 7,286 businesses. Among these, 649 different businesses responded, for a total response rate of 8.9%. The email distribution method was by far the most effective, generating a 15.8% response rate from the green businesses. The TRI businesses were also surprisingly willing to participate. Toxic businesses had a 13.6% response rate. Traditional businesses had a 7.3% response rate. The postcard and telephone methods were substantially less successful, with response rates of 5.0 and 3.8%, respectively.
Environmental Services or Consulting (25.5.%) was the largest industry represented among green businesses, followed by Construction (22.8%) and Architecture and Engineering (14.7%). Many of the construction firms in the green businesses survey are engaged in

10
residential construction with an emphasis on green building practices. The architecture, engineering, or design firms represented in the green survey have similar green design focuses. In both the traditional and TRI respondent samples, the largest sector was manufacturing.
Interviews
Finally, we conducted 98 interviews across the six regions we targeted. Interview respondents came from government, nonprofit intermediaries (such as cluster initiatives), trade associations, thinktanks, and chambers of commerce, and also included one or two major firms in each region. Interviews were in-person and semi-structured, with open-ended questions asked in an order that followed the flow of the conversation (see Appendix 2 for interview protocol). Interviewers (teams of student enrolled in a spring studio, along with six project graduate student researchers) asked respondents about the competitiveness of their region’s green economy, its market demand and regulation, the sources of green innovation, their region’s assets, and the extent of local networks and relationships. Respondents were asked to name the five people they interact with most frequently with regards to the green economy, and the answers were coded and analyzed using the UCINET network analysis software.
Photo: Ben Shepard, Sky WindPower Corporation, www.skywindpower.com

11
Chapter 3. Overview of Innovation and the Green Economy
3.1 The Central Role of Innovation in Competition and Economic Development
Innovation is not a new phenomenon. As some scholars have argued, there seems to be something inherently “human” about the tendency to think about new and better ways of doing things and to try them out in practice.13
Just as the introduction of agriculture, the wheel, or the alphabet reflects our capacity to innovate, so does, more recently, the introduction of the Internet and now, clean energy technology.
But despite its prevalence, innovation has not always received the attention it deserves from either academics or policymakers. While the fundamental role of innovation as driver of economic development was recognized in economic theory as early as 1934 by Joseph Schumpeter, the dominant economic theories of the 20th century treated innovation as a “residual” factor and emphasized the role of resources--land, labor, and capital--in the analysis of long-term economic growth.14
Micro economists simply assumed innovation as readily available to any firm and treated it as an exogenous factor in their supply-demand equilibrium models. Policymakers, in turn, have until recently primarily focused on the workings of the market and creating a favorable environment for investment without much attention on how innovation occurs
and what factors promote its development.
This is now changing, as innovation is discovered anew by researchers and civic actors alike. For the last three decades, scholars have revisited and expanded Schumpeter’s insights on the “creative destruction” that revolutionizes the economic structure from within, incessantly destroying the old one and creating a new one.15 In parallel, policymakers have increasingly recognized the fundamental role played by innovation, to the point where the National Innovation Initiative, a coalition of U.S. leaders from both the public and private sector, recently concluded that “innovation will be the single most important factor in determining America’s success through the 21st century.”16 Similarly, a report published by the National Governor’s Association, Innovation America, recognizes that “United States economic growth in the 21st century will be driven by our nation’s ability to innovate.”17
But why is innovation so fundamental to economic development? In a world in which many nations have embraced market economies and can compete on traditional cost and quality terms, it is innovation – the ability to create new value – that will differentiate 21st century economies. Furthermore, many observers of the U.S. economy suggest it is falling behind in building a knowledge-based economy. In addition to other advanced economies, many formerly ‘underdeveloped’ countries are now competing in knowledge-intensive

12
industries previously considered to be safe from international competition.18 Among the relatively few certainties in today’s rapidly changing markets is that firms must be competitive to survive and competition is increasingly reliant on innovation.19
Successful innovation results in new goods and services, gives rise to new markets, generates growth for enterprises, and creates customer value. Innovation improves existing goods and processes, thereby contributing to higher productivity, lower costs, increased profits and, sometimes, higher wages or employment. Firms that innovate have higher global market share, higher growth rates, higher profitability and higher market valuations. Innovation also generates spillover and cascading effects as competing firms absorb new innovations. Consumers of innovative products and services gain benefits in terms of more choices, better services and lower prices. As innovations are adopted and diffused, the ‘knowledge stock’ of the nation accumulates, providing the foundation for productivity growth, long-term wealth creation and higher living standards.20
Innovation, then, benefits individual firms and fosters national prosperity. However, the path from innovation to regional economic development – i.e., creating new economic activity in the form of jobs and income that benefit a particular region and its residents -- is less clear. That innovation leads to economic growth (in terms of productivity and jobs) is well established
at the national level.21 But researchers and policymakers seem to have adopted this finding uncritically for regions as well, though there is no reason to believe an individual region can capture the benefits of innovation, at least during the short-term. For instance, it is often in the interest of transnational corporations to co-opt innovation in smaller firms and send product development and production to regions with lower labor costs.22
We will examine the relationship between innovation and job growth in more detail in Chapter 4.
3.2 Defining Innovation
Despite its recognized importance, the concept of innovation remains elusive and is often the subject of misinterpretation. Innovation is commonly associated with the capacity to develop new ideas or scientific discoveries. But for a good, service, or process to be considered an innovation it needs not only to be new or significantly different from whatever already exists, but also to be successfully introduced into production and the marketplace. It is the realization of commercial value in the marketplace that distinguishes an innovation from an invention. Based on that distinction, Joseph Schumpeter also differentiated between inventors and entrepreneurs, since the knowledge, capabilities, skills, resources and attitudes required to realize commercial value out of a new idea are fundamentally different from the ones required to conceive it.23 Innovation may require production knowledge, skills and facilities, market knowledge, a well-functioning distribution system, sufficient financial resources, and so on.

13
We define innovation in this study as:
the implementation of a new or significantly improved product (good or service) or process, a new marketing method, or a new organizational system in business practices, workplace organization or external relations for the purpose of creating new value for customers and financial returns for the firm.
Under this definition, innovation activities are all scientific, technological, organizational, financial and commercial steps that lead (or are intended to lead) to the implementation of innovations.24
This definition goes beyond knowledge creation (invention) and emphasizes the many additional factors that drive the transformation of knowledge into value for society.
Innovation is the result of an uncertain and cumulative process involving a continuous matching of technologies on the one hand and user needs and market opportunities on the other.25 A perceived market need will be filled only if the technical problems can be solved, and a perceived performance gain will be put into use only if there is a realizable market use. As such, innovation is controlled by two distinct sets of forces that interact with one another in subtle and unpredictable ways. On the one hand are the market forces: such factors as changes in incomes, relative prices, and underlying demographics that combine to produce continual changes in
commercial opportunities for specific categories of innovation (a.k.a. demand pull). On the other hand, the forces of progress at the technological and scientific frontiers often suggest possibilities for fashioning new products, improving the performance of old ones, or producing those products at lower cost (technology push). Successful outcomes in innovation thus require the running of two gauntlets: the commercial and the technological.26
3.3 Determinants of Innovation at the Regional Level
Despite the extensive literature on innovation, there is little agreement on what fosters it and what its impacts are, especially at the regional scale. Most agree that market structure and urban structure are critical determinants of innovation. Market structure – typically measured as the distribution of firm size within the economy – shapes innovation, but the relationship is unclear; large firms may have more capacity to pursue R&D, but small firms have greater flexibility in access to skilled labor.27 The mixed results on firm size and innovation may stem from differences between industries. A study looking at the 4-digit SIC level finds that large firms innovate better in industries that are capital-intensive and highly unionized, while small firms have an advantage in industries that utilize a large share of skilled labor.28 Thus we might expect large green manufacturers, for instance making train cars or solar panels, to be more innovative than small companies, while small firms doing precision manufacturing, such as environmental controls, would also be more innovative.

14
There is also considerable disagreement about the role of urban diversity versus specialization, or urbanization versus localization economies. From the literature on clusters, from Marshallian districts to Porter and beyond, we learn that external economies are associated with specialization, which in turn increases learning and innovation. But others put forth counter-arguments to the specialization/localization perspective, including the structural risk associated with over-specialization, which can actually diminish innovation, and the greater importance of organizational proximity (similarity in size and industry) than geographical proximity.29 Also in favor of the urbanization economy perspective, one recent study found that innovation depends on a large and diverse agglomeration of firms with global connections.30
With traditional urban economic theories unable to explain the rise of innovation, researchers in the past twenty years have focused much more on describing how innovation works than ascertaining its determinants. The debate over industrial districts, agglomeration and clusters has morphed into a (relative) consensus that innovation at the regional level is best captured as a system.
3.4 The Systemic Nature of Innovation
Innovation is the result of an interactive and collective process involving not only multiple types of knowledge, skills, and resources, but also various organizations in both the public and private sector.31 In an economy characterized by increased
levels of technological complexity, rapidly changing markets, and the global distribution of knowledge, an organization cannot rely entirely on its own knowledge and resources but must tap into the assets available in other organizations in order to innovate successfully. Recognizing that innovation is predominantly interactive and therefore, a socially embedded process, scholars now argue that innovation is better captured as a system where multiple actors and institutions interact in the process of production, diffusion and use of new and economically useful knowledge.32
But what are the implications of applying a system perspective to the study of innovation? A system of innovation comprises elements and relationships that interact in the production, diffusion and use of new, and economically useful, knowledge.
Firms may draw on universities and private R&D labs for intellectual property and talent; on the financial resources of venture capitalists, angel networks, and government agencies; on the skills of other firms, consultants and suppliers; and the business savvy of trade associations and other nonprofits. They may even source product development from customers.
33 This leads naturally to a focus on the working of the linkages of the system. Is the potential for
Photo: TireDisposal & Recycling, Inc., www.tiredisposal-recycling.com

15
communication and interaction through existing linkages sufficiently exploited? Are there potential linkages within the system that might profitably be established?34
The systems of innovation framework makes evident that the innovation capabilities of firms rely not only on their internal competences, or even in the nature of the resources they can find in their environment, but in the quality and character of the relationships they can build with other organizations.
The innovation systems framework makes it clear that innovation is not a linear process that unidirectionally proceeds from science to the enterprise and then the marketplace. It calls attention not only the important supply inputs to the innovation process (like R&D investments, talent, venture capital, etc.) but also to the role of market demand and the influence of external factors, especially the policy environment and the common national infrastructure.35
The framework also highlights how cultural and institutional context affects the behavior of organizations and mediates the relationships among the multiple actors of the system.
Within a common systems perspective, scholars have developed different models for the study of innovation. One main approach has focused on the spatial level, and used national or regional borders to distinguish between different systems. For example, the term “National System of Innovation” characterizes the systemic interdependencies within a given country.36 This perspective argues that the national macroeconomic and
regulatory framework –as well as national norms and cultures--fundamentally shapes actors and institutions of the system of innovation, as well as their interactions. In contrast, proponents of Regional Innovation Systems argue that one simply cannot understand innovation properly if one does not appreciate the central role of spatial proximity and concentration in this process.37 This is because the process of innovation relies heavily on tacit knowledge which derives its meaning from the social and institutional context in which it is produced, and therefore, is difficult to exchange over long distances.38
Photo: ClearDome Solar Still Water Purifier/Pasteurizer, www.solarpurewater.com
At the same time, regional embeddedness may impede innovation, as large dowager firms exert power over investment and information flows.39 Innovation operates at multiple levels, and industries differ in how they use global, national, and regional resources in their innovative processes.40
Another influential approach is to delineate systems on the basis of technological, industrial, or sectoral characteristics. This line of research has
16
explored the manner in which industries and sectors differ in terms of their internal dynamics, focusing, in particular, on the differences across sectors in knowledge bases, actors, networks, and institutions.41
An important finding from this research is that, since the factors that influence innovation differ across industries, policy makers have to take such differences into account when designing policies. This obviously calls into question technology or innovation policies that only focused on one mechanism, such as subsidies to R&D.
Common to all these approaches is the goal of exploring the technological dynamics of innovation and how this influences and is influenced by the wider social, institutional, and economic frameworks. But research has been unable to fully explain the determinants of innovation systematically.42 And even if the regional innovation systems concept is used simply as a conceptual tool to enrich our understanding of how innovation occurs, descriptions of the system may mislead by emphasizing certain factors and omitting others. For instance, most of the regional innovation systems literature focuses on how institutions facilitate processes of knowledge spillovers and learning among regional actors but fails to examine the scales of governance, the social or economic systems which they shape, and how scales and systems interrelate.43
Though increasing attention is paid to the role of national regulation, most research ignores the role of local and state policymakers and regulations. Though case studies pay conceptual attention to the role of user-producer
interactions in supporting innovation in regions, there is little description of the specific factors affecting the competitive environment or demand, particularly regulations and incentives affecting the behavior of local households and cities.
3.5 Challenges and Current Efforts in Innovation Measurement
Despite the recognized importance of innovation, both our understanding of innovation processes and current efforts to promote innovation remain largely constrained by the lack of adequate indicators to identify and measure innovation. A recent report to the Secretary of Commerce by the Advisory Committee on Measuring Innovation in the 21st Century recognized that while the American economy is changing in fundamental ways, mostly due to innovation, our understanding of these changes remains incomplete.44 It adds that data collection and measurement loom large in understanding the processes of innovation and the effects they have in the economy. Similarly, in its Innovation Vital Signs Project, the Alliance for Science & Technology Research in America (ASTRA) stresses that the current inventory of indicators and measurement methods does not adequately describe, in a timely manner, the dynamics of innovation today. Innovation policy for the coming century will require new indicators, new data collection and integration methods, and sophisticated visualization tools. These will enable understanding of the more subtle, qualitative and interactive elements of innovation, a greater recognition of service sector innovation,

17
and insight into how the demand for innovation is created.45
This section will analyze some current efforts to measure innovation. It will first discuss the challenges involved in measuring innovation in general and some recent efforts to improve the measurement of innovation dynamics at the national level. It will also analyze some current efforts to identify the regional assets to support innovation and the effects of innovative activities in the regional economy. It will conclude with a discussion of the advantages and limitations of some of the main indicators used to measure innovation.
Why is innovation so difficult to measure? One of the main obstacles is conceptual.46
Measurement implies commensurability: that there is at least some level at which entities are qualitatively similar, so that comparisons can be made in quantitative terms. And innovation, by definition, implies the creation of something qualitatively new, via processes of learning and knowledge building. It involves changing competences and capabilities, and producing qualitatively new performance outcomes. This may lead to new product characteristics that are intrinsically measurable in some way, like improved fuel efficiency. However, such technical measurement comparisons are only rarely meaningful across products. More generally, innovation involves multidimensional novelty in aspects of learning or knowledge organization that are difficult to measure or intrinsically non-measurable. Obstacles to measuring
innovation thus include the underlying conceptualization of the object being measured, the meaning of the measurement concept, and the general feasibility of different types of measurement.
Quite apart from the problem of whether novelty can be measured, a fundamental definitional issue is what we actually mean by ‘new.’47 Does an innovation have to contain a basic new principle that has never been used in the world before, or does it only need to be new to a firm? Does an innovation have to incorporate a radically novel idea, or only an incremental change? In general, what kinds of novelty count as innovation? The understanding of innovation as a complex, uncertain, and interactive process involving different types of knowledge and skills has at least two important implications for indicator development. The first is that novelty implies not just the creation of completely new products or processes, but also relatively small-scale changes in product performance which may--over a long period--have major technological and economic implications. A meaningful innovation indicator should therefore be able to pick up such change. The second is the importance of non-R&D inputs to innovation: design activities, engineering developments and experimentation, training, exploration of markets for new products, etc. So there is a need for input indicators that reflect this input variety and its diverse distributions across activities.48 Another fundamental problem relates to identifying and measuring the assumed systemic character of innovation. In spite of the

18
longstanding acknowledgement of the interactive and collaborative nature of innovative processes, generally available data and indicators are of little help in examining the quality and character of the relationships among the elements of the system and how they affect the performance of the system as a whole.49
Some recent initiatives have tried to address these issues, including some economy-wide efforts that have some degree of international comparability. The most important development has been new survey-based indicators, especially the Community Innovation Survey (CIS) which is widely used in the European Union and has diffused to many other countries, including Canada, Australia, Hungary, Brazil, Argentina, and China. CIS is based on OECD’s Oslo
Manual (2005) which in turn has been informed by ideas from recent innovation research.50 In particular, CIS has been informed by the idea that innovation relies on collaboration and interactive learning, involving other enterprises, organizations, and the science and technology infrastructure. Data gatherers have explored the networking dimension of innovation, and this has been an important conceptual issue in survey design. In the U.S. the work of the aforementioned Advisory Committee on Measuring Innovation in the 21st Century provides important recommendations to improve the stock of available innovation indicators. And in an effort to better understand innovation activities and their impact in the economy, the Bureau of Economic Analysis has expanded its gross domestic product (GDP) accounts
Figure 3.1 ASTRA’s Framework to Analyze the National Innovation System
Source: The Alliance for Science & Technology Research in America (ASTRA) 2007. Innovation Vital Signs, Framework Report.
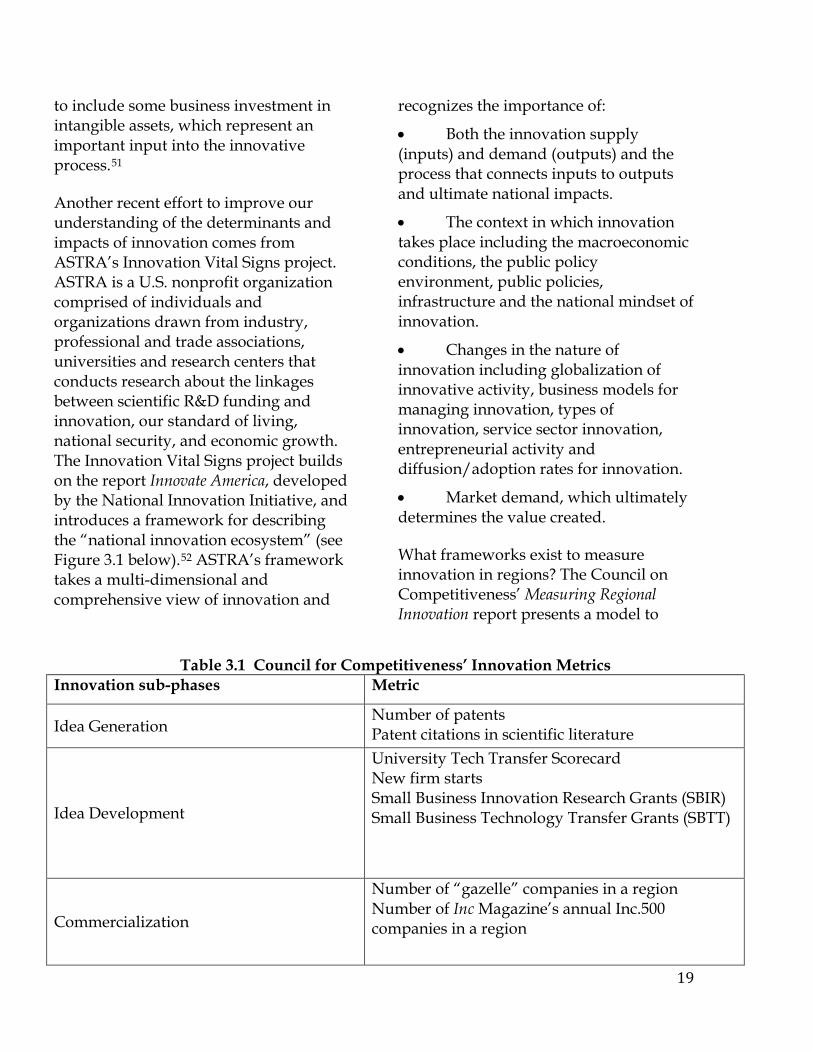
19
to include some business investment in intangible assets, which represent an important input into the innovative process.51
Another recent effort to improve our understanding of the determinants and impacts of innovation comes from ASTRA’s Innovation Vital Signs project. ASTRA is a U.S. nonprofit organization comprised of individuals and organizations drawn from industry, professional and trade associations, universities and research centers that conducts research about the linkages between scientific R&D funding and innovation, our standard of living, national security, and economic growth. The Innovation Vital Signs project builds on the report Innovate America, developed by the National Innovation Initiative, and introduces a framework for describing the “national innovation ecosystem” (see Figure 3.1 below).52
• Both the innovation supply (inputs) and demand (outputs) and the process that connects inputs to outputs and ultimate national impacts.
ASTRA’s framework takes a multi-dimensional and comprehensive view of innovation and
recognizes the importance of:
• The context in which innovation takes place including the macroeconomic conditions, the public policy environment, public policies, infrastructure and the national mindset of innovation.
• Changes in the nature of innovation including globalization of innovative activity, business models for managing innovation, types of innovation, service sector innovation, entrepreneurial activity and diffusion/adoption rates for innovation.
• Market demand, which ultimately determines the value created.
What frameworks exist to measure innovation in regions? The Council on Competitiveness’ Measuring Regional Innovation report presents a model to
Table 3.1 Council for Competitiveness’ Innovation Metrics
Innovation sub-phases Metric
Idea Generation Number of patents Patent citations in scientific literature
Idea Development
University Tech Transfer Scorecard New firm starts Small Business Innovation Research Grants (SBIR) Small Business Technology Transfer Grants (SBTT)
Commercialization
Number of “gazelle” companies in a region Number of Inc Magazine’s annual Inc.500 companies in a region

20
analyze the relationship between innovation and economic development in regions. In this model, innovation leads to productivity and productivity, in turn, leads to prosperity, the ultimate goal of economic development.
According to this report, innovation capacity rests on more than just scientific discovery or idea generation. It is a process that links together regional knowledge, assets, and networks to transform ideas and inventions into new processes, products and services that capture global market share. Successful innovation, and the increased productivity and prosperity that results, is the output of the dynamic interplay of a variety of regional factors. Every region has a different set of assets, networks, and an underlying economic culture that determines its success in supporting innovative firms and people.
Based on this framework, the Measuring Regional Innovation report presents a series of metrics for the assessment of both the regional innovation inputs (assets, networks, and attitudes) and outputs (innovation, productivity, and prosperity). In order to gather the information necessary to carry out this assessment, the report recommends the use of previous reports and available data, and suggests complementing this information with a regional business survey and interviews.
In order to assess the level and characteristics of innovation in regions, the first output in their model, the Measuring Regional Innovation report
proposes to divide the innovation process into three interrelated phases -- idea generation, idea development, and commercialization – each with associated indicators (Table 3.1).
The report concludes that there is no single, correct way to assess a region’s innovativeness. It also recognizes that even the most comprehensive efforts at creating a measurement methodology are hindered by the lack of available information on key topics, including the level of research and development expenditures by private companies, and good measures of internal innovation by established companies.
As discussed earlier, the issues of commensurability and novelty are basic problems for all innovation indicators. Still, there are three main indicators commonly used in innovation analysis: research and development (R&D) data, data on patent applications, and angel and venture capital investment.
R&D Statistics and Indicators
R&D adds to the knowledge base of a country or region and is essential to long-term economic growth. R&D spending at universities creates opportunities for partnerships between education and industry that can significantly benefit retention of companies and talented students. R&D investment by firms and government is also critical for developing innovative new products and services.

21
However, R&D data is always constrained as an innovation indicator by the fact that it measures an input only.53
While R&D investment constitute a fundamental asset to support the innovative capabilities of firms, regions, and countries, R&D data by itself does not tell us anything about the commercial success and economic impact of the inventions resulted from R&D activities. Another fundamental problem of R&D data is that many R&D activities are not accounted as such, particularly in small and medium enterprises. Finally, R&D investment is a limited indicator of innovation since many innovations result from improvements in production processes, organizational arrangements, marketing methods, or business models where little or no formal R&D takes place. Despite these limitations, R&D also has fundamental advantages. These include the long period over which it has been collected, the detailed sub-classifications that are available in many countries and the relatively good harmonization across countries.
The most widely used R&D indicator is the “R&D intensity,” that is, the ratio of R&D expenditure to some measure of output.54 For a firm, it is usually the R&D/Sales ratio. For an industry or a country, it is the ratio of business expenditure on R&D (often known as BERD) to total production or value added. A basic problem of this indicator is that R&D intensity depends on the industrial mix. Since industries vary considerably in their BERD/Production ratios, the aggregate BERD/GDP ratio
may simply be an effect of the fact that industrial structures are different across countries or regions. A country or region with large high-R&D industries will naturally have a higher aggregate BERD/GDP ratio than one with most of its activities in low R&D industries. So-called low-technology industries do not create or access knowledge via direct R&D, and the classification is in effect biased against all industries that employ non-R&D methods of knowledge creation.55
Patent Data
A patent is a public contract between an inventor and a government that grants time-limited monopoly rights to the applicant for the use of a technical invention.56
• Patents are granted for inventive technologies that hold commercial promise.
The patent system gathers detailed information about new technologies into a protracted public record of inventive activity, which is more or less continuous. This gives it striking advantages as an innovation indicator:
• The patent system systematically records important information about these inventions.
• The patent system is an old institution, providing a long history; it is the only innovation indicator extending back over centuries, and this means that it is possible to use patents to explore quantitative issues over very long periods.
• The data is readily available.

22
Of course, patents also have weaknesses, the most notable of which is that they are an indicator of invention rather than innovation: they mark the emergence of a new technical principle, not a commercial innovation. Many patents refer to inventions that are intrinsically of little technological or economic significance. Another weakness of patent data as an innovation indicator is that it misses many non-patented inventions and innovations. Some types of technology are not patentable and a large number of patents are never translated into commercially viable products and processes. And even when patents are translated into commercially viable products and processes, the fact that a patent was developed in a certain country or region does not necessarily means that its commercialization and its economic effects will take place in the same geographical entity.
Angel and Venture Capital Investment
High net-worth individuals and VC firms tend to invest resources locally and thus are key assets for ensuring that entrepreneurs have access to capital. Angel and venture capital investment not only provides financial resources to support the development of new enterprises but also supplies valuable expertise in particular technological fields and in commercialization strategy for budding entrepreneurs. As such, it represents a fundamental asset for a region that wants to support the commercialization of promising new technologies. The limitations of angel and venture capital investment as an indicator of the innovation capabilities of a region
are that, as in the case of R&D investments and patents, it only measures an input to the innovation process. Angel and venture capital investment by itself does not provide an indication of the success of the new enterprises they support at commercializing new technologies. And since this type of investment is usually targeted at emerging technologies with the potential to produce high returns in a short period of time, it does not capture incremental innovations or innovations in fields where returns may have a longer cycle. This indicator also fails to capture innovations carried out in established companies that might finance their activities through other sources.
With these qualifications in mind, these indicators measure key dimensions of the innovation process and taken together provide a good indication of those assets that countries and regions possess to support innovation activities. But in order to get a more detailed assessment of the innovation capabilities of a specific region, these and other widely available quantitative indicators should be used in conjunction with customized surveys as well as with qualitative data obtained from interviews with key informants. A rich understanding of the assets and complex innovation dynamics of a regional economy can best be gained by combining the strengths of different indicators and research methods.57
3.6 Innovation Policy
Recommendations for innovation policy generally focus more on the national than the regional scale, perhaps because many of the policy levers for innovation are

23
most effective when implemented nationally.58 For instance, control of monetary policy, which can affect the cost and availability of capital, is national, as are policies regulating technology transfer (e.g., how fast knowledge can flow from university to lab), monopolies (which can impede new market entrants), intellectual property rights (which can encourage risk-taking and also restrict the entry of competitors), and access to markets (trade tariffs and foreign direct investment regulations). Major new federal policy initiatives, such as health care or homeland security, can also have a significant impact on innovation, for instance through new market demand. Finally, the federal government remains the primary funder of R&D, although both state and private sectors are playing an increasing role.59 The federal government also funds technical assistance to manufacturers, which can help fuel adoption and commercialization of new technologies (e.g., through Centers for Manufacturing Excellence or Manufacturing Extension Programs).60
Despite the pivotal role of the federal government in supporting innovation, policymaking and regulation at other levels of government can make a difference. Local, regional and state policies to foster innovation tend to fall into one of three categories, just as at the national level: supporting talent, creating and maintaining research infrastructure, and providing investment.
In general, the state government devises and funds policies and programs to support talent through the public university, community college, postsecondary training, and K-12 educational systems. However, local and regional areas have some discretion over programming, for instance through local workforce investment boards and community college articulation agreements with local universities. Supporting talent not only means funding access to education and designing appropriate curricula, but also ensuring that the local areas are desirable places to live. 61
This, in turn, requires infrastructure: first, the physical facilities, such as transportation and telecommunications networks, that facilitate access and information flow, but also the policy structures that regulate the environment and incentivize individual households to contribute to a high regional quality of life.
Photo: “Edible Gardens,” BuenoLuna Landscape Design, http://www.buenoluna.com

24
Many different – and often overlooked -- policy initiatives to stimulate innovation can contribute to the local and regional policy infrastructure. Standards, which are typically set at the state level, can help facilitate and stabilize the adoption of platform technologies, which then provides a basis for further innovation. Local and state tax policies can provide incentives for consumers to adopt innovation (e.g., installing solar photovoltaic panels on their rooftops), while the new market demand helps speed up new R&D and commercialization processes. Local and state regulation can affect industry costs and help stimulate innovation. Procurement policies, such as large-scale aggregation of purchasing by local or state governments, can help speed commercialization and also influence design specifications.
Investment is the financial dimension of innovation, including R&D funding, angel networks and venture capital to support new ventures. States have an opportunity to use their R&D investments strategically to leverage more collaboration, and more importantly, projects that commercialize quickly and benefit state quality of life and economic development.62 They can also use tax credit policy to support gaps in venture capital and angel networks; for instance, to remedy the lack of risk capital, they could offer a tax credit for early-stage investments by angel funds in start-up investments.63
The advent of the regional innovation systems model also has policy
implications. A dynamic system has feedbacks, which may serve to reinforce (or weaken) the existing structure/functioning of the system, leading to “lock in” (a stable configuration), a change in orientation, or (eventually) the dissolution of the system.64
Hence, systems may be locked into a specific path of development that supports certain types of activities and constrains others. This may be seen as an advantage, as it can push the participating firms and other actors in the system in a beneficial direction. But it may also be a disadvantage, if the configuration of the system leads firms to ignore potentially fruitful avenues of exploration. The more open a system is for impulses from outside, the less the chance of being “locked out” from promising new paths of development that emerge outside the system. It is, therefore, important for “system managers”--such as policy makers--to keep an eye on the openness of the system, in order to avoid the possibility of innovation activities becoming unduly constrained by self-reinforcing path-dependency.
3.7 How Is (or Is Not) Green Innovation Different?
How is innovation in the green economy different from innovation in previous economic models/in other economic sectors? This is a hard question to answer given that the green economy is still in the process of consolidation, has only recently been the focus of academic research, and encompasses many different sectors. However, we can find in the available literature some insights that

25
help us understand the particularities of green innovation.
First, the mixed literature on market and urban structure suggests that there will be significant variation in regional performance, depending on the sector: we can’t expect the green building industry to innovate in the same way as biofuels. It is likely to be difficult to discern a relationship between innovation and job growth, especially given the timeframe and context (business cycle trough) in which we are looking at job growth. Finally, the regional innovation system model may work well for some sectors – for instance, those dependent on university-led R&D -- but not for others. In particular, green sectors innovating in process (such as utility companies changing the way they source energy) or market (such as green building firms building new market niches) may not conform nicely to the RIS model.
Another line of research relevant to green innovation relates to the market failures associated with the development of new technologies.65 Economic arguments for policies to promote renewable energy often include an assertion that the renewable energy technology will substitute for fossil fuel technologies that have significant (and negative) environmental externalities, in particular externalities associated with the atmospheric release of carbon dioxide. More generally, the development of new technologies is also subject of an appropriability market failure as the production of the new ‘clean’ technology may have spillover benefits from learning by doing (LBD). Learning by doing decrease s costs of a technology as cumulative experience increases. With LBD, a positive externality occurs because increased output (e.g., of solar panels) by one firm today contributes to a lower production cost in the future, benefiting that firm as well as other firms
Table 3.2 Martin & Scott’s Typology of Innovation Modes, Sources of Sectoral
Innovation Failure, and Policy Responses
Source: Martin, Stephen, and John T. Scott. 2000. The nature of innovation market failure and the design of public support for private innovation. Research Policy 29 (4-5):437-447.

26
or consumers in the market. As firms cannot appropriate this entire spillover effect, the private market under-provides the product of interest.
Given the externalities associated with the development of new, energy-efficient technologies, the reliance on market forces alone will result in underinvestment in R&D and/or underproduction of those technologies. This market failure is often used as a justification for public intervention - through tax incentives or direct subsidies - to support the development of new, energy efficient technologies. For instance, in the case of the California Solar Initiative, one of the largest photovoltaic (PV) energy incentive programs in the world, the subsidies cannot be justified by the environmental externalities alone.66
But because of the LBD phenomenon, the solar subsidies in the California Solar Initiative are actually highly appropriate, because they maximize net social benefits.
Thus, innovation in the green economy might be constrained by the market failures derived from learning by doing, and to a certain extent, from environmental externalities. However, the forces leading to private underinvestment in innovation differ from sector to sector across the economy, and policy design should take these differences into account.67 Markets differ in terms of the mixture of basic and applied knowledge that contributes to their knowledge base, in the degree of appropriability of technology, in the extent to which commercially applicable
knowledge is tacit, hence less likely to leak out, and in the importance of complementary assets to the commercialization of knowledge. The nature of the main mode of innovation has implications for the most important sources of sectoral innovation failure in each category, and consequently, for the most effective form of public support for private innovation. Table 3.2 presents a typology developed by Stephen Martin and John Scott of innovation modes and sectoral innovation failures aimed at guiding policy makers to choose the optimal promotional measure (competition policy, tax policy, subsidies, as well as actual R&D carried out by the public research units).68
As will be apparent in coming chapters, aspects of the Martin & Scott typology of innovation modes and related market failures and policy fixes (Table 3.2), loosely track prevalent features of green innovation observed in our study regions. For example, the East Bay region and its recent biofuels ventures (BP-EBI, JBEI) reflects the innovation mode characterized as “applications of high-science content and technology,” of the type often appearing in the biotechnology field and ones like it. The substantial investments of BP and the federal government in the intellectual engine represented by the UC Berkeley-Lawrence Berkeley Laboratory consortium indicate these funders believe innovation will first arise outside the commercial sector. The resulting partnerships, and the East Bay Green Corridor effort, may well evolve into what is identified as necessary 'high-tech bridging institutions' to facilitate the

27
diffusion of innovation. The Martin-Scott mode involving "development of complex systems" fits green-oriented activity observed in the Silicon Valley region and, more broadly, the electronics-industry settings where this innovation mode is often located. There the high costs and riskiness of new informatics relating to green-building systems and improved solar-energy equipment require levels of R&D collaboration, and perhaps subsidy capture, fitting Silicon Valley venture-capital strategic capacity nicely.
This work reminds us that the green economy should not be treated as a monolith. The stimulus to innovate, the dynamics of the innovation process, as well as the factors inhibiting its development and the required policy response might differ from energy services and environmental services, to green building and green manufacturing and to recycling and remediation or other green sectors. In the same manner, whether the relevant actors and institutions supporting (or inhibiting) green innovation are regional, national, or even global might differ from sector to sector. Only through empirical investigation should we be able to understand the determinants, dynamics, and economic effects of green innovation as well as the appropriate policies required to support it.
Photo: Berkeley Recycling Center, http://berkeleyrecycling.org/
28
Chapter 4: Statewide Trends and Innovation in California’s Green Economy The purpose of this chapter is to measure economic activity in the green economy, examine the patterns and processes of green innovation, and provide insight into the relationship between innovation and job growth in this arena. The chapter is organized around a set of three questions. First, we ask how much of the existing economic activity in California can be categorized as “green,” and what the overall trends are in green employment and business growth. This question establishes a baseline of how important the green economy is to the overall economic health of the state and explores which aspects of the green economy are most competitive in California. Second, we assess how much innovation is taking place on specifically green or clean technology products or services. Third, we examine where in the state are green economic businesses and green innovation concentrated. Through our analysis of the distribution of green employment growth and innovation across all of California’s metropolitan regions, we derive our six regional case studies that make up the remainder of this report.
4.1 Overview of California’s Green Economy
In 2008 there were 12,253 green establishments in the State of California, which collectively employed 163,616 workers across six distinct green
economic sectors (see Table 4.1).69
As a share of the overall economy, green economic activity makes up a relatively small percentage of businesses, jobs, and total sales (with less than one percent of state employment). This is not surprising given our conservative green definition and given the size and diversity of California’s economy. Despite its small size, however, green economic activity is growing relatively rapidly (79% sales growth versus 47% overall) and tends to employ more workers per establishment (13.4 versus 7.6).
As Figure 4.1 indicates below, businesses engaged in providing environmental services, including such industries as hazardous waste testing and environmental consulting, made up the largest share of all green establishments (38%) in 2008.
Recycling establishments comprised roughly one quarter of all green business (26%) while transportation activities account for approximately 13%. Despite their importance in bringing export dollars and attracting R&D investment, green manufacturers and energy research and service companies represented much smaller shares of overall green establishments (8% and 6%, respectively).
In terms of employment (see Figure 4.2), the environmental services sector experienced the largest employment increase since 1990, increasing 98% to 38,042 in 2008. The green transportation sector—which includes large public transportation authorities, private vanpools, car sharing, as well as bicycle

29
Energy research and services
6%
Environmental services
38%
Green building
9%Green manufacturing
8%
Green transportation
13%
Recycling26%
Table 4.1 Overview of California’s Green Economy
Year Establishments Employment
Avg. Estab. Size
Total Sales (billions $)
Sales per worker ($)
Green 1990 5,861 122,994 21.0 11.9 97,104 2008 12,253 163,616 13.4 21.4 130,534 Overall 1990 1,178,090 14,560,383 12.4 1,403.2 96,373 2008 2,380,875 18,023,171 7.6 2,061.3 114,370 Source: National Establishment Time Series (NETS); Center for Community Innovation.
Figure 4.1 Green Establishments in California by Sector, 2008
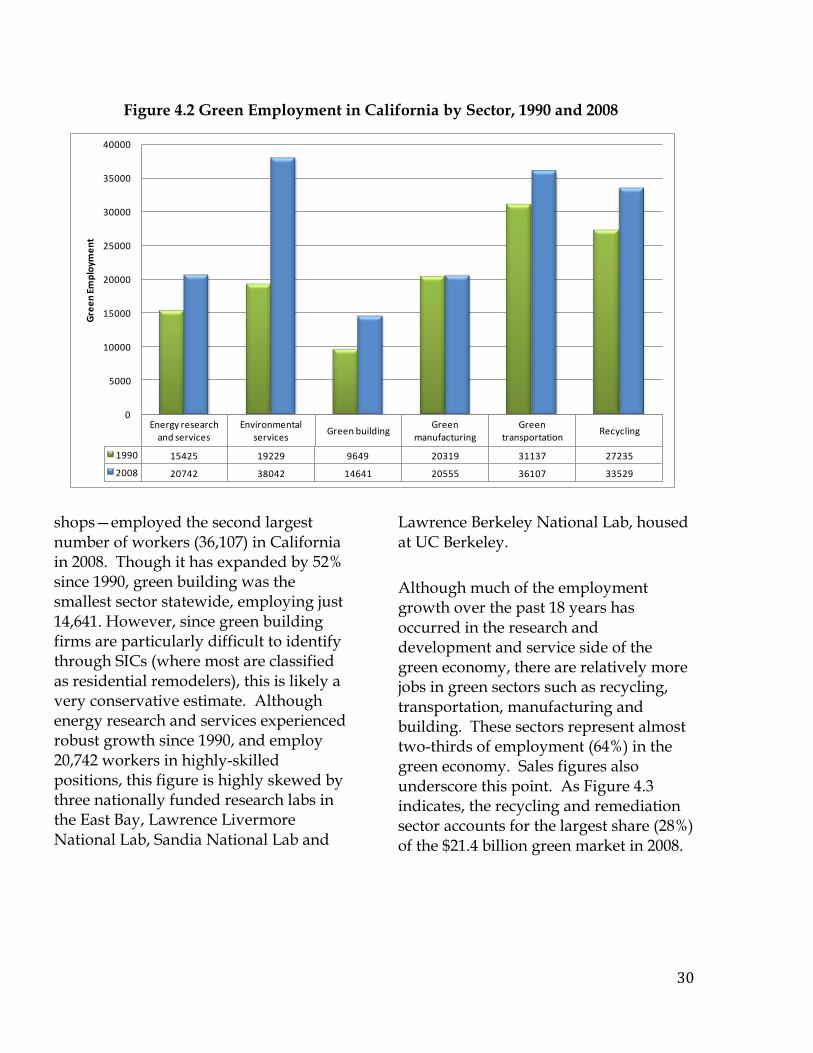
30
shops—employed the second largest number of workers (36,107) in California in 2008. Though it has expanded by 52% since 1990, green building was the smallest sector statewide, employing just 14,641. However, since green building firms are particularly difficult to identify through SICs (where most are classified as residential remodelers), this is likely a very conservative estimate. Although energy research and services experienced robust growth since 1990, and employ 20,742 workers in highly-skilled positions, this figure is highly skewed by three nationally funded research labs in the East Bay, Lawrence Livermore National Lab, Sandia National Lab and
Lawrence Berkeley National Lab, housed at UC Berkeley.
Although much of the employment growth over the past 18 years has occurred in the research and development and service side of the green economy, there are relatively more jobs in green sectors such as recycling, transportation, manufacturing and building. These sectors represent almost two-thirds of employment (64%) in the green economy. Sales figures also underscore this point. As Figure 4.3 indicates, the recycling and remediation sector accounts for the largest share (28%) of the $21.4 billion green market in 2008.
Energy research and services
Environmental services
Green buildingGreen
manufacturingGreen
transportationRecycling
1990 15425 19229 9649 20319 31137 27235
2008 20742 38042 14641 20555 36107 33529
0
5000
10000
15000
20000
25000
30000
35000
40000
Gre
en E
mpl
oym
ent
Figure 4.2 Green Employment in California by Sector, 1990 and 2008

31
As indicated above, green economic activity has grown much faster than the overall economy in California. For example green employment grew by 33% compared to 22% growth in general employment between 1990 and 2008. Looking at the trends in employment (Figure 4.4), indexed to their respective employment levels in 1990, it appears that the green economy grew more rapidly than the state as a whole in the early and mid 1990s, with the overall state trend picking up the pace in the tech boom years of 1999-2002. In the downturns of the early 1990s and 2000s, it appears that the green economy provided a much-needed lift. Throughout the period green employment growth outpaced that of overall employment.
Within the state’s green economy (Figure 4.5), the environmental services sector experienced a steady rise in employment throughout the period, while green building and green manufacturing lost employment in the mid 1990s, but recovered by 2000. As Figure 4.5 also
illustrates, the recycling/remediation sector, while still a large and significant segment of the market, has lost employment since the late 1990s, though it has stabilized in recent years. This is likely due to increased global competition in recycling commodities, on the one hand, and labor saving technologies on the other. Lastly, the green transportation sector, while consistently above 1990 levels, has never regained its employment levels of the mid-1990s.
4.2 Measures of Innovation in the Green Economy
As discussed in Chapter 3, while innovation is critical to maintain long run competitiveness for any economy, it is difficult to measure accurately. The primary goal of this chapter is to provide such measures for the green economy. To measure green innovation we gathered data on five distinct metrics of business activity that measure at least one aspect of innovation suggested by the literature. Unfortunately, not all
Energy research
12%
Enviro services18%
Green building
10%
Green mfg19%
Green transportation
13%
Recycling/remediation
28%
Figure 4.3 Share of Green Sales, by Sector, 2007

32
innovation metrics are available on a sectoral basis; for instance, though we know the number of angel networks in each region, it is impossible to determine how much support they are providing for the green economy. Thus we only include
metrics that are specifically green or cleantech-related.
For all of our metrics, we measured overall innovation across all sectors of the economy as well as activities explicitly focused on green activity or related to emerging clean technologies. These
0
50
100
150
200
250
1990 1991 1992 1993 1994 1995 1996 1997 1998 1999 2000 2001 2002 2003 2004 2005 2006 2007 2008
Empl
oym
ent I
ndex
(199
0=10
0)
Environmental services Energy Research and servicesTotal Green Green TransportationRecycling/remediation Green manufacturing
60
70
80
90
100
110
120
130
140
1990 1992 1994 1996 1998 2000 2002 2004 2006 2008
Empl
oym
ent I
ndex
(199
0=10
0)
Total Green Employment
Overall Total Employment
Figure 4.4 Index of Employment Change in California, Green Sectors vs. Overall, 1990-2008
Figure 4.5 Index of Employment Change by Green Sector, 1990-2008

33
measures include: 1) patents filed with the US Patent and Trademark Office (USPTO) assigned to companies or individuals in California; 2) venture capital investments; 3) Small Business Innovation Research (SBIR) and Small Business Technology Transfer (STTR) grants made by the US Department of Commerce; 4) start-up businesses; and 5) gazelles. The data thus span idea generation, development, and commercialization. The data sources and methodologies used for each metric are discussed individually below. Where detailed data is available we disaggregate each green innovation measure to describe the specific technologies or areas of green innovation that are emerging in California. Finally, we use these measures to develop a composite index of overall and green innovation, which is used to rank performance by metropolitan region in the following section.
Patent Activity One significant indicator of innovation is a patent applied for and issued by the US Patent and Trademark Office (USPTO). Given that a company or individual has taken a step to protect their investment in research and design in order to bring a new product or service to market, patents can be considered a leading measure of innovation. When a patent is issued for a specific technology, design, or process the government deems the idea to be novel and awards the patent owner exclusive rights over its development and marketing. However, while patents are a
direct measure of innovation, it is important to note that not all patented ideas result in new products or services in the market. Thus the overall impact of a given patent on firm growth, employment, and other measures of economic growth is highly uncertain. For the purposes of this report, we interpret the findings based on the distribution of patent activity across different technologies and different regions cautiously, and assume that patents are a proxy for innovative attempts, and do not fully capture all aspects of innovation. With these caveats in mind, we briefly summarize our methodology in the box below before presenting our findings.
Since 2000, there were 172,279 patents assigned to companies, universities, or individuals located in the State of California. Of this figure only 1,096 were classified as “cleantech” based our analysis of each patent’s abstract. The number of green/cleantech patents represents a small share of all patents (0.6%) and, despite the recent public attention paid to the green technologies, the number of patents assigned remained relatively steady since 2000 (Figure 4.6). However, it is important to note that our data only measures patents that are assigned, and would therefore not capture any recent spike in patent applications due to a typical lag over two to three years for the US Patent and Trademark Office to issue a patent.

34
Box 1. Patent methodology: We purchased a statewide extract of all patents issued in California from the United States Patent and Trademark Office’s (USPTO) from a third party data provider (freepatentsonline.com). The Patent Full-Text and Image Database is available at http://patft.uspto.gov/. Specifically, our dataset includes all patents issued (rather than applied for, a less conservative measure) to individuals, companies, or institutions (e.g. universities) located in California. To identify patents that covered green products or clean technologies, we searched the abstract field of each record for the following keywords, which we organized into the following eight categories:
• Alternative fuels: ethanol, biomass, cellulosic, biogas, alternative fuel, gasification • Energy management: energy management, energy efficiency, thermocouples, thermostats, power
regulators. • Fuel cells and vehicles: fuel cell, electric vehicle, hybrid vehicle • Green building products/lighting : insulation, fluorescent lamp, fluorescent light, compact fluorescent,
water conservation • Other renewable energy: wind turbine, marine, sustainable, geothermal, geothermal, renewable,
thermo-electric, cogeneration • Pollution control : pollution control, sequestration, greenhouse gas • Recycling: recycle • Solar: solar, photovoltaic
We developed this list of clean technology terms through consultation with our advisory committee. We limited the queries to patent applications filed between January 1st, 2000 through December 31st, 2008. Finally, we manually examined each of the records for the terms “solar”, “insulation”, “fuel cell”, “recycle”, and “marine” to determine whether each patent actually related to a clean technology innovation. We then geocoded each the patent to the appropriate region within California based on the city associated with the patent assignee.
Figure 4.6 Total Patents and Cleantech Patents Issued in CA, 2000-08

35
Patent activity for green products and/or clean technologies was distributed evenly across the five of the eight market segments defined in our analysis (see Table 4.2). Companies or research institutions developing solar technologies were issued the largest share of patents (250), representing 22.8%. Fuel cell and hybrid vehicle technologies garnered 20.5% of the State’s cleantech patents, followed by alternative fuels and green building products—which includes products such as new types of insulation for home as well as lighting products such as compact fluorescent light bulbs—which each represent approximately 15%.
Table 4.2 also lists the leading region for each cleantech category, which is defined as the region that had the highest number of patents (i.e. the plurality) in that category. Los Angeles was awarded the highest share of cleantech patents overall, and specialized in solar and fuel cell technology. The East Bay, which is home to UC Berkeley and several large petroleum companies led the state in alternative fuels, and was tied for leading
region status for recycling and pollution control technology. Silicon Valley was less specialized overall than Los Angeles or the East Bay, but still led the state in two smaller cleantech categories, other renewable energy—which includes wind turbines and geothermal energy—and energy management (e.g. smart grid) technologies.
As our patent data is available at the level of each individual patent, we can examine which companies or institutions play the largest role in cleantech patent activity overall. Table 4.3 lists all the patent assignees that each hold at least ten cleantech patents. The 15 companies and institutions that make up this list account for 29% of all cleantech patents (318 out of 1096) in California. Based on this list, it is clear that universities, including the University of California system and CalTech, are playing a leading role in clean technology patenting, particularly for research on fuel cells and alternative fuels.
Table 4.2 Total Patents by Clean Technology Category, 2000-2008.
Clean technology/Green Category Patents
% of Tot Leading Region
Solar 250 22.8 Los Angeles Fuel cells and vehicles 225 20.5 Los Angeles Alternative fuels 168 15.3 East Bay Green building products/lighting
166 15.1 Los Angeles
Recycling 156 14.2 Tie (EB & SV) Other renewable energy 75 6.8 Silicon Valley Energy management 50 4.6 Silicon Valley Pollution control 6 0.5 Tie (EB & SV & SF) Total 1,096 --- Los Angeles
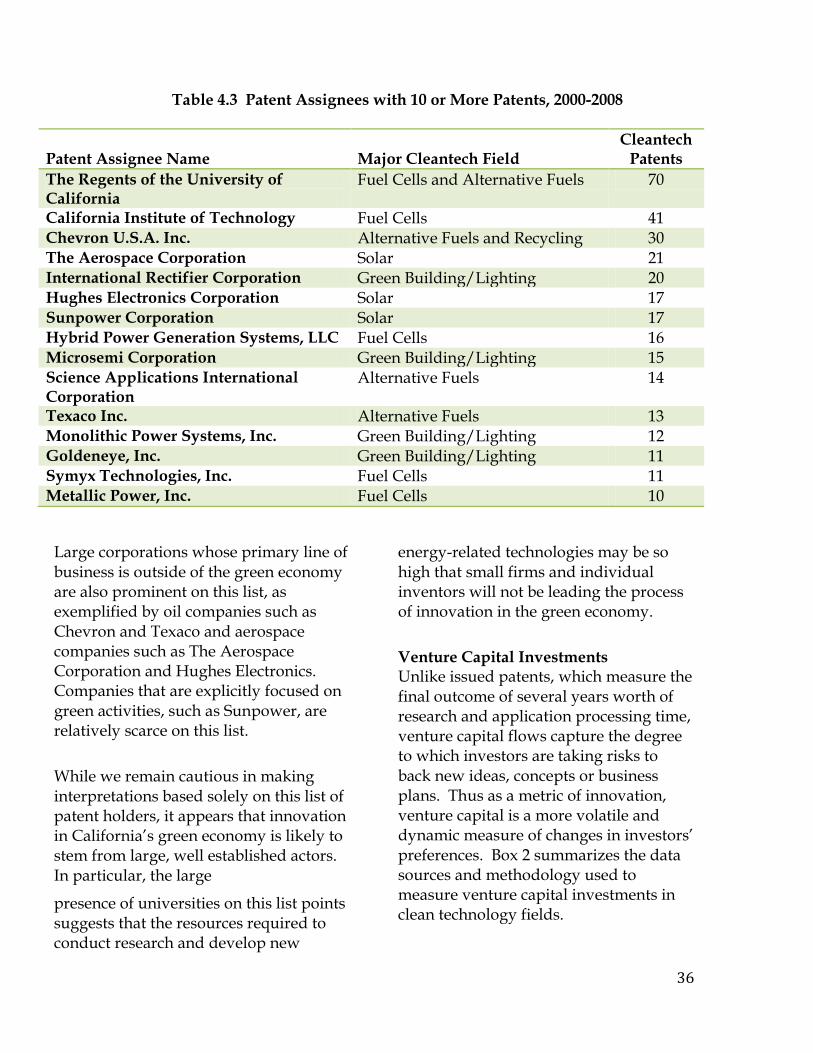
36
Large corporations whose primary line of business is outside of the green economy are also prominent on this list, as exemplified by oil companies such as Chevron and Texaco and aerospace companies such as The Aerospace Corporation and Hughes Electronics. Companies that are explicitly focused on green activities, such as Sunpower, are relatively scarce on this list.
While we remain cautious in making interpretations based solely on this list of patent holders, it appears that innovation in California’s green economy is likely to stem from large, well established actors. In particular, the large
presence of universities on this list points suggests that the resources required to conduct research and develop new
energy-related technologies may be so high that small firms and individual inventors will not be leading the process of innovation in the green economy.
Venture Capital Investments Unlike issued patents, which measure the final outcome of several years worth of research and application processing time, venture capital flows capture the degree to which investors are taking risks to back new ideas, concepts or business plans. Thus as a metric of innovation, venture capital is a more volatile and dynamic measure of changes in investors’ preferences. Box 2 summarizes the data sources and methodology used to measure venture capital investments in clean technology fields.
Table 4.3 Patent Assignees with 10 or More Patents, 2000-2008
Patent Assignee Name Major Cleantech Field Cleantech
Patents The Regents of the University of California
Fuel Cells and Alternative Fuels 70
California Institute of Technology Fuel Cells 41 Chevron U.S.A. Inc. Alternative Fuels and Recycling 30 The Aerospace Corporation Solar 21 International Rectifier Corporation Green Building/Lighting 20 Hughes Electronics Corporation Solar 17 Sunpower Corporation Solar 17 Hybrid Power Generation Systems, LLC Fuel Cells 16 Microsemi Corporation Green Building/Lighting 15 Science Applications International Corporation
Alternative Fuels 14
Texaco Inc. Alternative Fuels 13 Monolithic Power Systems, Inc. Green Building/Lighting 12 Goldeneye, Inc. Green Building/Lighting 11 Symyx Technologies, Inc. Fuel Cells 11 Metallic Power, Inc. Fuel Cells 10

37
Over the eight year period between 2000 and 2008, a total of $154.9 billion of venture capital was invested in California firms across all sectors of the economy. The trend in overall venture capital investment in California is indicative of the “dot-com” bust beginning in 2001, as venture capital investment fell from $44.5 billion in 2000 to $17.7 billion in 2001. Since then, however, there has been a
slow but steady increase with a small decrease in 2008 (see line in Figure 4.7) to $16.2 billion. As was also the case with patents, clean technologies received only a very small share of total venture investments during this period, or $1.6 billion (1.1% of total).70
Unlike patents however, the trend in venture capital investments surged recently, rising from nearly zero in 2005 to $1.1 billion in 2008. This rapid increase in venture capital investment in clean technology, while only still a small share of overall VC dollars (7% in 2008), indicates that investors are increasingly inclined to view green companies as profitable and worthy of risk taking. Thus, the spike in recent VC activity is evidence that the shift towards clean technologies is not merely a phenomenon that people are talking about—particularly environmentalists—but one that investors and entrepreneurs are actively pursuing for the sake of profit.
Of the venture capital funds invested in clean technologies, the majority between 2000 and 2008 were invested in just three sectors. Over half, 68%, of funds were
$3
$137
$25 $5 $0 $20
$102
$225
$1,114
0
200
400
600
800
1,000
1,200
0
5
10
15
20
25
30
35
40
45
50
2000 2001 2002 2003 2004 2005 2006 2007 2008
Clea
n-Te
ch V
C ($
mill
ions
), ba
r
Tota
l VC
($bi
llion
s), L
ine
Clean-Tech Overall
Figure 4.7 Venture Capital Investments in Clean technologies and Overall, 2000-2008.
Box 2. Venture Capital methodology: We collected venture capital investment data from the Thomson Financial VentureXpert database. The database was accessed on March 11th, 2009. We performed a search for total venture capital disbursements in California by county between January 1, 2000 and December 31, 2008. We also queried the database for venture capital disbursements to companies classified under the following three categories: 1) Alternative Energy, 2) Energy Conservation, and 3) Energy Management. Specifically, we searched for investment in companies classified under the following Thomson Financial Venture Economics (VE) industry codes: 6510 (Solar Energy), 6520 (Wind Energy), 6530 (Geothermal Energy), 6540 (Energy Co-Generation), 6800 (Energy Conservation Related), 6900 (Other Energy-Related) (which includes 8210, Energy Management). We excluded nuclear energy from the search.
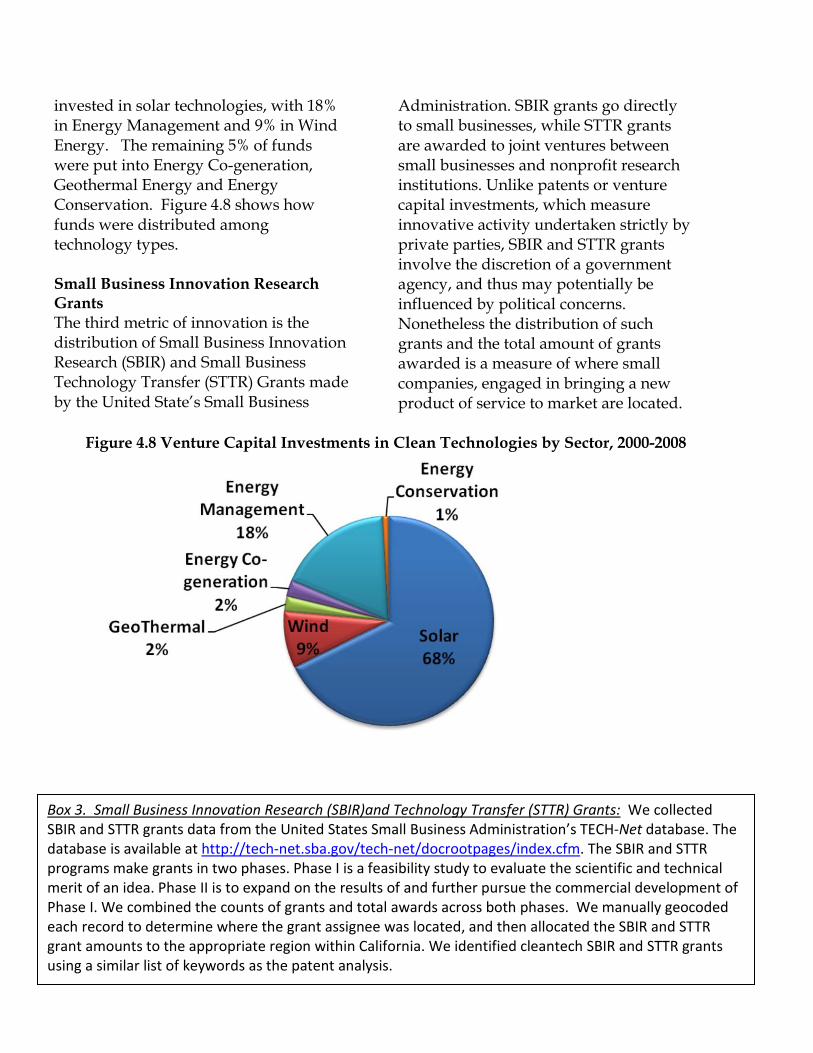
38
invested in solar technologies, with 18% in Energy Management and 9% in Wind Energy. The remaining 5% of funds were put into Energy Co-generation, Geothermal Energy and Energy Conservation. Figure 4.8 shows how funds were distributed among technology types.
Small Business Innovation Research Grants The third metric of innovation is the distribution of Small Business Innovation Research (SBIR) and Small Business Technology Transfer (STTR) Grants made by the United State’s Small Business
Administration. SBIR grants go directly to small businesses, while STTR grants are awarded to joint ventures between small businesses and nonprofit research institutions. Unlike patents or venture capital investments, which measure innovative activity undertaken strictly by private parties, SBIR and STTR grants involve the discretion of a government agency, and thus may potentially be influenced by political concerns. Nonetheless the distribution of such grants and the total amount of grants awarded is a measure of where small companies, engaged in bringing a new product of service to market are located.
Box 3. Small Business Innovation Research (SBIR)and Technology Transfer (STTR) Grants: We collected SBIR and STTR grants data from the United States Small Business Administration’s TECH-Net database. The database is available at http://tech-net.sba.gov/tech-net/docrootpages/index.cfm. The SBIR and STTR programs make grants in two phases. Phase I is a feasibility study to evaluate the scientific and technical merit of an idea. Phase II is to expand on the results of and further pursue the commercial development of Phase I. We combined the counts of grants and total awards across both phases. We manually geocoded each record to determine where the grant assignee was located, and then allocated the SBIR and STTR grant amounts to the appropriate region within California. We identified cleantech SBIR and STTR grants using a similar list of keywords as the patent analysis.
Figure 4.8 Venture Capital Investments in Clean Technologies by Sector, 2000-2008

39
Box 3 details the data source used to generate the SBIR and STTR metrics.
Between 2000 and 2008, the SBA made 7,097 SBIR grants across Phase I and II, totaling over $2.5 billion; during the same period, there were 909 STTR grants totaling $229 million. Of this amount, only 102 SBIR grants and 41 STTR grants were made to firms or ventures developing clean technologies, for a total of $46.8 million over this eight year period (1.7%) (Table 4.4). Thus the pattern observed for venture capital investments and cleantech patents holds here as well in that the level of resources flowing to innovation specifically focused on the green economy remains minor as a share of overall innovation. Our analysis of SBIR and STTR grants by type of technology indicates that firms in the solar business received the majority of SBIR/STTR funding (52%), with other cleantech (such as thermal energy, smart grid applications, solar-driven manufacturing processes, and temperature control devices) garnering 21%, and alternative fuels at 13%.
Startups The previous indicators of innovation all measure activity undertaken by existing firms or institutions in California. However, as discussed in Chapter 3, a critical aspect of innovation is the growth of new firms in emerging industries. Using the NETS, our unique time-series database, we are able to observe the growth of new establishments over time in specific industries.71
We define the growth of new establishments as a “startup” if it has not appeared in the time-series database previously and if it is not a branch or franchise of an existing firm located anywhere in the US.
Since the six industries sectors that we use to define the green economy make up a small share of the overall state economy, the total share of startups that are green is also small. Using a time period similar to that of our other innovation metrics, 2000-2007, there were a total of 7,231 green startups in California, a figure that is a small fraction (0.4%) of the 1.8 million startups throughout the economy.
Table 4.4 SBIR and STTR Grants by Cleantech Category
2000-08 Category # of
Grants Grant
Amount
% of Total
($) Solar 72 $24,206,885 52% Alternative fuels 21 $5,908,138 13% Fuel Cells 14 $4,858,953 10% Wind 6 $1,147,192 2% Tidal power 3 $839,986 2% Other cleantech 27 $9,818,329 21% Total 143 $46,779,483 100%

40
Figure 4.9 tracks green and total startups in the State by startup year. The trend in new establishment startups in the green economy fluctuates significantly by year since 1990, with a sharp decline in the boom years of 1996-1999, and a peak in 2002. This trend is consistent with overall economic trends; entrepreneurs choose to start new businesses in times when there are fewer overall opportunities in the labor market. Most recent years have also seen an increase in green startups, which may be consistent with increased interest in the green economy as also indicated in the analysis of venture capital flows. However, given the overall volatility in the pattern of green startups, this remains a tentative assessment.
Within the green economy, the environmental services sector saw the largest number of new startups, followed by firms in the recycling/remediation sector (Figure 4.10). The distribution of startups is closely related to a sector’s overall distribution in the economy. In some sectors, such as green building and transportation, the share of startups exceeds the overall share of establishments, suggesting recent expansion.
Gazelles While metrics such as patents and venture capital measure critical inputs early on in the process of innovation (i.e. the development of a working prototype and critical investment dollars), another critical aspect of innovation occurs after a
Figure 4.9 Green Startups by Year, 1990-2007
Source: NETS. CCI calculations.

41
firm brings a new product to market that successfully leads to new economic the development of a working prototype and critical investment dollars), another critical aspect of innovation occurs after a firm brings a new product to market that successfully leads to new economic growth. Thus another way to measure innovation at the regional scale is to count the number of firms that have increased their sales at an above average rate. These high-growth firms are referred to as “Gazelles” in the economic development literature. In this project we define an establishment as a Gazelle if its sales growth over a three year period was in the top quintile (20 percent) relative to other establishments within its own broad industry sector. We measure sales growth relative to other establishments within the same 3-digit SIC code in order to control for underlying trends in
industrial restructuring (i.e. the long-term decline in manufacturing versus steady growth of services). Without using this industry-specific growth measure, we would likely find most Gazelles in a few rapidly growing industries. In this case we would simply be measuring broader trends, rather than the presences of firms that are outperforming their peers. In our measure, and based on some basic assumptions of competitive markets, the fact that an establishments grows faster (in terms of sales) than its peers can be attributed to some form of innovation specific to that establishment. Specifically, we define an establishment (i) as a Gazelle according to formula 1 below.
(1) Gazellei,t=YES if SalesGrowthi, t-
t-3 > p80 (SalesGrowth ind,t-t-3)
Figure 4.10 Total Green Startups by Sector, 2000-2007 (Relative to Overall Establishments in 2008)

42
Where I denotes the each establishment and t denotes each year, and “ind” denotes the 3-digit SIC industry from which each establishments’ 8-digit SIC is a part. Due to the growth calculation over 3 years, the number of Gazelles were calculated for each year from 1993 to 2008 (e.g. Gazelle1993 would measure establishments with sales growth above the 80th
percentile over the 1990-1993 period). Finally, we categorized Gazelles as Green or Not-Green based on our standard list of green 8-digit SIC codes described above.
Since 2002, the green sector has spawned a greater share of gazelles than the economy overall, and that trend has accelerated in the past two years. Figure 4.11 shows the share of green establishments that are gazelles relative to the share of all establishments that are gazelles. Figure 4.12 summarizes the number of gazelles in each green sector.
Environmental Services has 1,652 businesses that have had sales in the top quintile in the 2005-2008 period. The second most successful sector in terms of numbers of gazelles is Recycling/remediation, with 838 businesses, followed by Energy Research and Services, with 300 firms in distant third. Though green manufacturing has the least number of gazelles in California with just over 200, its number of gazelles jumped over 50% from 2007 to 2008, indicating its recent rapid growth.
Another way to identify gazelles is via the Inc 500 list of the fastest growing companies in the country over the past year. In 2008, that list included five green firms in California: Enalasys in Calexico, with 2,814% growth; Global Wedge in Riverside, with 1,175% growth; Cali Bamboo in San Diego (877% growth); Borrego Solar in El Cajon (754% growth); and Utility Integration Solutions in Lafayette (744% growth).
Figure 4.11 Gazelles as Share of all Establishments
0%
5%
10%
15%
20%
25%
30%
35%
1993 1994 1995 1996 1997 1998 1999 2000 2001 2002 2003 2004 2005 2006 2007 2008
Shar
e of
Est
ablis
hmen
ts
Overall Green

43
4.3 Green Economic Activity and Innovation in California’s Metropolitan Regions
The previous section tracked five metrics of innovation in California as a whole. Across each of these five measures—patents, venture capital investments, SBIR and STTR grants, startups, and gazelles —we find that green innovation makes up a relatively small share of overall innovation taking place in California. However, there is some evidence that clean technologies are rapidly increasing as a share of overall innovative activity. Based on these quantitative measures of innovation alone, it would be wrong to conclude that green innovation is not important for either the state’s environmental goals or
for jump-starting job growth in an emerging industry. Rather these metrics point out that, while small in absolute terms, innovation is occurring in California’s green economy and that the state does posses the fundamental capacity to continue to innovate in this area. To fully understand how specific actors use this capacity and turn ideas into new, marketable products and services and respond to the incentives presented to them by state regulations, we need to dig deeper than these quantitative metrics allow. Thus Chapters V and VI focus on green innovation in six case study regions within California, complementing these quantitative measures of innovations with surveys of green and traditional firms and interviews with key
Figure 4.12 Green Gazelles by Sector, 2008 (Relative to All Establishments)
44
stakeholders and innovators at the regional scale.
Before turning to our in-depth case studies however it is important to understand how innovative activity is distributed across California and what the geographic trends are with regards to both measured innovation and the growth of green economic activity. In fact, we derive the logic for selecting our six cases through the following analysis of regional trends in innovation and growth in California’s metropolitan regions.
Table 4.5 lists all of the five innovation metrics discussed above for all of California’s 34 metropolitan regions.72
In each case the raw numbers for the green/cleantech metric are listed (e.g. number of cleantech patents, total cleantech venture capital investment), followed by the share of overall state innovation in that category that accrued to each region (e.g. the number total patents—cleantech or not—located in region X divided by the total patents statewide), and the share of California’s cleantech innovation in that category. We provide both the “share of state overall” and “share of state green/cleantech” for each metric so that one can ascertain if a given region is exceeding its expected level of innovation in clean technologies. For example, the East Bay received only 8% of overall patents issued in California, but 20% of all cleantech patents. This indicates that the innovative resources in the East-Bay are skewed towards energy saving technology and green processes relative to other patentable ideas or products.
Conversely, Silicon Valley captured over half of all patents (52%) in California between 2000 and 2008. Yet, this region received only 23% of cleantech patents.
To compare regional innovation across all five metrics at once we calculated a composite ranking of both overall and cleantech innovation measures. The composite rankings were generated by calculating the average of each region’s “share of statewide” activity across the five metrics, weighted to represent the three innovation categories – idea generation, idea development, and commercialization – equally. Specifically, we calculated the ranking as follows:
Composite avg. = % of CA patents + (% of CA VC$ + % of CA SBIR/STTR$ + % of CA startups)/3 + % of CA gazelles/
3
The penultimate two columns of Table 4.5 contain the composite rankings. The regions listed in the table are sorted by their composite cleantech ranking. The table shows that measured innovation is highly concentrated in just a few regions. For example, the top four regions—Los Angeles, Silicon Valley, the East Bay, and San Diego account for 79% of cleantech patents, 67% of venture capital investments in clean technology, and 65% of SBIR/STTR grants. Green startups and gazelles are less concentrated, but these four regions still account for almost half of these measures as well. Based on our ranking method, Los Angeles ranks as the most innovative green region in California across our four metrics of cleantech innovation. As the State’s

45
largest region in terms of population and employment, Los Angeles scored high on all metrics, but garnered a disproportionate share of the idea generation and development measures, cleantech patents, venture capital, and SBIR/STTR grants (as compared to the
share of overall innovation). Silicon Valley rightfully has a reputation as the leader in overall innovation (#1 rank), but this leadership did not directly spillover into green/cleantech fields, as it dropped to second on the cleantech ranking. The East Bay moved from 6th overall to 3rd in
Table 4.5 Innovation Measures by Region Ranked by Composite Cleantech Ranking
Norm-alized Rank
MSAname Clean-
tech
% of
Tot
% of State Clean-tech
Clean-tech VC
Funds
% of
Tot VC
% of Clean- tech VC
Clean-tech
Grants
% of
Tot
% of State Clean-tech
Total Green Start-ups
% of
Tot
% of State
Green Start-ups
Green Gaz-elles
% of State Total Gaz-elles
% of State
Green Gaz-elles
Overall
Clean-Tech
Clean-Tech
Los Angeles County 280 11.6 26.6 $404 9.1 15.0 15.5$ 28.4 33.2 1876 31.1 25.9 774 26.5 21.2 2 1 12Silicon Valley 245 51.8 23.2 $827 36.1 30.7 5.2$ 12.0 11.0 315 5.0 4.4 168 5.0 4.6 1 2 1East Bay 211 8.0 20.0 $441 10.1 16.4 1.5$ 6.8 3.2 605 6.6 8.4 415 6.9 11.4 6 3 2San Diego County 97 7.7 9.2 $130 8.8 4.8 8.3$ 20.6 17.8 622 9.0 8.6 330 9.1 9.0 3 4 7Orange County 66 7.7 6.3 $154 5.0 5.7 6.1$ 8.5 12.9 667 11.2 9.2 394 10.1 10.8 5 5 13SF-SM-Marin 48 6.1 4.6 $433 27.0 16.1 1.3$ 10.8 2.8 416 5.8 5.8 203 6.9 5.6 4 6 8Sacto-Ard.-Arc.-Roseville 30 0.6 2.8 $7 0.6 0.3 0.6$ 1.5 1.3 500 5.2 6.9 259 5.4 7.1 8 7 14Inland Empire 14 1.3 1.3 $0 0.3 0.0 -$ 1.0 0.0 704 8.8 9.7 266 7.7 7.3 7 8 29Sta Barbara-Sta Maria-Gol. 22 0.6 2.1 $1 0.6 0.0 2.9$ 6.2 6.1 100 1.1 1.4 51 1.4 1.4 10 9 3Oxnard-Thsnd Oaks-Vent. 3 1.1 0.3 $0 0.6 0.0 2.9$ 1.8 6.3 165 2.2 2.3 88 2.4 2.4 9 10 16Bakersfield 6 0.1 0.6 $0 0.1 0.0 0.8$ 0.4 1.8 139 1.4 1.9 63 1.6 1.7 15 11 18Visalia-Porterville 0 0.0 0.0 $209 0.2 7.8 -$ 0.0 0.0 43 0.6 0.6 27 0.9 0.7 19 12 4Santa Rosa-Petaluma 1 0.5 0.1 $36 1.0 1.3 0.4$ 0.5 0.9 135 1.3 1.9 71 1.7 1.9 13 13 19Upper San Joaquin 2 0.2 0.2 $0 0.0 0.0 -$ 0.0 0.0 147 2.4 2.0 86 2.9 2.4 11 14 33Fresno 0 0.1 0.0 $0 0.0 0.0 -$ 0.1 0.0 134 1.6 1.9 76 2.0 2.1 14 15 30Santa Cruz-Watsonville 8 2.0 0.8 $0 0.3 0.0 0.2$ 0.6 0.4 75 0.8 1.0 46 1.0 1.3 12 16 9Vallejo-Fairfield 12 0.1 1.1 $0 0.0 0.0 -$ 0.1 0.0 57 0.9 0.8 34 0.9 0.9 18 17 11San Luis Obispo-Paso Rob. 5 0.2 0.5 $0 0.0 0.0 0.1$ 0.1 0.2 66 0.8 0.9 32 0.9 0.9 17 18 21Chico 2 0.0 0.2 $0 0.0 0.0 0.8$ 0.2 1.8 50 0.5 0.7 16 0.7 0.4 21 19 17Non-metro* 0.0 0.0 $0 0.0 0.0 -$ 0.0 0.0 31 0.2 0.4 43 1.0 1.2 20 20 27Salinas 1 0.1 0.1 $0 0.1 0.0 0.1$ 0.2 0.2 65 0.8 0.9 31 1.1 0.8 16 21 32Napa 0 0.1 0.0 $53 0.1 2.0 -$ 0.1 0.0 30 0.4 0.4 14 0.5 0.4 23 22 10Eureka-Arcata-Fortuna 0 0.0 0.0 $0 0.0 0.0 -$ 0.0 0.0 63 0.2 0.9 30 0.4 0.8 25 23 6Redding 0 0.0 0.0 $0 0.0 0.0 -$ 0.0 0.0 55 0.5 0.8 24 0.6 0.7 22 24 25Truckee-Grass Valley 0 0.0 0.0 $0 0.0 0.0 -$ 0.0 0.0 40 0.3 0.6 20 0.4 0.5 24 25 22Ukiah 0 0.0 0.0 $0 0.0 0.0 -$ 0.0 0.0 33 0.2 0.5 20 0.3 0.5 27 26 15Yuba City-Marysville 1 0.0 0.1 $0 0.0 0.0 -$ 0.0 0.0 22 0.3 0.3 11 0.4 0.3 26 27 28El Centro 0 0.0 0.0 $0 0.0 0.0 -$ 0.0 0.0 24 0.2 0.3 12 0.3 0.3 28 28 26Madera 0 0.0 0.0 $0 0.0 0.0 -$ 0.0 0.0 26 0.2 0.4 11 0.3 0.3 29 29 24Red Bluff 0 0.0 0.0 $0 0.0 0.0 -$ 0.0 0.0 14 0.1 0.3 8 0.1 0.2 33 30 20Clearlake 0 0.0 0.0 $0 0.0 0.0 -$ 0.1 0.0 15 0.1 0.2 8 0.2 0.2 32 31 23Phoenix Lake-Cedar Ridge 0 0.0 0.0 $0 0.0 0.0 -$ 0.0 0.0 11 0.1 0.2 7 0.2 0.2 31 32 31Bishop 0 0.0 0.0 $0 0.0 0.0 -$ 0.0 0.0 6 0.0 0.1 7 0.1 0.2 34 33 5Hanford-Corcoran 0 0.0 0.0 $0 0.0 0.0 -$ 0.0 0.0 7 0.1 0.1 5 0.2 0.1 30 34 34Crescent City North 0 0.0 0.0 $0 0.0 0.0 -$ 0.0 0.0 3 0.0 0.1 0 0.1 0.0 35 35 35Statewide 1054 100 100 $2,694 100 100 46.8$ 100 100 7261 100 100 3650 100 100 - - -
Green Gazelles, 2008 RankingPatent Activity,
2000-08
Venture Capital Investments 2000-
08 ($millions)
SBIR/STTR Grants, 2000-08
($millions)Green Startups,
2000-07
Sources: 1) USPTO, 2) VentureExpert; 3) US Small Business Administration, 4) NETS. CCI Calculations

46
terms of cleantech innovation, indicating that it is specializing in green innovation. San Diego ranks 3rd overall and 4th
in cleantech.
The last column of Table 4.5 normalizes the composite cleantech rankings by the size of the local economy, measured by total number of establishments. This normalized ranking is a better indicator of the concentration of cleantech innovation (as opposed to its scale). In this ranking system, Los Angeles moves down to the 12th
rank. Silicon Valley and the East Bay assume the first and second place, with Santa Barbara third (due no doubt to the presence of a large research university in a very small metropolitan area) and Visalia fourth (due to a $209 million venture capital investment in a biomass venture).
As discussed above, these metrics do not by themselves measure the full impact of innovation. One reason why innovation is critical to the process of economic development in regions is to generate new job opportunities in new industries. Therefore we also examined the geographic distribution of green jobs across California’s metropolitan regions. Using the same time-series data employed for the analysis in section 4.1, Table 4.6 lists the employment levels in 1990 and 2008 in the green economy overall and for the six green industry sectors. We also calculated the annual average growth rate in employment in each green sector to allow comparison across regions. The table is ranked by total green jobs in 2008. Not surprisingly, Los Angeles had the largest number of
total green jobs in the state, with large concentrations of employment in manufacturing, transportation, and recycling, and a relatively smaller share of energy research and services and environmental services positions. This reflects Los Angeles’s traditional economic advantages in goods production and logistics. Therefore, it is interesting to note that while Los Angeles ranks as the most innovative region in the state on our cleantech ranking, from an industry perspective, the majority of LA’s green jobs are outside of those sectors that are closely linked to R&D. The East Bay, with three large national laboratories, dominates the Energy research and services sector, ranks second on total green employment, and also has large concentrations of jobs in environmental services. Although Silicon Valley ranked 1st in overall innovation and 2nd
on cleantech innovation metrics, its total number of jobs in green industry sectors was relatively low compared to other large regions in California.
Conversely, Riverside and the Upper San Joaquin Valley had a significant number of green jobs—spread out evenly across the six sectors—despite the fact that they are well below the leading regions in terms of innovation in clean technologies. In addition, both regions grew at an average annual rate (3.1% and 3.2% respectively) that was well above the state average (1.6%). Thus, the relationship between our quantitative innovation metrics and employment growth is not straightforward. We

47
Table 4.6 Employment in Green Sectors by Region, 1990-2008 (Ranked by 2008 Employment)
Total Green Sectors Energy research and
services Environmental
services Green building Region 1990 2008 AAGR
1990-2008
1990 2008 AAGR 1990-2008
1990 2008 AAGR 1990-2008
1990 2008 AA GR 1990-2008
Los Angeles 38354 39875 0.2% 500 998 3.9% 5336 6632 1.2% 2395 2028 -0.9% East Bay 23312 30876 1.6% 12437 15377 1.2% 1476 3412 4.8% 1009 3674 7.4% San Diego 11691 18220 2.5% 398 950 5.0% 2570 5109 3.9% 902 917 0.1% Orange County 9151 13551 2.2% 168 708 8.3% 2297 5269 4.7% 895 767 -0.9% Riverside-San Bernardino
6818 11781 3.1% 53 241 8.8% 838 2187 5.5% 620 1330 4.3%
San Francisco-San Mateo-Marin
9880 11352 0.8% 126 260 4.1% 1361 3845 5.9% 468 402 -0.8%
Sacramento 4544 8834 3.8% 331 312 -0.3% 1009 3118 6.5% 486 845 3.1% Silicon Valley 4151 6121 2.2% 133 246 3.5% 842 1367 2.7% 1338 2411 3.3% Upper San Joaquin 1716 3015 3.2% 66 120 3.4% 338 497 2.2% 204 395 3.7% Fresno 1555 2427 2.5% 108 109 0.1% 343 680 3.9% 241 382 2.6% Oxnard Ventura 1211 2214 3.4% 34 37 0.5% 329 784 4.9% 98 108 0.5% Bakersfield 1690 2018 1.0% 74 228 6.5% 369 511 1.8% 188 130 -2.0% Santa Rosa-Petaluma 927 1370 2.2% 152 128 -1.0% 175 518 6.2% 77 214 5.8% Vallejo-Fairfield 824 1230 2.3% 28 4 -10.2% 164 429 5.5% 90 37 -4.8% Santa Cruz-Watsonville 1054 1191 0.7% 8 18 4.6% 207 349 2.9% 57 85 2.2% Santa Barbara 927 1065 0.8% 13 25 3.7% 253 452 3.3% 91 52 -3.1% San Luis Obispo-Paso Robles
419 1052 5.2% 1 30 20.8% 196 412 4.2% 47 262 10.0%
El Centro 735 908 1.2% 650 764 0.9% 15 22 2.2% 2 6 6.3%

48
Visalia-Porterville 543 820 2.3% 0 12 n/a 235 293 1.2% 13 131 13.7% Salinas 579 768 1.6% 6 26 8.5% 118 165 1.9% 52 75 2.1% Non-metro 825 793 -0.2% 1 5 9.4% 337 376 0.6% 42 72 3.0% Redding 255 677 5.6% 13 6 -4.2% 32 297 13.2% 71 50 -1.9% Eureka-Arcata-Fortuna 220 580 5.5% 12 60 9.4% 106 322 6.4% 10 27 5.7% Napa 251 573 4.7% 24 11 -4.2% 28 177 10.8% 19 3 -9.7% Chico 283 457 2.7% 8 6 -1.6% 36 154 8.4% 21 47 4.6% Truckee-Grass Valley 206 409 3.9% 10 8 -1.2% 50 118 4.9% 42 110 5.5% Ukiah 259 377 2.1% 9 6 -2.2% 58 127 4.5% 61 27 -4.4% Red Bluff 89 217 5.1% 0 0 n/a 26 151 10.3% 4 6 2.3% Yuba City-Marysville 103 217 4.2% 3 33 14.2% 9 32 7.3% 56 16 -6.7% Madera 104 160 2.4% 20 3 -10.0% 2 50 19.6% 44 23 -3.5% Clearlake 132 132 0.0% 38 8 -8.3% 41 64 2.5% 6 5 -1.0% Hanford-Corcoran 101 132 1.5% 0 0 n/a 2 16 12.2% 0 0 n/a Phoenix Lake-Cedar Ridge
32 85 5.6% 1 3 6.3% 3 54 17.4% 0 4 n/a
Bishop 40 81 4.0% 0 0 n/a 25 31 1.2% 0 0 n/a Crescent City North 13 38 6.1% 0 0 n/a 3 22 11.7% 0 0 n/a Statewide Total 122994 163616 1.6% 13646 18312 1.6% 18386 36351 3.9% 9219 1124
8 1.1%

49
Table 4.6 (Continued) Employment in Green Sectors by Region, 1990-2008 (Ranked by 2008 Employment)
Green Manufacturing Green Transportation Recycling/Remediation Region 1990 2008 AAGR
1990-2008
1990 2008 AAGR 1990-2008
1990 2008 AAGR 1990-2008
Los Angeles 8146 7449 -0.5% 12339 11336 -0.5% 9638 11432 1.0% East Bay 783 647 -1.1% 3033 3666 1.1% 4574 4100 -0.6% San Diego 5056 5076 0.0% 1611 4227 5.5% 1154 1941 2.9% Orange County 1672 1530 -0.5% 1739 2714 2.5% 2380 2563 0.4% Riverside-San Bernardino
1199 1778 2.2% 1475 2626 3.3% 2633 3619 1.8%
San Francisco-San Mateo-Marin
740 835 0.7% 6206 5206 -1.0% 979 804 -1.1%
Sacramento 314 349 0.6% 1084 1737 2.7% 1320 2473 3.5% Silicon Valley 939 868 -0.4% 178 473 5.6% 721 756 0.3% Upper San Joaquin 268 359 1.6% 492 816 2.9% 348 828 4.9% Fresno 38 52 1.8% 261 389 2.2% 564 815 2.1% Oxnard Ventura 285 647 4.7% 126 90 -1.9% 339 548 2.7% Bakersfield 458 102 -8.0% 268 358 1.6% 333 689 4.1% Santa Rosa-Petaluma 60 88 2.2% 84 194 4.8% 379 228 -2.8% Vallejo-Fairfield 31 34 0.5% 106 344 6.8% 405 382 -0.3% Santa Cruz-Watsonville 39 31 -1.3% 644 627 -0.1% 99 81 -1.1% Santa Barbara 89 189 4.3% 218 81 -5.4% 263 266 0.1% San Luis Obispo-Paso Robles
30 93 6.5% 83 129 2.5% 62 126 4.0%
El Centro 0 6 n/a 32 33 0.2% 36 77 4.3% Visalia-Porterville 45 127 5.9% 120 94 -1.3% 130 163 1.3% Salinas 1 29 165 123 237 350 Non-metro 15 32 4.3% 326 117 -5.5% 104 191 3.4%
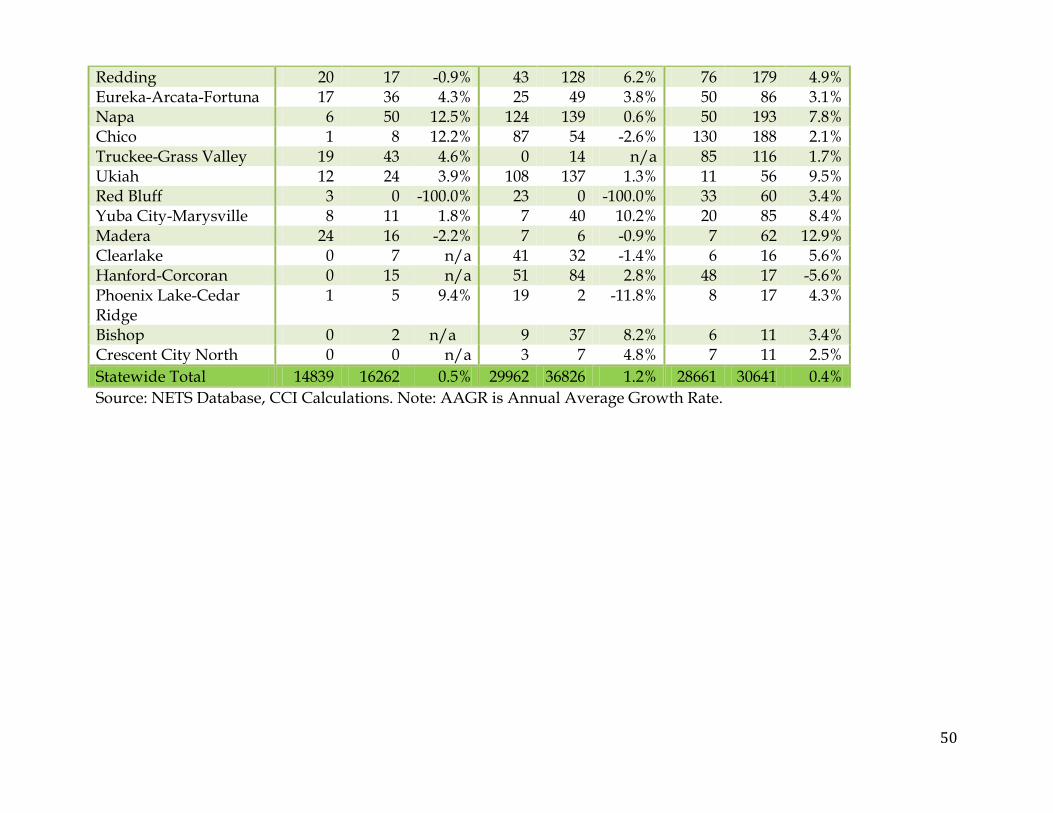
50
Redding 20 17 -0.9% 43 128 6.2% 76 179 4.9% Eureka-Arcata-Fortuna 17 36 4.3% 25 49 3.8% 50 86 3.1% Napa 6 50 12.5% 124 139 0.6% 50 193 7.8% Chico 1 8 12.2% 87 54 -2.6% 130 188 2.1% Truckee-Grass Valley 19 43 4.6% 0 14 n/a 85 116 1.7% Ukiah 12 24 3.9% 108 137 1.3% 11 56 9.5% Red Bluff 3 0 -100.0% 23 0 -100.0% 33 60 3.4% Yuba City-Marysville 8 11 1.8% 7 40 10.2% 20 85 8.4% Madera 24 16 -2.2% 7 6 -0.9% 7 62 12.9% Clearlake 0 7 n/a 41 32 -1.4% 6 16 5.6% Hanford-Corcoran 0 15 n/a 51 84 2.8% 48 17 -5.6% Phoenix Lake-Cedar Ridge
1 5 9.4% 19 2 -11.8% 8 17 4.3%
Bishop 0 2 n/a 9 37 8.2% 6 11 3.4% Crescent City North 0 0 n/a 3 7 4.8% 7 11 2.5% Statewide Total 14839 16262 0.5% 29962 36826 1.2% 28661 30641 0.4% Source: NETS Database, CCI Calculations. Note: AAGR is Annual Average Growth Rate.

51
explore the direct relationship between innovation and job growth in Figure 4.13 below.
Figure 4.13 plots all 34 regions according to their composite cleantech ranking on the vertical axis and the annual average growth rate of green jobs between 1990 and 2008 on the horizontal axis. The size of each region’s bubble reflects its 1990 green employment level. This figure bears out the observation made above that innovation is highly concentrated in a select group of large, coastal regions, including Los Angeles, San Diego, the East Bay and Silicon Valley. While there are a large number of smaller regions that compare favorably on job growth, this growth is due primarily to the fact that these regions were growing from a small base. This figure concludes that innovation is highly concentrated, but the
link between innovation and job growth is murky. This fact motivates our case studies of green innovation and economic activity in six regions in California. 4.4 Green Innovation: Six Cases
To determine which cases to select for further study, we first conducted a cluster analysis on the 34 metropolitan areas to determine whether any intuitive groupings would emerge. For the cluster analysis, we used the five innovation measures along with measures of population, unemployment, and poverty. The analysis derived the following groups of matched regions: Silicon Valley-East Bay-Orange County, San Diego-Los Angeles, Salinas-Truckee-Vallejo-Sacramento-San Luis Obispo, Napa-Santa Cruz-Santa Rosa, Oxnard-Santa Barbara, San Francisco in a class by itself, and all of the other regions (mostly
Figure 4.13 Innovation Versus Growth in the Green Economy in California Regions
East Bay
San Diego County
San Francisco-San Mateo-Marin
Orange County
LA
Sacramento County
Bakersfield
Riverside-San Bernardino
Silicon Valley
Upper San Joaquin Valley
-4.0% -2.0% 0.0% 2.0% 4.0% 6.0% 8.0%
Gre
en In
nova
tion
Ran
king
Average Annual Growth Rate of Green Jobs, 1990-2008
Bubble Size= 1990 Green Employment
Low
erH
ighe
r

52
Central Valley and Far Northern California) together.
Because of our primary focus on innovation, we decided to select the top four innovative regions in the state for study, which were conveniently grouped into pairs by the cluster analysis: two from the San Francisco Bay Area (the East Bay and Silicon Valley), and two from Southern California (Los Angeles and San Diego). We also chose two non coastal regions from the distressed region group, Riverside-San Bernardino (the Inland Empire) and the Upper San Joaquin Valley (Merced, Stockton and Stanislaus counties). We selected these two since we needed to find regions that had a certain minimum amount of employment across the different industry sectors. Although innovation levels are low in these metros (and distressed regions generally), it is important to include such cases in order to determine whether green innovation differs from traditional innovation in some way: Is it more likely to level the playing field? We turn to this question in more detail in Chapters 6 and 7.

53
Chapter 5. Survey of Businesses in the Green Economy 5.1 Survey Overview
The measures of innovation described in the previous chapter give an overview of the ways in which new green products are integrated into California’s industries and regional economies. The business survey examines green industries, greening processes, and innovation of green products at the firm level, as well as the location and business environment in which the businesses operate. By surveying three groups of firms -- those identified as “green,” traditional businesses in a range of industries, and businesses facing the most serious environmental challenges -- we are able to develop a broad understanding of the means by which green innovation occurs. The survey focused on new products and services developed, new processes incorporated into operations and production, as well as the role of location, customer and supplier networks, and support systems in firm operations.
We sampled three types of firms—those defined as green by the product or service offered (n=351), a strategic random sample of firms that do not offer green products or services (n=217, hereafter referred to as traditional firms) and, finally, a sample of firms that report their toxic chemical releases and waste management activities to the U.S. Environmental Protection Agency’s Toxic Release Inventory due to their high environmental impact (n=72, hereafter
referred to as TRI firms). The sample covered firms throughout the state, providing a rich picture of the variations among and within the case-study regions, different green and other industry sectors and among small and large green and non-green firms. Because the survey undersamples businesses from rural regions, it is generally representative of California’s larger metropolitan areas. Sample selection and survey methodology, as well as detailed information on the characteristics of respondents (size of firm, industry, location, etc.) are described in Appendix 3, Survey Methodology.
We report the survey findings in five broad sections. The first part, Green Innovation, address green innovation in respondent firms, distinguishing between product innovation and process innovation. The second section, Green Practices and Activities, reports the level of use of green business practices among respondent firms and the main barriers to incorporating such practices. The Regional Assets section describes endogenous strengths and regional assets that influence firm location and relocation decisions with a special focus on green businesses preferences. The Networks section examines relationships between businesses and public and private organizations at different geographical levels in order to identify networks that contribute and support the development of green innovation. The Policy Perceptions and Impact section addresses the role of federal, state and local policies in firm operations. The survey asks about the effects of public policy on business operations and green innovation looking

54
in particular at the impact of AB32 and the stimulus package among green and non-green firms. Drawing from each of these sections, in Factors Underlying Green Innovation, we use statistical analysis of responses to identify significant economic “drivers” behind green innovation. We conclude with a summary of the survey findings. For a full summary of the survey findings, see Appendix 4.
5.2 Green Innovation
We designed the survey to identify several types of innovation. First, we distinguish between product innovation (Has your firm introduced a new product or service in the past three years to reduce environmental impact?) and process innovation (Has your firm changed the way it operates in order to reduce environmental impact or meet environmental regulations?). Process innovation here is adding value, as in any kind of innovation, but may not translate directly into new economic returns. Instead, it involves adopting new green practices that may change the overall marketability of the company. Second, the survey asks these questions of all three types of businesses, recognizing that in green activities, innovation may come from within or beyond green sectors.
The responses in this section show that direct product and service development occurs in many types of businesses, but that green businesses are more likely than their traditional and TRI counterparts to innovate in this way. Fifty-nine percent of green businesses have introduced a new green product or service in the last 3 years compared to 37% and 43% of traditional and TRI businesses respectively, as shown in Table 5.1.
Among green firms, product innovation varies by industry sector and region. Manufacturing, architecture/ engineering/ design, construction, and energy research and utilities are, according to the survey, the most innovative green industries in terms of product innovation while recycling, environmental services and transportation are the least innovative (Table 5.2). (It should be noted, however, that some architecture/ engineering/ design firms describe themselves as innovating a new service if they simply gain LEED certification.) Because of the diversity of green businesses, with some more focused on reducing energy consumption and others more on improving environmental quality, there is great variation in the types of product innovation. In total, 154 businesses
Table 5.1 New Green Product/ Service Introduced in Past 3 Years
Green Businesses Traditional Businesses TRI Businesses n= 272 137 49
Yes 59% 37% 43% No 41% 63% 57% Source: UC Berkeley Green Business Survey, 2009.
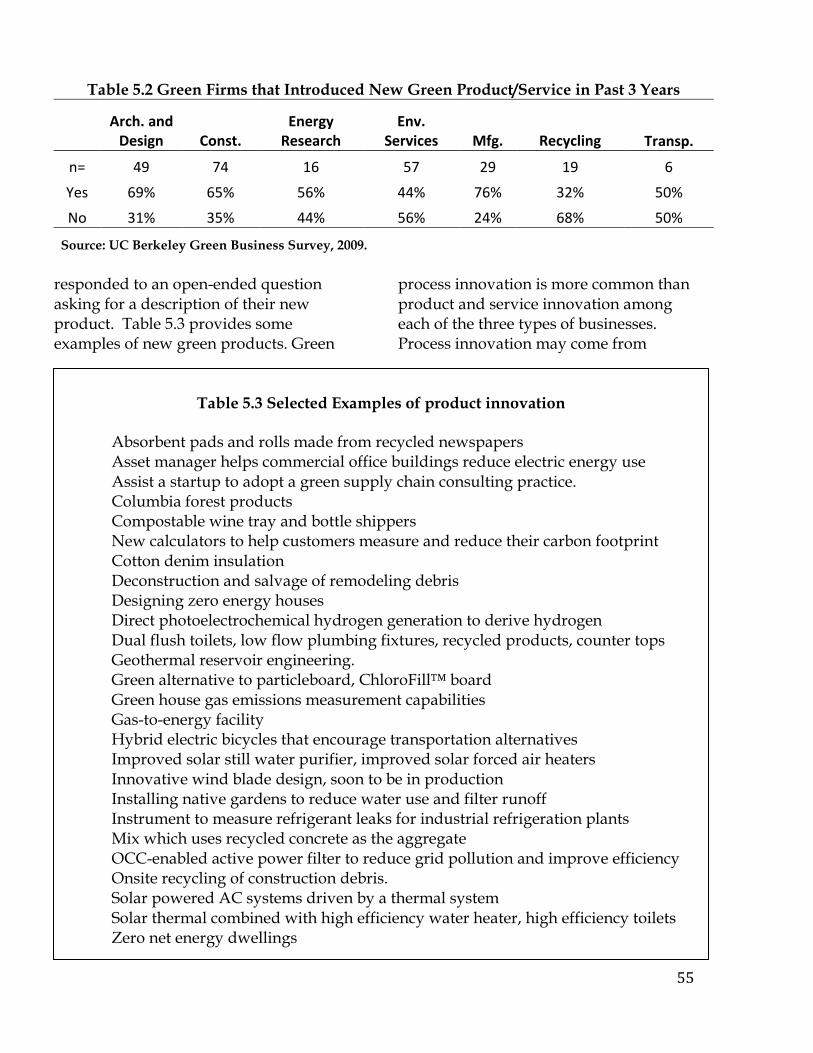
55
responded to an open-ended question asking for a description of their new product. Table 5.3 provides some examples of new green products. Green
process innovation is more common than product and service innovation among each of the three types of businesses. Process innovation may come from
Table 5.2 Green Firms that Introduced New Green Product/Service in Past 3 Years
Arch. and
Design Const. Energy
Research Env.
Services Mfg. Recycling Transp.
n= 49 74 16 57 29 19 6
Yes 69% 65% 56% 44% 76% 32% 50%
No 31% 35% 44% 56% 24% 68% 50%
Source: UC Berkeley Green Business Survey, 2009.
Table 5.3 Selected Examples of product innovation
Absorbent pads and rolls made from recycled newspapers Asset manager helps commercial office buildings reduce electric energy use Assist a startup to adopt a green supply chain consulting practice. Columbia forest products Compostable wine tray and bottle shippers New calculators to help customers measure and reduce their carbon footprint Cotton denim insulation Deconstruction and salvage of remodeling debris Designing zero energy houses Direct photoelectrochemical hydrogen generation to derive hydrogen Dual flush toilets, low flow plumbing fixtures, recycled products, counter tops Geothermal reservoir engineering. Green alternative to particleboard, ChloroFill™ board Green house gas emissions measurement capabilities Gas-to-energy facility Hybrid electric bicycles that encourage transportation alternatives Improved solar still water purifier, improved solar forced air heaters Innovative wind blade design, soon to be in production Installing native gardens to reduce water use and filter runoff Instrument to measure refrigerant leaks for industrial refrigeration plants Mix which uses recycled concrete as the aggregate OCC-enabled active power filter to reduce grid pollution and improve efficiency Onsite recycling of construction debris. Solar powered AC systems driven by a thermal system Solar thermal combined with high efficiency water heater, high efficiency toilets Zero net energy dwellings

56
necessity (the need to reduce pollution from production processes) rather than from connection to a green sector. In some cases, it is as simple as recycling paper – not a significant change in operations, but one that indicates a company’s environmental awareness. As shown in Table 5.4, TRI businesses were more likely than other types of companies to have changed the way they operate to reduce environmental impact or meet environmental regulations. The high share of TRI companies implementing greener operational changes in their production processes (89 percent) may indicate the impact of environmental regulations. The survey asked about changing processes, and green companies may already have environmentally-friendly production processes in place. For instance, a
respondent talking about how environmental regulations have affected their business, a green building company located in Silicon Valley says: “Our 'green' direction was implemented and already set a higher goal than those regulations”.
Green businesses that have introduced new products in the last three years (“innovative green businesses”) appear more optimistic about future growth than either their other green counterparts or other types of businesses, suggesting a role for innovation in future growth (see Table 5.5). Incentives from the federal stimulus bill and new demand created by other regulations may also make green businesses more likely than other business types to expand their green practices and services.
Table 5.5 Growth Plans for the Next Year by Survey
Green
Businesses Traditional Businesses
TRI Businesses
Innovative Green
Businesses Non-innovative
Green Businesses n= 334 176 61 157 111
Grow 51% 39% 30% 55% 47% Stay the same
size 42% 53% 52% 39% 46% Shrink 7% 8% 18% 6% 7%
Source: UC Berkeley Green Business Survey, 2009.
Table 5.4. Change in Operational Processes to Reduce Environmental Impact by Survey
Green Businesses Traditional Businesses TRI Businesses
n= 282 137 49 Yes 68% 65% 89% No 32% 35% 12%
Source: UC Berkeley Green Business Survey, 2009.

57
5.3 Green Practices and Activities
Not surprisingly, green businesses tend to see green practices as very important in their own operations. However, when their level of participation in such activities is compared to other firms, green businesses turn out not to be unusually environmentally conscious. While green businesses view green practices as important, when it comes to the actual implementation of green operations, they are not necessarily more likely to do so than other firm types. Further, TRI businesses are generally more aware and up to date on current practices than traditional firms. This is likely due to the fact that environmental laws and regulations generally most
heavily affect TRI businesses. Importance of Green Business Practices Table 5.6 shows, not surprisingly, that green businesses report valuing green practices much more than traditional and TRI businesses. Overall, 77% of green businesses rate such practices as Very important compared with only 46% of traditional businesses and TRI businesses. Green innovative businesses rate green practices as more important than non-innovative green businesses.
Responses also varied by firm size, as shown in Figure 5.1. As business size increases, firms seem to be more likely to rate the implementation of green practices as very important. While it might seem that this change would be due to a
Table 5.6 Importance of Green Business Practices
Green Businesses
Traditional Businesses
TRI Businesses
Innovative Green Businesses
Non-innovative Green Businesses
n= 298 175 59 157 112 Very important 77% 46% 46% 86% 65% Somewhat important 12% 43% 49% 13% 29% Not important 3% 11% 5% 1% 5% Source: UC Berkeley Green Business Survey, 2009.
77%72%
79%
92%
38%49% 52%
36%
0%
20%
40%
60%
80%
100%
<5 5-24 25-99 >100
Perc
ent o
f Res
pond
ents
Firm Size
Green (n=298) Traditional (n=170)
Figure 5.1 Businesses Rating Green Practices as Very Important, by Firm Size
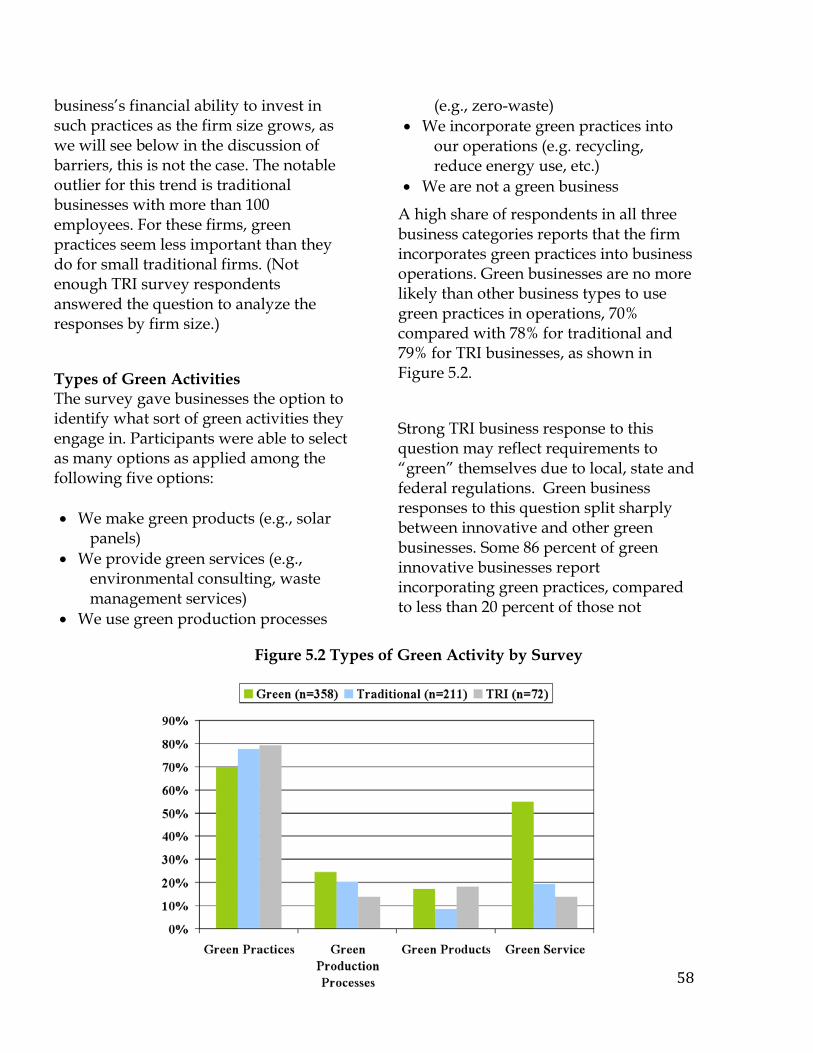
58
business’s financial ability to invest in such practices as the firm size grows, as we will see below in the discussion of barriers, this is not the case. The notable outlier for this trend is traditional businesses with more than 100 employees. For these firms, green practices seem less important than they do for small traditional firms. (Not enough TRI survey respondents answered the question to analyze the responses by firm size.)
Types of Green Activities The survey gave businesses the option to identify what sort of green activities they engage in. Participants were able to select as many options as applied among the following five options: • We make green products (e.g., solar
panels) • We provide green services (e.g.,
environmental consulting, waste management services)
• We use green production processes
(e.g., zero-waste) • We incorporate green practices into
our operations (e.g. recycling, reduce energy use, etc.)
• We are not a green business
A high share of respondents in all three business categories reports that the firm incorporates green practices into business operations. Green businesses are no more likely than other business types to use green practices in operations, 70% compared with 78% for traditional and 79% for TRI businesses, as shown in Figure 5.2.
Strong TRI business response to this question may reflect requirements to “green” themselves due to local, state and federal regulations. Green business responses to this question split sharply between innovative and other green businesses. Some 86 percent of green innovative businesses report incorporating green practices, compared to less than 20 percent of those not
Figure 5.2 Types of Green Activity by Survey

59
engaged in developing new products or processes. The area in which green businesses particularly exceed their traditional and TRI counterparts is in the provision of green services. This high percentage corresponds to the relatively high percentage of Environmental Services or Consulting firms in the green business survey (26%).
Barriers to Green Practice Implementation When asked about the barriers to incorporating green practices, there was relative consensus among the three business types. The largest issue for all businesses is the cost of incorporating green practices, followed by lack of demand and then lack of information (Table 5.7). Cost is a higher barrier for TRI businesses than for their green and traditional business counterparts. Information seems to be somewhat equally accessible to all business types.
In referring to both cost and lack of demand as being prohibitive barriers to some green practices, one TRI respondent wrote, “It can be expensive - we have to make persuasive arguments to our customers that it is the right thing to do, but the economy can make that a difficult
sell.” A traditional business respondent commented, “[It is] not expensive in terms of raw materials, rather in the cost of compliance with the bureaucracies.” Bureaucratic costs and “red tape” were often cited as reasons for unmanageable costs and lack of information for green practice implementation. A respondent from a traditional business in the Los Angeles region noted, “Some … government agencies and some utility companies make it nearly impossible to make it to anyone's advantage, or just so difficult you give up in trying to make your way through the incomprehensible process.” Even a green business in the East Bay region added, “The lack of green supplies on the shelf to purchase [makes it difficult]. The[re is a] lack of … information about alternatives when purchasing.” These views of green practice barriers are pervasive and span across business type and region.
Surprisingly, when asked about specific barriers to green practice implementation, the firms with more than 25 employees are more likely to cite the financial expense associated with such practices as a barrier (Table 5.8). It may be that the high cost practices become more relevant to larger businesses. For firms with less than 25
Table 5.7 Barriers to Incorporating Green Practices by Survey
Green Businesses
Traditional Businesses
TRI Businesses
n= 176 134 48 It is too expensive 59% 48% 63%
There is not enough information 27% 34% 27%
There is not enough demand from our customers 53% 40% 35% Source: UC Berkeley Green Business Survey, 2009

60
employees, a lack of demand from customers is the most cited barrier.
In sum, while green businesses are known for their environmentally friendly products and services, it appears that traditional and TRI businesses are at times just as engaged or more than green businesses in several green activities. Firm size seems to be a key variable in explaining green practices, with large firms being more willing to implement and expand green practices than smaller firms. The fact that there is a higher percentage of small firms in the green survey than in the traditional and TRI survey might help explain why green firms in the survey seem to be less likely to incorporate green practices than traditional and TRI firms.
5.4 Regional Assets
The following section examines factors behind firm location decisions for green companies. By asking companies why they located in a particular region, the survey aimed at identifying specific assets that could make a territory more attractive for new and emerging innovative green companies.
Location Patterns Although the dynamics of firm location are specific for each company, the location literature has identified a number of key factors that companies take into account when making location and relocation decisions. For instance, easy access to skilled and low-cost labor, a positive business climate, low taxes and financial incentives have traditionally been cited as important factors in firm location models. Product and firm maturity, the CEO’s residence, government policies, local markets, competitors, and suppliers are other factors influencing company location decisions.
Since the 1990s, a new lens for the study of firm location has emerged. Recent studies of small and entrepreneurial firms, as opposed to large companies, have found that less tangible factors such as personal preferences of entrepreneurs, quality of life, or local and regional networks of professional and personal relationships highly influence location and relocation decisions. The relevance of these less tangible factors for small and medium companies are often much larger than traditionally considered factors such as low taxes or financial incentives. This new focus on the endogenous assets of a
Table 5.8 Barriers to Incorporating Green Practices for Green Businesses by Firm
Size <5 5-24 25-99 ≥100 n= 77 54 26 9 It is too expensive 53% 56% 81% 78% There is not enough information 27% 26% 31% 33% There is not enough demand from our customers 58% 59% 31% 56% Source: UC Berkeley Green Business Survey, 2009

61
city or a region to explain firm location decisions and economic growth coincides with a worldwide surge in popularity of “new regionalism” and global city-region theories among policymakers and planners. These theories argue that comprehensive national strategies have lost effectiveness in the context of increasing economic globalization and that the competitive advantage of territories has increasingly come to rely on regional economic clusters and localized networks of firms and institutions.73 In the current context, local and regional networks of relationships – both personal and professional – are regarded as “important elements in explaining the locational behavior of firms.”74 For instance, an increasing number of independent studies have shown that for entrepreneurial and high-tech firms, which tend to be locally and regionally grown, the most important location factors are executive preferences, quality of life, and access to skilled labor.75
Small firms tend to have less
access to capital and distant markets, and, instead, take advantage of local and regional networks and opportunities.
The results of the survey, shown in Table 5.9, concur with this new body of literature. The survey confirms that three main factors guide green businesses in location and relocation decisions: executives’ residence, the existence of a strong green local market and quality of life. More specifically, 58% of the companies mention Executives’ residence as one of the three most relevant factors to locate in a region, followed by Local market for your product (56%) and Quality of life (52%). Other relevant factors included the availability and quality of the labor pool in the region (19%) and the availability of space (16%). In comparison, the existence of other firms in the area (11%), proximity to a university or research institution (13%), the availability of financial capital (12%) and the existence of suppliers (10%) are minor factors in location decisions. When
Table 5.9 Location Factors for Green Businesses
Most Relevant Factor
2nd Most Relevant Factor
3rd Most Relevant Factor
All 3 Factors Combined
n= 295 266 231 295 Executives' Residence 35% 12% 16% 58% Local Market for your Product 22% 24% 15% 56% Quality of Life 21% 21% 16% 52% Labor Pool 2% 9% 10% 19% Availability of Space 3% 9% 6% 16% Local University or Research Organization 5% 4% 5% 13% Availability of Financial Capital 2% 7% 4% 12% Other Firms in the Area 1% 5% 6% 11% Suppliers in the Area 2% 4% 5% 10% Other 5% 6% 16% 23% Source: UC Berkeley Green Business Survey, 2009

62
given the chance to comment on other factors behind their location choices a number of green companies mention personal reasons. Other relevant factors include the specific location-dependent character of their activities and the prior existence of the business in the area. For instance, a waste management company located in Los Angeles says, “treating waste generated in LA County, can't be elsewhere.”
Innovative green firms are less tied to their executives’ residence in their location decisions and instead rank quality of life and the existence of a local market as main location factors (Table 5.10). They also value the availability and quality of the labor pool more than other green businesses. Factors such as the availability of space or financial capital and, surprisingly, the proximity to a university or research institution are more valued by non-innovative than by innovative green firms.
By industry, most sectors value the three main factors mentioned above the most, except recycling/remediation firms, which perceive availability of space as the most important, and energy research and services companies, which consider access to a local university or research institution more important than access to a local market. Green construction firms are less tied to the executives’ residence and more to strong demand and good quality of life. Manufacturing companies, energy research and utilities, and environmental services are the sectors that most value the availability and quality of the labor pool and the proximity to universities. Proximity to research institutions is especially important for energy research and utilities companies while less relevant for construction (including solar panel installation), transportation, and recycling. On the other hand, availability of space is valued by more recycling/remediation, transportation and manufacturing firms (with
percentages higher than 30% for the three
Table 5.10 Location Factors for Innovative and Non-Innovative Green (in Top 3 factors)
Innovative Green Businesses
Non-innovative Green Businesses
n= 156 109 Executives' Residence 55% 64% Local Market for your Product 58% 54% Quality of Life 62% 41% Labor Pool 22% 15% Availability of Space 12% 19% Local University, lab, or other research organization 11% 14% Availability of Financial Capital 11% 14% Other Firms in the Area 7% 16% Suppliers in the area 6% 14% Other 29% 14% Source: UC Berkeley Green Business Survey, 2009
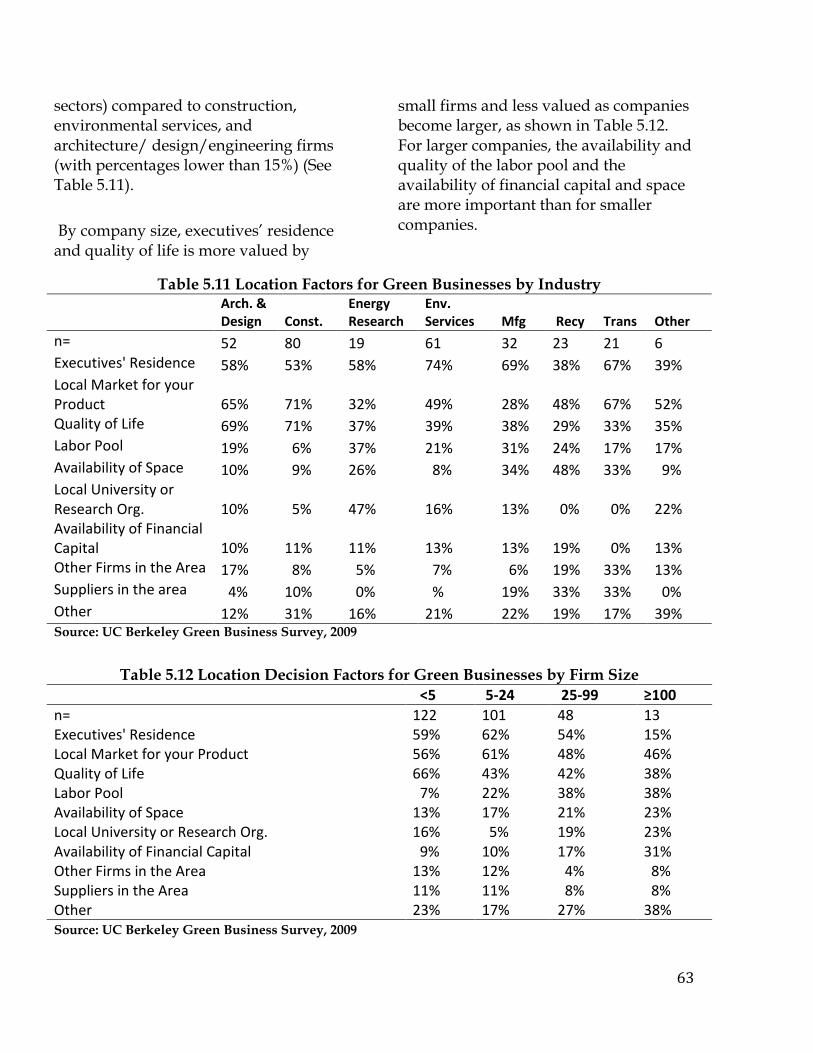
63
sectors) compared to construction, environmental services, and architecture/ design/engineering firms (with percentages lower than 15%) (See Table 5.11).
By company size, executives’ residence and quality of life is more valued by
small firms and less valued as companies become larger, as shown in Table 5.12. For larger companies, the availability and quality of the labor pool and the availability of financial capital and space are more important than for smaller companies.
Table 5.11 Location Factors for Green Businesses by Industry
Arch. & Design Const.
Energy Research
Env. Services Mfg Recy Trans Other
n= 52 80 19 61 32 23 21 6 Executives' Residence 58% 53% 58% 74% 69% 38% 67% 39% Local Market for your Product 65% 71% 32% 49% 28% 48% 67% 52% Quality of Life 69% 71% 37% 39% 38% 29% 33% 35% Labor Pool 19% 6% 37% 21% 31% 24% 17% 17% Availability of Space 10% 9% 26% 8% 34% 48% 33% 9% Local University or Research Org. 10% 5% 47% 16% 13% 0% 0% 22% Availability of Financial Capital 10% 11% 11% 13% 13% 19% 0% 13% Other Firms in the Area 17% 8% 5% 7% 6% 19% 33% 13% Suppliers in the area 4% 10% 0% % 19% 33% 33% 0% Other 12% 31% 16% 21% 22% 19% 17% 39% Source: UC Berkeley Green Business Survey, 2009
Table 5.12 Location Decision Factors for Green Businesses by Firm Size
<5 5-24 25-99 ≥100 n= 122 101 48 13 Executives' Residence 59% 62% 54% 15% Local Market for your Product 56% 61% 48% 46% Quality of Life 66% 43% 42% 38% Labor Pool 7% 22% 38% 38% Availability of Space 13% 17% 21% 23% Local University or Research Org. 16% 5% 19% 23% Availability of Financial Capital 9% 10% 17% 31% Other Firms in the Area 13% 12% 4% 8% Suppliers in the Area 11% 11% 8% 8% Other 23% 17% 27% 38% Source: UC Berkeley Green Business Survey, 2009

64
Regional differences among respondents, demonstrating differences between the state’s large urban areas and the inland metro-areas, are discussed in detail in Chapter 6. Plans to Stay in the Region Although the initial place of residence and personal preferences of the firm’s main executives are important factors in location decisions, 72 out of the 368 green companies in the survey (20%) say that they considered other locations outside their home region. Among those, 65% considered another location within California (47 out of 72), 32% another location within the US, and 3% an international location. When asked about the factors involved in rejecting alternative locations, most of the companies referred to higher costs and lower quality of life. Many of the alternative locations considered were close to the home region, not only within California but also within the same metropolitan region. For instance, some East Bay companies rejected San Francisco because of higher costs or some companies in Silicon Valley rejected Palo Alto because of higher housing prices. The fact that most of green companies stayed in their home region or considered other locations within the state shows how California is in general considered an attractive location for green businesses. As one wind energy company in the Inland Empire puts it, “It was about finding the optimum place, not rejecting other places. It is that California is one of the best states in the nation in promoting renewable energy. It also is leading the way to sustainability.”
Non-green companies in our survey show less affection for California. When asked about places where they would most likely move if relocating, only 32% of traditional companies and 16% of TRI companies would consider other Californian locations. In contrast, 59% and 63% respectively would consider other places within the country. For instance, a non-green natural stone fabrication and installation company in Los Angeles complains about the “oppressive California business climate,” while a food production and manufacturing company in the Upper San Joaquin Valley points at the “increased cost of regulation compliance” in the state. Among the traditional and TRI businesses that specified a particular reason for wanting to leave their region, all the responses were related to California’s perceived bad business environment. For instance, a traditional manufacturing company in San Diego says, “too many rules on waste and facilities in California and state tax.” On the same topic, a non-green construction company in the Upper San Joaquin Valley cites “regulation and cost of business” as its reasons for potential relocation.
In comparison, green companies are less concerned with strict regulations and high taxes in the state. While practically all of the responses of traditional and TRI companies were related to California’s perceived bad business environment (whether high taxes and costs of doing businesses or strict regulations), in their responses a lower percentage (75%) of green companies noted the bad business environment. Additionally, when green

65
companies mention bad business environment reasons, these are often more concerned with the high costs of living and taxes than with regulations. In fact, as the policy section shows, a high percentage of green companies see strict environmental regulation as an opportunity rather than a threat.
Despite complaints about California’s strict regulation and bad business environment, 98% of traditional companies and 96% of TRI companies plan to stay in their region in the near term. The percentages are similar to that of green companies (98%). In the long term, around 91% of green and traditional companies plan to stay, compared to 88% of TRI companies. By industry manufacturing firms are the most likely to leave their region, a finding that confirms other research on how “footloose” manufacturing is.76
5.5 Networks
Green innovation may depend on business networks, including market area, competitors, partners and suppliers’ location, as well as the frequency of
interactions with organizations within and outside the region. Responses indicate that green firms are more embedded in local/ regional networks and markets than traditional firms, and green innovative firms are even more locally/regionally embedded than non-innovative green firms.
Market Type and Location Private households constitute the largest market for green businesses, followed by private firms, as shown in Table 5.13. Private households are much less important to traditional and TRI firms, which instead rely much more heavily on private firms as a customer base. Green companies are more likely than other types of businesses to sell to local governments but less likely to sell to other public agencies. Green innovative companies are particularly reliant on private households, while other types of green firms are equally reliant on private households and private firms.
Green companies, and particularly green innovative companies, are more likely than other types of businesses to serve
Table 5.13 Primary Market Type by Survey
Green Businesses
Traditional Businesses
TRI Businesses
Innovative Green Businesses
Non-Innovative Green Businesses
n= 266 141 47 156 102 Private Firms 36% 51% 64% 35% 40% Private Households 48% 27% 13% 53% 38% Local Government 7% 5% 4% 5% 10% Other Public Sector 9% 16% 19% 6% 12% Source: UC Berkeley Green Business Survey, 2009

66
markets within their cities or regions. (See Table 5.14). TRI companies have a very different customer base, serving world markets and nationwide more than regional or local markets. When market and location are combined, the analysis gives us a more precise idea
of what kinds of markets are served and where they are located. Table 5.15 further emphasizes the importance of a local/ regional household market to green businesses, and the global, private firm market base for TRI businesses.
Table 5.14 Primary Market Location by Survey
Green Businesses
Traditional Businesses
TRI Businesses
Innovative Green Businesses
Non-Innovative Green Businesses
n= 266 141 47 156 102 Within Your City or Region 54% 42% 17% 59% 45% Throughout California 15% 16% 21% 12% 21% Throughout the Country 14% 21% 26% 14% 14% Throughout the World 16% 20% 38% 13% 21% Source: UC Berkeley Green Business Survey, 2009
Table 5.15 Combined Analysis (Market Type and Location) by Survey
Green Businesses
Traditional Businesses TRI Businesses
n= 266 141 47 Private Firms / City or Region 7% 14% 11% Private HH / City or Region 41% 21% 2% Local Gov. / City or Region 3% 2% 0% Other Public / City or Region 3% 4% 4% Private Firms / California 9% 9% 17% Private HH / California 3% 2% 2% Local Gov. / California 2% 1% 2% Other Public / California 2% 4% 0% Private Firms / US 8% 16% 15% Private HH / US 2% 1% 6% Local Gov. / US 1% 1% 2% Other Public / US 3% 4% 0% Private Firms / World 13% 12% 21% Private HH / World 2% 3% 2% Local Gov. / World 0% 1% 0% Other Public / World 2% 4% 15% Source: UC Berkeley Green Business Survey, 2009

67
Competitors, External Suppliers, Partners For green businesses, competitors, suppliers and partners are more likely to be located within the home city or region of the firms, with a small subset also oriented to global linkages (Table 5.16). Innovative green firms demonstrate a higher local/regional nature than non-innovative firms. There are significant variations by industry, as shown in Table 5.17. While primarily within their region, green energy research firms face competition
primarily at the national level, green manufacturing firms primarily face worldwide competition, and green environmental services firms face a mix of regional, statewide and nationwide competition.
Smaller firms are most likely to face competition from other firms within the region. As Table 5.18 shows, there is a strong relationship between firm size and the location of competitors for both green and traditional firms.
Businesses rely on a mix of regional,
Table 5.16 Location of Main Competitor
Green
Businesses Traditional TRI Innovative
Green Non-innovative
Green
n= 266 132 65 152 104 Within Your City or Region 59% 57% 22% 63% 55%
Throughout California 16% 11% 12% 13% 22%
Throughout the Country 15% 21% 25% 13% 18%
Throughout the World 9% 11% 17% 12% 5%
Source: UC Berkeley Green Business Survey, 2009
Table 5.17 Main Location of Competitors for Green Businesses by Industry
Arch. & Design Const
Energy Research
Env. Serv Mfg Recy Transp Other
n= 48 74 17 55 29 17 5 19 Within Your City or Region 79% 81% 13% 44% 18% 76% 60% 55%
Throughout California 12% 9% 27% 29% 4% 12% 20% 18%
Throughout the Country 9% 11% 60% 21% 21% 0% 0% 18%
Throughout the World 0% 0% 0% 6% 57% 6% 20% 9% Source: UC Berkeley Green Business Survey, 2009

68
statewide, national and international resources for networks of supplies and partners, as shown in Tables 5.19 and 5.20. Green and traditional firm networks are fairly similar, while TRI firms are more likely to draw from nationwide as
compared to statewide sources. Innovative green businesses on the other hand rely more on both local/regional and worldwide suppliers and partners than non-innovative green firms. The local orientation of green firms indicates
Table 5.19 Location of Main External Supplier
Green
Businesses Traditional TRI Innovative
Green Non-innovative
Green
n= 211 118 48 126 81 Within Your City or Region 53% 46% 46% 59% 44%
Throughout California 14% 17% 6% 13% 16%
Throughout the Country 18% 21% 35% 13% 26%
Throughout the World 16% 16% 13% 16% 14%
Source: UC Berkeley Green Business Survey, 2009
Table 5.20 Location of Main Partner
Green Businesses Traditional TRI
Innovative Green
Non-innovative Green
n= 166 73 20 99 62 Within Your City or Region 63% 59% 45% 69% 56% Throughout California 10% 7% 5% 9% 13% Throughout the Country 12% 22% 25% 7% 19% Throughout the World 14% 12% 25% 15% 11% Source: UC Berkeley Green Business Survey, 2009
Table 5.18 Main Location of Competitors by Company Size
Green Businesses Traditional Businesses
<5 5-24 25-99 ≥100 <5 5-24 25-99 ≥100
n= 111 90 44 10 29 63 30 7
Within Your City or Region 67% 62% 45% 30% 66% 59% 50% 29%
Throughout California 11% 17% 20% 40% 10% 6% 20% 14%
Throughout the Country 18% 13% 16% 10% 21% 21% 20% 43%
Throughout the World 5% 8% 18% 20% 3% 14% 10% 14%
Source: UC Berkeley Green Business Survey, 2009

69
that innovation does not necessarily come from statewide or nationwide companies but rather from companies that know how to use the markets, innovation systems and networks at their home city/region. At the same time, there is also a set of green innovative firms more connected to networks and markets throughout the world than non-innovative firms. Both findings point at an interesting local-global dynamic of green innovative firms, innovative with successful innovation coming from either a strong local focus or networks spread globally.
Between half and two-thirds of firms responded that they at times partner with other firms. Green firms, and particularly green innovative firms, indicate that other firms in the city or region are their primary partners (Table 5.20). More than half of the traditional firms responding to this question also use local partners, but traditional firms partner more frequently with firms spread throughout the country than do green firms. TRI firms have the highest shares of partners throughout the country or world. Green innovative firms, although primarily partnering locally, have a larger subset that used worldwide partners compared to other green or traditional firms.
Organizations The survey asked businesses about membership in professional organizations, as an indicator of how firms network within and among industries (Table 5.21). Berkeley-based Build It Green is the most cited organization by green businesses in the
survey. The names of the associations suggest that the solar, wind, and green building industries are the most organized industry sectors within the green economy with important trade associations such as the Solar Energy Industry Association (SEIA) and Cal SEIA for solar industries or Build It Green and USGBC for green building. In contrast, recycling/remediation and transportation companies mostly mention more general organizations, such as local chambers of commerce, suggesting the lack of strong sector-specific associations in those industries. There appear to be relatively few cross-industry connections established through specialized membership organizations, with the exception of Build it Green, which in addition to architects and builders has membership among the survey population from businesses that identify their industry as agriculture or legal. Frequency of Interactions Responses regarding interactions with other organizations show further the local and regional nature of many green businesses. Almost two thirds of green businesses report weekly or monthly interactions with similar businesses in the region.
As shown in Figure 5.3 below, green businesses have, in general, more frequent interactions with other organizations than traditional and TRI businesses. Green businesses also have higher shares of frequent interactions with local governments and local nonprofits.
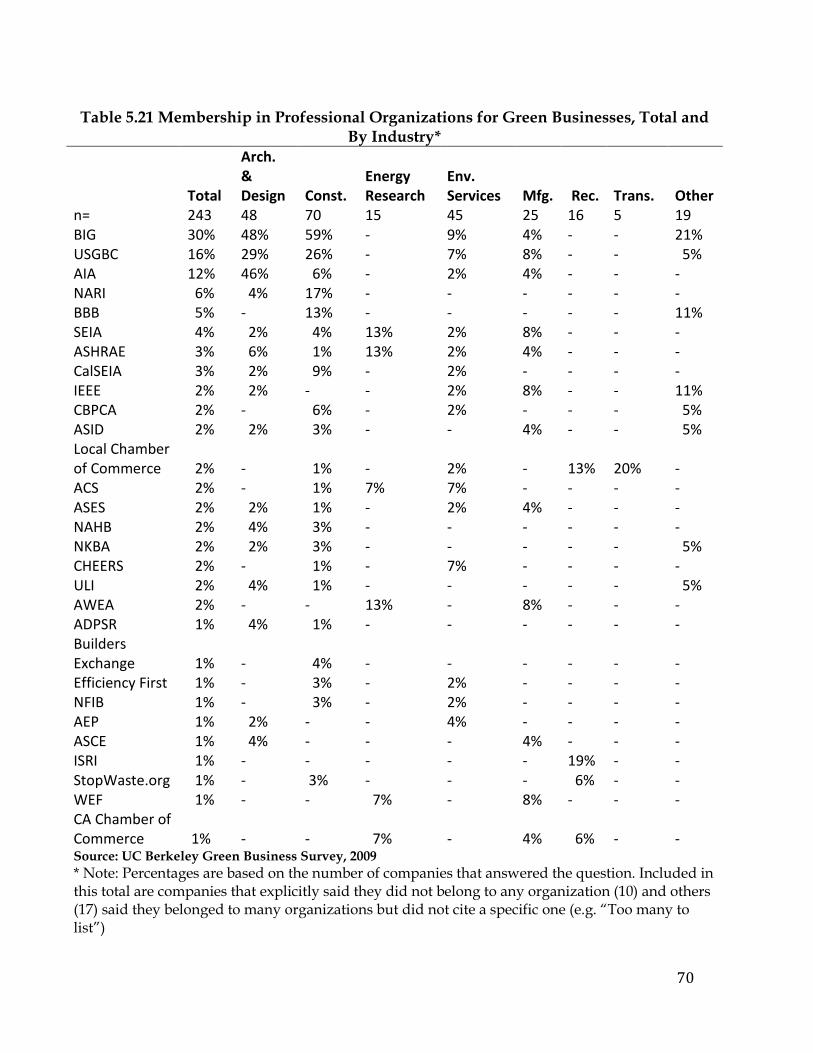
70
Table 5.21 Membership in Professional Organizations for Green Businesses, Total and By Industry*
Total
Arch. & Design Const.
Energy Research
Env. Services Mfg. Rec. Trans. Other
n= 243 48 70 15 45 25 16 5 19 BIG 30% 48% 59% - 9% 4% - - 21% USGBC 16% 29% 26% - 7% 8% - - 5% AIA 12% 46% 6% - 2% 4% - - - NARI 6% 4% 17% - - - - - - BBB 5% - 13% - - - - - 11% SEIA 4% 2% 4% 13% 2% 8% - - - ASHRAE 3% 6% 1% 13% 2% 4% - - - CalSEIA 3% 2% 9% - 2% - - - - IEEE 2% 2% - - 2% 8% - - 11% CBPCA 2% - 6% - 2% - - - 5% ASID 2% 2% 3% - - 4% - - 5% Local Chamber of Commerce 2% - 1% - 2% - 13% 20% - ACS 2% - 1% 7% 7% - - - - ASES 2% 2% 1% - 2% 4% - - - NAHB 2% 4% 3% - - - - - - NKBA 2% 2% 3% - - - - - 5% CHEERS 2% - 1% - 7% - - - - ULI 2% 4% 1% - - - - - 5% AWEA 2% - - 13% - 8% - - - ADPSR 1% 4% 1% - - - - - - Builders Exchange 1% - 4% - - - - - - Efficiency First 1% - 3% - 2% - - - - NFIB 1% - 3% - 2% - - - - AEP 1% 2% - - 4% - - - - ASCE 1% 4% - - - 4% - - - ISRI 1% - - - - - 19% - - StopWaste.org 1% - 3% - - - 6% - - WEF 1% - - 7% - 8% - - - CA Chamber of Commerce 1% - - 7% - 4% 6% - - Source: UC Berkeley Green Business Survey, 2009 * Note: Percentages are based on the number of companies that answered the question. Included in this total are companies that explicitly said they did not belong to any organization (10) and others (17) said they belonged to many organizations but did not cite a specific one (e.g. “Too many to list”)
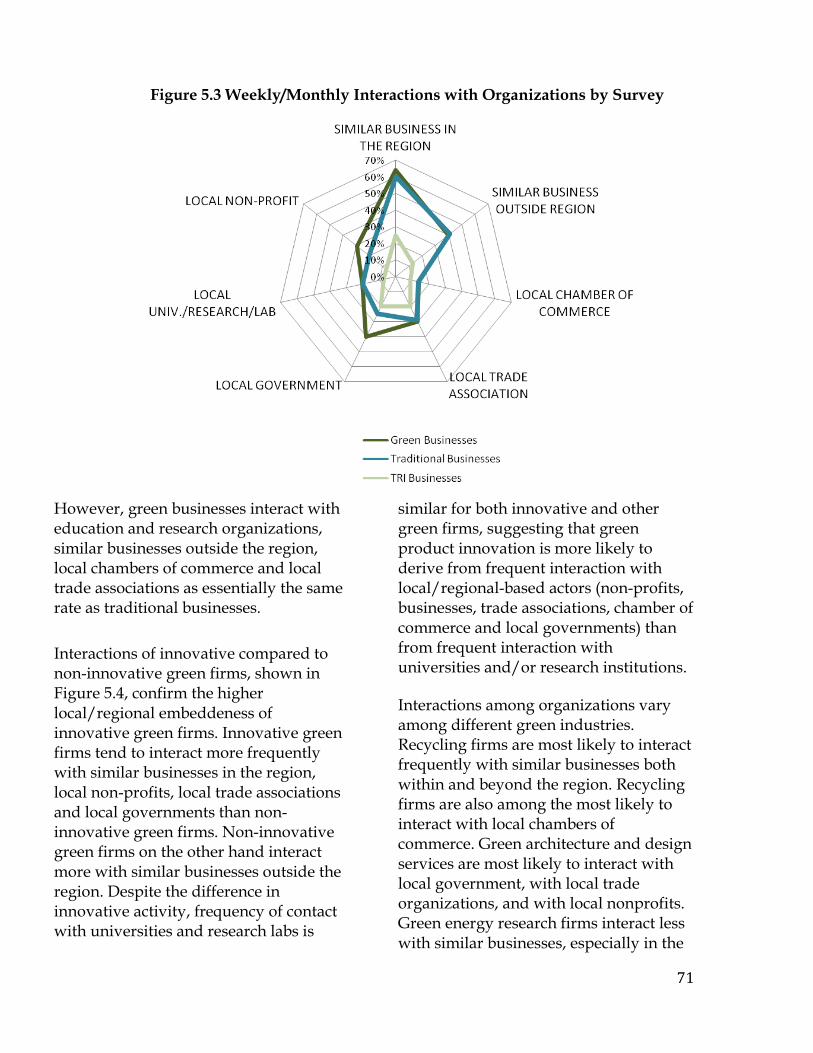
71
However, green businesses interact with education and research organizations, similar businesses outside the region, local chambers of commerce and local trade associations as essentially the same rate as traditional businesses.
Interactions of innovative compared to non-innovative green firms, shown in Figure 5.4, confirm the higher local/regional embeddeness of innovative green firms. Innovative green firms tend to interact more frequently with similar businesses in the region, local non-profits, local trade associations and local governments than non-innovative green firms. Non-innovative green firms on the other hand interact more with similar businesses outside the region. Despite the difference in innovative activity, frequency of contact with universities and research labs is
similar for both innovative and other green firms, suggesting that green product innovation is more likely to derive from frequent interaction with local/regional-based actors (non-profits, businesses, trade associations, chamber of commerce and local governments) than from frequent interaction with universities and/or research institutions.
Interactions among organizations vary among different green industries. Recycling firms are most likely to interact frequently with similar businesses both within and beyond the region. Recycling firms are also among the most likely to interact with local chambers of commerce. Green architecture and design services are most likely to interact with local government, with local trade organizations, and with local nonprofits. Green energy research firms interact less with similar businesses, especially in the
Figure 5.3 Weekly/Monthly Interactions with Organizations by Survey

72
region, and more with universities, research organizations and laboratories. Manufacturing firms interact most frequently with similar businesses outside the region. Figure 5.5 shows how larger green firms are more involved in all types of interactions with external organizations compared to smaller firms. The largest green businesses are more likely to interact frequently with local trade associations, local governments, local nonprofits and similar businesses outside the region.
5.6 Policy Perceptions and Impact
Responses to the policy section of the survey confirm that green businesses have, in general, a less negative perception of policies and regulation than non-green companies.
To the open-ended question Which city, county, or state policies have had a direct impact on your business? a total of 170 green businesses, 84 traditional businesses and 26 TRI businesses described the impact of different policies (Table 5.22). This question was coded to reflect the level of policy that businesses referred to (federal/state/local) and also, when mentioned, the perceived positive or negative impact of that policy. In the survey, 21% of the green companies mention negative policy impacts on their business, compared to 37% of traditional companies and 35% of TRI companies. Further, a remarkable 55% of green companies see policies having a positive impact, compared to 30% of traditional companies and 4% of TRI companies. On this topic a solar installation firm from Berkeley says, “City solar programs like
Figure 5.4 Weekly/Monthly Interactions with Organizations (Innovative and Non-Innovative Green Firms)
Source: UC Berkeley Green Business Survey, 2009

73
Figure 5.5 Weekly/Monthly Interaction with Organizations for Green Businesses by Company Size
Berkeley and San Francisco have increased business. State incentives also directly impact our business.”
By level of policy, (Table 5.23) there were no significant differences in the impact of
policies among the three types of respondents. State, local, and federal are, in this order, the most mentioned levels. Within these three levels, however, green companies seem to be relatively more affected by local policies and less by state policies than
Table 5.22 Perceived Positive/Negative Impact of Policies on Businesses by Survey
Green Businesses Traditional Businesses TRI Businesses
n= 170 84 26 Positive 55% 30% 4% Negative 21% 37% 35% Impact Not specified 24% 33% 61%
Source: UC Berkeley Green Business Survey, 2009
Source: UC Berkeley Green Business Survey, 2009

74
traditional companies. Innovative green firms are less affected by federal policies and more by the state and local levels. Green companies perceive policies at all levels as having a much more positive impact in their business than traditional companies did, as shown in Table 5.24. TRI companies responded only to local and state measures and have largely negative perceptions of both. Some respondents from green companies see opportunities in regulations. For instance, a green architecture company from the East Bay states, “Zoning, building codes, energy efficiency standards, difficult city approval processes create a demand for our services.”
AB32 and Stimulus Package The survey asked green, traditional and TRI companies about the specific impact of two policies: California’s Assembly Bill 32 (AB32) and the recent federal stimulus package (the American Recovery and Reinvestment Act of 2009, or ARRA). It is still early to evaluate the impact of AB32 and ARRA. A high percentage of companies did not know whether their business was affected or not, but some respondents report impacts at this early stage.
Table 5.23 Policy Impact by Level of Policy Survey*
Green Businesses
Traditional Businesses TRI Businesses
Green Innovative
Green Non-innovative
n= 170 84 26 94 58 Federal 27% 25% 12% 18% 33% State 67% 79% 62% 70% 67% Local 51% 34% 54% 57% 45% Source: UC Berkeley Green Business Survey, 2009 *Note: This was an open-ended question and therefore there could be two or more coded answers per company. Since the sample size is the number of companies that answered the question, percentages may sum up to more than 100%.
Table 5.24 Perception of Policy Impact by Policy Level by Survey
Green Businesses Traditional Businesses TRI Businesses n= 170 84 26 Federal Positive 16% 8% 0% Federal Negative 4% 5% 0% State Positive 18% 12% 0% State Negative 11% 19% 19% Local Positive 19% 6% 4% Local Negative 11% 13% 15% Source: UC Berkeley Green Business Survey, 2009

75
The response to AB32 emphasizes different perceptions among firms, with green firms seeing it as an opportunity for increased demand, and the others mostly as a new set of requirements. Respondents indicating strong impacts from AB 32 range from 19% of traditional to 25% of TRI companies (Table 5.25). Answers to an open-ended question indicate that while the effect of AB32 for green companies is mostly related to increased demand for their services or product (43%), for traditional and TRI firms, its impact has mostly materialized in new guidelines and requirements (Table 5.26). A green construction firm in the East Bay commented on the increased demand associated with AB 32 by writing, “People have become more interested in installing solar panels not only for the savings but also for environmental reasons.” Meanwhile, a
traditional construction firm from the Upper San Joaquin Valley says, “The processing time for environmental impacts has been lengthened. Future neighborhoods have additional requirements, which translates into cost to the home buyer.”
When the responses are analyzed by size, we find a strong relationship between firm size and impact of AB32, as shown in Table 5.27. The smaller the company, the more likely that AB32 has had no impact. A small environmental consulting company from LA that said that AB32 had not have any effect at all in its business says, “We are a relatively small company to start with.” A TRI company responded, “This plant has relatively low emissions; we've replaced fork lifts, reduced energy consumption and implemented an anti-idling policy.
Table 5.25 AB32 Impact by Survey Green Businesses Traditional Businesses TRI Businesses n= 270 53 55 Very much 20% 19% 25% Only slightly 31% 23% 40% Not at all 49% 58% 35% Source: UC Berkeley Green Business Survey, 2009
Table 5.26 Effect of AB32 by Survey (open-ended question)
Green Businesses Traditional Businesses TRI Businesses
n= 117 21 27 Increased demand 43% 10% 4% Increased cost 15% 14% 22% New guidelines/requirements 12% 43% 48% None/minor 9% 0% 11% Not yet 9% 0% 7% Unsure 8% 14% 0% Other 7% 24% 7%
Source: UC Berkeley Green Business Survey, 2009

76
The greater firm has taken more significant steps.”
ARRA has benefited relatively few companies in the survey. A higher percentage of green companies reported being very much affected by ARRA, relative to both TRI and traditional companies, as shown in Table 5.28. Open-ended responses described in Table 5.29 further illustrate the different perceptions of stimulus impact. Green companies
report benefiting from both increased demand and increased funding/tax credit, a portion of the stimulus targeted to their industry. TRI companies do not see increased demand but see increased possibilities to access funding. Traditional companies are more likely to mention increased demand than are green companies. The expectation of increased demand from traditional businesses may have to do either with the
Table 5.29 Effect of ARRA on Businesses by Survey (open-ended question)
Green Businesses Traditional Businesses TRI Businesses
n= 123 16 14 Not yet, but potential for increased funding / demand 28%
0%
29%
No impact 24% 25% 36% Increased funding / tax credit 19% 25% 14% Increased demand 15% 0% 0% Other 6% 13% 14% Negative impact 5% 25% 7% Unsure 4% 13% 0% Source: UC Berkeley Green Business Survey, 2009
Table 5.27 AB32 Impact for Green Businesses by Size
Green Businesses Traditional Businesses <5 5-24 25-99 ≥100 <5 5-24 25-99 ≥100 n= 111 93 43 11 13 24 11 4 Very much 14% 20% 28% 36% 8% 13% 36% 25% Only slightly 25% 31% 33% 45% 23% 17% 27% 50% Not at all 60% 48% 40% 18% 69% 71% 36% 25% Source: UC Berkeley Green Business Survey, 2009
Table 5.28 ARRA Impact by Survey Green Businesses Traditional Businesses TRI Businesses n= 273 56 53 Very much 12% 4% 4% Only slightly 22% 23% 30% Not at all 66% 73% 66% Source: UC Berkeley Green Business Survey, 2009

77
hope that the stimulus will speed recovery of the economy, or that traditional construction firms will benefit from expected new projects.
As with AB32, there seems to be a relationship between the perception of ARRA’s effect and the size of the company, the effect being more relevant to larger companies. As shown in Table 5.30, 8% of green companies with less than five full-time employees are highly affected by ARRA, compared to 45% of companies with 100 or more full-time employees. Green innovative firms are
more affected by AB32 than non-innovative firms. There are no significant differences between innovative and non-innovative green firms in the case of the stimulus package (see Table 5.31 below).
Training While in-house training remains the overwhelming preference of firms across types, survey results shown in Table 5.32 indicate that green companies rely slightly more on external programs and organizations for their training needs. For instance, a number of solar installation firms confirm their reliance
Table 5.30 ARRA Impact by Firm Size Green Businesses Traditional Businesses <5 5-24 25-99 ≥100 <5 5-24 25-99 ≥100 n= 115 94 42 11 13 25 12 5 Very much 8% 6% 26% 45% 8% 0% 8% 0% Only slightly 17% 28% 26% 9% 8% 24% 17% 60% Not at all 75% 66% 48% 45% 85% 76% 75% 40% Source: UC Berkeley Green Business Survey, 2009
Table 5.31 Impact of AB32 and ARRA, Innovative and Non-Innovative Green Businesses AB 32 ARRA
Innovative Green Businesses
Non-innovative Green Businesses
Innovative Green Businesses
Non-innovative Green Businesses
n= 155 110 156 110 Very Much 23% 15% 12% 11% Only slightly 32% 25% 20% 23% Not at all 42% 57% 66% 64% Source: UC Berkeley Green Business Survey, 2009
Table 5.32 Employee Training Source by Survey*
Green Businesses
Traditional Businesses TRI Businesses
n= 248 133 50 We train our employees ourselves 82% 94% 100% We work with a local organization to provide training 30% 19% 24% Source: UC Berkeley Green Business Survey, 2009 *Note: Not open-ended but multiple answers possible, percentages may sum up more than 100%.
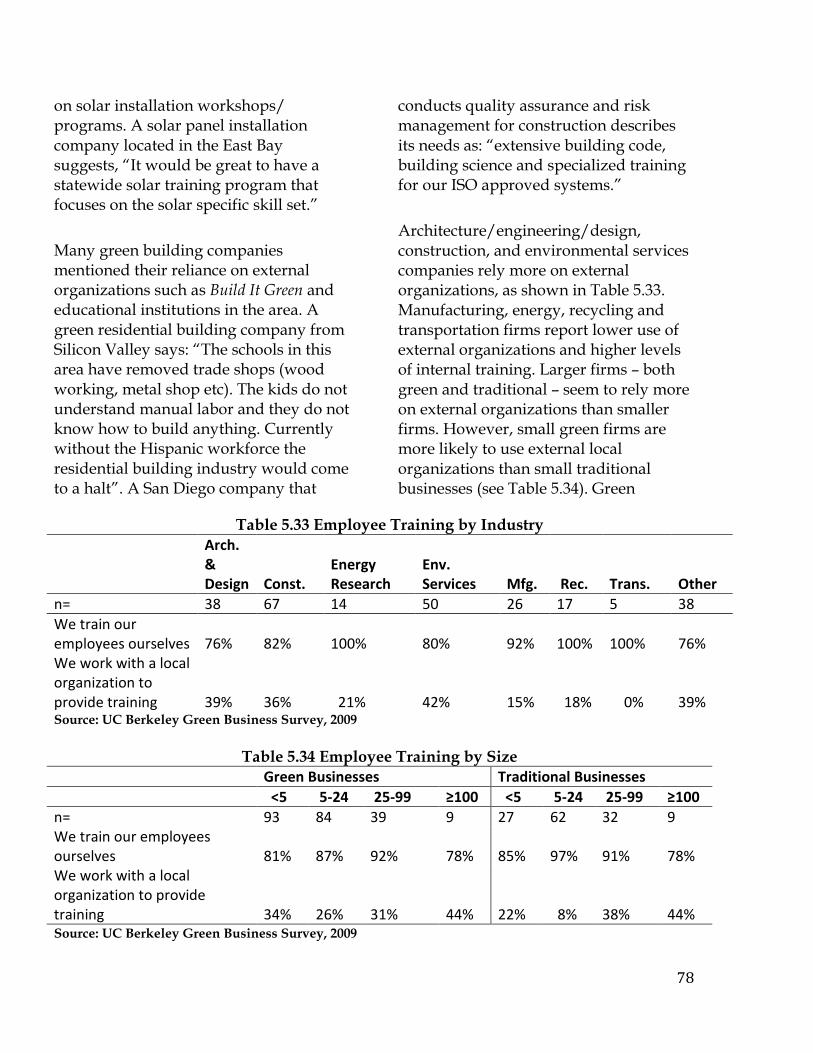
78
on solar installation workshops/ programs. A solar panel installation company located in the East Bay suggests, “It would be great to have a statewide solar training program that focuses on the solar specific skill set.”
Many green building companies mentioned their reliance on external organizations such as Build It Green and educational institutions in the area. A green residential building company from Silicon Valley says: “The schools in this area have removed trade shops (wood working, metal shop etc). The kids do not understand manual labor and they do not know how to build anything. Currently without the Hispanic workforce the residential building industry would come to a halt”. A San Diego company that
conducts quality assurance and risk management for construction describes its needs as: “extensive building code, building science and specialized training for our ISO approved systems.”
Architecture/engineering/design, construction, and environmental services companies rely more on external organizations, as shown in Table 5.33. Manufacturing, energy, recycling and transportation firms report lower use of external organizations and higher levels of internal training. Larger firms – both green and traditional – seem to rely more on external organizations than smaller firms. However, small green firms are more likely to use external local organizations than small traditional businesses (see Table 5.34). Green
Table 5.33 Employee Training by Industry
Arch. & Design Const.
Energy Research
Env. Services Mfg. Rec. Trans. Other
n= 38 67 14 50 26 17 5 38 We train our employees ourselves 76% 82% 100% 80% 92% 100% 100% 76% We work with a local organization to provide training 39% 36% 21% 42% 15% 18% 0% 39% Source: UC Berkeley Green Business Survey, 2009
Table 5.34 Employee Training by Size
Green Businesses Traditional Businesses <5 5-24 25-99 ≥100 <5 5-24 25-99 ≥100 n= 93 84 39 9 27 62 32 9 We train our employees ourselves 81% 87% 92% 78%
85%
97%
91%
78%
We work with a local organization to provide training 34% 26% 31% 44%
22%
8%
38%
44%
Source: UC Berkeley Green Business Survey, 2009
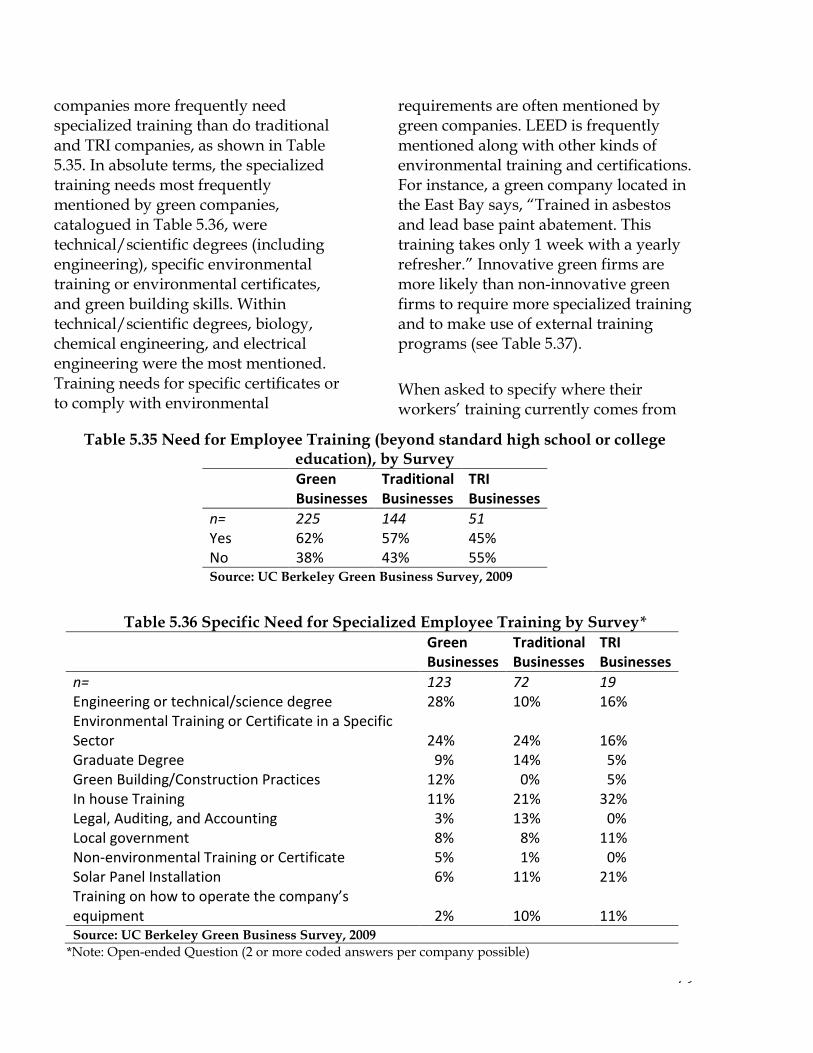
79
companies more frequently need specialized training than do traditional and TRI companies, as shown in Table 5.35. In absolute terms, the specialized training needs most frequently mentioned by green companies, catalogued in Table 5.36, were technical/scientific degrees (including engineering), specific environmental training or environmental certificates, and green building skills. Within technical/scientific degrees, biology, chemical engineering, and electrical engineering were the most mentioned. Training needs for specific certificates or to comply with environmental
requirements are often mentioned by green companies. LEED is frequently mentioned along with other kinds of environmental training and certifications. For instance, a green company located in the East Bay says, “Trained in asbestos and lead base paint abatement. This training takes only 1 week with a yearly refresher.” Innovative green firms are more likely than non-innovative green firms to require more specialized training and to make use of external training programs (see Table 5.37).
When asked to specify where their workers’ training currently comes from
Table 5.35 Need for Employee Training (beyond standard high school or college education), by Survey
Green Businesses
Traditional Businesses
TRI Businesses
n= 225 144 51 Yes 62% 57% 45% No 38% 43% 55% Source: UC Berkeley Green Business Survey, 2009
Table 5.36 Specific Need for Specialized Employee Training by Survey*
Green Businesses
Traditional Businesses
TRI Businesses
n= 123 72 19 Engineering or technical/science degree 28% 10% 16% Environmental Training or Certificate in a Specific Sector 24% 24% 16% Graduate Degree 9% 14% 5% Green Building/Construction Practices 12% 0% 5% In house Training 11% 21% 32% Legal, Auditing, and Accounting 3% 13% 0% Local government 8% 8% 11% Non-environmental Training or Certificate 5% 1% 0% Solar Panel Installation 6% 11% 21% Training on how to operate the company’s equipment 2% 10% 11% Source: UC Berkeley Green Business Survey, 2009
*Note: Open-ended Question (2 or more coded answers per company possible)

80
(an open-ended question), green companies often mentioned university/college (34%), industry organizations or industry events (25%), and workers with prior experience (19%) among others. Build it Green, USGBC, and PG&E Pacific Energy Center are often mentioned as sources for training and education, both in this question and in general in the training-related questions. Some green companies also mentioned webinars and the Internet as their source of training (e.g. Lynda.com).
Improving Regional Competitiveness
As mentioned earlier, green businesses perceive taxes and regulation less negatively than non-green companies do. In fact, as the following section shows, a high percentage of green companies see strict environmental regulation as an opportunity to improve regional competitiveness rather than a threat. Green companies have a particular notion of the factors that make their region more competitive, one that does not always coincide with the vision of non-green companies. Table 5.38 below shows the responses for the three surveys (green, traditional and TRI businesses) to the
question How could your region be more competitive in attracting businesses in your industry? In general terms, green businesses perceive taxes and regulation less negatively than non-green companies. In the survey, 48% of TRI companies and 40% of traditional businesses said that lower costs of doing business (including lower taxes) would make the region more competitive. This compares to 22% of green businesses. Green businesses would like more government incentives, not only for businesses (financial incentives) but also to increase the demand for green products among consumers (market incentives/market education). Seventeen percent of green businesses think that more financial incentives would make the region more competitive, while 10% point to environmentally-friendly market-related incentives (e.g. green education of consumers). On this topic, a soil remediation and restoration company based in Silicon Valley says, ”There needs to be significantly more education on sustainable landscaping and soil management practices” while a green construction company in the East Bay suggests, “Offer incentives to be a green business that are tangible. While it is
Table 5.37 Training for Innovative vs. Non-Innovative Green Firms
Innovative Green
Non-innovative Green
Specialized Training n= 150 109 Yes (Firm needs specialized training) 69% 58% No (Firms does not need specialized training) 31% 42% Internal/External Training n= 135 92 We train our employees ourselves 85% 86% We work with a local organization to provide training 34% 28% Source: UC Berkeley Green Business Survey, 2009

81
becoming mainstream, green business is still as much a personal ethical choice of the management, as it may be market driven.” A green architecture firm with more than 100 employees located in Silicon Valley suggests, “Provide more energy conservation financial incentives for lower to middle income families and businesses.” There are significant differences regarding the perception of regulation between green and non-green companies. Overall, 38% of TRI and 16% of traditional companies believe that less regulation will make the region more competitive compared to only 10% of green companies. In fact, 4% of green companies in the survey saw environmental regulation as a factor that contributes to the region’s competitiveness in the green economy.
Green businesses also ascribe more importance than traditional and TRI companies do to issues such as quality of life and public transportation/ infrastructure. In order to improve regional competitiveness, a San Diego-based environmental consulting company suggests: “moving towards developing and implementing a vision of sustainability (public transit, green spaces, walkable communities, energy and water self-sufficiency).” Fourteen percent of green businesses in the survey mentioned in open-ended responses that improving quality of life with, for instance, better public schools, lower housing costs, less crime or more affordable housing, would make the region more competitive for companies and more attractive for workers. Improving public transportation and
Table 5.38 Regional Competitiveness Improvement by Survey
Green Businesses
Traditional
TRI
n= 204 112 48 Lower Cost of Doing Business (esp. labor-related costs or taxes) 22% 40% 48% Financial Incentives/Tax breaks/Loans 17% 9% 13% Improve Quality of Life 14% 10% 2% Improve Public Transportation and Infrastructure 12% 7% 4% Permit Streamlining/Business-friendly Services 11% 5% 17% Environmental Market Incentives / Market Education 10% 0% 0% Less Regulation 10% 16% 38% Improve Government and Economy 8% 15% 13% Improve Labor Pool 5% 5% 8% Environmentally Friendly Regulation 4% 2% 4% Do Nothing 7% 7% 0% Other 9% 9% 6% Source: UC Berkeley Green Business Survey, 2009
Note: This was an open-ended question in which answers were coded into one or more categories. This is why the total of percentages could sum up to more than 100%. The sample size is the number of companies that gave one answer at least.
82
infrastructure was also mentioned by 12% of green companies, compared to 7% of traditional companies and 4% of TRI firms.
Both green and non-green businesses emphasize the necessity of removing barriers and streamline processes in order to develop standards and best practices. Standardized processes in different cities and regions would allow companies to scale up their business and have easier access to a larger market. The building and solar manufacturing industries are especially insistent on this in order to improve regional competitiveness. To make the region more competitive, an East Bay green architectural design company suggests: “more efficient permitting processes at the city level; more consistency from city to city; higher level of service and competency from permitting authorities; greater support for creative/innovative/green design.” A waste management company located in Los Angeles says: “streamlined environmental permitting from a system that looks at the whole picture, not just single issue agencies for air, water, etc.” Streamlined permitting seems especially relevant for green building and solar manufacturing companies. In the case of solar, in addition to state and national level organizations such as SEIA and Cal SEIA, region-specific industry organizations like SolarTech in Silicon Valley have emerged recently to accelerate the process of permit streamlining and gains associated with economies of scale.
Finally, some firms also volunteered that there is no need to make the region more
competitive because there is already too much competition. This is especially true for professional and legal services. Out of the 14 green companies included in this category, 5 are architecture/ design/ engineering firms and 5 are environmental services companies. On the other side, 4 out of the 7 traditional companies that responded “do nothing” to this open-ended question were law firms. As mentioned by an architecture and engineering consultancy company in the East Bay, “why would I want my region to attract more competitors? There are already too many architects, builders, and real estate businesses around here.”
Perceptions differ between innovative and non-innovative green firms. In general, innovative firms assign more importance to factors such as lower taxes, quality of life and environmental market incentives to improve the region’s competitiveness and less importance to permit streamlining and improved public transportation and infrastructure (see Table 5.39).
By industry (Table 5.40), energy research and utilities companies and manufacturing companies ask relatively more frequently for lower taxes and labor-related costs while recycling/remediation and, again, regulation. The case of the recycling/remediation industry is paradoxical because although they demand less regulation in general, it is the sector that is most likely to support environmentally friendly regulation (most likely because it increase the demand for recycled products).
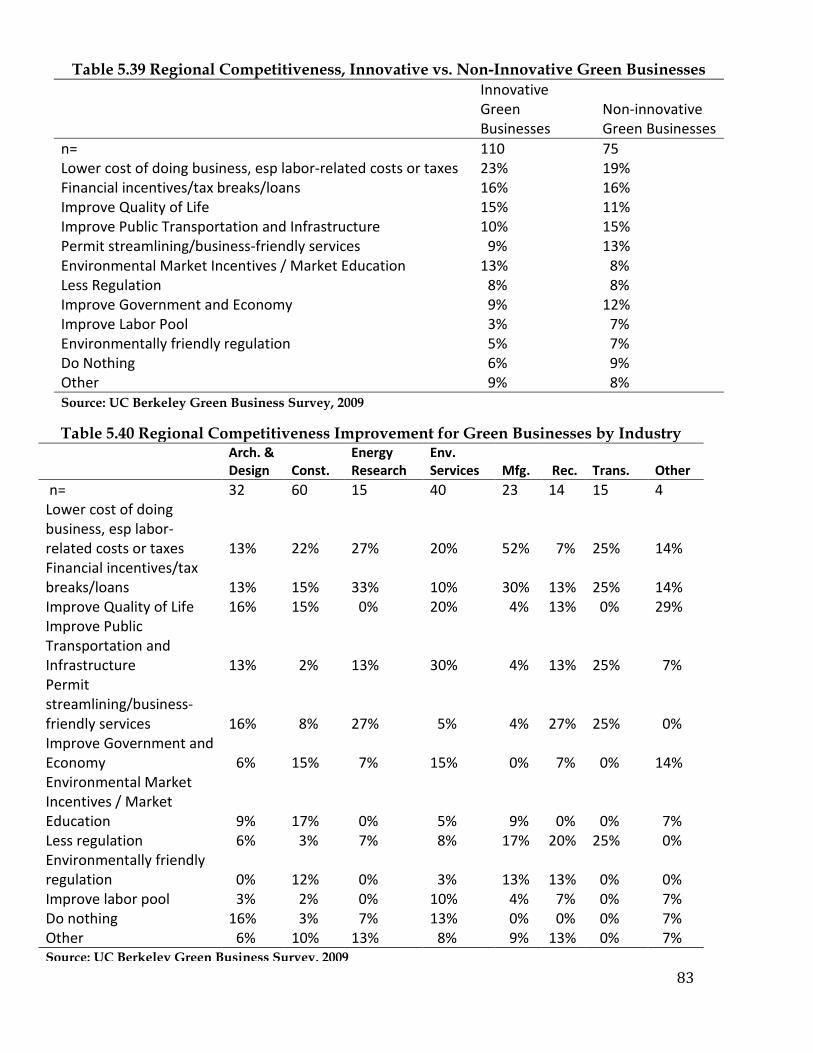
83
Table 5.40 Regional Competitiveness Improvement for Green Businesses by Industry
Arch. & Design Const.
Energy Research
Env. Services Mfg. Rec. Trans. Other
n= 32 60 15 40 23 14 15 4 Lower cost of doing business, esp labor-related costs or taxes 13% 22% 27% 20% 52% 7% 25% 14% Financial incentives/tax breaks/loans 13% 15% 33% 10% 30% 13% 25% 14% Improve Quality of Life 16% 15% 0% 20% 4% 13% 0% 29% Improve Public Transportation and Infrastructure 13% 2% 13% 30% 4% 13% 25% 7% Permit streamlining/business-friendly services 16% 8% 27% 5% 4% 27% 25% 0% Improve Government and Economy 6% 15% 7% 15% 0% 7% 0% 14% Environmental Market Incentives / Market Education 9% 17% 0% 5% 9% 0% 0% 7% Less regulation 6% 3% 7% 8% 17% 20% 25% 0% Environmentally friendly regulation 0% 12% 0% 3% 13% 13% 0% 0% Improve labor pool 3% 2% 0% 10% 4% 7% 0% 7% Do nothing 16% 3% 7% 13% 0% 0% 0% 7% Other 6% 10% 13% 8% 9% 13% 0% 7% Source: UC Berkeley Green Business Survey, 2009
Table 5.39 Regional Competitiveness, Innovative vs. Non-Innovative Green Businesses
Innovative Green Businesses
Non-innovative Green Businesses
n= 110 75 Lower cost of doing business, esp labor-related costs or taxes 23% 19% Financial incentives/tax breaks/loans 16% 16% Improve Quality of Life 15% 11% Improve Public Transportation and Infrastructure 10% 15% Permit streamlining/business-friendly services 9% 13% Environmental Market Incentives / Market Education 13% 8% Less Regulation 8% 8% Improve Government and Economy 9% 12% Improve Labor Pool 3% 7% Environmentally friendly regulation 5% 7% Do Nothing 6% 9% Other 9% 8% Source: UC Berkeley Green Business Survey, 2009
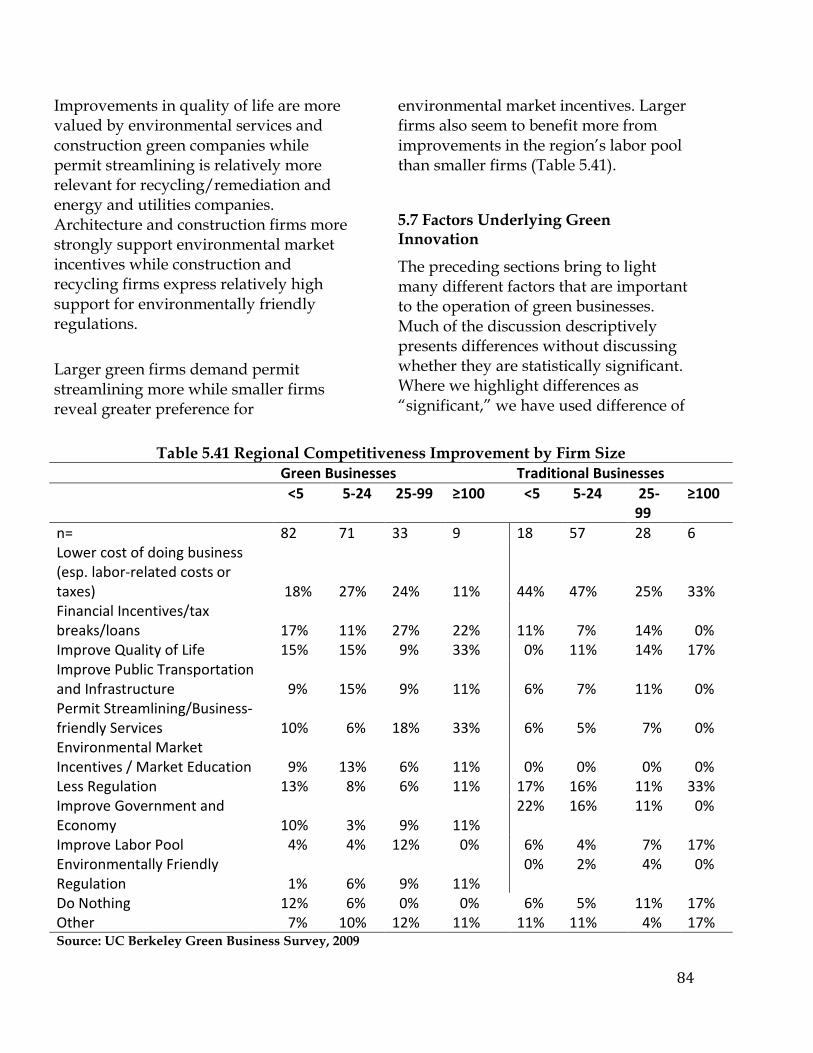
84
Improvements in quality of life are more valued by environmental services and construction green companies while permit streamlining is relatively more relevant for recycling/remediation and energy and utilities companies. Architecture and construction firms more strongly support environmental market incentives while construction and recycling firms express relatively high support for environmentally friendly regulations.
Larger green firms demand permit streamlining more while smaller firms reveal greater preference for
environmental market incentives. Larger firms also seem to benefit more from improvements in the region’s labor pool than smaller firms (Table 5.41).
5.7 Factors Underlying Green Innovation
The preceding sections bring to light many different factors that are important to the operation of green businesses. Much of the discussion descriptively presents differences without discussing whether they are statistically significant. Where we highlight differences as “significant,” we have used difference of
Table 5.41 Regional Competitiveness Improvement by Firm Size Green Businesses Traditional Businesses
<5 5-24 25-99 ≥100 <5 5-24 25-
99 ≥100
n= 82 71 33 9 18 57 28 6 Lower cost of doing business (esp. labor-related costs or taxes) 18% 27% 24% 11%
44%
47%
25%
33%
Financial Incentives/tax breaks/loans 17% 11% 27% 22% 11% 7% 14% 0% Improve Quality of Life 15% 15% 9% 33% 0% 11% 14% 17% Improve Public Transportation and Infrastructure 9% 15% 9% 11%
6%
7%
11%
0%
Permit Streamlining/Business-friendly Services 10% 6% 18% 33%
6%
5%
7%
0%
Environmental Market Incentives / Market Education 9% 13% 6% 11%
0%
0%
0%
0%
Less Regulation 13% 8% 6% 11% 17% 16% 11% 33% Improve Government and Economy 10% 3% 9% 11%
22% 16% 11% 0%
Improve Labor Pool 4% 4% 12% 0% 6% 4% 7% 17% Environmentally Friendly Regulation 1% 6% 9% 11%
0% 2% 4% 0%
Do Nothing 12% 6% 0% 0% 6% 5% 11% 17% Other 7% 10% 12% 11% 11% 11% 4% 17% Source: UC Berkeley Green Business Survey, 2009

85
means tests that indicate there is a 90 percent chance or better that the difference is not equal to zero. However, these descriptive statistics and simple tests do not tell us which characteristics are most important or how a set of characteristics interact to influence whether a business will innovate new green products or services or innovate green processes in their production process. To examine the factors in more depth, we run two sets of statistical models, one to identify the characteristics that influence innovation of green products and services, and the other to identify factors that influence innovation of green processes in production and operations. Because the dependent variable and many of the independent variables are dummy variables (with values of 0 or 1 only), we use a probit analysis that reports marginal values for all dummy variables to estimate the factors influencing the probability that a business will innovate green products or services, in the first set of models, or will innovate green processes, in the second set of models. We conducted the analysis in STATA, using the dprobit function.
We show three versions in modeling the propensity to innovate green products or services, the first with only regional, industry, and survey dummies. The second includes additional variables related to firm characteristics (size, age) and market area. The third includes network variables, such as membership in Build It Green, interactions with universities and nonprofits, and as well as the propensity of the firm to adopt green practices. The tables reported here show one version of the model for each
column. Cell entries are the estimated marginal effect with the probability of the z statistic being no different from zero shown in parentheses. We show four versions in modeling the propensity to innovate green processes. The first three are as previously described. The fourth adds a policy variable, the degree of impact the firm expects from AB32.
Table 5.42 shows the results for three models of the propensity to innovate green products. Although some differences by regions show up in the simple crosstab analyses that will be discussed in Chapter 6, when combined with other factors, regional differences were for the most part not significant. Only the East Bay was significantly negative in the third version of the model, and only at the 10% level of significance (a marginal result at best). In contrast, both manufacturing and architecture/ engineering/design firms were significantly more likely to innovate green products or services than other sectors, in all three versions of the model. (As noted previously, because many of the architecture/engineering/design firms consider simple LEED certification their innovation, this finding should be treated with caution.) Traditional establishments were significantly less likely than other firms to innovate green products. In the second version of the model, standalone establishments were less likely to be innovative, but only at a 10% degree of confidence (a marginal result). There is strong evidence in versions 2 and 3 of the model that firms serving local and regional markets were more likely to be innovating green

86
products and services. Other linkage variables were not significant, but firms that were taking several green actions were more likely to be innovating green products as well.
variables were not significant, but firms
Table 5.43 shows the results for four models of the propensity to innovate green processes in the production process. We add a fourth column to this
Table 5.42 Factors Influencing Green Product or Service Innovation Dependent Variable: Innovative Green Product or Service
Regional and Industry Only
Regional, Industry, Firm and Market Characteristics
With Network Characteristics
Regional Dummies East Bay -0.6947 (0.200) -0.0803 (0.168) -0.1198 (0.078)* Inland Empire -0.1538 (0.122) -0.1147 (0.295) -0.1420 (0.228) San Diego 0.0495 (0.500) 0.0556 (0.480) 0.0291 (0.737) Silicon Valley -0.1876 (0.782) -0.0694 (0.333) -0.0919 (0.254) Upper San Joaquin 0.0656
(0.547) 0.0456 (0.693) 0.0407 (0.741)
Industry Dummies Architecture 0.2610
(0.000)*** 0.2429 (0.002)*** 0.1690 (0.062)*
Construction 0.2291 (0.000)***
0.1560 (0.022)** 0.0928 (0.239)
Energy 0.1658 (0.086)*
0.1346 (0.182) 0.1617 (0.137)
Manufacturing 0.1871 (0.007)***
0.2234 (0.003)*** 0.2350 (0.004)***
Recycling -0.0875 (0.444) -0.1749 (0.151) -0.2042 (174) Transportation 0.0347 (0.770) -0.0558 (0.657) -0.0199 (0.894) TRI dummy -0.0556 (0.524) -0.1126 (0.238) -0.2241 (0.894) Traditional dummy -0.0709 (0.157) -0.0912 (-0.090)* -0.1672 (0.008)*** Standalone Estab -0.1090 (0.052)* -0.1001 (0.118) Employment FT 4.95 E-5 (0.371) 1.879 E-4 (0.298) Years in business -4.32 E-4 (0.707) -4.471 E-4 (0.753) City/Reg Market 0.2882 (0.000)*** 0.1665 (0.010)*** World Market 0.1319 (0.846) -0.0602 (0.433) Build it Green 0.0234 (0.792) Green Actions 0.0693 (0.002)*** Freq. univ. contacts 0.0138 (0.845) Freq. nonprofit contacts 0.0955 (0.138)
Number of obs 561 519 437 Pseudo R-Squared 0.0460 0.0921 0.1307 Prob > Chi-Squared 0.0008*** 0.0000*** 0.0000*** *** Significant at 1% level or better ** Significant at 5% * Significant at 10%
87
set of regressions to include one policy variable, the respondent’s estimate of the likely impact of AB32 on the firm. Because there were missing responses to this variable, the inclusion of the variable decreases the sample size. For this reason, we include a model of networks and green actions with and without the AB32 variable.
Overall, the results on green process innovation are less stable among the different versions of the model than for the model of green products and services. Before including network and policy characteristics, both the Inland Empire and Silicon Valley firms show a significant, positive relationship with green process innovation. This significance disappears when network and policy variables are added to the model. The results for industries are also somewhat inconsistent among the models, but it appears that the industries most likely to innovate products and services differ from those likely to innovate green processes. The recycling industry as well as TRI businesses are the most likely to be involved in green process innovation. The TRI dummy significance disappears in the final version of the model, but this may be the result of the strong correlation between firms that thought AB32 would affect their operations and TRI firms. Construction firms also showed significant effects in the first two versions of the model. When networking effects are also taken into account, older firms appear more likely to innovate new processes. There also appears to be a build-up of knowledge that supports process innovation—membership in
Build It Green and incorporation of several green practices raised the likelihood that a business would innovate new processes. Firms that expected AB32 to affect their operations also were more likely to innovate new processes.
5.8 Summary of Findings
The survey results show how broadly green innovation is spread throughout the economy. Innovation occurs in firms that are part of green industries but also takes place within large traditional firms and as part of the adaptation to environmental requirements by firms being monitored for toxic releases. New green products and services are more likely to come from green companies, especially those in manufacturing and in architecture, engineering and design. In contrast, process innovation is more likely to occur in recycling firms, but also in TRI firms. Indeed, green firms are no more likely than traditional or TRI firms to make use of green practices in their operations. Cost, lack of demand from customers, and lack of information are, in that order, the main barriers to incorporating green practices, but firms that have made the investment in green practices are more likely to develop new green processes as well. The regression models address only innovation. The survey, however, addressed other important aspects of the operation of green businesses, including factors that influence their location choice and growth prospects. One strong result from
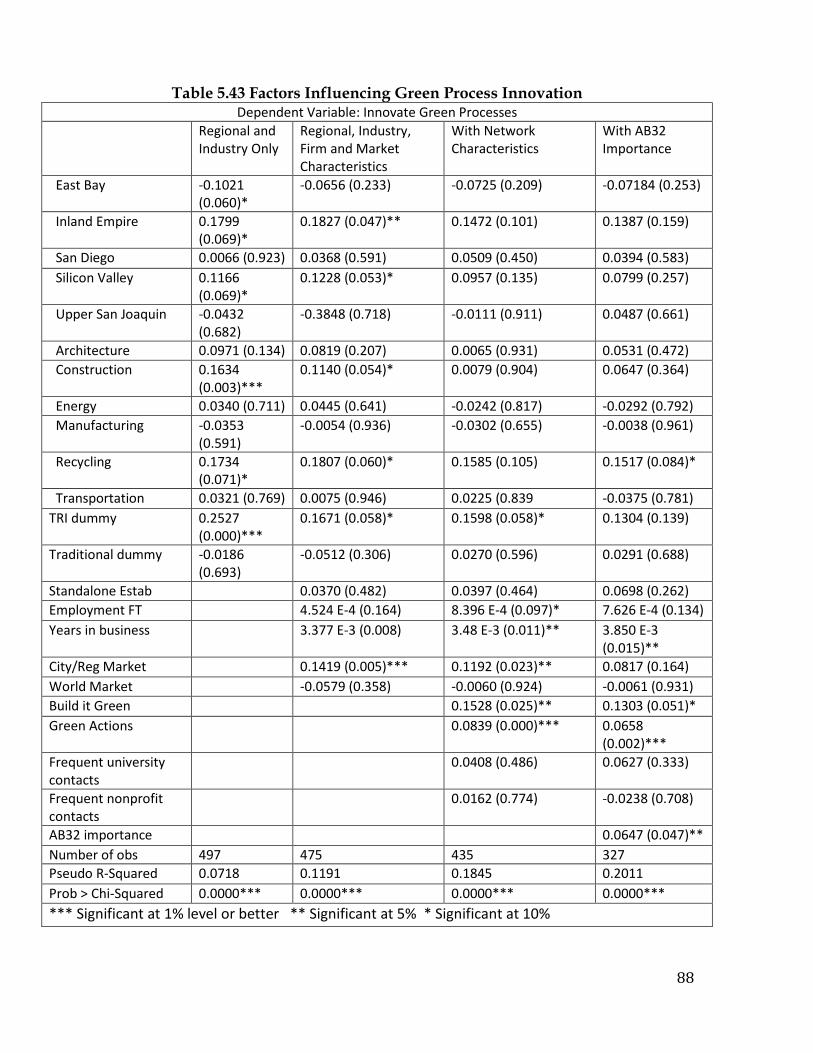
88
Table 5.43 Factors Influencing Green Process Innovation Dependent Variable: Innovate Green Processes
Regional and Industry Only
Regional, Industry, Firm and Market Characteristics
With Network Characteristics
With AB32 Importance
East Bay -0.1021 (0.060)*
-0.0656 (0.233) -0.0725 (0.209) -0.07184 (0.253)
Inland Empire 0.1799 (0.069)*
0.1827 (0.047)** 0.1472 (0.101) 0.1387 (0.159)
San Diego 0.0066 (0.923) 0.0368 (0.591) 0.0509 (0.450) 0.0394 (0.583) Silicon Valley 0.1166
(0.069)* 0.1228 (0.053)* 0.0957 (0.135) 0.0799 (0.257)
Upper San Joaquin -0.0432 (0.682)
-0.3848 (0.718) -0.0111 (0.911) 0.0487 (0.661)
Architecture 0.0971 (0.134) 0.0819 (0.207) 0.0065 (0.931) 0.0531 (0.472) Construction 0.1634
(0.003)*** 0.1140 (0.054)* 0.0079 (0.904) 0.0647 (0.364)
Energy 0.0340 (0.711) 0.0445 (0.641) -0.0242 (0.817) -0.0292 (0.792) Manufacturing -0.0353
(0.591) -0.0054 (0.936) -0.0302 (0.655) -0.0038 (0.961)
Recycling 0.1734 (0.071)*
0.1807 (0.060)* 0.1585 (0.105) 0.1517 (0.084)*
Transportation 0.0321 (0.769) 0.0075 (0.946) 0.0225 (0.839 -0.0375 (0.781) TRI dummy 0.2527
(0.000)*** 0.1671 (0.058)* 0.1598 (0.058)* 0.1304 (0.139)
Traditional dummy -0.0186 (0.693)
-0.0512 (0.306) 0.0270 (0.596) 0.0291 (0.688)
Standalone Estab 0.0370 (0.482) 0.0397 (0.464) 0.0698 (0.262) Employment FT 4.524 E-4 (0.164) 8.396 E-4 (0.097)* 7.626 E-4 (0.134) Years in business 3.377 E-3 (0.008) 3.48 E-3 (0.011)** 3.850 E-3
(0.015)** City/Reg Market 0.1419 (0.005)*** 0.1192 (0.023)** 0.0817 (0.164) World Market -0.0579 (0.358) -0.0060 (0.924) -0.0061 (0.931) Build it Green 0.1528 (0.025)** 0.1303 (0.051)* Green Actions 0.0839 (0.000)*** 0.0658
(0.002)*** Frequent university contacts
0.0408 (0.486) 0.0627 (0.333)
Frequent nonprofit contacts
0.0162 (0.774) -0.0238 (0.708)
AB32 importance 0.0647 (0.047)** Number of obs 497 475 435 327 Pseudo R-Squared 0.0718 0.1191 0.1845 0.2011 Prob > Chi-Squared 0.0000*** 0.0000*** 0.0000*** 0.0000*** *** Significant at 1% level or better ** Significant at 5% * Significant at 10%

89
both the statistical models and the broader questions is the local embeddedness of green businesses. Green businesses, and particularly innovative businesses, are largely oriented to serve local markets. The local market orientation is also an important factor in innovation of green products and services.
Although not a significant factor in the models of innovation, green businesses report making greater use of several types of local networks compared to other firms, including local nonprofits, local government, and similar businesses in the local area, and green innovative firms rely on local networks more than do other green firms. The importance of local assets varies by sector within the group of green industry respondents.
In particular, across all green firms, contact frequency with universities and research labs is relatively low for both innovative and non-innovative green firms, suggesting that green product innovation is more likely to derive from frequent interaction with local and regional-based actors (non-profits, businesses, trade associations, chamber of commerce and local governments) than from frequent interaction with universities and/or research institutions. However, interactions with local universities and research organizations are of much greater importance to energy research firms. Responses among all firms regarding location preferences are consistent with findings from earlier research. The three primary factors mentioned, across firms, are the local
market for the firm’s product or service, the executives’ place of residence (of particular importance for small firms), and the quality of life. The distinction between small and large green firms is significant and should be considered in planning any local economic development or support strategy. Smaller firms are characterized by a focus on the local market, and many choose a location close to the executive’s residence, while larger firms were more focused on the labor market and on access to financial capital in making a location choice. Green firms show more interest in using outside training, particularly certificate programs, than did other types of firms, another opportunity for economic development strategies. The survey results also highlight potential new policy directions for encouraging the growth of green businesses. Because of the local nature of many firms, there is wide agreement among respondents that standardization of policies across localities could ease the growth of the industry.
Distinctions between green firms and other types of firms are most striking in terms of the attitude towards a California location and towards public policy questions. Some respondents emphasize the California focus on environmental quality as a benefit to operating a green business in the area. Of the firms responding to the question of location choice should they move, two thirds of green firms would maintain a California location, as compared to one third of traditional firms and one sixth of TRI firms. When specific policies are discussed, green firms are much more

90
likely to see new regulations and the taxation system (through incentives) as an opportunity, while traditional and TRI firms focus on the regulatory impacts of these policies on firm operations. This is reflected in the attitude toward AB32 as well. In conjunction with the optimism that green firms express about their future growth, this suggests that the green economy presents a special opportunity for California.
Photo: Eco Expo International Green Forum & Marketplace, China Eco Expo, the International Green Building and Sustainable Cities Exposition, http://www.ecoexpo.com/EcoExpo2009
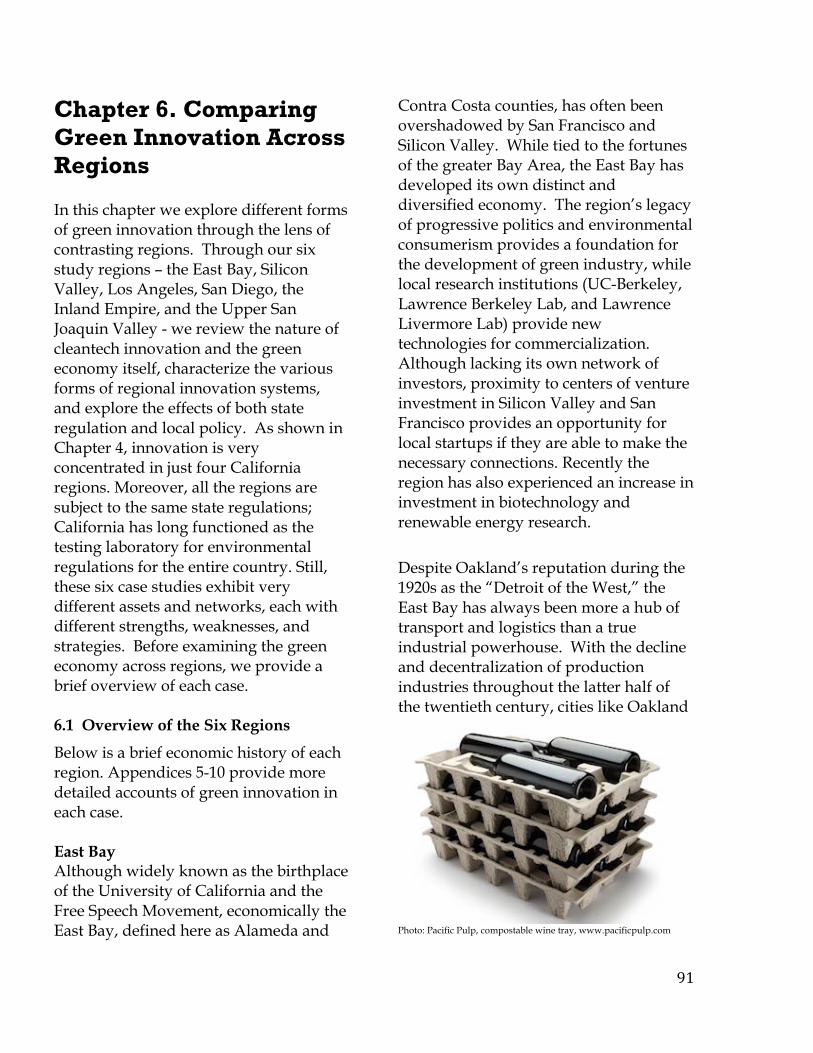
91
Chapter 6. Comparing Green Innovation Across Regions In this chapter we explore different forms of green innovation through the lens of contrasting regions. Through our six study regions – the East Bay, Silicon Valley, Los Angeles, San Diego, the Inland Empire, and the Upper San Joaquin Valley - we review the nature of cleantech innovation and the green economy itself, characterize the various forms of regional innovation systems, and explore the effects of both state regulation and local policy. As shown in Chapter 4, innovation is very concentrated in just four California regions. Moreover, all the regions are subject to the same state regulations; California has long functioned as the testing laboratory for environmental regulations for the entire country. Still, these six case studies exhibit very different assets and networks, each with different strengths, weaknesses, and strategies. Before examining the green economy across regions, we provide a brief overview of each case. 6.1 Overview of the Six Regions
Below is a brief economic history of each region. Appendices 5-10 provide more detailed accounts of green innovation in each case. East Bay Although widely known as the birthplace of the University of California and the Free Speech Movement, economically the East Bay, defined here as Alameda and
Contra Costa counties, has often been overshadowed by San Francisco and Silicon Valley. While tied to the fortunes of the greater Bay Area, the East Bay has developed its own distinct and diversified economy. The region’s legacy of progressive politics and environmental consumerism provides a foundation for the development of green industry, while local research institutions (UC-Berkeley, Lawrence Berkeley Lab, and Lawrence Livermore Lab) provide new technologies for commercialization. Although lacking its own network of investors, proximity to centers of venture investment in Silicon Valley and San Francisco provides an opportunity for local startups if they are able to make the necessary connections. Recently the region has also experienced an increase in investment in biotechnology and renewable energy research.
Despite Oakland’s reputation during the 1920s as the “Detroit of the West,” the East Bay has always been more a hub of transport and logistics than a true industrial powerhouse. With the decline and decentralization of production industries throughout the latter half of the twentieth century, cities like Oakland
Photo: Pacific Pulp, compostable wine tray, www.pacificpulp.com

92
and Richmond have made headlines more for high crime rates than as sites of opportunity. Yet the region as a whole has maintained high rates of growth and job creation. Oakland is still a transportation hub, with large amounts of goods flowing through the Port, but mechanization has led to ever-decreasing numbers of jobs. Although some of its industrial areas, particularly in Emeryville and Alameda, retain a vibrant mix of high-tech, biotech, and crafts manufacturers, the region often loses firms as they expand, either to California regions with lower land and labor costs, or to Silicon Valley.
The East Bay weathered the dot com crash in the early part of this century better than most areas, attracting tech industry workers from San Francisco and the South Bay, and experiencing a local boom in construction and housing finance. Lately, however, the East Bay has been hard hit by the economic crisis, suffering the highest foreclosure rates in the Bay Area, as well as a massive slowdown of construction. Inland Empire Though the Inland Empire (Riverside and San Bernardino counties) initially developed due to the citrus industry, most recently it has expanded due to spillover growth from the strong market regions of Los Angeles and San Diego directly to the west and south. New freeways and housing tracts are multiplying across former citrus orchard land, where cheap real estate and vast desert expanses abound.77
The Central and San Joaquin Valleys account for much of the agriculture in California, but the Inland Empire also maintains a large hold on the citrus industry. As the citrus industry developed, it became increasingly industrial in nature. Increasing pesticide use, along with the cultivation of a resident workforce in company towns, led to industrialized landscapes, factories in the field and an approach that was referred to as the business of oranges.
The Inland Empire now boasts a population of nearly four million.
78
As the citrus production developed and industrialized, zoning policies also began to incentivize the takeover of former citrus orchard land for suburban housing development tracts, housing the burgeoning Los Angeles area population.
Although the two counties operate relatively interdependently as the Inland Empire, there are some key differences between their industry make up. San Bernardino’s economy has historically focused on manufacturing (anchored by Kaiser Steel), while Riverside’s primary industry has been agriculture. Following the recession of the 1970s, the 1980s brought an unprecedented boom. Riverside and San Bernardino counties experienced some of the highest growth rates in Southern California due to the influx of manufacturing from Los Angeles, a growing immigrant and commuter population, and a booming construction industry.
Today, the strong industries in the area are industrial: manufacturing, logistics and energy production related to the region’s significant wind, solar, and geothermal resources. But the recent
93
recession has impacted the Inland Empire more than many California regions, due in large part to its dependence on the homebuilding industry, as well as its large first-time homeowner population, hit hard by the foreclosure crisis. Still, locals remain characteristically optimistic about their ability to remake the region once more.
Los Angeles Occupying most of the Los Angeles Basin, along with deserts, mountains, and beaches, Los Angeles County hosts its population of just under ten million – the largest of any county in the United States – in a flat valley basin that has accommodated the rapid development of industry, residential subdivisions, and an extensive freeway system. Historic land use policies in the county have resulted in sprawl-like growth patterns including low-density residential, commercial and industrial development that consume much of the available land in the county. Los Angeles County’s transportation network is heavily burdened, in part because it is one of the world's leading trade centers. In 2008, the Port of Los Angeles and Port of Long Beach were first and ninth respectively in the ranking of the top U.S. ports by value of two-way trade. Together, the two constitute the world’s fifth busiest container port and are a primary economic engine in the County – as well as one of its biggest polluters. Likewise, approximately 75 percent of the region’s air cargo traffic goes through LAX, ranking second in the U.S. in value of freight shipments.
Los Angeles has experienced consistent economic growth via a wide array of industries. The defense and aerospace industries have historically been major catalysts for the growth and prosperity of the county's (and region's) economy. Started in the 1920s and 1930s when the aircraft industry first took root in Southern California, the defense industry experienced explosive growth during World War II. Key to this growth was the continued expansion of the aircraft industry, along with the development of missile and military electronics production that led to huge aerospace/electronics complex that was established in the area. The Jet Propulsion Laboratory, started in 1929, was integral to training personnel and potential workers while simultaneously developing rocket technology. Likewise, the electronics industry began to develop during the WWII period, remaining one of the region’s dominant industries through the late 1980s. Today, the advanced electronics sector -- including telecommunications, advanced computers and electromedical equipment industries -- is among the County’s most important high-technology activities. Although the county economy has diversified considerably into services and entertainment (particularly the film industry), it has not weathered the recession well; in particular, manufacturing and logistics sectors have seen substantial job loss.
San Diego The San Diego metropolitan area, the second largest region in California, benefits from a large harbor with a dynamic port and close location to the

94
Mexican border, which make it a prime location for export and import activities. In the last few decades, the area has experienced a big expansion in its real estate sector with the redevelopment of its downtown, one of the largest increases of median home prices in the country, and a continuous expansion into the east and northeast areas of the county. The region’s combination of expensive real state and an attractive natural environment oftentimes is dubbed the “sunshine tax”. However, a closer look at the region evidences a dynamic economy that has reconfigured itself in the last 20 years from a federal spending dependent defense industry base to a diversified biotech, business services, and tourism-led economy.
Spurred by a significant U.S. Navy presence, the county reached a population of half a million shortly after WWII. The following decades, considered the contemporary boom period, witnessed great population and physical growth that propelled San Diego from the 31st largest city in the nation to the seventh. All throughout this time the military played an increasing role in the local economy, both in terms of direct employment in the several bases and facilities, but also on local defense and aerospace industries.
In the most recent period, from the 1990s to today, San Diego has experienced changes in its economy. While the military bases and shipbuilding are still an important part of the economy, other industries have risen in importance, namely the tourism, high-tech and
professional service sectors. Despite a worrying scenario of increasing costs of living, traffic congestion and sprawl, San Diego is a global and innovative economy that has several elements that make it an excellent candidate for the growth in green economy sectors. Among the most relevant factors leading San Diego to thrive in the emerging green economy is the past collaboration between government, schools and private sectors in the development of high tech and biotech clusters around the University of California San Diego campus in the 1990s.
Silicon Valley Beginning in the 1970s Silicon Valley has been regarded as the world’s leading center for technological innovation. But since the dot-com crash of the early 2000s, Silicon Valley has struggled to reinvent itself, first as a biotechnology center and a new wave of internet applications, Web 2.0, and most recently, as “a hotbed for clean technology” and green innovation.79
Before the rise of the Silicon Valley, the Santa Clara Valley was home to some of the richest fruit growing land in the world. But the arrival of the electronics industry and wartime and Cold War defense spending triggered a radical transformation in the socioeconomic structure of the Valley. A pro-growth coalition of local leaders, working closely with Stanford, worked together for economic development via initiatives such as the Stanford Research Institute and the Stanford Industrial Park.
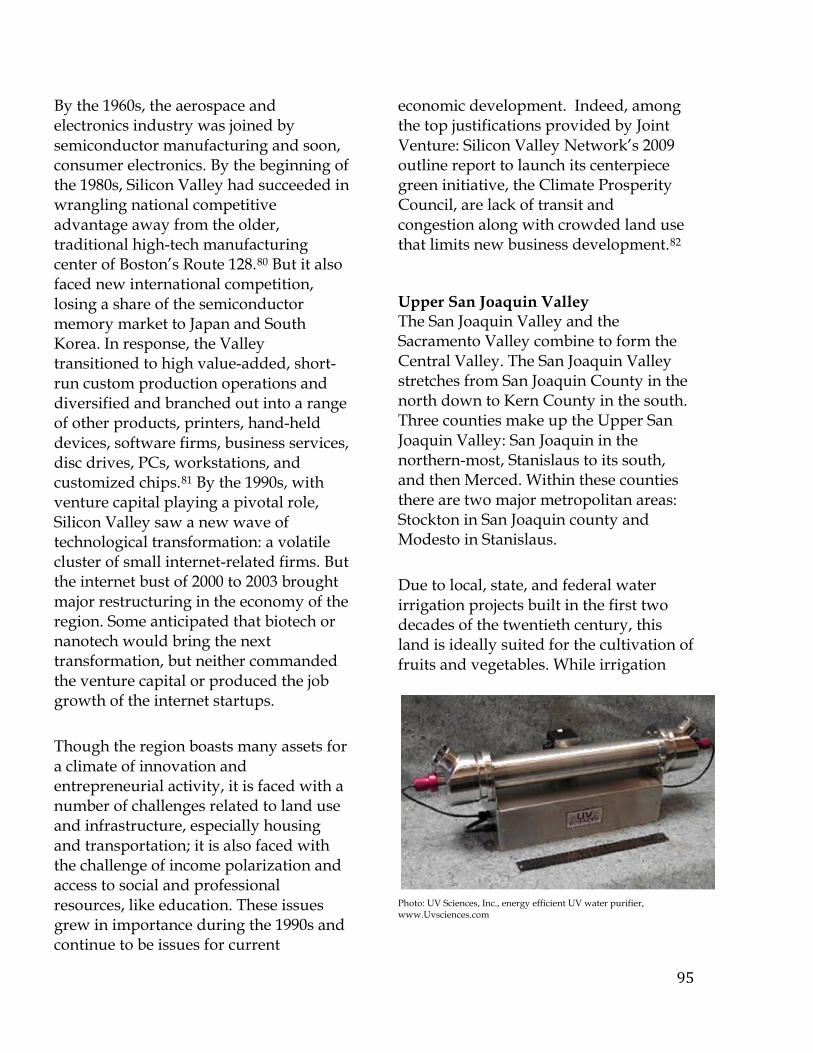
95
By the 1960s, the aerospace and electronics industry was joined by semiconductor manufacturing and soon, consumer electronics. By the beginning of the 1980s, Silicon Valley had succeeded in wrangling national competitive advantage away from the older, traditional high-tech manufacturing center of Boston’s Route 128.80 But it also faced new international competition, losing a share of the semiconductor memory market to Japan and South Korea. In response, the Valley transitioned to high value-added, short-run custom production operations and diversified and branched out into a range of other products, printers, hand-held devices, software firms, business services, disc drives, PCs, workstations, and customized chips.81
By the 1990s, with venture capital playing a pivotal role, Silicon Valley saw a new wave of technological transformation: a volatile cluster of small internet-related firms. But the internet bust of 2000 to 2003 brought major restructuring in the economy of the region. Some anticipated that biotech or nanotech would bring the next transformation, but neither commanded the venture capital or produced the job growth of the internet startups.
Though the region boasts many assets for a climate of innovation and entrepreneurial activity, it is faced with a number of challenges related to land use and infrastructure, especially housing and transportation; it is also faced with the challenge of income polarization and access to social and professional resources, like education. These issues grew in importance during the 1990s and continue to be issues for current
economic development. Indeed, among the top justifications provided by Joint Venture: Silicon Valley Network’s 2009 outline report to launch its centerpiece green initiative, the Climate Prosperity Council, are lack of transit and congestion along with crowded land use that limits new business development.82
Upper San Joaquin Valley The San Joaquin Valley and the Sacramento Valley combine to form the Central Valley. The San Joaquin Valley stretches from San Joaquin County in the north down to Kern County in the south. Three counties make up the Upper San Joaquin Valley: San Joaquin in the northern-most, Stanislaus to its south, and then Merced. Within these counties there are two major metropolitan areas: Stockton in San Joaquin county and Modesto in Stanislaus.
Due to local, state, and federal water irrigation projects built in the first two decades of the twentieth century, this land is ideally suited for the cultivation of fruits and vegetables. While irrigation
Photo: UV Sciences, Inc., energy efficient UV water purifier, www.Uvsciences.com

96
projects have historically provided the region with an ample water supply, growing demand for water and the degradation of water sources may compromise this in the future. Another major concern in the San Joaquin Valley and in the Central Valley as a whole is air pollution. Situated in the San Joaquin Valley Air Basin, mountains to the East and West effectively trap in emissions created by Valley residents and businesses or blown in from surrounding regions.
Although agriculture has dominated the region, the sector has adapted multiple times and in different ways to changes in both consumer demand and in the resources/technologies available for production: from cattle ranching, to fruit and vegetable crops enabled by irrigation technology, to food processing plants located near the farms to minimize the cost of transporting freshly harvested crops and to avoid damages in shipping. Only San Joaquin County has developed a diversified manufacturing sector outside of food processing.
California’s Central Valley and the Upper San Joaquin are undergoing diverse and rapid changes. During the housing boom at the beginning of the decade, as Bay Area workers traded low-cost housing for longer commute times, urbanization—or more accurately suburbanization—in the region was on the rise. And while the Bay Area's demand for housing spilled over to the Upper San Joaquin Valley, its knowledge-based economy failed to follow suit. With the addition of the construction sector, the Upper San
Joaquin Valley economy can still be summarized using the same lines that the Stockton Chamber of Commerce used in 1996: “Stockton's economy actually breaks down to three words—Agribusiness. Manufacturing. Distribution. Three sturdy cods in a circle of business that turns a profit.”83
6.2 Measuring Innovation and the Green Economy in Case Study Regions
Chapter 4 provided an overview of green/cleantech innovation and trends in the green economy. Here we examine patterns of innovation and economic growth across the six case study regions in order to establish key similarities and differences across regions.
Innovation Though Los Angeles, Silicon Valley, the East Bay, and San Diego rank #1 to #4, respectively, in green innovation, the Inland Empire and Upper San Joaquin Valley lag behind, at #8 and #14. Despite the concentration of green innovation in these four regions, they specialize in different aspects of innovation. Los Angeles, though dominating innovation in absolute size, falls to 12th rank when controlling for size of the regional economy. It excels in idea generation (as proxied by patents), led by CalTech, UCLA, and aerospace/defense corporations. Though it has 12% of patents overall in California, it has 27% of cleantech patents, leading the way in solar, fuel cells, and green building patents. It also does very well in idea development, particularly in terms of its ability to garner financial capital: though
97
it has received just 9% of overall VC since 2000, it has cornered 15% of cleantech VC, doing particularly well in solar and alternative energy. It also has received a disproportionate share of SBIR/STTR grants. Where it lags other regions is in startups and gazelles—i.e., getting the ideas to market.
Silicon Valley ranks #2 in innovation—and #1 if using the normalized index. Given its small size relative to Los Angeles, its dominance in cleantech patents and VC is astounding. It receives the lion’s share of VC ($827 million from 2000-2008), leading all other regions by a large margin in solar and energy management, and performing well in alternative energy as well. However, it is important to note that its performance in cleantech innovation has not, to date, been as dominant as in California innovation more generally. It has garnered a disproportionately low share of VC, SBIR/STTR grants, startups, gazelles, and most notably, patents: it has only 23% of cleantech patents (leading only in renewable energy, energy management, and recycling), despite producing 52% of patents overall. But since it is not dominating cleantech as it has other technological transformations, it might be characterized as a dowager region in green innovation, coasting on its previous innovation laurels.
Overall, the East Bay is proving to be much more innovative in the green economy than it has been historically; it ranks #6 in innovation in the state overall, but #3 in cleantech innovation. Unlike the other regions, it performs well
in all aspects of the innovation process: idea generation, development, and commercialization. It has received 20% of the state’s cleantech patents, compared to just 8% overall, with a strong specialization in alternative fuels, as well as recycling. According to the business survey, East Bay firms are particularly likely to innovate new products that improve energy efficiency or recycling. It has garnered 16% of cleantech VC funding, compared to 10% overall; 8% of green startups, compared to 7% of overall startups; and 11% of green gazelles, compared to 7% overall. It only lags in SBIR/STTR grants, perhaps due to the lack of collaborations between local small businesses and universities.
Nominally at #4, San Diego accounts for a much smaller share of innovative activity in the green economy than the first three regions. Its strength is idea generation, with 9.2% of cleantech patents (versus 7.7% of overall), but it does not specialize in any single cleantech category, rather innovating across many different industries. In all of the other categories, its cleantech performance lags that of its innovation overall.
Though the two distressed case study regions are thus far sorely lacking in patents, venture capital, and SBIR/STTR grants, it is worth noting that the Inland Empire shows considerable promise in green startups and gazelles. With only 8.8% of the state’s startups, it has 9.7% of its green startups, and its share of green gazelles is comparable to its overall share of California’s gazelles.

98
Uneven response rates make it difficult to ascertain the exact amount of green innovation in each region via the green business survey. However, the survey does provide some sense of the relative incidence of product versus process innovation in the regions (Figure 6.1). Only one region, San Diego, innovates more by producing new products or services rather than changing production processes, and in the Inland Empire, only 18% of green businesses respondents had introduced an environmentally friendly product or service. In most regions it is much more common to alter production processes, for instance by using greener materials and energy sources in the production process (as in the case of many Los Angeles firms), switching to cleaner transportation (most commonly in the East Bay), or increasing green
building practices (most commonly in Silicon Valley).
The Green Economy The green economy, while still evolving and quite idiosyncratic in nature, follows some of the traditional principles that underlie the spatial allocation of economic growth. First, regional advantage in terms of economies of scale (people, infrastructure, civic institutions, residential amenities, proximity to transport hubs, concentrations of venture capital) will inevitably explain a good portion of the variance in growth outcomes. We would naturally expect places like Los Angeles and San Diego to enjoy some advantage over more rural places like the Upper San Joaquin Valley.
Figure 6.1 Product Versus Process Innovation for Firms in the Six Regions
0%
10%
20%
30%
40%
50%
60%
70%
80%
90%
East Bay Los Angeles San Diego Silicon Valley Inland Empire Upper SanJoaquin Valley
% o
f Gre
en B
usin
ess
Surv
ey R
espo
nden
ts
ProductProcess

99
Second, regions which feature economies of scope (i.e., economic diversity) may be more readily able to deploy and maintain the necessary variety of services, occupations, management and physical plant that economic growth in emerging sectors requires. Of course, diversity of firms and labor pools are not sufficient in and of themselves; it is critical that the necessary matching of capacity, need, and opportunity occur. The regional competition for green economic growth is still evolving in California on this score. Next, sector specialization is often a third way to understand a region’s economic strengths and weaknesses. Such specialization does not necessarily coincide with either scale of resources or economic diversity. Fourth, history matters. Our inclusion of Silicon Valley as a study region points toward our attempt to learn whether concentrations of innovation in one macro-sector of the economy (information processing technology) provides net advantages or disadvantages relative to an emerging sector like green technologies. These fundamentals of regional economic growth and technological innovation affect green economic development just as they have historically affected other sectors, as we discuss next.
Economies of Scale One of the drivers of regional growth is economies of scale, or scale of resources. As described above, these resources, often called urbanization economies, provide support to firms and industries looking to grow and innovate. We measure strong scale economies by high sector employment, large average firm
size, and high location quotients (a measure of regional sector concentration relative to its concentration in the state). The two largest regional green economies from our six study regions, by far, are Los Angeles (39,875) and the East Bay (30,876) (Table 6.1).
Almost every sector in both regions had 1,000 or over employees in 2008 (with the exception of green manufacturing in the East Bay). Because of their sheer size, these two regions are able to support development and provide additional services and resources that help foster individual sectors. As a result of their size, Los Angeles and the East Bay also boasted the largest amount of green sales in 2008 ($5.3 and $4 billion, respectively). While the scale of these green economies ensures neither growth nor success, the economic development literature shows that a larger size and capitalization of economies of scale (both at the industry and regional level) lead to future competitive advantages.
Economies of Scope Economies of scope proxy for industry diversity within a region. While regional economies of scale are important for providing the infrastructure and urbanization economies that sectors need to grow, economies of scope are particularly important for certain kinds of growth and innovation. The convergence of a diverse industry mix allows for cross-pollination between different sectors’ processes and products and facilitates knowledge spillover. Economies of scope are measured primarily by a diversity index (entropy
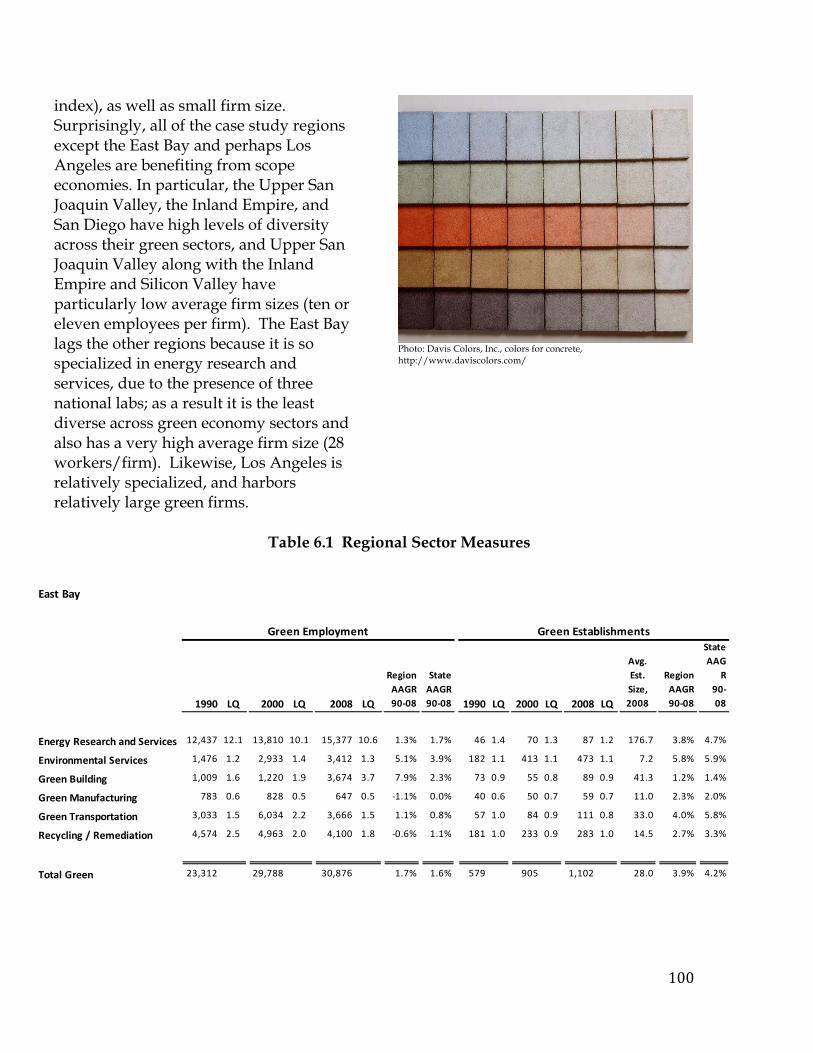
100
index), as well as small firm size. Surprisingly, all of the case study regions except the East Bay and perhaps Los Angeles are benefiting from scope economies. In particular, the Upper San Joaquin Valley, the Inland Empire, and San Diego have high levels of diversity across their green sectors, and Upper San Joaquin Valley along with the Inland Empire and Silicon Valley have particularly low average firm sizes (ten or eleven employees per firm). The East Bay lags the other regions because it is so specialized in energy research and services, due to the presence of three national labs; as a result it is the least diverse across green economy sectors and also has a very high average firm size (28 workers/firm). Likewise, Los Angeles is relatively specialized, and harbors relatively large green firms.
Photo: Davis Colors, Inc., colors for concrete, http://www.daviscolors.com/
Table 6.1 Regional Sector Measures
East Bay
1990 LQ 2000 LQ 2008 LQ
Region AAGR90-08
StateAAGR90-08 1990 LQ 2000 LQ 2008 LQ
Avg. Est. Size, 2008
Region AAGR90-08
StateAAG
R90-08
Energy Research and Services 12,437 12.1 13,810 10.1 15,377 10.6 1.3% 1.7% 46 1.4 70 1.3 87 1.2 176.7 3.8% 4.7%
Environmental Services 1,476 1.2 2,933 1.4 3,412 1.3 5.1% 3.9% 182 1.1 413 1.1 473 1.1 7.2 5.8% 5.9%
Green Building 1,009 1.6 1,220 1.9 3,674 3.7 7.9% 2.3% 73 0.9 55 0.8 89 0.9 41.3 1.2% 1.4%
Green Manufacturing 783 0.6 828 0.5 647 0.5 -1.1% 0.0% 40 0.6 50 0.7 59 0.7 11.0 2.3% 2.0%
Green Transportation 3,033 1.5 6,034 2.2 3,666 1.5 1.1% 0.8% 57 1.0 84 0.9 111 0.8 33.0 4.0% 5.8%
Recycling / Remediation 4,574 2.5 4,963 2.0 4,100 1.8 -0.6% 1.1% 181 1.0 233 0.9 283 1.0 14.5 2.7% 3.3%
Total Green 23,312 29,788 30,876 1.7% 1.6% 579 905 1,102 28.0 3.9% 4.2%
Green Employment Green Establishments
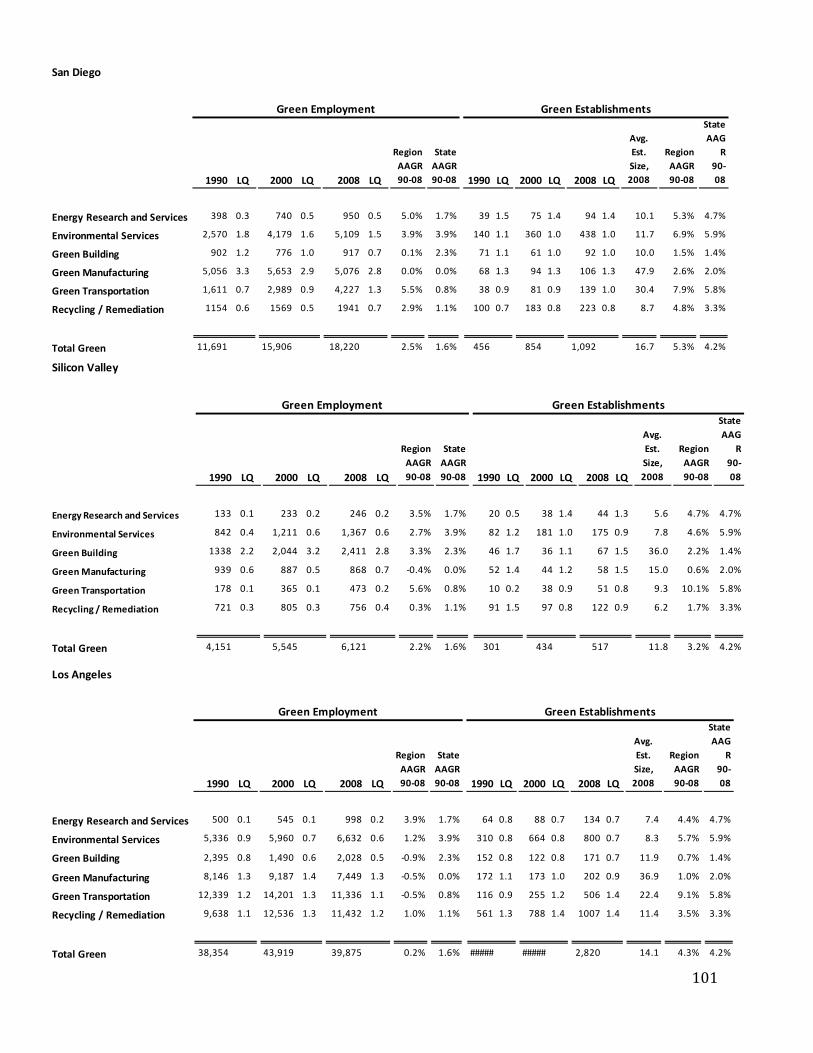
101
San Diego
1990 LQ 2000 LQ 2008 LQ
Region AAGR90-08
StateAAGR90-08 1990 LQ 2000 LQ 2008 LQ
Avg. Est. Size, 2008
Region AAGR90-08
StateAAG
R90-08
Energy Research and Services 398 0.3 740 0.5 950 0.5 5.0% 1.7% 39 1.5 75 1.4 94 1.4 10.1 5.3% 4.7%
Environmental Services 2,570 1.8 4,179 1.6 5,109 1.5 3.9% 3.9% 140 1.1 360 1.0 438 1.0 11.7 6.9% 5.9%
Green Building 902 1.2 776 1.0 917 0.7 0.1% 2.3% 71 1.1 61 1.0 92 1.0 10.0 1.5% 1.4%
Green Manufacturing 5,056 3.3 5,653 2.9 5,076 2.8 0.0% 0.0% 68 1.3 94 1.3 106 1.3 47.9 2.6% 2.0%
Green Transportation 1,611 0.7 2,989 0.9 4,227 1.3 5.5% 0.8% 38 0.9 81 0.9 139 1.0 30.4 7.9% 5.8%
Recycling / Remediation 1154 0.6 1569 0.5 1941 0.7 2.9% 1.1% 100 0.7 183 0.8 223 0.8 8.7 4.8% 3.3%
Total Green 11,691 15,906 18,220 2.5% 1.6% 456 854 1,092 16.7 5.3% 4.2%
Green EstablishmentsGreen Employment
Silicon Valley
1990 LQ 2000 LQ 2008 LQ
Region AAGR90-08
StateAAGR90-08 1990 LQ 2000 LQ 2008 LQ
Avg. Est. Size, 2008
Region AAGR90-08
StateAAG
R90-08
Energy Research and Services 133 0.1 233 0.2 246 0.2 3.5% 1.7% 20 0.5 38 1.4 44 1.3 5.6 4.7% 4.7%
Environmental Services 842 0.4 1,211 0.6 1,367 0.6 2.7% 3.9% 82 1.2 181 1.0 175 0.9 7.8 4.6% 5.9%
Green Building 1338 2.2 2,044 3.2 2,411 2.8 3.3% 2.3% 46 1.7 36 1.1 67 1.5 36.0 2.2% 1.4%
Green Manufacturing 939 0.6 887 0.5 868 0.7 -0.4% 0.0% 52 1.4 44 1.2 58 1.5 15.0 0.6% 2.0%
Green Transportation 178 0.1 365 0.1 473 0.2 5.6% 0.8% 10 0.2 38 0.9 51 0.8 9.3 10.1% 5.8%
Recycling / Remediation 721 0.3 805 0.3 756 0.4 0.3% 1.1% 91 1.5 97 0.8 122 0.9 6.2 1.7% 3.3%
Total Green 4,151 5,545 6,121 2.2% 1.6% 301 434 517 11.8 3.2% 4.2%
Green Employment Green Establishments
Los Angeles
1990 LQ 2000 LQ 2008 LQ
Region AAGR90-08
StateAAGR90-08 1990 LQ 2000 LQ 2008 LQ
Avg. Est. Size, 2008
Region AAGR90-08
StateAAG
R90-08
Energy Research and Services 500 0.1 545 0.1 998 0.2 3.9% 1.7% 64 0.8 88 0.7 134 0.7 7.4 4.4% 4.7%
Environmental Services 5,336 0.9 5,960 0.7 6,632 0.6 1.2% 3.9% 310 0.8 664 0.8 800 0.7 8.3 5.7% 5.9%
Green Building 2,395 0.8 1,490 0.6 2,028 0.5 -0.9% 2.3% 152 0.8 122 0.8 171 0.7 11.9 0.7% 1.4%
Green Manufacturing 8,146 1.3 9,187 1.4 7,449 1.3 -0.5% 0.0% 172 1.1 173 1.0 202 0.9 36.9 1.0% 2.0%
Green Transportation 12,339 1.2 14,201 1.3 11,336 1.1 -0.5% 0.8% 116 0.9 255 1.2 506 1.4 22.4 9.1% 5.8%
Recycling / Remediation 9,638 1.1 12,536 1.3 11,432 1.2 1.0% 1.1% 561 1.3 788 1.4 1007 1.4 11.4 3.5% 3.3%
Total Green 38,354 43,919 39,875 0.2% 1.6% ##### ##### 2,820 14.1 4.3% 4.2%
Green Employment Green Establishments

102
Specialization Just as growth can happen at the intersection between various sectors, other types of growth (as well as innovation) depend on highly specialized economies. This specialized, applicable knowledge stems from high levels of sector concentration and leads not only to a better environment for accessing industry-related information, but also facilitates the exchange of ideas, formation of local networks, and creates
a less risky environment for workers and employers. Additionally, the clustering of firms within an industry can lead to localization economies, a form of external economies of scale. Here, we measure specialization through high location quotients, and a large sector presence. In the East Bay, for example, the energy research and services sector, which makes up about half of the region’s green economy, is a major specialized sector. The sector has consistently had location quotients
Upper San Joaquin Valley
1990 LQ 2000 LQ 2008 LQ
Region AAGR90-08
StateAAGR90-08 1990 LQ 2000 LQ 2008 LQ
Avg. Est. Size, 2008
Region AAGR90-08
StateAAG
R90-08
Energy Research and Services 66 0.2 117 0.2 120 0.2 3.6% 1.7% 9 1.0 20 1.4 15 0.8 8.0 3.1% 4.7%
Environmental Services 338 0.7 508 0.6 497 0.5 2.3% 3.9% 19 0.4 60 0.6 69 0.6 7.2 7.9% 5.9%
Green Building 204 0.9 168 0.7 395 1.0 4.0% 2.3% 25 1.2 16 0.9 36 1.4 11.0 2.2% 1.4%
Green Manufacturing 268 0.5 272 0.5 359 0.6 1.7% 0.0% 13 0.8 23 1.1 27 1.2 13.3 4.4% 2.0%
Green Transportation 492 0.6 557 0.6 816 0.8 3.0% 0.8% 23 1.6 33 1.3 39 1.1 20.9 3.2% 5.8%
Recycling / Remediation 348 0.5 596 0.7 828 0.9 5.2% 1.1% 61 1.3 91 1.4 103 1.4 8.0 3.1% 3.3%
Total Green 1,716 2,218 3,015 3.4% 1.6% 150 243 289 10.4 3.9% 4.2%
Green Employment Green Establishments
Inland Empire
1990 LQ 2000 LQ 2008 LQ
Region AAGR90-08
StateAAGR90-08 1990 LQ 2000 LQ 2008 LQ
Avg. Est. Size, 2008
Region AAGR90-08
StateAAG
R90-08
Energy Research and Services 53 0.1 272 0.2 241 0.2 8.8% 1.7% 14 0.6 42 0.9 58 0.8 4.2 8.7% 4.7%
Environmental Services 838 0.8 1,607 0.8 2,187 0.8 5.5% 3.9% 81 0.7 220 0.7 313 0.8 7.0 8.3% 5.9%
Green Building 620 1.2 565 0.9 1,330 1.2 4.3% 2.3% 82 1.4 75 1.4 136 1.4 9.8 3.0% 1.4%
Green Manufacturing 1,199 1.1 1,835 1.2 1,778 1.2 2.2% 0.0% 52 1.1 74 1.2 91 1.1 19.5 3.3% 2.0%
Green Transportation 1,475 0.9 2,988 1.2 2,626 1.0 3.3% 0.8% 50 1.3 96 1.2 157 1.1 16.7 7.0% 5.8%
Recycling / Remediation 2633 1.8 3022 1.3 3619 1.4 1.8% 1.1% 129 1.0 255 1.2 322 1.1 11.2 5.5% 3.3%
Total Green 6,818 10,289 11,781 3.1% 1.6% 408 762 1,077 10.9 5.9% 4.2%
Green Employment Green Establishments

103
above 10 since 1990. Because of its size and concentration, this sector is particularly competitive at the regional, state and even national level. Similarly, in Silicon Valley, the green building sector also accounts for almost 40% of the green economy’s employment, and enjoys location quotients around 3.0. The level of competition among green building firms in the East Bay, and neighboring regions has pushed the industry to innovate in ways that less concentrated industries have not had to.
As also found in previous studies, there is no clear association between these three indicators -- economies of scale, economies of scope, and specialization – and the incidence of innovation. Los Angeles and the East Bay both benefit from scale economies, but that seems to translate into commercialization in the East Bay better than in Los Angeles. Scope economies characterize a couple of the most innovative regions (Silicon Valley and San Diego), but also one of the study’s least innovative, the Upper San Joaquin Valley. Both the East Bay and Silicon Valley have highly specialized green economies, which undoubtedly spurs some of the idea generation and development in both regions. We next summarize trends in the green economy in each region, based upon both the secondary data (summarized in Table 6.2) and the business survey responses. East Bay The East Bay is clearly one of the stronger study regions in terms of the green economy. The region has both the second largest employment base and the
second highest number of firms of all study regions (Los Angeles being the largest). The environmental services and green building sectors have both enjoyed higher than average growth rates, compared to the state, since 1990. Green building has also had consistently increasing location quotients, in terms of employment during the 1990 to 2008 period. Green transportation and recycling/remediation have also concentrated in the East Bay, but employment in both has declined in recent years. The presence of the two national research labs in the energy research and services sector is responsible for much local innovation, but also makes the East Bay the least diverse of all six study regions. The East Bay is also home to many cutting-edge solar firms, like Sunpower, as well as an environmental consulting cluster that serves the entire country. Compared to the other regions, East Bay firms were less likely to cite the executive’s residence as the reason for locating in the area; instead, they emphasized the existence of a local market for their product and the high local quality of life. East Bay companies are among the most rooted in the state: 91 of 92 companies stated that they planned to stay in the region for at least the next two years.
Silicon Valley
Only slightly more diverse than the East Bay’s green economy, Silicon Valley still has a comparably small green sector employment base. By far, the dominant green economy sector is the green

104
building industry, which employs just over 2,400 people, and accounts for 44% of all green economy sales, the largest of
any other sector. As of 2008, the green building sector had an employment location quotient of 2.8, compared to the
Table 6.2 Green Economy Trends in Employment, Establishments, Sales and Diversity

105
state, meaning that there is a very high concentration of this industry in the region. The sector is also growing at above-state average levels (3.3%).
Silicon Valley ranks behind only San Diego in terms of product innovation, according to the business survey. Much of this innovation comes from traditional Silicon Valley semiconductor firms, like Applied Materials, that are transitioning into solar. Like other regions, Silicon Valley businesses locate in the region because of the executive’s residence and the local market. However, firms are less likely to credit local quality of life, instead citing availability of a labor pool and financial capital as key to their location.
Los Angeles Los Angeles is by far the largest of the six regions, and has therefore enjoyed some of the effects of urbanization economies. Despite its size, however, the region has not seen sustained growth in most of its large sectors over the past years, or particularly high location quotients. The biggest industries in the region come from within the green transportation and recycling/remediation sectors, which each employ nearly 30% of the green economy’s workers and far exceed any other of the study regions in absolute numbers of jobs. While it is still a relatively small green economy sector, with about 1,000 employees, the energy research and services industry does show promise with its sustained growth in both employment and sales. It also has a stead concentration in green manufacturing; though Solar Integrated is the only large solar
manufacturer, there are clusters of fluorescent lighting and green building product manufacturers.
Los Angeles firms are the most pessimistic about their growth prospects, according to the business survey: 15% said they would shrink over the next year, compared to 7% of businesses overall in the state. Los Angeles respondents were particularly likely to emphasize the executive’s residence and the local market as reasons for locating in the region, and much less likely to cite the local quality of life.
San Diego While San Diego lags behind Los Angeles and the East Bay as the third largest green economy, 18,220, the region is much more diverse than either of the two. The two strongest green sectors are environmental services and green manufacturing, with transportation close behind. Environmental services account for almost 30% of employment and 40% of establishments, suggesting a niche in small firms. Green manufacturing firms also employ almost 30% of green economy workers but account for just 10% of establishments, suggesting that large-scale manufacturing has taken hold; this sector accounts for over half of all sales in the region. While it is still quite small (1,941 jobs), the recycling/ remediation industry holds promise in the region, as it has consistently outperformed the state in employment, establishment and sales growth rates. Energy research and services dominates in terms of the concentration of firms and growth rate relative to the state, as

106
R&D associated with the defense industry moves into energy-related research (for instance, the work of Scientific Applications International on the smart grid).
San Diego firms are among the most optimistic about their future growth, according to the survey; 64% plan to expand within the next year, and 97% within the next five years. Compared to other regions, San Diego firms were much more likely to cite executive’s residence and local quality of life as instrumental to their location, rather than the local market.
Inland Empire With a green economy much smaller than San Diego’s (11,781), the Inland Empire has seen extraordinary growth in each of its six sectors between 1990 and 2008. Every single sector outgrew the state in each of the three measures (employment, establishment, sales). While the recycling/remediation sector is shedding jobs in Los Angeles and the San Francisco Bay Area, it continues to grow steadily in the Inland Empire. As the second largest sector with over 20% of the employment, green transportation experienced particularly strong growth, with employment increasing 3.3% between 1990 and 2008. The energy research and services sector also experienced record growth (8.8% employment growth), however its small employment size (241 in 2008) and sales figures, indicate that it is not yet a strong and competitive sector either in the region or statewide.
Of all the regions, Inland Empire firms were the most likely to suggest (in the
business survey) that they would expand: 71% said they planned to grow in the next year, most staying in the Inland Empire. Alone among regions, Inland Empire firms are generally not located in the region because of the executive’s residence; instead, they emphasized the local market and the availability of appropriate space.
Upper San Joaquin Valley By far the smallest green economy region (3,015), the Upper San Joaquin Valley is the most diverse of the six study areas (0.92). None of the region’s sectors have employment levels above 1,000 employees. Based on growth rates and size, green transportation, recycling/ remediation and green building are potentially the region’s most promising sectors, though they have yet to concentrate in the region. Despite its relatively strong growth, environmental services continues to have location quotients of well under 1.0 for each measure.
In the case of the Upper San Joaquin Valley, the most relevant location factors were executive’s residence and the availability of space. Compared to the other regions, Upper San Joaquin Valley green companies were among the most rooted, with plans to remain in the area over the longterm.
6.3 Characterizing the Six Regional Innovation Systems
That the six case study regions differ so dramatically in the composition of their local green economy and the nature of local innovation is due in part to the deep

107
economic history of each region. But it is also related to how the regional innovation system structures itself. In the following we describe how the RIS functions in each region, focusing in particular on the role of local networks, markets, and regulation. We begin with an overview of the innovative milieux in the regions, showing how the culture of innovation varies between the four innovative and two distressed regions. We then look at differences in the use and role of networks, markets, and regulations in the six regions. A concluding section maps networks in each region and explains the dynamics of their innovation systems.
The Innovative Milieu The idea of the innovative milieu grew out of the 1980s revival of the Marshallian industrial district concept – the idea that innovation concentrates in clusters of primarily small and medium-sized firms that specialize and rely on the external economies of the district.84 This creates a form of permanent innovation--continuous improvisation and improvement using flexible equipment, skilled workers and local institutions that balance cooperation and competition to produce constantly shifting array of products and define new markets. The idea of this milieu -- or "complex which is capable of initiating a synergetic process. . . a coherent whole in which a territorial production system, a technical culture, and protagonists are linked”85 – contrasts with the Schumpeterian idea of innovation as a disruptive process, as well as the conventional image of innovation as the product of either lone-wolf inventors in their garages or successful grant-seeking, RFP-responding, academic scientist-
engineers. And in fact, most innovations are not disruptive, but come from existing corporations in existing markets.86
In the following we introduce the innovative milieu, contrasting the highly innovative regions (the East Bay, Los Angeles, San Diego, and Silicon Valley) with the two non-innovative regions (Riverside-San Bernardino and the Upper San Joaquin Valley) in terms of their regional culture, market structure, and local green strategies.
Regional Culture: Progressive Values and Risk-Taking Entrepreneurship – and economic evolution generally – require risk-taking and progressive visioning; conservative cultural attitudes simply may not free up the investment leaps-of-faith which spur growth in new sectors most efficiently. As one East Bay interviewee put it, speaking of the Bay Area more broadly:
There are more progressive businesses here. You know, Haas [School of Business] and [Graduate School of Business at] Stanford, San Francisco State, the Presidio, all these business schools have all these students who want to be part of the green economy. Even Peralta [community] colleges – there are courses on solar or energy efficiency. Things that you don’t necessarily find in Nebraska.
The next wave of green innovation seems ripe to emerge from previous innovation systems, as a UC-Berkeley researcher argued:

108
We didn’t really talk about the biotechnical aspects of making cellulosic fuels, but it is a kind of biotechnology. There’s a trained workforce of 50,000 that’s working in the biotech industry and we have expertise, managerial experience, all the capital. That’s what will make it easy to spin companies out of here, that’s all in place you know the network relationships and knowledge. So, yes. I would expect that Berkeley will become, let’s call it the industrial biotechnology, could become what Stanford was to the IT industry.
Even where such a mood of risk-taking does not prevail, a regional culture of green market demand may drive investment in green or greening sectors. As the leader of an Oakland business association explains:
A lot of companies are changing their business practices to make them more sustainable, and want to engage with the City on how to do it. Their involvement is really about how much the owners and managers care about being green. Companies recognize they need to be doing something green these days, if only for marketing reasons.
Other regions reflected more guarded, conservative attitudes, driven either by healthy skepticism or by the sense that much needs to happen before strategic decisions can be made. An Inland Empire interview subject stated:
Harmony Homes in Fontana was creative - they are marketing something as the first “solar community” and every home has solar panels, every home is built to be energy efficient. They’re hoping to create that market. But ultimately the market is going to be driven by cost and demand so I don’t think you can create the market.
An Upper San Joaquin Valley interview participant put it even more simply:
The renewable energies and the clean-tech sort of thing, those concepts are somewhat alien to us here in the Valley
Major Players in the Local Market It is apparent that the entry of large, existing firms into the midst of an evolving innovation system can catalyze the acquisition of factors and the elaboration of networks quite markedly. The $500 million investment of British Petroleum in biofuels and renewables research at the University of California, and at Lawrence Berkeley Laboratory and UC Berkeley specifically, is such a signal event. As one East Bay interview subject put it:
BP has a big commitment to renewables already. They are the second biggest photovoltaic, a big sequestration company; they are a big wind company. And when biofuels emerged, they thought they should explore if they should be a big biofuels company too …. Inside the company, 11 years ago, John Brown, the CEO of BP, John
109
Brown, got up at Stanford and said, burning fossil fuels is causing climate change and BP is going to start changing its ways, and we’re going to reduce our carbon footprint.
Not every region will be blessed with such a substantial outside investor, but a similar push may come from an insider, such as Del Monte in Upper San Joaquin Valley, making a substantial new commitment borne of the desire for increased energy savings, lowered environmental compliance costs, and participation in sustainability programming from the standpoint of corporate social responsibility.
Obviously this is difficult to reproduce for regions lacking this kind of leadership and industrial concentration; it cannot simply be part of an economic development strategy. So less advantaged regions may aim lower. An Inland Empire interviewee briefly described one strategy:
We’re also close to getting a Chinese solar company to come to Riverside. It isn’t exactly R&D, but the Chinese are good at manufacturing.
Local Resources and Strategies As noted above, differently situated regions optimally utilize their existing advantages, adapting them to the development challenge at hand. In a place like the Inland Empire, sprawling suburban communities meet wide swaths of wind- and sun-rich desert and
mountainous regions. Two interviewees commented:
Southern California Edison, like all the utilities, has an obligation of 20% renewable. They’re putting a lot of time and money into boosting that with particularly large solar arrays and those kinds of projects down here … and we just have lots of desert.
The region is very anxious. I know firsthand the economic development people are very anxious to do green stuff here. It’s kind of a natural here. The area is quite blessed. So solar is quite natural, and wind is like, oh my God. And the San Andreas fault is right down the road here, at the Salton Sea, so geothermal is natural out there as well. So the area is naturally suited for the free energy, if you will. They’re blessed with natural resources, but beyond that, they need jobs for the turbine parts, solar parts ….
The correct, most productive strategy may be one which both takes advantage of those local resources but also directs them wisely in one or more specific directions. Another interviewee from the Inland Empire:
We’d like to look at Riverside as a center for solar installation training, which there is none in CA. There is no place to go to get certified. It’s all on the job. There are also several PV installers in the area that’ll be around for a while. So I think there is the initial emergence of the next green

110
market here. And [placement opportunities are] not just [in] the Inland Empire ….
One interviewee from Upper San Joaquin Valley believes green will be a much more standard business case than is conventionally thought.
What we do here is based primarily on economics. We talked about green, but that's a rather new term. To the extent that it costs us a tremendous amount of money to purchase power, to purchase gas, discharge wastewater or solid waste, liquid waste. It makes economic sense if we're going to be viable to be able to reuse or minimize the amounts of those things that we discharge. You do that at point source, you minimize your inputs then you will minimize your outputs. The outputs that are left, then, you try to find a way to use. Or convert into something you can use.
Importantly, economic growth and innovation, particularly in environmentally sensitive settings, do not occur without stirring up potential political and even legal conflict. The farther from the metropolitan hubs a region is located, lacking the green regional culture of California’s coasts, the more likely such factors may obstruct evolution of new sectors. As an Upper San Joaquin Valley interviewee put it:
The ideal place to put [new solar farms] are in the Coastals, and we don’t think environmentalists will let them do that. I think that the
wind turbine people perhaps in some respects may have pulled the wool over some of the environmentalists’ eyes with the harmless nature of those, which doesn’t appear to be all that harmless and yet they were able to dot them all over the landscape on the other side of the hump. On this side, I don’t know if we’ll be able to get those done.
Without such a culture in place, the innovations in San Joaquin Valley are occurring piecemeal. The push for innovation comes neither from available technology outside the firm (although pieces of outside technologies may be used) or from consumer demand, but directly from the firm itself. As one firm explains:
The system we've built back here can be replicated and used in other applications. But the fact of the matter is that every factory is a little unique, every factory has different requirements in terms of inputs and outputs and therefore it would have to modified to some extent or another.
Not only does the push for innovation start at the firm level, but to some extent it ends there, as well. The process or product is not developed for a specific consumer market but rather for one firm, with one specific set of needs. This process is contrary to the conventional, linear model of innovation. As regulations and cost constraints are pushing businesses to innovate, the value created by the new product or process stays completely inside the firm, rarely if ever reaching the market.

111
The Networks – And the Players Researchers have long understood networks to be key to regional innovation systems and economic development. Connections among a variety of actors, including firms, universities, venture capitalists, trade associations, chambers of commerce, thinktanks, governments, and others, activate the innovative process from idea to product or service to market. Innovation thus occurs external to the firm; the regional innovation system creates an institutional milieu, embedded in a particular region, that facilitates interactive learning.87
The most well-known examples of regional innovation systems (or, as more popularly called in the 1980s, industrial districts) are perhaps Silicon Valley and the Third Italy (the Emilia-Romagna district).88
In both of these regions, innovation emerged organically from production, thus forming clusters that generate increasing returns to scale (for instance, lower unit operating costs due to concentrations of suppliers) and/or higher unit earnings due to product or process innovations resulting from intense local competition or even cooperation between firms. The cluster strategy entails intervening at a regional level to improve networks, often by developing a regional support infrastructure and working actively with business. Although studies have described how policies can help clusters function more smoothly (for instance, by supporting local universities and fostering an entrepreneurial climate),
they have not yet systematically evaluated whether and how they contribute to regional growth. Recent networks unique to the region: in the case of Silicon Valley, the connections between Stanford University and local entrepreneurs, and in the Third Italy, the relationships between industry and the local state.
As described in Chapter 3, relationships between universities and firms often propel regional innovation systems and facilitate commercialization of technological innovations. In the “technology push” model, universities themselves market their research. In “market pull,” entrepreneurs or corporations may mine university technologies to generate market applications. Another growing type of networking occurs through more direct collaboration, either partnerships between firms and universities initiated by corporations that wish to “milk” university research or the “morphing” of faculty themselves into entrepreneurs.89
This history of regional innovation matters: That green innovation networks already exist is due in part to the presence of mature networks in information technology and biotech. Several of our interview respondents emphasized the connections among the industries; as one expert commented, “And some of the green technologies are convergent. For instance, bio-fuels research on Berkeley Labs is coming out of previous bio-medical research that is now applied fuels.” According to a local
112
official in the East Bay, “A lot of the workers in the cleantech industry worked in the semiconductor industry, so if jobs are outsourced in one area, we have a trained workforce already waiting here… worked with executives at computing firms that are now executives at the cleantech firms.”
Though the idea of the network is useful in order to describe how regional innovation and economic development occur organically, it is more unwieldy as a prescriptive concept, i.e., a deliberate policy approach to economic development. In order to build networks, policymakers have widely adopted the cluster approach (popularized by Michael Porter beginning in the late 1990s90). Geographic concentrations of companies share products, markets, technology, labor, inputs, and other factors of evidence suggests that development of clusters actually slows job growth relative to non-clustered industries in a region, perhaps because productivity improvements make it possible to reduce the workforce.91
Thus, most consider a “successful” cluster initiative to be one that simply makes new network connections, improves information about and access to shared resources, and starts a dialogue among regional stakeholders – improved processes that should, at a minimum, lead to higher firm productivity and output. Chapter 5 demonstrated the prevalence of network connections for green economy firms. Despite the relatively recent emergence of green and cleantech firms, they have
already built networks, particularly with universities, trade associations, venture capitalists, and regional economic development intermediaries. Weakest are connections among local firms, many of whom expressed eagerness to learn more about each other (according to both our surveys and interviews). The following will describe the networks particular to our six regions, based on the survey results. Green businesses in the case study regions interact very differently with other organizations and businesses. Figure 6.2 shows the share of green businesses that interact frequently (on a weekly or monthly basis) with different types of players in the regional innovation system in each region. Overall, Silicon Valley and San Diego firms are the most interactive, and the East Bay is the least. All but San Diego green business interact most frequently with similar businesses within the region, while San Diego businesses interacted more with similar businesses outside of the region. Silicon Valley firms interacted fairly frequently with nonprofits, while East Bay and Los Angeles green businesses in the sample were the most likely to have only rare or no interactions with local universities and research organizations. Local trade associations were more important to San Diego and Silicon Valley businesses than to green businesses in other regions, and East Bay businesses were particularly unlikely to interact with local chamber Another perspective on interaction comes from examining relationships with firm competitors, suppliers, and partners – in other

113
words, other firms. In general, green companies seem to be competing primarily with businesses located within the city or regional area. However, in the Inland Empire, almost two thirds of green firms are competing with firms spread throughout California, and almost half of San Diego green firms are competing with firms spread throughout the country (Table 6.3). While Silicon Valley firms primarily compete locally, almost one
fifth face global competition. Interestingly, Silicon Valley and San Diego are the regions in which green companies are more exposed to international competition. Thus, along among the regions, Silicon Valley offers a clear local-global dynamic Close to half of green business responded that their major suppliers are located within the local region, with an additional 15 percent drawing from California (Table 6.4). Among the study regions, the East
Table 6.3 Main Location of Competitors for Green Businesses by Region
EB LA IE SD SV USJ Within Your City or Region 69% 56% 9% 23% 64% 75% Throughout California 13% 18% 64% 16% 6% 25% Throughout the Country 13% 15% 18% 45% 11% 0% Throughout the World 6% 12% 9% 16% 19% 0%
Figure 6.2 Weekly/Monthly Interactions for Green Businesses by Region*
* Upper San Joaquin Valley excluded due to the small number of responses

114
Bay is particularly dependent on local suppliers, while at the other extreme, no Inland Empire firms listed the city and region as the primary location of suppliers. San Diego is the only other large region where less than half of green businesses reported the region as the primary location of suppliers. Partners come primarily from the region as well for green businesses. Over sixty percent of green businesses primarily partner with businesses within the region. By this measure the San Diego area again is less locally based, and more globally based than other study regions (Table 6.5).
Thus, though most regions’ green innovation network is regionally embedded, several regions have unique relationships to networks beyond the region. The San Diego area, with an
international border, has stronger national and international interactions than most other regions. The Inland Empire, as a less diversified economy, relies more on other parts of the state for its market, supplies, and partners.
Another indicator of the strength of local networks is where firms get information about the green economy and environmental issues. Most regions rely on both Trade Associations and Publications or Media. But Silicon Valley businesses are particularly likely to use Conventions, Expositions and Meetings as well, in stark contrast to the Inland Empire. However, both Los Angeles and Inland Empire businesses rely disproportionately more on their competitors and other firms for information.
Table 6.4 Main Location of External Suppliers for Green Businesses by Region
EB LA IE SD SV USJ Within Your City or Region 64% 54% 0% 23% 50% 40% Throughout California 14% 0% 56% 19% 7% 40% Throughout the Country 12% 29% 22% 31% 21% 20% Throughout the World 10% 18% 22% 27% 21% 0%
Table 6.5 Main Location of Partners for Green Businesses by Region
EB LA IE SD SV USJ Within Your City or Region 72% 63% 50% 42% 67% 60% Throughout California 8% 21% 17% 15% 0% 40% Throughout the Country 8% 5% 17% 19% 10% 0% Throughout the World 12% 11% 17% 23% 24% 0%

115
The Role of Markets Local markets play a powerful role in regional innovation systems, and the excitement about the growing commercialization of clean technology is particular apparent in the most innovative regions. As an economic development official in San Diego argued:
Suddenly ideas that five years ago had no value whatsoever and now you have a greener technology that’s going to be a marketing advantage. Computers, batteries, wireless. Not because the cost reduction but because it’s the right thing to do.
The existence of a local market for their product is a key location factor for green businesses (Table 6.6), and in fact is particularly important for the Inland Empire and Los Angeles, where quality of life is less salient, as well as for the East Bay and Silicon Valley, where the green regional culture predominates. Though the location of the executive’s
residence dominates most firm location choice, it is not so important in the Inland Empire, whether because of absentee ownership or a more mobile CEO population. Asked where their actual markets are located, green firms in the East Bay, Los Angeles, Silicon Valley and the Upper San Joaquin Valley emphasized private households within the region, while firms in the Inland Empire sell mostly to firms throughout California (consistent with their specializations in manufacturing and logistics) and those in San Diego sell all over the world (Table 6.7). How Networks Work in the Six Regions The six case study regions base their green economy in very different types of networks. We used UCINET network analysis software to analyze network structures in each region, based on our interviews, during which we asked the respondents to list their top five contacts in their green economy work. If they couldn’t stop at five, we included their entire list; some were only able to name a couple.
Table 6.6 Location Decision Factors for Green Businesses by Region
EB LA IE SD SV USJ n= 94 40 13 34 40 8
Executives' Residence 61% 68% 15% 68% 65% 75% Local Market for your Product 57% 60% 62% 32% 53% 38% Quality of Life 53% 35% 31% 56% 43% 38% Labor Pool 19% 15% 15% 18% 25% 25% Availability of Space 18% 15% 31% 18% 5% 50% Local University or Research Organization 15% 10% 15% 15% 13% 0% Availability of Financial Capital 9% 13% 15% 6% 25% 38% Other Firms in the Area 13% 8% 31% 12% 18% 0% Suppliers in the Area 10% 15% 31% 0% 13% 0% Other 17% 20% 46% 32% 13% 38%

116
Not surprisingly, Silicon Valley is the most networked economy, with its various regional nonprofits (such as Joint Venture: Silicon Valley) at its heart; San Diego, with its pre-existing biotech cluster, follows closely behind. The East Bay, in contrast, lacks clear leadership and effective intermediaries between its university and local government. Likewise, Los Angeles experiences poor connectivity and unclear leadership. Though the Inland Empire lags in innovation, it has one of the densest networks (i.e., with a larger average number of ties per stakeholder), with particularly close relationships between
government and economic development organizations; the Upper San Joaquin Valley is similar, but with less density. The following cases describe how these networks work in more detail, based upon our field interviews in each region.
East Bay The heart of the East Bay’s green network is UC-Berkeley, the premier public university in the country, and the two national labs, Lawrence Berkeley (LBL) and Livermore. Yet, the East Bay economy did not grow as a high-tech campus around the university and labs in the Research Triangle model. With its
Table 6.7 Location of Markets for Green Businesses
EB LA IE SD SV USJ n= 86 35 10 32 36 8
Private Firms / City or Region 7% 14% 10% 3% 8% 0% Private HH / City or Region 35% 34% 10% 16% 53% 38% Local Gov. / City or Region 5% 3% 0% 0% 6% 13% Other Public / City or Region 3% 3% 0% 0% 0% 0% Private Firms / California 10% 6% 50% 9% 0% 13% Private HH / California 6% 3% 10% 0% 0% 0% Local Gov. / California 2% 3% 0% 6% 3% 0% Other Public / California 3% 0% 0% 0% 3% 0% Private Firms / US 9% 11% 0% 13% 3% 13% Private HH / US 1% 0% 10% 6% 0% 0% Local Gov. / US 1% 3% 0% 0% 0% 13% Other Public / US 3% 0% 0% 6% 3% 0% Private Firms / World 10% 11% 10% 34% 14% 13% Private HH / World 1% 0% 0% 3% 6% 0% Local Gov. / World 0% 3% 0% 0% 0% 0% Other Public / World 1% 3% 0% 3% 3% 0%

117
early development as a hub of transport and logistics, and later transition into a service hub for professional services, health, and education, the East Bay never had the type of space appropriate to attract R&D, product development, and custom manufacturing. Instead, technology firms jumped from campus to Silicon Valley or elsewhere. But the innovation infrastructure has provided a kind of “advantage in waiting” deployed now as the social and cultural structure of the economy appears to shift in more transformative, generational ways. The moment seems to have arrived in early 2007, when British Petroleum (BP) announced its ten-year, $500 million investment in research and development relating to biofuels, partnering with UC Berkeley (UCB) and the Lawrence Berkeley Labs (LBL).92 This initiative established the Energy Biosciences Institute (BP-EBI), the world’s first research consortium devoted solely toward bio-scientific development of clean-fuel technologies. In UC Berkeley and LBL, BP identified two leading research institutions with existing network connections, regionally positioned within a thriving innovation system, representing not only ample current faculty and staff resources but the capacity to continue attracting the finest bio-energy students and future researchers as well.
Why would a large corporation seek to partner with a university? As one player described the partnership, the need for corporations to collaborate stems from not just lack of expertise, but
the complex and interdisciplinary nature of many scientific problems:
So you have this company, 100,000 employees, a big energy company, and they have no one with any expertise in biofuels at all. So how, they are going to explore whether they should do it. In a nascent field there is not a lot of talent around….And the other component of that is that we believe that this is a very complex topic. It has environmental land use issues, social equity issues, (because it is predicting a global view), chemical engineering, agronomic, economic… so we have more than 20 academic disciplines integrated into the institute now, over 50 research groups, and actually what we are really trying to do is generate a coherent view by integrating those things…”
In its early phase BP-EBI has organized itself into roughly five research emphases, as reflected on its website and other publications. Its feedstock development effort studies plant species, such as switchgrass and miscanthus and possibly many others, capable of yielding sustainable, high-efficiency biofuel production. Work on biomass depolymerization focuses on how plant sugars can be broken down in ways which fundamentally shift the economics of fuel processing. The related field of biofuels production analysis at BP-EBI explores how traditional fermentation processes (not unlike those in the manufacture of wine, and beer) can be utilized for cleaner-

118
burning, less resource-intensive fuels. Fossil fuel bioprocessing employs biochemistry in the field of oil and coal field development, towards the aim of reducing such activities’ environmental impacts. Lastly, BP-EBI’s research on environmental, social and economic dimensions will take seriously the fact that biofuels may come to involve new and different environmental effects which will have to be managed responsibly and effectively.
BP provides an example of a forward-thinking company with an existing philosophy toward adapting traditional technologies to new market demands and regulatory imperatives. BP’s leadership was among the first in its industry to make clean-fuel research a key investment focus, and this emphasis on renewables and other sources predated much of the recent evolution in domestic and international policy realms. At the time BP formed its bio-energy initiative, it was already a key player in photovoltaic, sequestration and wind energy applications among its peers in the fossil-fuels industry. In shopping the world for regional concentrations of the kind of R&D talent necessary to the task, the UCB-LBL tandem proved ideal, particularly in combination with an agricultural research partner like the University of Illinois. According to a UC-Berkeley partner:
They are educating us as well, of course. We really learn a lot from them. They had their chief economist here, talking about the future of energy; their head fuel engineer did a whole day
workshop on what are fuels, from a chemical engineering perspective, we had the head of their business unit come and talk about what their vision for business was. This is really interesting and hard to get at…And what we’re giving them is this big picture view, plus we’re educating a cadre of people who are then going to lead this area within the company. Back in the day when this was really controversial at Berkeley, I made the point that we have this really unique opportunity to educate one of the biggest energy companies in the world in our values. That seems to me like a big opportunity. They live and work here and we deal with it line by line you might say with them...a good opportunity to work through everything with them. That is very powerful in my opinion. I think we can have a huge influence on them.
BP-EBI and the long-term R&D investment founding it helps demonstrate the potential power of regional innovation systems. Were UCB and LBL operating as isolated, private institutions, the BP partnership would still be striking as a research partnership. The sheer collocation of the university and its laboratory is formidable. But these are public institutions with broader missions, and indeed, the laboratory represents a national anchor in the federal research sector as well. The establishment of the EBGC partnership – having UCB and

119
LBL as its driving intellectual capital – shows how outside investment can help catalyze important interactions among civic, university and industry interests leading toward regional economic improvement.
In the partnership, researchers work in both campus and corporate environments. Some even work on projects supported by Chevron as well. Though this has raised ethical questions among some observers, the partners in this relationship see it as a new form of interaction between academia and corporations.
It’s really a hybrid model….I see one of my main roles as trying to find a working place between the needs of our mission and maintaining the normal purpose and academic life of the university. We don’t want to interfere with it, we don’t want to change it; we just want to draw on it.
Ultimately, the relationship with BP may create a way to overcome entrenched academic silos. The joint initiative cannot transform the way the university works, but it might be able to work with it more effectively than actors inside the system, as an academic partner explains:
…it’s only in academia that people are in their silos, not interacting. There are complex reasons for it, so we’re just trying to lay our structure or mission onto the normal structure of the university, so we don’t interfere with their work…We don’t want to change
what’s going on around here; we just want to draw on if more effectively than the normal system allows.
The presence of the UCB-LBL research community was necessary, but likely not sufficient, to warrant BP’s historic investment. The diverse urban structure of the East Bay, and its other embedded employment and corporate assets in research and development, played a key role. The relative absence of any dominant, rigid industrial sector provides ample room for regional growth and diversification should initial investments bear fruit. And perhaps most importantly from the standpoint of BP’s investment strategy, the existing pool of talent at UCB and LBL - in the basic and applied sciences and biology, physics, energy development and related fields – could be readily adapted towards urgent new challenges in technological innovation. Even the substantial resources of places like Silicon Valley and Stanford University, as well as other candidate regions in the US and around the world, could not offer a talent pool of similar research concentrations and adaptability.
Moreover, a strategic investment relying on regional innovation capacity can attract additional, complementary investment. Shortly after BP’s announcement of the UCB-LBL partnership, the United States Department of Energy (DOE) in mid-2007 established one of three new “bioenergy research centers,” the Joint BioEnergy Institute (JBEI) in the same East Bay region. JBEI is led by LBL,

120
UCB, and nearby Sandia National Laboratory and Lawrence Livermore National Laboratory, both part of the broader East Bay region and commuteshed.93
Dedication of substantial federal research funds demonstrates the dynamic advantages of regional collaboration in this field, both as an engine for innovation and a magnet for increased investment moving forward. In combination, the establishment of BP-EBI and JBEI makes the East Bay region’s story a compelling illustration of how well innovation systems can produce economic growth and change, in accelerated fashion when necessary.
Despite the promise of the new partnership, in general the East Bay network is particularly notable for its
low connectivity and its great distance between contacts (Figure 6.3). Low connectivity means that there are relatively few pathways that connect network members: for instance if the City of Richmond wants to network with the JBEI, it has just two ways to do it, both involving one or more intermediaries. Though three venture capitalists are mentioned (Mohr Davidow, the California Clean Energy Fund, and Siemen Ventures), they are socially distant from both the cities and the university-related organizations. The network has good density – on average, actors know many others, but that means little without connectivity. If there is a heart to the network, it is at the East Bay Economic Development Association, which houses the Green Corridor Partnership.
Figure 6.3 Green Innovation Network in the East Bay
121
Many obstacles have prevented successful relationships from emerging to date. One common issue mentioned in interviews is the embryonic state of much research in alternative energy, which has not yet gotten to the point of commercialization and thus has not attracted firm interest. At its simplest, it is an issue of proximity. An East Bay city official commented that her city could not compete for Lawrence Berkeley National Lab spin-off business, since it was too far away (30 minutes). A Silicon Valley venture capitalist, explaining why UC-Berkeley and LBL are at a competitive disadvantage, argued:
Stanford’s got a much easier game to play because they’re sitting on flat land; and I hate to say it but that’s the way it works, people don’t want to walk up a hill…if you had the national labs sitting at Stanford, it would be a totally different game. But getting up to the national labs is a pain in the ass. And so, oddly, geology matters.
Where the relationships fall particularly short is in translating innovation into economic development. Several UC-Berkeley informants, even when able to describe firm-university networks, claimed that they were not doing economic development or entrepreneurship (said one, “I’m not sure about promoting green companies.”). Though members of the partnership between BP and UC-Berkeley are optimistic about its ultimate potential for spinoffs, the network is strongest between campus
and large corporations (including Chevron in addition to BP). Some local firms seem themselves as players in a green innovation system more national than regional, as one explained:
I have professional friends and contacts, and I have a lot of allies, but do not interact with them that often. I travel a lot, so I don’t have that much of a strong network here. Unfortunately we would like to be involved locally, but given that we do more on the national scale, we are not involved locally….[for instance] we have a big relationship with Google, we do smart grid work with Google. Are we doing it because they are located here? If they were in Plano TX we would have the same relationship.
Yet, the relationships are clearly needed in order to improve information flow, as one local economic development leader explained:
The work of the Corridor, and the Partnership with the Lab and University, and early conversations with the tech transfer people there are the most helpful, because they are the ones who can really give a sense of who these companies and who they are likely to be. Other than Amyris I don’t know of that many companies that have stayed and have scaled up.
The first attempt at improving the East Bay green network came from the Oakland Partnership’s GreenTech

122
Cluster. This cluster initiative tried to foster new dialogue, help businesses access a green finance network, sponsor green building demonstration projects, and integrate green workforce development programs. However, it never gained much momentum. According to a local economic development leader:
The real challenge, to be frank, was that there weren’t really that many businesses that we could tap (to take a lead on initiatives). And so I think that was a weakness for the greentech industry group. We had a lot of people who were from non-profits, who were academics, who theoretically had a sense of where this thing could go. But there weren’t really a lot of practical business people who had a company who wanted to shape this thing.
Even one of the cluster’s nominal leaders was skeptical:
I mean, I went to a bunch of meetings. I went to two or three briefings with Mayor Dellums. I was more like brainstorming and levering my knowledge, you know, I’m not an economic development guy, I’m in business practices so I guess I was trying to bring the voice of the business community to the conversation.
There are much higher hopes for the East Bay Green Corridor Partnership (EBGCP), a concerted effort to create more effective networks – and green economic development – in the region that may well provide the much-needed
leadership and connections. The EBGCP is a joint effort by the University of California at Berkeley, the Lawrence Berkeley National Laboratory, the community college districts, California State University-East Bay, and the East Bay cities of Berkeley, Oakland, Richmond, Emeryville, San Leandro, Alameda, Albany, and El Cerrito to support and promote green economic development in the form of emerging green and sustainable industries, alternative energy research, and a healthy built environment. The Partnership has leveraged significant funding for workforce development and has begun integrating numerous economic development programs across the region. Interestingly, one of its most impressive outcomes to date has been indirect; the Oakland City Council decided to expand the Oakland Enterprise Zone to cover Emeryville and Berkeley as well, because of a new understanding that labor markets operate regionally. Silicon Valley The work of AnnaLee Saxenian, Martin Kenney, and others has established the networked structure of Silicon Valley’s economy. But how readily can high-technology networks transform into green networks? Apparently, quite quickly, one venture capitalist described it to us:
…expats from Silicon Valley in its related industries, the semiconductor …and the biotech industry being the two most relevant…are adapting their talent, both personal and network talent, to a fluffy mix of ideas that are

123
coming in the clean tech…and many of those executives from these companies are …saying…if I put my name on this idea and I…say that this what I think I can do with the business, is this fundable?
Yet, as described in Appendix 9, Silicon Valley stakeholders are not just rebranding their technology networks, but interacting in new and different ways. Because the interactions needed to sustain innovation in the green economy require a supporting organizational and institutional infrastructure, local actors are coordinating extensively both within the region and with state and federal regulators.
Figure 6.4 shows Silicon Valley’s green
network. What stands out most compared to the East Bay network is the connectivity and centrality in the network. Several of the key initiatives described below, including the Clean Tech Open, Solar Tech, and Sustainable Silicon Valley, play central roles, as does Collaborative Economics, which has led green economy studies nationally. Venture capital funders are also more central than in the East Bay, and LBL is just as integral to this network as it is to the East Bay’s. The high connectivity means that information and resources can flow readily among network members, making possible the new, widespread effort at coordinating the cleantech economy.
Figure 6.4 Green Innovation Network in Silicon Valley
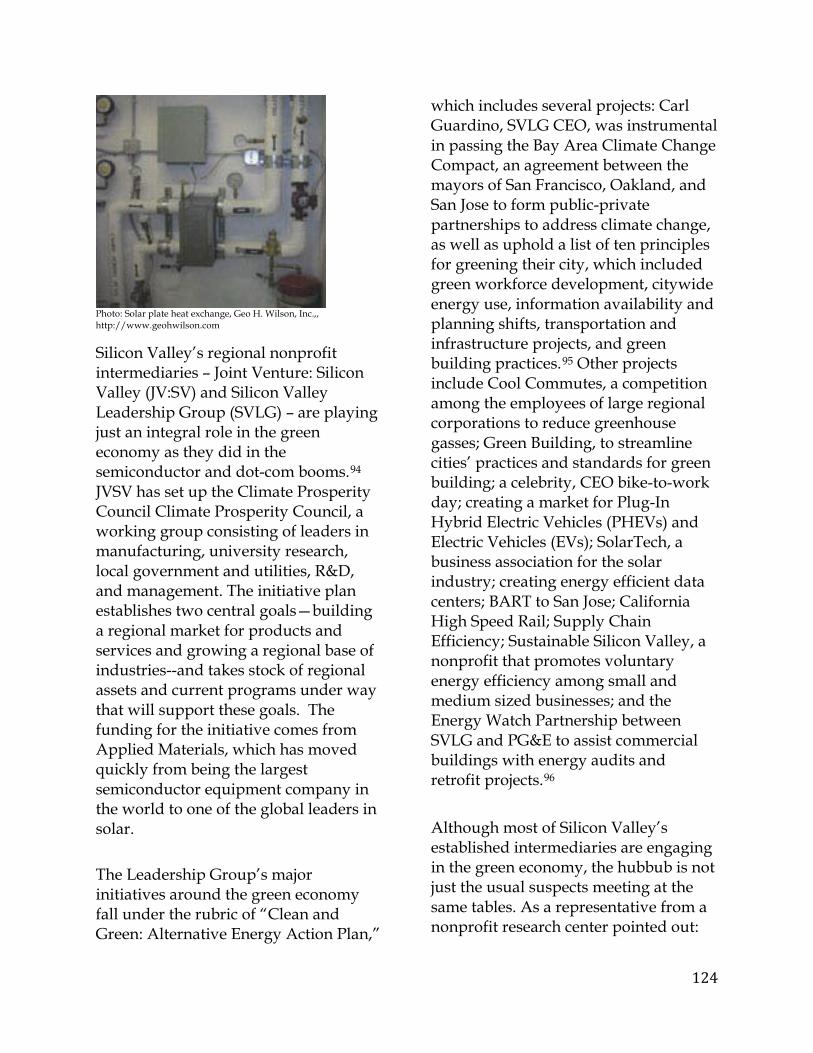
124
Photo: Solar plate heat exchange, Geo H. Wilson, Inc.,, http://www.geohwilson.com
Silicon Valley’s regional nonprofit intermediaries – Joint Venture: Silicon Valley (JV:SV) and Silicon Valley Leadership Group (SVLG) – are playing just an integral role in the green economy as they did in the semiconductor and dot-com booms.94
JVSV has set up the Climate Prosperity Council Climate Prosperity Council, a working group consisting of leaders in manufacturing, university research, local government and utilities, R&D, and management. The initiative plan establishes two central goals—building a regional market for products and services and growing a regional base of industries--and takes stock of regional assets and current programs under way that will support these goals. The funding for the initiative comes from Applied Materials, which has moved quickly from being the largest semiconductor equipment company in the world to one of the global leaders in solar.
The Leadership Group’s major initiatives around the green economy fall under the rubric of “Clean and Green: Alternative Energy Action Plan,”
which includes several projects: Carl Guardino, SVLG CEO, was instrumental in passing the Bay Area Climate Change Compact, an agreement between the mayors of San Francisco, Oakland, and San Jose to form public-private partnerships to address climate change, as well as uphold a list of ten principles for greening their city, which included green workforce development, citywide energy use, information availability and planning shifts, transportation and infrastructure projects, and green building practices.95 Other projects include Cool Commutes, a competition among the employees of large regional corporations to reduce greenhouse gasses; Green Building, to streamline cities’ practices and standards for green building; a celebrity, CEO bike-to-work day; creating a market for Plug-In Hybrid Electric Vehicles (PHEVs) and Electric Vehicles (EVs); SolarTech, a business association for the solar industry; creating energy efficient data centers; BART to San Jose; California High Speed Rail; Supply Chain Efficiency; Sustainable Silicon Valley, a nonprofit that promotes voluntary energy efficiency among small and medium sized businesses; and the Energy Watch Partnership between SVLG and PG&E to assist commercial buildings with energy audits and retrofit projects.96
Although most of Silicon Valley’s established intermediaries are engaging in the green economy, the hubbub is not just the usual suspects meeting at the same tables. As a representative from a nonprofit research center pointed out:

125
You just cannot call out and hire a smart grid expert to know all that stuff, so looking within our organization we have a lot of these pieces, we have people that know about fiber security, we have people that know about renewables, we have people that know about connecting distributive resources, but they don’t know about each other. Figuring out a way to get these parties in the room, to help define the problem, think about how each of their pieces of expertise can help solve it, where are the gaps, these are some of the things that I am doing. So that we can be prepared to work in this opportunity.
According to our survey, green businesses are disproportionately likely to rely on conferences to get information about new technologies or products. Silicon Valley offers multiple opportunities for convenings. Joint Venture’s annual State of the Valley conference has proven to be a forum for discussion of economic opportunities around climate change. The Clean Tech Open is a nationally known competition in cleantech technologies that connects businesses with university partners and engages venture capital by having them serve as competition judges. SolarTech is more of a traditional industry association that helps to identify and address industry needs. For instance, when they realized that Silicon Valley manufacturers were going to Arizona in order to test their solar panels, they collaborated with the City of San Jose to construct a facility locally. One ongoing
effort is to streamline solar permitting across the region to facilitate the work of green building firms. In sum, Silicon Valley’s networking continues to be unparalleled within California, and perhaps the entire US. San Diego Like Silicon Valley, San Diego has a long-established innovation network (see Appendix 8 for more details). One of the key factors behind its transformation from an economy dependent on defense spending to a high-technology region was UC-San Diego’s CONNECT program, which increased the university’s research capacity, involved local firms in funding research, and facilitated technology transfer. In conjunction with multiple other efforts, including the MIT Enterprise Forum, the Regional Technology Alliance, BIOCOM, a local trade association, and the San Diego Manufacturing Extension Center, it has helped to create the local high-tech and biotech clusters. Another factor is simply its small size. As one leading firm told us, “The beauty of San Diego is that it’s very small. And I love LA, but the beauty of San Diego is it’s very easy to meet people and get to know people.” Because of the region’s intimacy, firms interact regularly with trade associations and policymakers, as the survey results also suggested. From the same firm:
I want to talk to people who are designing the law. Like at the state level at the city level, to give them the industry perspective, to work on passing initiatives and

126
programs that are going to be sustainable and grow over the long term, not just overnight and then die because we’ve seen that happen in markets as well.
The local network structure demonstrates a higher density, connectivity, and centrality than any network except Silicon Valley’s (Figure 6.5). The network provides multiple pathways for information to flow, and indicates several actors with a high degree of influence over the network, particularly the California Center for Sustainable Energy, UCSD, the City of San Diego, and Cleantech, the formal cluster that has spun out of CONNECT. The San Diego Cleantech Initiative is working on marketing, lobbying,
Photo: One-Cycle Control, Inc., 100 Amp (40 kW) Active Power Filter, 15kW Bidirectional converter, 800 to 24Vdc converter, 400 to 24Vdc converter http://www.onecyclecontrol.com
technology transfer, financing, and communication among its members, who come from the private sector, academia, government, and civic associations. Commented a city official, “In order to be successful we need to have well defined roles where we can all add value.” Thus the initiative might
Figure 6.5 Green Innovation Network in San Diego
127
push one of its affiliated research centers to pursue a new idea from academia. The center then “flushes out” the idea and pushes the good ones to a local angel fund, such as the Tech Coast Angels. The Cleantech Initiative will help identify the right management strategy to launch the commercialization process. At that point, the cluster initiative involves the City to help identify sites and facilities, and planners help them streamline permitting processes and take advantage of state programs such as the foreign trade zone, as well as local incentives such as sales tax reductions and land donation.
Members are generally enthusiastic. Said one,
It’s a good networking environment for people in Cleantech. To find out what’s coming from the regulatory perspective to help the businesses. They work with policy at the state level. They were behind pushing the City of San Diego to adopt the AB811 policy to allow cities to lend money to solar PV projects. We are working with SANDAG to also promote that policy. They are helping cities implement energy efficiency and renewables and do an assessment of their carbon footprints.
Of course, it is also not hard to find skeptics. Asked what the initiative does, another member said:
I don’t understand myself and I’m a board member. They talk about clusters a lot so they want to do that. They have the head of the biotech cluster on the board. The reason he’s there is they want to replicate that for Cleantech. They have the universities involved, the industry involved and government, the cities involved. And that is the goal to attract manufacturing, well not manufacturing but the industry. My problem is that wherever I go people want manufacturers. And you can’t physically put a factory in every city you do business in. I don’t know how it is going to shake out. You have Texas, New Jersey, every state in the nation trying to attract solar. Austin has a cleantech program as well. LA has one. So it’s kind of hard to figure out what’s going to. It all depends on the market. We tell Cleantech that if the market is here then companies will come.
Los Angeles Long associated with the decidedly un-green images of heavy manufacturing, suburban sprawl, and traffic congestion, Los Angeles faces an uphill battle in establishing a reputation as a green city. According to an official in the mayor’s cabinet, when people are asked to think of a green city, they “automatically go to cities like San Francisco, Seattle, Portland” but not Los Angeles because it has “a historic reputation…whether it’s real or not, people just don’t want to believe [it is a green city].” Other challenges include the size and

128
dispersed nature of the region, weak communication links between certain sectors, and a nearly complete separation between green information networks and technology innovation networks.
Various key players in LA County consistently identified size and sprawl as network obstacles. One leading economic development official claimed he did not “know of any established green networks… LA is so spread out and diverse that it’s hard to consider a clustering of networks being developed.” Others pointed out the difficulty of gathering municipal stakeholders: “[LA County] is a huge geographical area with lots of jurisdictions.(…)We can’t get everybody in the room, there are many jurisdictions in the county, hundreds of districts.” The problem is not just logistical, but structural; as the economic development official argued, “small cities in the county [are] just [looking] at themselves and [not] at what’s happening throughout the county that can impact them.(…) It’s hard to encourage them to look outside of their own city. It’s hard to get these small cities to think globally.”
Certain relationships are particularly problematic. Poor networks between venture capitalists and Los Angeles stakeholders stand out. As the leader of one intermediary bemoaned,
People from Silicon Valley come [to LA County] and wonder where that [network] infrastructure is. By having [partners] come close
means that you can have coffee with them, you can breakfast with them, you can ask them what’s going on with your company. It’s a lot easier to build rapport, a relationship with the investor. If you have to jump on the plane and get to most of the investors, it’s really difficult to build that relationship.
One angel network member in Southern California simply told us, “We don’t have a one-to-one relationship with schools." Asked about university contacts, a Los Angeles venture capitalist could not even come up with a name:
Well, we have relationships with universities—we have relationships with UCLA, with USC, with CalTech. Generally those engineering schools and departments of chemistry—they know about us. Occasionally we’ll invest in a company that utilizes a technology which comes from the universities….
On the efforts to network regionally, the same respondent commented:
Boy, I don’t know if there is one [a network]. I think there's something called Green LA, but I don't know what they do. I think…I see them advertising, I think they have some get-togethers, but again, the pockets of capital that invest in companies and the networking and the Green LA, they’re really two different groups. Generally, if you’re a entrepreneur or promoter
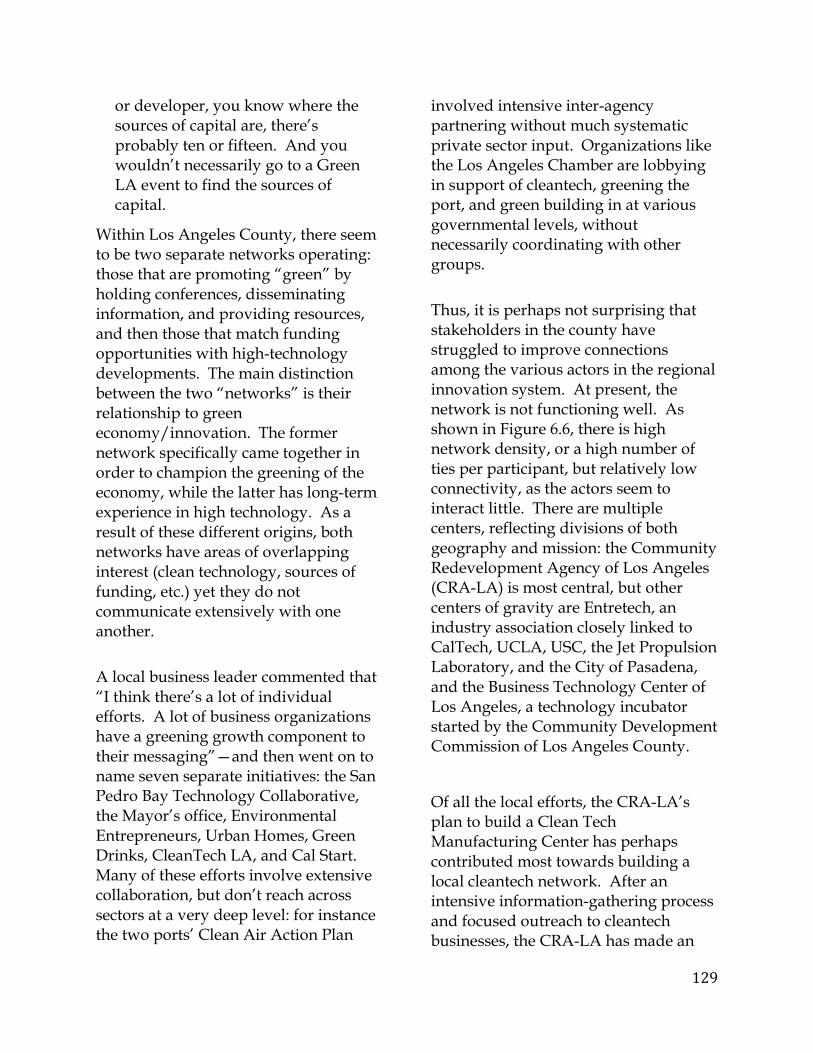
129
or developer, you know where the sources of capital are, there’s probably ten or fifteen. And you wouldn’t necessarily go to a Green LA event to find the sources of capital.
Within Los Angeles County, there seem to be two separate networks operating: those that are promoting “green” by holding conferences, disseminating information, and providing resources, and then those that match funding opportunities with high-technology developments. The main distinction between the two “networks” is their relationship to green economy/innovation. The former network specifically came together in order to champion the greening of the economy, while the latter has long-term experience in high technology. As a result of these different origins, both networks have areas of overlapping interest (clean technology, sources of funding, etc.) yet they do not communicate extensively with one another.
A local business leader commented that “I think there’s a lot of individual efforts. A lot of business organizations have a greening growth component to their messaging”—and then went on to name seven separate initiatives: the San Pedro Bay Technology Collaborative, the Mayor’s office, Environmental Entrepreneurs, Urban Homes, Green Drinks, CleanTech LA, and Cal Start. Many of these efforts involve extensive collaboration, but don’t reach across sectors at a very deep level: for instance the two ports’ Clean Air Action Plan
involved intensive inter-agency partnering without much systematic private sector input. Organizations like the Los Angeles Chamber are lobbying in support of cleantech, greening the port, and green building in at various governmental levels, without necessarily coordinating with other groups.
Thus, it is perhaps not surprising that stakeholders in the county have struggled to improve connections among the various actors in the regional innovation system. At present, the network is not functioning well. As shown in Figure 6.6, there is high network density, or a high number of ties per participant, but relatively low connectivity, as the actors seem to interact little. There are multiple centers, reflecting divisions of both geography and mission: the Community Redevelopment Agency of Los Angeles (CRA-LA) is most central, but other centers of gravity are Entretech, an industry association closely linked to CalTech, UCLA, USC, the Jet Propulsion Laboratory, and the City of Pasadena, and the Business Technology Center of Los Angeles, a technology incubator started by the Community Development Commission of Los Angeles County.
Of all the local efforts, the CRA-LA’s plan to build a Clean Tech Manufacturing Center has perhaps contributed most towards building a local cleantech network. After an intensive information-gathering process and focused outreach to cleantech businesses, the CRA-LA has made an
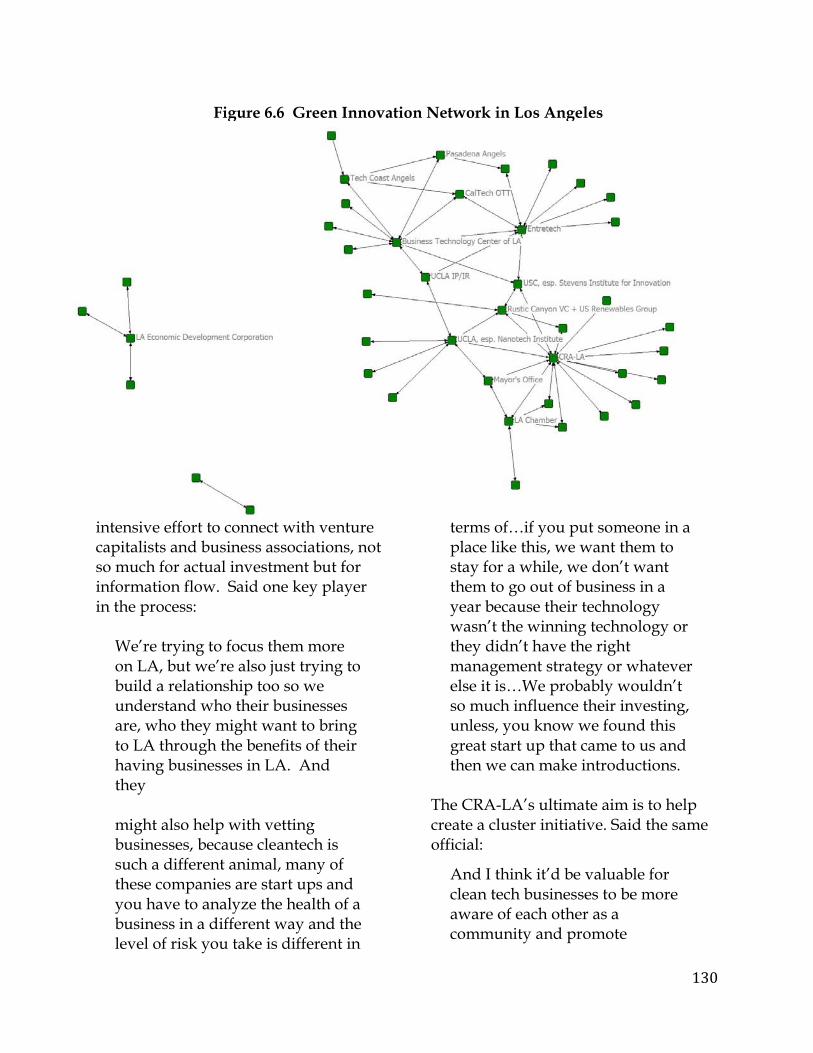
130
intensive effort to connect with venture capitalists and business associations, not so much for actual investment but for information flow. Said one key player in the process:
We’re trying to focus them more on LA, but we’re also just trying to build a relationship too so we understand who their businesses are, who they might want to bring to LA through the benefits of their having businesses in LA. And they might also help with vetting businesses, because cleantech is such a different animal, many of these companies are start ups and you have to analyze the health of a business in a different way and the level of risk you take is different in
terms of…if you put someone in a place like this, we want them to stay for a while, we don’t want them to go out of business in a year because their technology wasn’t the winning technology or they didn’t have the right management strategy or whatever else it is…We probably wouldn’t so much influence their investing, unless, you know we found this great start up that came to us and then we can make introductions.
The CRA-LA’s ultimate aim is to help create a cluster initiative. Said the same official:
And I think it’d be valuable for clean tech businesses to be more aware of each other as a community and promote
Figure 6.6 Green Innovation Network in Los Angeles

131
themselves as a community. I think that having that kind of self-awareness, that there is a body—a cluster—of some sort is helpful to a business.
The CleanTech Los Angeles Alliance has risen to fill the gap in regional networking. The culmination of two years of climate change meetings among the City of Los Angeles, the CRA/LA, the Los Angeles Business Council, UCLA, USC, and Caltech/JPL, it became formalized by the Mayor’s signing of a Memorandum of Understanding on April 15, 2009. The new partnership, which also includes the LA Chamber of Commerce, will work towards having Los Angeles become the “cleantech industry leader.”97 A website (http://www.cleantechlosangeles.org) currently lists updates on cleantech and other related news and events, while also offering information, resources, and reports on topics such as energy, climate change, clean transportation, and green workforce development. Further developments are on the way, promising the formal partnership to become a non-profit that works to increase LA’s cleantech opportunities.
Although still in an incipient state, the CleanTech Los Angeles Alliance promises to help cultivate local networks – but in a different way from Silicon Valley and San Diego. Rather than “green” being injected into an already existing strong regional network, green growth and innovation seem to the pulling point around which networks are beginning to form,
solidify, and strengthen. Whether this particular method of green economy/innovation network formation is more or less effective remains to be seen; however, the CleanTech LA Alliance is evidence of discrete groups in the region coming together to increase communication and could possibly become an asset to further green development and innovation.
The Inland Empire Given the low level of green innovation and economic activity in the Inland Empire (Riverside and San Bernardino counties), we might not expect to find close-knit green networks. However, the regional green network (Figure 6.7) actually displays high levels of connectivity and density, especially compared to the East Bay. Most central to the network are the Inland Empire Economic Partnership, a regional business group similar to Joint Venture: Silicon Valley, the Riverside County EDA, and the City of Riverside itself. Local universities, particularly Cal State San Bernardino, are well integrated into the network. The Inland Empire’s green cluster effort, the Green Valley Initiative, is well connected but not central. Not all the connections are close: initiatives in the eastern part of this huge region (so as the Coachella Valley Angel Network and Economic Partnership) are quite peripheral – not surprisingly due to that sub-region’s independent identity.
One of the reasons for the green network’s density is the leadership of

132
Riverside’s Mayor, Ron Loveridge, who draws from his experience sitting on the California Air Resources Board, as well as the fortuitous city ownership of the local public utility. The Mayor has rebranded suburban Riverside as the “Clean & Green City,” and has made early progress on green goals, such as a renewable energy standard for the utility, a tree-planting program, and a city fleet powered solely by alternative fuels (it is currently at sixty percent). They have built infrastructure for obtaining natural gas or even hydrogen fuel, and required LEED certification standards for new buildings. The mayor’s influence is profound: as a representative from the public utility told us, “I get an article on my desk from the mayor every time something happens in Berkeley, ‘Why aren’t we doing this?’” Ownership of the public
utility has given the city funding for R&D, so it has funded research at UC-Riverside on combining organic and inorganic materials combining to create growth photovoltaic cells and flexible batteries.
Another reason for the high functionality of this network is the role of UC Riverside's College of Engineering -- Center for Environmental Research and Technology (CE-CERT) in connecting to firms in Riverside and Los Angeles, which milk their research. For instance, a representative from the Port of Los Angeles described to us how they connected one of their tenants to CE-CERT to do tests on vessel engines to determine the effect of different technologies on emissions. A company that does materials research for improving efficiency of solar design got
Figure 6.7 Green Innovation Network in the Inland Empire

133
a grant from the Department of Energy and sought out CE-CERT in order to get both students and more companies involved in research off-campus. A large auto company heard about their research on new navigation techniques for cars and began a research collaboration. One economic development agency official commented that CE-CERT acted as UC-Riverside’s public interface for environmental issues and was both much easier to work with and much better networked than the rest of the UC system.
The Green Valley Initiative (GVI) is an ambitious cluster strategy that aims to establish the Riverside-San Bernardino region as a center for green technology. According to their website, GVI “is a regional business and economic development initiative to promote investment in both counties and to establish the region as a leader in green and clean technologies. Its mission: to create jobs, greater opportunities and a higher quality of life for the region.” Promotional materials further boast that more than five hundred regional leaders are involved in the initiative and more than thirty regional cities and towns have formally signed onto GVI’s mission.
GVI’s efforts thus far have resulted in the completion of a Comprehensive Economic Development Study, which have connected it to federal funding from the U.S. Department of Commerce Economic Development Administration and facilitated the previously-mentioned study on the greening of the logistics industry. GVI has also joined
with Collaborative Economics in order to identify clusters of opportunity and green action plans for the region.
In every interview, respondents referenced GVI as a major player in the drive for green economic development in the two counties, though some view the organization with skepticism, citing business attraction as a primary motivator that may eclipse sustainable sensibilities. Regardless, GVI has gathered widespread support throughout both Riverside and San Bernardino counties, which is no small feat. On the other hand, the region has yet to see tangible results from GVI’s substantial efforts, and strides toward green development remain to be taken. An economic leader involved with GVI acknowledges: “We created a lot of expectations and I think what [GVI] is trying to manage now is how you actually deliver something.” Another commented, “The whole ‘green talk’ is a lot of talk, but not a lot is happening.” Upper San Joaquin Valley
Although not constituting a regional innovation system in the conventional sense, a number of different local and regional institutions in the Upper San Joaquin Valley are relevant for the emerging green economy. As noted in Appendix 10, the Upper San Joaquin green economy is driven not by regional culture but by a dollar-and-cents logic, or the efficient application of processes or services to minimize the consumption of resources for financial gain. At the core of the green network, then, are firms reconfiguring their production processes, working independently of

134
one another but often with the assistance of industry associations like the Manufacturers Council of the San Joaquin Valley.
Two institutions shaping the entire Central Valley are The San Joaquin Valley Air Pollution Control District (the Air District) and the Great Valley Center. Both of these organizations strengthen links between the businesses, institutions, and local governments in the Central Valley. The Air District was established in 1992 in response to the substandard air quality level in the San Joaquin Valley Air Basin and is an independent entity governed by representatives from constituent cities’ boards of supervisors and the private sector. The Great Valley Center is a non-profit organization started in 1997 to support the activities and organizations of the Central Valley, with the stated goal of “helping communities throughout the region to develop a healthy and sustainable future by encouraging coordination and cooperation among the region's diverse interests.” Agriculture and energyprograms focus on increasing the sustainability of production processes, and in so doing represent a contrast to the conservative status quo in the Valley.
On a more local level, economic development activities in both San Joaquin County and Stanislaus County are headed by non-profit, public-private partnerships. The San Joaquin Partnership (SJP) spearheads efforts in San Joaquin County and in Stanislaus
County, the Stanislaus County Workforce Investment and Economic Development Alliance (The Alliance) takes a leadership role. The SJP is a non-profit, public-private economic development corporation that assists with business location and increasingly focuses on entrepreneurship, recently partnering with the University of the Pacific to start the San Joaquin Valley Angel Network. In neighboring Stanislaus County, the Stanislaus Economic Development and Workforce Alliance plays a similar role and is trying to position the County as more attractive to East Bay companies that have spun-off from Berkeley or Stanford, although these efforts have focused on biotech companies and not green businesses yet.
Photo: ChloroFill LLC, ChloroFill renewable building materials, http://www.chlorofill.com

135
Rounding out the institutional picture are three more institutions. The Modesto Irrigation District, one of the oldest institutions in the region, provides water and power to much of Stanislaus County, and because of this role as an energy provider brings capacity in energy management to the region. The Port of Stockton, a key transportation node within the region and California, owns and manages its surrounding area and as such, it is very involved with other economic development efforts in San Joaquin County. As a result of the downturn, the Port is currently trying to diversify and attract different kinds of businesses, including renewable energy enterprises. UC Merced, California’s newest addition to the state university system, which houses the Energy Research Institute, with a primary focus on the
study of new and improved renewable and sustainable energy technologies.
Interview respondents agree that economic development efforts in the region are splintered by county, with little communication regionally. Not surprisingly, then, the regional green network has a relatively low level of connectivity, meaning few channels through which actors can communicate (Figure 6.8). However, there is relatively high network density, indicating that some agencies are interacting with others within their discrete nodes. Moreover, there is clear centrality and leadership, with the Great Valley Center and the Alliance at the heart of the network.
In some ways, the Upper San Joaquin Valley network functions differently
Figure 6.8 Green Innovation Network in the Upper San Joaquin Valley

136
from those in other regions. Although the survey found that businesses are generally rooted in the region, some of the major firms may be non-local. As a representative from the Air District observes: “Startups are coming here mainly because it’s cheaper to set up shop here than on the coast… [However] they may set up their business here, but live and participate in the Bay Area.” Likewise, the relationship between universities and local firms is less one of milking or morphing, as in other regions, and more one in which (as a local trade association representative says) “Someone in the field says, you know, we've got this thing that we need to do. We think this might work, could you help us either test these things that people say are working? or help us design this? or help us measure it?” The relationship in this situation resembles more the traditional cooperative extension model commonly seen in agricultural sectors than the commercialization of university research seen in high-tech industries. Conclusion The case study regions seem to be following three distinct paths in cleantech innovation and the green economy. Each path will likely lead to new innovation and economic growth, should current patterns continue.
The Innovation Stars The clear leaders in cleantech innovation are Silicon Valley and San Diego. San Diego trails Silicon Valley by a large margin in the composite innovation index, but it dominates product innovation (according to the survey). It has transformed its economy
several times in recent decades, and local firms value its high quality of life and are optimistic about their prospects. Despite having a smaller green economy than some of the other regions, San Diego offers a high level of diversity across green sectors, balanced between services and manufacturing. Green transportation and energy research and services are growing particularly fast. Local firms compete globally, interacting with partners and suppliers nationally and internationally, and serving global markets. Its green innovation network is highly centralized and interconnected, suggesting a high degree of leadership and information flow.
Due to its local expertise, financial capital, labor pool and institutions, as well as excess capacity in manufacturing, Silicon Valley is leading green innovation in California. Its small firms are particularly competitive in green building and manufacturing, and are growing quickly in green transportation and energy research. Of all regions, Silicon Valley’s firms are the most highly networked, particularly with other firms, trade associations, and nonprofits. Also unlike other regions, Silicon Valley couples local and global reach in terms of its competitors, partners, and suppliers. More than any other segment, local household markets drive its green economy. Even more than San Diego’s network, Silicon Valley’s is dense, interconnected, and centralized, particularly around the several intermediaries that serve as green business conveners.
137
Though both San Diego and Silicon Valley concentrate cleantech innovation within their borders, neither yet dominate cleantech the way they do innovation overall. In a sense, they are coasting on their innovation laurels, benefiting from previous rounds of investment in an innovation infrastructure. Yet given their capacity for innovation and growth, it would not be surprising to see them both gain increasing shares of the cleantech and green markets over time. The Green Economy Giants The all-around leaders of California’s green economy are Los Angeles and the East Bay. Los Angeles has almost as many jobs as the #3-5 regions combined (Orange County, San Diego, and Riverside-San Bernardino), and the East Bay has almost as many as #5-7 combined (Riverside-San Bernardino, San Francisco-San Mateo-Marin, and Sacramento). Both regions are far more innovative in cleantech than they are generally, and when innovation is standardized by the size of the economy, then the East Bay ranks second only to Silicon Valley.
Los Angeles dominates cleantech innovation and the green economy due to its sheer size. City and county government policy and procurement can have a tremendous impact on energy consumption. The vast research infrastructure, both in the form of universities and private R&D, makes it the leading region for cleantech idea generation. Los Angeles has a green
economy dominated by large firms in transportation and manufacturing, with rapid growth in energy research and services. Local firms depend on local household markets, partners, and suppliers. Growth has slowed in recent years, making some firms pessimistic about the future. The regional network is high density, but has low connectivity: there are many centers of activity but not much interaction between them.
The East Bay is playing a new lead role in the green economy, particularly in biofuels and other alternative fuels. Of all regions, it has the best balance of idea generation, development, and commercialization. Its size stems from the presence of UC-Berkeley and two national labs, which make it highly specialized in energy research. The green building and environmental services sector are the region’s fastest growing, while it is not competing well for green manufacturing. Firms are relatively rooted due in part to their appreciation of the local quality of life. They also work closely with local suppliers, partners, and household markets. However, compared to other regions, there is little interaction between firms and intermediaries such as nonprofits, trade associations, and chambers of commerce. Although the regional network is very dense (actors interact with many others), it has poor connectivity among different portions of the network, and no central point of focus; information does not flow easily and there is little leadership.

138
Thus, Los Angeles and the East Bay are likely to continue dominating California’s green economy due to their extensive assets and industry structure. However, their growth is slowing, and other regions not the focus of this study may begin to catch up. In particular, the San Francisco-San Mateo-Marin metropolitan area, Orange County, and Sacramento County have similar profiles to these green giants and are likely to perform well in the future. The Rapid Green Growth Periphery Although the bulk of cleantech innovation and green economy jobs are located in the top four regions, many California regions are benefiting from the spillover of the green economy from these areas. State and local regulation plays a role here in leveling the playing field: firms may move out to more peripheral areas in order to lower costs, while many local businesses seem to be changing the way they operate in order to comply with environmental regulation.
With its strengths in manufacturing, construction, logistics, and natural resources, the Inland Empire has been well positioned to capture growth in the green economy. It performs well in green startups and gazelles, as well as the firms engaging in process innovation. The region specializes in manufacturing, recycling/remediation, and green building, and is one of the state’s fastest growing regions in all sectors. Its competitors and suppliers tend to be all over California, rather than local. Local firms are generally optimistic, despite the recent economic
downturn and the lack of a supportive regional culture. The regional green innovation network resembles that of San Diego and Silicon Valley, with high density and connectivity. However, apart from a center of green activity in Riverside, there is little leadership, and much distance between stakeholders in different parts of this extensive region.
Though the scale of its green economy is very small, the Upper San Joaquin Valley is the fastest growing of all six regions in all of the sectors, with an average annual growth rate of almost 3.4 percent. Environmental regulation has proved challenging for local firms to cope with, given the extent of local environmental issues and the cost of complying. Yet in some cases, it has made economic sense to innovate new processes, and recycling/remediation and manufacturing have grown as a result. Local firms are highly rooted, serving local markets and interacting with local suppliers and partners (as well as those around California). Despite lacking a supportive culture for green innovation, the Upper San Joaquin Valley offers a promising future for its green sectors. 6.4 Policy Approaches
As described in Chapter 3, a traditional menu of policies to support innovation might include development of talent, investment in R&D, and support of both the physical (“hard”) and policy (“soft”) infrastructure that will aid technology transfer and commercialization. The regional innovation systems framework adds to that the idea of instituting a “systems manager,” a policymaker,

139
venture capital firm, or other key player in the system who can broker new connections and speed the flow of information.
Recent trends in innovation policy bode well for green innovation. Government support for R&D and the research infrastructure is shifting to a more collaborative approach, emphasizing public/private partnerships, multidisciplinary projects, and open innovation.98 State funders in particular are demanding more accountability. To obtain R&D funding, researchers may have to show that they have obtained matching venture capital funds and are on the way to commercialization. Or, government programs may give preference to innovation related to quality of life issues that are of prominent public concern.99
But innovating the green economy also suggests that a slightly different set of policies might be added to the traditional strategies of investment in R&D and talent. With the exception of biofuels and some other alternative energy technologies, much of the idea generation and development has taken place already. For instance, most wind and solar technologies have long been ready for commercialization, although of course there is much room for incremental improvement. As shown in our business survey, businesses are innovating most in response to regulation, local markets, and local networks; proximity to a labor pool and a university matter relatively little for green innovators.
Thus an innovation policy to support the green economy might best focus on four areas -- regulation and standards, business incentives, market building, and networking – while also continuing to invest heavily in the more traditional strategies to support talent and R&D. These policy approaches, particularly market building, are likely not only to foster innovation, but also to create some firm and job growth. In the next section we look at each of these in turn, drawing from our case study examples. Ideally, a green innovation strategy will not be uniform across the country or state. As our cases show, distressed regions suggest a different approach from highly innovative regions. Regional culture also matters; we found that northern California regions in general favored the use of regulation and standards, while southern California regions advocated business incentives. Overview of Policy Preferences by Region Asked (in an open-ended question) about the types of policies that might make their region more competitive, businesses suggested a wide array of strategies (Tables 6.8 and 6.9). Most popular are various forms of incentives, including tax breaks, policies that lower the cost of doing business, and permit streamlining. Green businesses were slightly more likely than traditional businesses to favor financial incentives, with Southern California regions showing the strongest preference for such approaches. Businesses in the four most highly innovative regions voiced the need for government policies to lower the cost of doing business;

140
however, green businesses were much less insistent about business costs than traditional businesses were in their
survey responses. The need for permit streamlining seems particularly prominent in the Inland Empire.
Table 6.9 Regional Competitiveness Improvement for Traditional Businesses by Region
EB LA IE SD SV USJ Lower Cost of Doing Business (esp. labor costs or taxes)
32% 47% 0% 55% 47% 11%
Financial Incentives/Tax breaks/Loans
5% 14% 0% 5% 16% 0%
Improve Quality of Life 9% 11% 0% 10% 16% 0% Improve Public Transportation and Infrastructure
0% 8% 17% 10% 5% 11%
Permit Streamlining/Business- friendly Services
0% 0% 33% 10% 5% 11%
Environmental Market Incentives/ Market Education
0% 0% 0% 0% 0% 0%
Less Regulation 14% 17% 0% 15% 16% 33% Improve Government and Economy
23% 14% 33% 5% 16% 33%
Improve Labor Pool 0% 3% 17% 10% 5% 11% Environmentally Friendly Regulation 0% 0% 17% 5% 0% 0% Do Nothing 9% 6% 0% 5% 16% 0%
Table 6.8 Regional Competitiveness Improvement for Green Businesses by Region
EB LA IE SD SV USJ Lower Cost of Doing Business (esp. labor costs or taxes)
23% 27% 0% 36% 21% 0%
Financial Incentives/Tax breaks/Loans
11% 20% 22% 24% 21% 0%
Improve Quality of Life 16% 3% 22% 4% 18% 17% Improve Public Transportation and Infrastructure
16% 17% 0% 12% 9% 17%
Permit Streamlining/Business- friendly Services
8% 17% 22% 8% 9% 0%
Environmental Market Incentives/ Market Education
3% 3% 11% 16% 21% 17%
Less Regulation 6% 10% 0% 16% 9% 17% Improve Government and Economy
5% 23% 22% 0% 6% 0%
Improve Labor Pool 3% 10% 0% 0% 6% 33% Environmentally Friendly Regulation 8% 0% 11% 4% 3% 17% Do Nothing 16% 7% 0% 4% 3% 0%

141
The next most frequent references were to policies that either improve quality of life or improve public transportation and infrastructure. Quality of life concerns green businesses much more than it does traditional businesses, but appears to be less of an issue in some Southern California regions (Los Angeles and San Diego). The need for physical infrastructure improvements also seems particularly salient among green businesses, particularly in the East Bay, Los Angeles, and Upper San Joaquin Valley.
Only green businesses mentioned building the market as the path to building regional competitiveness. An eclectic group of regions, including San Diego, Upper San Joaquin Valley, and Silicon Valley, suggested market development as a strategy.
Survey respondents from different regions offered conflicting perceptions of regulation. In general, traditional businesses across all regions advocate for less regulation. But green businesses are more mixed. In particular, a greater share of green businesses in the East Bay, the Inland Empire, and the Upper San Joaquin Valley favor more environmental regulation rather than less, while more in San Diego, Los Angeles, and Silicon Valley prefer less rather than more. The survey also tabulated impressions of policy more generally, finding a similar division: East Bay, the Inland Empire, and (to a lesser extent) the Upper San Joaquin Valley were disproportionately likely to
cite the positive impact of policy and regulation, while the other regions emphasized the negative.
Improving the labor pool seems to be less of a concern for green businesses than for traditional ones, and really only an issue in Los Angeles and the Upper San Joaquin Valley.
Finally, a substantial share of businesses, particularly traditional but also green, did not advocate specific policies. Instead, they wish to see general improvements to how government and the overall economy are functioning. This was true particularly of green businesses in Los Angeles and the Inland Empire, but traditional businesses in all regions except San Diego. Many green businesses in the East Bay, as well as traditional businesses in Silicon Valley, suggested doing nothing at all; to these firms, mostly in green building, the regional economy is already more than enough competitive.
Many different levels of government are involved in enacting regulations and policies. The federal, state, and local government all can provide business incentives. Permitting processes exist at the state level (for environmental concerns) and municipal level (for buildings and solar installation). Local infrastructure spending decisions are made at the state, regional, county, and municipal levels. While higher levels of government can help incentivize local household spending primarily through tax policy, local government can

142
promote markets through regulation and technical assistance, in addition to property taxes and impact fees. Federal and state governments shape the availability of funding for higher education and workforce development, while local areas have some say over workforce development programming. R&D investment comes mostly from the federal government, but increasingly from the state as well.
As described in Chapter 5, green firms look less to the federal government and more to state and local government for policies and regulations that support their businesses; of policies mentioned in the survey, just 19% are federal, while 46% are state and 35% are local. But between regions, there is considerable and significant variation. Firms in Los Angeles and the Inland Empire were disproportionately likely to mention the importance of state policies and regulation. Silicon Valley, San Diego, and Inland Empire firms cited the federal government disproportionately. But in the East Bay and the Upper San Joaquin Valley, firms made disproportionate mention of the local government role. Part of this likely reflects the industry structure in each region; for instance, the highly innovative Silicon Valley and San Diego firms are well connected to federal R&D resources, and the manufacturers in the Inland Empire must deal constantly with state and federal environmental regulation. But part may also reflect differences in regional culture: for instance, activist local government is considered the norm in the East Bay, while firms in the San Joaquin Valley
depend disproportionately on local government because of their relative isolation from other levels of government.
In the following sections we examine in more detail regional differences in attitudes towards regulation, incentives, market-building, and other innovation policies. Regulation and Standards Green regulations and standards provide goals to green the way goods and services are produced by spurring renewable energy use, greater energy efficiency, or improved environmental quality. The State of California has encouraged growth within the renewable energy sector through its Renewable Portfolio Standard Program (RPS) which set goals to increase the amount of renewable sources for energy use with investor-owned utilities (IOUs). The RPS program requires electric corporations to increase procurement from eligible renewable energy resources by at least 1% of their retail sales annually, until they reach 20% by 2010. A growing number of cities are adopting green building regulations, from mandating LEED standards in government buildings to setting these standards for all large development, as in San Francisco. Recycling standards to reduce waste from construction and demolition can help spur the local recycling industry. In order to use such regulations to grow local business, however, cities need to pair them with preference purchasing clauses or marketing programs (such as green certification programs) for local businesses.

143
Not all regulations and standards will result in economic growth. Many green standards are simply requiring the substitution of energy-efficient for traditional inputs, and as such are unlikely to result in net increases of jobs or materials. They could even result in job loss, as firms figure out how to produce goods or services more efficiently or hire fewer workers. New regulations will undoubtedly result in job loss in carbon-intensive industries. In order to result in growth or even retention, the regulations have to grow the overall market. For instance, green building retrofits may create a new market, as households undertake rehabilitation projects they would otherwise not have. But green cleaning products may not, as consumers substitute eco-sensitive for traditional cleansers.
Federal and state environmental policies and regulations are without a doubt a significant driving force in motivating local jurisdictions, businesses and individuals to try to reduce greenhouse gas emissions. In 2001, the Sate of California created the Climate Action Registry (CAR) to track greenhouse gas emissions (GHG), limit vehicle emissions, and boost the amount of clean energy procurement by the state. Two of the most effective laws in regulating carbon emissions are Assembly Bill 32 (AB 32) and Senate Bill 375 (SB 375). AB 32 established the benchmark goal of reducing the state’s carbon emissions to below 1990 levels by 2020 and SB 375 provides a guide for developing local and regional transportation emissions standards via regional coordination of land use planning, requiring metropolitan
transportation planning agencies to develop target goals for 2020 and 2035.
As described in Chapter 5, green companies perceive federal and state policies as having a much more positive impact in their business than traditional companies do, and interviews across our six study regions also confirmed many of our survey findings. For example, in our Los Angeles study region, the leader of a nonprofit intermediary argued that state policies such as AB 32 will not only help to create new markets and attract businesses through incentives but has the potential to be “a driver of innovation in California…The clean air policies at every level are mandated for either car emissions or cities to achieve, and that is a very important framework that will drive innovation.”
In addition to innovation, many actors from our study regions feel that policies and regulations could also increase competition and investment resulting in more innovative practices within the green economy. For example in San Diego, some green non-profits argue that more regulations are needed to make green businesses more competitive against companies that sell more traditional technologies and processes. As one representative of a nonprofit organization commented:
That’s where I think the US is in general: You have innovators and early adopters. But if you want to get to the mass market and you can’t get the masses to understand that you have a value case you are

144
going to have a hard time. You need a playing field that makes those products look good. It’s all about the value… maybe about making carbon more expensive, natural gas more expensive. Policy plays a huge role on it.
This sentiment was also shared by institutions and actors involved in cleantech innovation. One San Diego economic development official emphasized that a more strict regulatory system may help with competition and investment:
The models for biotech are not functional anymore. Biotech, high-tech, Internet, they were funded with billions of dollars because the excitement was high and over time most [companies] failed. Now venture capital is more cautious. We need to create a more sustainable model of how we do benching, especially in the early stage. We are a country of ideas not labor and that’s our own competitive advantage and we need to take advantage of this.
In some of our study regions such as the Upper San Joaquin Valley, state and regional regulations are driving firms to operate in a way that meets both their financial bottom line as well as mandated regulatory standards. Regulatory standards have encouraged green practices not by choice but rather through mandates. According to a representative of an environmental agency, one of the driving forces behind innovation is cost-driven. She argued that innovation is in response to
regulation, it “is being driven by economics…..How can I meet this rule and not have it be something that is $1 million cost in one year, but three instead? Where can I build in flexibility in my production processes?”.
In order to integrate regulation and regulators into the innovation system, businesses, venture capitalists, and trade organizations have had to rethink the traditional model of fast-paced innovation among horizontally networked firms. The realignment of roles has meant essentially inviting the regulators to the table. As one director of an economic development consulting firm stated:
If you’re going to be successful in the green industry you need to understand the regulations and policies that are affecting the industry from a public policy standpoint, you know, utilities, regulations, etc. So this is a tricky industry, it’s not that you can just jump on… it’s not like starting a dot.com or something, it needs an understanding of a more complicated regulatory environment.
Based on our interviews and surveys with study region actors across the six regions, it is clear that they are looking for government policies and regulations to help increase technological innovation and commercialization. Many feel that the right policies and regulations can make the market for green products and services competitive with more traditional sectors. The general belief is that this will enable innovation within the demand and consumer side of the green economy.

145
One of the best examples of this is the response to AB32, the bill to reduce greenhouse gas emissions. AB32 During interviews, a number of regional actors throughout our study regions commented on how AB 32 and SB 375 may influence their policy and business strategies. For example in the Silicon Valley, an executive of a trade association made the following comments regarding AB 32 and SB 375:
AB 32 is an incredible vision and it sets ambitious goals. When we get into the cap and trade program it’s going to have teeth. So we are really going to have to achieve these goals or it’s going to be very expensive for the polluters. . . . . 375 is kind of the long range investment strategy because it is all about land use and transportation . . . . both of them indirectly create markets for these products and the cities are saying alright we’ve got to get our greenhouse gas covered, businesses that are covered are saying we’ve got to get our emissions down. So they’re looking for solutions, consultants, they are spending money trying to figure out how to do it. It’s good business.
However, not everyone shared the same optimism about the prospects of AB 32 and SB 375 being positive for business growth. In Los Angeles, a representative of a leading business group stated:
AB32 is probably the biggest challenge. I mean, manufacturing in LA is just so difficult, there are so many employer restrictions, there are so many environmental restrictions, and a lot of it for good reason, but it makes it hard to compete with places like Texas or even South America or China, which don’t have any of these restrictions. Plus land here is very expensive and we are very congested; and so all of that is sort of the dark side of the opportunities here.”
An in-depth look at the regions helps show the different role AB32 plays in each case. In the East Bay, where university, government and business are highly balkanized, stakeholders have a hard time expressing what its effect is. One city official described her city’s efforts as diffuse and uncoordinated, with four staff each working on different aspects of the issue (from business development to solar permitting to energy standards). To a business association leader, it is still about talk:
When talking to the business community, everybody is going in this direction anyways. They recognize that it has to part of their business model so it’s all about the pace at which these regulatory changes come about. If you make them too fast, then the cost is higher. If you make them too slow, people worry they are not competitive. So it’s all about making sure there is a good,

146
healthy dialogue between the regulators and the companies.
In Silicon Valley, these policies are game-changers, altering how the innovation process works from funding to commercialization. From a venture capitalist:
Now what they sometimes underestimate is the difficulty of change in the energy business. It’s not just another IT play. You have to build power plants, you have to build new refineries, you have to build transmission lines, you have to deal with 100 year old incumbents and regulated utilities and providers that just do not change quickly. They resist change, that’s been their model of survival—to work with the regulatory community and resist competition, secure their customer base and make a regulated rate of return. None of those things tend to inspire an entrepreneurial attitude. So there’s a waking up to the bureaucratic challenge of change in the energy world that a lot of VCs and a lot of entrepreneurs coming out of other areas of technology didn’t fully internalize when they started in this five years ago.
Despite the challenges presented by AB32, it is in ways leveling the playing field across the state, since it forces all regions to organize a response to climate change. The bill is not necessarily creating economic development (yet) in struggling economies like the Inland Empire. As
the visionary but cautious Riverside Mayor Loveridge confessed:
But I’m not clear how SB375 or AB32 even in the immediate sense is going to translate into green jobs. When I first got on the resources board, they were talking about the hydrogen highway. A little further down in the call, it said they hoped by 2020 there would be 20,000 hydrogen vehicles on the road. That is good, but there are 40 million cars. It’s not that much.
But AB32 has at least gotten the conversation started, as one San Bernardino County official indicated:
AB32 is kind of what got the ball rolling here in San Bernardino County. We were the first county to get sued because of AB32. Jerry Brown claimed that the county hadn’t taken AB32 into account when we redid our general plan. We were picked on because we were the first in line and we’re the “biggest” county (size-wise, not population-wise, because of the desert and unincorporated areas). We talked to Brown about the things that we are doing- investing in hybrid vehicles, replacing diesel with natural gas vehicles, we’re committed to following LEED Silver standards for all new buildings and major renovations, we have solid waste and recycling programs. We were able to settle the lawsuit. We’re also looking to have a landscape ordinance, we’re working on requiring wind

147
energy, having water efficient landscapes, etc. But ultimately it comes back down to the fact that the county doesn’t have a whole lot of jurisdiction.
Incentives Business incentives to spur the green economy may include tax credits, fee exemptions, low-cost loans, permit streamlining, and in-kind contributions (e.g., of land or infrastructure). For example, the City of San Francisco Clean Energy Business Exclusion is a payroll tax exemption for businesses with over ten employees. California (like many other states) offers tax credits and loans for the purchase of capital equipment, which can in turn help further innovation.
Many of our study regions have implemented Recycling Market Development Zones (RMDZ), a state program that combines recycling with economic development to not only reduce the amount of waste produced but also to encourage new businesses, expand existing ones and create more jobs within California. In these designated zones, the state provides low-interest loans for land and equipment purchases as well as leasehold improvements and working capital. The East Bay region is home to three RMDZs and Riverside County promotes RMDZ on their website.
As a number of interviewees across regions suggested, targeted incentives can help to address common economic-development pitfalls. Matters of zoning,
water supply, parking, and other realities of business life are no less pertinent simply because the sectors involved may be considered novel or cutting-edge. Ironically, emerging industrial sectors often use more energy in their initial growth phases than they do once matured, and this may hold as much for firms in the green economy as it does in others. A quote from a city official in the East Bay is illustrative:
[I]t’s not that easy to locate these firms because of their huge power needs and huge water consumption. [A]nd it will be harder to locate these firms in the future as water supplies are diminished, so I keep worrying about water districts. The county has, I think, seven different water providers. Any big industry typically has water needs … so I’m worried about the availability of resources, even if you’re trying to attract firms that in the long run use less resources—to create the products can use a lot of resources.
Market-Building Approaches Green standards and regulations for energy use, green building incentives, and environmentally preferable purchasing may or may not help develop local businesses, depending on how mandates are framed (e.g., whether local purchasing standards accompany them). However, they still play an important role by raising awareness of the environment and thus indirectly helping to build the market for green goods and services. For instance, in response to the survey, a green

148
construction firm in the East Bay commented on the increased demand associated with AB 32 by writing, “people have become more interested in installing solar panels not only for the savings but also for environmental reasons.” Likewise, a San Diego environmental consulting company that design and build cogeneration for biogas and natural gas applications sees increased demand for their products as a result of AB32, “new interest from large producers of biogas to capture this gas and convert to cogen[eration].”
Cities in the case regions have found innovative ways to build a market. One example is Berkeley First Sustainable Energy Financing District, which reimburses homeowners for solar installation costs, to be paid back at a fixed rate via property taxes. Many cities, as well as the federal government, are modeling their own Property Assessed Clean Energy financing system after this program. State and federal solar tax rebate programs complement this strategy. Green building ordinances are another way in which local jurisdictions are promoting energy efficiency in local markets. Across most of our study regions, cities have enacted green building ordinances which encourage energy efficient construction and design. In some cities such as Berkeley, builders must consult the Berkeley Green Building Coordinator before proceeding with their plans; in the City of Richmond, all city-funded projects must achieve minimum green building standards. Los Angeles has established the Private Sector Green Building Ordinance. This
ordinance acts as a regulatory role for the private sector but also is focused on encouraging growth in the green construction/building sectors by creating incentives for buildings to focus on green building construction. Los Angeles officials are hoping that the Private Sector Green Building Ordinance will not only improve energy efficiency but will also benefit construction companies and their suppliers.
Local programs can help show businesses the way to build a new market niche. For instance, the East Bay, particularly Oakland, offers free assistance in green building techniques. Recycling standards in Oakland have helped to build a new market as well, as a local leader argued:
…our Waste Management Group in the Public Work department…were one of the first public agencies to have a zero waste goal… this has led to a nice relationship with our recycling community. And Oakland has a large recycling community because of the Port. Scrap goes onto barges, make into things they sell back to us. My basic understanding is that there is an example of the virtuous cycle between some of these regulatory initiatives and the recycling industry.
Another strategy local government entities are using is leveraging their purchasing power to create and expand new markets. For example, under Los

149
Angeles’ Green LA Plan, the Department of Water and Power (LADWP) developed a Solar Energy Plan which is aimed at acquiring 1,280 megawatts (MW) of solar power by 2020. LADWP’s Solar Energy Plan includes a feed-in tariff that establishes contracts between private solar sellers and the LADWP, allowing the Department to purchase solar energy produced by private entities. Moreover, in an effort to reduce air pollutant emissions from facility vehicles, the Port of Los Angeles has created its Gateway Cities Fleet Modernization Program. This program has allocated over $17 million for the replacement of 530 diesel trucks with new cleaner-fueled ones. A representative of the LA Mayor’s Office regarded the city’s green policies in this way:
We’re a big city, and if any big city does things in scale, it changes the way a market functions. That applies very well to encouraging the green economy because it’s all about scale.(…) [With city product purchasing], you can make people produce it. Remember that they’re going to respond to only what the market is going to support, so if you actually become a market, they can respond. And [the City of LA] is doing that.
In the Silicon Valley many actors felt policies and regulations are already encouraging new funding mechanisms and expanding markets. As a director of a consulting firm stated:
The policy side is really an important driver. It’s the interaction between policies, standards, and incentives that we think began to have a broad impact on the private sector. One of the reasons we are seeing such an increase in venture capital funding today is, I believe, that companies here in Silicon Valley and across California believe that there’s a possibility of markets developing in terms of investment and business. … it is policy, influencing private behavior … it’s a combination of all three (policy, businesses, and consumers).
Another interviewee, from an independent research center, commented that the federal stimulus package has helped create new funding and investment which is ultimately helping markets expand,
The investment tax credit for solar, that was part of the stimulus package signed last year, extended this tax credit for eight years. And then the recent stimulus, I think allow you to take a cash [rebate]. That was tax credit, and then now, they allow you to take, I think a grant for 30% of the installation which I think is a huge thing. Tax credits is great but you have to wait to get it, you need to make the investment, you need to borrow money, you can’t borrow money these days, so it was great, a carrot hanging out there over a chasm that you couldn’t get across. Now,

150
if you can get a 30% grant, you can get across the chasm a little easier. That is primarily for solar. There is another one for wind that I am not too well versed on.
But growing market demand is challenging in some regions. An economic development official in eastern Riverside County sees variation:
Our county is large and so regional that if you look within the City of Riverside for example, they have their own public utilities, they have the CURE program and they offer free reusable shopping bags, free trees, and curb-side recycling. Their in-house utility gives them an opportunity to localize it and I really do think that in the city there is a lot of consumer interest. But then when you get closer out to Arizona, eastern part of county, I do not know what type of consumer you have out there.
Inland Empire officials are more skeptical about the potential of the green economy in part because of the dire condition of the local economy: “Because green implies more cost. So I think the demand for all this stuff is tempered right now, because of what is going on in the economy.” But they also are less certain that the green market is emerging:
I think there is the first wave. I’m waiting for it to fall away for the real green market to emerge. There is a lot of green smoke, people who
want to say they are green. We just hired a green cleaning company. People are saying “we’re green” and slapping green labels on their products, so that’s kind of irritating, so I’m waiting for that to fall away, and the green market to emerge.
Climate Action Plans and Initiatives Across California, city governments from the East Bay to San Diego are implementing climate action plans. Although these are non-binding, they guide policy from municipal energy use to transportation planning to building codes, and as such may spur innovation and/or job creation. In the East Bay, cities such as Berkeley and Oakland have developed climate plans which advocate for specific actions to be taken by government entities, businesses and residents in order to reduce their carbon emissions in a number of sectors such as transportation and land use, building and construction, and waste reduction and recycling. City governments in the East Bay have created the Cool Counties Initiative which consists of 14 Alameda County cities aimed at reducing greenhouse gas emissions 80 percent by 2050.
In Los Angeles, the Mayor’s Green LA: Climate Change Plan for Los Angeles sets goals of reducing carbon emissions to 20% below 1990 levels by 2010 and 35% below 1990 levels by 2030. In addition to the Green LA climate action plan, the ports of Los Angeles and Long Beach have adopted the Clean Air Action Plan (CAAP), a five-year program with the goal reducing criteria pollutant air

151
emissions from port activity through innovative methods such as effective implementation strategies, new technology investment/development, and monitoring and tracking program.
In the Inland Empire, the mayor of the City of Riverside enacted a Clean and Green Task Force that detailed regulatory and incentive programs, infrastructural assets, renewable energy objectives, green building practices and green government and business models. So far the City of Riverside has been successful in meeting their goals: by 2013 the municipal utility will be at 50% renewable energy and the City plans to plant 100,000 new trees over the next decade through a public coupon program. The city’s green initiatives are boosted by Riverside’s February 2009 designation as an Emerald City, part of the California Department of Conservation’s Emerald City Pilot Project. Emerald City status will give Riverside access to state funding and expertise in the realization of the city’s Green Action Plan.
Talent There is still considerable uncertainty about what the labor demand of the green economy will be. Firms producing products in a relatively early stage of the product cycle dependent upon a highly skilled workforce, with, at a minimum, a four-year degree in a scientific or engineering discipline, and preferably, a Ph.D. But businesses growing quickly as they bring new technologies to market may require a less skilled workforce. Once there is significant labor demand and
standardization of skills, firms will typically shift from providing on-the-job training to utilizing local job training and community college programs.
In anticipation of this sort of demand, a number of cities and counties across the state have started workforce development programs, typically focused on green building construction programs: for instance Richmond Build trains local youth in solar panel installation and experiences 90 percent placement rates due to close relationships with both unions and industry. The Oakland Green Academy articulates a career ladder from short-term training programs through community college, four-year college, and advanced degrees.
The businesses that responded to our survey suggest that employer demand for workforce development has not yet materialized. There is indeed growing demand for workers without a college degree: in response to a question about the need for specialized training, just 38% of firms said they needed specially trained workers with a college degree or higher. Most specialized training consists of short-term training programs leading to a certification, for instance in LEED techniques or asbestos removal. Over twenty percent of firms work with a local organization to provide such training, and use of external organizations is particularly common in the three northern California regions (perhaps reflecting greater capacity). But apart from these certificate programs, training for low-skilled work, particularly solar panel installation and green building, takes place

152
in-house rather than via external training providers. This will likely change as the green economy matures. System Managers (Cluster InitiativesAs described above, each of the case study regions has begun some type of green or cleantech cluster initiative. Each of these builds upon the existing concentrations of green economy firms, as well as existing relationships among firms, venture capitalists, universities, labs, and thinktanks. And in each case, a system manager – or cluster champion – will be needed to help shepherd the initiative.
)
In the case of Silicon Valley and San Diego, the players have changed little from the IT and biotech clusters of decades past, and they are essentially relearning innovation in the much more complex regulatory environment surrounding cleantech. The remaining regions face quite unique challenges. Los Angeles has perhaps the most daunting organizational task, due to its sheer scale. The East Bay has the challenge of building relationships between powerful players – the University of California and the national labs versus the local cities and community colleges – that historically have not collaborated well, if at all. The green economy in the Upper San Joaquin Valley is less about product innovation than process innovation in response to regulation, so the cluster initiative will be trying to help local manufacturers cope with new requirements. The Inland Empire must cope with very uneven capacity across a
large region, with the green economy highly concentrated in Riverside.
It is not clear what impact these initiatives will have; as with most cluster strategies, they are more about starting and maintaining a conversation than creating economic development. Still, given the importance of regional embeddedness to cleantech innovation – and, most likely, to firm creation and job growth as well – cluster strategies may prove particularly important in this context.

153
Chapter 7. Conclusion
Our research findings demonstrate that innovation in the green economy presents a complex story within California. As discussed in the previous chapter, cleantech innovation and the green economy have traveled distinct and varied paths among our case study regions. Silicon Valley and San Diego are the leaders in cleantech innovation. Due to its local expertise, financial capital, labor pool and institutions, as well as excess capacity in manufacturing, Silicon Valley is leading green innovation in California. San Diego dominates in the area of product innovation while maintaining healthy diversity across green sectors including services and manufacturing. Los Angeles and the East Bay are the leaders in California’s green economy due to their extensive assets and industry structure. Although not yet leaders in cleantech innovation or the green economy, other regions such as the Inland Empire and the Upper San Joaquin Valley are already benefitting from the State’s movement towards an innovative and green economy.
Green Economy The green economy, defined as economic activity that reduces energy consumption or improves environmental quality, is growing faster than the overall economy. From 1990 to 2008, green economic activity within California was growing relatively rapidly (33% employment growth) compared to the overall economy (22% employment growth). In addition, the
green economy also tends to employ more workers per establishment (13.4) as compared to employment in California overall (7.6).
The green economy and cleantech innovation combined, however, only constitute about one percent of the California economy. In 2008, for example, there were 12,253 green establishments across the State of California, which collectively employed nearly 164,000 workers across six green economic sectors; there are 18 million employed workers statewide. In California, environmental services accounted for 38% of the green economy, followed by recycling (26%), green transportation (13%), green building (9%), green manufacturing (8%) and energy research and services (6%).
Innovation Cleantech innovation is highly concentrated in just a handful of California regions—in order, Los Angeles, Silicon Valley, the East Bay, San Diego, Orange County, and the San Francisco metropolitan area--and has not yet led to higher rates of job growth, at least in those regions. Since 2000, there were just 1,096 patents classified as “cleantech” based on our analysis, suggesting that much of the current green economy activity is based upon innovation from previous decades. Los Angeles was awarded the highest share of cleantech patents overall, having received 641 or nearly 60% of all cleantech patents between 2000-2008. Los Angeles led in solar (250 patents),

154
fuel cells and vehicles (225 patents), and green building products/lighting (166 patents). The East Bay was second, receiving 330 patents overall between years 2000-2008. The East Bay was also the leading region in alternative fuels (168 patents) and tied with Silicon Valley for the lead in recycling (156 patents) and pollution control (6 patents). Notably, Silicon Valley was in just third place, receiving 287 patents overall between the years 2000-2008. Silicon Valley led or tied for the lead in the following categories: recycling (156 patents), other renewable energy (75 patents), energy management (50 patents), and pollution control (6 patents).
As explained in Chapter 4, venture capital flows capture the degree to which investors are taking risks to back new ideas, concepts or business plans. Between 2000 and 2008, a total of $159.9 billion of venture capital was invested in California firms across all sectors of the economy. During this period clean technologies received only $1.6 billion (1.1% of total) of total venture investments. Of the total amount of venture capital investments, Silicon Valley garners a disproportionate share of venture capital ($827 million). Los Angeles and the East Bay, however, are also very innovative. In particular, Los Angeles dominates in idea generation (number of patents), and the East Bay hosts a disproportionate share of the state’s green gazelles at 11.4%.
Our study findings also suggest that traditional and Toxic Release Inventory
(TRI) firms are rapidly greening themselves. For instance our surveys of both traditional and TRI firms found that over the last three years 37% of traditional businesses and 43% of TRI businesses have introduced a new green product or service. Moreover, more TRI businesses (89%) have changed the way they operate to reduce their environmental impact or meet environmental regulations than green (68%) and traditional companies (65%). Thus in some ways, the green economy spans both green and traditional sectors.
Another important finding of our study is that serving local and regional markets, interacting with local nonprofits, and/or partnering with firms outside of the U.S. are associated with green product innovation. In particular, embeddedness in local markets is likely to lead firms to become more innovative.
Policy and Its Impact on Innovation Within the Green Economy Policy can be a key driver in inducing firms to innovate by changing their production processes. One such “policy shock” is California’s Assembly Bill 32. In our survey of businesses, 25% of TRI businesses, 20% of green businesses and 19% of traditional businesses responded that AB32 is very much impacting their operations. An open-ended survey question indicates that while the effect of AB32 for green firms is mostly related to increased demand (43%), for traditional and TRI firms, AB32’s impact has mostly materialized in new guidelines and requirements. Along the

155
same lines, green firms view federal and state policies and regulations much more favorably (34%) than traditional businesses (20%).
While green businesses certainly are more willing and interested in innovating the green economy than their traditional and TRI counterparts, they are more likely to innovate by introducing new green products or services than by changing their processes to reduce environmental impact. In fact, a considerably higher percentage of TRI companies have changed the way they operate to reduce environmental impact or meet environmental regulations compared to green and traditional companies. Furthermore, the survey confirmed the paradox that green businesses do not necessarily incorporate more green practices than non-green businesses. Cost, lack of demand from customers, and lack of information were, in that order, the main barriers cited to incorporating green practices.
Regions matter, but which region a firm is in does not seem to matter as much as traditionally thought (at least according to our product innovation regression). In other words, green innovation is more about being embedded in the local market and responding to local regulation than about relationships with a traditional university-centered regional innovation system. For example, innovative green firms tend to interact more frequently with similar businesses in the region, local non-profits, local trade associations and local
governments than non-innovative green firms. Non-innovative green firms on the other hand interact more with similar businesses outside the region. Yet, local networks are much stronger in San Diego, Silicon Valley, Inland Empire, and even Upper San Joaquin Valley than in the East Bay and Los Angeles, suggesting that local cluster initiatives in the latter two regions have much work ahead.
Along with the finding that green firms are relatively “captive” in California, the importance and strength of local networks in most regions suggests that California will continue to lead the country in the green economy for years to come. As the state continues to draft and enforce pioneering environmental regulations, some traditional firms will leave due to the high costs of compliance. But others will stay, gaining a competitive advantage as other states follow California’s lead.
Within California, the most distressed metropolitan regions, such as the Inland Empire, may be able to boost their own green economies through carefully crafted regulations that incentivize the growth of local green markets. This, in turn, can build the capacity of local firms to compete in global markets. But if the green economy is to be the panacea promised by many, it will require the focused and coordinated action of governments, firms, and communities.
156
References Acs, Z. J. & Audretsch, D. B. (1987).
Innovation, market structure, and firm size. The Review of Economics and Statistics, 69(4), 567-574.
Advisory Committee on Measuring Innovation in the 21st Century Economy. (2008). Innovation Measurement: Tracking the State of Innovation in the American Economy. A report to the Secretary of Commerce. Washington, DC: U.S. Department of Commerce.
Aizcorbe, A. M., Moylan, C.E. & Robbins, C.A. (2009). BEA Briefing: Toward Better Measurement of Innovation and Intangibles. Washington, DC: Bureau of Economic Analysis.
Alamillo, J.M. (2006). Making Lemonade Out of Lemons: Mexican American Labor and Leisure in a California Town, 1880-1960. Urbana, Chicago: University of Illinois Press.
Alliance for Science & Technology Research in America (ASTRA). (2007). Defining "Innovation": A New Framework to Aid Policymakers. Innovation Vital Signs Project. Prepared for Technology Administration, U.S. Department of Commerce. Washington, DC: U.S. Department of Commerce.
———. (2007). Innovation Vital Signs, Framework Report. Innovation Vital Signs Project. Prepared for Technology Administration, U.S. Department of Commerce. Washington, DC: U.S. Department of Commerce.
Asheim, B. T. & Isaksen, A. (2002). Regional innovation systems: The integration of local ‘sticky’ and global ‘ubiquitous’ knowledge. The Journal of Technology Transfer 27(1).
Asheim, B. T. & Gertler, M.S. (2005). The geography of innovation: Regional innovation systems. In The Oxford Handbook of Innovation, edited by J. Fagerberg, D. C. Mowery and R. R. Nelson. New York: Oxford University Press.
Baumol, W.J. (2002). The Free-Market Innovation Machine: Analyzing the Growth. Miracle of Capitalism. Princeton, Princeton University Press.
Bishop, Shaun. (2009). Bay Area's 'Big Three' mayors sign climate change pact. San Jose Mercury News, March 06.
Brouwer, E., Kleinknecht, A., et al. (1993). Employment growth and innovation at the firm level: An empirical study. Journal of Evolutionary Economics, 3(2), 1386-1432.
Brusco, S. (1982) The Emilian model: productive decentralisation and social integration, Cambridge Journal of Economics, 6(2), 167-184.
Bunnell, T. G. & Coe, N. M. (2001). Spaces and scales of innovation. Progress in Human Geography, 25(4), 569-589.
Chapple, K. (2008). Defining the Green Economy: A Primer on Green Economic Development. Berkeley, CA: Center for Community Innovation.
Chapple, K., Hinkley, S. & Makarewicz, C. (2008). Business as Usual in California Suburbs? Exploring the Dynamics of Firm Relocation, 1990-2005. Unpublished paper.
Christopherson, S. & Clar, J. (2007). Power in firm networks: what it means for regional innovation systems. Regional Studies 41(9), 1223.
157
Cohen, M. (2008). East Bay Green Corridor Partnership: Leveraging UCB & LBL Green Start-ups. Presentation at the Center for Community Innovation Speaker Series, October 2008. Accessed at http://communityinnovation.berkeley.edu/events.html.
Collaborative Economics. (2008). Clean Technology and the Green Economy: Growing Products, Services, Businesses and Jobs in California’s Value Network. Prepared for the California Economic Strategy Panel. Sacramento, CA: California Economic Strategy Panel.
-- -- --. 2009. 2009 California Green Innovation Index. Prepared for Next10. Palo Alto, CA: Next10.
Cooke, P. (1998). Introduction: origins of the concept. In Regional Innovation Systems, edited by H. J. Braczyk, P. Cooke and M. Heidenreich. London, UCL Press.
Cooke, P., Gomez Uranga, M. & Extebarria, G. (1997). Regional innovation systems: Institutional and organisational dimensions. Research Policy 26, 475-491.
Cooke, P., Heidentreich, M. & Braczyk, H-J., eds. (2004). Regional Innovation Systems: The Role of Governance in a Globalized World. 2nd ed. London and New York: Routledge.
Council on Competitiveness. (2005a). Innovate America: National Innovation Initiative Summit and Report. Washington, DC: Council on Competitiveness.
———. (2005b). Measuring Regional Innovation: A Guidebook for Conducting Regional Innovation Assessments. Report produced for the U.S. Economic Development
Administration. Washington, DC: Council on Competitiveness.
Doloreux, D. & Parto, S. (2005). Regional innovation systems: Current discourse and unresolved issues. Technology in Society, 27 (2), 133-153.
Dosi, G. (1988). The nature of the innovative process. In Technical Change and Economic Theory, edited by G. Dosi, C. Freeman, R. Nelson, G. Silverberg and L. Soete. London and New York: Pinter Publishers.
———. (1988). Sources, Procedures, and Microeconomic Effects of Innovation. Journal of Economic Literature, 26 (3), 1120-1171.
Edquist, C. (2005). Systems of innovation: Perspectives and challenges. In The Oxford Handbook of Innovation, edited by J. Fagerberg, D. C. Mowery and R. R. Nelson. New York: Oxford University Press.
Fagerberg, J. (2005). Innovation, a guide to the literature. In The Oxford Handbook of Innovation, edited by J. Fagerberg, D. C. Mowery and R. R. Nelson. New York: Oxford University Press.
Fagerberg, J., Mowery, D.C., & Nelson, R.R., eds. (2005). The Oxford Handbook of Innovation. New York: Oxford University Press.
Feser, E., Renski, H. & Goldstein, H. (2008). 2008. Clusters and economic development outcomes: An assessment of the link between clustering and economic growth in Appalachia. Economic Development Quarterly, 22 (4), 324-344.
Freeman, C. (1974). The Economics of Industrial Innovation. Harmondsworth ; Baltimore: Penguin.

158
Freeman, C. & Soete, L. (1997). The Economics of Industrial Innovation. 3rd ed. Cambridge, Mass.: MIT Press.
Fulton, W. & Shigley, P. (2001). Little chips, big dreams. Governing (May).
Gertler, M.S. (2003). Tacit knowledge and the economic geography of context, or the undefinable tacitness of being (there). Journal of Economic Geography, 3, 75-99.
Gordon, K. & Hays, J. (2008). Green-Collar Jobs in America’s Cities: Building Pathways Out of Poverty and Careers in the Clean Energy Economy. Washington, D.C.: The Apollo Alliance.
Gottlieb, P. D. 1995. “Residential Amenities, Firm Location and Economic Development. Urban Studies, 32 (9), 1413-1436.
Haug, P. (1991). The location decisions and operations of high technology organizations in Washington State. Regional Studies, 25 (6), 525-541.
Hirsch-Kreinsen, H., Jacobsen, D., Leastadius, S., & Smith, K. (2003). Low tech industries and the knowledge economy: State of the art and research challenges. In Working Paper 2003:10. Stockholm: Dept. of Industrial Economics and Management, Royal Institute of Technology.
Iammarino, S. (2005). An evolutionary integrated view of regional systems of innovation: Concepts, measures and historical perspectives. European Planning Studies, 13 (4), 497-519.
Kamien, M. I. & Schwartz, N. L. (1975). Market structure and innovation: A survey. Journal of Economic Literature, 13(1), 1-37.
Kenney, M. (2000). Understanding Silicon Valley: The Anatomy of an Entrepreneurial Region. Stanford, California: Stanford University Press.
Kleinknecht, A, and Mohnen, P., eds. (2002). Innovation and Firm Performance. Econometric Explorations of Survey Data. Hampshire and New York: Palgrave.
Kline, S.J. & Rosenberg, N. (1986). An overview of innovation. In The Positive Sum Game, edited by R. Landau and N. Rosenberg. Washington, D.C.: National Academy Press.
Kolko, J. & Neumark, D. (2008). Changes in the location of employment and ownership: Evidence from California. Journal of Regional Science, 48 (4), 717 - 744.
Lundvall, B-A., ed. (1992). National Systems of Innovation: Towards a Theory of Innovation and Interactive Learning. London: Pinter Publishers.
Lundvall, B-A. (1988). Innovation as an interactive process: from user-producer interaction to the National Innovation Systems. In Technology and Economic Theory, edited by G. Dosi, C. Freeman, R. Nelson, G. Silverberg and L. Soete. London: Pinter Publishers.
Maillat, D. (1991). The innovation process and the role of the milieu. In Bergman, E., Maier, G. and Tvdtling, F., editors, Regions Reconsidered: Economic Networks, Innovation and Local Development in Industrialised Countries. London: Cassel.
Malerba, F. (2002). Sectoral systems of innovation and production. Research policy, 31 (2), 247.

159
———. (2004). Sectoral Systems of Innovation: Concepts, Issues and Analyses of Six Major Sectors in Europe. New York: Cambridge University Press.
———. (2005). Sectoral Systems of Innovation. In The Oxford Handbook of Innovation, edited by J. Fagerberg, D. C. Mowery and R. R. Nelson. New York: Oxford University Press.
Malerba, F. & Orsenigo, L. (1997). Technological regimes and sectoral patterns of innovative activities. Industrial and Corporate Change, 6 (1), 83-118.
Mansfield, E. (1972). Contribution of research and development to economic growth of the United States. Papers and Proceedings of a Colloquim on Research and Development and Economic Growth Productivity. Washington, DC., National Science Foundation.
Martin, S. & Scott, J.T. (2000). The nature of innovation market failure and the design of public support for private innovation. Research Policy, 29 (4-5), 437-447.
Nadiri, I. (1993). Innovations and technological spillovers. National Bureau of Economic Research Working Paper 423.
National Governors Association and Pew Center on the States. (2007). Innovation America: Investing in Innovation. Washington D.C.: NGA Center for Best Practices,.
Nelson, R.R., ed. (1993). National Innovation Systems: A Comparative Analysis. New York: Oxford University Press.
Nelson, R.R. & Rosenberg, N. (1993). Technical innovation and national systems. In National innovation systems: a comparative analysis,
edited by R. R. Nelson. New York: Oxford University Press.
OECD and Eurostat. (2005). Oslo Manual: Guidelines for Collecting and Interpreting Innovation Data. 3rd ed. Paris.
Pavitt, K. (1984). Sectoral patterns of technical change: towards a taxonomy and a theory. Research Policy, 13, 343-373.
———. (2002). Knowledge about knowledge since Nelson and Winter: a mixed record. Electronic Working Paper Series, Paper No. 83. In Electronic Working Papers Series: SPRU, University of Sussex.
———. (2005). Innovation Processes. In The Oxford Handbook of Innovation, edited by J. Fagerberg, D. C. Mowery and R. R. Nelson. Oxford: Oxford University Press.
Pew Charitable Trust. (2009_. The Clean Energy Economy: Repowering Jobs, Businesses and Investments across America. Washington, DC: Pew Charitable Trust.
Piore, M.J. & Sabel, C.F. (1984). The Second Industrial Divide: Possibilities for Prosperity. New York: Basic Books.
Polanyi, M. (1958). Personal Knowledge: Towards a Post-Critical Philosophy. Chicago: University of Chicago Press.
Porter, M.E. (1990). The Competitive Advantage of Nations. New York: The Free Press.
Porter, M.E. (1998). On Competition. Boston: Harvard University Press.
Porter, M.E. (2000). Location, competition and economic development: Local clusters in a global economy. Economic Development Quarterly, 14(1), 15-34.
Porter, M.E. (2001). Regions and the new economics of competition. In Global City-Regions:Trends, Theory,
160
Policy, ed. Allen Scott, 139-157. New York: Oxford University Press.
Romer, P. M. (1986). Increasing Returns and Long Run Growth. Journal of Political Economy, 94, 1002–1037.
Sackman, D.C. (2005). Orange Empire: California and the Fruits of Eden. Berkeley: University of California Press.
Saxenian, A. (1994). Regional Advantage: Culture and Competition in Silicon Valley and Route 128. Cambridge, MA: Harvard University Press.
Saxenian, A. & Chinoy Dabby, N. (2004). Creating and Sustaining Regional Collaboration in Silicon Valley? The Case of Joint Venture: Silicon Valley. IURD WP-2004-05. Berkeley, CA: UC-Berkeley.
Schumpeter, J.A. (1934). The Theory of Economic Development: An Inquiry into Profits, Capital, Credit, Interest, and the Business Cycle. Cambridge, Mass.: Harvard University Press. Original edition, 1911 in German.
———. (1939). Business Cycles: A Theoretical, Historical and Statistical Analysis of the Capitalist Process. New York: McGraw-Hill Book Company, Inc.
Scott, A.J. & Storper, M. (2003). Regions, globalization and development. Regional Studies, 37 (6&7), 579–593.
Silicon Valley Leadership Group. (2009). 2009 Silicon Valley Projections: Clean and Green. San Jose, CA: Silicon Valley Leadership Group.
Simmie, J. & Sennett, J. (1999). Innovative clusters: Global or local linkages? National Institute Economic Review, 170 (1), 87-98.
Smith, K. (2005). Measuring Innovation. In The Oxford Handbook of Innovation, edited by J. Fagerberg,
D. C. Mowery and R. R. Nelson. New York: Oxford University Press.
Solow, R. M. (1956). A contribution to the theory of economic growth. Quarterly Journal of Economics, 70, 65–94.
Spradley, C. (1996). Stockton, City of the Future. Montgomery, AL: Community Communications.
Stam, E. (2007). Why butterflies don’t leave: Locational behavior of entrepreneurial firms. Economic Geography, 83(1), 27-50.
Steiner, M. (1998). The discreet charm of clusters: An introduction. Pp. 1-17 in Clusters and Regional Specialisation: On Geography, Technology and Networks. London, Pion.
Tassey, G. (1997). The Economics of R&D Policy. Westport, CT: Quorum Books.
Van Benthem, A., Gillingham, K. & Sweeney, J. (2008). Learning-by-doing and the optimal solar policy in California. The Energy Journal, 29 (3).
Von Hippel, E. (1988). The Sources of Innovation. New York: Oxford University Press.

161
1 Karen Chapple, Defining the Green Economy: A Primer on Green Economic Development (Berkeley, CA: UC-Berkeley Center for Community Innovation, 2008). 2 Keith Pavitt, “Innovation Processes,” in The Oxford Handbook of Innovation, edited by J. Fagerberg, D. C. Mowery and R. R. Nelson (Oxford: Oxford University Press, 2005). 3 National Governors Association, and Pew Center on the States, 2007 4 Saxenian, 1994; Cooke, 1998; Porter, 1998. 5 Asheim & Gertler, 2005; Cooke, Heidenreich & Braczyk, 2004; Cooke, Gomez Uranga, &Extebarria, 1997. 6 Gertler, 2003; Polanyi, 1958; Von Hippel, 1988. 7 Saxenian & Dabby, 2004. 8 Gordon & Hays, 2008. 9 Collaborative Economics, 2009. 10 Council on Competitiveness, 2005b. 11 Adapted from Karen Chapple, Defining the Green Economy: A Primer on Green Economic Development (Berkeley, CA: Center for Community Innovation, 2008). 12 Ibid. 13 Fagerberg, 2005. 14 Schumpeter’s Theory of Economic Development was in fact first published in 1911 in German. But it wasn’t until 1934, when this work was published in English, that it reached a wider audience. 15 See Fagerberg, Mowery, and Nelson 2005 for a comprehensive review. 16 Council on Competitiveness, 2005b. 17 National Governors Association and Pew Center on the States, 2007 18 Council on Competitiveness, 2005b. 19 Cooke, Gomez Uranga, & Etxebarria, 1997; Porter, 1990. 20 ASTRA, 2007. 21 Brouwer, Kleinknecht and Reijnen, 1993; Mansfield, 1972; Nadiri, 1993; Romer, 1986; Solow, 1956. 22 Christopherson & Clark, 2007. 23 Schumpeter, 1934, 1939. 24 Pavitt, 2005. 25 Dosi, 1988; Kline & Rosenberg, 1986; Lundvall, 1988; Freeman, 1974. 26 Kline & Rosenberg, 1986; Freeman & Soete, 1997; Dosi, 1988.
27 Freeman & Soete, 1997, Kamien & Schwartz, 1975. 28 Acs & Audretsch, 1987. 29 Steiner, 1998. 30 Simmie & Sennett, 1999. 31 Council on Competitiveness, 2005b; ASTRA, 2007; National Governors Association and Pew Center on the States, 2007; OECD and Eurostat, 2005. 32 Cooke, Gomez Uranga, & Etxebarria, 1997; Lundvall, 1992; Nelson, 1993; Edquist, 2005. 33 Lundvall, 1992. 34 Fagerberg, 2005 35 Council on Competitiveness, 2005b; Cooke, Gomez Uranga, & Etxebarria, 1997; Lundvall, 1992; Nelson, 1993; Edquist, 2005. 36 Lundvall, 1992; Nelson, 1993. 37 Asheim & Gertler, 2005; Cooke, Gomez Uranga, & Etxebarria, 1997; Cooke, Heidenreich, & Braczyk 2004. 38 Gertler, 2003; Polanyi, 1958; Von Hippel, 1988, see also Pavitt, 2002. 39 Christopherson & Clark, 2007. 40 Asheim & Isaksen, 2002; Bunnell & Coe, 2001. 41 Malerba, 2002, 2004, 2005; Malerba & Orsenigo, 1997; Pavitt, 1984. 42 Edquist, 2005. 43 Doloreux & Parto, 2005. 44 Advisory Committee on Measuring Innovation in the 21st Century Economy. 2008. 45 ASTRA, 2007. 46 Smith, 2005. 47 Fagerberg, 2005; Smith, 2005. 48 Smith, 2005. 49 Doloreux & Parto, 2005; Iammarino, 2005; Edquist, 2005. 50 OECD, 2005. 51 Aizcorbe, Moylan, & Robbins, 2009. 52 ASTRA, 2007; Council on Competitiveness, 2005b. 53 Kleinknecht & Mohnen, 2002. 54 Smith, 2005. 55 Hirsch-Kreinsen et al., 2003. 56 Smith, 2005. 57 Council on Competitiveness, 2005a. 58 ASTRA, 2007. 59 National Governors Association and Pew Center on the States, 2007. 60 Council on Competitiveness, 2005b. 61 Florida, 2002.

162
62 National Governors Association and Pew Center on the States, 2007. 63 Council on Competitiveness, 2005b. 64 Fagerberg, 2005. 65 Martin & Scott, 2000; Van Benthem, Gillingham, & Sweeney, 2008. 66 Van Benthem, Gillingham, & Sweeney, 2008. 67 Martin & Scott, 2000. 68 Pavitt, 1984; Dosi, 1988; Martin & Scott, 2000; Nelson & Rosenberg, 1993; and Tassey, 1997. 69 See Chapter 2 and the Appendix for a detailed discussion of the methodology used to measure green economic activity. Employment figures, which come from the National Establishment Time Series (NETS) data, are underestimated because not all green firms could be located in that dataset. Note also that this figure does not include additional jobs and economic activity generated by a multiplier effect of these direct green jobs. Firm and job totals in this report are more than three times those found in the California Economic Strategy Panel report, Clean technology and the Green Economy. This difference is likely due to several factors: first, this report uses data from 2007 (instead of 2006), second, we use a more comprehensive list of industry codes, particularly in transportation and environmental services; and third, we added green businesses found from several different other sources (rather than just the NETS). 70 This figure is significantly lower than that reported in the Next Ten 2009 Green Innovation Index. This difference may be due to our conservative methodology; for instance, we excluded some categories, including nuclear energy. 71 The NETS reports start-up data for the previous year; thus, 2006 is the last year for which this data is available. 72 For the purposes of this report we used the 2003 OMB core-based definition of Metropolitan areas with a few modifications. First we defined the East Bay region as Alameda and Contra Costa counties (a.k.a. the Oakland metropolitan area) and separated it from the remainder of the Bay Area (i.e. San Francisco-San Mateo-Marin). Second, we defined the Los Angeles region as just Los Angeles County, breaking out Orange County by itself. Third, we combined three smaller metros in the San Joaquin Valley
(Merced, Stockton and Modesto) to make a single region, which we call the Upper San Joaquin region. 73 Porter, 2001. Scott & Storper, 2003. 74 Stam, 2007:29. 75 Haug, 1991; Fulton & Shigley, 2001; Stam, 2007; Gottlieb, 1995. 76 Chapple, Hinkley, & Makarewicz, 2008; Kolko & Neumark, 2008. 77 Alamillo, 2006. 78 Sackman, 2005. 79 Joint Venture Silicon Valley Network, 2009: 30-31. 80 Saxenian, 1994. 81 Ibid. 82 Joint Venture Silicon Valley Network. 2009. 83 Spradley, 1996:58. 84 Brusco, 1982; Piore & Sabel, 1984. 85 Maillat, 1991:113. 86 Baumol, 2002. 87 Asheim & Gertler, 2005; Cooke, Heidenreich, & Braczyk, 2004; Cooke, 1998; Cooke, Gomez Uranga, & Extebarria, 1997. 88 Piore & Sabel, 1984; Saxenian, 1994. 89 Cohen, 2008. 90 Porter, 2000. 91 Feser, Renski & Goldstein, 2008. 92 One additional partner in the effort is the University of Illinois. 93 Other partners include the University of California, David, and Stanford University’s Department of Plant Biology. 94 Saxenian & Dabby, 2004. 95 Bishop, 2009. 96 Silicon Valley Leadership Group, 2009. 97 CleanTech LA website, http://www.cleantechlosangeles.org/news_events/show_news.php?id=43, Accessed April 16, 2009. 98 National Governors Association, and Pew Center on the States, 2007. 99 Ibid.