Embed Size (px)
Citation preview

Innovation and Growth ofLarge Scale Assessments
Irwin KirschEducational Testing Service
February 18, 2013

Overview
• Setting a context
• Growth in Large Scale Assessments (LSA)
• Features of Large Scale Assessments (LSA)
• Growing importance of CBA
• Innovations in recent LSA (PIAAC and PISA)
• Future areas for innovation

• Until relatively recently educational data were not collected in a consistent or standardized manner.
• In 1958, a group of scholars representing various disciplines met at UNESCO in Hamburg, Germany to discuss issues surrounding the evaluation of schools and students through the systematic collection of data relating to knowledge, skills and attitudes.
• Their meeting led to the development of a feasibility study of 13 year olds in 12 countries covering 5 content areas and the legal entity known as IEA in 1967.
Setting a Context

• Back in the United States the Commissioner of Education, Francis Keppel, invited Ralph Tyler in 1963 to develop a plan for the periodic assessment of student learning.
• Planning meetings were held in 1963 and 1964 and a technical advisory committee formed in 1965.
• In April 1969, NAEP first assessed in-school 17 year olds in citizenship, science and writing.
Setting a Context

• Tyler’s vision for NAEP was that it would focus on what groups of students know and can do rather than on what score an individual might receive on a test.
• The assessment would be based on identified objectives whose specifications would be determined by subject matter experts.
• Reports would be based on the performance of selected groups, not individuals, who responded correctly to the exercises and would not rely on grade-level norms.
Setting a Context

• Prior to IEA and NAEP there were no assessment programs to measure students or adults as a group.
• The primary focus of educational testing had been on measuring individual differences in achievement rather than on students’ learning.
• And, the data that were collected dealt primarily with the inputs to education rather than the yield of education.
Setting a Context

• Interpretations would be limited to the set of items used in each assessment. This basic approach to large scale assessments remained in place through all of the 1970s.
• In the 1980s programs beginning with NAEP began to use item response theory (IRT) to allow for the creation of scales and the broadening of inferences to include items not included in the assessment.
• New methodology involving marginal estimation was developed to optimize the reporting of proficiency distributions based on complex designs such as BIB spiraling. This approach remains in use today.
Setting a Context
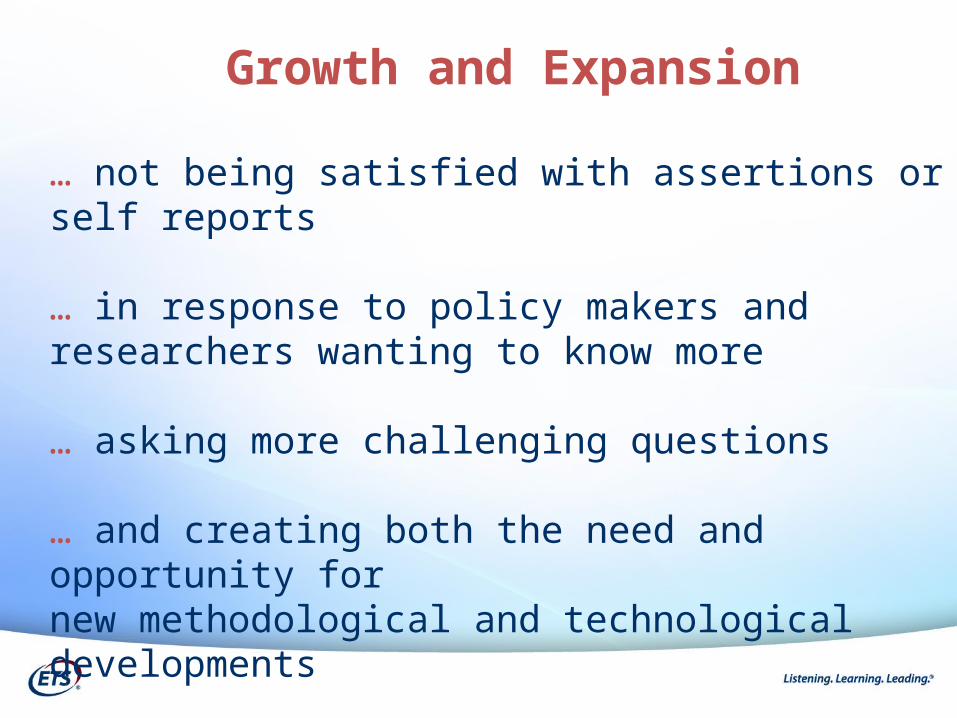
… not being satisfied with assertions or self reports
… in response to policy makers and researchers wanting to know more
… asking more challenging questions
… and creating both the need and opportunity fornew methodological and technological developments
Growth and Expansion

• Number of assessments
• Participation of countries
• Populations who are surveyed
• Domains / Constructs that are measured
• Methodology
• Modes
Growth and Expansion

Overview
10
Large-Scale International Surveys
School-Based
PIRLS
TIMSS
PISA
Adults
IALS
ALL
PIAAC
STEP
Growth and Expansion

Growth and Expansion
Curriculum
Life skills
Measurement

Growth and Expansion
Curriculum
Life skills
Measurement

Features of LSA Assessment
• LSA are primarily concerned with the accuracy of estimating the distribution of a group of respondents rather than individuals.
• In this way, the focus is on providing information that can inform policy and further research
• Differ from individual testing in key ways

• Extensive framework development
• Sampling
• Weighting
• Use of Complex Assessment Designs
• IRT Modeling
• Population Modeling
• Connection to background variables
• Increasing reliance on CBA
Features of LSA Assessment

• Until very recently all large scale national and international assessments were paper based assessments with some optional computer based components.
• PIAAC (2012) was the first large scale survey of adult skills in which the primary mode of delivery was computer and paper and pencil became the option.
• In 2015, PISA will also use computers as the primary mode of delivery with paper and pencil becoming an option for countries
Growing Importance of Computer Based Assessments

Why is a Computer Delivered Assessment Important for PISA?
• Better reflects the ways in which students & adults access, use and communicate information
• Enables surveys like PIAAC and PISA to broaden the range of skills that can be measured;
• Allow these surveys to take better advantage of both operational and measurement efficiencies that technology can provide
Why is Computer Based Assessment Important for Surveys such as PIAAC
and PISA?

Goals of the PIAAC 2012 and PISA 2015 Assessment Designs
• Establish the comparability of inferences across countries, across assessments and across modes
• Broaden what can be measured by both extending the existing constructs and by being able to introduce new constructs
• Reduce random and systematic error through the use of more complex designs, automated scoring; use of timing information; and the use of adaptive testing

PIAAC Main Study Cognitive Assessment Design
CORE4L + 4N
LITERACY20 Tasks
NUMERACY20 Tasks
READING COMPONENTS
CBA-CoreStage 1: ICT
LITERACYStage 1 (9
tasks)Stage 2 (11
tasks)
NUMERACYStage 1 (9
tasks)Stage 2 (11
tasks)
PS in TRE
NUMERACYStage 1 (9
tasks)Stage 2 (11
tasks)
LITERACYStage 1 (9
tasks)Stage 2 (11
tasks)
PS in TRE
ICT use from BQ
CBA-CoreStage 2: 3L + 3N
No computer experience
Computer experience
Pass
PassPass Pass
Fail
Fail
Fail
:Random assignment

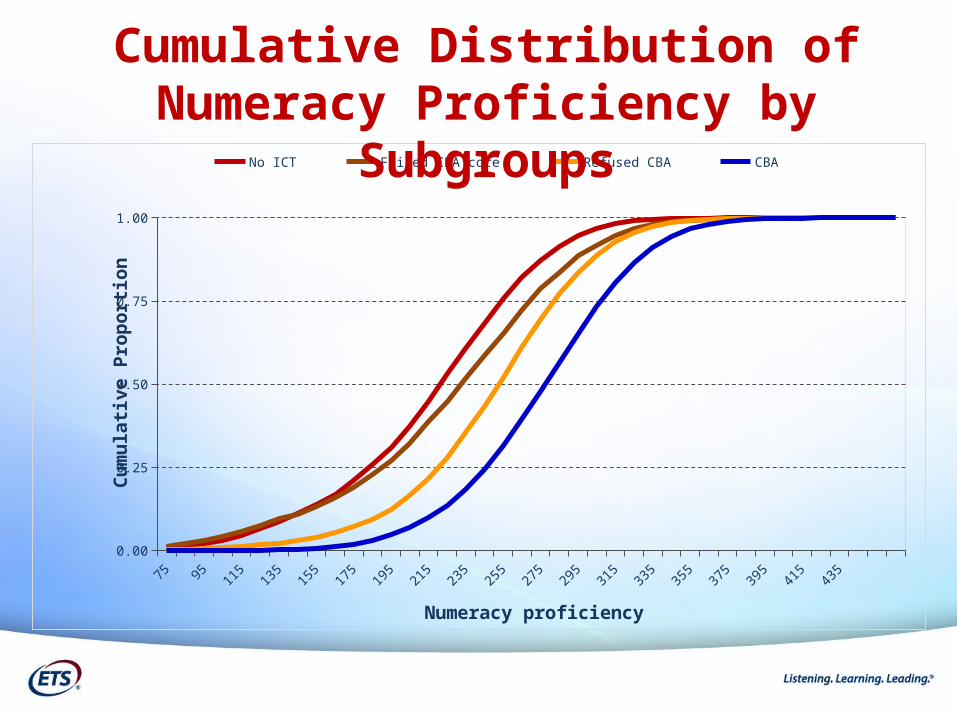
Average Proficiency Scores By Domain and Subgroups
Literacy Numeracy PSTRE
No ICT 225 209
Failed CBA Core 255 236
Refused CBA 265 249
CBA 281 274 281
75 85 95105
115125
135145
155165
175185
195205
215225
235245
255265
275285
295305
315325
335345
355365
375385
395405
415425
435445
0.00
0.25
0.50
0.75
1.00
No ICT Failed CBA core Refused CBA CBA
Numeracy proficiency
Cu
mu
lati
ve P
rop
orti
on
Cumulative Distribution of Numeracy Proficiency by
Subgroups

Percentage of Item-by-Country
Interactions
* Literacy and numeracy interactions go across modes and time
Literacy Numeracy PSTRE
8% 7% 3%
146 out of 1748 pairs (76 items x 23 countries)
118 out of 1748 pairs (76 items x 23 countries)
8 out of 280 pairs (14 items x 20 countries)

Number of Unique Parameters for Each Country - Numeracy
0
10
20
30
40
50
60
70
80
Unique General
Countries
Num
ber o
f Num
erac
y Ite
ms

Maintaining and Improving Measurement of Trends
• Proposal for PISA 2015 is to enhance and stabilise the measurement of trend data
• Refocus the balance between random and systematic errors
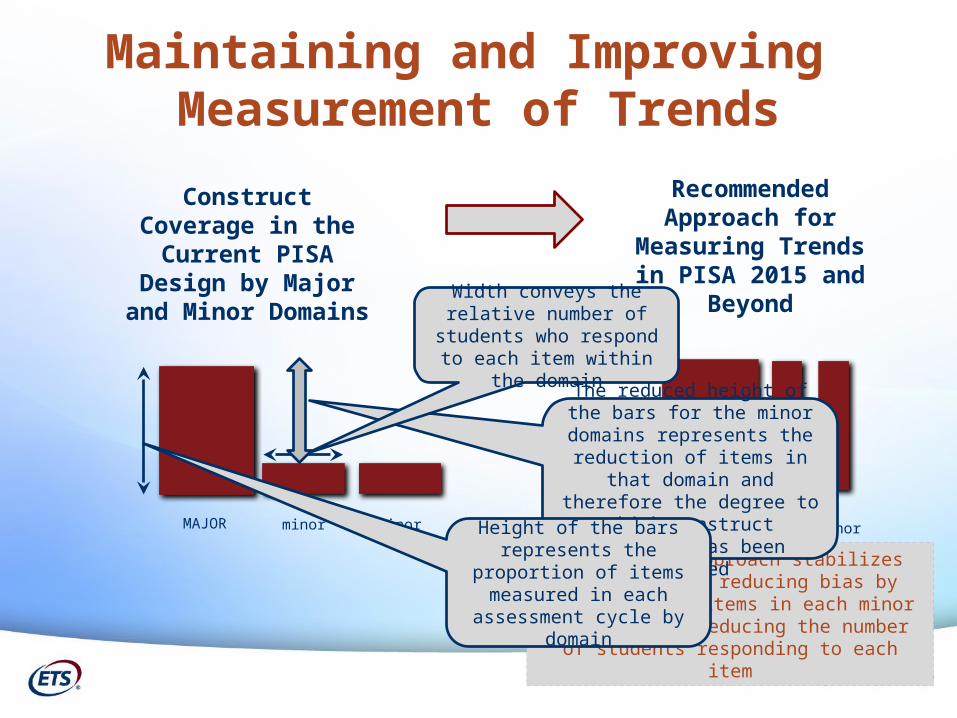
Recommended approach stabilizes trend through reducing bias by including all items in each minor domain while reducing the number
of students responding to each item
MAJOR minor minor
Construct Coverage
The reduced height of the bars for the minor domains represents the reduction of items in that domain and therefore the degree to which
construct coverage has been reduced
Width conveys the relative number of students who
respond to each item within the domain
MAJOR minor minor
Construct Coverage in the Current PISA
Design by Major and Minor Domains
Recommended Approach for
Measuring Trends in PISA 2015 and
Beyond
Height of the bars represents the proportion of items
measured in each assessment cycle by domain
Maintaining and Improving Measurement of Trends

MAJOR2006
minor2009
minor2012
MAJOR2015
minor2018
New
It
ems
New Items Reflecting New Construct
New Items Reflecting Old Construct
Tren
d It
ems
minor2021
Domain Rotation Domain Rotation
Scientific Literacy as a major domain - new items
Scientific Literacy as a minor
domain – new trend line from a construct point of
view
Maintaining and Improving Measurement of Trends
Impact Over Cycles
• Introduction of new item types
• Use of fully automated scoring
• More flexible use of languages
• Development of research around process
information contained in log files
• Introduction of more complex
psychometric models
• Development of derivative products
Future Innovations

• Large scale international assessments continue to grow in importance
• Computer based assessments are now feasible and will become the standard for development and delivery …
• better reflect the ways in people now access, use and communicate information
• add efficiency and quality to the data
• introduce innovation that broadens what can be measured and reported
Summary

Questions and Discussion


• Broaden what was measured;
• Demonstrate high comparability among countries, over time and across modes;
• Introduce multi-stage adaptive testing;
• Include the use of timing information to better distinguish between omit and not reached items;
• Demonstrate an improvement in the quality of the data that was collected
The design for PIAAC was able to …

Growth and Expansion
Curriculum
Life skills
Measurement