Embed Size (px)
Citation preview

Makara J. Technol. 21/3 (2017), 145-152 doi: 10.7454/mst.v21i3.3213
145 December 2017 Vol. 21 No. 3
Innovation of Hydrocarbon Investigation Using Audio-Magnetotelluric in Cepu
Field, Indonesia
Iqbal Fauzi Aditama and Widodo
Geophysical Engineering, Faculty of Mining and Petroleum Engineering, Institut Teknologi Bandung, Bandung 40132,
Indonesia
*e-mail: [email protected]
Abstract
An audio-magnetotelluric (AMT) survey has been performed at Cepu oil field located in Indonesia. The objective of
this research is to detect resistivity structures of this important hydrocarbon rock. This research can be classified as an
innovation in application of the AMT method for hydrocarbon exploration. The lack of seismic resolution has been
provided by the AMT method, especially in the location of sub-basalt and sub-salt plays. In additional, the cost of AMT
survey is quite low compared to seismic. The forward modelling is included in this research to understand the
measurement data response from a mathematical model. In the field campaign, AMT data were acquired along two
profiles in a frequency range of 0.1 to 8000 Hz. Anticlinal structure that has an E-W trend has also been identified by
AMT resistivity model. Analyses of the AMT data suggest signatures of hydrocarbon reservoir from the anticlinal
structure that indicated by a low resistivity zone. The basement structure is estimated to be located at 1600 m or deeper.
This study concludes that, as far as the hydrocarbon prospects are concerned, the AMT results seem to confirm the
continuation of the anticlinal structure, which was identified as the primary hydrocarbon prospect in previous studies.
Abstract
Inovasi Penggunaan Metode Audio-magnetotelurik pada Investigasi Hidrokarbon di Lapangan Cepu, Indonesia.
Sebuah survei audio-magnetotelurik (AMT) telah dilakukan di lapangan minyak Cepu di Indonesia. Tujuan dari
penelitian ini adalah untuk mendeteksi struktur resistivitas dari batuan hidrokarbon di sana. Penelitian ini dapat
diklasifikasikan sebagai sebuah inovasi dalam penerapan metode AMT untuk eksplorasi hidrokarbon. Kekurangan pada
resolusi seismik telah disediakan oleh metode AMT, terutama di lokasi yang terdapat sub-basalt dan sub-salt. Selain itu,
biaya survei AMT cukup rendah dibandingkan dengan seismik. Pemodelan ke depan termasuk dalam penelitian ini
dilakukan untuk memahami respon data pengukuran dari model matematis. Di lapangan, data AMT diperoleh disekitar
dua profil dalam rentang frekuensi 0,1 sampai 8000 Hz. Struktur antiklinal yang memiliki tren E-W juga diidentifikasi
menggunakan model resistivitas AMT. Analisis-analisis data AMT menunjukkan tanda-tanda reservoar hidrokarbon
dari struktur antiklinal yang ditunjukkan oleh zona resistivitas rendah. Struktur dasar diperkirakan berada pada
kedalaman 1600 m atau lebih. Studi ini menyimpulkan bahwa sejauh menyangkut prospek hidrokarbon, hasil-hasil
AMT tampaknya mengkonfirmasi penerusan struktur antiklinal, yang diidentifikasi sebagai prospek hidrokarbon utama
pada penelitian sebelumnya.
Keywords: audio-magnetotelluric, exploration, hydrocarbon, resistivity
1. Introduction
In recent years, electromagnetic (EM) methods have
been applied in hydrocarbon exploration, particularly
audio-magnetotelluric (AMT) method. The AMT method
is mainly used as a complement of seismic reflection
method. The lack of seismic resolution has been
provided by that AMT method, especially in the
location of sub-basalt and sub-salt plays. The AMT
method can differentiate structures and hydrocarbon
formation based variation in resistivity value, while the
seismic method is unable to do that. Additionally, the
cost of AMT survey is quite low compared to seismic.
In some previous studies, EM methods have been used in
hydrocarbon exploration and mapped geology structures.
For example, CSAMT (Controlled source audio-magneto-
telluric) and AMT for hydrocarbon exploration in Egypt
[1]) and RMT (Radio magnetotelluric) and TEM (Transient
electromagnetic) for mapping active faults in Northern
146 Aditama, et al.
Makara J. Technol. December 2017 Vol. 21 No. 3
Greece [2]. Those methods give a good overview of the
structures and/or allow determination of the hydrocarbon
reservoir.
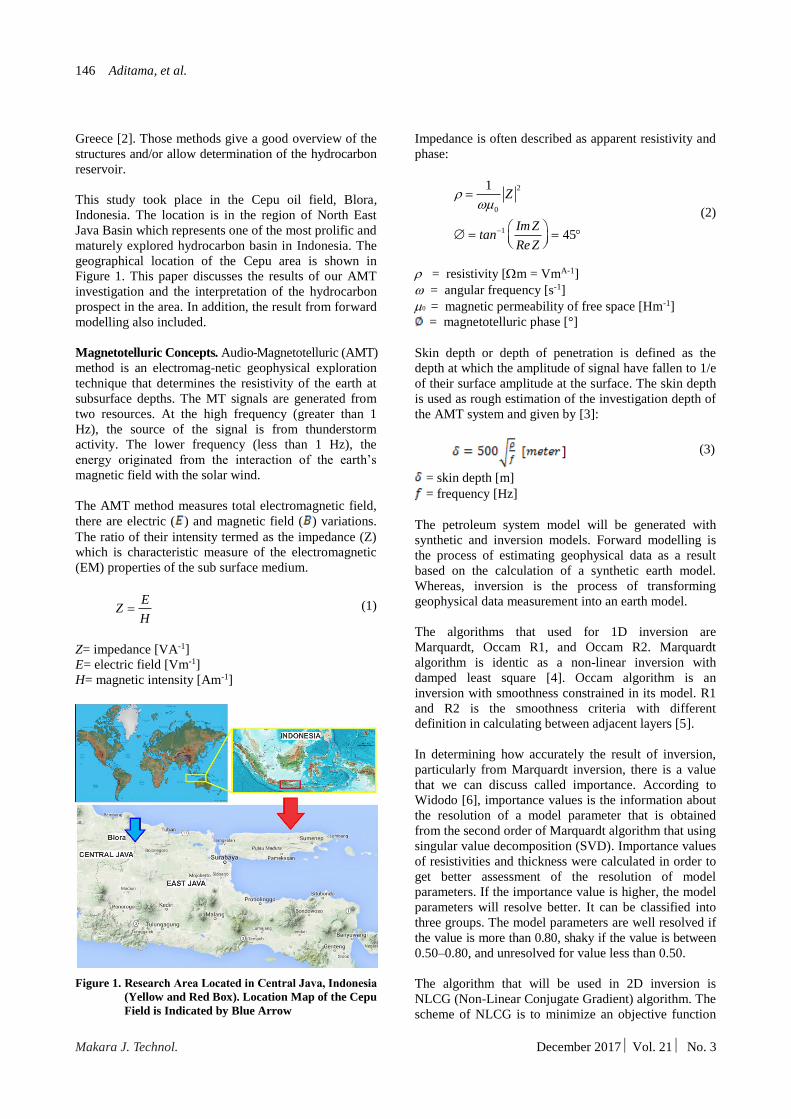
This study took place in the Cepu oil field, Blora,
Indonesia. The location is in the region of North East
Java Basin which represents one of the most prolific and
maturely explored hydrocarbon basin in Indonesia. The
geographical location of the Cepu area is shown in
Figure 1. This paper discusses the results of our AMT
investigation and the interpretation of the hydrocarbon
prospect in the area. In addition, the result from forward
modelling also included.
Magnetotelluric Concepts. Audio-Magnetotelluric (AMT)
method is an electromag-netic geophysical exploration
technique that determines the resistivity of the earth at
subsurface depths. The MT signals are generated from
two resources. At the high frequency (greater than 1
Hz), the source of the signal is from thunderstorm
activity. The lower frequency (less than 1 Hz), the
energy originated from the interaction of the earth’s
magnetic field with the solar wind.
The AMT method measures total electromagnetic field,
there are electric ( ) and magnetic field ( ) variations.
The ratio of their intensity termed as the impedance (Z)
which is characteristic measure of the electromagnetic
(EM) properties of the sub surface medium.
E
ZH
(1)
Z= impedance [VA-1]
E= electric field [Vm-1]
H= magnetic intensity [Am-1]
Figure 1. Research Area Located in Central Java, Indonesia
(Yellow and Red Box). Location Map of the Cepu
Field is Indicated by Blue Arrow
Impedance is often described as apparent resistivity and
phase:
2
0
1
1
45
Z
Im Ztan
Re Z
(2)
= resistivity [m = VmA-1]
= angular frequency [s-1]
0 = magnetic permeability of free space [Hm-1]
= magnetotelluric phase [°]
Skin depth or depth of penetration is defined as the
depth at which the amplitude of signal have fallen to 1/e
of their surface amplitude at the surface. The skin depth
is used as rough estimation of the investigation depth of
the AMT system and given by [3]:
(3)
= skin depth [m]
= frequency [Hz]
The petroleum system model will be generated with
synthetic and inversion models. Forward modelling is
the process of estimating geophysical data as a result
based on the calculation of a synthetic earth model.
Whereas, inversion is the process of transforming
geophysical data measurement into an earth model.
The algorithms that used for 1D inversion are
Marquardt, Occam R1, and Occam R2. Marquardt
algorithm is identic as a non-linear inversion with
damped least square [4]. Occam algorithm is an
inversion with smoothness constrained in its model. R1
and R2 is the smoothness criteria with different
definition in calculating between adjacent layers [5].
In determining how accurately the result of inversion,
particularly from Marquardt inversion, there is a value
that we can discuss called importance. According to
Widodo [6], importance values is the information about
the resolution of a model parameter that is obtained
from the second order of Marquardt algorithm that using
singular value decomposition (SVD). Importance values
of resistivities and thickness were calculated in order to
get better assessment of the resolution of model
parameters. If the importance value is higher, the model
parameters will resolve better. It can be classified into
three groups. The model parameters are well resolved if
the value is more than 0.80, shaky if the value is between
0.50–0.80, and unresolved for value less than 0.50.
The algorithm that will be used in 2D inversion is
NLCG (Non-Linear Conjugate Gradient) algorithm. The
scheme of NLCG is to minimize an objective function
Hydrocarbon Investigation Using Audio-Magnetotelluric 147
Makara J. Technol. December 2017 Vol. 21 No. 3
that penalizes data residuals and second spatial
derivatives of resistivity, which can be denoted as [7]:
(4)
= objective function
d = measured data
G = forward modelling function
V = weighting matrix
= regularization parameter
L = second order smoothness operator
m = model parameter
In the ideal 2-D case, electric and magnetic fields are
mutually orthogonal. Therefore, we can decoupled into
two independent modes; one incorporating electric
fields parallel to strike (Transverse electric or TE mode),
the other incorporating magnetic fields parallel to strike
(Transverse magnetic or TM mode) [8].
Tectonic and Geologic Setting. North East Java Basin
is a back-arc basin which dominated with anticline,
syncline, and fault structures. This basin can be
classified as a classic back-arc basin and the most
structurally and stratigraphically complex of Indonesian
back-arc basins.
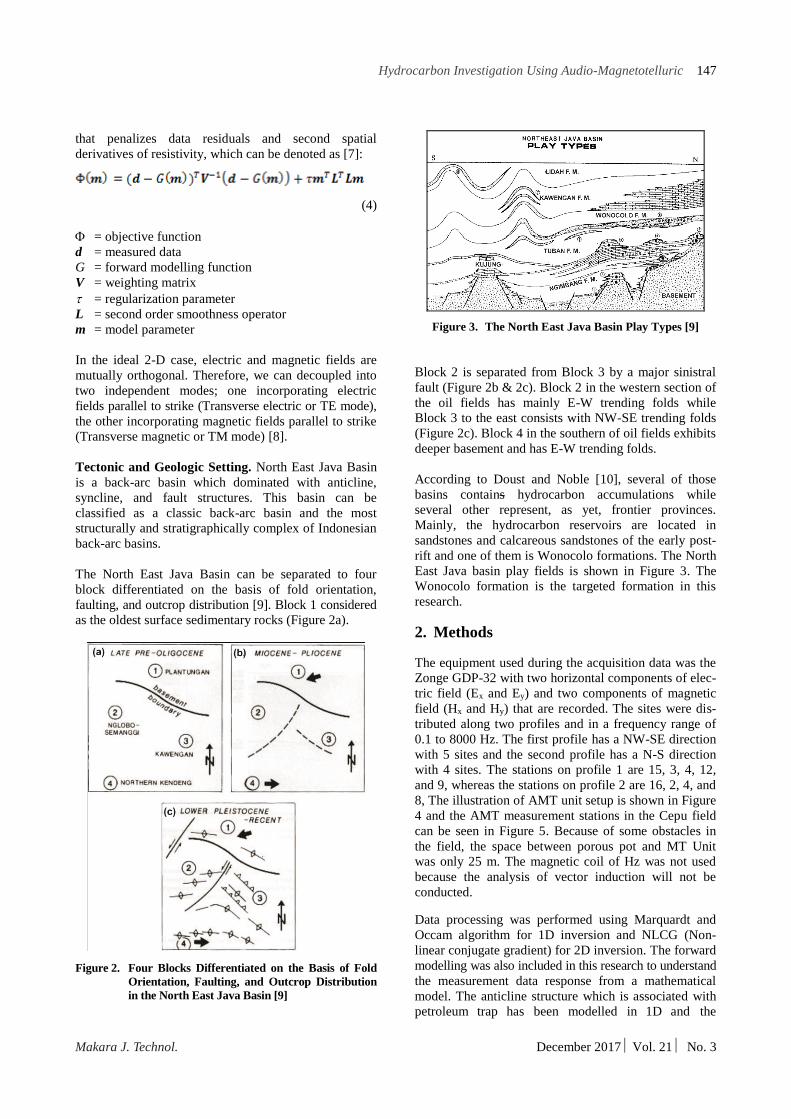
The North East Java Basin can be separated to four
block differentiated on the basis of fold orientation,
faulting, and outcrop distribution [9]. Block 1 considered
as the oldest surface sedimentary rocks (Figure 2a).
Figure 2. Four Blocks Differentiated on the Basis of Fold
Orientation, Faulting, and Outcrop Distribution
in the North East Java Basin [9]
Figure 3. The North East Java Basin Play Types [9]
Block 2 is separated from Block 3 by a major sinistral
fault (Figure 2b & 2c). Block 2 in the western section of
the oil fields has mainly E-W trending folds while
Block 3 to the east consists with NW-SE trending folds
(Figure 2c). Block 4 in the southern of oil fields exhibits
deeper basement and has E-W trending folds.
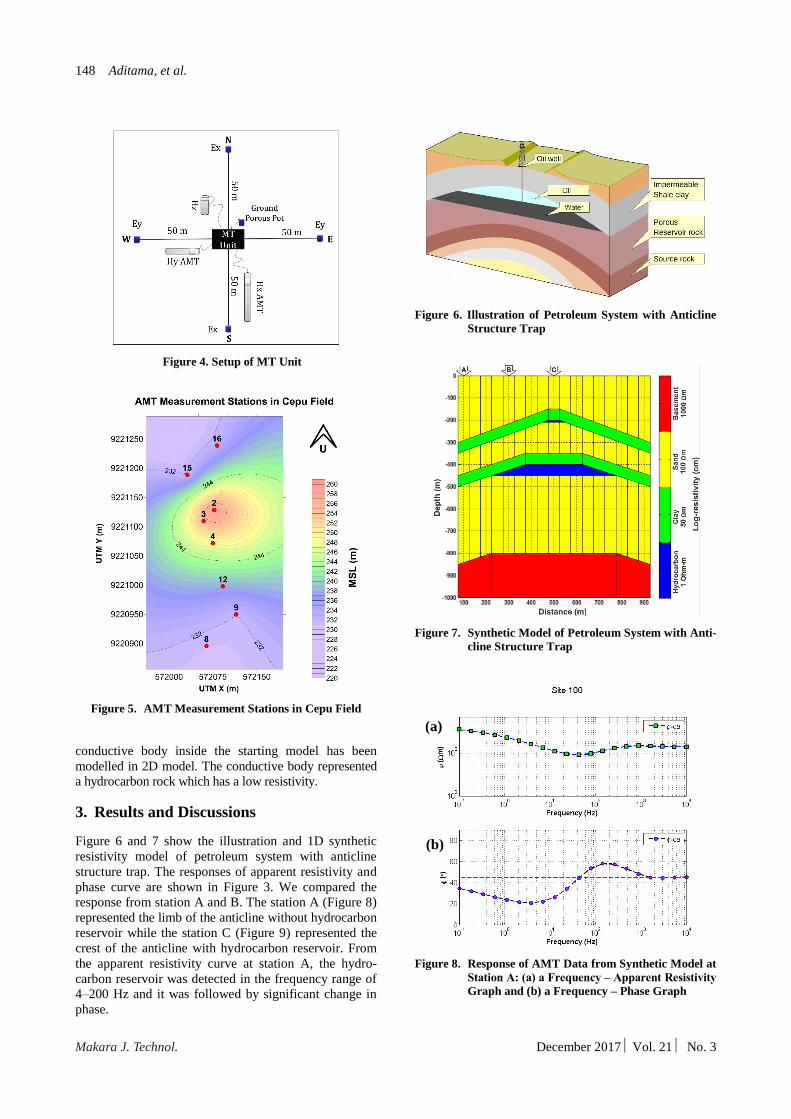
According to Doust and Noble [10], several of those
basins contains hydrocarbon accumulations while
several other represent, as yet, frontier provinces.
Mainly, the hydrocarbon reservoirs are located in
sandstones and calcareous sandstones of the early post-
rift and one of them is Wonocolo formations. The North
East Java basin play fields is shown in Figure 3. The
Wonocolo formation is the targeted formation in this
research.
2. Methods
The equipment used during the acquisition data was the
Zonge GDP-32 with two horizontal components of elec-
tric field (Ex and Ey) and two components of magnetic
field (Hx and Hy) that are recorded. The sites were dis-
tributed along two profiles and in a frequency range of
0.1 to 8000 Hz. The first profile has a NW-SE direction
with 5 sites and the second profile has a N-S direction
with 4 sites. The stations on profile 1 are 15, 3, 4, 12,
and 9, whereas the stations on profile 2 are 16, 2, 4, and
8, The illustration of AMT unit setup is shown in Figure
4 and the AMT measurement stations in the Cepu field
can be seen in Figure 5. Because of some obstacles in
the field, the space between porous pot and MT Unit
was only 25 m. The magnetic coil of Hz was not used
because the analysis of vector induction will not be
conducted.
Data processing was performed using Marquardt and
Occam algorithm for 1D inversion and NLCG (Non-
linear conjugate gradient) for 2D inversion. The forward
modelling was also included in this research to understand
the measurement data response from a mathematical
model. The anticline structure which is associated with
petroleum trap has been modelled in 1D and the
148 Aditama, et al.
Makara J. Technol. December 2017 Vol. 21 No. 3
Figure 4. Setup of MT Unit
Figure 5. AMT Measurement Stations in Cepu Field
conductive body inside the starting model has been
modelled in 2D model. The conductive body represented
a hydrocarbon rock which has a low resistivity.
3. Results and Discussions
Figure 6 and 7 show the illustration and 1D synthetic
resistivity model of petroleum system with anticline
structure trap. The responses of apparent resistivity and
phase curve are shown in Figure 3. We compared the
response from station A and B. The station A (Figure 8)
represented the limb of the anticline without hydrocarbon
reservoir while the station C (Figure 9) represented the
crest of the anticline with hydrocarbon reservoir. From
the apparent resistivity curve at station A, the hydro-
carbon reservoir was detected in the frequency range of
4–200 Hz and it was followed by significant change in
phase.
Figure 6. Illustration of Petroleum System with Anticline
Structure Trap
Figure 7. Synthetic Model of Petroleum System with Anti-
cline Structure Trap
Figure 8. Response of AMT Data from Synthetic Model at
Station A: (a) a Frequency – Apparent Resistivity
Graph and (b) a Frequency – Phase Graph
(a)
(b)
Hydrocarbon Investigation Using Audio-Magnetotelluric 149
Makara J. Technol. December 2017 Vol. 21 No. 3
Figure 9. Response of AMT Data from Synthetic Model at
Station C: (a) a Frequency - Apparent Resistivity
Graphand (b) a Frequency – Phase Graph
As already described in basic theory, we can decoupled
2D AMT data into two independent modes. The TE
mode describes currents flowing parallel to strike. As a
consequence of the discontinuous object in the subsurface,
TE mode tend to resolve lateral conductivity. However,
the TM mode describes currents flowing perpendicular
to strike. TM mode can be used to diagnose lateral
conductivity on -axis variations better than TE mode.
Figure 10 shows a synthetic model with a horizontal
conductive body which is represent a hydrocarbon
reservoir. The resistivity value of starting model was 50
Ωm while the conductive body was 5 Ωm. There was no
strike on that model because the conductive body is on
lateral position. From that synthetic model and its
response, it can be seen that TE mode is more sensitive
than TM mode. The resistivity and phase curve of TE
mode significantly changed at frequency 10 Hz or less.
The response of AMT data can identified that
conductive body was located at depth around 200–400
m and at the further depth the layer was more resistive.
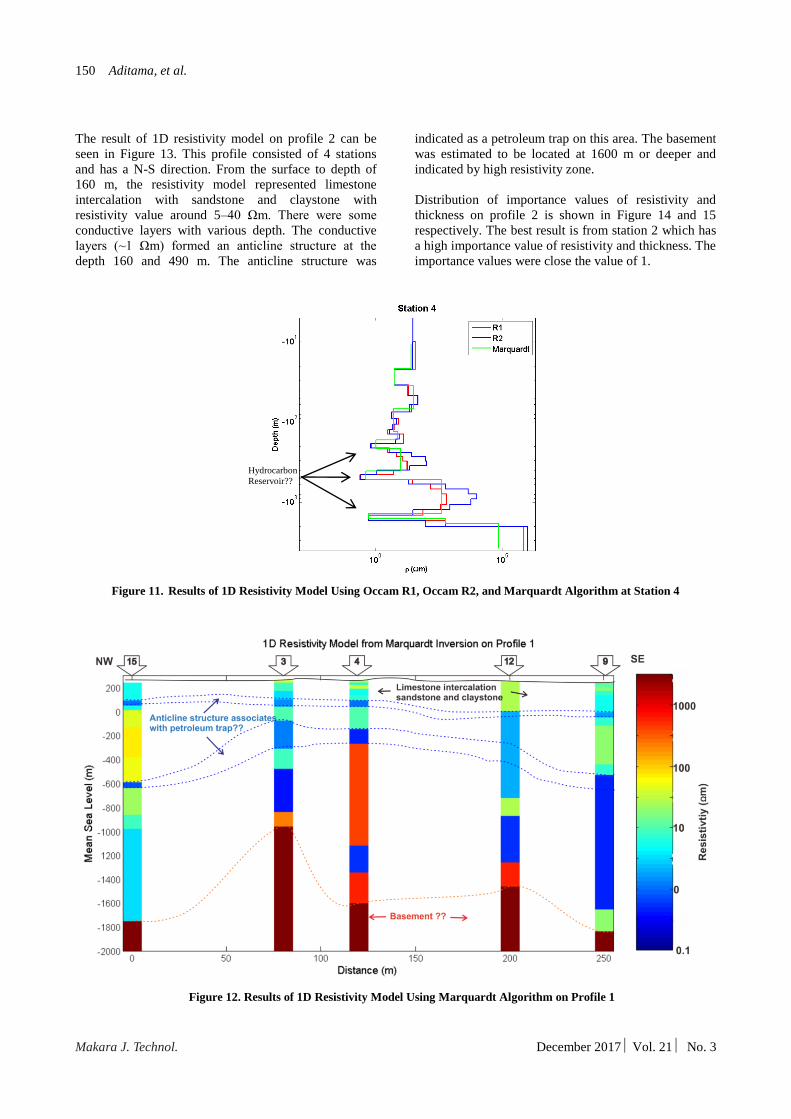
Figure 11 shows the result from Marquardt, Occam R1,
and Occam R2 inversion. The first and second order
smoothness constraints of the Occam inversion generated
smoother model relative than Marquardt inversion.
However, the hydrocarbon reservoirs were indicated
from conductive layer at the depth 160-210 m, 410-530
m, 1030-1060 m.
The result of Marquardt 1D inversion on profile 1 can
be seen in Figure 12. This profile consisted of 5 stations
and has a NW-SE direction. The resistivity model
obtained from AMT data showed the depth was up to
2000 m and indicated a complex structure.
Figure 10. (a) Synthetic Model with Horizontal Conductive
Body, (b) Response of AMT Data with TM Mode,
and (c) Response of AMT Data with TE Mode
(b)
(c)
(a)
(b)
(a)
(a)
150 Aditama, et al.
Makara J. Technol. December 2017 Vol. 21 No. 3
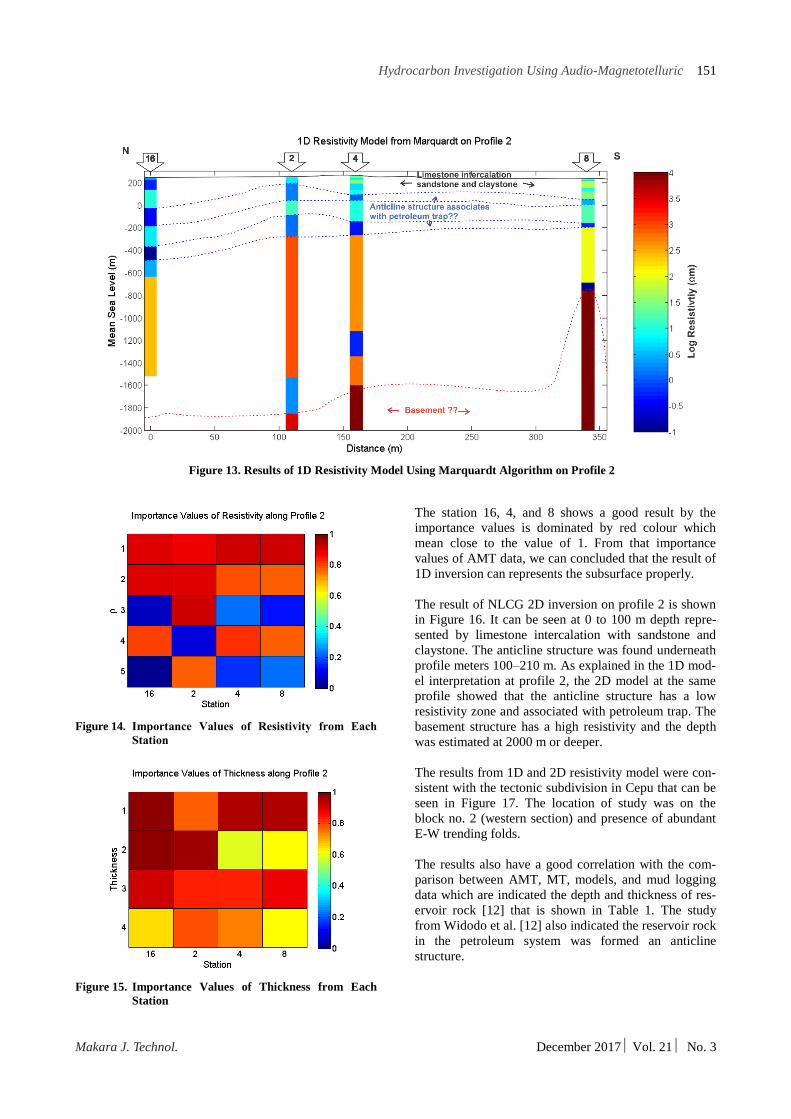
The result of 1D resistivity model on profile 2 can be
seen in Figure 13. This profile consisted of 4 stations
and has a N-S direction. From the surface to depth of
160 m, the resistivity model represented limestone
intercalation with sandstone and claystone with
resistivity value around 5–40 Ωm. There were some
conductive layers with various depth. The conductive
layers (~1 Ωm) formed an anticline structure at the
depth 160 and 490 m. The anticline structure was
indicated as a petroleum trap on this area. The basement
was estimated to be located at 1600 m or deeper and
indicated by high resistivity zone.
Distribution of importance values of resistivity and
thickness on profile 2 is shown in Figure 14 and 15
respectively. The best result is from station 2 which has
a high importance value of resistivity and thickness. The
importance values were close the value of 1.
Figure 11. Results of 1D Resistivity Model Using Occam R1, Occam R2, and Marquardt Algorithm at Station 4
Figure 12. Results of 1D Resistivity Model Using Marquardt Algorithm on Profile 1
Hydrocarbon
Reservoir??
Hydrocarbon Investigation Using Audio-Magnetotelluric 151
Makara J. Technol. December 2017 Vol. 21 No. 3
Figure 13. Results of 1D Resistivity Model Using Marquardt Algorithm on Profile 2
Figure 14. Importance Values of Resistivity from Each
Station
Figure 15. Importance Values of Thickness from Each
Station
The station 16, 4, and 8 shows a good result by the
importance values is dominated by red colour which
mean close to the value of 1. From that importance
values of AMT data, we can concluded that the result of
1D inversion can represents the subsurface properly.
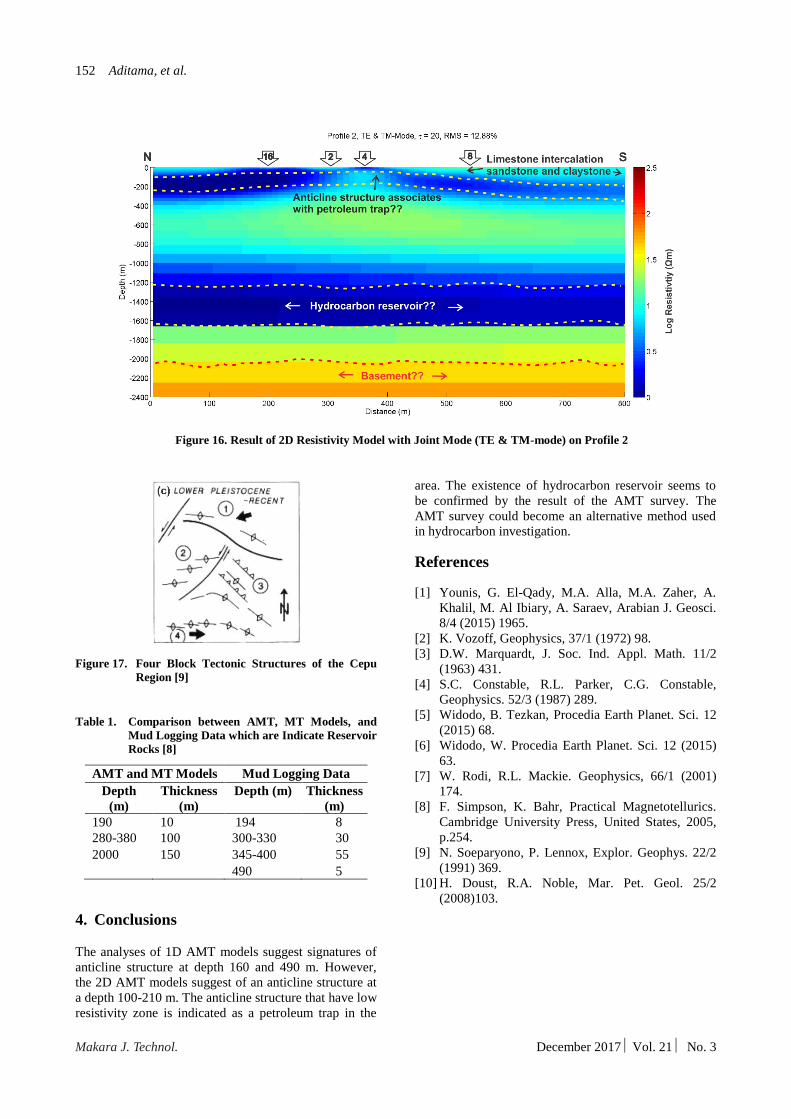
The result of NLCG 2D inversion on profile 2 is shown
in Figure 16. It can be seen at 0 to 100 m depth repre-
sented by limestone intercalation with sandstone and
claystone. The anticline structure was found underneath
profile meters 100–210 m. As explained in the 1D mod-
el interpretation at profile 2, the 2D model at the same
profile showed that the anticline structure has a low
resistivity zone and associated with petroleum trap. The
basement structure has a high resistivity and the depth
was estimated at 2000 m or deeper.
The results from 1D and 2D resistivity model were con-
sistent with the tectonic subdivision in Cepu that can be
seen in Figure 17. The location of study was on the
block no. 2 (western section) and presence of abundant
E-W trending folds.
The results also have a good correlation with the com-
parison between AMT, MT, models, and mud logging
data which are indicated the depth and thickness of res-
ervoir rock [12] that is shown in Table 1. The study
from Widodo et al. [12] also indicated the reservoir rock
in the petroleum system was formed an anticline
structure.
152 Aditama, et al.
Makara J. Technol. December 2017 Vol. 21 No. 3
Figure 16. Result of 2D Resistivity Model with Joint Mode (TE & TM-mode) on Profile 2
Figure 17. Four Block Tectonic Structures of the Cepu
Region [9]
Table 1. Comparison between AMT, MT Models, and
Mud Logging Data which are Indicate Reservoir
Rocks [8]
AMT and MT Models Mud Logging Data
Depth
(m)
Thickness
(m)
Depth (m) Thickness
(m)
190 10 194 8
280-380 100 300-330 30
2000 150 345-400 55
490 5
4. Conclusions
The analyses of 1D AMT models suggest signatures of
anticline structure at depth 160 and 490 m. However,
the 2D AMT models suggest of an anticline structure at
a depth 100-210 m. The anticline structure that have low
resistivity zone is indicated as a petroleum trap in the
area. The existence of hydrocarbon reservoir seems to
be confirmed by the result of the AMT survey. The
AMT survey could become an alternative method used
in hydrocarbon investigation.
References
[1] Younis, G. El-Qady, M.A. Alla, M.A. Zaher, A.
Khalil, M. Al Ibiary, A. Saraev, Arabian J. Geosci.
8/4 (2015) 1965.
[2] K. Vozoff, Geophysics, 37/1 (1972) 98.
[3] D.W. Marquardt, J. Soc. Ind. Appl. Math. 11/2
(1963) 431.
[4] S.C. Constable, R.L. Parker, C.G. Constable,
Geophysics. 52/3 (1987) 289.
[5] Widodo, B. Tezkan, Procedia Earth Planet. Sci. 12
(2015) 68.
[6] Widodo, W. Procedia Earth Planet. Sci. 12 (2015)
63.
[7] W. Rodi, R.L. Mackie. Geophysics, 66/1 (2001)
174.
[8] F. Simpson, K. Bahr, Practical Magnetotellurics.
Cambridge University Press, United States, 2005,
p.254.
[9] N. Soeparyono, P. Lennox, Explor. Geophys. 22/2
(1991) 369.
[10] H. Doust, R.A. Noble, Mar. Pet. Geol. 25/2
(2008)103.