Embed Size (px)
Citation preview
The St. John’s Well Child and Family Center, an independent network of Federally Qualified Health Centers in central and south Los Angeles, was awarded an innovation challenge grant from the Tides Foundation–Community Clinics Initiative to improve integration of care and health outcomes for seniors and individuals living with disabilities who use long term services and supports (LTSS). This Enhanced Home Care Pilot Program, which began in January 2012 and concluded in December 2012, is one of the first known models that specifically tied coordination of care and an enhanced role for home care workers with the Triple Aim goals of better health, better care, and lower costs.1
The pilot included 97 participant-provider pairs: older adults and individuals living with disabilities who receive services through California’s In-Home Support Services (IHSS) program, and their IHSS home care providers. To achieve successful integration, participants agreed to let their home care providers become part of their patient-centered healthcare team. And, home care providers agreed to participate in additional training better equipping them to play an enhanced role, specifically in the areas of team-based communication with the participant’s care coordinator and medical provider, coordination of certain health
and related services, and acquisition of supplemental skills relating to paramedical tasks and chronic disease management.
Data analysis indicates the pilot was successful in demonstrating positive outcomes in each of the three goal areas. A few notable examples include:
• Better Health – Participants displayed a sharp rise in measured healthy days, greater adherence to medications, and less utilization of acute and emergency services.
• Better Care – Participants reported higher rates of satisfaction with the experience and quality of medical services received during the pilot.
• Lower Cost – Participants demonstrated marked decreases in the use of hospital and emergency room services, known drivers of healthcare costs.
This pilot was successful in linking an innovative model of care to improved Triple Aim outcomes. By improving health, improving quality of care and reducing costs, these innovative models of service delivery have great potential to transform healthcare in America.
INNOVATIONS IN HOME CAREBetter Health. Better Care. Lower Costs.
St. John’s Enhanced Home Care Pilot Program
Innovative service delivery approaches show great potential for transforming healthcare in America by improving health, improving quality and
satisfaction, and lowering overall healthcare costs.
Selection of Participants and Providers
Project participants were recruited from a group of older adults and individuals with disabilities who receive services through both the S. Mark Taper Chronic Disease and Environmental Health Center one of the clinics in the St. John’s network, and California’s In-Home Support Services program (IHSS). To join the project, participants and their IHSS home care providers had to agree to participate as pairs. All participation was voluntary.
Testing Enhanced Roles for Home Care Providers
The project focused on two core components:
• better integration of clinic and home-based services; and
• the capacity for home care providers to play an enhanced role on the care team and in the delivery of services.
To reach this level of integration and enhanced service delivery, it was essential for the providers to be meaningfully engaged in the planning, communication and coordination processes, and to expand the skills needed for use in the home. To accomplish this, a care coordinator position was created and a specialized home care worker training program was built into the pilot design.
Designing the Care Coordinator Position
A care coordinator position was developed specifically to support the integration of clinic and home-based services. The care coordinator acted as the primary contact for the home care provider as well as the conduit through which all clinic-based services were coordinated for project participants. The care coordinator was also responsible for the majority of project data collection activities.
Home care providers participated in an introductory meeting with the participant and the care coordinator. This initial meeting was followed by weekly check-ins between the home care provider and the care coordinator, as well as the participant and the care coordinator, for the remainder of the project. The weekly check-ins were intended to offer an opportunity to discuss health status, treatment progress, need for additional medical and/or other services, medical appointments, and other issues as necessary.
Training Design and Process
The specialized training program for home care providers was developed by drawing on several sources: training proposed by the Congress of California Seniors (CCS); a review of the existing California Long Term Care Education Center (CLTCEC) curriculum; and focus groups consisting of home care providers.2
The training was conducted by CLTCEC instructors and included modules on the IHSS system, life quality for participants, activities of daily living, home safety and fall prevention techniques, paramedical services, mobility and transferring, nutrition, strategies for medication adherence and medication compliance, and
MethodologySt. John’s Enhanced Home Care Pilot Program: Design and Data Collection Methodology.
2
mental health. Post-testing was administered to participating home care providers as a means for measuring knowledge retention.
Enrollment and Baseline Data Collection
One hundred ninety-four individuals participated in the program–97 IHSS participants and their 97 home care providers.3 Once the participant-provider pairs were formally enrolled in the program, baseline data was collected that included:
• participants’ general health and sense of well-being;
• functional status for activities of daily living (ADLs);
• satisfaction with various aspects of care;
• recent hospitalizations and emergency room visits; and
• medication adherence behaviors.4
The same data collection categories were used with participants throughout the pilot project. Depending upon the measure, some participant data was collected only at baseline and conclusion while other data was recorded at up to five points throughout the course of their participation in the pilot.
Participants were asked about their satisfaction with St. John’s, whether the provider attended the participant’s medical appointments, and their satisfaction with the project at both the beginning and the end of the pilot.
Home care providers were tested on skills and knowledge acquired at the conclusion of their training program.
Triple Aim OutcomesThe pilot program aimed to show improvements in Triple Aim areas of improved health, improved quality of care, and reduced overall healthcare costs. In every measured variable, the pilot was successful in demonstrating positive outcomes in these three goal areas.
1. Participants Experienced Better Health
In every variable measured, participants displayed significantly better health at the conclusion of the pilot than at the start of the project. For variables that were measured multiple times during the pilot, a clear progression toward better health is seen over the course of their participation. Additionally, participants’ self-reported assessments of their own physical and mental well-being indicated a belief that their health had improved as a result of participation in the pilot.
Increase in Number of “Healthy Days”
The overall health status of each participant was measured using the Center for Disease Control’s Health Related Quality of Life instrument.5 Data on participants’ physical, mental and emotional health were collected at baseline and at every month thereafter. These data were then translated into a measurement
3

of “healthy days” and “unhealthy days” per month. Participants showed a sharp increase in measured “healthy days”; from the beginning to the end of the program, participants’ “healthy days” increased from an average of 4.7 healthy days per month to an average of 14.4 healthy days per month.
Number of Healthy Days Tripled
Near Unanimous Agreement that Overall Health Benefitted
All participants were asked at the pilot’s conclusion whether they agreed or disagreed their health had benefitted from participating in the program. On a scale ranging from “strongly agree” to “strongly disagree,” an astounding 85 percent of participants “strongly agreed” their health had benefited from participating in the program. An additional 13 percent “somewhat agreed,” bringing the total of those who agreed their health had benefited to a near unanimous 98 percent. Remarkably, no participants “somewhat” or “strongly” disagreed their health had benefitted.
2. Participants Experienced Better Care
Participants’ satisfaction with the quality of care they received increased over the course of the pilot. Additionally, participants displayed high levels of satisfaction with their doctor and with the St. John’s clinic.
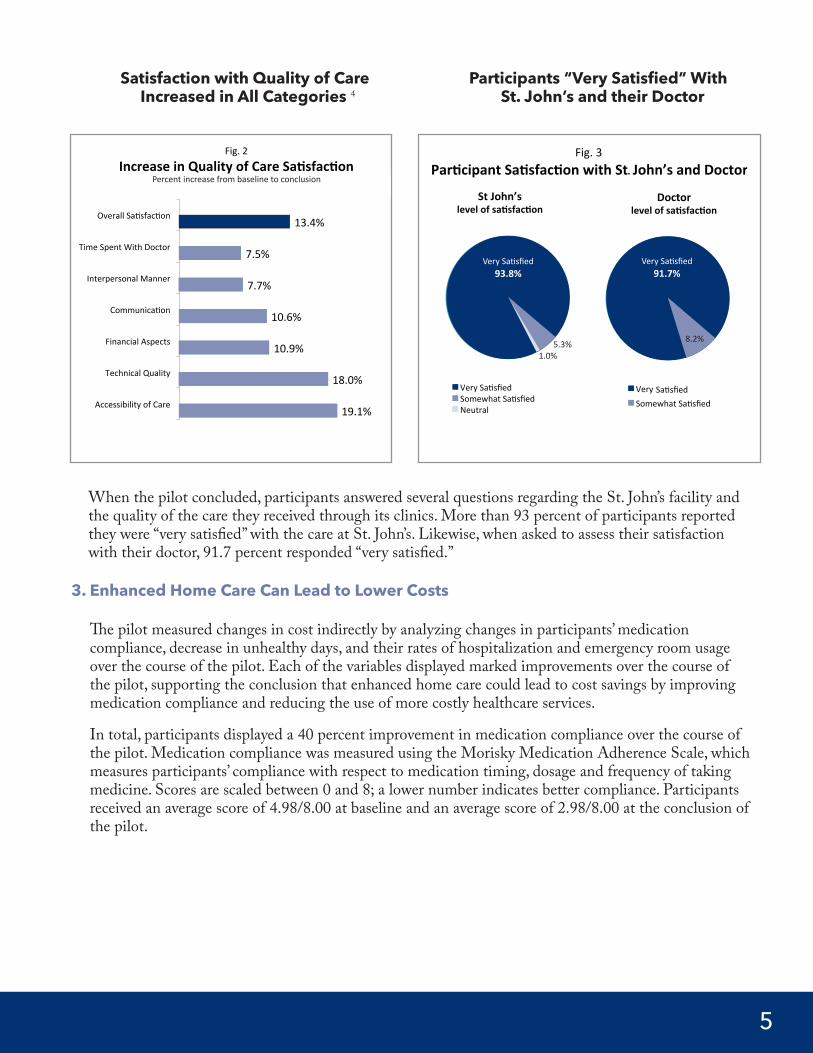
High Satisfaction with Quality of Care
Participants were asked to evaluate the quality of care they received during the pilot. As shown in the chart below, participants’ satisfaction with overall quality of care from the time they enrolled in the pilot to its conclusion increased by an average of 13.4 percent. The chart also depicts improvements in specific areas, such as satisfaction with the technical quality of care.
4.7
6.9
12.8 13.9 14.4
0
2
4
6
8
10
12
14
16
Month 1 Month 2 Month 3 Month 4 Month 5
Fig. 1 Number of Healthy Days per Month
Par?cipants were tracked in five -‐month cycles
6.9
4.7
12.813.9 14.4
4.7
6.9
12.8 13.9 14.4
0
2
4
6
8
10
12
14
16
Month 1 Month 2 Month 3 Month 4 Month 5
Fig. 1 Number of Healthy Days per Month
Par?cipants were tracked in five -‐month cycles
4
Satisfaction with Quality of Care Participants “Very Satisfied” With Increased in All Categories 4 St. John’s and their Doctor
When the pilot concluded, participants answered several questions regarding the St. John’s facility and the quality of the care they received through its clinics. More than 93 percent of participants reported they were “very satisfied” with the care at St. John’s. Likewise, when asked to assess their satisfaction with their doctor, 91.7 percent responded “very satisfied.”
3. Enhanced Home Care Can Lead to Lower Costs
The pilot measured changes in cost indirectly by analyzing changes in participants’ medication compliance, decrease in unhealthy days, and their rates of hospitalization and emergency room usage over the course of the pilot. Each of the variables displayed marked improvements over the course of the pilot, supporting the conclusion that enhanced home care could lead to cost savings by improving medication compliance and reducing the use of more costly healthcare services.
In total, participants displayed a 40 percent improvement in medication compliance over the course of the pilot. Medication compliance was measured using the Morisky Medication Adherence Scale, which measures participants’ compliance with respect to medication timing, dosage and frequency of taking medicine. Scores are scaled between 0 and 8; a lower number indicates better compliance. Participants received an average score of 4.98/8.00 at baseline and an average score of 2.98/8.00 at the conclusion of the pilot.
Fig. 2 Increase in Quality of Care SaDsfacDon
Percent increase from baseline to outcome
19.1%
18.0%
10.9%
10.6%
7.7%
7.5%
13.4%
Accessibility of Care
Technical Quality
Financial Aspects
Communica?on
Interpersonal Manner
Time Spent With Doctor
Overall Sa?sfac?on
Fig. 3 ParDcipant SaDsfacDon with St John’s and Doctor
93.8%
5.3% 1.0%
St John’s level of saDsfacDon
Very Sa?sfied Somewhat Sa?sfied Neutral
91.7%
8.2%
Doctor level of saDsfacDon
Very sa?sfied Somewhat Sa?sfied
Fig. 3
ParDcipant SaDsfacDon with St John’s and Doctor 93.8%
5.3% 1.0%
St John’s
level of saDsfacDon
Very Sa?sfied
Somewhat Sa?sfied
Neutral
91.7%
8.2%
Doctor
level of saDsfacDon
Very sa?sfied
Somewhat Sa?sfied
Fig. 3 ParDcipant SaDsfacDon with St John’s and Doctor
93.8%
5.3% 1.0%
St John’s level of saDsfacDon
Very Sa?sfied Somewhat Sa?sfied Neutral
91.7%
8.2%
Doctor level of saDsfacDon
Very sa?sfied Somewhat Sa?sfied
Fig. 3 ParDcipant SaDsfacDon with St John’s and Doctor
93.8%
5.3% 1.0%
St John’s level of saDsfacDon
Very Sa?sfied Somewhat Sa?sfied Neutral
91.7%
8.2%
Doctor level of saDsfacDon
Very sa?sfied Somewhat Sa?sfied
Fig. 3 ParDcipant SaDsfacDon with St John’s and Doctor
93.8%
5.3% 1.0%
St John’s level of saDsfacDon
Very Sa?sfied Somewhat Sa?sfied Neutral
91.7%
8.2%
Doctor level of saDsfacDon
Very sa?sfied Somewhat Sa?sfied
Fig. 3 ParDcipant SaDsfacDon with St John’s and Doctor
93.8%
5.3% 1.0%
St John’s level of saDsfacDon
Very Sa?sfied Somewhat Sa?sfied Neutral
91.7%
8.2%
Doctor level of saDsfacDon
Very sa?sfied Somewhat Sa?sfied
Fig. 3 ParDcipant SaDsfacDon with St John’s and Doctor
93.8%
5.3% 1.0%
St John’s level of saDsfacDon
Very Sa?sfied Somewhat Sa?sfied Neutral
91.7%
8.2%
Doctor level of saDsfacDon
Very sa?sfied Somewhat Sa?sfied
Fig. 3 ParDcipant SaDsfacDon with St John’s and Doctor
93.8%
5.3% 1.0%
St John’s level of saDsfacDon
Very Sa?sfied Somewhat Sa?sfied Neutral
91.7%
8.2%
Doctor level of saDsfacDon
Very sa?sfied Somewhat Sa?sfied
Fig. 3 ParDcipant SaDsfacDon with St John’s and Doctor
93.8%
5.3% 1.0%
St John’s level of saDsfacDon
Very Sa?sfied Somewhat Sa?sfied Neutral
91.7%
8.2%
Doctor level of saDsfacDon
Very sa?sfied Somewhat Sa?sfied
Percent increase from baseline to conclusion
5.3% 8.2%
1.0%
Very Satisfied93.8%
Very Satisfied91.7%
5
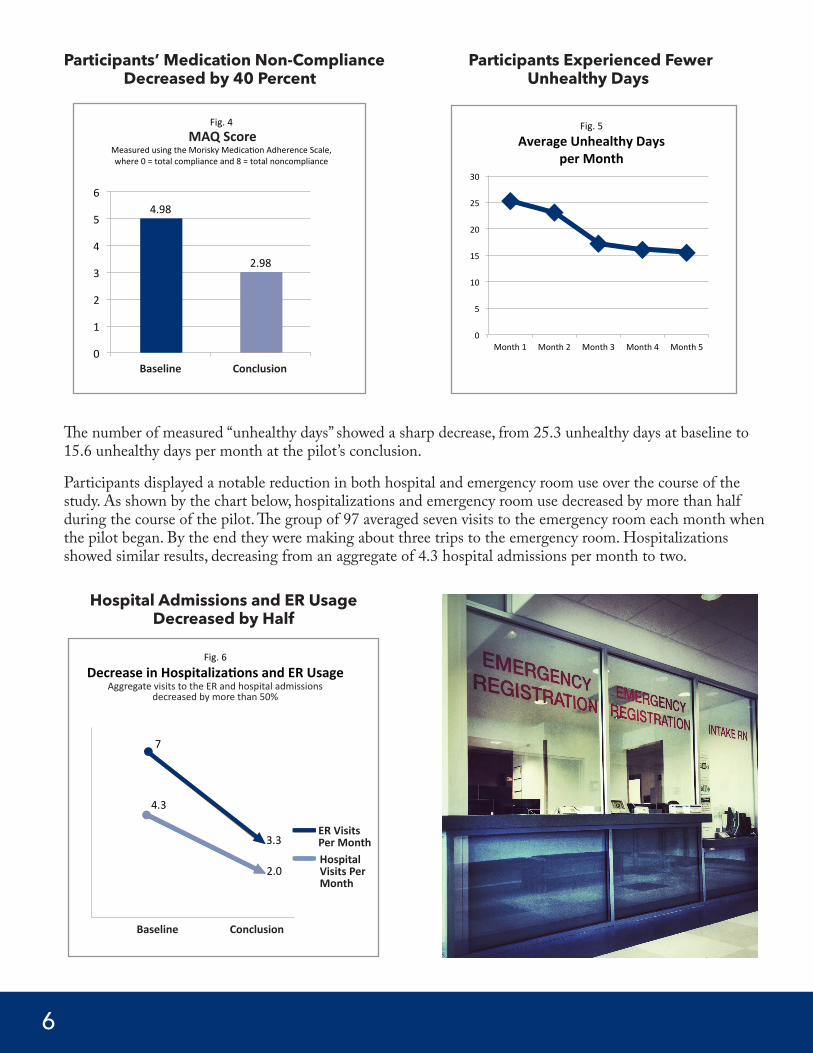
Participants’ Medication Non-Compliance Participants Experienced Fewer Decreased by 40 Percent Unhealthy Days
The number of measured “unhealthy days” showed a sharp decrease, from 25.3 unhealthy days at baseline to 15.6 unhealthy days per month at the pilot’s conclusion.
Participants displayed a notable reduction in both hospital and emergency room use over the course of the study. As shown by the chart below, hospitalizations and emergency room use decreased by more than half during the course of the pilot. The group of 97 averaged seven visits to the emergency room each month when the pilot began. By the end they were making about three trips to the emergency room. Hospitalizations showed similar results, decreasing from an aggregate of 4.3 hospital admissions per month to two.
Fig. 4
MAQ score over 12-‐month period Measured using the Morisky Medica?on Adherence Scale, where 0 = total compliance and 8 = total noncompliance
4.98
2.98
0
1
2
3
4
5
6
Baseline Outcome
0
5
10
15
20
25
30
Month 1 Month 2 Month 3 Month 4 Month 5
Fig. 5 Average Unhealthy Days
per Month
Fig. 6 Decrease in HospitalizaDons and ER Usage Par?cipant visits to the ER and hospital admissions decreased
by more than 50% over a 12 month period
4.3
2.0
7
3.3
Baseline Conclusion
Group Hospital Visits Per Month
MAQ Score
Baseline Conclusion
Baseline Conclusion
Aggregate visits to the ER and hospital admissions decreased by more than 50%
HospitalVisits PerMonth
ER VisitsPer Month
6
Hospital Admissions and ER Usage Decreased by Half
The success of the St. John’s pilot program was measured both by participants’ health outcomes and by the degree of home care provider integration. As discussed previously, participants’ health outcomes met or exceeded the pilot’s initial goals. Similarly, the pilot also achieved a very high level of provider integration.
Integration between the clinic and home-based services occurred by expanding home care providers’ health-related knowledge and skills, by allowing trained providers to perform enhanced tasks in the home, and by integrating these providers into their participants’ larger medical and social care team.
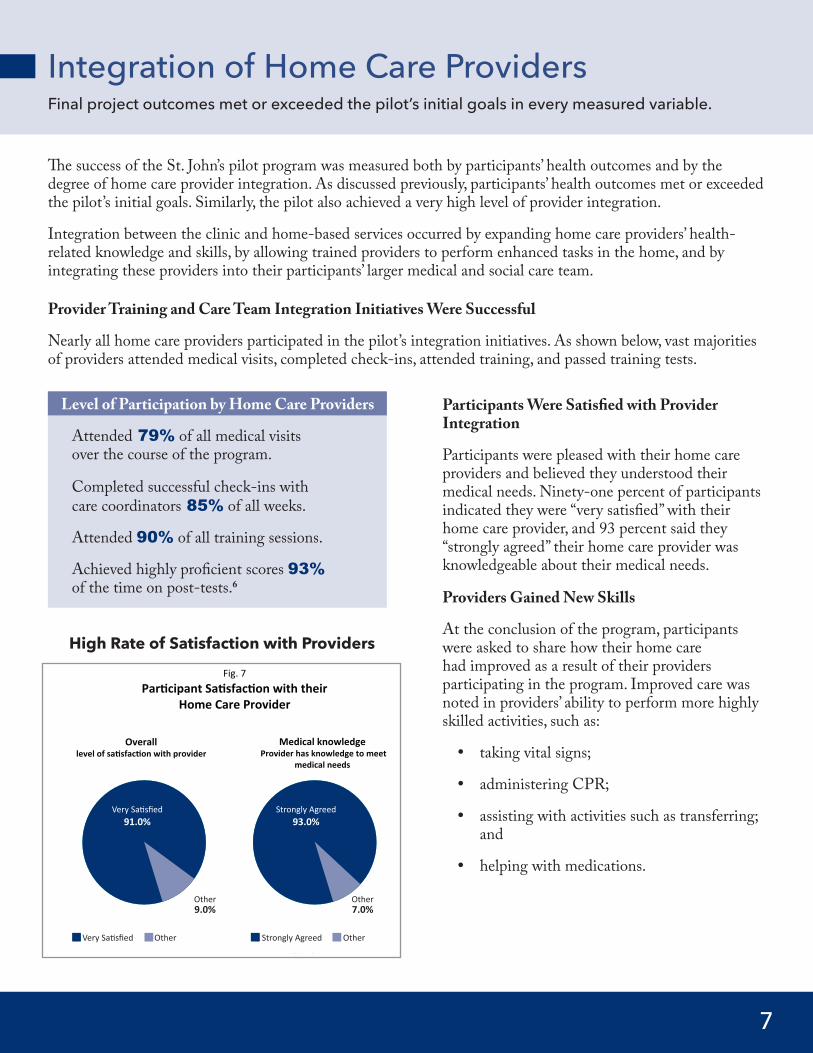
Provider Training and Care Team Integration Initiatives Were Successful
Nearly all home care providers participated in the pilot’s integration initiatives. As shown below, vast majorities of providers attended medical visits, completed check-ins, attended training, and passed training tests.
Level of Participation by Home Care Providers
Attended 79% of all medical visits over the course of the program.
Completed successful check-ins with care coordinators 85% of all weeks.
Attended 90% of all training sessions.
Achieved highly proficient scores 93% of the time on post-tests.6
Fig. 7 ParDcipant SaDsfacDon with their
Home Care Provider
Very Sa?sfied, 91.0%
Other, 9.0%
Overall level of saDsfacDon with provider
Very Sa?sfied Other
Strongly agreed, 93.0%
Other, 7.0%
Medical knowledge Provider has knowledge to meet
medical needs
Strongly agreed Other
Fig. 7 ParDcipant SaDsfacDon with their
Home Care Provider
Very Sa?sfied, 91.0%
Other, 9.0%
Overall level of saDsfacDon with provider
Very Sa?sfied Other
Strongly agreed, 93.0%
Other, 7.0%
Medical knowledge Provider has knowledge to meet
medical needs
Strongly agreed Other
Integration of Home Care Providers Final project outcomes met or exceeded the pilot’s initial goals in every measured variable.
Other9.0%
Other7.0%
Very Satisfied Other Strongly Agreed Other
Very Satisfied91.0%
Strongly Agreed93.0%
7
Participants Were Satisfied with Provider Integration
Participants were pleased with their home care providers and believed they understood their medical needs. Ninety-one percent of participants indicated they were “very satisfied” with their home care provider, and 93 percent said they “strongly agreed” their home care provider was knowledgeable about their medical needs.
Providers Gained New Skills
At the conclusion of the program, participants were asked to share how their home care had improved as a result of their providers participating in the program. Improved care was noted in providers’ ability to perform more highly skilled activities, such as:
• taking vital signs;
• administering CPR;
• assisting with activities such as transferring; and
• helping with medications.
High Rate of Satisfaction with Providers
Home care providers frequently spend more time with individuals needing long term services and supports than any other medical and social service providers. They are uniquely well-positioned to make a positive and significant contribution to meeting Triple Aim goals of better health, better care and lower healthcare costs. Little effort has been made, however, to collect and analyze data relating to an expanded role for home care providers in achieving these outcomes for a significant and growing segment of the population.
The Enhanced Home Care Pilot was one of the first attempts to measure whether integrating home care providers into participants’ care teams via communication, coordination and delivering enhanced services could improve health, improve experience, and lower healthcare costs. To achieve successful integration, participants allowed their home care providers to become part of their patient-centered healthcare team. Subsequently, home care providers participated in additional training which equipped them to play an enhanced role, specifically in the areas of team-based communication with the participant’s care coordinator and medical provider, coordination of certain health and related services, and acquisition of supplemental skills relating to the delivery of paramedical tasks and chronic disease management.
This pilot was very successful in linking an innovative model of service delivery involving better integration
and expanded roles for home care workers to improved Triple Aim outcomes.
The sharp rise in measured “healthy days” is a clear sign of better health. The increase in satisfaction with the quality of medical care received suggests a better experience with care. Significant increases in medication compliance, marked decrease in unhealthy days, hospitalizations, and less frequent emergency room visits indicate better health as well as lower healthcare costs attributed to a drop in utilization of known cost drivers. The enormous potential for home care providers to effect change by serving in an enhanced role remains largely unexplored and deserves serious examination from the healthcare industry.
Future projects can build upon the success of this pilot to better understand the impact of incorporating home care providers into care teams and performing enhanced tasks. Other critical dimensions to be considered include the use of technology to improve integration and communication, more rigorous tracking of healthcare cost data, measuring workforce performance standards and effectiveness, and assessing job quality and satisfaction. If the healthcare industry is to fully achieve the goals of the Triple Aim and realize an innovative 21st century service delivery system, then the home care workforce must be an integral part of this transformation.
1 The Triple Aim was developed by the Institute for Healthcare Improvement as a framework for enhancing health system performance in three dimensions– improving health of populations; improving patient experience; and, reducing per capita health care costs. http://www.ihi.org/engage/initiatives/TripleAim/Pages/default.aspx
2 The California Long-Term Care Education Center was established in 2000 by SEIU–United Long Term Care Workers (SEIU-ULTCW). Currently the CLTCEC is the largest educator of IHSS providers in California, serving more than 5,000 people per year and offering training in more than five languages.
3 The grant called for enrolling three cohorts of participants and providers. The first and second cohorts were combined and enrolled 68 individuals (34 home care providers and 34 IHSS participants); while the third cohort enrolled 126 individuals (63 home care providers and 63 IHSS participants).
4 Data instruments used include the Morisky Medication Adherence Questionnaire (measuring medication adherence), the Centers for Disease Control’s Health-Related Quality of Life (HRQOL) questionnaire with specific use of the Unhealthy Days Index (measuring healthy days and unhealthy days), and the short form (PSQ-18) of the RAND Patient Satisfaction Questionnaire. In addition, data was collected by program staff on participants’ satisfaction with St. John’s and the pilot program, and whether the provider attended the participants’ medical appointments. Participants also self-reported their numbers of hospital and emergency room admittances.
5 See “CDC–Health Related Quality of Life” at http://www.cdc.gov/hrqol/ for more on this instrument. 6 “Highly proficient” was a score of 80 percent or higher.
For more information, contact: Kimberly Austin-Oser, SEIU Healthcare [email protected] Edmiston, SEIU United Long Term Care Workers [email protected] Sussman, St. John’s Well Child and Family Center [email protected]
ConclusionSt. John’s Enhanced Care Pilot Program proves that involving home care workers in new and innovative ways produces highly positive outcomes for all involved.
The Service Employees International Union (SEIU) unites 2 million diverse members in the United States, Canada and Puerto Rico. SEIU members working in the healthcare industry, public sector and in property services believe in the power of joining together on the job to win higher wages, benefits and create better communities, while fighting for a more just society and an economy that works for all of us, not just corporations and the wealthy.
www.seiu.org