Embed Size (px)
Citation preview
Innovations in Managing Post-Acute CareTom Scully
2
Our vision of PACSimilar to Part D, PAC is an area that holds promise for better management through payment reform
Post Acute Bundle is 20 years overdue
Part APart B90 day
PAC Bundle
3
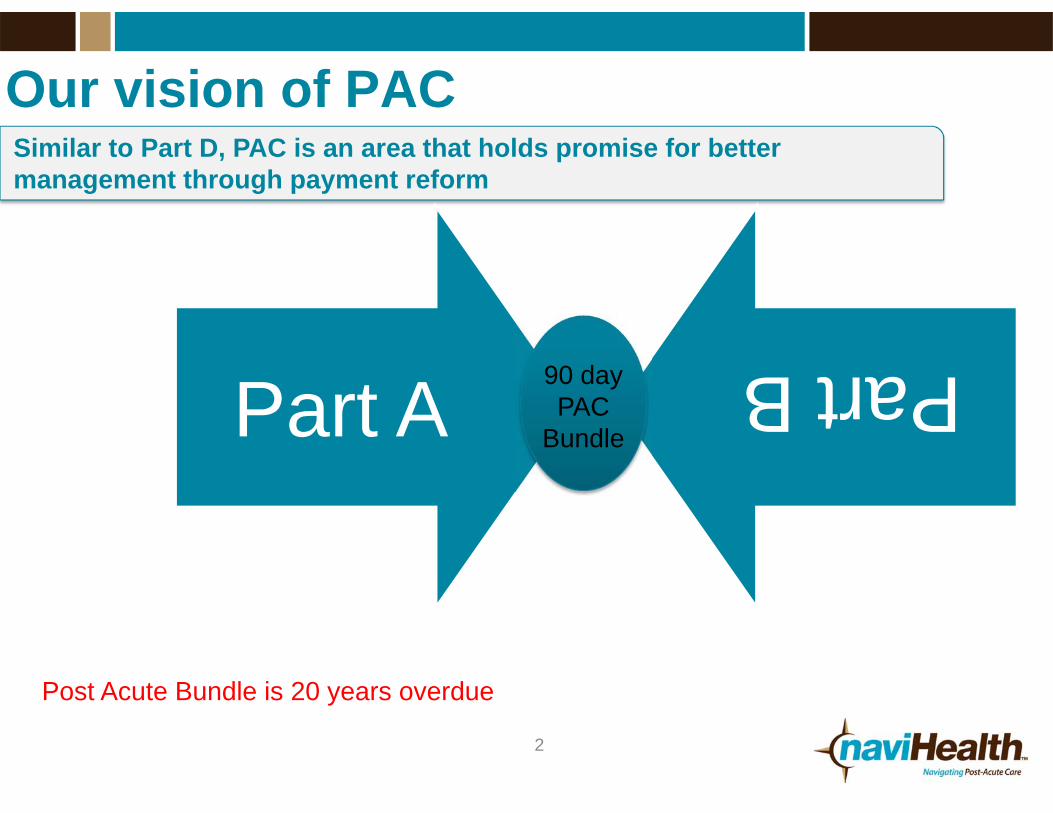
The Post-Acute OpportunityPost‐acute care (PAC) by the Numbers
Up to40%
•The percentage of Medicare patients utilizing PAC services following hospitalization
• The percentage of total medical spend that PAC represents
• The rate at which Medicare spending on PAC grew annually from 2001-2012
If regional variation in PAC spend did not exist, Medicare spending variation would fall by 73%
PAC: 73%Acute: 27%
Diagnostic Tests: 14%
Procedures: 14%
Drugs: 9%
Market forces driving incentives to manage PAC more efficiently
• Payment reform
• Medicare Advantage funding cuts
• Providers taking on risk through ACOs and capitation from managed care
• Hospital readmission penalties and efficiency requirements
• PAC provider reimbursement declines
43 23 >8

4
Post-Acute Heat MapGeographic variation and high utilization results in significant savings opportunity across post-acute landscape
Medicare FFS PAC Utilization by State:Per member per month spending for SNF, IRF, LTAC utilization
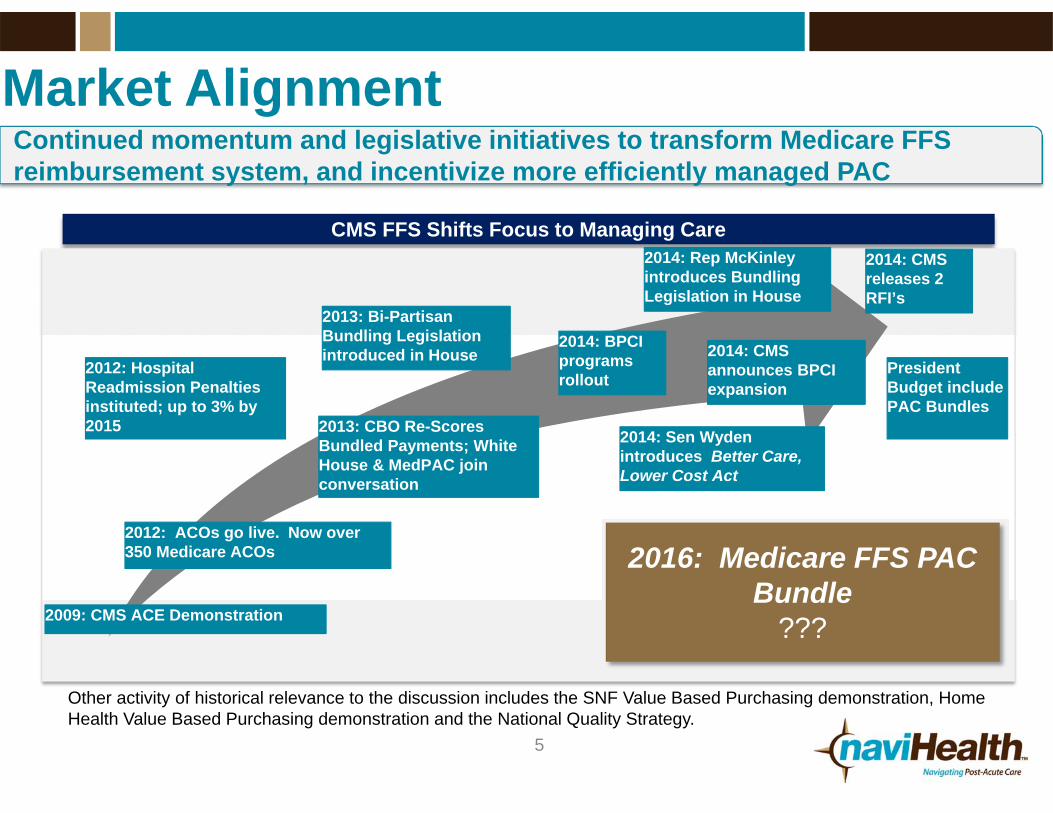
Continued momentum and legislative initiatives to transform Medicare FFS reimbursement system, and incentivize more efficiently managed PAC
Market Alignment
CMS FFS Shifts Focus to Managing Care
2009: CMS ACE Demonstration
2012: ACOs go live. Now over 350 Medicare ACOs
2012: Hospital Readmission Penalties instituted; up to 3% by 2015 2013: CBO Re-Scores
Bundled Payments; White House & MedPAC join conversation
2013: Bi-Partisan Bundling Legislation introduced in House
2014: BPCI programs rollout
2016: Medicare FFS PAC Bundle
???
5
2014: Rep McKinley introduces Bundling Legislation in House
2014: Sen Wyden introduces Better Care, Lower Cost Act
Other activity of historical relevance to the discussion includes the SNF Value Based Purchasing demonstration, Home Health Value Based Purchasing demonstration and the National Quality Strategy.
2014: CMS announces BPCI expansion
2014: CMS releases 2 RFI’s
President Budget include PAC Bundles
6
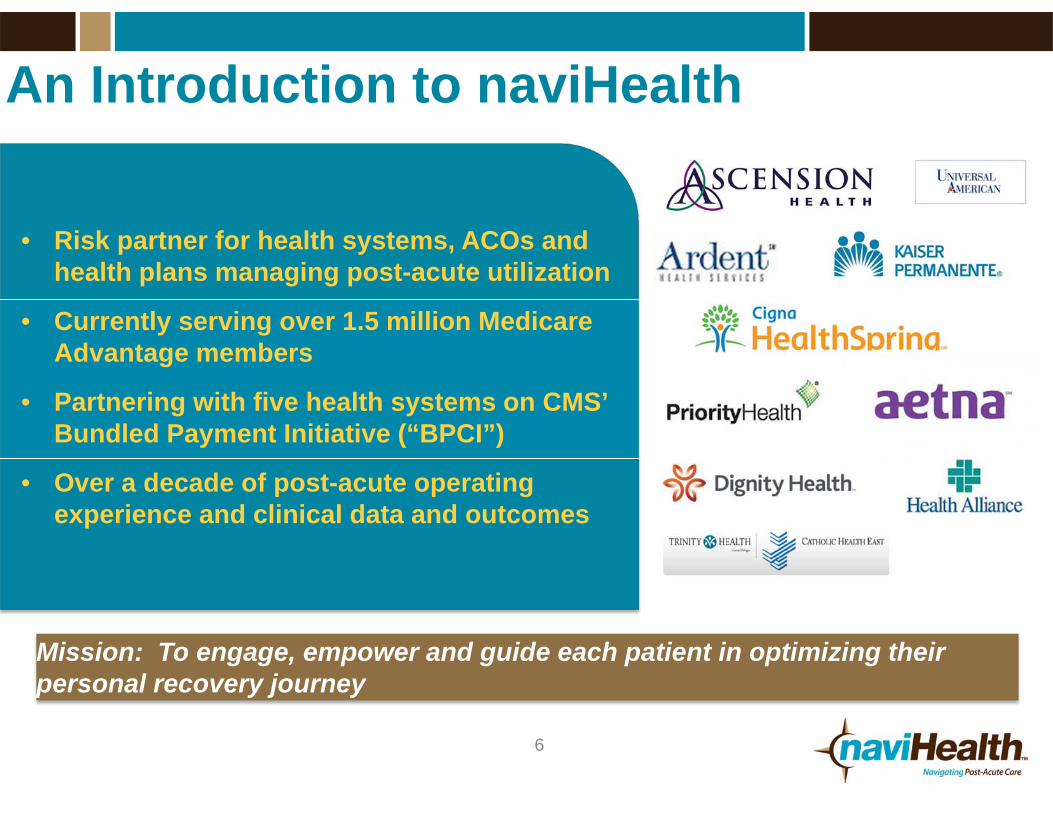
An Introduction to naviHealth
• Risk partner for health systems, ACOs and health plans managing post-acute utilization
• Currently serving over 1.5 million Medicare Advantage members
• Partnering with five health systems on CMS’ Bundled Payment Initiative (“BPCI”)
• Over a decade of post-acute operating experience and clinical data and outcomes
Mission: To engage, empower and guide each patient in optimizing their personal recovery journey
7
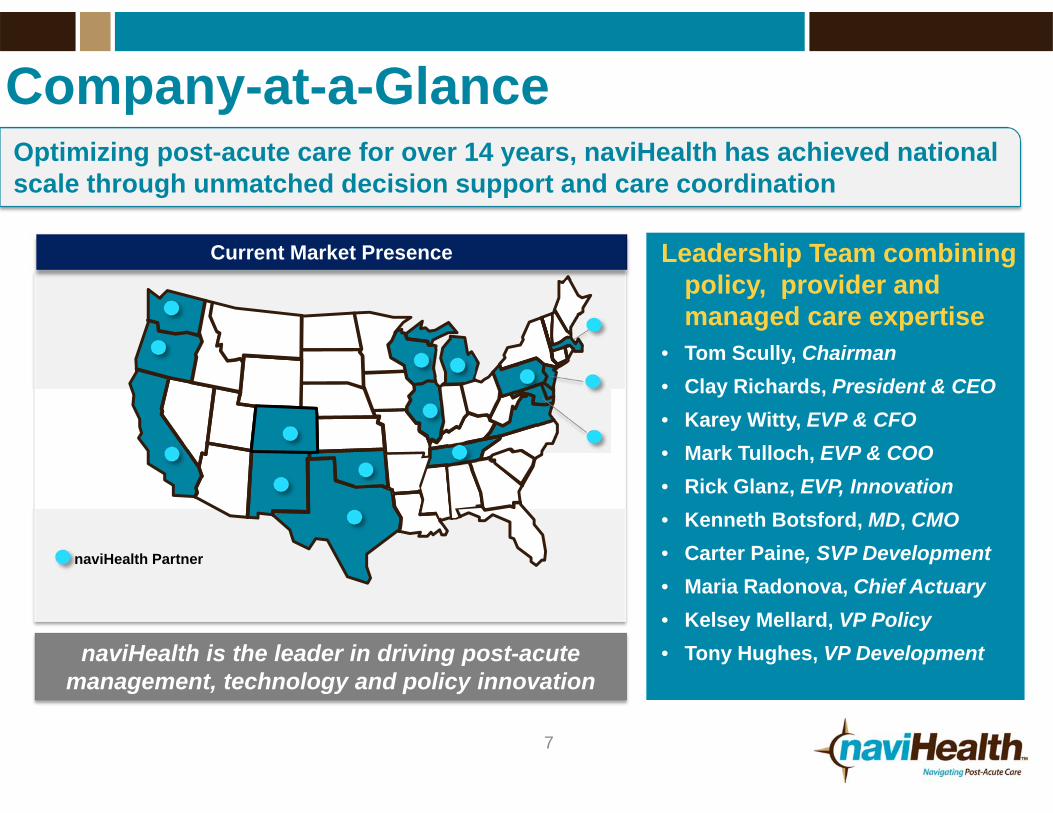
Company-at-a-GlanceOptimizing post-acute care for over 14 years, naviHealth has achieved national scale through unmatched decision support and care coordination
Leadership Team combining policy, provider and managed care expertise
• Tom Scully, Chairman• Clay Richards, President & CEO• Karey Witty, EVP & CFO• Mark Tulloch, EVP & COO• Rick Glanz, EVP, Innovation• Kenneth Botsford, MD, CMO• Carter Paine, SVP Development• Maria Radonova, Chief Actuary• Kelsey Mellard, VP Policy• Tony Hughes, VP DevelopmentnaviHealth is the leader in driving post-acute
management, technology and policy innovation
Current Market Presence
naviHealth Partner

8
BPCI Program : Needs to Move Faster
CMS program incentivizing quality and financial alignment across the multiple services delivered to a beneficiary receives during a care episode
Four models:1.Retrospective Acute Care Hospital Stay
Only2.Retrospective Acute Care Hospital plus
Post-Acute Care (Model 2)3.Retrospective Post-Acute Care Only
4.Acute Care Hospital Stay Only
naviHealth went live January 1 as a Model 2 risk convener and signing up new partners for the January 2015 Go-Live
A widespread initiative aimed at more efficiently managing post-acute utilization in the Medicare population
Over 300 current BPCI participants
IOM Report
naviHealth is currently signing on new partners for Model 2

$122
$99
$67$53
$42
Top quartile National average Medicare Advantageaverage
naviHealth average naviHealth Best
naviHealth Post-Acute Value PropositionVariation and overutilization of post-acute services offer significant opportunity to create better and more efficient outcomes
Average LTAC, SNF, IRF costs per member per month (PMPM)
~50% less than FFS national average
(Fee‐for‐service Medicare)
Post-acute utilization, in the fee-for-service Medicare population, is substantially higher than other managed models
BPCI opportunity can introduce coordinated data driven care to an otherwise fragmented and misaligned area of healthcare
9
10
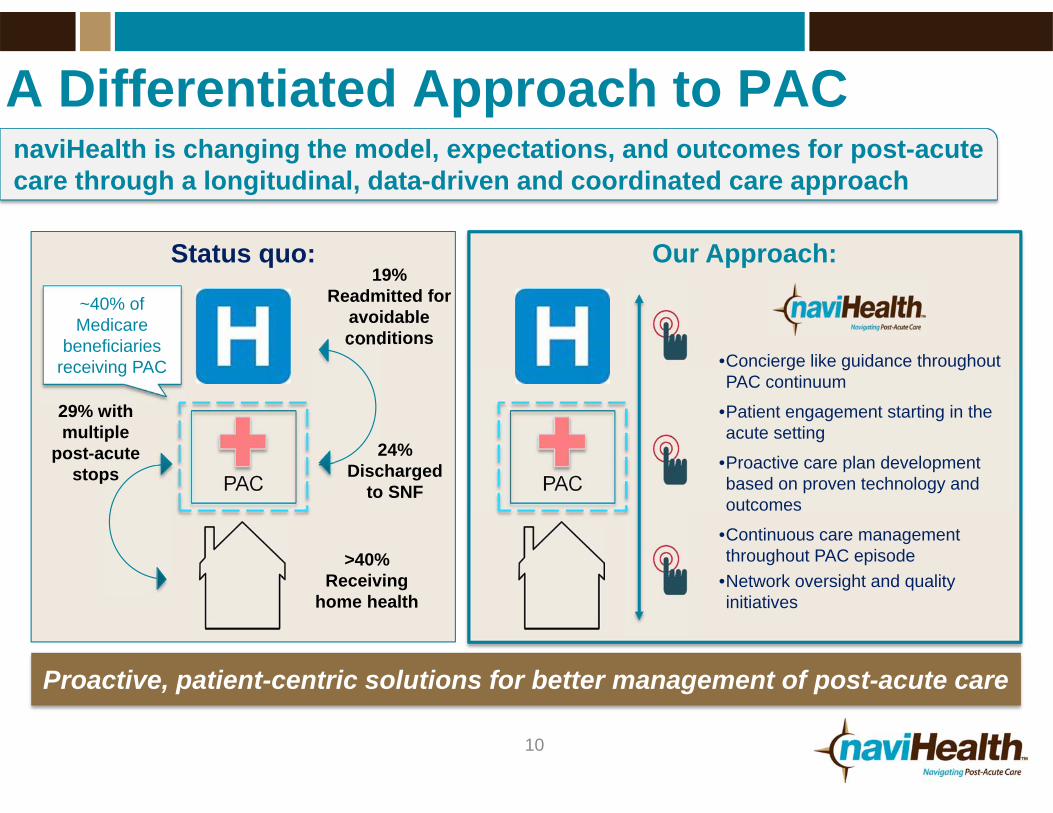
A Differentiated Approach to PACnaviHealth is changing the model, expectations, and outcomes for post-acute care through a longitudinal, data-driven and coordinated care approach
PAC
19% Readmitted for
avoidable conditions
24% Discharged
to SNF
~40% of Medicare
beneficiaries receiving PAC
29% with multiple
post-acute stops
Status quo:
>40% Receiving
home health
PAC
Our Approach:
•Concierge like guidance throughout PAC continuum
•Patient engagement starting in the acute setting
•Proactive care plan development based on proven technology and outcomes
•Continuous care management throughout PAC episode
•Network oversight and quality initiatives
Proactive, patient-centric solutions for better management of post-acute care
11
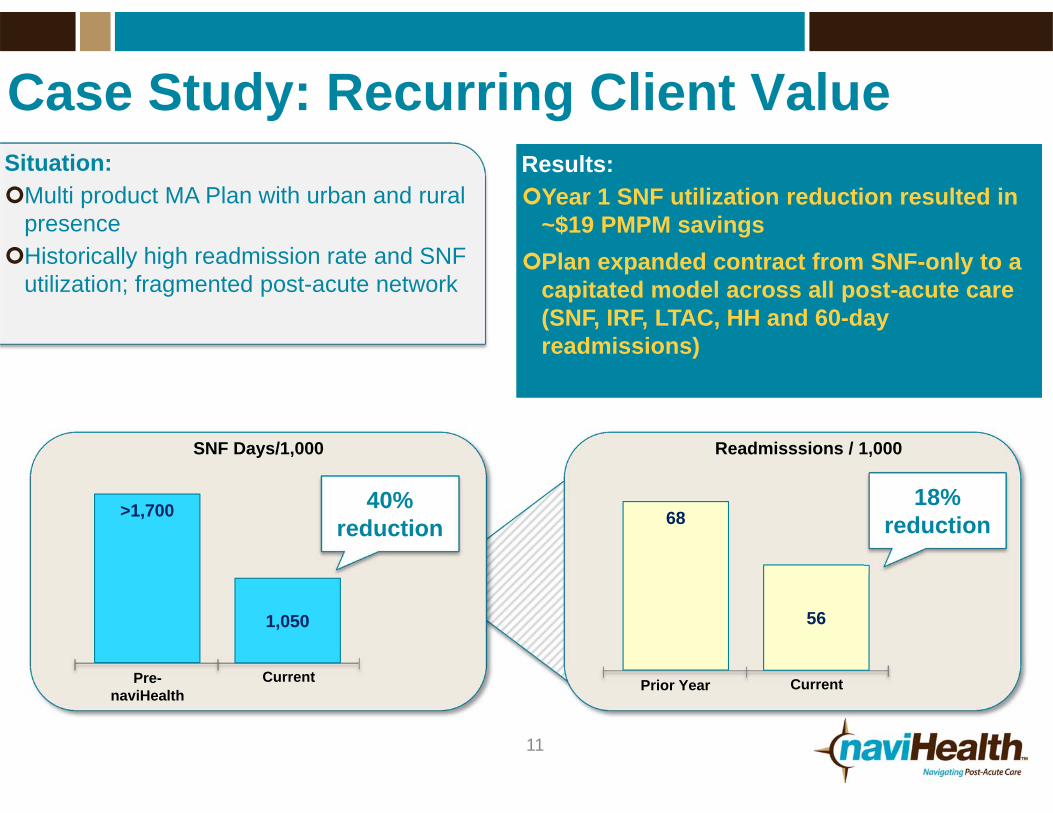
Case Study: Recurring Client ValueSituation:Multi product MA Plan with urban and rural
presenceHistorically high readmission rate and SNF
utilization; fragmented post-acute network
Results:Year 1 SNF utilization reduction resulted in
~$19 PMPM savingsPlan expanded contract from SNF-only to a
capitated model across all post-acute care (SNF, IRF, LTAC, HH and 60-day readmissions)
SNF Days/1,000
40% reduction
Readmisssions / 1,000
68
56
Prior Year Current
>1,700
1,050
Pre-naviHealth
Current
18% reduction
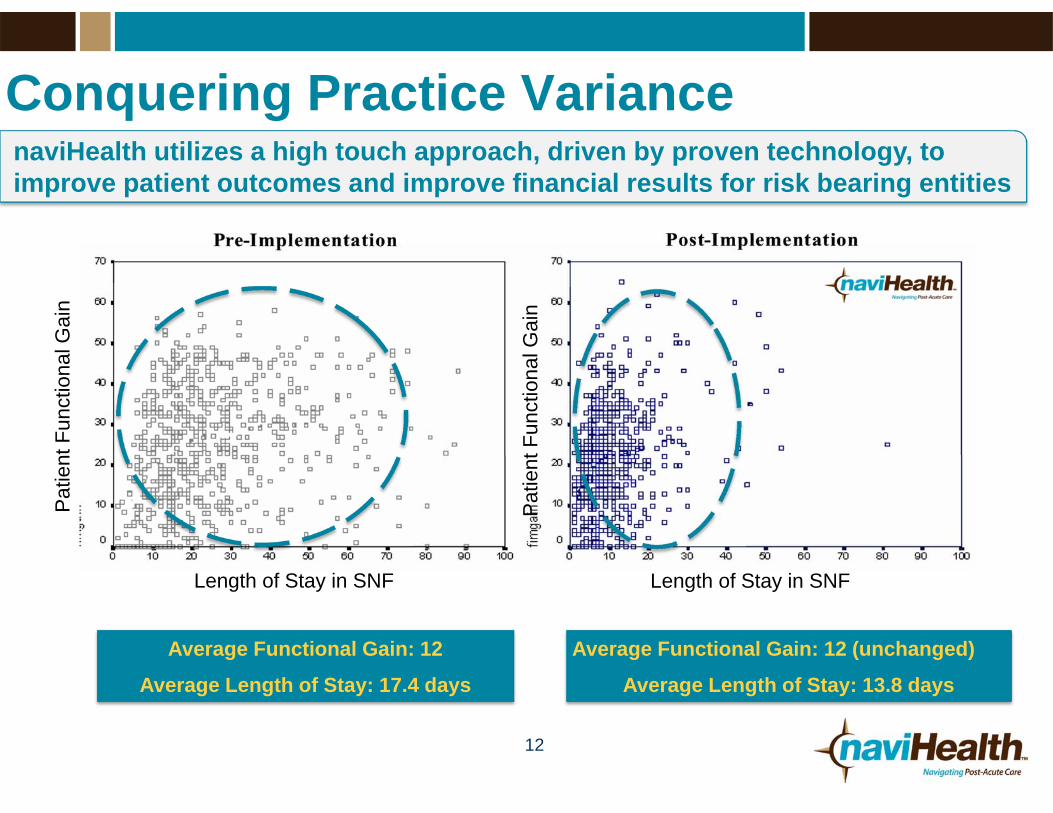
Conquering Practice Variance
12
Average Functional Gain: 12
Average Length of Stay: 17.4 days
Average Functional Gain: 12 (unchanged)
Average Length of Stay: 13.8 days
naviHealth utilizes a high touch approach, driven by proven technology, to improve patient outcomes and improve financial results for risk bearing entities
Length of Stay in SNF Length of Stay in SNF
Pat
ient
Fun
ctio
nal G
ain
Pat
ient
Fun
ctio
nal G
ain
13
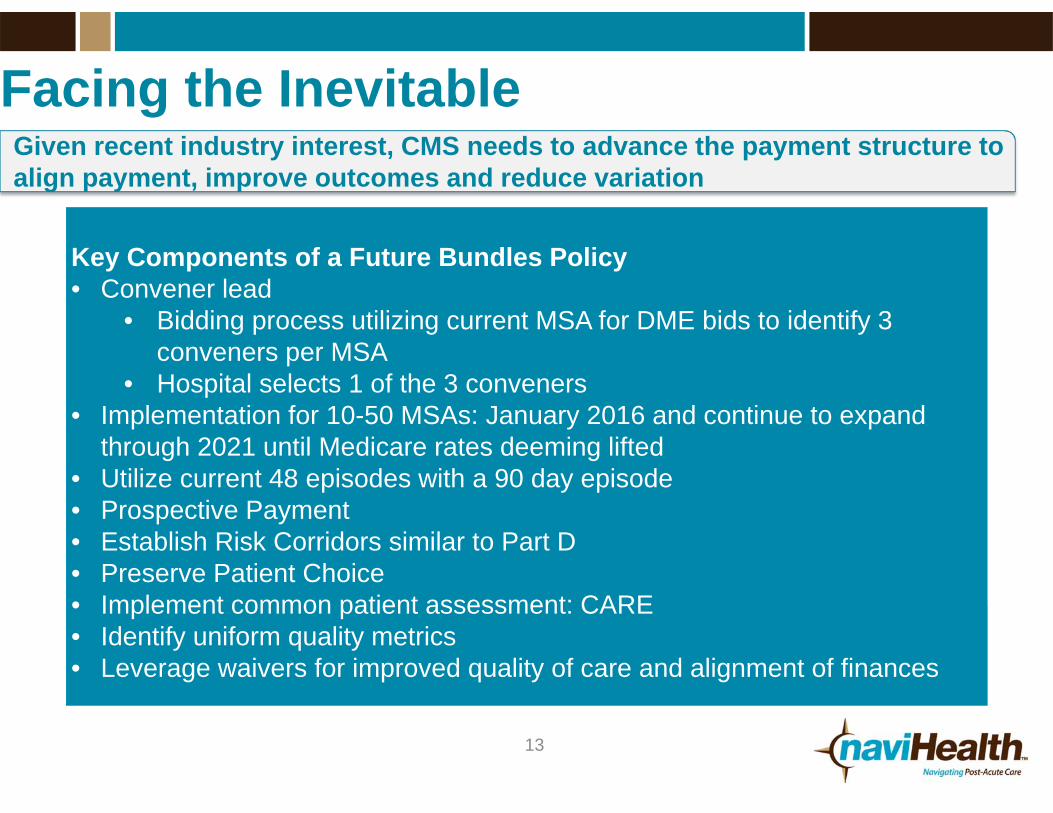
Facing the InevitableGiven recent industry interest, CMS needs to advance the payment structure to align payment, improve outcomes and reduce variation
Key Components of a Future Bundles Policy• Convener lead
• Bidding process utilizing current MSA for DME bids to identify 3 conveners per MSA
• Hospital selects 1 of the 3 conveners• Implementation for 10-50 MSAs: January 2016 and continue to expand
through 2021 until Medicare rates deeming lifted• Utilize current 48 episodes with a 90 day episode • Prospective Payment• Establish Risk Corridors similar to Part D• Preserve Patient Choice• Implement common patient assessment: CARE• Identify uniform quality metrics• Leverage waivers for improved quality of care and alignment of finances
14
naviHealth: Key Takeaways• Increasing senior population paired with
increasing post-acute demand
• CMS, providers and health plans increasingly seeking risk partners to manage post-acute spend
• Differentiated in market approach empowered by leading post-acute analytics platform
• Proven outcomes from over a decade of experience
• Operating at scale today - currently serving over 1.5 million Medicare beneficiaries in 17 states