Embed Size (px)
Citation preview
This article was downloaded by: [University of Guelph]On: 06 November 2014, At: 00:00Publisher: Taylor & FrancisInforma Ltd Registered in England and Wales Registered Number: 1072954 Registeredoffice: Mortimer House, 37-41 Mortimer Street, London W1T 3JH, UK
Journal of Biopharmaceutical StatisticsPublication details, including instructions for authors andsubscription information:http://www.tandfonline.com/loi/lbps20
Innovative Approaches for Designing andAnalyzing Adaptive Dose-Ranging TrialsBjörn Bornkamp a , Frank Bretz b , Alex Dmitrienko c , Greg Enas c ,Brenda Gaydos c , Chyi-Hung Hsu d , Franz König e , Michael Krams f
, Qing Liu g , Beat Neuenschwander b , Tom Parke h , José Pinheiro i ,Amit Roy j , Rick Sax k & Frank Shen ja University of Dortmund , Dortmund, Germanyb Novartis Pharma AG , Basel, Switzerlandc Eli Lilly and Company , Indianapolis, Indiana, USAd Pfizer Inc. , New York, New York, USAe Medical Univ. of Vienna , Vienna, Austriaf Wyeth Research , Collegeville, Pennsylvania, USAg Johnson & Johnson PRD , Raritan, New Jersey, USAh Tessella Support Services , Abingdon, UKi Novartis Pharmaceuticals Corporation , East Hanover, New Jersey,USAj Bristol-Myers Squibb Company , Princeton, New Jersey, USAk AstraZeneca , Wilmington, Deleware, USAPublished online: 14 Nov 2007.
To cite this article: Björn Bornkamp , Frank Bretz , Alex Dmitrienko , Greg Enas , Brenda Gaydos ,Chyi-Hung Hsu , Franz König , Michael Krams , Qing Liu , Beat Neuenschwander , Tom Parke ,José Pinheiro , Amit Roy , Rick Sax & Frank Shen (2007) Innovative Approaches for Designing andAnalyzing Adaptive Dose-Ranging Trials, Journal of Biopharmaceutical Statistics, 17:6, 965-995, DOI:10.1080/10543400701643848
To link to this article: http://dx.doi.org/10.1080/10543400701643848
PLEASE SCROLL DOWN FOR ARTICLE
Taylor & Francis makes every effort to ensure the accuracy of all the information (the“Content”) contained in the publications on our platform. However, Taylor & Francis,our agents, and our licensors make no representations or warranties whatsoever as tothe accuracy, completeness, or suitability for any purpose of the Content. Any opinionsand views expressed in this publication are the opinions and views of the authors,and are not the views of or endorsed by Taylor & Francis. The accuracy of the Content

should not be relied upon and should be independently verified with primary sourcesof information. Taylor and Francis shall not be liable for any losses, actions, claims,proceedings, demands, costs, expenses, damages, and other liabilities whatsoever orhowsoever caused arising directly or indirectly in connection with, in relation to or arisingout of the use of the Content.
This article may be used for research, teaching, and private study purposes. Anysubstantial or systematic reproduction, redistribution, reselling, loan, sub-licensing,systematic supply, or distribution in any form to anyone is expressly forbidden. Terms &Conditions of access and use can be found at http://www.tandfonline.com/page/terms-and-conditions
Dow
nloa
ded
by [
Uni
vers
ity o
f G
uelp
h] a
t 00:
00 0
6 N
ovem
ber
2014
Journal of Biopharmaceutical Statistics, 17: 965–995, 2007Copyright © Taylor & Francis Group, LLCISSN: 1054-3406 print/1520-5711 onlineDOI: 10.1080/10543400701643848
INNOVATIVE APPROACHES FOR DESIGNINGAND ANALYZING ADAPTIVE DOSE-RANGING TRIALS
Björn BornkampUniversity of Dortmund, Dortmund, Germany
Frank BretzNovartis Pharma AG, Basel, Switzerland
Alex DmitrienkoEli Lilly and Company, Indianapolis, Indiana, USA
Greg EnasEli Lilly and Company, Indianapolis, Indiana, USA
Brenda GaydosEli Lilly and Company, Indianapolis, Indiana, USA
Chyi-Hung HsuPfizer Inc., New York, New York, USA
Franz KönigMedical Univ. of Vienna, Vienna, Austria
Michael KramsWyeth Research, Collegeville, Pennsylvania, USA
Qing LiuJohnson & Johnson PRD, Raritan, New Jersey, USA
Beat NeuenschwanderNovartis Pharma AG, Basel, Switzerland
Tom ParkeTessella Support Services, Abingdon, UK
José PinheiroNovartis Pharmaceuticals Corporation, East Hanover, New Jersey, USA
Received March 6, 2007; Accepted June 14, 2007Address correspondence to José Pinheiro, Novartis Pharmaceuticals Corporation, One Health
Plaza, East Hanover, NJ 07936, USA; E-mail: [email protected]
965
Dow
nloa
ded
by [
Uni
vers
ity o
f G
uelp
h] a
t 00:
00 0
6 N
ovem
ber
2014
966 BORNKAMP ET AL.
Amit RoyBristol-Myers Squibb Company, Princeton, New Jersey, USA
Rick SaxAstraZeneca, Wilmington, Deleware, USA
Frank ShenBristol-Myers Squibb Company, Princeton, New Jersey, USA
Inadequate selection of the dose to bring forward in confirmatory trials has beenidentified as one of the key drivers of the decreasing success rates observed indrug development programs across the pharmaceutical industry. In recognitionof this problem, the Pharmaceutical Research and Manufacturers of America(PhRMA), formed a working group to evaluate and develop alternativeapproaches to dose finding, including adaptive dose-ranging designs. This papersummarizes the work of the group, including the results and conclusions of acomprehensive simulation study, and puts forward recommendations on how toimprove dose ranging in clinical development, including, but not limited to, theuse of adaptive dose-ranging methods.
Key words: Dose-finding; Dose-response; Flexible designs; Modeling; Phase II trials; Proofof concept; Target dose.
1. BACKGROUND
In the spring of 2005, the Pharmaceutical Innovation Steering Committee(PISC) of PhRMA formed several working groups to look into different driversof the decreasing success rates observed in drug development programs across thepharmaceutical industry, identified in a previous survey conducted by a consultinggroup. Among those was the Adaptive Dose-Ranging Designs (initially calledRolling Dose Studies) working group. The objectives of this group are to developnew and evaluate existing adaptive dose-ranging methods, and to produce policyrecommendations for regulatory agencies on their use in clinical drug development.This paper summarizes the work of the group, including the results and conclusionsof a comprehensive simulation study, and puts forward recommendations on howto improve dose ranging in clinical development, including, but not limited to, theuse of adaptive dose-ranging methods.
2. INTRODUCTION
Selection of a dose (or doses) to carry into confirmatory Phase III trials isamong the most difficult decisions that need to be made during drug development.Although the exact numbers are not known, it is thought that the high attrition ratewhich continues to plague the pharmaceutical industry in Phase III studies may,in part, be due to inadequate dose selection—doses that are too low to achieveadequate benefit, as well as doses that are too high and lead to dose-related adverseevents in the population. There is also evidence that, even after registration, dose-adjustments in the label continue to be required with some frequency.
Dow
nloa
ded
by [
Uni
vers
ity o
f G
uelp
h] a
t 00:
00 0
6 N
ovem
ber
2014
DESIGNING AND ANALYZING ADAPTIVE DOSE-RANGING TRIALS 967
Until recently, the process of dose selection in a clinical program tended tofollow a “traditional” pattern: When a new candidate drug was first studied in man,single ascending doses were used, followed by multiple ascending doses in healthyvolunteers. The goal was to empirically establish both a “no effect” dose and a dosewhere subjects began to experience “symptom-limiting” adverse events (a “maximumtolerated dose”). This was followed by empiric testing of doses in small predefinedpatient cohorts, looking both for differences in the pharmacokinetic profile inpatients (compared to healthy volunteers) and evidence that the drug had an effecton the disease being studied, often called a proof-of-concept (PoC) study. Inevitably,a point would come in the development of the drug where a critical decision had tobe made as to gathering more safety and efficacy data related to dosing in a largerpatient cohort (“Phase IIb study”), or taking the plunge into a “development forlaunch (Phase III)” program to register the drug. At times, only a small amount ofclinically-derived scientific data are available to justify the dose selection..
As we move into an era in which drug development is guided increasingly bythe availability of biomarkers and modeling-and-simulation activities (from animaldata to humans, from biomarkers to disease state and from disease state to clinicaloutcome), dosing decisions can be guided by the availability of prior information.This changes the paradigm of dose selection from one based on a purely empiricapproach (“try a dose and let’s see what happens”) to an approach that is basedmore on verification of a derived model. The availability of “prior” information alsoallows one to prospectively specify adaptations to take place during a dose-rangingtrial; such prespecified adaptations allow modifications to the original study designas dose-response information accrues. This is known as adaptive dose-ranging andis the subject of this paper.
Adaptive dose-ranging can have a number of objectives. For example, it canbe used to establish the overall dose-response relationship for an efficacy parameter,estimate the therapeutic window and help with the selection of a single target dose(e.g., a dose that delivers a prescribed level of efficacy and is adequately safe).Other applications of adaptive dose-ranging designs might be related to specificindications; for example, an oncology study might use an adaptive approach to finda maximum tolerated dose.
Adaptive dose-ranging approaches can encompass a variety of designmodifications, including adding doses, dropping doses, changing sample sizes,and unbalanced randomization (randomizing more patients to doses of interest),prespecified in the study protocol to occur as information accrues during the courseof the trial. Adaptations to the analysis of dose-response data can also be performedeven if fixed randomization schedules are used, again based on information thatbecomes available during the course of a study. Use of such adaptations couldsubstantially enhance the efficiency and effectiveness of dose-selection in clinicalprograms—increasing the amount of information available to allow for goodselection decisions, while decreasing the time and cost of running these studies.
In addition to adaptive dose-ranging being used to address a number ofdifferent objectives and encompassing a number of different approaches, thereare also a number of different statistical methodologies that have recently beendeveloped to allow adaptations to take place without compromising the statisticalintegrity of the trial (e.g., preserving the Type I error rate). This paper exploressome of these statistical strategies and attempts to assess the performance of these
Dow
nloa
ded
by [
Uni
vers
ity o
f G
uelp
h] a
t 00:
00 0
6 N
ovem
ber
2014

968 BORNKAMP ET AL.
approaches. A variety of methodologies are considered, from more traditionalfrequentist approaches to flexible Bayesian approaches. Using a common formatand set of parameters across all approaches (prespecified scenarios for doseselection; the context and parameters are described in Section 4), the strengths andweaknesses of each method are explored via a comprehensive simulation study, notonly with respect to the robustness of information obtained, but also the ability ofthe approach to learn from the data and adapt to emerging trends. In doing so, thispaper provides insight into understanding which adaptive dose-ranging strategiesmight be most useful for establishing the presence of dose-response, estimating thedose-response relationship, and selecting a target dose.
Since the focus of this paper is on statistical methodologies for adaptive dose-ranging, general considerations on the use of adaptive designs are not discussedhere. A thorough discussion of these can be found in the special issues of theBiometrical Journal (Vol. 48, No. 4, 2006) and the Drug Information Journal (Vol. 40,No. 4, 2006). Still, certain assumptions are worth mentioning. First, the scenariosand methods considered in this paper are purely for dose-ranging purposes; thus,regulatory concerns often associated with adaptive trials in the confirmatory setting(Phase III) are less of an issue. Nevertheless, to ensure the validity of the trialresults, there has to be an implicit assumption that demographic and other relevantcharacteristics of the patients enrolled in the study remain relatively constant overtime. Second, it is assumed that the efficacy response being measured is available ina sufficiently rapid time frame (relative to the enrollment period and the durationof the study) to allow for meaningful adaptations to occur (the scenarios describedin this paper involve a visual analogue scale measurement of neuropathic pain at a6 week period). Lastly, it is assumed that the transmission of relevant informationto the data analysis group is sufficiently rapid (e.g., instant data capture andtransmittal) to allow adaptations to occur according to the prescribed methodology.These considerations are pre-requisites for any adaptive dose-ranging study and thusmust be taken into consideration before embarking on any such program.
The rest of the paper is organized as follows. The dose-ranging methodsutilized in the simulation study are described in Section 3. Section 4 is dedicated tothe simulation study itself, describing the different scenarios and assumptions usedand presenting key summary results. Logistical and regulatory considerations arediscussed in Section 5, with the working group’s recommendations being presentedin Section 6.
3. STATISTICAL METHODOLOGY
This section provides an overview of traditional and adaptive approaches todesigning and analyzing dose-ranging studies. Two classes of adaptive procedureswill be described below. The first class includes methods that enable clinical trialsresearchers to modify certain elements of the study design based on the datacollected in the trial. For example, based on the review of interim safety andtolerability data, the trial’s sponsor can decide to drop one or more doses or reducethe number of patients assigned to these doses. This adaptation can be performed ina continuous manner, i.e., the design can be updated prior to the enrolment of eachnew patient. Alternatively, one can consider group-sequential adaptive strategies
Dow
nloa
ded
by [
Uni
vers
ity o
f G
uelp
h] a
t 00:
00 0
6 N
ovem
ber
2014
DESIGNING AND ANALYZING ADAPTIVE DOSE-RANGING TRIALS 969
and perform design modifications based on responses from cohorts of patients.This class of methods will be termed the design-focused adaptive approaches.
The other class of approaches (analysis-focused adaptive approaches) relies ona fixed study design, that is, no design modifications are performed during thestudy. In this case, the trial’s sponsor focuses on selecting the most appropriatedata analysis method. The choice of the “best” method is adaptive in the sense thatit is driven by the data collected in the trial. To illustrate this approach, considerthe case when the sponsor examines the data to find a model for the dose-responserelationship that improves their ability to detect the dose-related drug effect andcharacterize the dose-response function.
In each of the two classes of approaches, adaptation is aimed at optimizingthe assessment of the dose-response relationship and narrowing down the set ofdoses from which to select the estimated target dose, for example, by identifying thedoses that provide a prespecified level of improvement. The statistical approachesintroduced in the section are listed below.
• Traditional approach (ANOVA): This approach relies on the classical analysis ofvariance (ANOVA) methods. The data analysis procedures are prespecified andno adaptive elements are employed within the traditional framework.
• Design-focused adaptive approaches:
– General adaptive dose allocation approach (GADA) utilizes Bayesian modeling toidentify an appropriate dose for each new patient based on partial and completeresponses from the previously enrolled patients (design modifications are carriedout in a continuous manner).
– D-optimal response-adaptive approach (Dopt) relies on the D-optimality criterionto select the patient allocation scheme that provides most information about thedose-response relationship given in the interim data. The method is applied in agroup-sequential manner.
• Analysis-focused adaptive approaches:
– Multiple comparison procedures–modeling approach (MCP-Mod) combines ele-ments of multiple testing and modeling to select an appropriate dose-responsemodel and subsequently estimate the target dose.
– Bayesian model-averaging approach (BMA) utilizes Bayesian methods to produceweights used to combine information obtained from a set of prespecified dose-response models.
– Multiple trend test approach (MTT) utilizes three sigmoid Emax models to describea range of possible dose-response curves and improve the clinical researchers’ability to identify a target dose.
– Nonparametric dose-response modeling approach (LOCFIT) relies on nonpara-metric regression methods, based on local polynomials (LOESS), to allow greaterflexibility in the estimation of the dose response.
3.1. Traditional Approach (ANOVA)
The traditional ANOVA approach uses contrast statistics comparing the doselevels (e.g., differences between active doses and placebo) to determine the existence
Dow
nloa
ded
by [
Uni
vers
ity o
f G
uelp
h] a
t 00:
00 0
6 N
ovem
ber
2014
970 BORNKAMP ET AL.
of a dose-response (PoC) and, if so, to select a target dose. Multiplicity adjustments(e.g., Dunnett, 1955) are typically used to preserve the family-wise Type I error rateassociated with the contrast tests. These methods can optionally be combined withpost hoc modeling of the dose-response and with strategies for incorporating clinicalrelevance in dose selection.
The particular ANOVA approach used in the simulation study described inSection 4 consists of an initial one-sided Dunnett multiple comparison procedureto test each of the active doses against placebo. If at least one of the dosesis statistically significant (under Dunnett’s multiplicity adjustment), dose-responseis established. The target dose is then estimated as the smallest statisticallysignificant dose which has an average effect that is clinically relevant (accordingto a prespecified value of clinical relevance), provided at least one dose meet bothcriteria. If a target dose can be estimated, the final step of the approach consistsin estimating a dose-response model. Three candidate dose-response models (linear,quadratic, and logistic) are fitted to the data and the Akaike Information Criterion(AIC) is used to select the best model, which is then used for predictions, etc.
3.2. Bayesian Adaptive Dose Allocation Approach (GADA)
This design-focused adaptive approach relies on Bayesian dose-responsemodeling and employs a decision theoretic framework to determine the mostinformative dose to administer to each new subject (Berry et al., 2002). This methodgeneralizes the approach implemented in the ASTIN trial (Krams et al., 2003), aPhase II study in stroke patients.
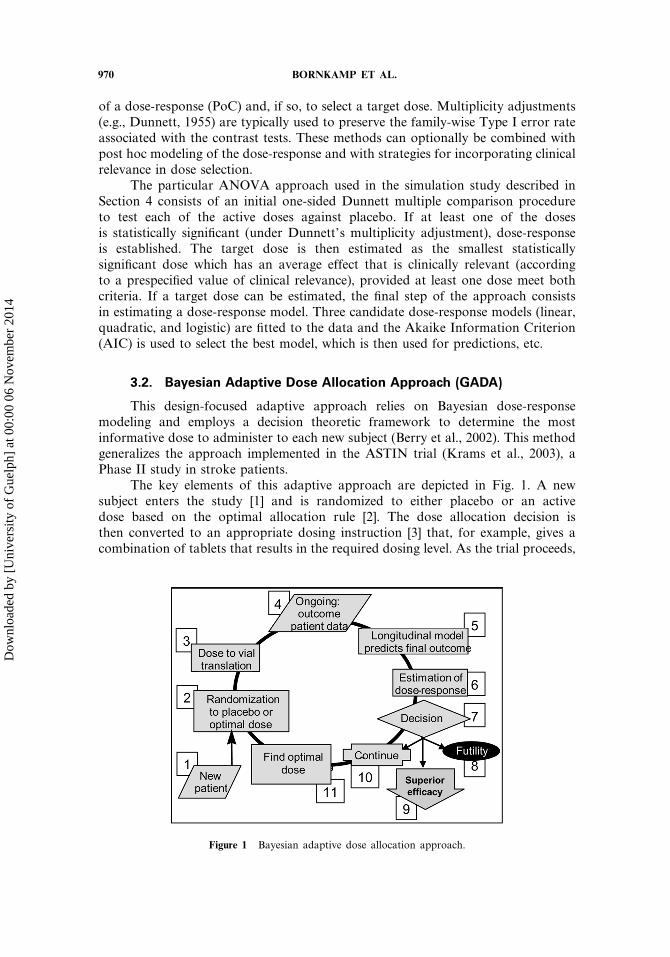
The key elements of this adaptive approach are depicted in Fig. 1. A newsubject enters the study [1] and is randomized to either placebo or an activedose based on the optimal allocation rule [2]. The dose allocation decision isthen converted to an appropriate dosing instruction [3] that, for example, gives acombination of tablets that results in the required dosing level. As the trial proceeds,
Figure 1 Bayesian adaptive dose allocation approach.
Dow
nloa
ded
by [
Uni
vers
ity o
f G
uelp
h] a
t 00:
00 0
6 N
ovem
ber
2014
DESIGNING AND ANALYZING ADAPTIVE DOSE-RANGING TRIALS 971
interim and final results from subjects are gathered and sent to the central system(as soon as they are available) in addition to CRF data [4]. Subjects with interimresults but as yet no final results can have final results imputed by a longitudinalmodel [5] (this facility was disabled in the simulation study described in Section 4).The final (and imputed) results are then used to update the estimated dose responsemodel [6]. Based on the posterior probability of the response at the target dose (e.g.,ED95 or the dose with a clinically relevant response), a decision [7] is made whetherto stop the trial for futility [8], superior efficacy [9] or continue with the dose findingstage [10]. The optimal dose for the next subject is chosen by simulating the effectsof randomizing the next subject to each of the possible doses and finding the onethat minimizes the variance of a parameter of interest (typically this is the variancein the response at the target dose).
The outlined dose allocation method uses the normal dynamic linear model(NDLM) (West and Harrison, 1997) to model the dose-response curve, combinedwith a conventional Gamma distribution model for the inter-subject variance. TheNDLM provides a non-parametric, non-monotonic model for smoothing the dose-response function that can be updated analytically. A non-informative prior is usedfor the dose-response relationship. Key characteristics of the adaptive design (e.g.,Type I and Type II error rates) are estimated by simulation.
3.3. D-Optimal Response-Adaptive Approach (Dopt)
In the context of design-focused adaptive approaches, clinical trial researchersare frequently interested in updating patient allocation to the active doses andplacebo in order to improve the estimation of various aspects of the dose-responserelationship. This includes estimation of a single target dose (e.g., a dose thatdelivers a prespecified level of efficacy such as ED90), estimation of the therapeuticwindow (efficacious doses with an acceptable safety profile) or the entire dose-response curve.
The D-optimal approach focuses on minimizing the variance of modelparameters describing the dose-response function, including the baseline effect,slope, and maximum effect. In order to implement this method, one needs to choosea rich family of models (e.g., a logistic model with a polynomial trend) that canprovide a good fit to dose-response curves likely to be encountered in a particularsetting (both monotone and non-monotone). Given this family of models, the D-optimal patient allocation algorithm is easy to apply in a group sequential manner(patients are enrolled in groups and an interim analysis is performed after eachgroup has completed the study) as described below.
The first cohort of patients is randomized to the active doses and placebousing any prespecified patient allocation scheme, e.g., equal allocation. At the firstinterim look, a sigmoid or other appropriate (non-linear) model is fitted to thedata to estimate the dose-response curve. Based on the obtained model, a patientallocation scheme that maximizes the amount of information about the overall dose-response relationship is found. In most cases, it is reasonable to keep the proportionof patients assigned to placebo constant throughout the study to facilitate the dose-placebo comparisons.
Patients in the second cohort are randomly allocated to the active doses andplacebo according to the derived optimal allocation scheme and, at the second
Dow
nloa
ded
by [
Uni
vers
ity o
f G
uelp
h] a
t 00:
00 0
6 N
ovem
ber
2014
972 BORNKAMP ET AL.
interim look, a model is fitted to the data to update the estimate of the dose-responsefunction. The computed dose-response function is again utilized to define an optimalallocation scheme for the next cohort. This process is repeated until the total samplesize is reached or a prespecified futility rule is met.
At the end of the study, the estimation of the dose-response relationship aswell as optimal dose selection can be performed using pre-determined or data-drivenmethods. Due to the response-adaptive nature of the described approach, the finalanalysis of the dose-response relationship will be more informative than the analysisperformed in the traditional fixed-design setting.
3.4. Multiple Comparison-Modeling Approach (MCP-Mod)
Multiple comparison procedures (MCP) and modeling techniques havetraditionally been the two main approaches used to design and analyze dose-rangingstudies in drug development. Bretz et al. (2005) proposed a hybrid methodology(termed the multiple comparison-modeling or MCP-Mod approach) which combinesaspects of MCP and modeling into a unified strategy for dose-ranging studies.
This methodology allows both the statistical testing of evidence of dose-response (PoC), as well as the estimation of target doses to be used in confirmatorystudies. Instead of prespecifying a single dose-response model, the MCP-Modapproach uses a set of candidate models covering a suitable range of dose-responseshapes. Each of the models in the candidate set is assessed using appropriatelydefined contrast tests and employing MCP techniques to preserve the family-wiseerror rate (FWER). PoC is established when at least one of the model contrast testsis significant. Otherwise, the procedure stops and concludes that there is no sufficientevidence of a dose-response relationship in the study.
After PoC has been established, the best model is selected from the statisticallysignificant models in the candidate set. The selection of the best model can bebased on the minimum p-value of the test statistics or some other relevant modelselection criteria such as the AIC or the Bayesian Information Criterion (BIC). Theselected dose-response model is then employed to estimate target doses using inverseregression techniques and typically incorporating information on clinically relevanteffects. The precision of the estimated doses can be assessed using, for example,bootstrap methods.
The MCP-Mod method combines the advantages of multiple comparisons andmodeling. The first step provides robustness to model misspecification and placesthe associated statistical uncertainty in a hypothesis testing context, while the secondstep (dose-response modeling) provides greater flexibility and efficiency in estimatingtarget doses.
3.5. Bayesian Model-Averaging Approach (BMA)
The Bayesian approach to dose ranging in clinical trials has a modelingand a decision-making component. The former necessitates a flexible class ofdose-response models (parametric or nonparametric), whereas the latter relies ondecisions that are based on appropriate inferential summaries and can be eitherinformal (posterior- and/or predictive-based) or formal, i.e., fully decision-analyticusing utilities. Dose-response modeling can be done in various ways, ranging from
Dow
nloa
ded
by [
Uni
vers
ity o
f G
uelp
h] a
t 00:
00 0
6 N
ovem
ber
2014
DESIGNING AND ANALYZING ADAPTIVE DOSE-RANGING TRIALS 973
simple models with a small number of parameters (typical for small Phase I trials)to high-dimensional or non-parametric models. Bayesian model averaging is anintermediate strategy that tries to avoid the dangers of under- or over-fitting:the basis is a set of relatively simple dose-response models with correspondingparameters. Then, starting from prior model probabilities (“weights”), as well asprior distributions on the model-specific parameters, standard Bayesian inferenceleads to posterior updates of the unknown quantities (model weights and modelparameters). The former are usually more difficult to obtain even with the helpof the Markov chain-Monte Carlo (MCMC) approach. Therefore, in the case ofnon-informative priors, the updates are often approximated by the BIC. Bayesianmodel averaging is conceptually straightforward and can be seen as a specialcase of a hierarchical model. The approach is well-suited for situations where thequantity of interest is model-independent, such as in dose-ranging studies where theobjective is to find a dose fulfilling a certain prespecified criterion. Bayesian modelaveraging generalizes model selection strategies and has the advantage of weightingthe candidate models in an appropriate (data-dependent) way.
A simple informal Bayesian model averaging approach based on a set ofnormal linear models allowing for analytic posterior updates is used in this paper.This choice was mainly dictated by the fact that MCMC-based posterior inferencesfor non-conjugate models would have made simulations computationally infeasible.The approach is informal in that it only uses posterior summaries as a basis fordose selections. Depending on the situation at hand and available external input, theapproach can be tailored accordingly by selecting a more appropriate model basis,including prior information, and extending dose selection to a fully decision-orientedframework.
3.6. Multiple Trend Test Approach (MTT)
To reflect most dose-response curves one would encounter in dose-rangingstudies, it is sensible to select, from a class of sigmoid Emax models, two dose-response (upper and lower) curves that capture a range of likely dose-responsecurves. A dose-response curve in the middle of the range is also selected from theclass of Emax models so that, for a given sample size, the power of the resultingtriple-trend test is minimized. The sample size is chosen to achieve prespecifiedminimum power, for example, 95%. This yields a procedure with robust power fora broad spectrum of underlying dose-response curves.
For the given class of Emax models, the parameters, and the associated dose-response curve, are estimated by maximum likelihood. For an estimated curve,a reverse calculation yields an estimate of the target dose, which is the dosecorresponding to a target effect size. However, a target dose is not an underlyingcharacteristic of the model, and therefore, it may not be identifiable for a givenestimated dose-response curve.
The outlined approach extends the work of Tukey et al. (1985) and Capizziet al. (1992). Tukey et al. (1985) introduced three-trend tests for carcinogenicityand toxicology animal studies without a multiplicity adjustment and Capizzi et al.(1992) proposed to use three-trend tests for efficacy analysis, where correlationsbetween three trend test statistics are explicitly incorporated to control the Type Ierror rate.
Dow
nloa
ded
by [
Uni
vers
ity o
f G
uelp
h] a
t 00:
00 0
6 N
ovem
ber
2014
974 BORNKAMP ET AL.
3.7. Non-Parametric Dose-Response Modeling Approach (LOCFIT)
This method relies on model-free testing techniques to assess a possible dose-response effect. Non-parametric regression techniques are used for target doseestimation as they can model virtually any smooth dose-response shape without theneed to prespecify a parametric dose-response model.
The dose-response effect is assessed using a multiple contrast test. To cover abroad range of potential dose response shapes, the method relies on five contrasttests capturing the concave, convex, sigmoid, linear, and umbrella model shapes(see Stewart and Ruberg, 2000 for more information on multiple contrast tests).
For the dose estimation step we utilized local quadratic regression techniques(Loader, 1999) using a Gaussian kernel and a global bandwidth. The bandwidth wasselected by minimizing the generalized cross-validation score. The locfit package inR was used for the implementation of the procedure.
4. SIMULATION STUDY TO EVALUATE PERFORMANCE OF METHODS
One of the key goals of the Adaptive Dose-ranging Studies working groupis to provide an assessment of the relative performance of the traditional andnovel dose-ranging methods described in Section 3, leading to recommendations ontheir use in practice. To allow a direct quantitative comparison of the describedmethods, under the same conditions and using the same performance metrics, acomprehensive simulation study, motivated by a real dose-ranging application andcovering a wide range of practical scenarios, was undertaken. This section describesthe design of this simulation study, including its assumptions and scenarios; theperformance metrics used to evaluate different statistical operational characteristicsof each method; and a graphical summary of the statistical performance of themethods, based on the simulation results.
To give practical motivation, a neuropathic pain dose-ranging study was usedto provide context for the simulation study. However, the assumptions and scenariosconsidered in the simulations, as well as the performance metrics used to summarizethe results, are quite general, allowing the extension of results and conclusions to awide range of trials. In fact, we could have used any indication having dose-rangingtrials with a normally distributed response and independent treatment groups, suchas Type 2 diabetes (HbA1c endpoint), high blood pressure, dyslipidemia (LDLcholesterol endpoint), oncology (tumor size endpoint), etc. We expect the mainconclusions of the simulation study to remain valid, at least qualitatively, to othertypes of response variables (e.g., binary, time-to-event) and designs (e.g., cross-overstudies).
4.1. Design of Simulation Study
In total, 36 different scenarios were used in the simulations, correspondingto different combinations of dose designs (3), dose-response profiles (6), and totalsample size (2).
4.1.1. Primary endpoint, distributional assumptions, and clinicallyrelevant effect. Following common practice in neuropathic pain studies, the
Dow
nloa
ded
by [
Uni
vers
ity o
f G
uelp
h] a
t 00:
00 0
6 N
ovem
ber
2014
DESIGNING AND ANALYZING ADAPTIVE DOSE-RANGING TRIALS 975
primary endpoint is the change from baseline at 6 weeks in a visual analog scale(VAS) of pain. The VAS takes values between 0 (no pain) and 10 (highest pain) on acontinuous scale and, for the purpose of the simulation, it is assumed to be normallydistributed. Weekly VAS measurements are collected in each patient until the endof follow up, at 6 weeks. The between-patient standard deviation is set to 2.5 unitsand the within-patient standard deviation at 1.5 units. For simplicity, it is assumedthat no patients drop out of the study. Letting VASk denote the VAS measurementat the kth Week, k = 0� 1� � � � � 6 and with k = 0 representing baseline, the primaryendpoint is defined as y = VAS6 − VAS0. From the assumptions above, y is normallydistributed with variance �2 = 2× 1�52 = 4�5. Negative values of y give indicationof efficacy in reducing the neuropathic pain. The clinically relevant effect is set toetarg = −1�3 units (i.e., an average reduction of at least 1.3 units from baseline).
4.1.2. Dose design scenarios. It is assumed that up to nine equally spaceddoses can be utilized in the trial: 0� 1� � � � � 8 (note that these are not indices, but theactual dose values). Three different dose designs are considered in the simulations,to investigate the impact of number and spacing of doses on the performance of themethods:
• Five equally spaced doses: 0, 2, 4, 6, and 8.• Seven unequally spaced doses: 0, 2, 3, 4, 5, 6, 8.• All nine equally spaced doses: 0� 1� � � � � 8.
The scenarios above list the set of available study doses; the subset of doses actuallyutilized by a given method will depend on its specific characteristics and procedures.
4.1.3. Dose-response profiles. A total of six different dose-responseprofiles were used to simulate the primary endpoint, allowing the evaluation of themethods under a wide range of scenarios likely to be observed in clinical practice.A flat model was also included to evaluate the Type I error rate. In all models, theplacebo effect was set to 0 points and, with the exception of the logistic model, themaximum effect within the observed dose range was set to −1�65 units.
• Flat: y = �.• Linear: y = −�1�65/8�d + �.• Logistic: y = 0�015− 1�73/�1+ exp�1�2�4− d�+ �.• Umbrella: y = −�1�65/3�d + �1�65/36�d2 + �.• Emax: y = −1�81d/�0�79+ d�+ �.• Sigmoid Emax: y = −1�70d5/�45 + d5�+ �.
The error terms � are assumed to be independently normally distributed with meanzero and variance 4.5. Figure 2 presents the corresponding dose-response profiles.
The dose response profiles in Fig. 2 cover the most common DR shapesobserved in dose-ranging studies. It is clear from Fig. 2 that the dose responseprofiles corresponding to the logistic and sigmoid Emax models are very similar. Asa consequence, the simulation results for the two models are quite similar and wewill include only the logistic model summaries.
Dow
nloa
ded
by [
Uni
vers
ity o
f G
uelp
h] a
t 00:
00 0
6 N
ovem
ber
2014

976 BORNKAMP ET AL.
Figure 2 Dose-response profiles used in simulation.
4.1.4. Sample size and number of simulated trials. Two maximum totalsample sizes are used in the simulations: 150 and 250 patients. These values areconsistent with sample sizes commonly used in neuropathic pain Phase II trials.The total sample size N corresponds to the sum of the number of patients assignedto each dose. For example, under equal treatment allocation and with N = 250, a5-dose design assigns 50 patients to each dose and a 9-dose design, about 28. Notethat design-focused adaptive methods which have flexible treatment allocation rules,such as GADA and Dopt described in Section 3, will likely use different samplesizes per dose. The sample size N refers always to the maximum number of patientsthat can be used in the trial.
To adequately estimate the statistical operational characteristics of the variousmethods, a minimum of 5,000 simulated trials are used for each of the scenariosconsidered. For some of the less computationally intensive methods (e.g., MCP-Modand ANOVA), 10,000 simulated trials per scenario are used.
4.1.5. Number of adaptations and accrual period. These are onlyrelevant for design-focused adaptive methods, and the latter only for methods usingcalendar data information (e.g., GADA). The number of adaptations is method-specific and so no restrictions are placed on it. For simplicity, only one accrualperiod is used in the simulations: 16 weeks, corresponding to relatively fast accrualfor a neuropathic pain indication.
Dow
nloa
ded
by [
Uni
vers
ity o
f G
uelp
h] a
t 00:
00 0
6 N
ovem
ber
2014

DESIGNING AND ANALYZING ADAPTIVE DOSE-RANGING TRIALS 977
4.2. Measuring Performance of Methods
The main goal of a Phase II program should be to ensure efficient learning ofthe dose-response profile to allow accurate and timely decision making with regardto moving into the confirmatory stage. To make the problem more concrete andeasier to quantify, for the purpose of the simulation study the following specificgoals were identified:
• Detecting DR: evaluate if there is evidence of activity associated with the drug,represented by a change in clinical response resulting from a change in dose(PoC);
• Identifying clinical relevance: if PoC is established, determine if a predefinedclinically relevant response can be obtained within the observed dose range;
• Selecting a target dose: when the previous goal is met, select the dose to bebrought into the confirmatory phase, the so-called target dose;
• Estimating the dose response: finally, estimate the dose-response profile within theobserved dose range.
Performance metrics to quantify each of these goals are described below.
4.2.1. Detecting DR. Each of the methods described in Section 3 includesa decision rule to determine whether the data provides sufficient evidence of doseresponse (DR) activity. This can be a simple hypothesis test (e.g., ANOVA), ora Bayesian rule utilizing the posterior distribution of the model parameters (e.g.,GADA). The probability of identifying the presence of dose response, Pr(DR),estimated as the percentage of simulated trials in which the decision rule concludedfor DR activity, is used as the summary metric for this objective. Under a flat doseresponse (DR) model, Pr(DR) gives the Type I error rate and, under active dose-response profiles, it gives the power to make the correct identification of DR. Toallow adequate comparisons, a nominal Type I error rate of 5% was specified forall methods.
4.2.2. Identifying clinical relevance. Pr(DR) is based on the statisticalevidence of a non-flat dose-response profile. It is, of course, possible to concludethat DR is present, but, nevertheless, that none of the observed doses is capable ofproducing at least the clinically relevant effect. All methods described in Section 3implement decision rules for identifying clinical relevance within the dose range ofthe trial. The corresponding probability, Pr�dose�, estimated as the percentage ofsimulated trials in which PoC was established and a dose with a clinically relevanteffect was chosen, is used to summarize the performance of the methods with regardto this objective. By definition, Pr�dose� ≤ Pr�DR�. No nominal levels under the flatDR model are specified for Pr�dose�.
4.2.3. Selecting a target dose. In practice, the selection of the dose tobring into the confirmatory phase is based on a plurality of factors, including,but not restricted to, efficacy and safety outcomes in the Phase II trial(s). For thepurpose of the simulation study, we simplify the problem and consider only a targetefficacy result (the clinically relevant effect) to determine the dose to be selected.In this context, the target dose dt arg is defined as the smallest dose which produces
Dow
nloa
ded
by [
Uni
vers
ity o
f G
uelp
h] a
t 00:
00 0
6 N
ovem
ber
2014
978 BORNKAMP ET AL.
an effect greater than, or equal to, the clinically relevant target effect et arg. Eventhough not explicit in the notation, it should be clear that dt arg varies with theunderlying DR model. So does the impact of deviations from dt arg on the expectedclinical effect. For example, in a DR model with a steep slope around dt arg, smalldeviations from the target dose could result in large deviations from the target effect.On the other hand, models with a shallow slope around dt arg would be considerablyless sensitive to deviations around the target dose. To account for this, we considertarget effect intervals Iet arg��� = et arg ± � et arg (that is, being within ±100 �% of thetarget effect) and their corresponding target dose intervals Idt arg���.
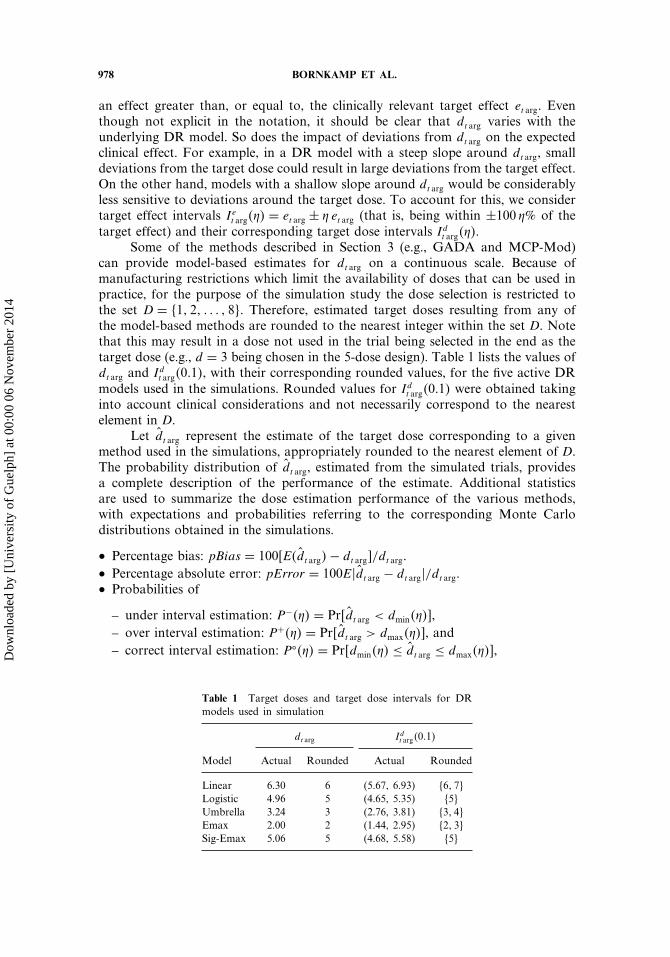
Some of the methods described in Section 3 (e.g., GADA and MCP-Mod)can provide model-based estimates for dt arg on a continuous scale. Because ofmanufacturing restrictions which limit the availability of doses that can be used inpractice, for the purpose of the simulation study the dose selection is restricted tothe set D = �1� 2� � � � � 8. Therefore, estimated target doses resulting from any ofthe model-based methods are rounded to the nearest integer within the set D. Notethat this may result in a dose not used in the trial being selected in the end as thetarget dose (e.g., d = 3 being chosen in the 5-dose design). Table 1 lists the values ofdt arg and Idt arg�0�1�, with their corresponding rounded values, for the five active DRmodels used in the simulations. Rounded values for Idt arg�0�1� were obtained takinginto account clinical considerations and not necessarily correspond to the nearestelement in D.
Let d̂t arg represent the estimate of the target dose corresponding to a givenmethod used in the simulations, appropriately rounded to the nearest element of D.The probability distribution of d̂t arg, estimated from the simulated trials, providesa complete description of the performance of the estimate. Additional statisticsare used to summarize the dose estimation performance of the various methods,with expectations and probabilities referring to the corresponding Monte Carlodistributions obtained in the simulations.
• Percentage bias: pBias = 100�E�d̂t arg�− dt arg/dt arg.• Percentage absolute error: pError = 100E�d̂t arg − dt arg�/dt arg.• Probabilities of
– under interval estimation: P−��� = Pr�d̂t arg < dmin���,– over interval estimation: P+��� = Pr�d̂t arg > dmax���, and– correct interval estimation: P���� = Pr�dmin��� ≤ d̂t arg ≤ dmax���,
Table 1 Target doses and target dose intervals for DRmodels used in simulation
dt arg Idt arg�0�1�
Model Actual Rounded Actual Rounded
Linear 6.30 6 (5.67, 6.93) �6� 7Logistic 4.96 5 (4.65, 5.35) �5Umbrella 3.24 3 (2.76, 3.81) �3� 4Emax 2.00 2 (1.44, 2.95) �2� 3Sig-Emax 5.06 5 (4.68, 5.58) �5
Dow
nloa
ded
by [
Uni
vers
ity o
f G
uelp
h] a
t 00:
00 0
6 N
ovem
ber
2014
DESIGNING AND ANALYZING ADAPTIVE DOSE-RANGING TRIALS 979
where dmin��� and dmax��� denote the endpoints of the target interval Idt arg���,appropriately rounded to an element of D.
4.2.4. Estimating the dose response. Proper estimation of the DR profileis relevant not only for the purpose of estimating target doses, but also for theappropriate labeling after approval. The average absolute prediction error (APE),calculated at the available doses (including placebo), is used as an overall measureof performance for DR estimation. Letting ��d� denote the expected dose responseat dose d and �̂�d� its prediction based on the estimated dose-response model,we define APE = 1/9
∑8d=0 E��̂�d�− ��d��. To make the summary statistic non-
dimensional and interpretable as a percentage, we consider the percent APE (pAPE),defined as the percent value of APE relative to the (absolute) target effect, thatis pAPE = 100APE/�et arg� (the absolute target effect does not provide an upperbound on the APE, so pAPE can take values greater than 100%). Quantiles of theprediction errors at each dose level (i.e., �̂�d�− ��d�� are also used in Section 4.3 tosummarize the DR prediction performance of the various methods.
4.3. Simulation Results
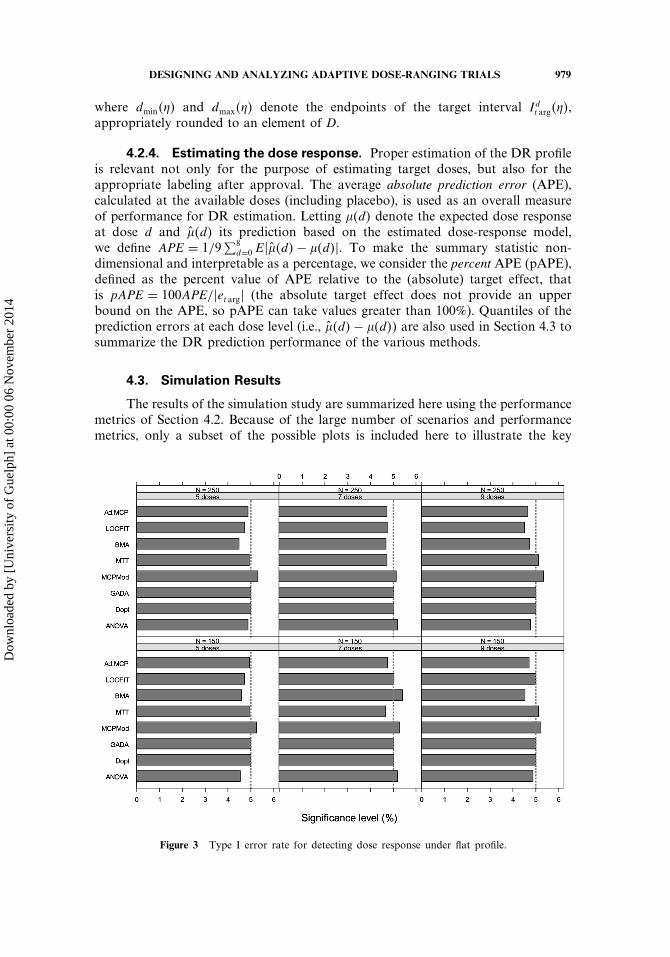
The results of the simulation study are summarized here using the performancemetrics of Section 4.2. Because of the large number of scenarios and performancemetrics, only a subset of the possible plots is included here to illustrate the key
Figure 3 Type I error rate for detecting dose response under flat profile.
Dow
nloa
ded
by [
Uni
vers
ity o
f G
uelp
h] a
t 00:
00 0
6 N
ovem
ber
2014
980 BORNKAMP ET AL.
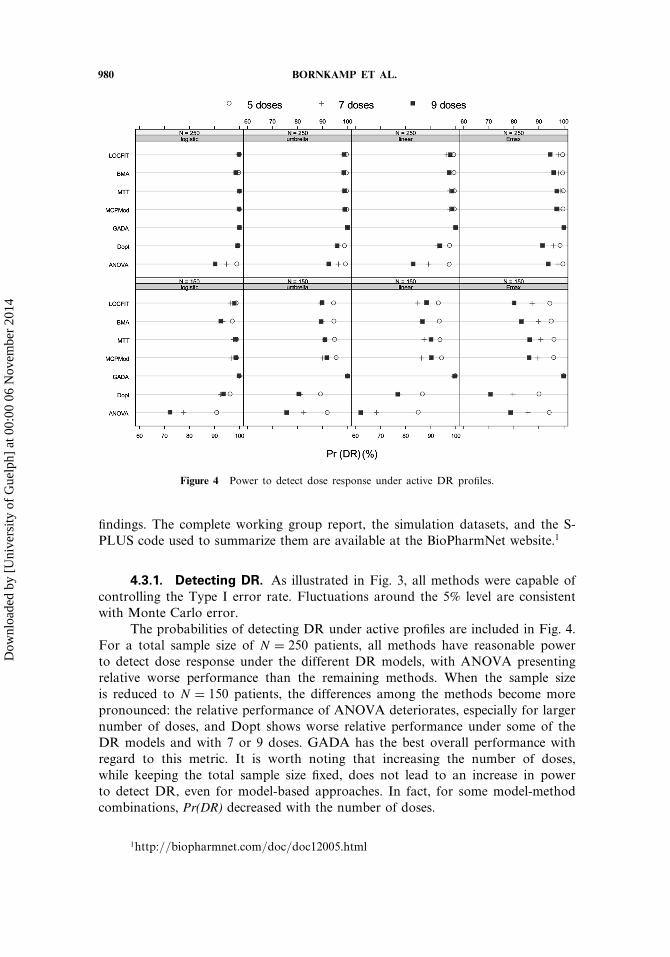
Figure 4 Power to detect dose response under active DR profiles.
findings. The complete working group report, the simulation datasets, and the S-PLUS code used to summarize them are available at the BioPharmNet website.1
4.3.1. Detecting DR. As illustrated in Fig. 3, all methods were capable ofcontrolling the Type I error rate. Fluctuations around the 5% level are consistentwith Monte Carlo error.
The probabilities of detecting DR under active profiles are included in Fig. 4.For a total sample size of N = 250 patients, all methods have reasonable powerto detect dose response under the different DR models, with ANOVA presentingrelative worse performance than the remaining methods. When the sample sizeis reduced to N = 150 patients, the differences among the methods become morepronounced: the relative performance of ANOVA deteriorates, especially for largernumber of doses, and Dopt shows worse relative performance under some of theDR models and with 7 or 9 doses. GADA has the best overall performance withregard to this metric. It is worth noting that increasing the number of doses,while keeping the total sample size fixed, does not lead to an increase in powerto detect DR, even for model-based approaches. In fact, for some model-methodcombinations, Pr(DR) decreased with the number of doses.
1http://biopharmnet.com/doc/doc12005.html
Dow
nloa
ded
by [
Uni
vers
ity o
f G
uelp
h] a
t 00:
00 0
6 N
ovem
ber
2014
DESIGNING AND ANALYZING ADAPTIVE DOSE-RANGING TRIALS 981
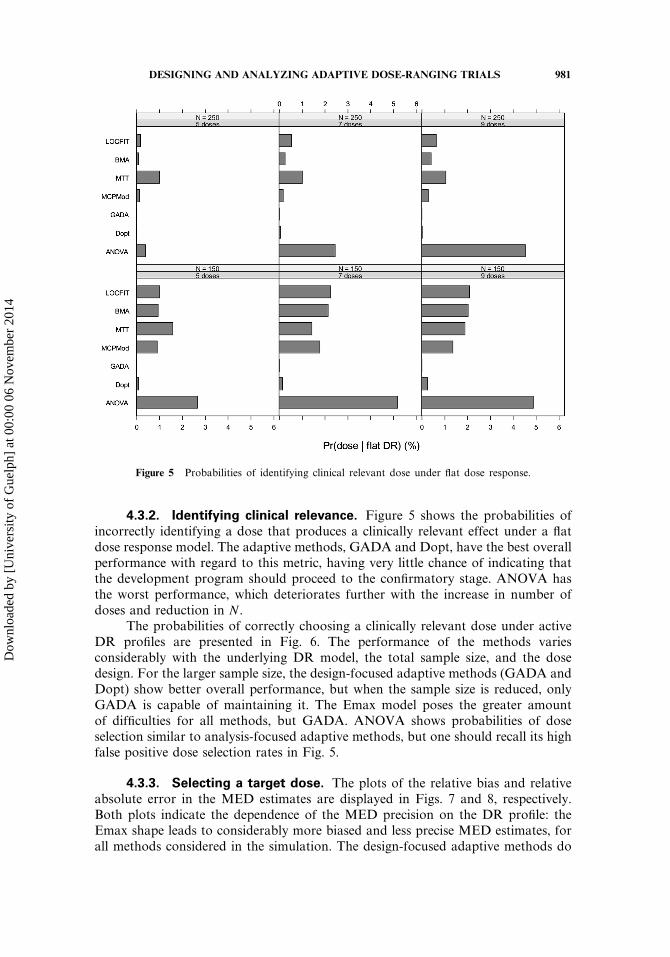
Figure 5 Probabilities of identifying clinical relevant dose under flat dose response.
4.3.2. Identifying clinical relevance. Figure 5 shows the probabilities ofincorrectly identifying a dose that produces a clinically relevant effect under a flatdose response model. The adaptive methods, GADA and Dopt, have the best overallperformance with regard to this metric, having very little chance of indicating thatthe development program should proceed to the confirmatory stage. ANOVA hasthe worst performance, which deteriorates further with the increase in number ofdoses and reduction in N .
The probabilities of correctly choosing a clinically relevant dose under activeDR profiles are presented in Fig. 6. The performance of the methods variesconsiderably with the underlying DR model, the total sample size, and the dosedesign. For the larger sample size, the design-focused adaptive methods (GADA andDopt) show better overall performance, but when the sample size is reduced, onlyGADA is capable of maintaining it. The Emax model poses the greater amountof difficulties for all methods, but GADA. ANOVA shows probabilities of doseselection similar to analysis-focused adaptive methods, but one should recall its highfalse positive dose selection rates in Fig. 5.
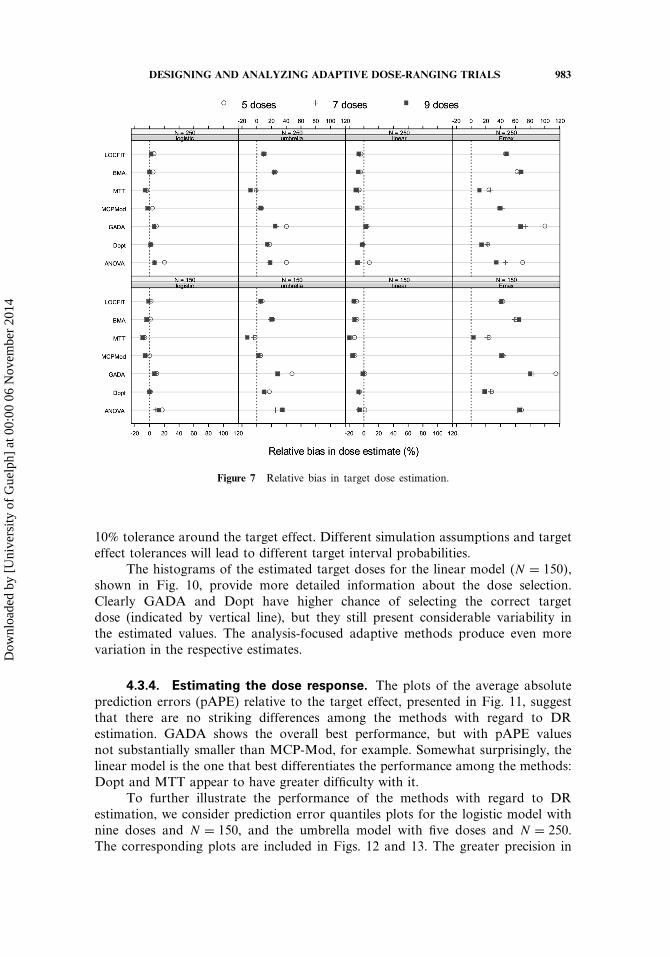
4.3.3. Selecting a target dose. The plots of the relative bias and relativeabsolute error in the MED estimates are displayed in Figs. 7 and 8, respectively.Both plots indicate the dependence of the MED precision on the DR profile: theEmax shape leads to considerably more biased and less precise MED estimates, forall methods considered in the simulation. The design-focused adaptive methods do
Dow
nloa
ded
by [
Uni
vers
ity o
f G
uelp
h] a
t 00:
00 0
6 N
ovem
ber
2014
982 BORNKAMP ET AL.
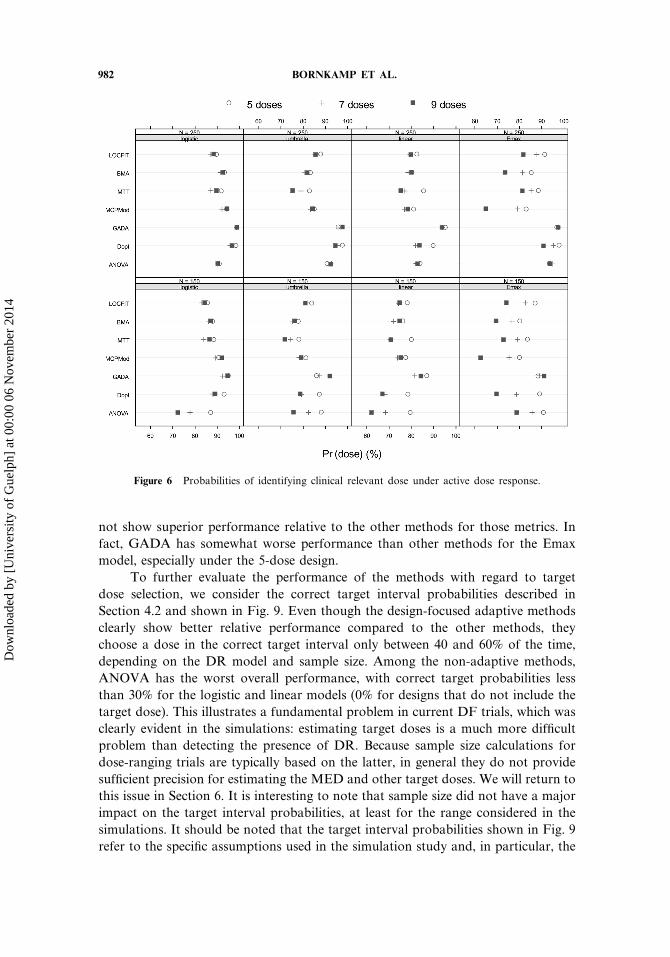
Figure 6 Probabilities of identifying clinical relevant dose under active dose response.
not show superior performance relative to the other methods for those metrics. Infact, GADA has somewhat worse performance than other methods for the Emaxmodel, especially under the 5-dose design.
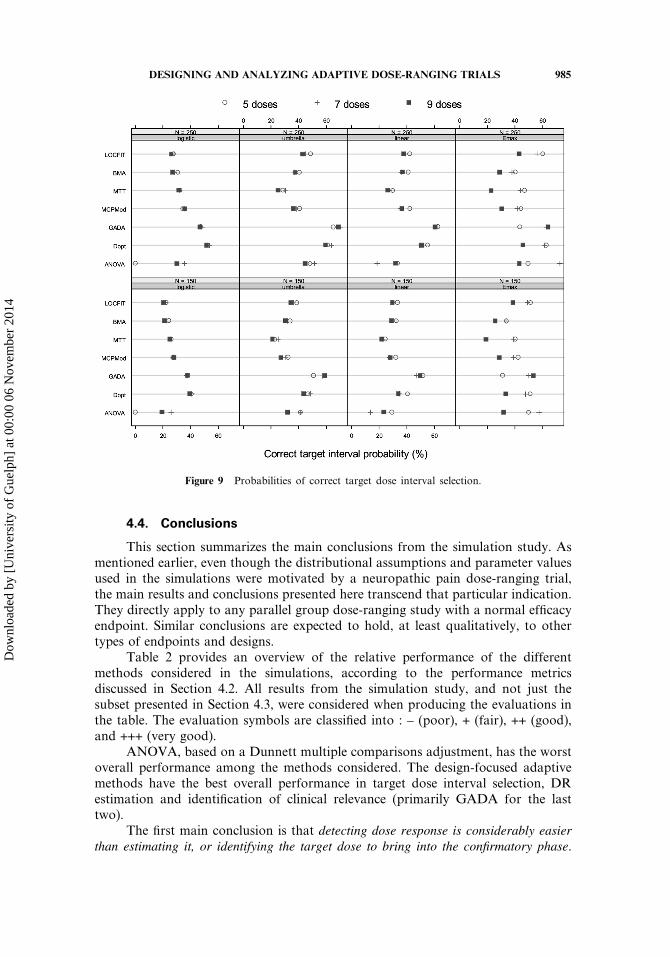
To further evaluate the performance of the methods with regard to targetdose selection, we consider the correct target interval probabilities described inSection 4.2 and shown in Fig. 9. Even though the design-focused adaptive methodsclearly show better relative performance compared to the other methods, theychoose a dose in the correct target interval only between 40 and 60% of the time,depending on the DR model and sample size. Among the non-adaptive methods,ANOVA has the worst overall performance, with correct target probabilities lessthan 30% for the logistic and linear models (0% for designs that do not include thetarget dose). This illustrates a fundamental problem in current DF trials, which wasclearly evident in the simulations: estimating target doses is a much more difficultproblem than detecting the presence of DR. Because sample size calculations fordose-ranging trials are typically based on the latter, in general they do not providesufficient precision for estimating the MED and other target doses. We will return tothis issue in Section 6. It is interesting to note that sample size did not have a majorimpact on the target interval probabilities, at least for the range considered in thesimulations. It should be noted that the target interval probabilities shown in Fig. 9refer to the specific assumptions used in the simulation study and, in particular, the
Dow
nloa
ded
by [
Uni
vers
ity o
f G
uelp
h] a
t 00:
00 0
6 N
ovem
ber
2014
DESIGNING AND ANALYZING ADAPTIVE DOSE-RANGING TRIALS 983
Figure 7 Relative bias in target dose estimation.
10% tolerance around the target effect. Different simulation assumptions and targeteffect tolerances will lead to different target interval probabilities.
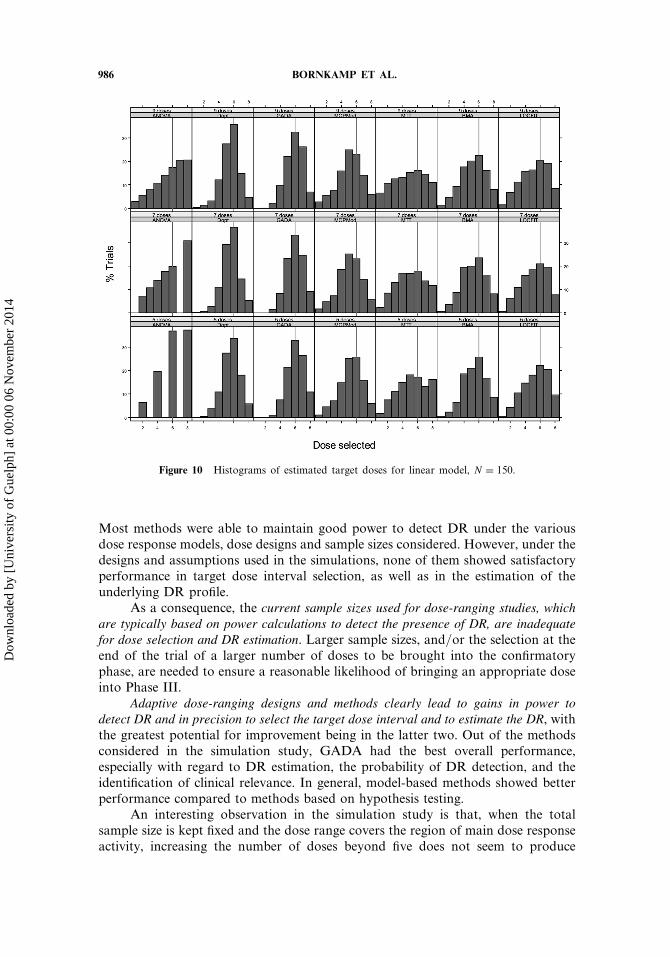
The histograms of the estimated target doses for the linear model �N = 150�,shown in Fig. 10, provide more detailed information about the dose selection.Clearly GADA and Dopt have higher chance of selecting the correct targetdose (indicated by vertical line), but they still present considerable variability inthe estimated values. The analysis-focused adaptive methods produce even morevariation in the respective estimates.
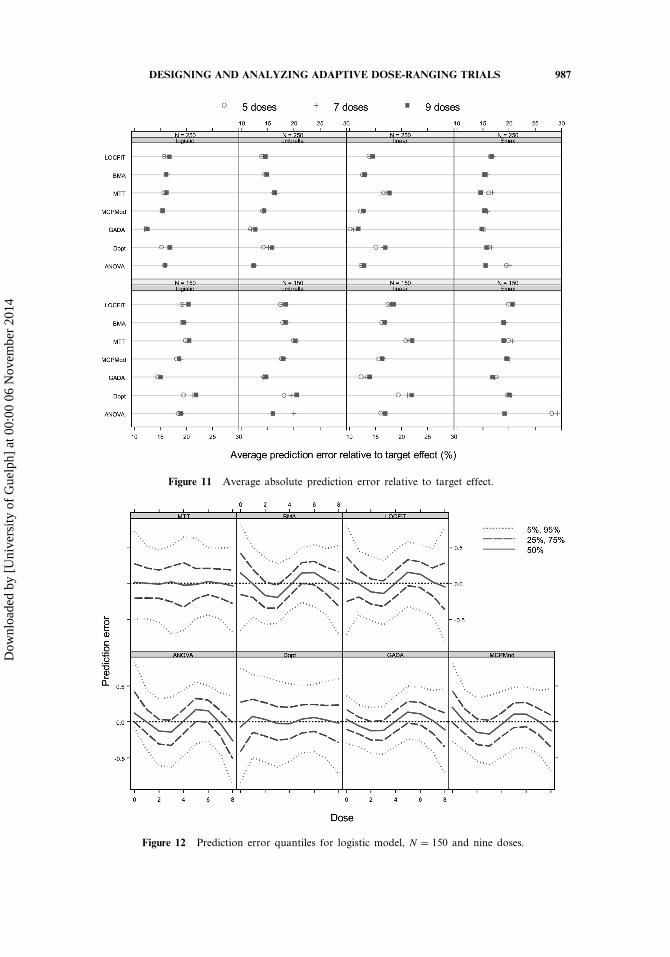
4.3.4. Estimating the dose response. The plots of the average absoluteprediction errors (pAPE) relative to the target effect, presented in Fig. 11, suggestthat there are no striking differences among the methods with regard to DRestimation. GADA shows the overall best performance, but with pAPE valuesnot substantially smaller than MCP-Mod, for example. Somewhat surprisingly, thelinear model is the one that best differentiates the performance among the methods:Dopt and MTT appear to have greater difficulty with it.
To further illustrate the performance of the methods with regard to DRestimation, we consider prediction error quantiles plots for the logistic model withnine doses and N = 150, and the umbrella model with five doses and N = 250.The corresponding plots are included in Figs. 12 and 13. The greater precision in
Dow
nloa
ded
by [
Uni
vers
ity o
f G
uelp
h] a
t 00:
00 0
6 N
ovem
ber
2014
984 BORNKAMP ET AL.
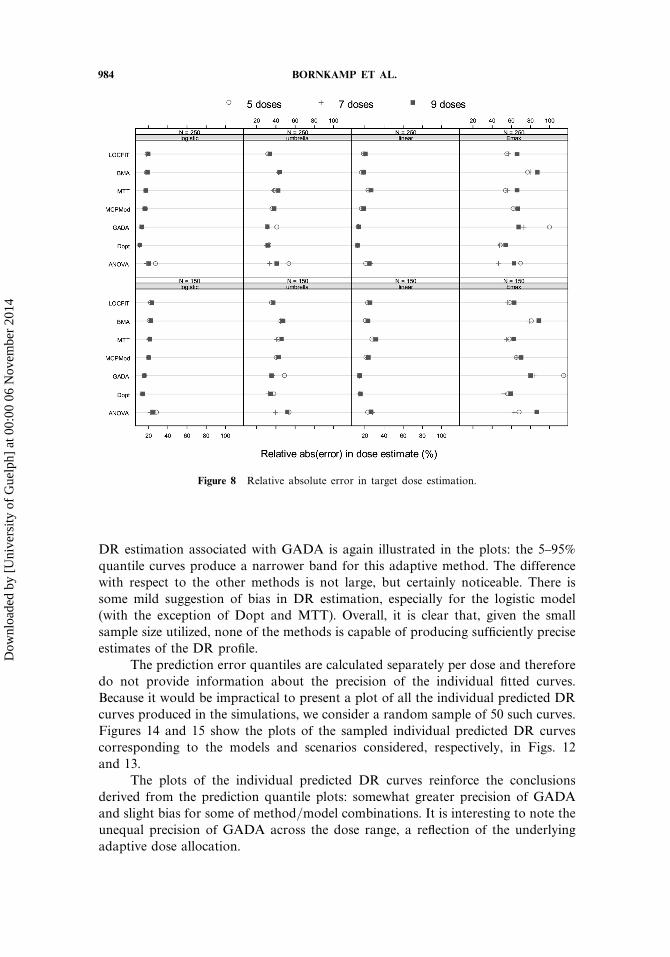
Figure 8 Relative absolute error in target dose estimation.
DR estimation associated with GADA is again illustrated in the plots: the 5–95%quantile curves produce a narrower band for this adaptive method. The differencewith respect to the other methods is not large, but certainly noticeable. There issome mild suggestion of bias in DR estimation, especially for the logistic model(with the exception of Dopt and MTT). Overall, it is clear that, given the smallsample size utilized, none of the methods is capable of producing sufficiently preciseestimates of the DR profile.
The prediction error quantiles are calculated separately per dose and thereforedo not provide information about the precision of the individual fitted curves.Because it would be impractical to present a plot of all the individual predicted DRcurves produced in the simulations, we consider a random sample of 50 such curves.Figures 14 and 15 show the plots of the sampled individual predicted DR curvescorresponding to the models and scenarios considered, respectively, in Figs. 12and 13.
The plots of the individual predicted DR curves reinforce the conclusionsderived from the prediction quantile plots: somewhat greater precision of GADAand slight bias for some of method/model combinations. It is interesting to note theunequal precision of GADA across the dose range, a reflection of the underlyingadaptive dose allocation.
Dow
nloa
ded
by [
Uni
vers
ity o
f G
uelp
h] a
t 00:
00 0
6 N
ovem
ber
2014
DESIGNING AND ANALYZING ADAPTIVE DOSE-RANGING TRIALS 985
Figure 9 Probabilities of correct target dose interval selection.
4.4. Conclusions
This section summarizes the main conclusions from the simulation study. Asmentioned earlier, even though the distributional assumptions and parameter valuesused in the simulations were motivated by a neuropathic pain dose-ranging trial,the main results and conclusions presented here transcend that particular indication.They directly apply to any parallel group dose-ranging study with a normal efficacyendpoint. Similar conclusions are expected to hold, at least qualitatively, to othertypes of endpoints and designs.
Table 2 provides an overview of the relative performance of the differentmethods considered in the simulations, according to the performance metricsdiscussed in Section 4.2. All results from the simulation study, and not just thesubset presented in Section 4.3, were considered when producing the evaluations inthe table. The evaluation symbols are classified into : – (poor), + (fair), ++ (good),and +++ (very good).
ANOVA, based on a Dunnett multiple comparisons adjustment, has the worstoverall performance among the methods considered. The design-focused adaptivemethods have the best overall performance in target dose interval selection, DRestimation and identification of clinical relevance (primarily GADA for the lasttwo).
The first main conclusion is that detecting dose response is considerably easierthan estimating it, or identifying the target dose to bring into the confirmatory phase.
Dow
nloa
ded
by [
Uni
vers
ity o
f G
uelp
h] a
t 00:
00 0
6 N
ovem
ber
2014
986 BORNKAMP ET AL.
Figure 10 Histograms of estimated target doses for linear model, N = 150.
Most methods were able to maintain good power to detect DR under the variousdose response models, dose designs and sample sizes considered. However, under thedesigns and assumptions used in the simulations, none of them showed satisfactoryperformance in target dose interval selection, as well as in the estimation of theunderlying DR profile.
As a consequence, the current sample sizes used for dose-ranging studies, whichare typically based on power calculations to detect the presence of DR, are inadequatefor dose selection and DR estimation. Larger sample sizes, and/or the selection at theend of the trial of a larger number of doses to be brought into the confirmatoryphase, are needed to ensure a reasonable likelihood of bringing an appropriate doseinto Phase III.
Adaptive dose-ranging designs and methods clearly lead to gains in power todetect DR and in precision to select the target dose interval and to estimate the DR, withthe greatest potential for improvement being in the latter two. Out of the methodsconsidered in the simulation study, GADA had the best overall performance,especially with regard to DR estimation, the probability of DR detection, and theidentification of clinical relevance. In general, model-based methods showed betterperformance compared to methods based on hypothesis testing.
An interesting observation in the simulation study is that, when the totalsample size is kept fixed and the dose range covers the region of main dose responseactivity, increasing the number of doses beyond five does not seem to produce
Dow
nloa
ded
by [
Uni
vers
ity o
f G
uelp
h] a
t 00:
00 0
6 N
ovem
ber
2014
DESIGNING AND ANALYZING ADAPTIVE DOSE-RANGING TRIALS 987
Figure 11 Average absolute prediction error relative to target effect.
Figure 12 Prediction error quantiles for logistic model, N = 150 and nine doses.
Dow
nloa
ded
by [
Uni
vers
ity o
f G
uelp
h] a
t 00:
00 0
6 N
ovem
ber
2014

988 BORNKAMP ET AL.
Figure 13 Prediction error quantiles for umbrella model, N = 250, and five doses.
Figure 14 Sample of 50 predicted curves for logistic model, N = 150 and nine doses.
Dow
nloa
ded
by [
Uni
vers
ity o
f G
uelp
h] a
t 00:
00 0
6 N
ovem
ber
2014

DESIGNING AND ANALYZING ADAPTIVE DOSE-RANGING TRIALS 989
Figure 15 Sample of 50 predicted curves. Umbrella model, N = 250 and five doses.
noticeable improvements in performance. In fact, for some of the methods (mostnoticeably ANOVA) performance decreased with number of doses. A possibleexplanation for this is the trade-off between the greater level of detail about the DRprofile associated with more doses and the greater precision in the estimation of themean DR at each dose associated with fewer doses.
Table 2 Overview of relative performance of methods in simulation study
Method Pr(DR) Pr(dose) Bias Error Dose† interval DR estimation
ANOVA ++ + ++ ++ – NA‡
GADA +++ +++ ++ ++ ++ +++Dopt +++ ++ +++ ++ ++ ++MTT +++ ++ +++ ++ + ++MCP-Mod +++ ++ +++ ++ + ++BMA +++ ++ +++ ++ + ++LOCFIT +++ ++ +++ ++ + ++
†Under the designs and assumptions used in the simulations, none of the methods had a satisfactoryperformance in identifying the correct dose interval for total sample sizes considered (N = 150 and250).
‡ANOVA is not model-based and does not provide direct estimates for the DR profile. Modifiedversions were used in the simulations to allow DR estimation.
Dow
nloa
ded
by [
Uni
vers
ity o
f G
uelp
h] a
t 00:
00 0
6 N
ovem
ber
2014
990 BORNKAMP ET AL.
5. LOGISTICAL AND REGULATORY CONSIDERATIONS
This section gives a brief discussion of implementation and regulatory issuesassociated with adaptive dose-ranging designs. Many of the logistical issues areshared with other adaptive designs methods, but, as discussed in Section 5.1, someare more specific to the class of adaptive designs we have considered (see Quinlanand Krams, 2006 for a more general and thorough discussion on the topic).
Because we concentrate here on designs leading into confirmatory trials, butnot with confirmatory value on their own, regulatory concerns are less of an issuethan would be, for example, in adaptive seamless Phase II/III designs (Gallo,2006). However, some regulatory considerations still apply to adaptive dose-rangingdesigns, as discussed in Section 5.2.
5.1. Logistical Considerations
The different approaches to dose-ranging studies compared in this white paperhave very different demands on the logistics of planning and running a trial.Broadly, dose-ranging methodologies can be classified into 3 types:
• Fixed: designs with pre-determined randomization strategy and single analysisat the study end, illustrated by analysis-focused methods such as ANOVA andMCP-Mod.
• Discrete adaptation: randomization can be adjusted (e.g., drop treatment arms,change treatment allocation ratios) at pre-planned interim analyses, representedby Dopt.
• Continuous adaptation: fine grain continuous adjustment of the randomization,adapting design as response data (possibly surrogates) becomes available,represented by GADA.
Planning and preparation: Fixed designs have a requirement for planning andpreparation that most pharmaceutical companies are familiar with; however whatthis working group has found is that in the statistical planning currently almost noregard is paid to determining how well a trial will perform in identifying the correctdose. To correct this, fixed designs need additional planning and preparation,including simulation of the proposed trial design over a range of scenarios in orderto characterize the design’s ability to identify the correct dose to take forward tothe next phase.
Unfortunately, off-the-shelf software does not currently exist to implementdiscrete adaptation methods in the context of dose-ranging. Usually a softwarepackage, or modules for an existing package, will be required. Discrete adaptationwill need simulation of the trial design to assess fundamental characteristics of thedesign such as alpha, power, and study size, as well as how well the correct dose isidentified.
Similarly there are no standard, packaged continuous adaptation methods,and these will inevitably require developing a software package developing.Continuous adaptation methods will require simulation to assess the proposedtrial’s characteristics and to optimize the design. These simulations are likely to beorders of magnitude more computationally intensive than those required for discreteadaptive or fixed designs.
Dow
nloa
ded
by [
Uni
vers
ity o
f G
uelp
h] a
t 00:
00 0
6 N
ovem
ber
2014
DESIGNING AND ANALYZING ADAPTIVE DOSE-RANGING TRIALS 991
Until there are packaged adaptive methods the time and cost to develop thesemethods at the trial planning stage are likely to be a significant hurdle to theiradoption.
Randomization: Fixed designs can use prespecified master randomizationlists, with drug packs pre-allocated subject id’s. Central randomization is onlyrequired where there is a desire to ensure even randomization across sub-populations of the subjects, or where drug re-supply will be necessary during thetrial because of limited supplies of the drug and/or unpredictable levels of subjectrecruitment at the centers.
Discrete adaptive designs can also use prespecified master randomization listsbut there are more reasons why central randomization would be preferred. If thedoses being tested are packaged separately they can be prerandomized. If the dosesare made up by combining packs to save potentially wasted material (e.g., dosesare made up by combining two tablets from tablets of three possible strengthsplus placebo) then central randomization will be required. When at an interimanalysis a treatment arm is dropped if using a prespecified master randomizationlist, it will mean contacting the centers and withdrawing the unused treatmentpacks for the dropped treatment arm and the centers’ behavior may not be promptor reliable. Using a central randomization system to drop a treatment arm canbe implemented immediately and correctly. Using a central randomization systemalso facilitates a greater range of options for adaptation such as adjusting theprobabilities of randomizing to an arm rather than dropping it altogether andre-instating a previously dropped arm.
Continuous adaptive designs require central randomization systems. Therandomization is continuously tuned based on the most complete response dataavailable so the randomization must assign a subject to a dose as late as possibleand must have good access to full, up to date, response data.
Data capture: Fixed designs do not require any real time data capture, onlyquick closure of the CRF database at the end of the trial, to allow timely analysisof the data.
Discrete adaptive designs face something of a quandary. One of the attractionsof the discrete adaptive design is that it can be run manually, obviating the needfor the development of a time consuming and expensive central software system.However at the times of the interim analysis it will be as necessary to have as fulland up to date response data as the continuous adaptive designs require all thetime. The less data is available the poorer the adaptation decision is likely to be.It is tempting to think that the now widely available electronic data capture (EDC)systems for collecting CRFs can supply this data, but EDCs are designed principallyto ensure the data is validated and that the system remains validated. They werenot designed for quick, incomplete, data collection during the trial, but quickcompletion at the end. Inevitably this tends to make them inflexible and somewhatcumbersome for our purpose. So without the support of a targeted response capturesystem developed specifically to support adaptation decisions, having complete dataat the interims may be hard to achieve unless the trial can be restricted to a smallnumber of well run centers, allowing the data to be gathered manually.
Dow
nloa
ded
by [
Uni
vers
ity o
f G
uelp
h] a
t 00:
00 0
6 N
ovem
ber
2014
992 BORNKAMP ET AL.
Continuous adaptive designs require good access to full, up to date, responsedata. The adaptation will only require the principal outcome for each subjecthowever (often a single number) and not the full CRF. Often interim data isrequired as well as final data – to increase the data available to the system,particularly early in the trial. It is usually advantageous to collect this dataseparately to the CRF data even though this means some duplication. However byretaining the EDC system as the principal route for capturing the full CRF data itenables the fast response system capture to be more easily modified and extendedfor each trial. This in turn means it can be modified to suit the trial and be easy andconvenient for investigators (and possibly subjects) to use. This in turn leads to ahigh level of compliance in returning the key response data required for adaptationin a timely fashion.
Adaptive dose supply: Even in fixed-design studies, if the drug supply islimited and recruitment unpredictable, an adaptive dose supply must be used to re-supply only those centers that are successfully recruiting subjects. This avoids thewastage of large initial supplies of drugs to centers that then end up recruiting fewif any subjects into the trial.
Data monitoring: Fixed designs or discrete adaptive designs have the samerequirements for safety data monitoring. This includes the case by case monitoringrequired to comply with regulatory reporting requirements, as well as the unblindedassessments required at interim analyses.
5.2. Regulatory Considerations
While trial designs for early phase drug development are under the purview ofthe sponsoring company as long as strict compliance to regulations around potentialhuman risk and safety is maintained, a successful dose-ranging trial brings majorevidence to regulatory discussions such as end-of-phase IIA or IIB meetings. Thevalidity of the dose recommendation for a phase III program based on adaptivestrategy will be scrutinized in the following contexts: (1) whether the trial uses thesame endpoint as the future phase III confirmatory trials, e.g., the trial might usea biomarker or a clinical utility; (2) whether the trial itself may be considered as aconfirmatory trial; (3) whether the trial will be seamlessly transitioned to a phase IIIconfirmatory trial by either linking operationally or combining evidence from twotrials.
If (2) and (3) are not proposed by the sponsor, adaptive dose-ranging designsshould be considered as an effective learning paradigm for drug development wherethe risks of missing an accurate assessment of the true underlying dose-responseprofile of an investigational treatment are borne by the sponsor. These plans wouldnot require special approval from health authorities and regulators. On the otherhand if (2) or (3) is intended, then the adaptive dose-ranging trial would need tobe planned in the context of the phase III program and a major discussion withregulatory authorities should be expected before the trial is initiated. The biggestvalidity concern is that allowing sponsors or physicians access to ongoing trialresults could introduce bias that consciously or unconsciously change their conducton an ad hoc basis. Certain logistical or statistical procedures need to be in place toremove such bias (Bretz et al., 2006; Maca et al., 2006).
Dow
nloa
ded
by [
Uni
vers
ity o
f G
uelp
h] a
t 00:
00 0
6 N
ovem
ber
2014
DESIGNING AND ANALYZING ADAPTIVE DOSE-RANGING TRIALS 993
In addition, it is very common for an adaptive dose-ranging trial to use anendpoint different from the endpoint used in the confirmatory trial that is requiredfor regulatory approval. The difference is induced due to either a registrationendpoint takes too long to measure, e.g., survival endpoint, or a clinical utility isused to enhance development decisions based on a benefit-risk profile. In the formersituation, a validated biomarker with shorter duration may be introduced for thepurpose of either proof of concept or adaptive randomization of patients. Sincethe science and guidance development in biomarkers and clinical utility functionsare still evolving, discussing these options with regulatory authorities ahead of timewould be highly encouraged.
The timing of initiating these regulatory discussions is also very important.Depending on the design features, it could occur as early as a pre-IND meeting if aphase 2A/2B seamless adaptive dose-ranging trial is planned. It would trigger muchearlier internal discussion on the development options and impact on the time lineof IND preparation if there are large modeling and simulation work needed to bedone before the regulatory discussion.
In summary, knowledge generated from an adaptive dose-ranging trial iscrucial in taking the drug to approval even when the trial usually occurs in theearly phase of the drug development. Thus, it is important to include regulatoryconsiderations as a part of the trial design considerations.
6. RECOMMENDATIONS
This section presents the main recommendations from the Adaptive Dose-Ranging Studies PhRMA working group. The results and conclusions of thesimulation study discussed in Section 4, together with the logistical and regulatoryconsiderations presented in Section 5, are of central importance to the group’srecommendations. To recall the context in which the recommendations werederived, we reproduce below the key conclusions discussed in Section 4.4.
• Detecting dose response is considerably easier than estimating it, or identifyingthe target dose to bring into the confirmatory phase.
• Current sample sizes used for dose-ranging studies, which are typically based onpower calculations to detect the presence of DR, are inadequate for dose selectionand DR estimation.
• Adaptive dose-ranging designs and methods clearly lead to gains in power todetect DR and in precision to select target dose(s) and to estimate the DR.
As discussed earlier, even though the simulations were motivated by a specificindication (neuropathic pain), the conclusions and recommendations presented inthis paper apply broadly to dose-ranging studies with similar endpoints/designs andare expected to hold, at least qualitatively, to other types of endpoints and designs.It would be useful to perform similar methods evaluations using other types ofendpoints and designs. To that end, the approach described in Section 4, based onsimulations under a variety of scenarios and a combination of performance metrics,can be easily generalized.
Based on the conclusions from the simulation study, as well as further internaldiscussions, the recommendations from the working group are as follows:
Dow
nloa
ded
by [
Uni
vers
ity o
f G
uelp
h] a
t 00:
00 0
6 N
ovem
ber
2014
994 BORNKAMP ET AL.
• Because they can lead to substantial gains in performance over traditionaldose-ranging methods, adaptive, model-based dose-ranging approaches should beencouraged for routine use in drug development.
• Sample size calculations for Phase II studies used for dose selection should takeinto account the desired precision of the estimated target dose and, possibly, alsothe estimated DR profile. At a minimum, the precision of target dose estimateunder the planned sample size should be assessed.
• When the required sample size for adequate precision in dose selection is notpractically feasible, one should consider allowing two or three doses to beselected for the confirmatory phase. This would be used to ensure an appropriateprobability of including the target dose among the ones selected. Adaptive designsshould then be used in the confirmatory trials for greater efficiency (e.g., droppingless efficacious/safe doses earlier)
• Ideally, proof-of-concept and dose selection should be combined into oneseamless trial, when feasible. Development strategies that envision this should beencouraged.
• Early stopping rules, for both efficacy and futility, should be used, when feasible,to maximize the gains in efficiency associated with adaptive designs. Bayesianmethods are particularly well-suited for this purpose.
• Routine use of trial simulations at the protocol design stage to determineappropriate sample sizes, to estimate the operational characteristics of designs andmethods under consideration, and to evaluate their sensitivity to deviations fromunderlying assumptions should be encouraged. This holds true for both adaptiveand non-adaptive approaches.
• Appropriate software is critical for designing, implementing, and analyzing datafrom adaptive dose-ranging studies needs to be developed. An effort to developuser-requirements with broad industry input for public publication should beconsidered.
• In practice, one should balance the potential gains associated with adaptive dose-ranging designs against their greater methodological and operational complexity.
APPENDIX (ACRONYMS USED IN THE PAPER)
ANOVA Analysis of VarianceAIC Akaike Information CriterionBIC Bayesian Information CriterionBMA Bayesian Model-AveragingCRF Case Report FormDopt D-optimal response adaptiveDR Dose ResponseEDC Electronic Data CaptureFWER Family-Wise Error RateGADA General Adaptive Dose AllocationIND Investigational New DrugLOCFIT Local Regression FitLOESS Local RegressionMCMC Markov Chain-Monte CarloMCP Multiple Comparison Procedure
Dow
nloa
ded
by [
Uni
vers
ity o
f G
uelp
h] a
t 00:
00 0
6 N
ovem
ber
2014
DESIGNING AND ANALYZING ADAPTIVE DOSE-RANGING TRIALS 995
MCP-Mod Multiple Comparison Procedure–ModelingNDLM Normal Dynamic Linear ModelMED Minimum Efficacious DoseMTT Multiple Trend TestPhRMA Pharmaceutical Research and Manufacturers of AmericaPISC Pharmaceutical Innovation Steering CommitteePoC Proof-of-ConceptVAS Visual Analog Scale
REFERENCES
Berry, D. A., Mueller, P., Grieve, A. P., Smith, M. K., Parke, T., Krams, M. (2002).Bayesian designs for dose-ranging drug trials. In: Gatsonis, C., Kass, R. E., Carlin, B.,Carriquiry, A., Gelman, A., Verdinelli, I., West, M., eds. Case Studies in BayesianStatistics. Vol. 5. New York: Springer-Verlag, pp. 99–181.
Bretz, F., Pinheiro, J., Branson, M. (2005). Combining multiple comparisons and modelingtechniques in dose-response studies. Biometrics 61:738–748.
Bretz, F., Schmidli, H., Koenig, F., Racine, A., Maurer, W. (2006). Confirmatory seamlessphase II/III clinical trials with hypotheses selection at interim: General concepts.Biometrical Journal 48(4):623–634.
Capizzi, T., Survill, T. T., Heyse, J. F., Malani, H. (1992). An empirical and simulatedcomparison of some tests for detecting progressive of response with increasing dosesof a compound. Biometrical Journal 34:275–289.
Dunnett, C. W. (1955). A multiple comparison procedure for comparing several treatmentswith a control. J. Amer. Statist. Assoc. 50:1096–1121.
Gallo, P. (2006). Confidentiality and trial integrity issues for adaptive designs. DrugInformation Journal 40(6):445–450.
Krams, M., Lees, K. R., Hacke, W., Grieve, A. P., Orgogozo, J. M., Ford, G. A. for theASTIN Study investigators. (2003). ASTIN: An adaptive dose-response study of UK-279,276 in acute ischemic stroke. Stroke 34:2543–2548.
Loader, C. (1999). Local Regression and Likelihood. New York: Springer.Maca, J., Bhattacharya, S., Dragalin, V., Gallo, P., Krams, M. (2006). Adaptive
seamless phase II/III designs—background, operational aspects, and examples. DrugInformation Journal 40(4):463–473.
Quinlan, J. A., Krams, M. (2006). Implementing adaptive designs: Logistical and operationalconsiderations. Drug Information Journal 40(6):437–444.
Stewart, W. H., Ruberg, S. J. (2000). Detecting dose response with contrasts. Statistics inMedicine 19:913–921.
Tukey, J. W., Ciminera, J. L., Heyse, J. F. (1985). Testing the statistical certainty of aresponse to increasing dose of a drug. Biometrics 41:295–301.
West, M., Harrison, P. J. (1997). Bayesian Forecasting and Dynamic Models. New York:Springer-Verlag.
Dow
nloa
ded
by [
Uni
vers
ity o
f G
uelp
h] a
t 00:
00 0
6 N
ovem
ber
2014