Embed Size (px)
Citation preview

Indonesia The transparent margin partnership model:Linkingmangofarmers todynamicmarkets Ronnie S. Natawidjaja, Yosini Deliana, Wayan Rusastra, Tomy Perdana, Togar A. Napitupulu, Hanny Sulistyoningrum, and Yovie M. RahayuCenter for Agricultural Policy and AgribusinessStudies (CAPAS), Padjadjaran University andCentre for Alleviation of Poverty throughSecondary Crops’ Development in Asia and thePacific (CAPSA), United Nations Economic andSocial Commission for Asia and the Pacific(UNESCAP)
www.regoverningmarkets.org
Innovative Practice
Regoverning MarketsSmall-scale producers in modern agrifood markets

1
The transparent margin partnership model: Linking mango farmers to dynamic markets
Final report of case study component 2, submitted to the Regoverning Market programme, Bandung, June 30, 2007
Ronnie S. Natawidjaja, Yosini Deliana, Wayan Rusastra, Tomy Perdana, Togar A. Napitupulu, Hanny Sulistyoningrum, and Yovie M. Rahayu*
*Authors Natawidjaja, Deliana, Perdana, Sulistyoningrum, and Rahayu are with the Center for Agricultural Policy and Agribusiness Studies (CAPAS), Padjadjaran University (Jl. Sekeloa Selatan I Bandung 40132, Indonesia); authors Rusastra and Napitupulu are with the Centre for Alleviation of Poverty through Secondary Crops’ Development in Asia and the Pacific (CAPSA) (UNESCAP, Jl. Merdeka 145, Bogor 16111, Indonesia).

2
Regoverning Markets Regoverning Markets is a multi‐partner collaborative research programme analysing the growing concentration in the processing and retail sectors of national and regional agrifood systems and its impacts on rural livelihoods and communities in middle‐ and low‐income countries. The aim of the programme is to provide strategic advice and guidance to the public sector, agrifood chain actors, civil society organizations and development agencies on approaches that can anticipate and manage the impacts of the dynamic changes in local and regional markets. Innovative Practice Innovative Practice is a series of country case studies from the Regoverning Markets programme providing examples of specific innovation in connecting small‐scale producers with dynamic markets at local or regional level. Based on significant fieldwork activities, the studies focus on four drivers of innovation: public policy principles, private business models, collective action strategies by small‐scale farmers, and intervention strategies and methods of development agencies. The studies highlight policy lessons and working methods to guide public and private actors. The case studies were coordinated by: Julio Berdegué, RIMISP ‐ Latin American Centre for Rural Development, Chile (conctact: [email protected]) Lucian Peppelenbos, Royal Tropical Institute (KIT), Netherlands (contact [email protected]) Estelle Biénabe, Centre de Coopération Internationale en Recherche Agronomique pour le Développement (CIRAD), France (contact: [email protected]). Other publication series from the Regoverning Markets programme Agrifood Sector Studies These studies look at specific agrifood sectors within a country or region. Research studies have been carried out in China, India, Indonesia, Mexico, South Africa, Turkey, Poland and Zambia covering the horticulture, dairy and meat sectors. Part A of the studies describe the observed market restructuring along the chains. Part B explores the determinants of small‐scale farmer inclusion in emerging modern markets. Using quantitative survey techniques, they explore the impacts on marketing choices of farmers, and implications for rural development.

3
Innovative Policy These are short studies addressing a specific policy innovation in the public or private sector that improves the conditions for small‐scale producers to access dynamic markets at national, regional and global level. Country Studies These provide a summary of market changes taking place at national level within key high value agrifood commodity chains. Policy Briefs These are short policy‐focused summaries targeted at each stakeholder group. Further information and publications from the Regoverning Markets programme are available at: www.regoverningmarkets.org.

4
Authors Ronnie S. Natawidjaja, Yosini Deliana, Wayan Rusastra, Tomy Perdana, Togar A. Napitupulu, Hanny Sulistyoningrum, and Yovie M. Rahayu* *Authors Natawidjaja, Deliana, Perdana, Sulistyoningrum, and Rahayu are with the Center for Agricultural Policy and Agribusiness Studies (CAPAS), Padjadjaran University (Jl. Sekeloa Selatan I Bandung 40132, Indonesia); authors Rusastra and Napitupulu are with the Centre for Alleviation of Poverty through Secondary Crops’ Development in Asia and the Pacific (CAPSA) (UNESCAP, Jl. Merdeka 145, Bogor 16111, Indonesia). Acknowledgments Funding for this work was provided by: UK Department for International Development (DFID) International Development Research Centre (IDRC), Ottawa, Canada ICCO, Netherlands Cordaid, Netherlands Canadian International Development Agency (CIDA) US Agency for International Development (USAID). The views expressed in this paper are not necessarily those of the funding agencies. Citation: Natawidjaja, RS, The Transparent Margin Partnership Model: Linking Mango Farmers to Dynamic Markets. Final Report of Case Study Component 2, Y Deliana, W Rusastra, T Perdana,T.A. Napitupulu, H Sulistyoningrum and Y.M. Rahayu (2008), Regoverning Markets Innovative Practice series, IIED, London. Permissions: The material in this report may be reproduced for non‐commercial purposes provided full credit is given to the authors and the Regoverning Markets programme. Published by: Sustainable Markets Group International Institute for Environment and Development (IIED) 3 Endsleigh Street London WC1H 0DD www.iied.org Tel: +44(0)20 7388 2117, email: [email protected] Cover design: smith+bell

5
Contents
1 Abstract.................................................................................................................................. 7 2 Background........................................................................................................................... 8 3 Dynamic changes in mango markets .............................................................................. 10 4 Development of innovation in the mango supply chain.............................................. 14 4.1 Innovation in the supply chain ................................................................................ 14 4.2 Innovation in the Pemalang area ............................................................................. 17 4.3 Factors leading to inclusion and exclusion of farmers during the innovation process ..................................................................................................................................... 18
5 Impact of innovation ......................................................................................................... 24 5.1 Impact on mango marketing (supply chain).......................................................... 24 5.1.1 Product flow ...................................................................................................... 24 5.1.2 Information flow ................................................................................................ 24 5.1.3 Knowledge flow ................................................................................................. 25 5.1.4 Capital flow......................................................................................................... 25
5.2 Impact of the supply chain on governance ............................................................ 26 5.3 Active role of the supply chain champion ............................................................. 28 5.4 Value‐chain mapping ................................................................................................ 29 5.5 The off‐season mango supply chain through KUBM........................................... 30 5.6 The off‐season mango supply chain: KUBM indirect to independent farmers (non‐members) ....................................................................................................................... 32 5.7 Off‐season mango supply chain through Aspirasi ............................................... 33 5.8 Costs and bbenefits .................................................................................................... 35 5.8.1 Costs and benefit for farmers ........................................................................... 35 5.8.2 Costs and benefits at the supply chain level .................................................. 37
6 Replication potential of innovation................................................................................. 39 7 Conclusions and policy implications .............................................................................. 41 7.1 Conclusions................................................................................................................. 41 7.2 Policy Implications..................................................................................................... 42
8 References – Bold numbers of journals........................................................................... 43 9 Annexes ............................................................................................................................... 46 9.1 Annex 1. Change of physical flow in distribution supply chains of “in‐season” mangos after innovation ....................................................................................................... 46 9.2 Annex 2. Change of information flow in distribution supply chains of “off‐season” mangos before and after innovation .................................................................... 47 9.3 Annex 3. Change of knowledge flow in distribution supply chains of “off‐season” mangos before and after innovation .................................................................... 50 9.4 Annex 4. Change of capital flow in distribution supply chains of “off‐season” mangos before and after innovation ................................................................................... 53

6
9.5 Annex 5. Legitimacy governance flow before and after innovation .................. 56 9.6 Annex 6. Rights, responsibilities, and benefits of stakeholders involved in innovation ............................................................................................................................... 61 9.7 Annex 7. Inter‐stakeholder relations in innovation ............................................. 62 9.8 Annex 8. Performance changes by farmers before and after innovation........... 64 9.9 Annex 9. Historical innovation ................................................................................ 67 9.10 Annex 10. Supply Chain Evolution........................................................................ 68 9.11 Annex 11. Critical changes required by stakeholders for achieving successful innovation ............................................................................................................................... 69 9.12 Annex 12. Median Value of critical stakeholder changes for achieving innovation success ................................................................................................................. 70 9.13 Annex 13. Skills, competence, and capacity of included and excluded farmers .. ....................................................................................................................................... 71 9.14 Annex 14. Sequence of supply chain innovation and evolution....................... 72 9.14.1 KUBM .................................................................................................................. 73 9.14.2 Bimandiri............................................................................................................. 73 9.14.3 Carrefour ............................................................................................................. 73
9.15 Annex 15. Mango value chain in Pemalang, Central Java, Indonesia............... 77

7
1 Abstract The main objective of the study is to generate policy lessons and working methods to guide public policy makers and private actors in supporting greater inclusion of small‐scale producers in dynamic markets. The study shows that the transparent margin system is a co‐innovating marketing institution which provides small farmers access to a modern market supply chain. Evolution of the innovation has created dynamic changes at the producer level. Factors that support small farmer inclusion are the farmer’s ability, willingness, and trust to make changes, and receive its benefit. Sustainability of the transparent margin system is dependent on commitment, level of trust in the partnership, the transformation of marketing institution, an innovative learning process, risk managements, and the role of rural production organisation in the marketing system. The innovation of the partnership can be replicated by facilitating and giving incentives to the supply chain champion.

2 Background Indonesia ranks fourth among the mango‐producing countries, after India, China, and Thailand. One of the important mango production zones in Indonesia is Pemalang, in Central Java. In this area, mangos can be harvested during the off‐season, May to August, while mangos in other areas are generally harvested in the period from October to January. The specific harvesting period is a significant bargaining point for farmers with traders in determining the selling price of the produce. However, local collectors (tengkulak) and wholesalers (bandar) are the ones who benefit the most from off‐season mango. Since farmers in Pemalang are generally bound by a loan received from a trader, they allow the trader to make the decisions regarding the sale of the harvest. Therefore, farmers do not know the accurate volume of their mango production. This kind of exchange system creates vulnerability in the farmers’ bargaining position, so that they receive a relatively lower price in relation to the real market price. This was the result of unbalanced information, the traders’ monopoly, and the farmers’ weak financial condition. As a consequence of this system farmers’ lacked motivation to improve the quality and productivity of mango farming. Through the rapid development over the past ten years of modern retail and more competitive marketing, some supermarket suppliers attempted to cut down marketing chains by involving farmers directly in the supply chain. However, the effort failed because farmers breached their contract agreements, resulting in severe loses for the supermarket supplier in terms of investment made, technical assistance given, and affecting the supplier’s reputation. Contract breaches occurred because suppliers were unable to offer the highest price to farmers. One of the partnership systems which has been in operation since 2003 and successfully brought farmers into direct negotiation with major modern retailers, such as Carrefour, was a partnership between Bimandiri (a specialized supplier to the modern market) and the mango farmer’s group KUBM (Kelompok Usaha Bersama Mandiri or Self‐help Collective Business Group) in Pemalang, Central Java. This successful endeavour can generate policy lessons and working methods to guide public and private actors in supporting greater inclusion of small‐scale producers in dynamic markets. To be more specific, the purpose of this case study are: a) to identify the main characteristics of the partnership system between Bimandiri and KUBM; b) to analyze the factors supporting the inclusion of small farmers in modern market supply chains; c) to analyze the motivation of a supermarket supplier such as Bimandiri to

9
collaborate with small mango producers on a significant scale; d) to analyze the main factors affecting inclusion or exclusion of small farmers; e) to analyze the costs and benefits of this partnership system and its profit distribution to actors in the supply chains; and f) to examine the replication potential of the partnership system. The case study was carried out in Pemalang, Central Java and based on three main components of field data analysis: first, interviews with key respondents and focus group discussion (FGD) covering the staff of Bimandiri, members of KUBM, other farmer’s groups, middlemen, capital providers, policy makers from both central and local governments, and all parties involved in the mango supply chain from Pemalang. The second component consisted of observations about marketing channels and their function from farm to retail market. The third component was a cost and benefit analysis, through financial and economic surveys, of the Bimandiri‐KUBM partnership system as compared to the traditional system approaches. Field study was conducted from February to June, 2007.

10
3 Dynamic changes in mango markets In the period 1994–2004, Indonesia’s mango production increased about seven per cent per year (Table 2.1). However, although new mango harvesting areas had increased about 40 per cent during that decade, national mango productivity had decreased sharply. Therefore, in 2004, mango productivity was estimated at only about 7.7 tons per hectare. Based on the above, the Directorate General of Horticulture realized and set a target of mango productivity at 10.6 tons per hectare through a program focused on intensification and replanting of mango farms (Ministry of Agriculture, 2006). Table 2.1. Harvested area and mango production growth in Indonesia, 1994–2004
Year Harvest and production 1994 2004
Growth (%/year)
1. Harvested area (hectare) 36,981 185,773 40 2. Production (ton) 826,824 1,437,665 7
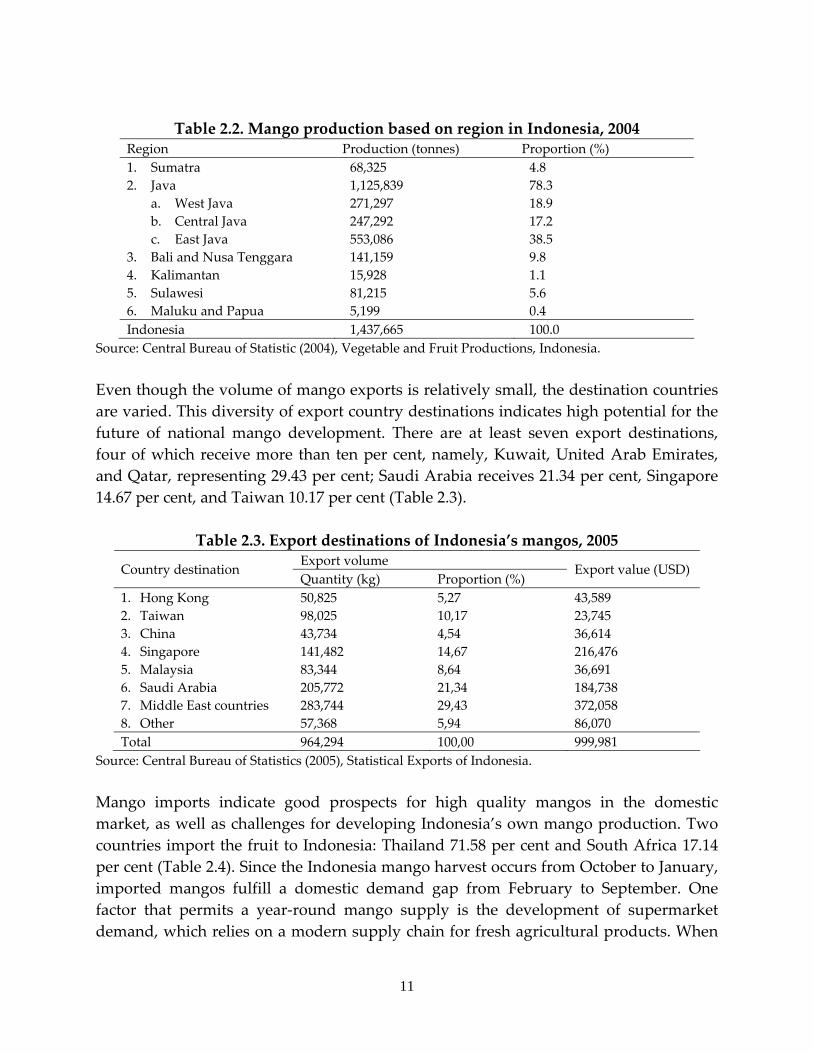
Source: Central Bureau of Statistics, Jakarta, 2005. Java Island makes a significant contribution to national mango production. From the total mango production in 2004, the Java’s share is 78 per cent (Table 2.2). Other important central producing areas of mango are Bali and Nusa Tenggara (9.8 per cent), Sulawesi (5.6 per cent), and Sumatra (4.7 per cent). The central area of mango production in Java Island was East Java, contributing about 38.5 per cent. West and Central Java shared a roughly equal production of about 18.9 and 17.2 per cent, respectively. The regencies of Pemalang, Tegal, Pekalongan (Central Java), Indramayu (West Java), and Probolinggo (East Java) are the main areas of mango production in Java Island. Pemalang Regency, the location of this case study, represented about 4 per cent of the total production of Central Java (247,292 tons). Indonesia’s mango production was intended to meet domestic consumption, which stands currently at 60.9 per cent of FAO recommendation, namely 65.75kg per capita per year (National Seminar on Mango Agribusiness, 2006). Hence, there remains considerable opportunity to increase mango production, even if only to satisfy domestic consumption, in response to an increase and improvement of distribution in income. In comparison to national consumption, international mango exports are relatively small, 95.6 tons of net export in 2005 (Tables 2.3 and 2.4). The volume of mango import and export amount to 869 tons (0.06 per cent) and 964 tons (0.07 per cent), respectively, less than one per cent of total production.
11
Table 2.2. Mango production based on region in Indonesia, 2004
Region Production (tonnes) Proportion (%) 1. Sumatra 68,325 4.8 2. Java 1,125,839 78.3
a. West Java 271,297 18.9 b. Central Java 247,292 17.2 c. East Java 553,086 38.5
3. Bali and Nusa Tenggara 141,159 9.8 4. Kalimantan 15,928 1.1 5. Sulawesi 81,215 5.6 6. Maluku and Papua 5,199 0.4 Indonesia 1,437,665 100.0
Source: Central Bureau of Statistic (2004), Vegetable and Fruit Productions, Indonesia. Even though the volume of mango exports is relatively small, the destination countries are varied. This diversity of export country destinations indicates high potential for the future of national mango development. There are at least seven export destinations, four of which receive more than ten per cent, namely, Kuwait, United Arab Emirates, and Qatar, representing 29.43 per cent; Saudi Arabia receives 21.34 per cent, Singapore 14.67 per cent, and Taiwan 10.17 per cent (Table 2.3).
Table 2.3. Export destinations of Indonesia’s mangos, 2005 Export volume Country destination Quantity (kg) Proportion (%)
Export value (USD)
1. Hong Kong 50,825 5,27 43,589 2. Taiwan 98,025 10,17 23,745 3. China 43,734 4,54 36,614 4. Singapore 141,482 14,67 216,476 5. Malaysia 83,344 8,64 36,691 6. Saudi Arabia 205,772 21,34 184,738 7. Middle East countries 283,744 29,43 372,058 8. Other 57,368 5,94 86,070 Total 964,294 100,00 999,981
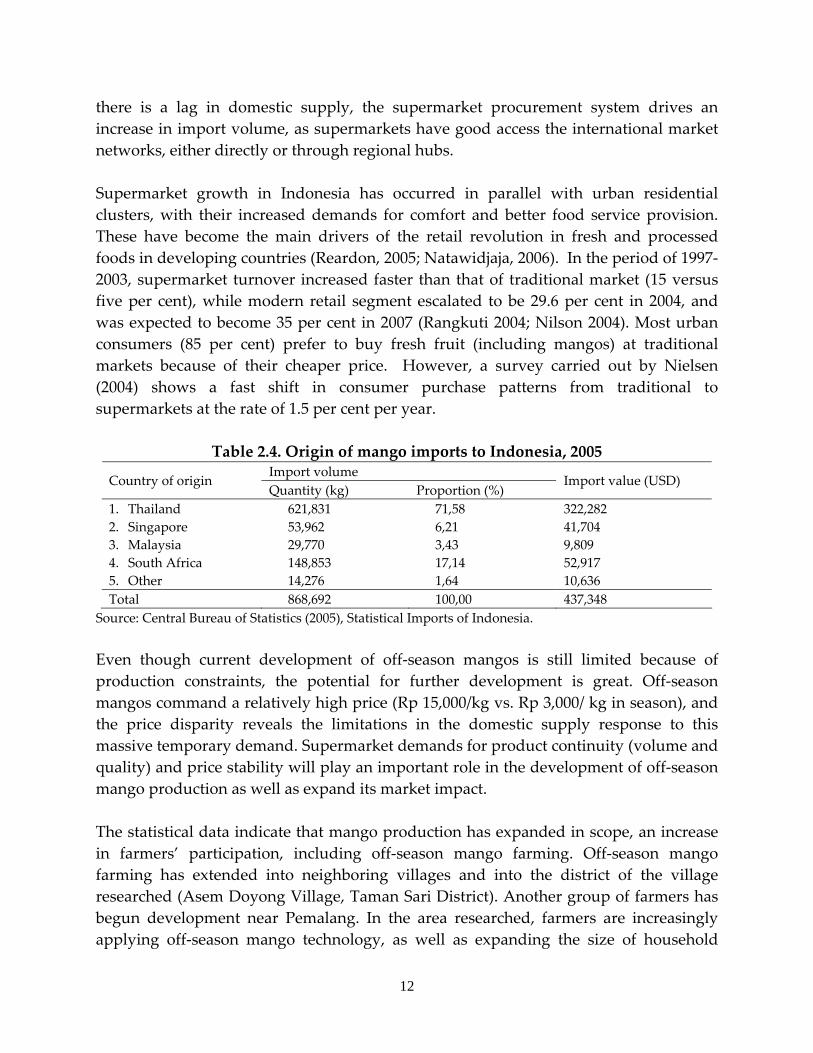
Source: Central Bureau of Statistics (2005), Statistical Exports of Indonesia. Mango imports indicate good prospects for high quality mangos in the domestic market, as well as challenges for developing Indonesia’s own mango production. Two countries import the fruit to Indonesia: Thailand 71.58 per cent and South Africa 17.14 per cent (Table 2.4). Since the Indonesia mango harvest occurs from October to January, imported mangos fulfill a domestic demand gap from February to September. One factor that permits a year‐round mango supply is the development of supermarket demand, which relies on a modern supply chain for fresh agricultural products. When
12
there is a lag in domestic supply, the supermarket procurement system drives an increase in import volume, as supermarkets have good access the international market networks, either directly or through regional hubs. Supermarket growth in Indonesia has occurred in parallel with urban residential clusters, with their increased demands for comfort and better food service provision. These have become the main drivers of the retail revolution in fresh and processed foods in developing countries (Reardon, 2005; Natawidjaja, 2006). In the period of 1997‐2003, supermarket turnover increased faster than that of traditional market (15 versus five per cent), while modern retail segment escalated to be 29.6 per cent in 2004, and was expected to become 35 per cent in 2007 (Rangkuti 2004; Nilson 2004). Most urban consumers (85 per cent) prefer to buy fresh fruit (including mangos) at traditional markets because of their cheaper price. However, a survey carried out by Nielsen (2004) shows a fast shift in consumer purchase patterns from traditional to supermarkets at the rate of 1.5 per cent per year.
Table 2.4. Origin of mango imports to Indonesia, 2005 Import volume Country of origin Quantity (kg) Proportion (%)
Import value (USD)
1. Thailand 621,831 71,58 322,282 2. Singapore 53,962 6,21 41,704 3. Malaysia 29,770 3,43 9,809 4. South Africa 148,853 17,14 52,917 5. Other 14,276 1,64 10,636 Total 868,692 100,00 437,348
Source: Central Bureau of Statistics (2005), Statistical Imports of Indonesia. Even though current development of off‐season mangos is still limited because of production constraints, the potential for further development is great. Off‐season mangos command a relatively high price (Rp 15,000/kg vs. Rp 3,000/ kg in season), and the price disparity reveals the limitations in the domestic supply response to this massive temporary demand. Supermarket demands for product continuity (volume and quality) and price stability will play an important role in the development of off‐season mango production as well as expand its market impact. The statistical data indicate that mango production has expanded in scope, an increase in farmers’ participation, including off‐season mango farming. Off‐season mango farming has extended into neighboring villages and into the district of the village researched (Asem Doyong Village, Taman Sari District). Another group of farmers has begun development near Pemalang. In the area researched, farmers are increasingly applying off‐season mango technology, as well as expanding the size of household

13
farms. In the near future, it is expected that mango production will continue throughout the year. It is predicted that both supermarket and traditional markets will play a larger role in supporting off‐season mango development through sustainable technological and capital investment on mango farms.

14
4 Development of innovation in the mango supply chain 4.1 Innovation in the supply chain Institutional innovation in the supply chains has changed the traditional marketing chain, which has tended to be long and inefficient. It has become more modern, shorter, and more efficient. Moreover, there has been a change in the system of sales at the farm level: from tebasan—selling the green fruit on the tree, without harvesting it first—to using a wholesaler to organize the harvest of a group of farmers, dealing with the post‐harvest handling, and then selling it to supermarket. That system has changed the farmers’ role from price‐taker to price decision maker. For a very long time, mango farmers in Pemalang have used a traditional, long marketing chain, for either in‐season or off‐season mango cultivation (Figure 3.1). In this system, farmers play only a passive role, especially at marketing level. Although the farmers have employed the technology to produce off‐season mango—which made it possible for the mango to be harvested at a time of heavy demand—they continue to use the tebasan system in selling their product. This system benefits only the buyers, collectors (tengkulak), or wholesalers, who have better knowledge of the market. Although they realize their weak position, the farmers find themselves the price takers in the chain, but no other alternative than to accept it.
Figure 3.1. Mango marketing channels in Pemalang before
institutional innovation
After the institutional innovation of employing a transparent margin system was put in place, marketing chains became shorter (Figure 3.2). This change occurred because of the involvement of the Bimandiri partnership which gave technical assistance and advance funding to farmers. As a dedicated wholesaler to supermarkets, Bimandiri gives farmers direct access to the Hero supermarket chain. Through this system, the farmers are assured a marketing opportunity and the possibility of receiving a higher price than is given by the traditional market. However, in this system, farmers must play an active role in various activities, such as deciding about cultivation techniques, disease control, and post‐harvest handling. At harvest time, the farmers do not sell their crop. Instead, they leave the fruit harvest to the care of a farmer cooperative called Aspirasi Bina Usaha.

15
Bimandiri develops a partnership with mango farmers based on transparent and mutual trust, so that the burden of risk of mango marketing is shared by both the farmers and the partnership as a whole. All parties involved in this system know the margin they earn transparently. Bimandiri receives a fee of five per cent from the total sale of mangos for the service it renders in assuring supermarket quality, quantity, and all liabilities involved, apart from the service given to the farmers. This service includes the introduction and testing of new mango varieties, provision of agricultural inputs such as soft loans, quality control, accounting, and contract negotiation with buyers. The services of Bimandiri also indirectly affect other mango farmers, as they provide technological information, pricing advice, and marketing opportunities for rural farmers.
Figure 3.2. Off‐season mango marketing channels in Pemalang after institutional innovation
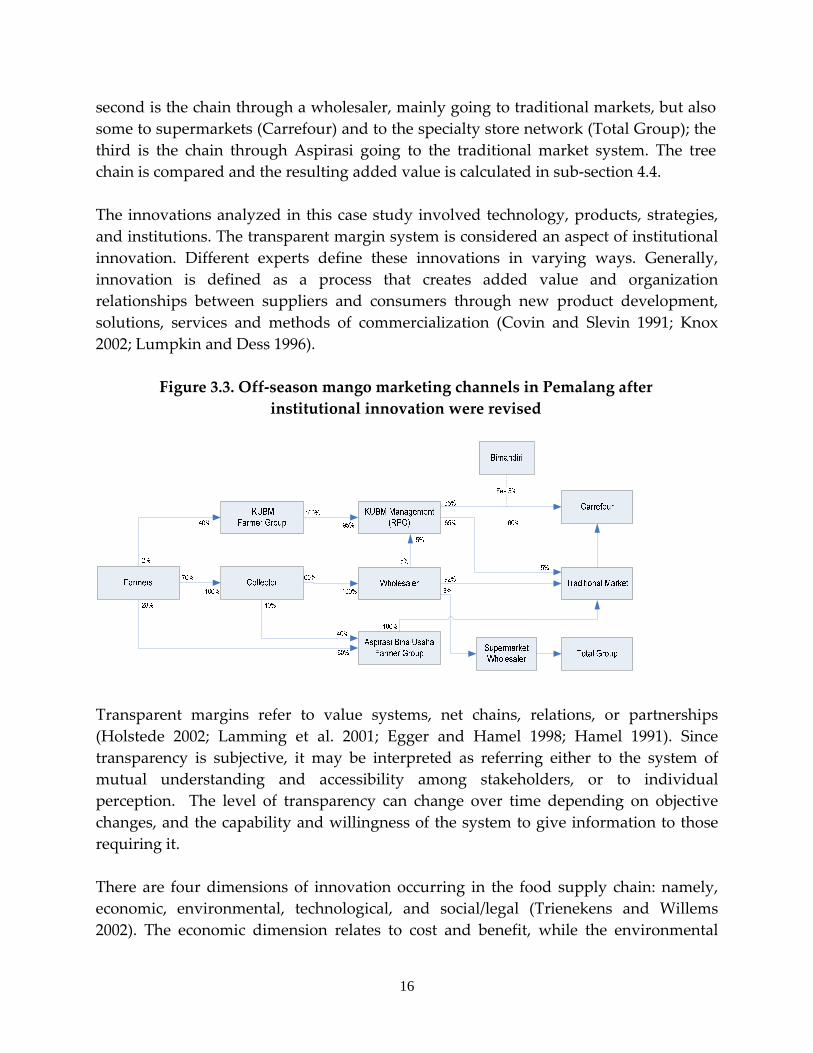
Since Aspirasi Bina Usaha is a large farmer grouping with 46 members and diverse interests, some difficulties do occur in the group dynamic, such as mixed incentives and conflicts of interest. These sometimes give rise to a group debt for unpaid production loans made to Bimandiri for sums as large as Rp300 million. Figure 3.2 shows that Aspirasi received mangos not only from members (60 per cent) but also from outside farmers via collectors (40 per cent) and sold to both supermarkets (30 per cent) and traditional markets (70 per cent). Not all members have the same vision about the partnership with Bimandiri and some are just only along for the ride. The institutional innovations undertaken were dynamic and entailed self correction as well as resulting in improvements. In order to consolidate and improve the innovations, Bimandiri and those farmer group members who were genuinely interested in the innovations overcame the free‐ride problem by separating themselves (becoming exclusive) and creating a new farmer group named KUBM. Figure 3.3 shows what the marketing channels in Pemalang looked like after the KUBM farmer group was created. Three channels were now available in Pemalang: first the chain through the KUBM farmer group going to Carrefour and traditional market;
16
second is the chain through a wholesaler, mainly going to traditional markets, but also some to supermarkets (Carrefour) and to the specialty store network (Total Group); the third is the chain through Aspirasi going to the traditional market system. The tree chain is compared and the resulting added value is calculated in sub‐section 4.4. The innovations analyzed in this case study involved technology, products, strategies, and institutions. The transparent margin system is considered an aspect of institutional innovation. Different experts define these innovations in varying ways. Generally, innovation is defined as a process that creates added value and organization relationships between suppliers and consumers through new product development, solutions, services and methods of commercialization (Covin and Slevin 1991; Knox 2002; Lumpkin and Dess 1996).
Figure 3.3. Off‐season mango marketing channels in Pemalang after institutional innovation were revised
Transparent margins refer to value systems, net chains, relations, or partnerships (Holstede 2002; Lamming et al. 2001; Egger and Hamel 1998; Hamel 1991). Since transparency is subjective, it may be interpreted as referring either to the system of mutual understanding and accessibility among stakeholders, or to individual perception. The level of transparency can change over time depending on objective changes, and the capability and willingness of the system to give information to those requiring it. There are four dimensions of innovation occurring in the food supply chain: namely, economic, environmental, technological, and social/legal (Trienekens and Willems 2002). The economic dimension relates to cost and benefit, while the environmental
17
dimension concerns production methods, distribution, and trade. The technological dimension involves technological methods (products, technological processes, transport technology, information, and technological communication) aimed at increasing product quality and quantity, and safe distribution. Finally, the social dimension has to do with those social issues which impede production. Therefore, the transparent margin partnership system can be defined as a new marketing strategy that gives added to farmers and other stakeholders by linking farmers directly to modern retailers. The system can be identified as an innovation since it satisfies economic, environmental, technological, and social dimensions in the mango marketing system. 4.2 Innovation in the Pemalang area The innovation of the transparent margin system generates continual institutional change in the Pemalang area. Farmers who used to sell their products individually modified their practice and began to sell as part of a group. Moreover, the informal markets of post‐harvest mangos (open market‐based negotiation) became formal, based on contracts. Evidence shows that the farmers following formal marketing practices tend to develop faster than when they used the informal ones. Institutional innovation in Pemalang began with technological innovation, i.e., off‐season mango cultivation technology, created by a pioneer named H. Soewarno in 1995. The marketing structures for mangos in the production zone did not offer good incentives to farmers, with the result that farmers could not enjoy the considerable benefits from technological innovation. However, despite the fact that it was not always successfully applied since it required high technical skills, the number of farmers making use of the technological innovations was increasing and the information about off‐season mango technology spread quickly across the region. The innovations gained momentum when an outsider entered the picture, namely, Bimandiri, which acted as a corporate entrepreneur by designing innovative strategies for gaining access to the competitive supply chains to modern markets. The collaboration between Bimandiri and Aspirasi Bina Usaha resulted in co‐innovation in the form of the transparent margin system. Subsequently, after the AspirasiBina Usaha farmer group divided and six members of the group founded a new farmer group called KUBM, Bimandiri resumed the transparent margin system with KUBM. Aspirasi Bina Usaha farmers then returned to the old system, supplying the tradition markets. This action resulted in the farmers belonging to the Aspirasi group becoming excluded

18
from the innovations. Because the roles and responsibilities of the members involved in the Aspiras group were unclear, Aspirasi ended up becoming a trader (Bandar) struggling for their own interests, rather than for the interests of its members. As an institutional innovation, the transparent margin system succeeded in transforming the previously informal market system (an open market based on negotiation) into a formal contract‐based arrangement. Through changes in the partnership system, the KUBM group was able to expand its planting area from 36 hectares (4,680 trees) to 45 hectares (5,800 trees) within a brief one‐year period. On the other hand, the land size of the Aspirasi group remained unchanged at 72 hectares (10,028 trees) over the same period. In generating innovation, there were two processes at work: first main or core process, and second the enabling process which made the innovation happen. Underlying the core process were the generating concepts, product innovation, processes of innovation and acquisition techniques, while the enabling processes involved leadership, systems and tools, and available resources (Chiesa et al. 1996). The end result of these two processes was the achievement of competitive status. An example of the process‐based innovation approach is small industry development in China. Ren et al (2006) explain how benchmarking (through an applied innovation technique) can be used as a management reference point for further adoption and the basis for further successful innovation. This was the technique used by Bimandiri to beat its competitors when it carried out benchmarking with the KUBM farmer group. Hypothesis 1: Private companies tend to work with disorganized or loosely organized small‐scale producers. This study shows that Bimandiri, a private company, was willing to work in long‐term partnership with the KUBM farmer group, a group of well organised small‐scale farmers controlling a total of 45 hectares of farm land with a total of 5,800 mango trees.
4.3 Factors leading to inclusion and exclusion of farmers during the
innovation process Factors that encouraged each of the farmers in the KUBM group to adopt innovation of the transparent margin system were their capability, skill, and willingness to adapt in response to the demands of the modern market. As a supply chain champion, Bimandiri was motivated to collaborate with KUBM because the group had the basic capability to adopt the innovation and the skill to cultivate mangos in the off‐season, to pioneer the new technology. Bimandiri also liked

19
to collaborate with farmers who were capable of expanding their harvest volume. Members of KUBM are owner‐operator farmers who also manage other mango farms, giving them the capability to expand their supply volume when needed. Another sought after characteristic for Bimandiri was strong commitment and sense of responsibility. KUBM was founded by ex‐members of the Aspirasi group recommended by the Syngenta company, a trustworthy partner of Aspirasi. Hypothesis 2: Farmer organizations need to select members carefully (be exclusive) order to consolidate their position in dynamic markets and remain competitive in the supply chain. The study showed that in order to respond effectively to a change demanded by the dynamic market, eight members of the Aspirasi farmer group needed to create an exclusive new group called KUBM to consolidate their position and remain competitive in the supply chain.
Transparent margin system was able to encourage farmers to establish their cooperative by implementing five management steps: learning, steering, forming, implementing, and developing (Tuckman 1965; Banet 1976; Chamala 1995). The farmers who were able to change survived, while those who were not were excluded from the group. After the innovation process began to make changes, the farmers who were included in the new group and those who were excluded had different characteristics (Annex 13). The chronology of the process of change is described in Annexes 9 and 10. The greatest changes occurred in products, marketing, stakeholders, and use of technology, management, organization, and financial arrangements. In order to succeed in innovation, every stakeholder involved had to manage critical change. There were three levels of stakeholders involved in the transparent margin partnership system:
• Level 1: Directly involved in the change process, such as farmers, KUBM group, management of KUBM, Bimandiri, and Carrefour;
• Level 2: Indirectly involved in the change process, such as group of Aspirasi Bina Usaha, local market actors, central market actors, and field extension agents;
• Level 3: Not involved at all in the change process, such as local government, field extension officers, Sygenta, and other private parties.
The three stakeholder levels are illustrated in Figure 3.4. Every stakeholder involved has different characteristics and plays a different role in the transparent margin system (see Annex 14).

20
Figure 3.4. Stakeholder levels in the transparent margin innovation model
Notes:
Level 1 : Level 2 : Level 3 1. Farmers 2. KUBM Farmer Group 3. KUBM RPO 4. Bimandiri 5. Carrefour
6. Aspirasi Farmer Group 7. Local market actors 8. Central market actors/agents 9. Local government 10. Extension agent
11. Extension agent 12. Sygenta 13. Private sectors
The actors at Level 1 (particularly farmers of the KUBM group, Management of KUBM, and Bimandiri) played active roles in the innovation process; that is, they mobilized, responded, and made necessary changes. Carrefour, in fact, did not take any action. The KUBM group supported its own management by continuing to innovate and by supplying products continuously to the management, and by shouldering the assumed risks faced by the management of KUBM. The responsibility and commitment on the part of the KUBM management enabled them to overcome the financial problems encountered by the farmers. However, the actors at Level 2 and 3 did not offer solutions to the problems that emerged in the innovation process. At Level 2, only Aspirasi made changes, and then only in the area of quality handling. Meanwhile, at Level 3, the stakeholders involved responded appropriately, but did not make any changes. Local government did not play any role in either including farmers in, or excluding them from, the innovation process.
3
2
4
1
78
69
11
5
12 13
10
Level 3
Level 2
Level 1

21
Innovation was sustained by two farmer groups: Aspirasi Bina Usaha and KUBM. Annex 15 describes the change reactions and problems which occurred in these groups during the process. The problems faced by the two groups were primarily in the area of financial management. Its non cash payment system meant that Aspirasi Bina Usaha was not a suitable organizational environment, with the result that the responsibility for innovation fell to the smaller group, namely, KUBM. The responsibility of stakeholders to assist farmers in managing well and solving problems was an important factor in enabling them to continue the innovation, as illustrated in Figure 3.5.
Figure 3.5. Critical factors in stakeholder innovation success
0
1
2
3
4
5Agro Input
Employment
Technology
Product
Distribution
Marketing
Finance
Subsidy
Credit
Stakeholder of Inovation
Organization
Management
Policy
Social and Culture
Inclusion Farmer
KUBM Management
Bimandiri
Carrefour
Interviews with the actors (Annex 11 and 12) indicated that the most critical factor for the farmers who were included in the process, KUBM management, Bimandiri, and Carrefour was the involvement of stakeholders and management in making institutional innovations. This can be considered the Critical Stage Factor (CSF) in assuring the success of the innovation. It was vitally important for farmers and the KUBM management that Bimandiri, as the dedicated supermarket wholesaler, was able to handle farm inputs, labor costs, technology, product specification, distribution, marketing, financial issues, subsidies, organization, regulation and policy, and to carry out negotiations with Carrefour. Interestingly, the analysis shows that the included farmers and Bimandiri perceived subsidies as being relatively unimportant and that the farmers never actually felt the
22
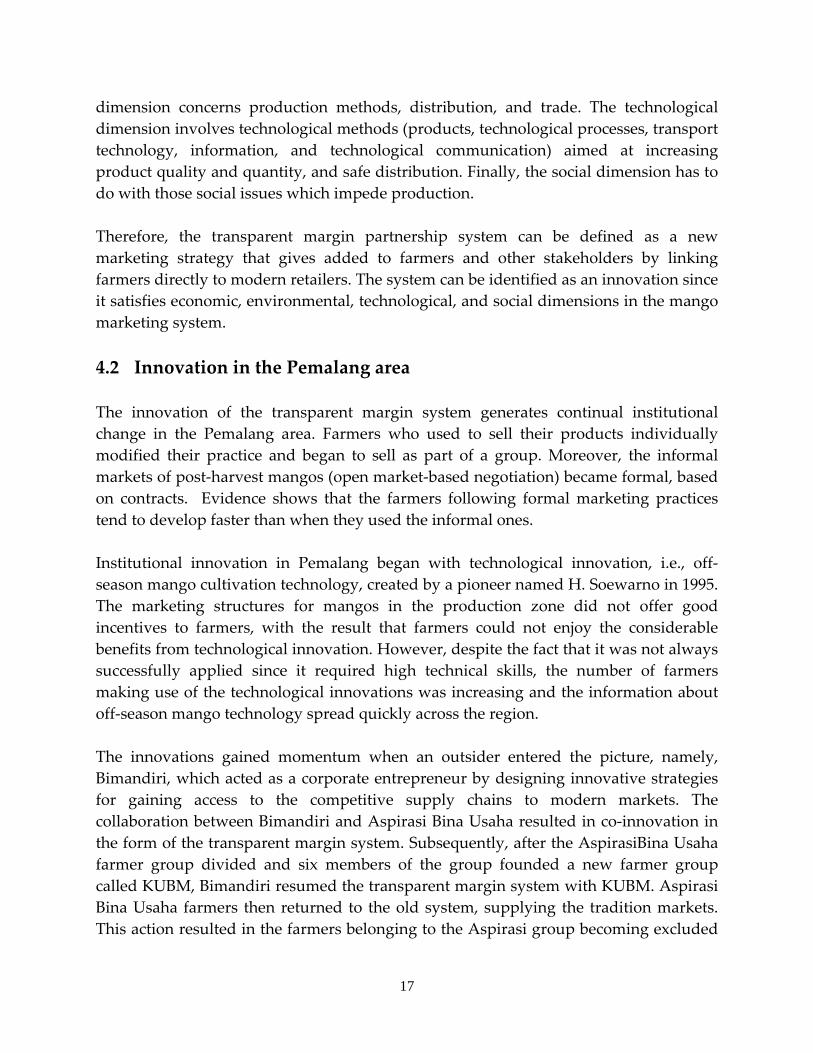
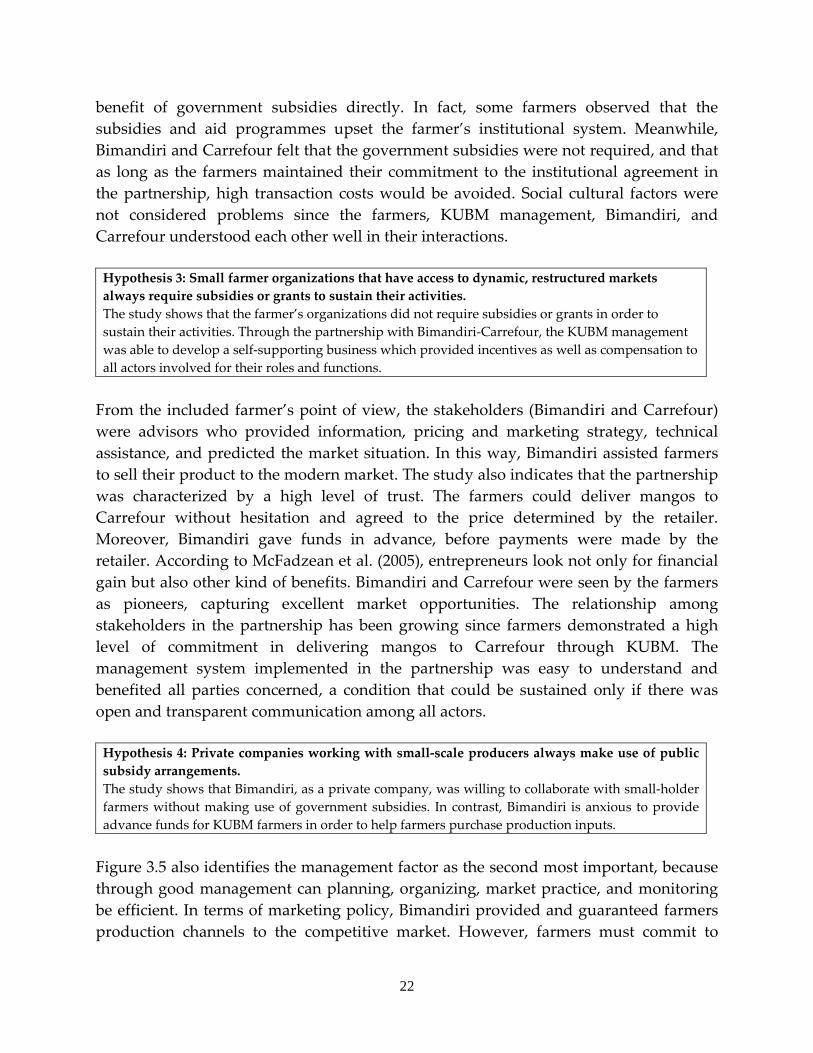
benefit of government subsidies directly. In fact, some farmers observed that the subsidies and aid programmes upset the farmer’s institutional system. Meanwhile, Bimandiri and Carrefour felt that the government subsidies were not required, and that as long as the farmers maintained their commitment to the institutional agreement in the partnership, high transaction costs would be avoided. Social cultural factors were not considered problems since the farmers, KUBM management, Bimandiri, and Carrefour understood each other well in their interactions. Hypothesis 3: Small farmer organizations that have access to dynamic, restructured markets always require subsidies or grants to sustain their activities. The study shows that the farmer’s organizations did not require subsidies or grants in order to sustain their activities. Through the partnership with Bimandiri‐Carrefour, the KUBM management was able to develop a self‐supporting business which provided incentives as well as compensation to all actors involved for their roles and functions. From the included farmer’s point of view, the stakeholders (Bimandiri and Carrefour) were advisors who provided information, pricing and marketing strategy, technical assistance, and predicted the market situation. In this way, Bimandiri assisted farmers to sell their product to the modern market. The study also indicates that the partnership was characterized by a high level of trust. The farmers could deliver mangos to Carrefour without hesitation and agreed to the price determined by the retailer. Moreover, Bimandiri gave funds in advance, before payments were made by the retailer. According to McFadzean et al. (2005), entrepreneurs look not only for financial gain but also other kind of benefits. Bimandiri and Carrefour were seen by the farmers as pioneers, capturing excellent market opportunities. The relationship among stakeholders in the partnership has been growing since farmers demonstrated a high level of commitment in delivering mangos to Carrefour through KUBM. The management system implemented in the partnership was easy to understand and benefited all parties concerned, a condition that could be sustained only if there was open and transparent communication among all actors. Hypothesis 4: Private companies working with small‐scale producers always make use of public subsidy arrangements. The study shows that Bimandiri, as a private company, was willing to collaborate with small‐holder farmers without making use of government subsidies. In contrast, Bimandiri is anxious to provide advance funds for KUBM farmers in order to help farmers purchase production inputs. Figure 3.5 also identifies the management factor as the second most important, because through good management can planning, organizing, market practice, and monitoring be efficient. In terms of marketing policy, Bimandiri provided and guaranteed farmers production channels to the competitive market. However, farmers must commit to

23
producing the best quality mangos. Farmers followed the norm of partnership because of the high price incentives and quick payment. Moreover, the system has become important in helping farmers escape from the capital loan trap of local traders. The KUBM organization has been well managed and provides salary to the management board based on position and responsibility. A Memorandum of understanding (MoU) between KUBM farmers and Bimandiri is aimed at maintaining the legality of all parties’ commitments. In terms of product policy, Bimandiri has the primary function of ensuring quality standards and quantity fulfillment.

24
5 Impact of innovation 5.1 Impact on mango marketing (supply chain) The farmers involved in the transparent margin partnership perceived several changes after their inclusion, among them: increased income, market guarantees for their product, higher prices than from the traditional markets, faster payment, and better access to market information. The impact of the transparent margin inovation can be analyzed from four kinds of flow changes in the mango supply chain: physical product, information, knowledge, and capital flow. 5.1.1 Product flow A change in physical product flow occurred after the transparent margin system was instituted. Prior to innovation, mangos flowed through conventional marketing channels from farmers to collectors to wholesalers and, finally, to the traditional wholesale markets (Figure 3.1). After the innovation, the marketing chain was shortened significantly and the volume delivered was greatly increased (Figure 3.2). At the time of the partnership with Hero, the volume of mangos delivered to the supermarket was only 30 per cent, while the remainder went to traditional markets. After innovation, i.e., when the KUBM group entered into partnership with Carrefour, the figure increased to 35 per cent, with the remainder going to the traditional markets (Figure 3.3). The illustration shows that the partnership with Carrefour is more profitable than the one with Hero. This is also apparent from the decrease in management fees, from 15 per cent (five per cent for Hero, five per cent for Bimandiri, and five per cent bridging fee) to only five per cent for Bimandiri as management fee. 5.1.2 Information flow A change in information flow also occurred after the introduction of the institutional innovation. Before innovation, price information from traditional markets was passed to farmers via the dealers and collectors (Annex 2, Figure 1). Under these conditions, the farmers had no other alternative and marketed their products only to traditional markets. Furthermore, they did not have information on the prevailing prices in the market, which rendered them passive price takers. After innovation, when farmers first collaborated with Hero, there was substantial change in information flow not only as regards price information, but with regard to quantity, quality, delivery schedules, and formal agreements between the group and Hero (Annex 2, Figure 2). Innovation improved further when a new collaboration was established with Carrefour and the collaboration with Hero was terminated. This new arrangement made information on

25
market opportunities available which had previously been absent in the collaboration with Hero (Annex 2, Figure 3). The market opportunity provided by Carrefour was perhaps meant to maintain punctuality of delivery by the suppliers. During the partnership between farmers and Hero (later with Carrefour), farmers were still integrated into the traditional market through collectors and dealers, with around 65 per cent of their produce sold through this channel. Interestingly, the innovation brought changes in information flow from the traditional markets. Where earlier there had been only price flow, there was now quantity information flow. This condition reflects the propagation effect of the innovation on the surrounding marketing systems, including the traditional markets. 5.1.3 Knowledge flow A change in flow of knowledge occurred after the innovation in which there was additional flow of know‐how and quality supervision by Bimandiri and Hero to the Aspirasi Group to guarantee the quality, quantity, and continuity, which had been absent in the traditional market system (Annex 3, Figures 1 and 2). After innovation, i.e., after the partnership with Carrefour was established, there was a flow of know‐how from Bimandiri to the management of KUBM , which enabled the farmers to have direct access to the Carrefour Distribution Centre (Annex 3, Figure 3). This enabled the farmers to quickly follow changes in the market. For example, the farmers were able to respond quickly to the quality of mangos with regard to freshness and shrinkage level required by the supermarket. 5.1.4 Capital flow Innovation brought about new capital flow. Prior to innovation, there was only capital flow from the dealer to the collector, so that the collectors could provide money up front to the farmers (Annex 4, Figure 1). After innovation, however, during the partnership with Hero, Bimandiri provided reserve funds to Aspirasi with a five per cent management fee (Annex 4, Figure 2). After the innovation, the arrangement was continued (Annex 4, Figure 3) in the partnership with Carrefour, despite some delays in the payback process early in its establishment. This situation proves that capital aid from the government was not the main factor for the success of the innovation. The most important element seemed to be the member’s commitment to manage the fund, and their ability to follow changes in a dynamic market. The farmer who could follow the innovation adopted a contract system, and was thus able to obtain price and market guarantees. In the contract system, there was agreement

26
on quality, quantity, delivery schedule, and information on market opportunity. Thus, KUBM functioned as agent for Carrefour and also for the farmers, whereas Carrefour acted as Principal. In the case of mangos in Pemalang, the Principal could not monitor the behaviour of its agents, and it was with the help of Bimandiri that the partnership could come about. Bimandiri indirectly brought about change in know‐how and capital flow. Networking increased the company’s social capital by increasing access to information, assistance technique, and financial support (Coleman 1990; Burt 1997 and 2007). Through Bimandiri, the KUBM farmers were given access to the modern market, and the farmers achieved a higher bargaining position by means of price negotiation between the farmers and Carrefour. Moreover, organisation and management of KUBM improved, resulting in greater trust on the part of Carrefour. In network theory, collaboration is based not only on profit , but also on power and trust (Uzzi 1997). 5.2 Impact of the supply chain on governance Institutional analysis of the governance of the supply chain divides the actors into three roles: legislative, executive, and judicial (Kaplinsky 2000). Innovation resulted in changes in the governance of the supply chain. Despite the absence of particular and written regulations, every stakeholder had the right and obligation to implement his or her respective role. Prior to innovation, the functions of legislative, executive, and judicial governance were all executed by the dealer in the traditional market. After innovation, the three roles were no longer centred on the dealer, but were shared by Hero, Aspirasi, and Bimandiri. There was a shift in the role of legislative governance from Hero to Carrefour, and a transfer in the role of executive governance from Aspirasi to the management of KUBM. Judicial governance remained with Bimandiri. The flow of governance legitimacy before innovation is presented in Annex 5, Table A. It shows that in the traditional market, it was the dealer which carried out legislative, executive, and judicial governance. It was this dealer who made, implemented and monitored the rules, sometimes capriciously, resulting in poor governance legitimacy among all the traditional market actors. After innovation, there was a change in the flow of governance legitimacy (Annex 5, Table B). Hero carried out legislative governance, Aspirasi executive governance, and Bimandiri judicial governance, as evidenced by the legitimacy of governance flow

27
among the three actors. Hero set standards for suppliers, created a schedule for punctual product delivery, and for the frequency and quantity of delivery, none of which had previously been implemented. Aspirasi implemented the rules by providing assistance to the member farmers, to encourage them to meet the stipulated standards. Bimandiri, on the other hand, monitored the supplier implementation in meeting already stipulated quality standards. After some improvements to the innovation, i.e., when Carrefour replaced Hero, there was a change in governance legitimacy flow. Carrefour carried out legislative governance, KUBM management dealt with executive governance, and Bimandiri continued to handle judicial governance (Annex 5, Table C), with a high level of governance legitimacy among the three actors. Aspirasi and the KUBM management played different roles with regard to executive governance. On the one hand, Aspirasi provided technical assistance to the farmers referred to the field extension specialists who adhered to the government programme, and followed less carefully the changes taking place in modern dynamic markets. As a result, Aspirasi farmers were excluded from the innovation process. The KUBM management, on the other hand, provided technical assistance to the farmers under their care by referring to the Bimandiri programme which was implementing the changes occurring in dynamic modern markets. The only farmers who were included in the innovation were those who were capable of coping with the changes demanded by the dynamic modern markets, whereas the ones who were excluded returned to their relationship with the traditional market actors who had poor governance legitimacy. As a result, farmers who lost their market opportunity had no guarantee of product quality, and any price guarantee or market security, ending with only moment‐to‐moment transactions or spot markets. Annex 7 shows that even though there were differences in governance roles, individual relationships among the stakeholders was good, with the exception of Carrefour, which shows poor relationships, in the 5 to 8 value range. This is understandable because Carrefour as Principal in the Agency Theory (Douma et al. 1991) did not directly observe agents’ behaviour and knew only about the agents’ work efforts. Hypothesis 5: farmer organizations that supply to dynamic markets have little or no influence over chain governance issues Research showed that the KUBM farmersʹ organisation had effect on supply chain governance, especially in implementing rules (executive governance). This shows that the KUBM management could make bargaining position to become better and control product quality.

28
5.3 Active role of the supply chain champion Bimandiri is a model of the supply chain champion, whose chief concern in the business operation is not short‐term profit, but market development capability and long‐term profit. Bimandiri positioned itself as an innovating entrepreneur, not as a trader (Amit et al. 1993; Drucker 1985; McGrath 1996; Stevenson and Jarillo 1990). An entrepreneur is a catalyst for innovation (Schumpeter 1961). Suppliers like Bimandiri are needed by Carrefour as reliable partners in following dynamic market change. Corporate entrepreneurship links entrepreneurial behaviour to organisation (Echols and Neck 1998). This is the foundation on which management faces governmental challenges and stimulates innovation (Barringer and Bluedorn, 1999). It is also the responsibility of entrepreneurs to encourage innovative organisation by testing potential new opportunities, acquiring new resources, and by implementing, exploiting, and commercialising new products or services (Guth and Ginsberg 1990; Kuratko et al. 1990; Sathe 1989; Stopford and Baden‐Fuller 1994; Thornberry 2003). Corporate entrepreneurship also includes various behaviours and acts which enhance a company’s capability to take risks, and the scope of opportunity and innovation (Zahra, 1991, 1995). Further, Leibenstein (2005) said that entrepreneurs always engage in one or more activities, organise, and make use of appropriate resources in order to produce and market new products or services, coordinate contract arrangements between partners and suppliers, create the right organisational structures and culture to develop and manufacture new products or services, respond to market deficiencies with additional resources in the absence of a market, and provide contacts between buyers and sellers at different locations. Bimandiri engaged in almost all these activities of corporate entrepreneurship. From the analysis of stakeholders’ rights, obligations, and benefits (Annex 6), the KUBM farmers were categorized to avoid risk by surrendering mangos to KUBM management due to the existence of market and price guarantee. The KUBM management may be understood to have self‐insured its risk, because they kept funds in reserve when mango prices declined, but withdrew them when mango prices were favourable. Bimandiri shared the risk and received a 5 per cent management fee without becoming involved in production itself. On the other hand, Carrefour mitigated risk by expecting quality and punctual product continuity.

29
Hypothesis 6: The private sector (processors, retailers) is generally seen as having a passive role, buying product when available at the right quality, price, risk profile and transaction cost. Research indicated that, as a private company, Bimandiri played an active role in determining quality, price, risk, and control of transaction fees. This is illustrated by the fact that Bimandiri provided technical assistance to the KUBM management, initiated cultivation and cutting techniques, post‐harvest handling, grading, labelling, and packing, resulting in better quality.
Aspirasi may be said to belong to being bold in risk taking, because Aspirasi looked for its own market and transacted with traditional market actors at fluctuating prices. Beulens (2000) revealed that there are five kinds of risks in transparency dilemma, namely, contamination risk, poaching risk, risk of stealing, asset specificity risk, and loss of resources control risk. With regard to transparency dilemma, in this case, there was the tendency for KUBM to engage in poaching risk, because the resources it acquired benefited only the KUBM farmers or the KUBM management. 5.4 Value‐chain mapping The marketing chain for off‐season mangos from Pemalang, after the improved institutional innovation (by the establishment of KUBM, see Figure 3.3) has several value‐chain alternatives. In this section, only six value chains will be mapped and analyzed, namely, the value chain through KUBM and through Aspirasi (Figure 4.1). Value chains 1A and 2A are the farmers’ marketing channels directly through KUBM with permanent members. As shown in Figure 3.3, 35 per cent of the off‐season mangos sold by KUBM were channelled to Carrefour (1A), while the other 65 per cent were channelled through the traditional wholesale markets. Value chains 3A and 4A are the marketing channels from independent farmers bought by KUBM through collector traders or middlemen in pre‐harvest transactions. The ratio of those channelled to Carrefour and the traditional market was also the same, namely 35 per cent and 65 per cent. Meanwhile, value chains 8A and 9A represented off‐season mango marketing through Aspirasi, directly as well as through middlemen, and bought by way of pre‐harvest transaction.

30
Figure 4.1. Off‐season mango value chain mapping in Pemalang
No Value Chain Mapping 1A 2A 3A 4A 8A 9A
In each chain, the majority of the farmers received their highest profit share (value added) due to the high price of off‐season mangos. As shown in Annex 15, off‐season mango sale prices ranged on average between Rp4,000 and Rp9,000, while the prices of in‐season mangos ranged between Rp1,200 – Rp1,500. The majority of the farmers at Pemalang were independent and not committed to a group. They usually sold their produce to collectors on a pre‐harvest basis. Indeed, in general, when farmers sell their produce to collectors or dealers, they usually use the pre‐harvest selling system. It was only the KUBM and Aspirasi groups that were willing to buy on the basis of quality grade. It is to be regretted, however, that a very low percentage of the mangos the farmers produced were of good quality (A). Thus the remainder had still to be sold to the traditional market. Value‐chain analysis was conducted on the six value chains in groups on the basis of institutional channels, that is, through KUBM and Aspirasi, and the results will be discussed in the next sections. 5.5 The off‐season mango supply chain through KUBM
Chain 1A became the main objective of the KUBM farmers, that is, to the Carrefour modern retail market. This channel provided high value‐added for the farmers due to the highest quality and price. However, only about 35 per cent of the mangos produced
Farmer
Farmer
Farmer
Farmer
Farmer
Farmer
KUBM
KUBM
KUBM
KUBM
Collector
Collector
Collector
Carrefour
Carrefour
ASP
ASP
Trad wholesale Market
Traditional Retail Market
Trad. wholesale Market
Trad. wholesale Market
Trad. wholesale Market
Traditional Retail Market
Traditional Retail Market
Traditional Retail Market

31
Total Value added Rp. 7.849,-
by the KUBM farmers could be accepted by Carrefour. The remaining sub‐standard mangos were marketed to the traditional retail market (Chain 2A).
Chain 1A Cost Value‐ Added
Chain 2A Cost Value‐ Added In chain 1A as well as in chain 2A, the KUBM farmers received the highest profits, when compared to the whole of the value‐added activities in the chain mentioned, that is, 67 per cent and 60 per cent. This means that institutional innovation had an impact in the form of increased income for the farmers. The total value‐added for value chain 1A was Rp11.399 per kg of mango—higher than that of value chain 2A, which came to Rp7,849 per kg. This is of course understandable, because activities in value chain 1A produced mangos of better quality. Out of the total value‐added produced in both these value chains, the farmers enjoyed the greatest benefits as compared to other actors. To obtain such a high value‐added, the farmers had to sacrifice Rp1,326 per kg most of which (65 per cent) was spent on agro input expenses. For example, farmers increased
37% Farmer 67%
49% KUBM 11%
14%
Carrefour 22%
- Labor cost 35% - Agro input cost 65%
29% Farmer 60%
48% KUBM 15%
5%
Trad. wholesale market
9%
18%
Traditional retail market
17%
- Labor cost 35% - Agro input cost 65%
Total Value-Added Rp. 11.399,-

32
their use of pesticides in order to boost productivity in the course of pursuing the highest off‐season profits. Due to the small quantity of mangos available in the off‐season, wherever the KUBM farmers marketed their mangos, to the modern market (1A) as well as to the traditional market (2A), the profit was still highest for the farmers. 5.6 The off‐season mango supply chain: KUBM indirect to independent
farmers (non‐members) Chains 3A and 4A represent the KUBM sale chain to additional buying sources. To keep up with the continuous demand of the modern market, KUBM was required to keep up a supply of high quality products, by obtaining mangos from member farmers, a portion of whose products were supplied by middlemen (five per cent). In Chain 3A, the middlemen traders received large profits. In Chain 4A, however, it was the farmers who made the highest profits. The total value‐added of Value Chain 3A was Rp11,647 per kg of mango, and 42 per cent of this total value‐added was obtained through middleman traders, who carried out harvesting and provision of goods. These services required an outlay of only Rp128 per kg of mangos, the greater part being used for the provision of goods (66 per cent). In this chain, the middleman farmer made the smallest sacrifice and made the highest profit. The selling price to KUBM was high, but the buying price from the farmers using the pre‐harvest system was low. In this value chain, the independent farmers did not get the greater part of the profit, even though they sold to KUBM through middlemen. The total value‐added in Value Chain 4A was Rp8,098 per kg of mango. The activity carried out by the independent farmers was worth most of the profit. The total expenses for the activities in this supply chain were Rp974 per kg, and the largest expense was for agro input cost, that is, 52 per cent.
Chain 3A Cost Value‐ added
52% KUBM 11%
4%
Collector (42%)
16%
Carrefour 21%
29% Farmer 26%
- Harvesting cost 34% - Procurement cost 66%
Total Value added Rp. 11.647,-

33
Total Value added Rp. 8.098,-
Chain 4A Cost Value‐ added 5.7 Off‐season mango supply chain through Aspirasi Chains 8A and 9A represent the off‐season mango marketing chains through Aspirasi where the objective of marketing was the traditional wholesale market. The supply chain consisted of two parts of value chains: with and without middleman traders. Aspirasi obtained most of their products through middleman traders (60 per cent), while the other 40 per cent originated from Aspirasi member farmers. In Value Chain 8A as well as in Value Chain 9A the farmers had large profits, namely, 38 per cent and 52 per cent, respectively, out of the total value‐added.
22% Farmer 37%
52% KUBM 11%
3% Collector
23%
5%
Trad. wholesale market
9%
19%
Retail traditional market
16%
- Labor cost 48% - Agro input cost 52%
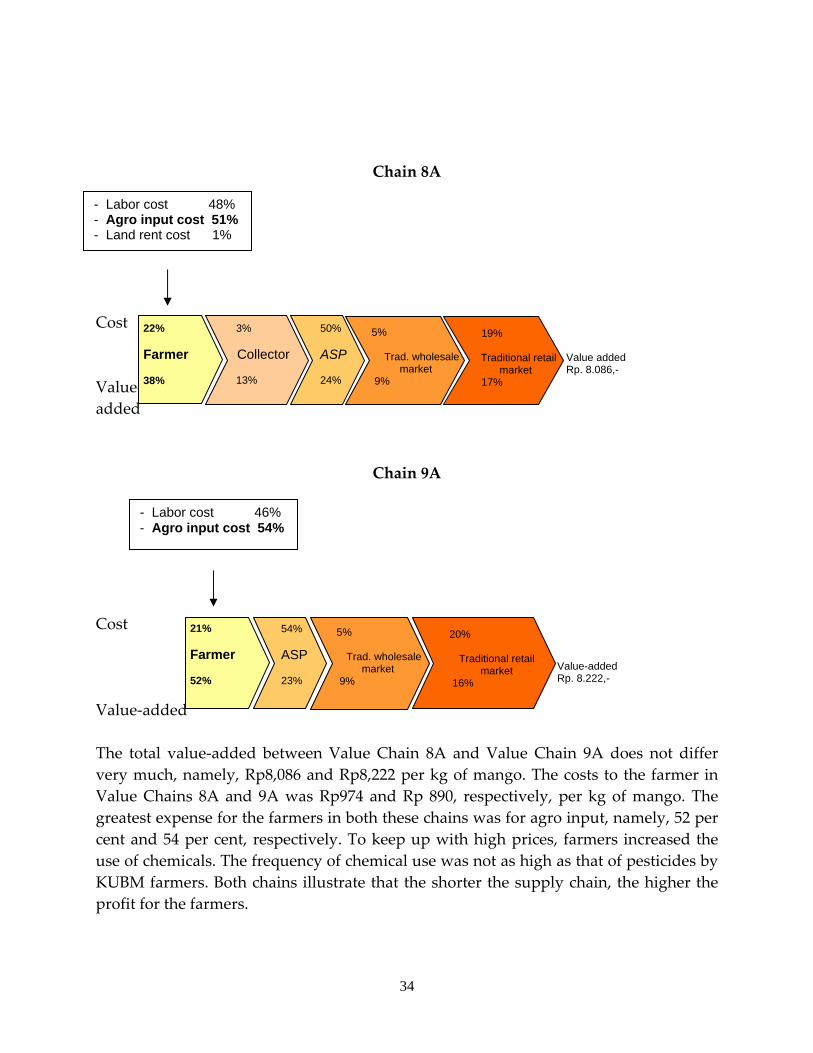
34
Value added Rp. 8.086,-
Value-added Rp. 8.222,-
Chain 8A Cost Value‐ added
Chain 9A
Cost Value‐added The total value‐added between Value Chain 8A and Value Chain 9A does not differ very much, namely, Rp8,086 and Rp8,222 per kg of mango. The costs to the farmer in Value Chains 8A and 9A was Rp974 and Rp 890, respectively, per kg of mango. The greatest expense for the farmers in both these chains was for agro input, namely, 52 per cent and 54 per cent, respectively. To keep up with high prices, farmers increased the use of chemicals. The frequency of chemical use was not as high as that of pesticides by KUBM farmers. Both chains illustrate that the shorter the supply chain, the higher the profit for the farmers.
22% Farmer 38%
3% Collector 13%
50% ASP 24%
5%
Trad. wholesale market
9%
19% Traditional retail
market 17%
- Labor cost 48% - Agro input cost 51% - Land rent cost 1%
21% Farmer 52%
54% ASP 23%
5%
Trad. wholesale market
9%
20%
Traditional retail market
16%
- Labor cost 46% - Agro input cost 54%

35
When comparing Value Chain 8A with Value Chains 3A and 4A (sale through middlemen), there is no difference in profit between the farmer who sold his product to KUBM and one who sold his product through Aspirasi. From the point view of the farmer’s profit in each chain, sale through Aspirasi yielded higher profits for the farmer. However, when ccomparing Value Chain 9A with Value Chains 1A and 2A (farmer’s direct sale), there is a difference in profit for the farmers. The farmer who sold his product directly to KUBM obtained higher profits compared to those who sold their products directly to Aspirasi. However, to affect sale through KUBM, the farmer had to offer 11 per cent greater sacrifice, in particular for agro input cost. 5.8 Costs and bbenefits Institutional innovation promotes increased income and improved financial flows, thus motivating stakeholders to persevere with innovation. In this case study, institutional innovation has changed costs and benefits at several levels, for both farmers and participants in the supply chain. 5.8.1 Costs and benefit for farmers Farmers’ production expenses, production costs, product value, and profits changed after institutional innovation. Productivity, quality standards, and product value meant higher profits for the included farmers, in comparison to other farmers overall. This is apparent when one compares the KUBM farmers with the independents who sold to KUBM through middlemen, and Aspirasi (ASP) farmers (see details in Annex 15). The supply chain that provided the highest value added was the innovation supply chain in column 1A, that is, the activities of the KUBM farmers. Table 5 shows a comparison of what was received by the KUBM farmers with that of the other farmers. It is clear from Table 5 that production costs and production levels of the included farmers were higher than that of the ones who were excluded. (Table 4.1)
Table 4.1. Difference in production costs, production levels, quality standards, product value and profit between KUBM, Aspirasi, and independent farmers
Variable KUBM farmers (1A) Aspirasi farmers
(9A) Independent farmers (3A)
Production costs Rp1,326/kg Rp1,326/kg Rp973/kg Off‐season production 13,5 Tons 12 Tons 10 Tons Quality standards and share
30% A, 40% B, 30% C 12% A, 8% B, 20% C, 50% D
Without grading
Product value per grade A=Rp9,000; B=Rp6,000;
A= Rp9,250, B= Rp. 6250, B= Rp3,250, B=
Rp. 4,000

36
C=Rp3,000 Rp2,000 Profit Rp7,674/kg Rp4,297/kg Rp3,026/kg
Table 4.1 indicates that the production costs of included farmers were greater than the production costs of farmers as a whole. Table 4.2 shows that the highest costs (more than 65 per cent of total expenses) were for off‐season spraying, used by the KUBM farmers to increase their production and product value in the off‐season. Table 4.2 Comparison of production costs of KUBM, Aspirasi, and independent
farmers
Production costs KUBM farmers (1A)
Aspirasi farmers (9A)
Independent farmers (3A)
Labours costs 35% 48% 46% Agro input costs 65% 51% 54% Land rent 0,1% 1% 1% Total (Rp/kg) 1,326 890 974 Percentage of total cost in the value chain
37% 29% 21%
In relation to production costs, column 1B and column 2B in Annex 15 illustrates that if the KUBM farmers had used only their agricultural activities and had marketed their product only to traditional markets, the profit they received would have been smaller than that of other farmers. These high production costs resulted from the fact that innovation could not be applied to in‐season commodities, targeted entirely at the traditional markets. Because the greater part of the farmers’ produce entered the traditional retail market, not all farmers were interested in being included in the innovation process. .The production yield of KUBM farmers (included) was 100 per cent, distributed to KUBM (RPO). The sale of mangos to KUBM had higher value because of the grade quality requirements which were relatively high. The quality of the KUBM farmers’ produce were 30 per cent grade A, 40 per cent grade B, and 30 per cent grade C. This was not the case with the Aspirasi farmers who entered the innovation process later. Their supply management was not controlled, with the result that the quality of the produce was also not controlled. Even though the farmers’ productivity was not different and even though it offered higher prices to the farmers, the low grade standard resulted in a sharp decline of the value of the produce received by the farmers. Table 4.1 shows that the product value given by KUBM to its members was lower than that of other market actors. When one compares the variety of quality standards the

37
KUBM farmers were capable of meeting, it will be noted that the majority (40 per cent) was Grade B, equalling a product value of Rp6, 000. Meanwhile, most of the other farmers’ produce (60 per cent) was Grade D, with a value of Rp2, 000. This answers the question why farmers preferred to sell their produce using the pre‐harvest system and middleman traders. Table 4.3. Comparison of profit levels of KUBM, Aspirasi, and independent farmers Cost KUBM farmers
(1A) Aspirasi farmers(9A)
Independent farmers (3A)
Value‐added (Rp/kg) 7,674 4,297 3,026 Total costs (Rp/kg) 1,326 890 3,026 C/B ratio 5.79 4.83 3.11 Even though production costs were high, productivity, quality, and high prices yielded higher profits. Table 4.3 illustrates the profit level of each farmer. The profit level of KUBM farmers was high compared to that of both Aspirasi and independent farmers. The net C/B ratio for each farmer (5.79, 4.83, and 3.11, respectively) proves that innovation was responsible for increasing farmer’s income. Hypothesis 7: There is no clear evidence to show that inclusion and exclusion within dynamic markets defines the difference between ‘winners’ and ‘losers.’ The study shows that included farmers (members of KUBM) generally gained higher profits then excluded farmers (members of Aspirasi) in both the marketing chain to supermarkets as well as the marketing chain to traditional markets.
5.8.2 Costs and benefits at the supply chain level At the supply chain level, institutional innovation caused changes in the distribution of profit level in the whole supply chain, in transaction value, and in volume of produce. The change in profit level distribution is seen from the net C/B ratio value of each actor (ratio of value‐added/kg and cost/kg). The change in transaction value and volume is seen from the selling price and the percentage of product flow in the chain. Table 4.4 illustrates the net C/B ratio for each actor in every supply chain.

38
Table 4.4 Net cost/benefit (C/B ) ratio of actors in the supply chains
Value chain of KUBM Value chain of KUBM
through collectors Value chain of Aspirasi Actor
1A 2A 3A 4A 8A 9A 1. Farmers ‐ KUBM farmers 5,79 3,53 ‐ ‐ ‐ ‐ ASP farmers ‐ ‐ ‐ ‐ ‐ 4,83 ‐ Independent farmers ‐ ‐ 3,11 3,11 3,11 ‐ 2. Collector ‐ ‐ 38,20 14,68 8,31 ‐ 3. KUBM 0,71 0,52 0,73 0,54 ‐ ‐ 4. Aspirasi ‐ ‐ ‐ ‐ 0,90 0,84 5. Traditional wwholesale market*)
‐ ‐ ‐ ‐ ‐ ‐
6. Traditional rretail market ‐ 1,58 ‐ 1,58 1,58 1,58 7. Carrefour 4,77 ‐ 4,77 ‐ ‐ ‐ Note: Profit was obtained through marketing fee provided by the wholesaler in the amount of ten per cent
In the KUBM supply chain without middleman traders (supply chains 1A, 2A, and 9A), the farmers made the highest profit level in every chain. When the mango marketing to KUBM was carried out through middleman traders (supply chain 3A, 4A, and 8A), the highest profit level was with the middleman traders. The actor indicating the highest Net C/B ratio was the middleman trader in the Value Chain 3A, that is, 38.20. Middleman traders, in sales through KUBM as well as through Aspirasi, still received high profit levels for off‐season commodities. The middleman trader was one of the market actors carrying out business with little sacrifices but making significant income. However, the middlemen traders faced considerable risk, since they were using the pre‐harvest purchasing system. The Net C/B ratio in the KUBM supply chain to the traditional wholesale market (2A) as an outlet for poor quality mangos was 0.52. KUBM was already aware that every sale to the traditional wholesale market would not yield high value‐added, because the fruit were considered to have been rejected by the supermarket.

39
6 Replication potential of innovation Increasingly stiff competition among the modern retail markets will spur the application of a more efficient procurement system. In the near future, large modern retail market actors such as Carrefour, Giant, and Hypermart will introduce a centralized fresh and processed food products procurement system through distribution centres (DC) and is expected to replace the prevailing store‐to‐store procurement system. This change will have implications for the existing fresh and processed food suppliers and processors that is for their ability to supply a continuous large volume of goods, to face the strict application of increasingly high product quality standards, and to improve production processing cost efficiency. In anticipation of this change, suppliers to modern retail markets should design a new procurement system, capable of guaranteeing product availability, quantity, and quality at competitive and differentiated prices. In order to realise this goal, suppliers should take the initiative to have direct relationships with producers or organised farmers. The business partnership model implemented by Bimandiri and KUBM is one alternative in best practice to anticipate the decentralization of procurement policy currently envisaged by modern retail marketers. The margin transparency system is a form of co‐innovation which resulted from the strategic alliance of KUBM and Bimandiri in the mango supply chain of the village of Asem Doyong, Pemalang. The continuation of this KUBM‐Bimandiri partnership will be dependent on the strong commitment and trust of both parties in the partnership, on marketing transformation, innovation learning, risk management, and on the role of the village production organisation based on marketing value. On the basis of this best practice, it is anticipated that a modern retail market will develop, followed by change in the procurement system. This will require policy intervention to promote wide replication of the partnership in question, creativity, and input from both decision makers and researchers to ascertain the determining factors of the success of partnership systems such as that undertaken by Bimandiri and KUBM To replicate the success of the margin transparency system, the government could take the following steps: 1. Search for champions from among entrepreneurs in the chain of agricultural
commodity supply to modern retail markets. A champion would be an

40
entrepreneur, like Bimandiri, which possesses corporate entrepreneurship to develop a co‐innovation creation system with partners. In this search process, the government would do well to collaborate with research institutions and universities.
2. Provide incentive to the champion to carry out replication of institutional marketing
transformation. The champion in question should be spurred to become the marketing agent of the village production organisation. In this marketing institution, ownership is not transferred from producer and/or village production organisation to champion. Rather, there is only a transfer of product control. Ownership transfer only occurs from producer to the final destination market. As agent, the champion will receive a commission or share of the output from the business it carries out in order to provide added value for the producer‐end of the market relationship. This value‐ added business process creates a transparent information system, provides reserve funds, financial support, and technical assistance. The incentive the government could provide to the champion is access to modern financial market facilities, such as factoring, investment funds, working capital, and partnership with state‐ and university‐owned research institutions to accelerate the process of co‐innovation and chain upgrading through exchange of experience and innovation learning.
3. Facilitate the establishment of multi‐stakeholder organisations specifically aimed at
monitoring and advocating the partnership process in the modern retail market business. Such organisations would act as trusted resolution agents in the event of conflict between actors in the modern supply chain.
4. Facilitate funding for research and development of an effective, efficient, integrated
agribusiness supply chain, capable of competing in both domestic and global markets.
5. Facilitate the development and certification of integral chain care, such as the
HACCP System, GAP, GPP, GHP, GMP, and traceability systems.
41
7 Conclusions and policy implications 7.1 Conclusions
1. The transparent margin partnership system is a co‐innovation marketing institution which gives farmers direct access to the supermarket with support from Bimandiri, the value chain champion, in the form of quality assurance, continuity of supply, technical assistance, and bridge capital service to farmers. Product ownership does not change within the marketing institution. Exchange takes place between the farmer group KUBM and Carrefour, the modern retailer, and Bimandiri receives a commission of 5 per cent from the sales made in the partnership.
2. The transparent margin system results in dynamic changes at the producer’s level.
The system encourages farmers to work both individually and as a group to transform the farmer’s relationship to the market, moving from spot market‐based to contract‐based.negotiation.
3. The specialized supermarket wholesaler ( e.g., Bimandiri) developed the partnership
system in response to the demands of a dynamic market, which requires farmers to be organised in order to guarantee product quality and continuity.
4. Factors that support the inclusion of farmers in such intitutional inovation as the
transparent margin system are their ability, willingness, and trust in adapting to and changing the rules of the game created by a dynamic market and in adopting incentives that support individual as well as group business development.
5. Farmers have the most to gain from the transparent margin system, as is indicated
by the increase in their income (compared with pre‐innovation). They received highest value‐added in the chain, gained a guaranteed market, and were assured a higher price (for better quality) than the traditional market could pay. In addition, the system also gives the farmer faster payment after the harvest and provides access to market information.
6. Sustainability of the transparent margin partnership system depends on the strong
commitment and trust of all agents involved, the ability to transform institutions, innovation learning, risk management functions, and rural production organisations.

42
7. Government can be the catalyst for replicating institutional inovation by giving incentives to the supply chain champion and other suppporting agents, according to the requirements of dynamic market development.
7.2 Policy Implications
The success of Bimandiri, the supply chain champion, in providing market access to small mango producers (members of the KUBM farmer group) to Carrefour without any subsidies or support from the government, suggests that the government should not interfere in the workings of the partnership. However, the partnership system that can potentially link farmers with dynamic markets and increase the well‐being of farmers, as was done by Bimandiri and KUBM, should be systematically promoted and supported by; 1. Giving incentives, such as tax deductions, technical support, information access, etc.,
to any agribusiness company, supermarket supplier, or food industry which has the potential to take a leadership role in becoming a supply chain champion and in creating a partnership with small farmers in a transparent system.
2. Providing capacity‐building training for rural production organisations (RPO) in
such technical aspects as GAP, GPP, GHP, food safety certificates (HACCP), management, and farmer group dynamics.
3. Facilitating a financial system which supports actors in a dynamic market by
factoring, encouraging investment, providing working capital, using unpaid letters of credit from a supermarket supplier as collateral.
4. Supporting a development of multi‐stakeholder institution which can become a
trusted mediation agent to resolve conflict, disputes, or breach of contract among actors in the market supply chain.
5. Providing incentives to facilitate development of public private partnerships for
research and development of agribusiness supply chain integration, in order to enhance competitive and comparative advantage of Indonesian products in the global market.

43
8 References – Bold numbers of journals Amit, R., L. Glosten and E. Muller (1993) ‘Challenges to theory development in entrepreneurship research’ in Journal of Management Studies 30(5):815–34. Badan Pusat Statistik (2004) Produksi Tanaman Sayuran dan Buah‐buahan, Jakarta. ——— 2005 Statistik Indonesia. Jakarta. ——— 2005 Statistik Ekspor Indonesia. Jakarta. ———2005 Statistik Impor Indonesia. Jakarta. Banet, A.G. (1976) ‘Bion interview’ in Group and Organisation Studies 1:268–85. Baringer, B.R. and A.C. Bluedorn (1999) ‘The relationship between corporate entrepreneurship and strategic management’ in Strategic Management Journal 20(5):292–303. Burt, R.S. (1997) ‘The contingent value of social capital’ in Administrative Science Quarterly 42:339–65. ——— (2002) ‘The social capital of structural holes’ in Guillen, M.F., R. Collins, P. England, (eds) The new economic sociology: Developments in an emerging field, New York: Russel Sage Foundation, 148–92. Chamala, S. (1995) ‘Overview of Participative Action Approaches in Australian Land and Water Management’ in Chamala, S. and Keith, K. (eds) Participative approaches to Landcare: Perspectives, policies and programs, Brisbane: Australian Academic Press. Chiesa, V., P. Coughlan, and C. Voss (1996) ‘Development of a technical innovation audit’ Journal of Production Innovation Management 13:105–36. Coleman, J. (1990) Foundations of Social Theory, Cambridge, MA: Harvard University Press. Covin J.G. and D.P. Slevin (1991) ‘A conceptual model of entrepreneurship as firm behaviour’ in Entrepreneurship: Theory and Practice 16(1):7–25. Douma, Sytse and Hein Schreuder (1991) Economic Approaches to Organizations, New York: Prentice Hall.
44
Doz, Y.L., and G. Hamel (1998) Alliance advantage: The art of creating value through partnering, Boston: Harvard Business School Press. Drucker, P. (1985) Innovation and Entrepreneurship, New York: Harper & Row. Echols, A.E. and C.P. Neck (1998) ‘The impact of behaviours and structure on corporate entrepreneurial succcess’ in Journal of Managerial Psychology 13 (1/2):38–46. Guth, W.D., and A. Ginsberg (1990) ‘Guest Editors’ Introduction: Corporate Entrepreneurship. Strategic Management Journal 11(5):5–15. Kaplinsky, Raphael (2000) ‘Spreading the gains from globalisation: What can be learned from value chain analysis?’ IDS Working Paper 110, Institute of Development Studies, University of Sussex, Brighton, UK. May. Knox, S. (2002) ‘The boardroom agenda: Developing the innovative organization’ in Corporate Governance 2(1):27–39. Kuratko, D. F., R.V. Montagno, and J.S. Hornsby (1990) ‘Developing an Intrapreneurial Assessment Instrument for an Effective Corporate Entrepreneurial Environment’ in Strategic Management Journal 11(5):49–58. Lamming, RC, N.D. Caldwell, D.A. Harrison, and W. Philips (2001) ‘Transparency in Supply Relationships: Concept and Practice’ in The Journal of Supply Chain Management 37(4): 4–10. Lumpkin, G. T., and G.G. Dess (1996) ‘Clarifying the Entrepreneurial Orientation Construct and Linking It to Performance’ Academy of Management Review 21(1):35–72. Mc Fadzean, Elspeth, Andrew OʹLoughlin, and Elizabeth Shaw (2005) ‘Corporate Entrepreneurship and Innovation Part 1: The Missing Link’ in European Journal of Innovation Management 8(2):2005. Mc Grath, R.G. (1996) ‘Options and the entrepreneur: Toward a strategic theory of entrepreneurial behaviour’ Working Paper, Columbia University. Rangkuti, Fahwani Y. (2004) Indonesia Retail Food Sector Report 2004. GAIN Report No: ID3028. USDA Foreign Agricultural Services. Jakarta. Reardon, T. (2005. The Impact of the Rise of Supermarkets on Horticulture Markets and Farmers in Indonesia, Department of Agricultural Economics, Michigan State University.

45
Ren, L., Krabbendam, J.J., and P. De Weerd‐Nederhof ( 2006) ‘Innovation Practices Success in China: The Use of Innovation Mechanisms in Chinese SOEs’ in Journal of Technology Management in China 1(1), 2006. Sathe, V. (1989) ‘Fostering Entrepreneurship in the Large Diversified Firm’ In OrganisationalDynamics 18(1):20–32. Schumpeter, J.A. (1934) ‘The Theory of Economic Development: An Inquiry into Profits, Capital, Credit, Interest, and the Business Cycle’ New York: Oxford University Press. Stevenson H.H., and J.C. Jarillo (1990) ‘A Paradigm of Entrepreneurship: Entrepreneurial Management’ in Strategic Management Journal 11:17–27. Stopford, J.M. and C.W.F. Baden‐Fuller (1994) ‘Creating corporate entrepreneurship’ in Strategic Management Journal 15:521–36. Thornberry, N. (2001) ‘Corporate Entrepreneurship: Antidote or Oxymoron?’ in European Management Journal 19(5):526–33. Tuckman, B. W. (1965) ‘Developmental sequence in small groups’ in Psychological Bulletin 63:384–89. Trienekens J.H. and S. Willems (2002) ‘Cross‐border Agri Supply Chains’ in The Challenge of Global Chains: Integrating Developing Countries into International Chains, a Potential risk or an Oportunity? Mercurius Wageningen (Ed.), Wageningen Academic Publishers, 63–68. Uzzi, Brian (1997) ‘Social structure and competition in interfirm networks: The paradox of embeddedness’ in Administrative Science Quarterly 42:35–67. Zahra, S.A. (1991) ‘Predictors and financial outcomes of corporate entrepreneurship, an exploratory study’ in Journal of Business Venturing 6:256–89. ——— (1995) ‘Corporate entrepreneurship, and financial performance: The case of management leveraged buyouts’ in Journal of Business Venturing 10(3):225–47.

46
9 Annexes 9.1 Annex 1. Change of physical flow in distribution supply chains of
“in‐season” mangos after innovation
Figure 1. Distribution supply chains of “in‐season” mangos after innovation
Figure 2. Distribution supply chains of “in‐season” mangos after improvement of innovation

47
9.2 Annex 2. Change of information flow in distribution supply chains of “off‐season” mangos before and after innovation
Figure 3. Information Flow Chains Before Innovation
Figure 2. Information flow chains after innovation (Aspirasi Bina Usaha Group)

48
Figure 3. Information flow chains after improvement of innovation (KUBM Group)
Notes: inf 1 price information at farmer level inf 2 price information inf 3 price and quantity information inf 4 price information at farmer level inf 5 price information at farmer level inf 6 price information at farmer level inf 7 price information inf 8 price information inf 9 market opportunity information inf 10 market opportunity information inf 11 information on price, quantity, quality, and delivery schedule inf 12 information on price and quality inf 13 information on price and quality inf 14 information on price, quality, and trade agreement between group and Hero Supermarket

49
inf 15 information on price at farmer level inf 16 information on price at farmer level inf 17 information on price at farmer level inf 18 information on price, quantity, quality, market condition, cost reduction per kg inf 19 price information inf 20 price information inf 21 price information inf 22 information on price, quantity, quality, market opportunity, and delivery schedule inf 23 price and quantity information inf 24 price and quantity information inf 25 price and quantity information inf 26 information on market opportunity inf 27 information on another opportunity such as government bureaucracy and input inf 28 information of price, quantity, market opportunity, and trade agreement between group and Carrefour

50
9.3 Annex 3. Change of knowledge flow in distribution supply chains of “off‐season” mangos before and after innovation
Figure 1. Knowledge flow before innovation
Figure 2. Knowledge flow after innovation (Aspirasi Bina Usaha Group)
FarmerFarmer Group (Aspirasi Bina
Usaha)Collector Hero Supermarket
Bimandiri
Traditional Wholesale Market Wholesaler
png. 5 png. 7 png. 12
png. 4
png. 13
png. 14png. 8
png. 6
png. 11 png. 15
PPL
Syngenta
png. 9png. 10

51
Figure 3. Knowledge flow after improvement of innovation (KUBM Group)

52
Notes: png. 4 picking, quality, sorting knowledge png. 5 picking, quality knowledge png. 6 picking, quality, sorting knowledge png. 7 picking, quality, sorting knowledge png. 8 picking, quality knowledge png. 9 cultivation technique and group organization knowledge png. 10 cultivation technique knowledge png. 10 quality control knowledge png. 11 picking, quality, packing, sorting knowledge png. 12 picking, quality, packing, sorting knowledge png. 15 quality, quantity, continuity knowledge png. 18 picking, quality, sorting knowledge png. 19 picking, cultivation technique, sorting, organization, and management knowledge png. 20 picking knowledge png. 21 picking and quality knowledge png. 22 picking, quality, sorting knowledge png. 23 waxing technique knowledge png. 24 quality, marketing, organization, management, and knowledge negotiation png. 25 cultivation and group organization knowledge png. 27 quality knowledge png. 28 packing knowledge

53
9.4 Annex 4. Change of capital flow in distribution supply chains of “off‐season” mangos before and after innovation
Figure 1. Capital flow before innovation
Figure 2. Capital flow after innovation (Aspirasi Bina Usaha Group)

54
Figure 3. Capital flow after improvement of innovation (KUBM Group)

55
Notes: cap. 2 Capital support to help collector give down payment to farmers cap. 4 Assistance with input and capital cap. 5 Assistance with input and capital cap. 6 Assistance with input and capital cap. 8 Capital support to help collector give down payment to farmers cap. 9 Capital support in term of advance payment from supermarket (5%) and input support to group cap. 14 Input and capital support cap. 15 Input and capital support cap. 16 Input, capital, and agriculture mechanic support cap. 17 Capital support from organization funds to pay off loan to Bimandiri and help cash payment to farmers cap. 19 Capital support to help collector give down payment to farmers cap. 23 Capital support to KUBM to help cash payment to farmers (advance fund) cap. 25 Capital support in the form of advance payment from supermarket (5%) cap. 25 Agriculture mechanic, research field plot, and soft loan support

56
9.5 Annex 5. Legitimacy governance flow before and after innovation
Figure 1. Distribution supply chains before innovation
Table A. Relation of legitimacy governance flow before innovation Legitimacy governance
Farmer Collector/ middleman
Local trader Traditional market
Farmer Low Collector/middleman Low Low Local trader Low Low Traditional market Low
Figure 2. Distribution supply chains after innovation (Aspirasi Group)
FarmerFarmer Group (Aspirasi Bina
Usaha)Collector Hero Supermarket
Bimandiri
Traditional Wholesale MArketWholesaler
a.d. 1a a.d. 2a a.d. 3b
a.d. 4b
a.d. 1b
a.d. 3a
a.d. 3aa.d. 2a
Fee 5%
a.d. 2b
Table B. Relation of legitimacy governance flow after innovation
Legitimacy governance Farmer Collector/middleman Trader
Aspirasi “BU”
Bimandiri Hero Supermarket
Traditional market
Farmers Low Low Low Collector/middleman Low Low Low Trader Low Low Low Aspirasi “BU” Low Low High High Low Bimandiri High Hero Supermarket High Traditional market Low Low
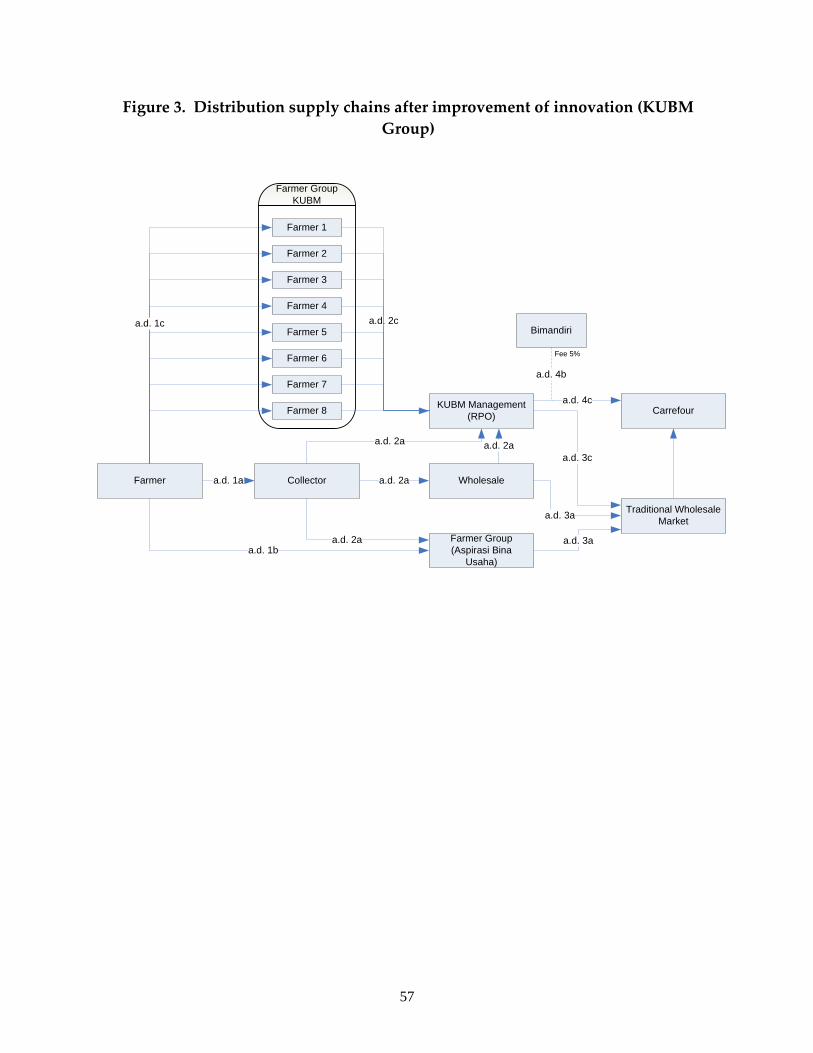
57
Figure 3. Distribution supply chains after improvement of innovation (KUBM Group)
Farmer Collector
Farmer Group (Aspirasi Bina
Usaha)
Wholesale
KUBM Management (RPO) Carrefour
Traditional Wholesale Market
a.d. 3a
a.d. 3a
a.d. 3c
a.d. 4c
Bimandiri
a.d. 4b
a.d. 1a
a.d. 1b
a.d. 2a
a.d. 2a
a.d. 2a
Farmer Group KUBM
Farmer 2
Farmer 3
Farmer 4
Farmer 5
Farmer 6
Farmer 7
Farmer 1
Farmer 8
a.d. 1c a.d. 2c
Fee 5%
a.d. 2a

58
Table C. Legitimacy governance flow after improvement of innovation
Legitimacy Governance Farmer
KUBM Group
KUBM Management (RPO)
Collector/ middleman Trader
Aspirasi “BU” Bimandiri Carrefour
Traditional market
Farmer Low Low Low KUBM Group Low High RPO High Low Low High High Low Collector/middleman Low Low Low Low Trader Low Low Low Aspirasi “BU” Low Low Low Bimandiri High Carrefour High Traditional market Low Low Low

59
Notes: a.d.1a: Low trust chain: (1) short time trading relation, (2) every middleman may get
the price through negotiation, (3) farmers produce in line with their ownership, (4) field supervision by middleman, (5) farmers have many buyers (middlemen traders) and middleman trader has many alternative sources (farmers), (6) technical assistance only when needed, (7) no formal inter‐actor relation and focused on purchase, (8) competitive price decision and hidden information, (9) having access to proposed loan in the form of input, (10) periodical payment with some delays.
a.d. 2a: Low trust chain : (1) short‐term trading relation, (2) every middleman may get the price through negotiation, (3) contract relation follows written order from trader, (4) field supervisions by middleman, (5) middleman has many buyers (traders) and trader has many alternative sources (middlemen), (6) absence of technical assistance, (7) no formal inter‐actor relation and focused on purchase, (8) competitive price decision and hidden information, (9) some middleman traders have access to proposed loan in the form of capital advances, (10) periodic payment with some delay.
a.d. 3a: Low trust chain: (1) short time trading relation, (2) every middleman may get the price through negotiation, (3) trader is more flexible in delivery, (4) Field supervision by middleman, (5) trader has many buyers (market) and market has many sources (traders), (6) no technical assistance, (7) no formal inter‐actor relation and focused on purchase, (8) competitive price decision, (9) no credit aid is available, (10) periodic payment with some delay.
a.d. 1b: Low trust chain: (1) short time trading relation, (2) every middleman may get the price through negotiation, (3) Farmers produce in line with their ownership, (4) field supervisions by middleman, (5) farmers have many buyers (traders) and group has many sources (farmers), (6) routine technical assistance, (7) formal inter‐actor relation but still focused on purchase, (8) competitive price decision and hidden information, (9) access to proposed loan in the form of input (10) periodic payment with some delay.
a.d. 2b: Low trust chain: (1) short time trading relation, (2) every middleman may get the price through negotiation, (3) farmers produce in line with their ownership, (4) field supervisions by middleman, (5) farmers have many buyers (traders) and trader has many alternative sources (farmers), (6) technical assistance is carried out when needed, (7) formal inter‐actor relation but still focused on purchase, (8) competitive price decision and hidden information, (9) access to proposed loan in the form of input (10) periodic payment with some delay.
a.d. 3b: High trust chain: (1) long time trading relation, (2) no one gets price through negotiation, (3) group starts producing to written order, (4) checking at every

60
delivery, (5) dependency level: some buyers for group and one or two seller sources to Hero supermarket, (6) technical assistance is given every time, (7) multi‐channel communication, (8) little competition, open information, (9) no credit aid, (10) delayed payment.
a.d. 4b: High trust chain: (1) long‐term trading relation, (2) no one gets price through negotiation, (3) group starts producing to written order, (4) checking at every delivery, (5) dependency level: some buyers for group and one or two seller sources to Hero supermarket, (6) technical assistance is given every time, (7) multi‐channel communication, (8) little competition and open information, (9) no credit aid (10) delayed payment with payment acceleration and bridging cost payments to Bimandiri
a.d. 1c: Low trust chain: (1) short‐term trading relation, (2) every middleman may get price through negotiation, (3) contract relation: farmers produce in line with their ownership, (4) field supervisions by middleman, (5) dependence level: farmers have many buyers and group has many alternative sources (farmers), (6) technical assistance is carried out when needed, (7) infrequent formal inter‐actor relation and focused on purchase, (8) competitive price decision and hidden information, (9) access to proposed loan in the form of input (10) good payment and no delay in payment (cash).
a.d. 2c: High trust chain: (1) long‐term trading relation (with submit process from group to RPO, (2) no one gets price through negotiation, (3) contract relation: group is more flexible about instructions in production and submission, (4) no checking at every delivery, (5) dependency level: some buyers to farmer and one source by RPO, (6) technical assistance given every time, (7) multi‐channel communication, (8) little competition and open information, (9) access to proposed credit, long period payment with easy approval, (10) system employed is submission, payment is sometimes delayed.
a.d. 3c: Low trust chain: (1) short‐term trading relation, (2) every middleman may get price through negotiation, (3) trader is more flexible about instructions to produce (4) field supervisions by middleman, (5) dependence level: trader has many buyers, and market has many sources, (6) no technical assistance, (7) infrequent formal communication relation and still focused on purchase, (8) competitive price decision and hidden information, (9) access to proposed credit with payment after product is sold, (10) delayed payment.
a.d. 4c: High trust chain: (1) long‐term trading relation, (2) no one gets price through negotiation, (3) group is more flexible about instructions to produce, (4) minor checking at every point, (5) dependency level: some buyers to group and one or two sources by Carrefour, (6) technical assistance given every time, (7) multi‐channel communication, (8) price decision: no competition and open information, (9) no credit aid, (10) delayed payment.

61
9.6 Annex 6. Rights, responsibilities, and benefits of stakeholders involved in innovation
Stakeholder Rights Responsibilities Benefits Included farmers
- Acquire technical assistance
- Acquire financial aid and/or services
- Sell all merchandise
- Submit all goods produced - Implement technology - Pay loans
‐ Increased production ‐ ‐‐ Obtain services in payment - Increased income - Clarity re product
volume sold - Minimize cheating by
trader - Market information
Management of KUBM
- Acquire all yields produced by farmers
- Obtain payment agreed with shop
- Obtain technical assistance from Bimandiri
- Provide technical assistance
- Provide services to farmers - Give market information - Sell farmers’ products - Promotion - Fulfill all demands of shop - Complete quality
requirements set up by shop
- Product is well known among consumers
- Quality produce - All product is sold - Enjoy high price as
compared with traditional market
- Turnover generated - Mutual understanding
Bimandiri - Obtain 5% fee from total mango sales to Bimandiri’s accessible market
- Acquire advance loans for farmers
- Obtain information related to expectations and prediction of mango productivity before harvest
- Information re transactions between group and Carrefour
- Give routine technical assistance to RPO (KUBM)
- Grant aid in the form of advance funds
- Provide aid and assurance of access to market
- Turnover increased - Minimized risk - Product continuity - Success of horizontal
expansion - Mango produce
diversified in Bimandiri

62
9.7 Annex 7. Inter‐stakeholder relations in innovation Stakeholder Included farmers Management of
KUBM Bimandiri Carrefour
Included Farmers
Meeting between KUBM and farmers: once a week (3) Method of problem solving (3) Method of price determination/price receive (1) Risk sharing (3) Level of dependency (3) Sum of value = 13
Meeting between Bimandiri and KUBM: once a month (3) Method of problem solving (3) Method of price determination(1) Risk sharing (3) Level of dependency (3) Sum of value = 13
Meeting between farmers and Carrefour: never (1) Method of problem solving (1) Method of price determination (1) Risk sharing (1) Level of dependency (1) Sum of value = 5
Management of KUBM
Meeting between KUBM and farmers: once a week (3) Method of problem solving (3) Method of price determination (3) Risk sharing (3) Level of dependency (3) Sum of value = 15
Meeting between KUBM and Bimandiri: once a month (3) Method of problem solving (3) Method of price determination (1) Risk sharing (3) Level of dependency (3) Sum of value = 13
Meeting between KUBM and Carrefour: every delivery of product (3) Method of problem solving (1) Method of price determination (1) Risk sharing (1) Risk sharing (1) Sum of value = 7
Bimandiri Meeting between Bimandiri and farmers: once a month or two (3) Method of problem solving (3) Method of price determination (1) Risk sharing (3) Level of dependency (2) Sum of value = 12
Meeting between Bimandiri and KUBM: once a month (3) Method of problem solving (3) Method of price determination (1) Risk sharing (3) Level of dependency (2) Sum of value = 12
Meeting between Bimandiri and Carrefour: once a year (2) Method of problem solving (1) Method of price determination (3) Risk sharing (1) Level of dependency (1) Sum of value = 8

63
Stakeholder Inclusive Farmers Management of
KUBM Bimandiri Carrefour
Carrefour Meeting between Carrefour and farmers: never (1) Method of problem solving (1) Method of price determination (3) Risk sharing (1) Level of dependency (2) Sum of score = 8
Meeting between Carrefour and KUBM: every delivery of product (3) Method of problem solving (1) Method of price determination (3) Risk sharing (1) Level of dependency (1) Sum of score = 9
Meeting between Carrefour and Bimandiri: once a year (2) Method of problem solving (1) Method of price determination (3) Risk sharing (1) Besarnya Level of dependency (2) Sum of score = 9
Score: 5 – 8 = Poor 9 – 12 = Fair 13 – 15 = Good

64
9.8 Annex 8. Performance changes by farmers before and after innovation
Change Before After Source of input Individual, input shop, middlemen Individual, Bimandiri, central
market Input use Should be Should be Labor availability Standard number Standard number, only different in
use Cultivation technology
Required Required
Harvest technology No weighing and grading Weighing and grading Post harvest technology
No picking method Use of picking method
Processing technology
No processing No processing
Product quality No grading in which all quality is standardized
30% to 50% graded A or B
Product quantity By potential of trees By potential of trees Product distribution
Disorganized produce delivery Delivery of produce based on market orientation
Time distribution No conformity of delivery Delivery conforms to demand Information and knowledge distribution
Guided by extension worker who sells pesticide as well
Guided by input supplier, with extension workers set aside
Market destination Central market Clear market orientation (i.e., central market, modern market, and inter‐island market)
Extent of marketing volume
Depends on production Targeted, with produce received from non‐members
Marketing process Through middlemen, and initiate to carry out self‐marketing
Direct access to market
Price, product value One price, no sorting By grade (off‐season), no sorting (in‐season)
Production costs Only on technical cultivation practices, no post harvest treatment
Additional marketing costs for label printing, packing, picking, and packaging
Organizational costs
None organization not yet established
Money allocated to pay management of KUBM. Some Rp3,000 for every unit is allocated to finance harvesting, post harvest, and marketing
Innovation costs No innovation applied No innovation costs due to many meetings between farmers and targeted market client and promotion costs as a marketing

65
Change Before After strategy
Investment costs None Incremental investment costs especially from exclusive farmers (even from outer village) to offer investment collaboration through KUBM
Explicit subsidy Not available Not available Explicit subsidy Not available Not available Credit From middlemen, relatives, bank,
and Jakarta central market From middlemen, relatives, traders, and Jakarta central market
Number of stakeholders
Farmers, farmer’s group, Syngenta, collectors, traders, and Jakarta central market
Farmers, farmer’s group, Syngenta, input companies, traders, Jakarta central market, Lampung market, Carrefour, other modern markets, inter‐island trading market
Role of stakeholders Remain as farmers Farmers encouraged to both farm and trade
Stakeholder rights None Obtain all payments from sale of produce of group after 5% fee for Bimandiri. Besides produce sold to Carrefour, group can sell remaining produce and has the right to immediate payment
Stakeholder responsibilities
None Pay 5% to Bimandiri, with strong commitment to obey rules set up by supermarket for quality, quantity, and continuity
Stakeholder profits Limited to produce sold, with profit taken only by professional farmers
More profitable, with profit dependent on level of farmers, while trader’s orientation is profit.
Relationship among stakeholders
Limited to transactions with middlemen, without technical assistance
Less relationship with middlemen
Internal organization/institution
Only association Organization
External organization/institution
Good relationships More competitive
Management Only individual management Regulation and clear delegation of authority, based on the role and function of each component of organization
Product regulation/policy
No quality standards Quality standards
Marketing No marketing regulation/policy To avoid conflict between parties

66
Change Before After regulation/policy (free) from the same area, special
regulations for outside farmers (Aspirasi), implemented in event that produce of both included farmers and Aspirasi enter one market: one should cede place to the other. However, both can enter but one must follow regulations
Contract regulation/policy
No contract Contract in the form of MoU between Bimandiri and KUBM
Organization regulation/policy
No regulation Regulation based on arranged management
Socio‐cultural Bound by middlemen (tengkulak) with tebasan system
More selective towards cash payment with higher price

67
9.9 Annex 9. Historical innovation Year Event 1980s Conventional planting of in‐season mangos. Certain people planted mangos.
Majority planted melati 1980–1985 Planted mangos and oranges; oranges not prospective 1985 Began to plant off‐season mangos 1987 Government collaborated with one political party to plant mango seed in
Pemalang Regency Planting of off‐season mangos developed primarily in Asem Doyong Village
1995 Use of ZPT (zat perangsang tumbuh/growth stimulate ingredient) 1997–1998 People recognized technical planting of off‐season mangos 2000–2001 Planting of off‐season mangos spread throughout Pemalang Regency. Off‐
season mangos distributed along coastal area 2002–2003 Syngenta became interested in off‐season mangos in Asem Doyong Village.
Establishment of spraying promoted by input company (Syngenta), namely Aspirasi Bina Usaha
2003–2004 Farmer’s group introduced to Bimandiri 2004 Aspirasi group experienced losses due to use of tebasan system; detriment
becomes debt of group to farmers 2005 Due to detriment, group was separated into two groups, namely KUBM and
Bina Usaha; number of those included changes from 38 persons to six persons 1. KUBM :
KUBM was led by Mr. Dauvi, with eight members; currently, KUBM has 25 hectares of farmland Bimandiri collaborates with KUBM in marketing produce to modern market. Partnership system “margin transparency” introduced by Bimandiri as continued by KUBM; Bimandiri provides technical assistance and funds aid for the group Market destination is Hero Supermarket and central market; Bimandiri and KUBM perceived Hero as bad supermarket and relationship with Hero discontinued
2. Aspirasi “Bina Usaha” Group: Aspirasi group runs continuously; carries out leadership changes with total membership of 30, using 75 hectares of farmland separated in Pemalang, Tegal, and Comang On 9 December, 2005, Aspirasi group awarded first mango farmer’s group champion in Pemalang Regency After awarding championship, government pays greater attention to farmer’s group; subsequently, government provides farmers with physical and fund aid through the group; after championship award, farmers feel that group became vulnerable
2006 In mid‐2006, Carrefour shows interest in KUBM, and provides opportunity Emergence of other groups:
Farmers become dissatisfied with group “Aspirasi Bina Usaha” and establish new group, Utama (Usaha Tani Maju) with 15 members

68
9.10 Annex 10. Supply Chain Evolution Year Supply Chain Event Innovation Event 1980–1985 Start to plant mango Change from low economic
plant to high economic plant 1985 Start to plant off‐season mango Plant mango which
previously flowered once a year to one which flowers twice a year
1995 Start to use ZPT (zat perangsang tumbuh/growth stimulation hormone)
Use of ZPT changes productivity particularly of off‐season mangos
2000–2001 Off‐season mangos spread all over Pemalang, particularly along coastal areas.
Changed labor function, more cultivator farmers
2003 Input spraying company (Syngenta) established, called Aspirasi “Bina Usaha”
Farmers established farmer’s group, changing from individual to group system, forming first group in local village
Syngenta introduces farmer’s group to Bimandiri supplier (Bimandiri)
Farmers begin to recognize market and begin to become farmer‐traders
2004 Aspirasi group introduced to Hero Supermarket
Farmers begin to recognize quality standards of modern market
Farmer’s group begins to implement quality standards
Farmers implement harvesting and post‐harvest technologies (grading, sorting, and packaging)
Hero Supermarket and Bimandiri conduct field observations
2005 Aspirasi group divides into two: Aspirasi (reshuffle output) and KUBM
Changesin organization and management
Partnership system “margin transparency” continued by KUBM
KUBM carries out reshuffle KUBM introduced to Carrefour 2006 KUBM has opportunity to deliver produce to
Carrefour without Bimandiri. Farmers expand market orientation

69
9.11 Annex 11. Critical changes required by stakeholders for achieving successful innovation
Change towards Success factors
Included farmer
KUBM management
Bimandiri Carrefour
Source of input 4 3 4 Utilization of input 1 1 4 Labor availability 1 1 4 Cultivation technology 1 1 4 Harvesting technology 4 3 4 Post‐harvest technology 4 3 4 Processing technology 1 1 4 Product quality 4 3 4 Product quantity 1 3 4 Product distribution 4 4 4 Time distribution 4 3 4 Information/knowledge distribution 4 3 4 Marketing destination 4 2 4 Percentage of marketing volume 4 2 4 Marketing method 4 4 4 Price, product value 4 2 4 Production cost 1 3 4 Organization costs 1 4 4 Innovation costs 1 3 4 Investment costs 2 4 4 Explicit subsidy 1 1 3 Implicit subsidy 1 1 3 Credit 2 4 4 Stakeholder role 4 3 4 Stakeholder rights 4 4 4 Stakeholder responsibilities 4 4 4 Stakeholder profits 4 3 4 Stakeholder relationships 4 4 4 Internal organization/institution 4 3 4 External organization/institution 2 2 4 Management 4 4 4 Product regulation/policy 4 3 4 Marketing regulation/policy 4 4 4 Contract regulation/policy 4 2 4 Organization regulation/policy 4 3 4 Socio‐cultural 4 3 4

70
9.12 Annex 12. Median Value of critical stakeholder changes for achieving innovation success
Stakeholders
Item Included farmers
KUBM management Bimandiri Carrefour
Farm production input 2.5 2 4 Labor availability 1 1 4 Technology 2.5 2 4 Product 2.5 3 4 Distribution 4 3 4 Marketing 4 2 4 Financial 1 3 4 Subsidy 1 1 3 Credit 2 4 4 Stakeholders 4 4 4 Organization/institution 3 2.5 4 Management 4 4 4 Regulation/policy 4 3 4 Socio‐cultural 4 3 4 Note : 4 = very important change 3 = important change 2 = moderate important change 1 = less important change

71
9.13 Annex 13. Skills, competence, and capacity of included and excluded farmers Ability Included farmers Excluded farmers Impact Skills ‐ Skill in technical
cultivation both in‐ and off‐season mangos; become planting initiators
‐ Search for alternative markets
‐ Skill in obtaining information
‐ Differentiated roles depending on skills
‐ Skills only in technical mango cultivation.
‐ Technical cultivation not sufficient for partnership system
‐ Those lacking other than technical cultivation skills cannot innovate
Competency - Deliver product on time and appropriately
- Competence in expanding markets
- Competence in expanding cultivation area (local investment)
- Lack guarantor for achieving market access helpful in all activities
- Individualistic, low capital, dependent on traders and middlemen
- Meet market demands based only on availability of produce
- Without guarantor, market orientation becomes changeable, lacks reliability and continuity
- Activity limited to middleman and trader capital
- Reliance on individuals influences market capital, volume, selling capacity, and selling price
- Included farmers have privileges, expanded market opportunities

72
Ability Included farmers Excluded farmers Impact - Market (consumer)
expectations can be anticipated
- Production opportunities higher
Capacity - Commited - Responsible - Expert in technical
cultivation - Experienced
- No commitment - No responsibilities - Lack optimal
function and role of organization members
- Commitment shared by group
- Buyers can trust quality, quantity, and continuity
9.14 Annex 14. Sequence of supply chain innovation and evolution Step‐1 : Identifying stakeholders in innovation development 1. Farmers 2. KUBM/KUBM farmers 3. RPO management 4. Bimandiri 5. Carrefour 6. Aspirasi “Bina Usaha” group 7. Local market actors 8. Central market actors 9. Government 10. Agricultural extension workers 11. Syngenta 12. Other private sectors

73
Step‐2 : Identifying characteristic of each stakeholder Stakeholders Basic Location Function Time‐generation Farmer Men, rich/poor, young/old Rural, near to the issue Producer Past, present, future generation 9.14.1 KUBM Men, rich, young Rural, near to the issue Producer Present, future generation RPO management men, rich, young Rural, near to the issue Producer and trader Present, future generation 9.14.2 Bimandiri men, rich, young Urban, near to the issue Supplier Present, future generation 9.14.3 Carrefour Men, rich, young Urban, near to the issue Supermarket Present, future generation Aspirasi group Men, rich, young Rural, near to the issue Producer Past, present, future generation Local market actor Men, rich/poor, young/old Rural, far away Trader Past, present, future generation Central market actor Men, rich, young/old Urban, far away Trader Past, present, future generation Government Men/women, rich/poor,
young/old Urban, far away Policy maker Past, present, future generation
Extension workers Men, rich/poor, young Rural, far away Governance Past, present, future generation Syngenta Men, rich/poor, young Urban, far away Private sector Past generation Other private sectors Men, rich, young Urban, far away Private sector Present, future generation

74
Step‐3: Identifying role of each stakeholder in innovation
Stakeholder’s Role
Farmer
KUBM group
KUBM management
Bimandiri Carrefour Aspirasi group
Local market actor
Central market actor
Government
Extension worker
9.14.3.1 Syn
ent
Other private sectors
Funding owner √ √ √ √ √ √ √ √ √ √ √
Funding receiver √ √ √ √ √ √ √ √ √ √ √ √
Opposing √ √ √ No comment √ √ √ √ Mobilizing √ √ √ √ √ √ √ Responding √ √ √ √ √ √ √ Conducting change
√ √ √ √ √
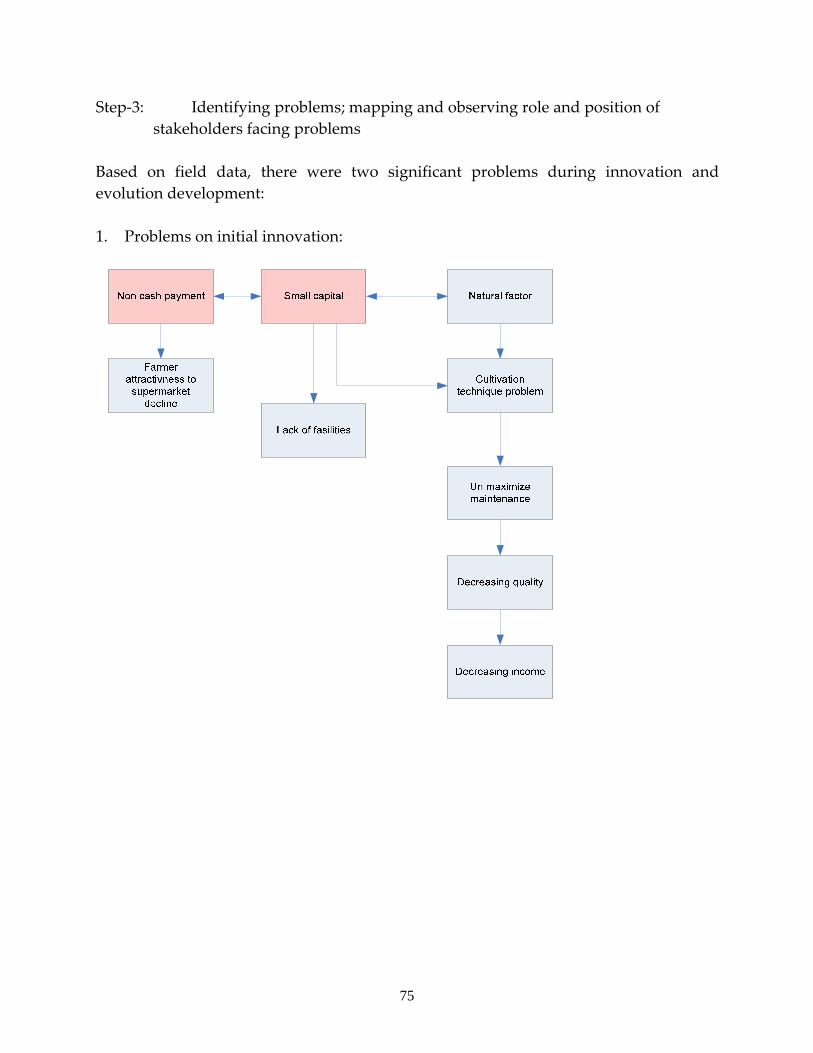
75
Step‐3: Identifying problems; mapping and observing role and position of stakeholders facing problems
Based on field data, there were two significant problems during innovation and evolution development: 1. Problems on initial innovation:

76
2. Problems on innovation development:
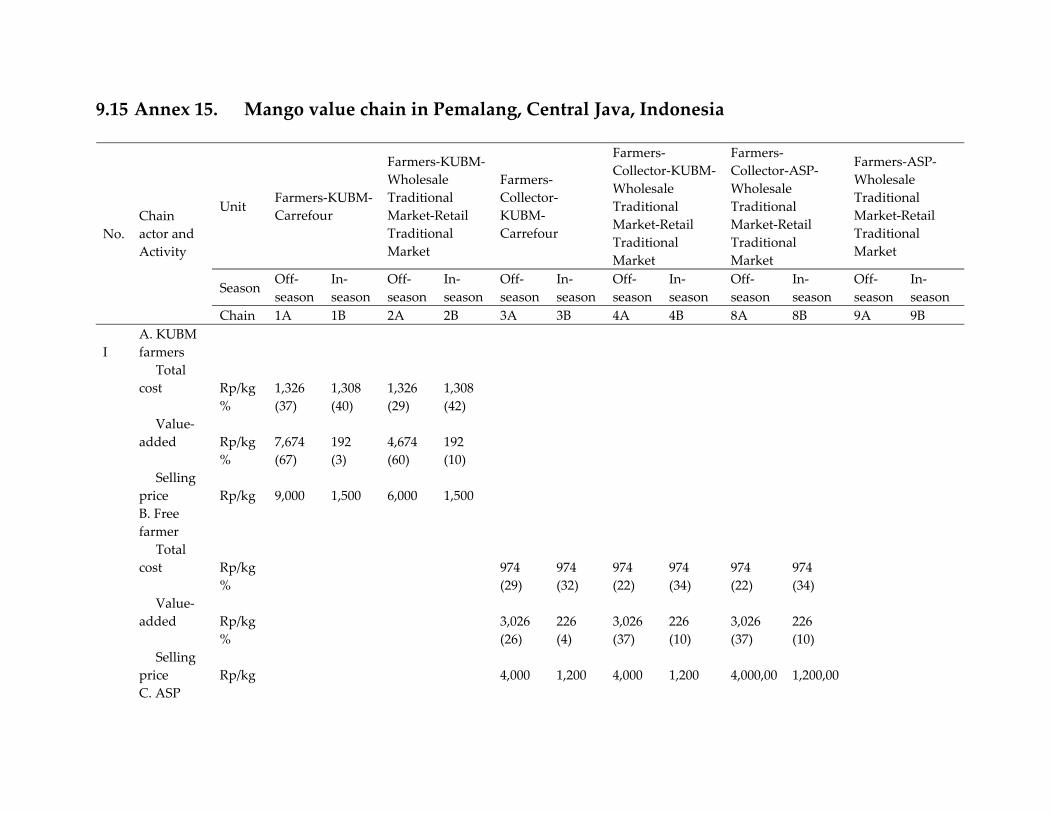
9.15 Annex 15. Mango value chain in Pemalang, Central Java, Indonesia
Unit Farmers‐KUBM‐Carrefour
Farmers‐KUBM‐Wholesale Traditional Market‐Retail Traditional Market
Farmers‐Collector‐KUBM‐Carrefour
Farmers‐Collector‐KUBM‐Wholesale Traditional Market‐Retail Traditional Market
Farmers‐Collector‐ASP‐Wholesale Traditional Market‐Retail Traditional Market
Farmers‐ASP‐Wholesale Traditional Market‐Retail Traditional Market
Season Off‐season
In‐season
Off‐season
In‐season
Off‐season
In‐season
Off‐season
In‐season
Off‐season
In‐season
Off‐season
In‐season
No. Chain actor and Activity
Chain 1A 1B 2A 2B 3A 3B 4A 4B 8A 8B 9A 9B
I A. KUBM farmers
Total cost Rp/kg 1,326 1,308 1,326 1,308
% (37) (40) (29) (42) Value‐
added Rp/kg 7,674 192 4,674 192 % (67) (3) (60) (10) Selling
price Rp/kg 9,000 1,500 6,000 1,500 B. Free
farmer Total
cost Rp/kg 974 974 974 974 974 974 % (29) (32) (22) (34) (22) (34) Value‐
added Rp/kg 3,026 226 3,026 226 3,026 226 % (26) (4) (37) (10) (37) (10) Selling
price Rp/kg 4,000 1,200 4,000 1,200 4,000,00 1,200,00 C. ASP

78
farmer Total
cost Rp/kg 890 890 % (21) (32) Value‐
added Rp/kg 4,297 610 % (52) (26) Selling
price Rp/kg 5,188 1,500,00 II Collector:
Total cost Rp/kg 128 128 128 128 128 128
% (4) (4) (3) (4) (3) (4)
Value‐added Rp/kg 4,872 172 1,872 172 1,060 172
% (42) (3) (23) (8) (13) (8)
Selling price Rp/kg 9,000 1,500 6,000 1,500,00 5,188 1,500,00
III KUBM :
Total cost Rp/kg 1,756 1,461 2,193 1,595 1,732 1,420 2,168 1,553
% (49) (44) (48) (51) (52) (47) (50) (54)
Value‐added Rp/kg 1,244 3,039 1,141 84 1,268 3,080 1,165 126
% (11) (53) (15) (4) (11) (52) (14) (6)
Selling price Rp/kg 12,000 6,000 9,333 3,179 12,000 6,000 9,333 3,179

79
Unit Farmers‐KUBM‐Carrefour
Farmers‐KUBM‐Wholesale Traditional Market‐Retail Traditional Market
Farmers‐Collector‐KUBM‐Carrefour
Farmers‐Collector‐KUBM‐Wholesale Traditional Market‐Retail Traditional Market
Farmers‐Collector‐ASP‐Wholesale Traditional Market‐Retail Traditional Market
Farmers‐ASP‐Wholesale Traditional Market‐Retail Traditional Market
Season Off‐season
In‐season
Off‐season
In‐season
Off‐season
In‐season
Off‐season
In‐season
Off‐season
In‐season
Off‐season
In‐season
No. Chain actor and activity
Chain 1A 1B 2A 2B 3A 3B 4A 4B 8A 8B 9A 9B IV Aspirasi
Total cost Rp/kg 2,180 1,565 2,255 1,639
% (50) (54) (54) (59)
Value‐added Rp/kg 1,965 114 1,891 39
% (24) (5) (23) (2)
Selling price Rp/kg 9,333 3,179 9,333 3,179
V Wholesale traditional market
Total cost Rp/kg 228 32 228 32 228 32 228 32
% (5) (1) (5) (1) (5) (1) (5) (1)
Value‐added Rp/kg 706 286 706 286 706 286 706 286
% (9) (15) (9) (13) (9) (13) (9) (12)
Selling price Rp/kg 9,333 3,179 9,333 3,179 9,333 3,179 9,333 3,179
VI Retail trade market :

80
Total cost Rp/kg 839 198 839 198 839 198 839 198
% (18) (6) (19) (7) (19) (7) (20) (7)
Value‐added Rp/kg 1,328 1,409 1,328 1,409 1,328 1,409 1,328 1,409
% (17) (71) (16) (63) (16) (64) (16) (60)
Selling price Rp/kg 11,500 4,786 11,500 4,786 11,500 4,786 11,500 4,786
VII Carrefour :
Total cost Rp/kg 520,00 520,00 520,00 520,00
% (14) (16) (16) (17)
Value‐added Rp/kg 2,480 2,480,00 2,480,00 2,480,00
% (22) (43) (21) (42)
Selling price Rp/kg 15,000 9,000 15,000 9,000
TOTAL COST Rp/kg 3,601 3,289 4,584 3,133 3,353 3,041 4,336 2,884 4,348 2,896 4,211 2,759 TOTAL VALUE ADDED Rp/kg 11,399 5,711 7,849 1,971 11,647 5,959 8,098 2,220 8,086 2,208 8,222 2,344

Regoverning MarketsRegoverning Markets is a multi-partner collaborative research programmeanalysing the growing concentration in the processing and retail sectors of nationaland regional agrifood systems and its impacts on rural livelihoods and communitiesin middle- and low-income countries. The aim of the programme is to providestrategic advice and guidance to the public sector, agrifood chain actors, civil societyorganizations and development agencies on approaches that can anticipate andmanage the impacts of the dynamic changes in local and regional markets. Theprogramme is funded by the UK Department for International Development (DFID),the International Development Research Centre (IDRC), ICCO, Cordaid, theCanadian International Development Agency (CIDA), and the US Agency forInternational Development (USAID).
Innovative PracticeInnovative Practice is a series of case studies from the Regoverning Marketsprogramme providing examples of specific innovation in connecting small-scaleproducers with dynamic markets at local or regional level. Based on significantfieldwork activities, the studies focus on four drivers of innovation: public policyprinciples, private business models, collective action strategies by small-scalefarmers, and intervention strategies and methods of development agencies. Thestudies highlight policy lessons and suggest working methods to guide public andprivate actors.
The case studies were coordinated by:Julio Berdegué, RIMISP - Latin American Centre for Rural Development, Chile Lucian Peppelenbos, Royal Tropical Institute (KIT), NetherlandsEstelle Biénabe, University of Pretoria, South Africa and Centre de CoopérationInternationale en Recherche Agronomique pour le Développement (CIRAD), France
www.regoverningmarkets.org