Embed Size (px)
Citation preview
1
INNOVATIVENESS: AN ANALYSIS BASED ON INNOVATION TAXONOMY AND
DATA ENVELOPMENT ANALYSIS
by
METE SEVİNÇ
Submitted to the Graduate School of Engineering and Natural Sciences
in partial fulfillment of the requirements for the degree ofMaster of Science
in
SABANCI UNIVERSITY
Spring 2014

2
© Mete Sevinç 2014
All Rights Reserved

3
INNOVATIVENESS: AN ANALYSIS BASED ON INNOVATION TAXONOMY AND
DATA ENVELOPMENT ANALYSIS
APPROVED BY:
Prof. Gündüz Ulusoy ...................
(Thesis Supervisor)
Assoc. Prof. Kemal Kılıç ...................
Prof.Lütfihak Alpkan ...................
DATE OF APPROVAL: ............................................
4
INNOVATIVENESS: AN ANALYSIS BASED ON INNOVATION TAXONOMY AND
DATA ENVELOPMENT ANALYSIS
Mete SEVİNÇ
Industrial Engineering, M.Sc. Thesis, 2014
Thesis Supervisor: Prof Dr. Gündüz Ulusoy
Keywords: Manufacturing Industry, Statistical Analysis, Clustering, Innovation Taxonomy,
Innovation Capabilities, Innovation Design
Abstract
Innovation is an important competitiveness determinant and is studied extensively by
both the academicians and the practitioners particularly in the last decades. Dichotomous
(e.g., High vs. Low) research is widely available in innovation literature in terms of analyzing
the innovative capabilities and the defined determinants of innovativeness. Our approach in
this thesis extends the literature by providing a conceptual taxonomy for the capabilities and
determinants of innovativeness. The results demonstrate that the investigation on differences
among groupings of firms yields statistical significance and actionable insights.
The main objective of this study is to model and analyse the innovative capabilities
and determinants of innovativeness for a firm through conducting statistical analysis and
implementing information visualization on a dataset comprising the results of an innovation
survey of 184 Turkish manufacturing companies. Innovative capabilities of firms are among
the leading factors defining their competitiveness, thus it is of extreme importance to define
and analyze these skills and conclude with insights related to the enterprise and the industry.
For this purpose, clustering analysis, statistical testing and Data Envelopment Analysis are
performed and the resulting visualizations are provided. Four clusters are formed as a result of
the cluster analysis, and these are labeled as the Leading innovators, Followers, Inventors and
Laggers respectively. These clusters are statistically investigated under the components of
intellectual capital, organizational structure, organizational culture, barriers to innovation,
monitoring and collaborations. DEA analysis provide benchmarking results through
efficiency scores. The end results obtained from the analyses are commented upon.

5
ACKNOWLEDGEMENTS
Firstly, I’d like to express my gratitude to my thesis advisor Gündüz ULUSOY for his
guidance and support throughout my research. He has been a great supervisor and he not only
aided my thesis progress greatly, but provided me with great insights and feedbacks. I have
been more than content with his academical and personal communication skills.
I would like to thank my thesis committee member Kemal KILIÇ and Lütfihak
ALPKAN for their support and guidance. I would also like to credit Çağrı BULUT from
Yaşar University, Atilla ÖNER and Orçun TÜREGÜN from Yeditepe University and Ekin
TAŞKIN from Aegean Union for Commerce.
My sincere thanks go to my fellow masters student friends, as I have learned a lot
from their feedback and they have been a great source of inspiration and motivation during
my thesis writing period. Our undergrad student Ezgi ÜLGÜR has also greatly contributed to
my work with her assistance in literature search.
6
TABLE OF CONTENTS
ABSTRACT
1. INTRODUCTION............................................................................................................13
1.1 Introduction, Scope and Motivation...................................................................13
1.2 Definitions of Innovation....................................................................................15
1.3 Research Questions and Purposes......................................................................16
1.4 Research Methodology.......................................................................................17
1.5 Organization of the Thesis..................................................................................18
2. PROBLEM DEFINITION................................................................................................19
3. BASIC TERMINOLOGY AND LITERATURE REVIEW............................................20
3.1 Importance of Innovation and Basic Terminology.............................................20
3.2 Innovation Types and Innovation at Firm Level.................................................21
3.3 Review of Innovation Literature.........................................................................22
3.3.1 Drivers of Innovation...........................................................................22
3.3.2 Intellectual Capital...............................................................................23
3.3.3 Organizational Structure......................................................................29
3.3.4 Organizational Culture.........................................................................30
3.3.5 Barriers to Innovation...........................................................................32
3.3.6 Monitoring............................................................................................35
3.3.7 Collaborations.......................................................................................36
4. INNOVATION MODEL AND HYPOTHESES..............................................................44
4.1 Drivers of Innovativeness Model........................................................................45
4.2 Hypotheses..........................................................................................................48
7
5. METHODOLOGY AND ANALYSES..........................................................................50
5.1 The Design of the Questionnaire and the Measurement of Variables..............50
5.2 Data Collection.................................................................................................52
5.3 Statistical Methods............................................................................................56
5.4 Cluster Analysis................................................................................................57
5.5 Data Envelopment Analysis (DEA) .................................................................58
6. RESULTS.......................................................................................................................60
6.1 Cluster Analysis................................................................................................61
6.1.1 Incremental Product Innovation.........................................................62
6.1.2 Radical Product Innovation................................................................62
6.1.3 Process Innovation.............................................................................63
6.1.4 Market Innovation..............................................................................64
6.1.5 Organizational Innovation..................................................................64
6.2 Hypothesis Testing............................................................................................65
6.2.1 Innovation Drivers..............................................................................65
6.2.2 Intellectual Capital............................................................................68
6.2.3 Organizational Structure....................................................................73
6.2.4 Organizational Culture.......................................................................77
6.2.5 Barriers to Innovation.........................................................................81
6.2.6 Monitoring..........................................................................................86
6.2.7 Collaborations....................................................................................90
6.2.8 Results Related to Intellectual Capital Ignoring Specialization.........93
8
6.3 Data Envelopment Analysis..................................................................................94
6.3.1 Innovation Drivers..................................................................................99
6.3.2 Performance Measures...........................................................................105
6.3.3 DEA Results Ignoring Specialization.....................................................113
6.4 Dichotomous Study...............................................................................................117
7. SUMMARY & CONCLUSION.........................................................................................123
7.1 Summary...............................................................................................................123
REFERENCES........................................................................................................................126
9
LIST OF FIGURES
Figure 3.1. In-firm relations in the innovation process......................................................22
Figure 4.1. Drivers of Innovativeness Model.....................................................................45
Figure 5.1. Data Sample Profile.........................................................................................53
Figure 5.2. Industry Profile..................................................... ..........................................54
Figure 5.3. Respondent Profile...........................................................................................55
Figure 6.1. Distribution of Clusters to Industries...............................................................61
Figure 6.2. Incremetal Product Innovation.........................................................................62
Figure 6.3. Radical Product Innovation..............................................................................62
Figure 6.4. Process Innovation...........................................................................................63
Figure 6.5. Market Innovation............................................................................................64
Figure 6.6. Organizational Innovation...............................................................................64
Figure 6.7. Box-plots of Intellectual Capital.....................................................................72
Figure 6.8. Box-plots of Organizational Structure............................................................76
Figure 6.9. Box-plots of Organizational Culture...............................................................80
Figure 6.10.. Box-plots of Barriers to Innovation..............................................................84
Figure 6.11. Box-plots of Monitoring................................................................................89
Figure 6.12. Box-plots of Collaborations...........................................................................92
Figure 6.13. Orange Visualization Model..........................................................................94
Figure 6.14. Drivers of Innovativeness Correlation Results..............................................95
Figure 6.15. Performance Measures Correlation Results...................................................95
Figure 6.16..Efficiency Scores Normality Results.............................................................96
Figure 6.17. Efficiency Scores Mean Comparison Results................................................97
10
Figure 6.18. Pairwise Efficiency Scores Mean Comparison..................................................98
Figure 6.19 Efficiency versus Intellectual Capital.................................................................99
Figure 6.20. Efficiency vs. Organizational Structure.............................................................100
Figure 6.21. Efficiency vs. Organizational Culture...............................................................101
Figure 6.22. Efficiency vs. Barriers to Innovation.................................................................102
Figure 6.23. Efficiency vs. Collaborations............................................................................103
Figure 6.24. Efficiency vs. Monitoring..................................................................................104
Figure 6.25. Efficiency vs. Innovativeness............................................................................105
Figure 6.26. Efficiency vs. Industry......................................................................................106
Figure 6.27. Efficiency vs. Number of Employees................................................................107
Figure 6.28. Efficiency vs. General Innovation Performance...............................................108
Figure 6.29. Efficiency vs. Production Performance.............................................................109
Figure 6.30. Efficiency vs. Marketing Performance..............................................................110
Figure 6.31. Efficiency vs. Financial Performance................................................................111
Figure 6.32. Production vs. General Innovation Performance...............................................112
Figure 6.33. Efficiency vs. Innovativeness (Ignoring specialization)....................................114
Figure 6.34. Efficiency vs. Intellectual Capital (Ignoring specialization).............................115
Figure 6.35. Correlation Results (Ignoring specialization)....................................................116
11
LIST OF TABLES
Table 4.1. Hypotheses Development...................................................................................49
Table 6.1. Drivers of Innovativeness Normality Test Results.............................................66
Table 6.2. Drivers of Innovativeness Mean Comparison Results........................................67
Table 6.3. Intellectual Capital Normality Test Results........................................................69
Table 6.4. Intellectual Capital Mean Comparison Results..................................................70
Table 6.5.Organizational Structure Normality Test Results................................................73
Table 6.6. Organizational Structure Mean Comparison Results.........................................74
Table 6.7. Organizational Culture Normality Test Results.................................................77
Table 6.8. Organizational Culture Mean Comparison Results............................................78
Table 6.9..Barriers to Innovation Normality Test Results...................................................82
Table 6.10. Barriers to Innovation Mean Comparison Results............................................83
Table 6.11.Monitoring Normality Test Results...................................................................86
Table 6.12.Monitoring Mean Comparison Results..............................................................87
Table 6.13.Collaborations Normality Test Results..............................................................90
Table 6.14. Collaborations Mean Comparison Results........................................................91
Table 6.15. Intellectual capital ignoring Specialization Normality Results........................93
Table 6.16. Intellectual capital ignoring Specialization Mean Comparison Results............93
Table 6.17. Numbers of firms with increased or decreased efficiency scores...................113
Table 6.18. Dichotomous Study Normality Results for Cut-Off Level 2..........................117
Table 6.19. Dichotomous Study Normality Results for Cut-Off Level 2,5.......................118
Table 6.20. Dichotomous Study Normality Results for Cut-Off Level 3..........................119
Table 6.21. Dichotomous Study Mean Comparison Results for Cut-Off Level 2.............120

12
Table 6.22. Dichotomous Study Mean Comparison Results for Cut-Off Level 2,5...........121
Table 6.23. Dichotomous Study Mean Comparison Results for Cut-Off Level 3..............122
Table 7.1. Hypothesis Testing Results................................................................................125
13
CHAPTER 1
INTRODUCTION
1.1 Introduction, Scope and Motivation
Post-industrial organizations in todays competitive corporate world are knowledge-
based organizations and their success and survival depend on the emphasis they place on
creativity, innovation, discovery and inventiveness. The early examples of innovation present
themselves in the shape of inventions, such as the watermill, the printing press and the wheel.
Many gadgets invented throughout the existence of human kind had only one purpose to
fulfill, and that was to make life easier for human beings. Today the significance of
innovation to boost competitiveness and profitability is well understood in the corporate
world, and the concept took on a fresh understanding that is widely perceived as the idea that
generates money at the end of the day.
The concept of innovation was not present 100 years ago. In the past, manufacturing
capabilities were extremely important and little significance was given to improving
innovative capabilities of a firm. Today, the developing trends such as globalisation and
outsourcing provide a more competitive market, and drive firms into improving their
efficiency and effectiveness, rather than simply improving their product quality. Corporate
14
world constantly seeks ways to minimize costs and maximize productivity in order to generate
more revenues in an increasingly challenging fast paced business environment. Innovative
capabilities also gained importance due to increased distribution networks and wide-spread
internet usage. Consumers today are much more demanding for customizable products that fit
their wants and needs. Hence, the market is relatively more competitive compared to the past
and is becoming more and more competitive with each day. Firms try their best to exploit
innovation to the fullest, simply because of the extensive emphasis placed on innovation due
to the nature of the knowledge based economy. Benefits of systematic Research and
Development (R&D) endeavours and constant accumulation of know-how are documented to
have proven fruitful results in terms of generating additional revenues and increasing overall
corporate performance and competitive capability. As a result of the emergence of Total
Quality Management (TQM) around 1980s, the increased added value requirements meant
increased knowledge component, thus the stress on innovative capabilities increased
dramatically.
In an extended view, innovation is extremely vital for the advancement of society
around the world. New and innovative products increase the standard of living and provide
mankind with opportunities to improve their everyday lives. Major breakthroughs in medicine
and technology have already significantly improved the living standards around the world.
Moreover, innovation has also led to significant improvements in the way businesses operate
and has closed the gaps between different markets.
Today, the innovation definitions by OECD (2005) are widely accepted around the
world. OECD (2005) classifies innovation in four groups. These are product innovation,
process innovation, market innovation and organizational innovation, respectively.
In this thesis, the concept of innovation is investigated at firm level. Hypotheses were
developed and tested on 184 Turkish manufacturing firms. Six manufacturing sectors that are
subject to statistical testing in this thesis include, textile, chemical, metal, machine industry,
domestic appliances and automotive industries, respectively.
The goal of this thesis is to define taxonomical categories, investigate the innovativeness
depending on the defined performance factors on firm level. For this purpose, cluster analysis,
statistical hypothesis testing and Data Envelopment Analysis (DEA) are three methods that
are resorted to for knowledge extraction.
15
Four clusters formed as a result of cluster analysis are labeled as Leading innovators,
Followers, Inventors and Laggers respectively (Kılıc et al., 2014). Moreover, these clusters
are investigated under the performance factors of intellectual capital, organizational structure,
organizational culture, barriers to innovation, monitoring and collaborations.
1.2 Definitions of Innovation
One of the earlier definitions by Schumpeter (1934) describes innovation as the
introduction of new goods, new methods of production, the opening of new markets, the
conquest of new sources of supply and the carrying out of a new organization in any industry.
On the other hand, Drucker (2002) investigates the innovation concept on a broader
perspective and describes it as the effort to create purposeful, focused change in an
enterprise’s economic or social potential.
The innovation perception to be used in this thesis is closest to the definitions
introduced by the European Commisssion reports (European Commission, 1996), explaining
the characteristics of innovation in three clauses:
i. A radical or marginal extension or update on the range of products, services or
markets.
ii. Development of new methods for production, acquisition and distribution.
iii. Implementation of new techniques that increase the utilization of manpower,
the organization, the work conditions and the administration.
Drucker (1985) stated that innovations are extremely vital for perpetual success and
are located in the heart of the entrepreneurial companies that seek further profitability and
competitiveness. Continuous innovation today is essential and it has become an integral part
of our lives, as we greatly benefit from direct results of innovation in the shape of products
and services we use every day. The pace of innovation has been increasing over time as a
requirement of todays competitive corporate world. On the other hand, innovation is
occasionally unwanted since it is unpredictable, because of technological and demand
uncertainties, and accurate forecasting for innovative products is almost impossible.
Innovation can be disruptive. It makes competencies and knowledge obsolete and shifts bases
16
of power and the change can be scary for some parties, both end-users and the producers. It is
of vital importance to manage such an unpredictable and potentially disruptive, yet essential
process in order to make the most out of it as beneficiaries.
1.3 Research Questions and Purposes
The main objective of this thesis is to develop a drivers of innovation model, and
conduct a taxonomy study on an existing database of survey results from 184 Turkish
manufacturing companies, observe and comment on the similarities and differences among
the clusters that are categorized. A set of hypotheses testing are performed in order to explore
the nature of the relationships between the cluster means of drivers of innovation. The cluster
analysis and statistical testing are performed in order to comment on the explorations in the
light of current innovation literature and provide examples of such instances. Furthermore, a
DEA is performed as an extension to this study in order to reveal the hidden insights in the
details of the data and observe insights from an even deeper perspective.
The database was compiled as part of a project funded by The Scientific and
Technological Research Council of Turkey (TUBITAK) coded 105K105/SOBAG (2007).
The title of the project is “Innovation Models and Implementations in Manufacturing
Industry”. When conducting this study, the research methodology proposed by Meredith et
al. (1989) was taken into consideration for selection of survey application procedure. In the
questionnaire designed a large number of questions are of subjective nature and a 5-point
Likert scale is employed to get the assessments to these questions. By this procedure, intiutive
assessments of managers or the representative staff are taken into consideration through
transformation of these assessments into quantifiable scales. The subjective measurement
eventually paves the way for for manager bias but is used widely in empirical research
(Khazanchi et al., 2007).
The survey method is advantageous particularly because it is relatively less expensive
and is easier to fill. On the other hand, it has the disadvantage of not providing the respondent
needs when in doubt, thus leaving the respondent choose with his or her own perception and
judgment. This study collected answers to 311 survey questions from six different industries
in Turkey and 184 participating firms from several regions. A clustering analysis was
17
conducted, related visualizations and statistical test are provided in the following chapters of
this thesis.
In summary, this thesis is centered towards reaching conclusions on the conceptual
and theoretical aspects of innovation in manufacturing firms in Turkey by utilizing methods
of empirical analysis. The results are visualized and tabulated for facilitating understanding
and comperehension, and the conclusions are expected to provide managerial insights as how
to assess innovativeness among the firms from six different industries of the Turkish
manufacturing firms.
1.4 Research Methodology
In this study, three main research methodologies from datamining, statistics and
information visualization are used. Cluster analysis is conducted in order to obtain the groups
of manufacturing firms that are significantly different from others in terms of sharing
common characteristics. To test the differences of the groups in terms of the innovation
drivers and the subcomponents, hypotheses are developed and put to test. Finally, a DEA
analysis is utilized for the purpose of obtaining the efficiency scores of each firm and
commenting on the figures with respect to clusters and industries. The principal motivation
for using DEA are capabilities of the DEA for reflecting input-output relationships and for
obtaining single dimensional evaluations (efficiency scores) from multi-dimensional data.
The analyses conducted in this thesis was performed in IBM SPSS v20 software.
Statistical methods and hypothesis testing features in this version of the software are sufficient
for performing the hypothesis tests and reaching conclusions. The DEA was performed
employing SmartDEA Solver (Akcay et al., 2012). The figures in this thesis and the analytical
results were visualized in yEd or Orange open-source software with versions 3.11
(yworks.com, 2014) and 2.7.6 (orange.biolab.si, 2014) respectively. The results of the
analyses are gathered and conclusions are drawn in the upcoming chapters.
18
1.5 Organization of the Thesis
This thesis has seven chapters. Introduction and scope, definitions of innovation,
research questions and purposes, and the research methodology are submitted in this chapter.
The second chapter consists of the problem definition. The third chapter provides basic
terminology on innovation concept and a literature review.The fouth chapter proposes a
drivers of innovation model. The fifth chapter presents information on the implemented
methodologies and the analyses conducted, and this chapter features basic information on the
data collection procedure, the measurement of variables, fundamentals of cluster analysis and
the DEA. The sixth chapter supplies the results of the cluster analysis, hypotheses testing and
the DEA model, while the seventh chapter provides a summary and concludes the thesis by a
summary and remarks concerning the limitations of the study. Suggestions for future work are
provided as well.
19
CHAPTER 2
PROBLEM DEFINITION
In operations management studies, researchers utilize taxonomies in order to improve
the understanding of the nature of certain concepts and explore undiscovered territories in the
applicable fields to a greater extend. Taxonomies are mutually exclusive and collectively
exhaustive classifications of organizations. (Nair and Boulton, 2008). The clusters formed
through cluster analysis depending on single or multiple variables, are homogenous among
themselves, but are seperate from the other clusters. Once the clusters are formed, one needs
to label them in accordance with cluster features in order to differentiate them.
In this study, 184 Turkish manufacturing firms are subjected to a cluster analysis. Four
firms are left out by the software as they did not fit into any of the clusters and the remaining
180 firms are clustered in 4 distinct groups and labeled according to their level of
innovativeness in compliance with OECD’s (2005) definitions of innovation types.
The investigation of differences among the cluster groups obtained were done
statistically by hypothesis development and testing. For further analysis, a DEA was
conducted and the results were inspected and interpreted visually. The methodology for the
Cluster Analysis, the Hypothesis testing and the DEA and the results are provided later in this
thesis in Chapters 5 and 6 respectively.
20
CHAPTER 3
BASIC TERMINOLOGY AND LITERATURE REVIEW
3.1 Importance of Innovation and Basic Terminology
Innovation has gained significance in all industries particularly in the last decade
where technological advancements have paved the way for increased emphasis on creating
means of production resulting at lower costs and satisfying customer demand.
Today companies need innovation for various reasons. Innovation brings about
economic growth by transforming the old products, services or processes into new by using
the new technology and knowledge. It is necessary for overall human wealth and well-being,
as more innovation means more businesses, and more businesses require more labor force and
this leads to an increase in employement. Innovation creates new jobs for people and provide
the income for families of all levels. Innovation accelerates the improvement process on new
products, and change our way of living. As a direct consequence of the benefits provided by
innovation, today human beings are enjoying a greater level of comfort and live on higher
standards. Human basic needs and wants are more than satisfied by the new products that are
21
introduced each year. Innovation provides competitive advantage to firms by capturing value
in the existing markets or the newly generated markets. Innovation aids profitability of a firm
by cutting down on costs and thus enabling to survive and thrive in the markets. While
minimizing the costs, innovative activities also aim to maximize the revenues. In order to do
so, marketing and product innovations play a significant role to increase customer awareness
and offer better products to the markets. Innovation takes advantage of the opportunity by
capturing the idea that will sell and generate money out of the realization of the idea. The
return on investment on innovation can be relatively high, when the idea is right and timely. It
is crucial for firms not to ignore the importance of innovation and rather continue to invest on
a constant stream of innovative activities, if they want to survive and thrive in todays’
extremely competitive market.
3.2 Innovation Types and Innovation at Firm Level
One of the first categorizations of innovation concept was introduced by Schumpeter
in 1934. Schumpeter (1934) defined the five types of innovation as new products, new
methods of production, new sources of supply, the exploitation of new markets and new ways
to organize business.
A more recent classification of innovation is provided by OECD (2005) in the Oslo
Manual document and is accepted world-wide as the international standards for defining
innovation and data collection and measurement of innovation. According to the OECD
definition, there are four types of innovation. These are product innovation, process
innovation, marketing innovation and organizational innovation.
Henderson and Clark (1990) categorize innovation types in terms of their impact on
component knowledge and the architectural knowledge. Products with low architectural
knowledge and low impact on component knowledge are incremental innovations, while
those with low impact on architectural knowledge and high impact on component knowledge
are modular innovations. Products with high architectural knowledge and low impact on
component knowledge are architectural innovations, while those with high impact on
architectural knowledge and high impact on component knowledge are termed radical
innovations.
22
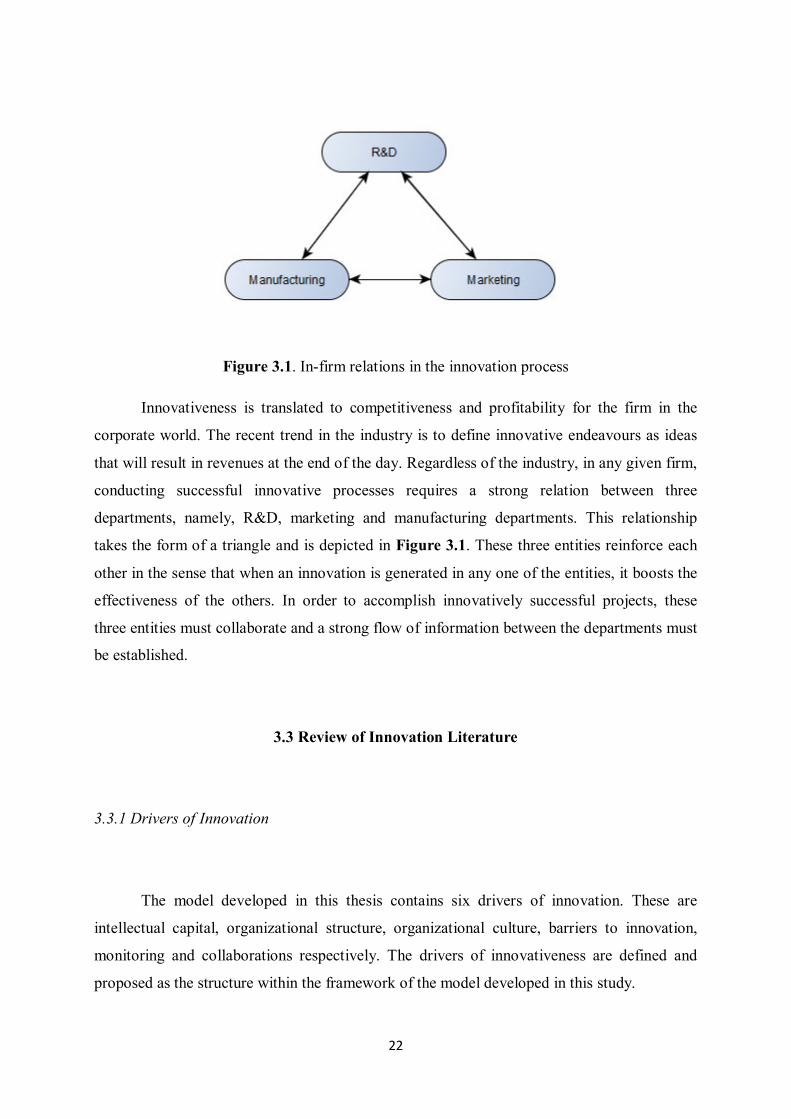
Figure 3.1. In-firm relations in the innovation process
Innovativeness is translated to competitiveness and profitability for the firm in the
corporate world. The recent trend in the industry is to define innovative endeavours as ideas
that will result in revenues at the end of the day. Regardless of the industry, in any given firm,
conducting successful innovative processes requires a strong relation between three
departments, namely, R&D, marketing and manufacturing departments. This relationship
takes the form of a triangle and is depicted in Figure 3.1. These three entities reinforce each
other in the sense that when an innovation is generated in any one of the entities, it boosts the
effectiveness of the others. In order to accomplish innovatively successful projects, these
three entities must collaborate and a strong flow of information between the departments must
be established.
3.3 Review of Innovation Literature
3.3.1 Drivers of Innovation
The model developed in this thesis contains six drivers of innovation. These are
intellectual capital, organizational structure, organizational culture, barriers to innovation,
monitoring and collaborations respectively. The drivers of innovativeness are defined and
proposed as the structure within the framework of the model developed in this study.
23
Related recent literature for each driver can be found in the following sections. Each
subsection from 3.4.2 to 3.4.8 provide the recent literature shedding light on the drivers of
innovativeness either in the case of empirical or theoretical studies.
3.3.2 Intellectual Capital
Vargas-Hernandez and Noruzi (2010) review the Intellectual Capital concepts in
management perspective, and suggest ways in which intellectual capital and learning
organization can be utilized and enhanced in order to improve the organizational
competitiveness of a firm.
Hsu and Sabherwal (2012) investigate the relationship between intellectual capital and
knowledge management on empirical data. Their study consists of a dataset derived from 533
Firms in Taiwan. The authors report that the intellectual capital effects knowledge
management and dynamic capabilities, knowledge management facilitates innovation but not
dynamic capabilities or Intellectual capital, firm performance depends on the efficiency and
innovation but not directly on the dynamic capabilities, and efficiency does not depend on any
of the other constructs proposed in the study.
Wang and Chen (2013) analyze the nature of high-performance work systems and how
they facilitate the incremental and radical innovative capabilities. The authors investigate the
mediating role of intellectual capital on these two entities. Their data consists of 164 Chinese
firms. Their findings report that Organizational and social capital mediate the relationship
between HPWSs and incremental innovative capability, whereas social capital mediates the
relationship between HPWSs and radical innovative capability.
Bellora and Guenther (2013) identify innovation capital disclosure characteristics in
the intellectual capital statements. The authors investigate the relationships of these
statements with industry, firm size, region etc. 51 European Firms are studied in this paper
and homogenous disclosure patterns across the regions in Europe are reported.
Longo and Mura (2011) investigate the effect of intellectual capital on employees’
satisfaction and retention and identify two Human Resources practices which positively
influence intellectual capital. Structural Equation Modeling (SEM)was used in their study and
their database consisted of 1117 employees from a large italian company in food industry.
24
The authors report that human and relational capital do not directly affect employees’ job
satisfaction, and they are affected by structural capital.
Luno et al. (2011) investigate the effects of interorganizational links on radical
innovation using a comprehensive framework and integrate social capital, knowledge based
view and innovation. The analysis on 143 firms of innovative manufacturing and service
industries yield the information that knowledge complexity has a clear influence on radical
innovation, and the mere existence of strong cooperation agreements do not guarantee radical
innovation.
Ruta (2009) elaborates on how the Human Resource portal configuration is facilitating
intellectual capital creation and development. The author works on a case study of a major
consulting firm and finds out that HR configurations for consulting firms are designed for
social capital creation and development.
Subramanian (2012) performs a longitudinal study in order to explore the relationship
between intellectual human capital and exploratory innovation within organizations. The
author conducts the study based on the data obtained from patent, publication and financial
information from biotechnology firms.
Mura et al. (2012) introduce and empircally test a theoretical model that links
intellectual capital dimensions to employees innovative work behaviour and suggests
knowledge sharing behaviour among employees as a key mediator. The data consists of 135
employees in 3 healthcare organizations and SEM is used.
Adrian (2008) explains the intellectual capital notion, the definitions, and its
components, and remarks that information is static whereas knowledge is dynamic.
Marcin (2013) takes the intellectual capital in a regional perspective. He ennumerates
knowledge indicators for measuring intellectual capital at national level, and uses Knowledge
Assesment Methodology (KAM).
Mention (2012) systematically reviews the intellectual capital literature and comments
on the complex relationship between intellectual capital, innovation and performance.
Zerenler et al. (2008) investigate the Influence of intellectual capital of Turkish
automotive supplier industry upon their innovation performance. The study shows that three
types of intellectual capital –employee capital, structural capital, and customer capital– have a
25
significantly positive relationship with innovation performance. Moreover, the results also
indicate that the higher the growth rate of an industry, the stronger are the positive
relationships between three types of intellectual capital and innovation performance. Besides,
customer capital is the greatest among these three types of intellectual capital in Turkish
automotive supplier industry, employee capital is the next, and structural capital is the last.
This shows two points; first, Turkish automotive supplier industry emphasize the interactive
“relations” with their suppliers, clients, and partners; second, it is imperative for Turkish
manufacturing enterprises to develop their structural capital to increase their innovation
performance.
Ding and Li (2010) perform a study on the Management of Intellectual Capital and
how it gradually replaces the real capital and changes to the headspring of value
enhancement for modern enterprises. The authors remark that to acquire advantages in the
market competition, modern enterprises should not only innovate upon products,
marketing channels and services, but also increase the emphasis placed on the R&D and
the firm’s ability to market their products. Moreover, They should also pay attention to the
cultivation of in-house knowledge and the proliferation of the Intellectual Capital.
Kong and Thompson (2009) provide a new intellectual capital perspective of human
resource strategies and practices by providing an overview of connections between three
elements: Intellectual Capital, Human Resource Management and Strategic Human Resource
Management
Wu and Sivalogathasan (2013) refine the existing intellectual capital literature
methods with respect to unique characteristics of the industries. The authors examine the
relationship between intellectual capital and organizational motivation and further elaborate
on multidimensional and contingent gradual effect of intellectual capital on innovation
capability.
Guo et al. (2012) study on intellectual capital and firm performance in 279 biotech
companies in the United States from 1994 to 2005, and claim that R&D expenditure increases
the number of patents, increase in patents do not increase accounting performance, and finally
the quality of human capital plays a positive role in technology innovations and financial
performance.
26
Curado and Henriques (2011) propose an integrated framework for intellectual capital
disclosure. The authors report that the measure, manage and report intellectual capital process
enables firms to more accurately describe their intangible assets.
Molodchik et al. (2012) conduct a literature research. The authors propose a detailed
algorithm for intellectual capital evaluation in terms of input-outcome transformation.
Intellectual Capital Transformation Evaluating Model (ICTEM) was utilized in this study.
Abeysekera (2007) compare Intellectual capital reporting (ICR) of large firms in Sri
Lanka with Australia. The author uses a dataset consisting of the top 30 firms in market
capitalization listed on the Colombo stock exchange, and reports that the ICR differences
identified between two countries can be attributed to economic, social and political factors.
The novelty of this study is that it provides insights into comparative reporting practices
between a developed and a developing country.
Kujansivu and Lönnqvist (2007) investigate the value and efficiency of intellectual
capital and comment on the present state of intellectual capital in Finnish companies. The
authors explain the relationship between concepts value of intellectual capital and efficiency
of intellectual capital. The data used in this study is collected from 20.000 companies in 2001-
2003, and correlation analysis is used in order to analyze the proposed model. The authors
comment on the value and efficiency of IC that are described in 11 industries in both SMEs
and large companies. The originality of this study is that it provides an analysis of relationship
between measures of CIV and VAIC that has not been conducted before.
Echebarria and Barrutia (2013) investigate the social capital as a limitation and
conduct an empirical analysis in the context of European regions. The authors conclude that
there exists an inverted U-shape relationship among some components of social capital and
innovation.
Link and Ruhm (2011) differentiate between public and private knowledge and
comment on the intellectual capital of entrepreneurs. The authors investigate the innovative
actions of entrepreneurs, their tendency to reveal the intellectual capital that results from their
research effeorts in terms of publications or patents. The dataset comes from National
Research council within the US national academies, small business innovation research
awards between 1992 and 2001. The findings of this study are several. The authors report that
entrepreneurs with academic background are more likely to publish their intellectual capital.
27
Business bakgrounded entrepreneurs are likely to patent their IC. Universities aid the
academic entrepreneur but not the business entrepreneur.
Wu et al. (2008) aim to discover how a firm’s operational mode reinforces the
advantages of intellectual capital on innovation. They develop a comprehensive research
model to integrate the relationships among social capital, entrepreneurial orientation,
intellectual capital and innovation. They also note on the moderating effects of spcial capital
and entrepreneurial orientation on innovation. The finding of this paper is that firms with
higher levels of social capital and entrepreneurial orientation tend to amplify the effects of
intellectual capital on innovation.
Castro et al. (2013) analyse the internal complexity that characterises technological
innovation in firms. They document that the innovation capability of a firm depends closely
on its intellectual and/or organisational knowledge assets and on its ability to deploy these
assets. The dataset consists of 251 Spanish high and medium-high technological
manufacturing firms, and multiple regression models were developed in order to analyze the
data. The findings reveal the existence of the moderating role of innovation culture in a
knowledge-based product innovation model.
Lopez-Cabrales et al. (2010) aim to discover the relation of organizational learning
capability with human resource management practises, assess the extension of the value and
uniqueness of human capital that is associated with OLC and the possible mediating role of
human capital in the relationships between HRM practises and OLC. The sample dataset
consists of companies in the most innovative sectors of spanish indusrtry, and the analysis
applies the Partial least squares technique. The authors document that there is a direct
relationship between human capital and the value and uniqueness of employees’ knowledge
and this human capital is associated to HRM practices.
Carmona-Lavado et al. (2013) investigate the influence of human, social and
organizational capital and intensity in collaboration with clients on service innovativeness in
knowledge-intensive business services. The dataset is a sample of companies belonging to
two technology-based KIBS industries: software and R&D Services The findings are that the
positive effect of human capital on service innovativeness is moderated by intenstiy in
collaboration with clients, the effect of social capital on service innovativeness is partially
mediated by human capital and also moderated by intensity in collaboration with clients, and
28
the service innovativeness positively affects innovation success, while intensity in
collaboration with clients has a higher effect.
Carmona-Lavado et al. (2010) study the influence of organizational and social capital
on firms’ product innovation, and the moderating role of radicalness and report that the social
capital favors firms’ product innovation, especially under radical innovations, the
organizational capital has an indirect effect on product innovation through positive influence
on social capital, and firms can stimulate communication and interaction among people, and
therefore innovative activity, by means of explicit and codified knowledge.
Farsi et al. (2013) investigate the impact of social capital on organizational innovation
by studying the mediating factor of entrepreneurial orientation in auto parts
manufacturers. The authors conduct their analysis using the partial least squares structural
equation modeling (PLS-SEM) method on a dataset collected from Iranian auto parts
companies. The findings illustrate that the social capital has a positive, significant impact on
organizational innovation and entrepreneurial orientation among the staff. Entrepreneurial
orientation of the staff in turn affects organizational innovation, which confirms the
mediating effect of entrepreneurial orientation on the relationship between social capital
and organizational innovation.
Musteen and Ahsan (2011) use the intellectual capital perspective as a theoretical
framework, and develop a conceptual model of offshoring of knowledge-intensive, complex
work by young, entrepreneurial firms. They posit that the unique qualities of human, social,
and organizational capital of such firms drive them to offshore complex, nonroutine activities
to foreign vendors. Furthermore, the authors claim that offshoring of such activities might
lead to innovation under certain intellectual capital configurations.
Chang and Chen (2012) integrate the theories on corporate social responsibility and
green management to develop an integral conceptual model of green intellectual capital to
explore its managerial implications and determinants. The authors use SEM on Taiwanese
firms’ dataset.
29
3.3.3 Organizational Structure
Nagappan et al. (2008) investigate the influence of organizational structure on the
software quality by conducting an empirical case study.The findings of the study conclude
that the organizational metrics are related to, and are effective predictors of failure-proneness.
Zheng et al. (2010) aim to establish a link between organizational culture, structure,
strategy and organizational effectiveness by studying the mediating role of knowledge
management. A dataset consisting of survey responses from 301 organizations are analyzed
and the results suggest that the knowledge management mediates the impact of organizational
culture and organizational structure and strategy on organizational effectiveness.
Hornsby et al. (1993) review the intrapreneurship and entrepreneurship literature for
consistent organizational and individual characteristics paving the way for innovative
behaviour. Authors propose a framework model in order to explain the intrapreneural process
of firms based on past theoretical and empirical research.
Sundbo (1999) investigates how well firms are succesful in development of
entrepreneurship competencies and the conditions leading to success in the area. The author
analyzes a small Danish bank in a framework consisting of innovation theory, organizational
theory and the human resource management theory. The findings demonstrate that it is
possible to develop an innovative learning structure within the firm positioned around
corporate entrepreneurship. The condition for entrepreneural success for the firm is reported
to be that the extended barter between the firm and the employees is satisfactory on both
sides.
Van den Ende et al. (2003) investigate the coevolutionary process of firms to organize
their innovative endeavours and the dynamics of the markets. The authors focus on the extent
of the internal autonomy, the integration of R&D, production activities in the product
development process and the external autonomy. Taking into account three cases, the authors
develop hypotheses on the relation between the organization of innovation and bandwagon
and network effects.
Koberg et al. (1996) investigate the macro level facilitators and inhibitors of
innovation, which are considered to be organizational and environmental conditions of a firm
30
that promote or restrain innovation in the firm. Organizational structure, the incentive system,
the resources provided to the employees are considered in the study. The results of this study,
using data from 326 U.S. firms in different stages of their development and are involved with
various kinds of high-tech industries, support the proposed theory that there is a relationship
between a facilitator and innovation changes as the firm evolve. The authors report that
formally structured young firms are less innovative than informal ones and formalization had
no negative impact on innovation in relatively older firms.
3.3.4 Organizational Culture
Barney (1986) investigates the organizational culture and the degrees to which it can
be a source of sustained competitive advantage. The author claims that the firms without the
required cultures are not capable of of engaging in activities to modify their cultures and
generating sustained financial performance. Firms with the required cultures can obtain
sustainable development and superior financial performance.
O’Reilly et al. (1991) discuss the assessment of person-organizational fit by bringing
together a renewed interest in assessing person-situation interactional constructs, the
quantiative assessment of organizational culture, and the application of template matching
approaches. The authors investigate a dataset consisting of longitudinal data from accountants
and MBA students, as well as a cross-section from the industry. They report that
organizational culture is widely open for interpretation as a direct result of the dimensionality
of individual preferences for organizational cultures.
Hornsby et al. (2002) aim to assess the measurement of properties of a scale to
measure the essential factors which effect the middle managers to increase innovative
activities in a firm. In their study, the authors cover critical factors such as the appropriate use
of rewards, gaining top management support, the resource availability, supportive
organizational structure and risk taking and tolerance for failure. The authors developed a
Corporate Entrepreneurship Assessment Instrument (CEAI) as an assessment tool. The
assessment tool consisted of 84 Likert-scale questions. The results demonstrate that the five
organizational culture factors are present in the studied firms and from a managerial
31
perspective, CEAI can be a useful tool in diagnosing a firm’s environment for corporate
entrepreneurship and development of effective training programs for middle managers.
Schein (1984) defines the concept of organizational culture in terms of a dynamic
model on how culture is learned, passed on and changed. The author proposes a framework on
the emergence of organizational culture in a firm, how it is inherited by the future employees
and how it can evolve.
Kuratko et al. (1990) investigate methods to measure the effectiveness of an
environment or culture for the implementation of innovative ideas. The study attempts to
define the factor structure by proposing a framework for measurement of intrapreneurship
culture through the development of the intrapreneurship assessment instrument (IAI). The
authors utilize the assessment tool to assess the effectiveness of an intrapreneurship training
program in a Fortune 500 company.
Alpkan et al. (2010) investigate the impacts of the internal supportive environment for
intrapreneurial activities on firms innovative performance and the degree to which human
capital plays a moderating role in this relationship. The authors conducted a survey
questionnaire to 184 Turkish manufacturing firms and the results demonstrate that the
management sıpport for idea development and risk tolerance are positively effecting the
innovative performance in the firms. The findings also support that the availability of a
reward system and allocation of free time have no impact on innovativeness, whereas work
discretion has a negative effect.
Alpkan et al. (2007) examine the joint effects of market orientation and planning
flexibility on business performance. The authors develop and test hypotheses concerning the
nature of relationship between the factors on a dataset consisting of small and medium-sized
Turkish manufacturing firms. The findings in this study demonstrate that both market
orientation and market flexibility have a positive influence on firm performance.
Naranjo-Valencia et al. (2011) investigate the effect of organizational culture in terms
of fostering or inhibiting the overall organizational innovation as well as the immitation
strategy. The study utilizes a dataset consisting of 471 Spanish firms to develop and test
hypotheses. The findings display that organizational culture is a clear determinant of
innovation strategy and adhocracy cultures foster innovation strategies and hierarchical
cultures promote imitation cultures.
32
Martins and Terblanche (2003) propose a model that presents the determinants of
organizational culture that boost creativity and innovation. The authors identify the
determinants as strategy, structure, support mechanisms, behaviour to encourage innovation
and open communication. The authors further discuss the effect of each determinant on
creativity and innovation.
Morrison and Robinson (1997) examine the organizational culture concept in a
psychological perspective. The authors propose a model explaining the sensemaking process
preceding and employee’s experience of psychological betrayal, and identify the factors
which affect the psychological processes with the purpose of influencing future empirical
research.
Khazanchi et al. (2007) aim to explore how organizational culture values impact a
particular process innovation, the implementation of advanced manufacturing technology
(AMT). The authors examine the value profiles, value congruence and value-practice
interactions.
Claver et al. (1998) analyze the origins of organizational culture emergence in firms
that presents itself in innovation technology. The authors investigate the most important
conditions for the generation of a corporate culture based on technological innovation.
3.3.5 Barriers to Innovation
Shorr (2010) explains why the companies resist to innovation and summarizes the
internal factors in his own words. The top ten apparent reasons are the fear of failure, the fear
of success, the fear of looking foolish, the fear of being first, the inertia, complacency,
unwillingness to act on intuition, stereotyping, not enough energy to sell the ideas internally,
and the companies being too busy with other means of work that will produce added-value.
Chesbrough (2010) studies on the exploration of barriers to business model innovation
including conflict with existing assets as well as cognition. The author cites and provides an
extended research on the previous academic works on the barriers to innovation. Chesbrough
(2010) further elaborates on the barriers and converys the learnings through a case study on
Xerox and the Compact Disc piracy.
33
D’este et al. (2011) argue that there are two types of barriers to innovation, and these
are revealed barriers (degree of difficulty of the innovation process and the learning
experience from the firms engagement in innovation activity) and deterring barriers (obstacles
that prevent the firm from committing to innovation) respectively. The dataset is obtained
from the 4th UK Community Innovation Survey. The findings illustrate that there exists a
strong relationship between the types and it is curvilinear in case of costs and market barriers.
Zhu et al. (2011) invesitage how institution based barriers affect innovation in SMEs
in China. The authors develop a Cost-Risk-Opportunity (CRO) model for innovation. This
study focuses on the data obtained from interviews conducted to 82 managers and owners at
41 SMEs in China. The findings yield that the five key institution-based barriers to innovation
in China are Competition fairness, Access to financing, laws and regulations, tax burden and
support systems respectively.
Madrid-Guijarro et al. (2009) resarch on barriers of manufacturing SMEs in Spanish
context. The authors examine the relation between product, process and management
innovation, as well as thge 15 obstacles and their significance as barriers. The analyses
conducted in this study involve simple regression modelling and hypothesis testing on 294
Spanish SMEs. The findings illustrate the facts that most significant barriers are associated
with costs, least significant barriers are associated with manager/employee resistance, and the
costs associated with innovation have greater impact on small, rather than large firms.
Fortuin and Omta (2009) compare barriers to innovation in business/industry to food
processing industry to come up with actionable insights and propose improvements in food
processing industry. The dataset used in this study involves 9 multinational food processing
firms in Netherlands The authors conclude that the open innovation is underutilized in food
processing industry, and the high pressure from the buyers acts as a strong driver for
innovation. The originality of this paper is that it is the first to investigate innovation concepts
in the context of food industry.
Foxon and Pearson (2008) investigate the policy making for transition to
sustainability. The authors propose guiding principles for sustainable innovation policy
processes, and these are, stimulating the development of a sustainable innovation policy
regime, bringing together innovation and environmental policy regimes, and applying systems
thinking, engaging with the complexity and systemic interactions of innovation systems and
policy-making processes, to promote a transition to sustainability. The study presents a case
34
study on low carbon emission in the UK and the transition approach implemented in the
Netherlands.
Metze and Levelt (2012) explain how collaborative regional governance and
credibility of innovation are imposed by municipalities. The authors emphasize the barriers to
innovation in regional coordination of government unit and the study overviews 4 Dutch city-
regions.
Demirbas et al. (2011) investigate on the effect of perceptions as barriers to innovation
and conduct analysis on empirical evidence from 224 Turkish SMEs. This study introduces
certain characteristics of SME’s in Turkey compared to USA, Japan, UK and South Korea
and comment on the general featuristics of SME entrepreneurs in Turkey. The authors
develop a logit regression model and hypothesis test four proposed ideas. The findings
illustrate that the lack of robust government R&D policy poses as a formal barrier, and the
lack of sizeable and thriving economy as an informal barrier that drives the investment away,
thus making it costly for SMEs to innovate. They also conclude that the innovation decisions
of the owners are highly affected by the lack of appropriate sources of finance and skill
shortages.
Gülcan et al. (2011) compare two Turkish cities, Istanbul and Denizli, in Textile
industry in terms of knowledge generation capabilities and comment on the strengths and
weaknesses of their Regional Innovation System. The authors collected answers to 27
questions from 54 firms in two cities, and their analysis concludes that the relatively smaller
city has the advantage of containing less companies but more interaction among them that
will boost innovation, while the relatively greater city has more companies but these
companies do not interact among each other sufficiently in order to generate knowledge and
increase innovation.
35
3.3.6 Monitoring
Bernhardt (1994) describes what competitive intelligence is, why it represents a key
element in the strategic management system of the company, and how it works in reality. The
author suggests definitions and key concepts into a deeper understanding of the notion of
competitive intelligence.
Prescott (1999) provides a historical overview of the evolution of competitive
intelligence (CI), and the related concepts including the intelligence production process. The
author further evaluates on a framework containing four levels of sophistication in CI
programs. The author remarks that CI can aid in creating more competitive responses to
requests for proposals and commercial opportunities.
Calof and Wright (2008) trace the origins of Competitive Intelligence fields and
identify the practitioners, academics and inter-disciplinary views on CI practice. The authors
review the CI literature extensively. The authors report that their analysis supports the view of
competitive intelligence being an activity consisting of environmental scanning and strategic
management literature.
Qiu (2007) investigate how entrepreneurial attitude and normative beliefs influence
managerial scanning for competitive intelligence and how managerial scanning efforts affect
managerial interpretation of organizations’ strengths and weaknesses in the competitive arena.
The author conducts the analysis on a dataset consisting of survey results from 309 managers
in the USA. The findings demonstrate that entrepreneurial attitude orientation and market
orientation significantly impact managerial scanning for competitive intelligence.
Jaworski et al. (2004) investigate how competitive intelligence is generated within an
organization. The authors propose a conceptual framework describing three stages of CI
generation process: organizing for CI, searching for information and sensemaking. The
proposed framework can be utilized for managing the CI generation process and is discussed
further in the study.
Bose (2007) studies and reports the process used to create and maintain a CI program
in organizations and provides an analysis of several emergent text mining, web mining and
visualization-based CI tools that are specific to collection and analysis of intelligence. The
36
findings of this study constitute a guideline aiding the decision makers and strategic managers
make better understanding of the methods and tools available for making accurate decisions in
the steps involved in generation of CI.
Wright et al. (2002) conduct a pilot research project on UK firms for a better
understanding of their approach to competitive intelligence. The authors develop a tentative
typology of companies reflecting the attributes attitude, gathering, use and location.
Teo and Choo (2001) study the impact of wide spread internet usage by firms for the
purpose of generating CI. The authors use the results of a survey questionnaire for their
analysis and the results demonstrate that research and external use of the internet is
significantly related to the quality of CI information. Moreover, the relationship between
internal use and quality of CI is not detected to be significant. Furthermore, the study reveals
the empirical evidence suggesting that the quality of CI information is positively related to
organizational impact and further implications are discussed.
Rouach and Santi (2001) investigate the growing importance of CI as a management
practice in the majority of leading companies. The authors review the CI literature in order to
define the factors the CI is composed of, and further elaborate on the nature of CI as an
innovation performance booster.
3.4.7 Collaborations
Waite and Williams (2009) examine the social capital’s influence on development of
horizontal export-focused industry clusters. Evaluating the dataset from 9 SMEs in Australia,
the authors report that the collaboration among SMEs increase their effectiveness in
international markets.
Felzenstein et al. (2010) focus on a dataset incorporating the salmon industries from
Scotland and Chile and further explain the marketing collaboration among cluster-based firms
and the nature of the relation between geographical distance and inter-firm marketing
cooperation.
37
Beers et al. (2008) investigate the determinants of innovating firms’ (foreign &
domestic) R&D Collaboration with domestic universities and public knowledge institutes in
Finland and the Netherlands. The authors base their research on Community Innovation
Surveys (CIS) in Finland and Netherlands for the duration 1996-2000. The results illustrate
that the foreign firms in Netherlands are less likely to cooperate with domestic public
knowledge institutions than domestic firms, while in Finland there is no statistical
significance.
Spence et al. (2008) investigate the use of collaboration in Canadian SMEs and aim to
explain the determinants in measuring the success of international ventures.
Arto and Monroy (2009) probe to examine why and how Global Manufacturing
Virtual Networks emerge, and their nature. The authors provide a global framework for
information and communication technologies in Global Manufacturing Virtual Networks.
Monroy and Arto (2010) articulate on the causes behind the establishment of Global
Manufacturing Virtual Networks and analyse these networks. The authors investigate their
convergence to new trend of mass customization and provide a case study on Rolls Royce.
Lööf (2009) aims to estimate the knowledge spillovers to multinational enterprises in
Sweden via domestic and foreign R&D collaboration. The data is collected from 1249
enterprises. Augmented generalized method of moments-estimator that accounts for
selectivity and simultaneity bias are used. The findings of this study demonstrate that the
knowledge spillovers via R&D collaboration is a network phenomenon rather than a process,
successfull collaboration requires foreign innovation partners, output is an increasing function
of R&D collaboration only among non-export oriented firms, and the foreign multinational
enterprises benefit more from R&D collaboration.
Bogers (2011) analyzes ways to protect the R&D know-how and how much
information to share. The author provides extensive literature review and interviews, and
develops a framework based on the case studies. The results suggest revealing methods on
how to cope with the problem and the dataset is collected from 8 Danish firms actively
involved in collaboration. The novelty of this paper is that it provides a holistic perspective on
the knowledge paradox in R&D collaborations as a coupled process of open innovation. It
also provides two strategies to cope with the “tension field” as well as the role and
implications of licensing as a particular mechanism to overcome the open innovation paradox:
38
Open knowledge exchange strategies, layered collaboration schemes with inner and outer
members and licensing.
Buganza and Verganti (2009) investigate the organizational aspects of an open
innovation approach by focusing on the relationship between universities and firms as a tool
for acquiring technological knowledge. The dataset exploited in this study comes from an
Interview-based case study method with 4 companies (from telecom, construction and
aviation industries). The results illustrate that the companies take into account the technology
lifecycle (S-curve) and its associated phases while acquiring knowledge from universities, and
these four main variables determine the decisions by firms on the relationships with the
universities: number of people involved in the organizational unit, positioning of the
organizational unit within or outside the firm, degree of work specialization in the
organizational unit, and the degree of formalization of the process. The novelty of the paper is
that it is the first attempt to analyze the open innovation concept from an organizational
perspective.
Soosay et al. (2008) investigate how collaboration helps continuous innovation in the
supply chain through a dataset from interviews with 23 managers in 10 case studies. The
authors conclude that the differing relationships impact on the operation of firms and their
capacities to innovate. Working together aids integration, increases effectiveness and offers
radical and incremental innovation.
Hawkins and Little (2011) investigate the catalysts required to develop, promote,
implement and maintain effective collaborative practice with special significance attached to
the benefits of business collaboration and partnering with world’s first national standard BS
11000. The authors comment that the BS11000 standard provides a solid bases on which
firms can build more sustainable relationships.
Hingley et al. (2011) examine how using fourth-party logistics management might
improve horizontal collaboration among grocery retailers through a data obtained from 3
suppliers, 3 logistics firms and 1 grocery store retailer. The findings reveal that the fourth-
party logistics negatively influence the retailer-supplier dynamic but provides potential
benefits, and the novelty of this study is that it constitutes an example from a high volume,
mass market industry that needs enormous logistics infrastructure and highly embedded
networks of relationships.
39
Gellynck and Kühne (2010) study the innovation concept in networks and its
application to the traditional food sector. The authors comment on the collaborative
characteristics of the industry, and also mention the barriers that prevent collaboration in this
sector, which are lack of trust, lack of knowledge on benefits of networking, lack of financial
and physical resources and lack of knowledge on appropriate methods and skills. The dataset
consists of interviews in Belgium, Hungary and Italy with 84 participants on 6 food types.
Parida et al. (2012) investigate SME adoption of open innovation by conducting
hypothesis testing on 252 high-tech SMEs from Sweden. The authors’ findings demonstrate
that different open innovation activities are beneficial for different innovation outcomes.
Santamaria and Surroca (2011) analyze the fitness/match of a firm choosing a
technological partner and its impact on the business. The authors conduct their analysis on a
dataset collected from 1300 Spanish manufacturing firms over 5 years in a longitudinal study,
and the findings demonstrate that forming alliances with vertical partners to exploit existing
competences leads to likelihood of obtaining product and process innovations. Horizontal
collaboration is for pre-competitive search and does not have much effect on innovation
outcomes.
Reniers et al. (2010) identify collaboration drivers and partner features for enhancing
the vertical and/or horizontal collaboration in chemical using industries. The authors propose
a framework for Advancing and Stimulating Collaboration (ASC) in chemical industry.
Nieto and Santamaria (2010) describe how technological collaboration helps as
forming the input to innovation process and how SMEs can use it to bridge the innovation gap
between them and the large firms. The authors conduct a longitudinal study on Spanish
manufacturing firms and the results illustrate that technological innovation is beneficial for
all, but the benefit depends on the innovation output and type of partner. The significance is
much higher for product than process innovation for SMEs. Regarding type of partner,
vertical collaboration—with suppliers and clients—has the greatest impact on firm
innovativeness, though this effect is clearer for medium-sized enterprises than for the small
firms.
Owen et al. (2008) examine how collaborative innovation emerges in extended
enterprises and provide a guideline for managing and administrating collaborative behaviour.
40
The authors generate a collaborative innovation ABC, that is Alignment, Boundaries and
Commitment.
Bahinipati et al. (2009) examine how horizontal cooperation in semiconductor
manufacturing industry supply chains may emerge, by proposing quantiative models to assess
the degree of collaboration and generating AHP-fuzzy models.
Giesen et al. (2007) identify three types of business model innovations: industry
models, revenue models and enterprise models. The authors compare the three types in 35
Best practice cases and the study is based on IBM Dataset. The authors remark that the
products and services can be copied, but the business model is the differentiator.
Lhuillery and Pfister (2009) investigate the R&D cooperation and failures in
innovation projects by studying on data from French Community Innovation Survey. The
authors report that 14% of R&D collaborating firms in France had to abort projects due to
partnership difficulties (cooperation failures), and the firms collaborating with competitors
and public research organizations are more likely to stop or abort an innovation project.
Larger firms face less risk for cooperation failures.
Ili et al. (2010) study the concept of open innovation in the automotive industry. They
report that the open innovation proves to be more adequate in the attempt to achieve a better
R&D productivity for companies in the automotive industry than a closed innovation model.
Tomlinson (2010) explores the impact of cooperative ties upon levels of innovation
(product and process) in 5 industries and 436 manufacturing firms. The originality of this
paper is that the hypothesis developed that posits vertical cooperative ties are significant in
explaining the firms level of innovative performance finds statistical significance.
Tsai (2009) evaluates the absorptive capacity’s effect on the relationship between
partners and product innovation performance. The analysis conducted in the study involves a
moderated hierarchical regression approach on 753 firms from Taiwanese Technological
Innovation Survey.
Czarnitzki et al. (2007) investigate the relationship between R&D Collaboration,
Subsidies and R&D performance. The authors remark that in Germany, subsidies for
individual research do neither exhibit a significant impact on R&D nor on patenting, but the
innovative performance could be improved by additional incentives for collaboration. For
41
Finnish companies, public funding is an important source of finance for R&D. Without
subsidies, recipients would show less R&D and patenting activity, while those firms not
receiving subsidies would perform significantly better if they were publicly funded.
Moodysson and Jonsson (2007) examine the role of functional and relational
proximity for knowledge collaboration among biotech firms. The authors’ findings
demonstrate that the embodied knowledge is more sensitive to functional proximity than
projects with encoded knowledge, the local knowledge is never enough, firms seek global
knowledge, thus, form collaborations, and the policy resources aimed at promoting bioregions
are better used for enhancing local resources and providing biotech firms to link up with
global resources.
Segarra-Blasco and Arauzo-Carod (2008) identify the determinants of R&D
cooperation agreements among firms, customer and suppliers, competitors, universities and
public research centers. The authors focus on innovative firms and universities, and the
dataset comes from 4150 firms that participated in Spanish Community Innovation Survey.
MacCormack et al. (2007) comment that the idea of centralized and isolated R&D
teams is obsolete and explain the strategies and practises used by firms to achieve greater
success through collaborative innovation efforts. The authors cite the common mistakes by
companies that do not lead to success through collaboration as the following: focusing on
lower costs while failing to consider the broader strategic role of collaboration; not
organizing effectively for collaboration; believing that innovation could be managed
much like production and partners treated like “suppliers.”; not investing in building
collaborative capabilities; assuming that their existing employees and processes are
already equipped for the challenge.
Leiponen and Byma (2009) examine how the SMEs can get greater return on their
R&D investment and how they perceive innovation. The authors comment that most small
firms take pride in returns by speed to market, and those working closely with universities
believe that the number of patents is the major indicator.
Drejer and Vinding (2007) explore the relation between absorptive capacity and the
propensity to collaborate across geographical distance. The authors report that the firms
located in the relatively sparsely populated region are more likely to collaborate with firms
located outside the region; and for these firms, the level of absorptive capacity matters for the
42
distance to the collaboration partners—firms with a low level of absorptive capacity tend to
collaborate with domestic partners, while those with a high level of absorptive capacity are
much more likely to find their main product-innovation partner abroad. Their dataset is
composed of 2 Danish neighbouring regions.
Abramovsky et al. (2009) discuss the roles of knowledge flows, cost and risk-sharing
and public financial support in firms’ decisions to collaborate. The authors analyze the dataset
composed of firms from France, Germany, Spain, and UK. The findings illustrate that firms
valueing external information flows are more likely to co-operate, spanish firms collaborate to
overcome risks and financial constraints, and public support is positively related to engaging
in collaborative innovation.
Camarinha-Matos et al. (2009) describe the key concepts related to Collaborative
Networked Organizations (CNO), classify the collaborative networks and provide application
cases. The authors conclude with remarks on the key challenges and further discussion.
Nieto and Santamaria (2007) explain the role of different models of collaborative
networks in achieving product innovations and their degree of novelty on a dataset composed
of Spanish firms in a longitudinal study. Their findings reveal that collaboration with partners
has negative effect, while the greatest positive impact comes from networks comprising of
different types of partners (generation of new ideas, diversity).
Weaver (2008) explains how collaborative pull innovation has induced a
fundamentally new dynamic in innovation processes and remark that the new form of
innovation aims at fulfilling consumer demand judging from a dataset in food sector.
Vrande et al. (2009) discuss the motives and perceived challenges of SMEs when
adopting open innovation practices. The authors measure open innovation on 8 innovation
practices and analyze a dataset from 605 innovative SMEs from Netherlands. Their findings
demonstrate that the medium sized firms are more engaged in open innovation practices
compared to smaller firms, SMEs use open innovation for practical purposes, like meeting
customer demands or keeping up with the competition in the market, and the most important
challenges are organizational and cultural issues.
Zeng et al. (2010) investigate the relationship between cooperation networks and
innovation performance of SMEs, by conducting SEM on 137 Chinese manufacturing SMEs.
The authors’ findings demonstrate that the Inter-firm cooperation has the most positive
43
impact, cooperation with government agencies do not demonstrate significant impact, and the
cooperation with customers, suppliers and other firms are more important than research
institutions, universities or colleges and government agencies.
Elmquist et al. (2009) conduct an extensive literature research on open innovation
concept. The authors study the academic papers and books on open innovation until
November 2007, and the contribution of 9 researchers on the subject for further research. The
novelty of this work is that it constitutes a comprehensive review of open innovation to
understand the key concepts on a wider perspective.
Serrano and Fischer (2007) elaborate on how high-tech systems aid collaborative
innovation in enterprises.
44
CHAPTER 4
INNOVATION MODEL AND HYPOTHESES
The ultimate purpose of a commercial organization today is to sustain a profitable
business and excel in the corporate world. With increasing emphasis placed on innovation in
the last decade, companies are constantly striving for ways to generate innovation to boost
their innovative capabilities. Consequently, enhanced innovative skills yield strong
competitiveness and sustainable profitability for a company. In innovation literature, a great
number of studies are conducted in order to be able to accurately define factors that assess the
innovative capabilities, which are also presented in Chapter 2.
In this chapter, an innovation model is presented with six innovativeness drivers and
their contents, and the hypotheses developed are proposed.
4.1 Drivers of Innovativeness Model
The drivers of innovativeness model proposed in this section demonstrate the
relationships among the innovation elements. Judging from the recent literature research
provided in Chapter 2, most of the innovation-backed research that supports large
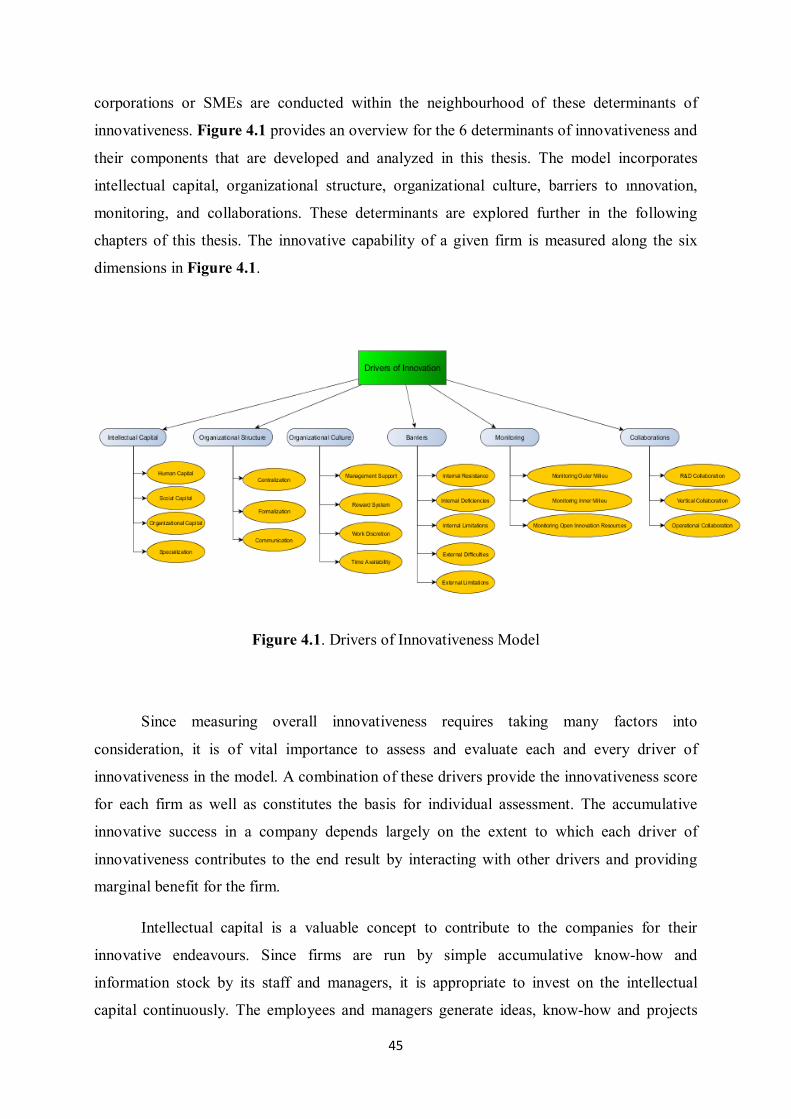
45
corporations or SMEs are conducted within the neighbourhood of these determinants of
innovativeness. Figure 4.1 provides an overview for the 6 determinants of innovativeness and
their components that are developed and analyzed in this thesis. The model incorporates
intellectual capital, organizational structure, organizational culture, barriers to ınnovation,
monitoring, and collaborations. These determinants are explored further in the following
chapters of this thesis. The innovative capability of a given firm is measured along the six
dimensions in Figure 4.1.
Figure 4.1. Drivers of Innovativeness Model
Since measuring overall innovativeness requires taking many factors into
consideration, it is of vital importance to assess and evaluate each and every driver of
innovativeness in the model. A combination of these drivers provide the innovativeness score
for each firm as well as constitutes the basis for individual assessment. The accumulative
innovative success in a company depends largely on the extent to which each driver of
innovativeness contributes to the end result by interacting with other drivers and providing
marginal benefit for the firm.
Intellectual capital is a valuable concept to contribute to the companies for their
innovative endeavours. Since firms are run by simple accumulative know-how and
information stock by its staff and managers, it is appropriate to invest on the intellectual
capital continuously. The employees and managers generate ideas, know-how and projects
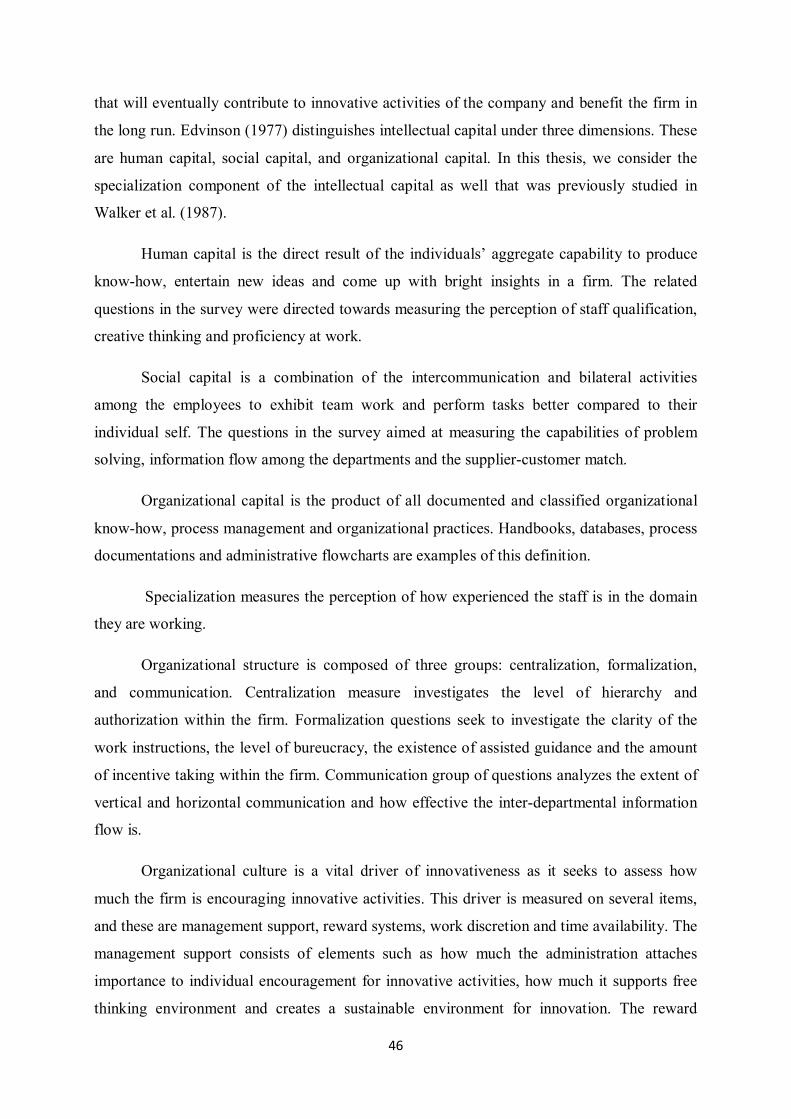
46
that will eventually contribute to innovative activities of the company and benefit the firm in
the long run. Edvinson (1977) distinguishes intellectual capital under three dimensions. These
are human capital, social capital, and organizational capital. In this thesis, we consider the
specialization component of the intellectual capital as well that was previously studied in
Walker et al. (1987).
Human capital is the direct result of the individuals’ aggregate capability to produce
know-how, entertain new ideas and come up with bright insights in a firm. The related
questions in the survey were directed towards measuring the perception of staff qualification,
creative thinking and proficiency at work.
Social capital is a combination of the intercommunication and bilateral activities
among the employees to exhibit team work and perform tasks better compared to their
individual self. The questions in the survey aimed at measuring the capabilities of problem
solving, information flow among the departments and the supplier-customer match.
Organizational capital is the product of all documented and classified organizational
know-how, process management and organizational practices. Handbooks, databases, process
documentations and administrative flowcharts are examples of this definition.
Specialization measures the perception of how experienced the staff is in the domain
they are working.
Organizational structure is composed of three groups: centralization, formalization,
and communication. Centralization measure investigates the level of hierarchy and
authorization within the firm. Formalization questions seek to investigate the clarity of the
work instructions, the level of bureucracy, the existence of assisted guidance and the amount
of incentive taking within the firm. Communication group of questions analyzes the extent of
vertical and horizontal communication and how effective the inter-departmental information
flow is.
Organizational culture is a vital driver of innovativeness as it seeks to assess how
much the firm is encouraging innovative activities. This driver is measured on several items,
and these are management support, reward systems, work discretion and time availability. The
management support consists of elements such as how much the administration attaches
importance to individual encouragement for innovative activities, how much it supports free
thinking environment and creates a sustainable environment for innovation. The reward
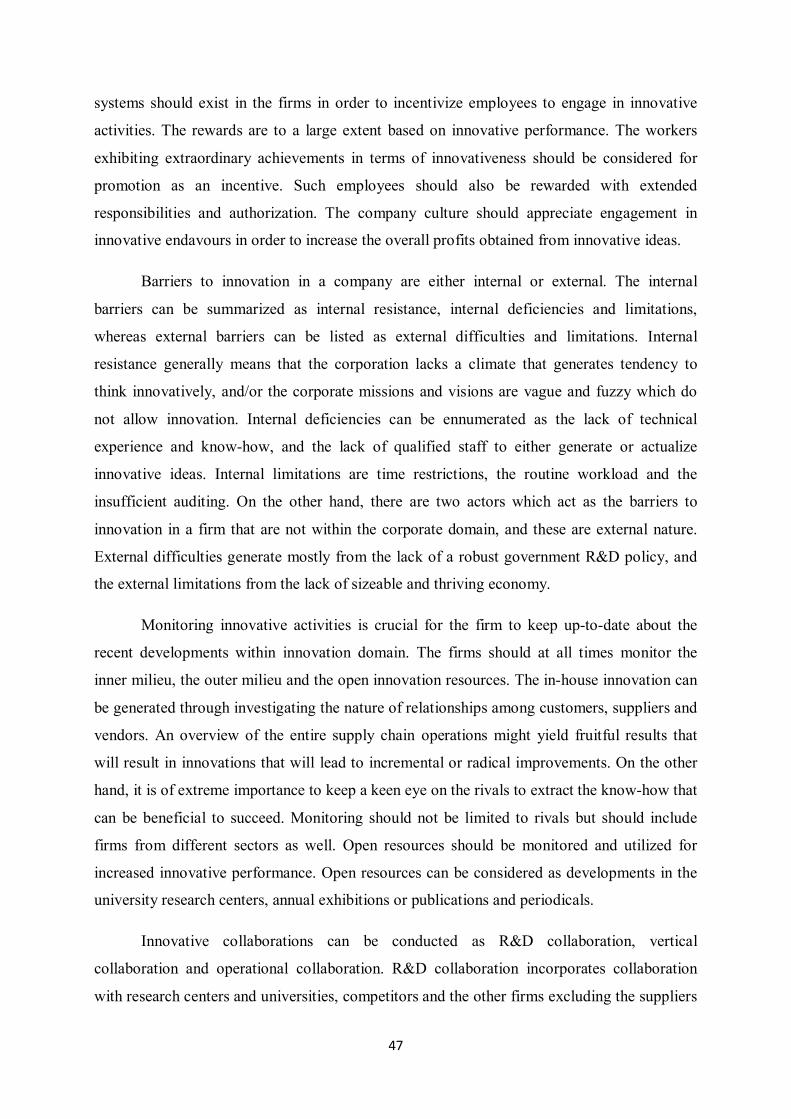
47
systems should exist in the firms in order to incentivize employees to engage in innovative
activities. The rewards are to a large extent based on innovative performance. The workers
exhibiting extraordinary achievements in terms of innovativeness should be considered for
promotion as an incentive. Such employees should also be rewarded with extended
responsibilities and authorization. The company culture should appreciate engagement in
innovative endavours in order to increase the overall profits obtained from innovative ideas.
Barriers to innovation in a company are either internal or external. The internal
barriers can be summarized as internal resistance, internal deficiencies and limitations,
whereas external barriers can be listed as external difficulties and limitations. Internal
resistance generally means that the corporation lacks a climate that generates tendency to
think innovatively, and/or the corporate missions and visions are vague and fuzzy which do
not allow innovation. Internal deficiencies can be ennumerated as the lack of technical
experience and know-how, and the lack of qualified staff to either generate or actualize
innovative ideas. Internal limitations are time restrictions, the routine workload and the
insufficient auditing. On the other hand, there are two actors which act as the barriers to
innovation in a firm that are not within the corporate domain, and these are external nature.
External difficulties generate mostly from the lack of a robust government R&D policy, and
the external limitations from the lack of sizeable and thriving economy.
Monitoring innovative activities is crucial for the firm to keep up-to-date about the
recent developments within innovation domain. The firms should at all times monitor the
inner milieu, the outer milieu and the open innovation resources. The in-house innovation can
be generated through investigating the nature of relationships among customers, suppliers and
vendors. An overview of the entire supply chain operations might yield fruitful results that
will result in innovations that will lead to incremental or radical improvements. On the other
hand, it is of extreme importance to keep a keen eye on the rivals to extract the know-how that
can be beneficial to succeed. Monitoring should not be limited to rivals but should include
firms from different sectors as well. Open resources should be monitored and utilized for
increased innovative performance. Open resources can be considered as developments in the
university research centers, annual exhibitions or publications and periodicals.
Innovative collaborations can be conducted as R&D collaboration, vertical
collaboration and operational collaboration. R&D collaboration incorporates collaboration
with research centers and universities, competitors and the other firms excluding the suppliers
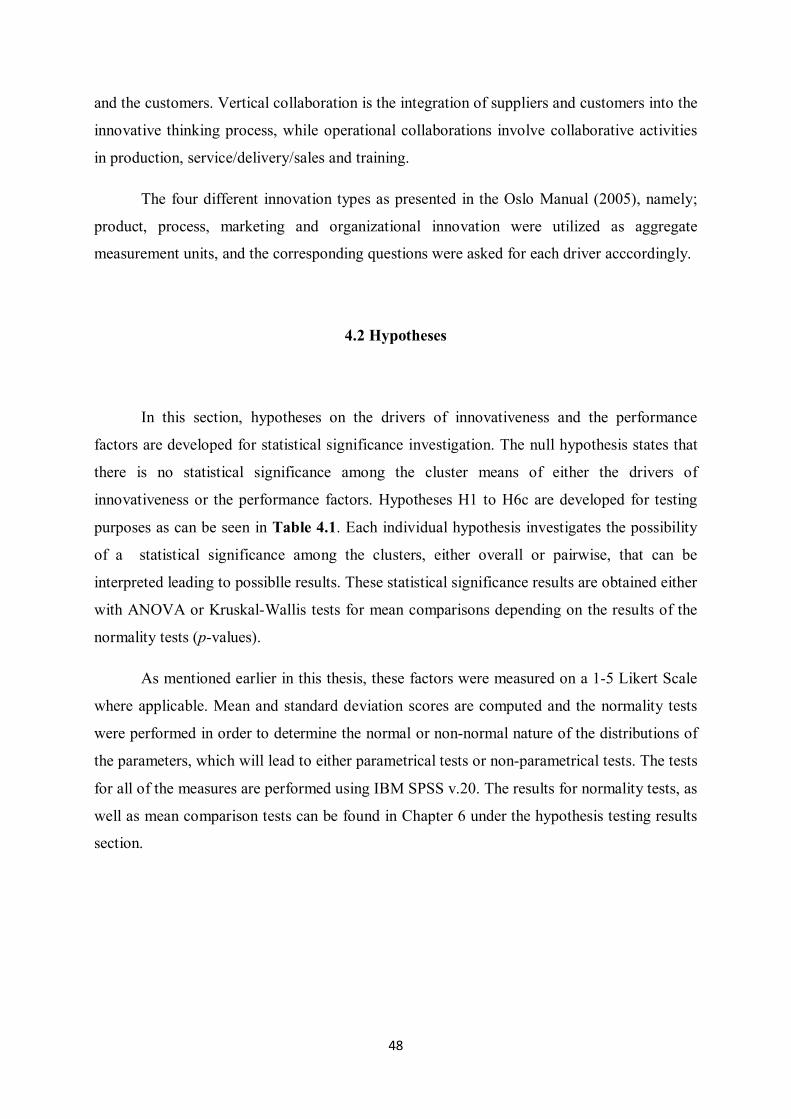
48
and the customers. Vertical collaboration is the integration of suppliers and customers into the
innovative thinking process, while operational collaborations involve collaborative activities
in production, service/delivery/sales and training.
The four different innovation types as presented in the Oslo Manual (2005), namely;
product, process, marketing and organizational innovation were utilized as aggregate
measurement units, and the corresponding questions were asked for each driver acccordingly.
4.2 Hypotheses
In this section, hypotheses on the drivers of innovativeness and the performance
factors are developed for statistical significance investigation. The null hypothesis states that
there is no statistical significance among the cluster means of either the drivers of
innovativeness or the performance factors. Hypotheses H1 to H6c are developed for testing
purposes as can be seen in Table 4.1. Each individual hypothesis investigates the possibility
of a statistical significance among the clusters, either overall or pairwise, that can be
interpreted leading to possiblle results. These statistical significance results are obtained either
with ANOVA or Kruskal-Wallis tests for mean comparisons depending on the results of the
normality tests (p-values).
As mentioned earlier in this thesis, these factors were measured on a 1-5 Likert Scale
where applicable. Mean and standard deviation scores are computed and the normality tests
were performed in order to determine the normal or non-normal nature of the distributions of
the parameters, which will lead to either parametrical tests or non-parametrical tests. The tests
for all of the measures are performed using IBM SPSS v.20. The results for normality tests, as
well as mean comparison tests can be found in Chapter 6 under the hypothesis testing results
section.
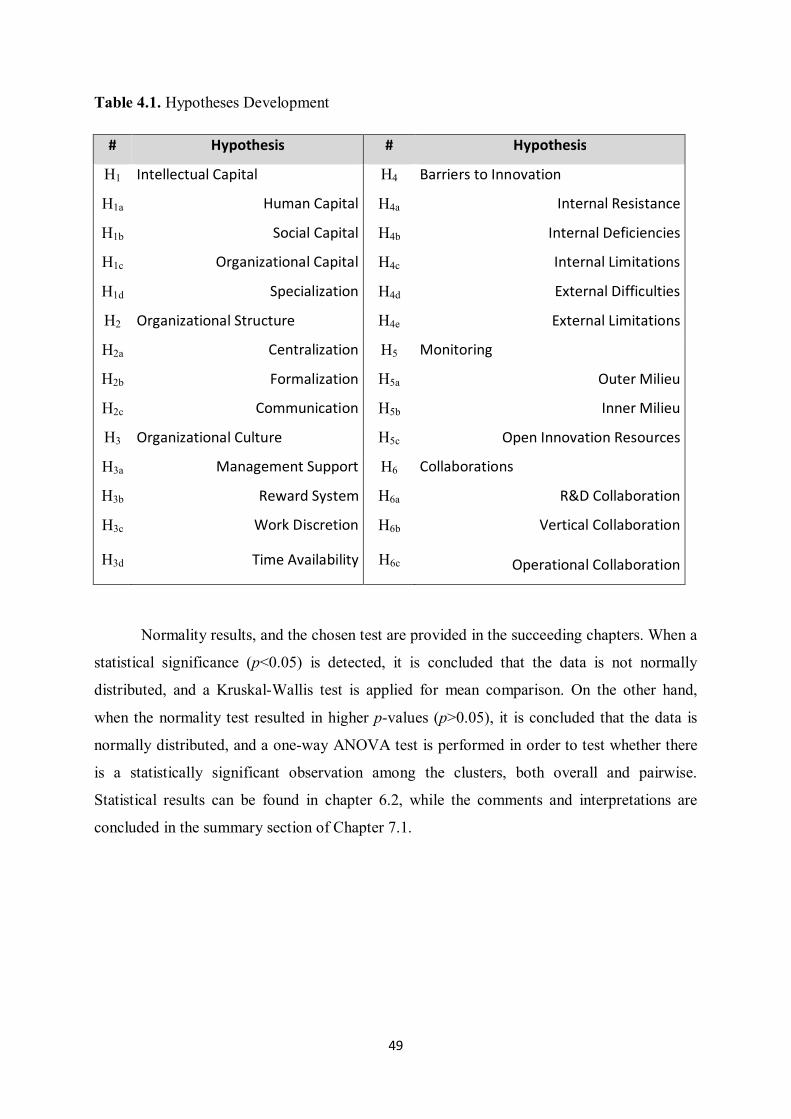
49
Table 4.1. Hypotheses Development
# Hypothesis # Hypothesis
H1 Intellectual Capital H4 Barriers to Innovation
H1a Human Capital H4a Internal Resistance
H1b Social Capital H4b Internal Deficiencies
H1c Organizational Capital H4c Internal Limitations
H1d Specialization H4d External Difficulties
H2 Organizational Structure H4e External Limitations
H2a Centralization H5 Monitoring
H2b Formalization H5a Outer Milieu
H2c Communication H5b Inner Milieu
H3 Organizational Culture H5c Open Innovation Resources
H3a Management Support H6 Collaborations
H3b Reward System H6a R&D Collaboration
H3c Work Discretion H6b Vertical Collaboration
H3d Time Availability H6c Operational Collaboration
Normality results, and the chosen test are provided in the succeeding chapters. When a
statistical significance (p<0.05) is detected, it is concluded that the data is not normally
distributed, and a Kruskal-Wallis test is applied for mean comparison. On the other hand,
when the normality test resulted in higher p-values (p>0.05), it is concluded that the data is
normally distributed, and a one-way ANOVA test is performed in order to test whether there
is a statistically significant observation among the clusters, both overall and pairwise.
Statistical results can be found in chapter 6.2, while the comments and interpretations are
concluded in the summary section of Chapter 7.1.
50
CHAPTER 5
METHODOLOGY AND ANALYSES
5.1 The Design of the Questionnaire and the Measurement of Variables
For investigation purposes, a questionnaire with 311 individual questions were
prepared and submitted to upper managers of manufacturing companies in 6 distinct
industries, namely textile, chemical, metal products, machinery, domestic appliances and
automative industries. The questionnaire was designed to assess the firm’s business strategy,
innovativeness degree, competitive priorities, market and technology strategy, existing market
situation and overall corporate performance and it was constructed in the neighbourhood of
the proposed model.
The measurement of the variables was achieved as follows (Ulusoy et al., 2014).
The questionnaire form is prepared by considering recent questionnaire forms
utilized in similar studies and commonly accepted measures met in the current literature.
Specifically, the questions about manufacturing strategies (operations priorities),
organization culture, innovation barriers, intellectual capital, business strategies are
enquired using a 5-point Likert scale and inquiring how important each item is for the firm
51
with the scale ranging from 1=extremely unimportant to 5=extremely important. Such
subjective measures possibly bring in manager bias, but are widespread practice in empirical
research (Khazanchi et al., 2007).
The scales of the four different manufacturing strategies' measures are adapted from
existing operations management (OM) literature with six, six, seven, and six criteria,
respectively. The base of items asked regarding these priorities are adapted mainly from
Boyer and Lewis (2002), Alpkan et al. (2003) , Noble (1997), Ward et al. (1998),
Vickery et al. (1993) and Kathuria (2000). For business strategy items, we also benefited
from Olson et al. (2005).
The scales of the three intellectual capital measures are constructed by inspiring
from Subramaniam and Youndt (2005) with five, five, and four criteria, respectively for the
human capital, social capital and organizational capital. Similarly organizational culture
measures are adapted from several criteria in OM literature based previous studies of Walker
et al. (1987), Jaworski and Kohli (1993) and Menon et al. (1999).
The questions about innovative capabilities are enquired employing a 5-point
Likert scale. The respondents are asked to indicate “to what extent are the related
applications/practices implemented in your organization in the last three years” ranging from
1=‘not implemented’, 2=‘imitation from national markets’, 3=‘imitation from
international markets, 4=‘current products/processes are improved’, 5=‘original
products/processes are implemented’. The base of items regarding these capabilities is
adapted mainly from Oslo Manual [2005]. Each innovation construct is measured by
its original measurement items, which are developed accordingly. Note that the innovation
measures used in this research are partially new for the literature and required to be validated
during the analysis.
The numerical responses to the questions were averaged out to obtain the mean values,
which were used to represent the variable associated with the measurement unit.
On the other hand, some of the innovation determinants such as the general
firm characteristics (i.e., size, age, owner ship status and foreign capital) and innovation
outlay are in a different scale (the answer to these determinants have either nominal
values or logical values such as yes or no). Same is true for the marketing and technology
strategies.
52
5.2 Data Collection
For investigation purposes, a questionnaire with 311 individual questions were
prepared and submitted to upper managers of manufacturing companies in 6 distinct
industries, namely textile, chemical, metal products, machinery, domestic appliances and
automative industries. The questionnaire was designed to assess the firm’s business strategy,
innovativeness degree, competitive priorities, market and technology strategy, existing market
situation and overall corporate performance and it was constructed in the neighbourhood of
the proposed model.
The initial survey went through a pilot study consisting of 10 interviews to ensure the
appropriability of formatting, wording and sequencing of the questions. Further information
on data gathering stage can be found in Günday et. al (2011).
The dataset was obtained over a 7-month period. As a result of the diversity of the
organizational structures, manufacturing business units were selected as the unit of analysis.
A total of 1674 firms were randomly selected in accordance with the number of firms
represented the size of the sector and the province. 184 useful questionnaires were obtained,
resulting in a response rate of 11%. All the respondents completing the questionnaire were
from the top (52%) or middle management (48%).
The profile of the sample is represented in Figure 5.1. Firm size was determined by
the number of full-time employees (up to 50: small, between 50 and 250: medium, more than
250: large) and the firm age was determined by the year the firm started production (older
than 1975: old, between 1975 and 1992: moderate, younger than 1992: young).
After the data collection stage, multivariate statistical analyses via SPSS v20 software
package were conducted in order to validate the research framework. Missing data points
were handled by the random distribution (MAR) on items and they were deleted by list-wise
deletion. Control variables were investigated on age, size, foreign capital and legal status in
terms of statistical significance and no statistical evidence was spotted.
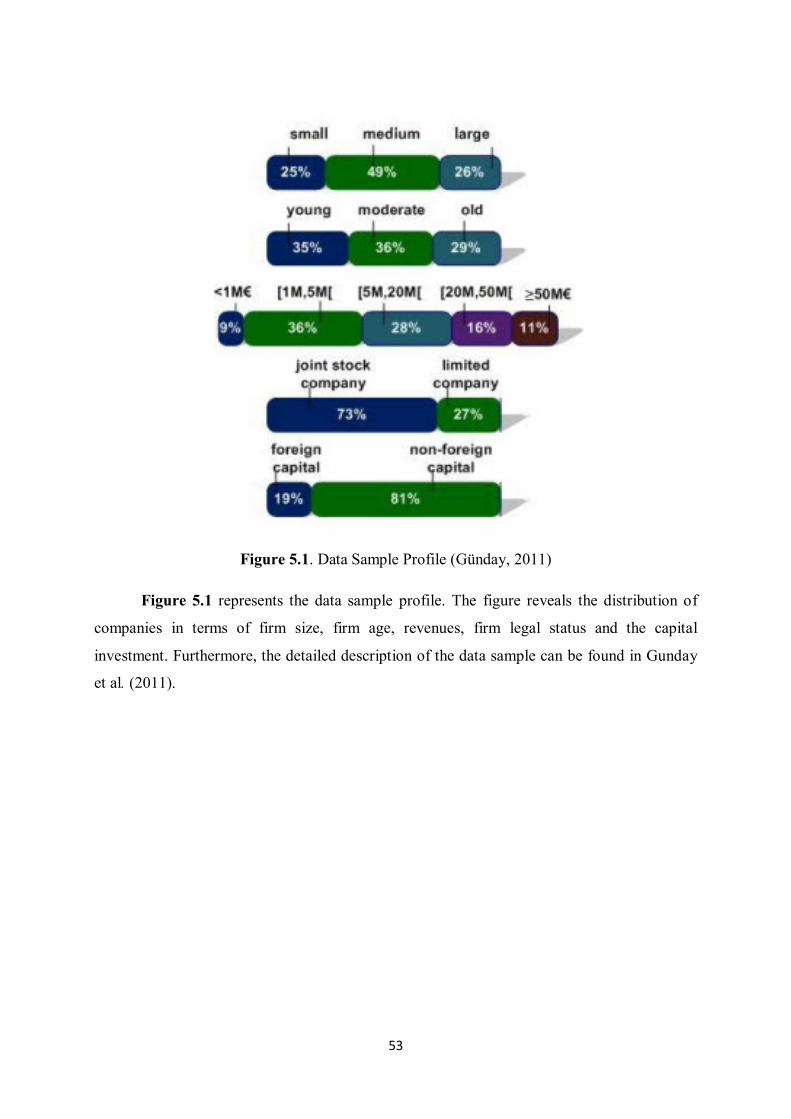
53
Figure 5.1. Data Sample Profile (Günday, 2011)
Figure 5.1 represents the data sample profile. The figure reveals the distribution of
companies in terms of firm size, firm age, revenues, firm legal status and the capital
investment. Furthermore, the detailed description of the data sample can be found in Gunday
et al. (2011).
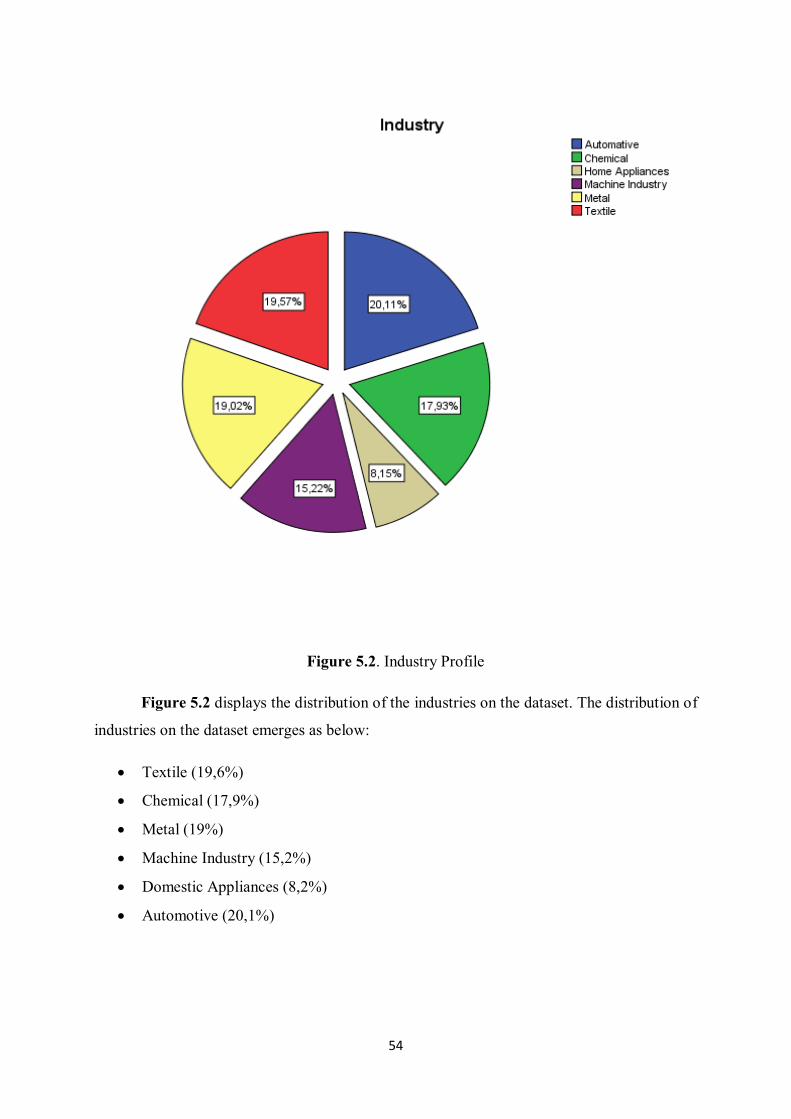
54
Figure 5.2. Industry Profile
Figure 5.2 displays the distribution of the industries on the dataset. The distribution of
industries on the dataset emerges as below:
Textile (19,6%)
Chemical (17,9%)
Metal (19%)
Machine Industry (15,2%)
Domestic Appliances (8,2%)
Automotive (20,1%)
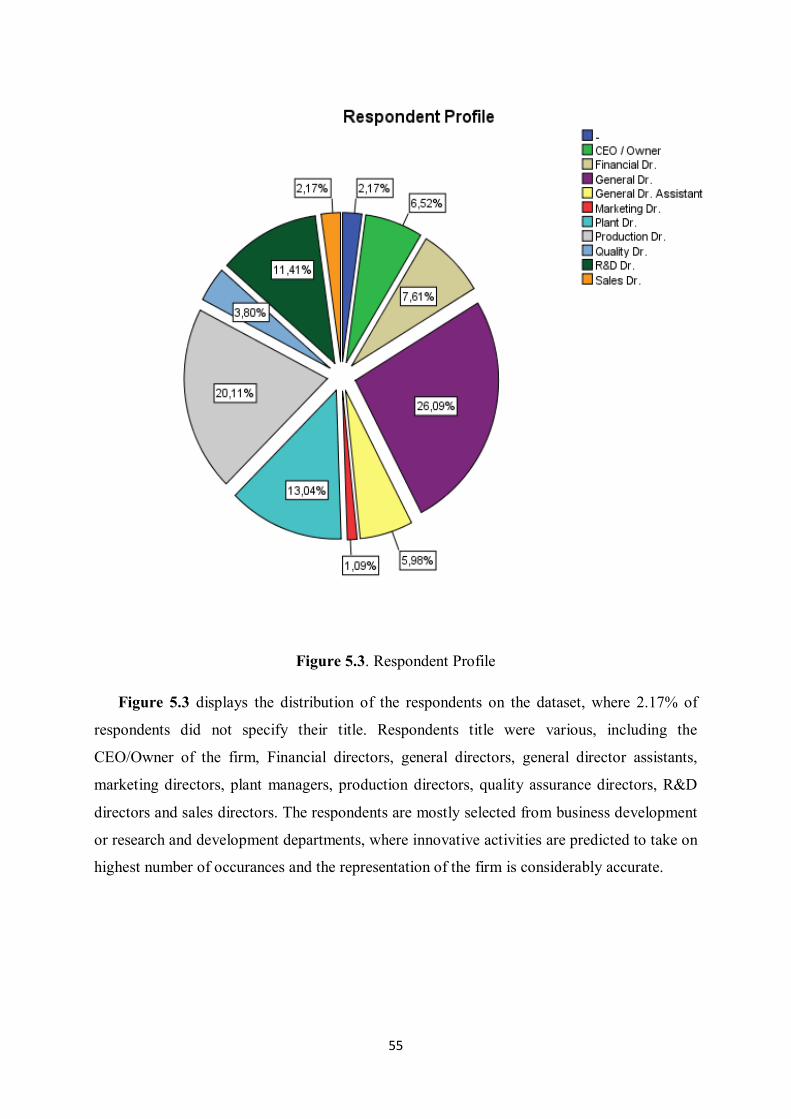
55
Figure 5.3. Respondent Profile
Figure 5.3 displays the distribution of the respondents on the dataset, where 2.17% of
respondents did not specify their title. Respondents title were various, including the
CEO/Owner of the firm, Financial directors, general directors, general director assistants,
marketing directors, plant managers, production directors, quality assurance directors, R&D
directors and sales directors. The respondents are mostly selected from business development
or research and development departments, where innovative activities are predicted to take on
highest number of occurances and the representation of the firm is considerably accurate.
56
5.3 Statistical Methods
In order to identify the statistical relationships among the innovativeness drivers, the
initial step is to determine whether the data points in each group are distributed normally or
not. The first important decision was whether to choose parametric or non-parametric
statistical tests (Conover, 1998). For this purpose, normality tests are performed.
Parametricality and non-parametricality of the sample points are commented. Since
parametric tests are applicable only when the distribution exhibits a parameterized distribution
like normal distribution, they were not applicable in all the cases in our study. The widely
used Shapiro-Wilk test was applied to test whether the samples follow normal distributions or
not (Shapiro and Wilk, 1965).
The parametric t-test, and the non-parametric Wilcoxon rank-sum test (also known as
the Mann–Whitney U test; Mann and Whitney, 1947) could not be used for testing the
statistical significance of the differences in the means. These two tests are used when there are
only two samples to compare. In our case of multiple clusters, either ANOVA (when
normally distributed), or a Kruskal-Wallis test (when non-normally distributed) were
performed depending on the normality results of the samples.
Kruskal-Wallis test does not make assumptions on the normality of the data, since it is
a non-parametric test, ANOVA test, on the other hand, expects the inputs to be normally
distributed. Similar to Wilcoxon rank-sum test, Kruskal-Wallis test is performed on ranked
data, so the data points are attached a ranking value in accordance with the overall dataset.
One-way anova analysis does not request ranked input data, since the variables are nominal
and assumed to exhibit normal distribution. The Kruskal-Wallis test does not test the null
hypothesis that the input samples have identical means, that is the null hypothesis for one-way
ANOVA test. Even though Kruskal-Wallis test does not assume normal distribution and this
fact makes the test powerful, it should be noted that the test assumes that the observations in
each group exhibit the same shape of distribution, thus neglecting skewness which may
provide inaccurate results, as discussed by Fagerland and Sandvik (2009).
Gaten (2010) lists the data types that can be used with the Kruskal-Wallis test. He
remarks that the data points must be independent from each other, the distributions do not
have to be normal and the variances do not have to be equal, ideally there should be more than
57
five data points per sample, all individuals must be selected at random from the population, all
individuals must have equal chance of being selected, and the sample sizes should be as equal
as possible but with some differences allowed.
In order to investigate the DEA efficiency scores, a Spearman Correlation Analysis
(Spearman, 1904) was performed, and the results are provided in the DEA chapter. Spearman
tests displays a positive correlation between two measures when the resulting rho values are
between 0 and 1, and a negative correlation when the values are between 0 and -1.
5.4 Cluster Analysis
A hierarchical procedure based on Ward‟s agglomerative method was used with
squared Euclidian distance measure. As a stopping rule, the elbow criterion was implemented
(Hair, Anderson, Tatham and Black, 2006). The cluster analysis yielded 4 distinct clusters
and consequently these clusters were examined in terms of their mean differences and thus,
possible managerial insights.. The clusters obtained in this section were grouped as follows:
Followers(82 firms), Inventors (35 firms), Leading Innovators (41 firms) and Laggers (22
firms). 4 firms were excluded from the analysis due to incomplete data, and these are firms
numbered 1, 114, 143 and 183 respectively.
Having formed the clusters, a statistical mean comparison is performed for these four
groups. Overall mean comparisons, as well as pairwise mean comparisons are provided in the
chapters following this one. The results are tabulated and visualized in box-plots. The
comparisons in the next chapter necessitated one-way ANOVA test with Bonferroni post-hoc
pair-wise (Bonferroni test adjustment is utilized because it constitutes a general approach as
corrective measures for overall error when there are irregularities or missing points in the
data, and it also aids in conrtoling Type-1 error) comparison or Kruskal-Wallis mean
comparison testing for the purpose of determining which clusters distinguished themselves
from the others in a statistically significant manner, in terms of the aforementioned six
determinants of innovativenes.
The clusters were categorized through a naming convention that is suitable for each
cluster. In accordance with OECD’s classification of innovation. As an addition to OECD’s
58
(2005) four groups, we have further dissected product innovation into incremental product
innovation and radical product innovation in order to have a more accurate analysis. The
clusters are obtained in terms of their incremental product innovation, radical product
innovation, process innovation, marketing innovation and organizational innovation. These
clusters were then named Leadering Innovators, Followers, Inventors and Laggers
respectively.
Leading Innovators are the top firms that have a robust reputation in being innovative,
and they outperform the other 3 clusters in all domains of the 5 definitions of innovation.
Followers pursue the innovativeness road that is paved by the Leading innovators and benefit
from immitating the innovation. They are better off than Inventors and Laggers in all domains
except radical product innovation. Even though Inventors are ahead of the Followers in terms
of radical product innovation, it falls short in other domains and is only better off than the
Laggers. Laggers perform the worst regarding all the innovation definitions.
5.5 Data Envelopment Analysis (DEA)
DEA is a highly effective methodology that can be implemented in order to
benchmark a group of entitites, through efficiency scores (Cooper et al., 2006). Through the
results of DEA, managers are able to gain actionable insights and improve the overall
performance of their organization. As a performance measuring tool, the use of DEA has been
popular in the literature. There exist various applications of DEA, and Gattoufi et al. (2004a)
provide a classification scheme for the DEA studies in literature, based on data source, type of
implemented DEA model, analysis, and the nature of the paper. The contents of the studies in
the DEA literature are discussed in another paper by Gattoufi et al. (2004b).
Calculations of efficiency scores are based on the values of inputs and outputs for the
entities, which are referred to as Decision Making Units (DMUs). Inputs, are the resources
consumed by the DMUs, for generating desired outputs. Efficiency score, which takes a value
between 0 and 1, increases as a DMU can generate higher values in any of the outputs when
the input values are the same, or when a DMU can generate the same values in the outputs
when any of the input values is lower.
59
In our study, the 6 drivers of innovativeness (Intellectual Capital, Organizational
Structure, Organizational Capital, Barriers to Innovation, Monitoring and Collaborations)
were considered as inputs and the single dimension innovativeness was considered to be the
output for the DMUs. It is reasonable to reduce these 6 dimensions into 1 dimension in order
to evaluate the level of innovativeness on a single metric. Since the input values can not be
changed, the goal of a DMU is to increase the values of its outputs. The values for each driver
of innovativeness are measured on a 1-5 Likert scale, and can not take negative values. As a
result of the input values being constant, the objective of a DMU is to increase the values of
its outpus, which interprets to the necessity of an output oriented model. This perspective is
reflected in the selected DEA model, which is the output-oriented BCC model (BCC-O). In
this research, an interactive open source DEA modelling software, SmartDEA Solver (Akcay
et al., 2012), has been extensively used. As a result of the DEA analysis, the multi
dimentional evaluation for the 6 criteria is expressed in a single dimension, that is the
efficiency score for each firm. The efficiency score for a firm represents the overall
innovativeness of that firm with respect to the 6 drivers of innovativeness.
60
CHAPTER 6
RESULTS
In this chapter, the results of analyses are provided and commented upon.
Sub-sections under Chapter 6.1 display the cluster analysis results, sections under
Chapter 6.2 provide the hypothesis testing results, while Chapter 6.3 concludes Chapter 6
with the DEA results.
Figures related to clusters are provided and groupings are commented upon. Unique
positioning of the four clusters, namely Leading Innovators, Followers, Inventors and Laggers
are displayed in the visuals. Mean comparison tests and statistical investigations are
conducted and the resulting significance values are given in the chapters below. DEA analysis
provided efficiency scores that signify the relative efficiency scores of each firm in our
dataset compared to the others in terms of input and output relationship. The figures were
obtained in terms of clusters obtained in the cluster analysis and elaborated further.
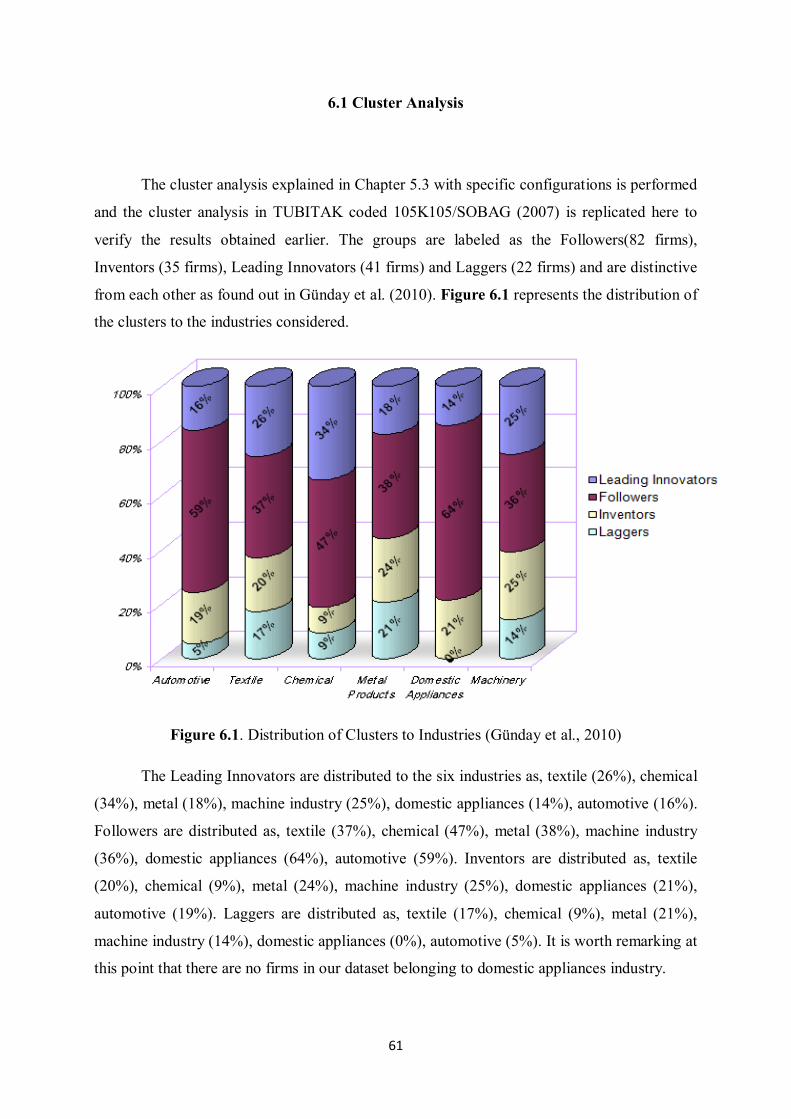
61
6.1 Cluster Analysis
The cluster analysis explained in Chapter 5.3 with specific configurations is performed
and the cluster analysis in TUBITAK coded 105K105/SOBAG (2007) is replicated here to
verify the results obtained earlier. The groups are labeled as the Followers(82 firms),
Inventors (35 firms), Leading Innovators (41 firms) and Laggers (22 firms) and are distinctive
from each other as found out in Günday et al. (2010). Figure 6.1 represents the distribution of
the clusters to the industries considered.
Figure 6.1. Distribution of Clusters to Industries (Günday et al., 2010)
The Leading Innovators are distributed to the six industries as, textile (26%), chemical
(34%), metal (18%), machine industry (25%), domestic appliances (14%), automotive (16%).
Followers are distributed as, textile (37%), chemical (47%), metal (38%), machine industry
(36%), domestic appliances (64%), automotive (59%). Inventors are distributed as, textile
(20%), chemical (9%), metal (24%), machine industry (25%), domestic appliances (21%),
automotive (19%). Laggers are distributed as, textile (17%), chemical (9%), metal (21%),
machine industry (14%), domestic appliances (0%), automotive (5%). It is worth remarking at
this point that there are no firms in our dataset belonging to domestic appliances industry.
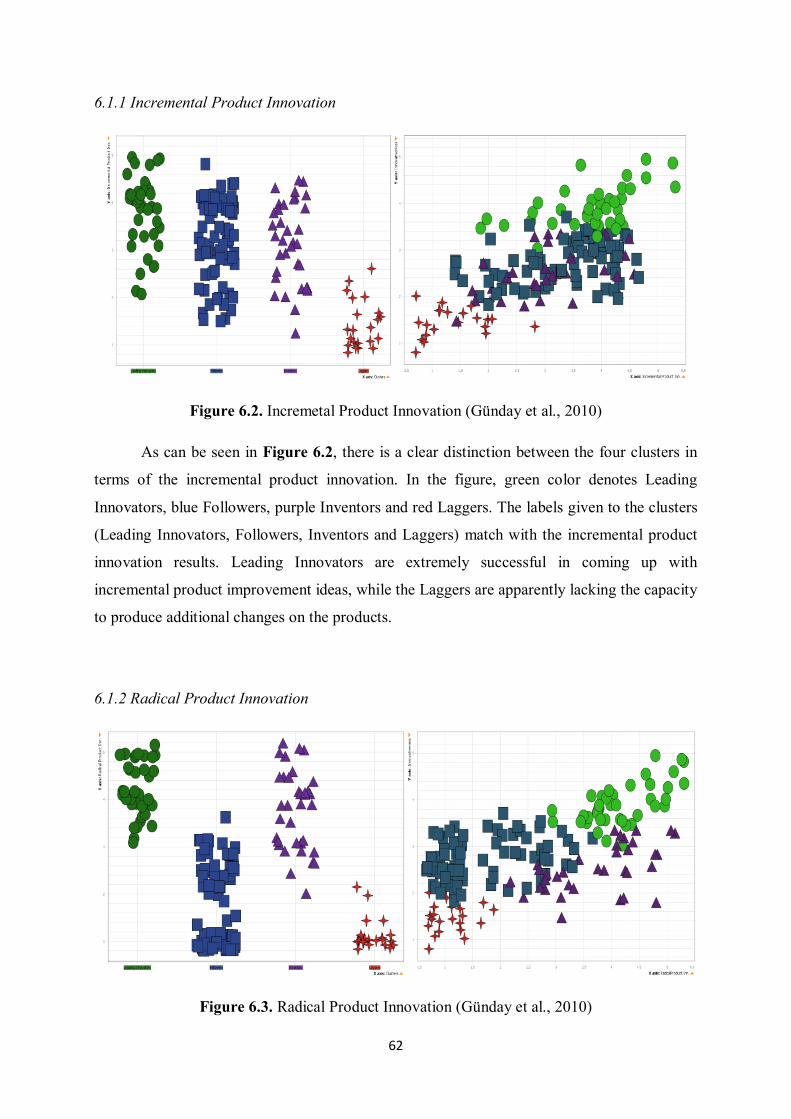
62
6.1.1 Incremental Product Innovation
Figure 6.2. Incremetal Product Innovation (Günday et al., 2010)
As can be seen in Figure 6.2, there is a clear distinction between the four clusters in
terms of the incremental product innovation. In the figure, green color denotes Leading
Innovators, blue Followers, purple Inventors and red Laggers. The labels given to the clusters
(Leading Innovators, Followers, Inventors and Laggers) match with the incremental product
innovation results. Leading Innovators are extremely successful in coming up with
incremental product improvement ideas, while the Laggers are apparently lacking the capacity
to produce additional changes on the products.
6.1.2 Radical Product Innovation
Figure 6.3. Radical Product Innovation (Günday et al., 2010)
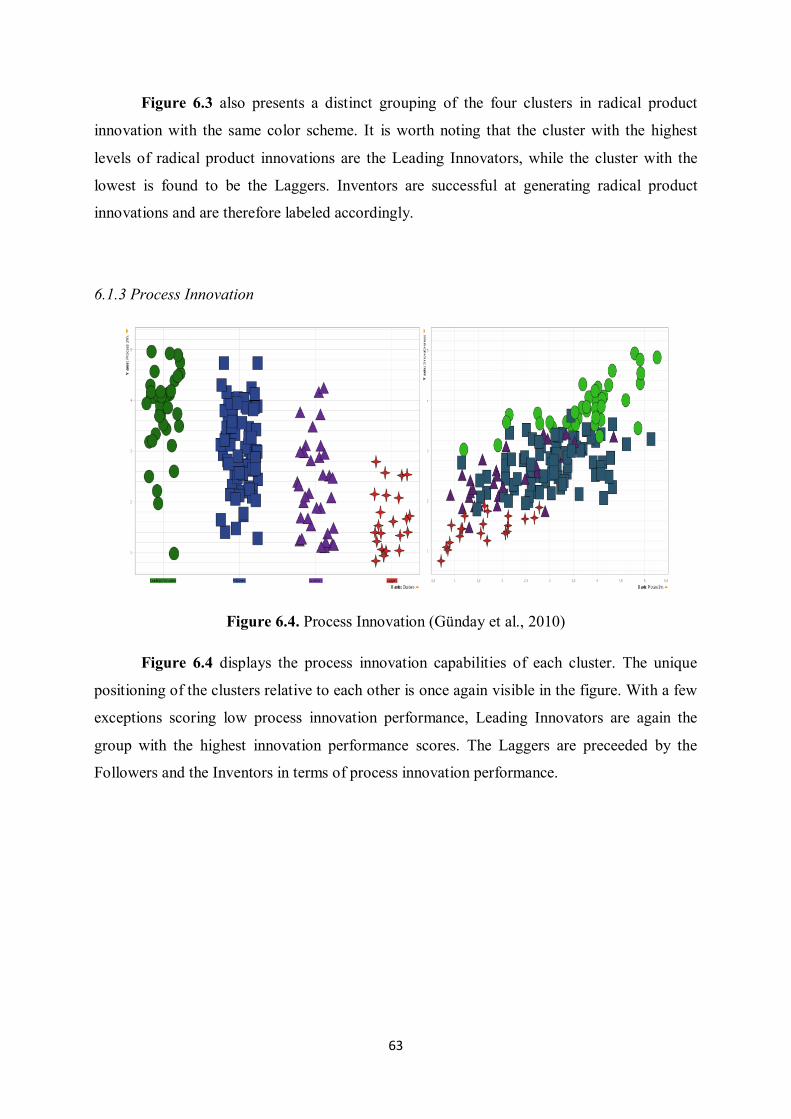
63
Figure 6.3 also presents a distinct grouping of the four clusters in radical product
innovation with the same color scheme. It is worth noting that the cluster with the highest
levels of radical product innovations are the Leading Innovators, while the cluster with the
lowest is found to be the Laggers. Inventors are successful at generating radical product
innovations and are therefore labeled accordingly.
6.1.3 Process Innovation
Figure 6.4. Process Innovation (Günday et al., 2010)
Figure 6.4 displays the process innovation capabilities of each cluster. The unique
positioning of the clusters relative to each other is once again visible in the figure. With a few
exceptions scoring low process innovation performance, Leading Innovators are again the
group with the highest innovation performance scores. The Laggers are preceeded by the
Followers and the Inventors in terms of process innovation performance.
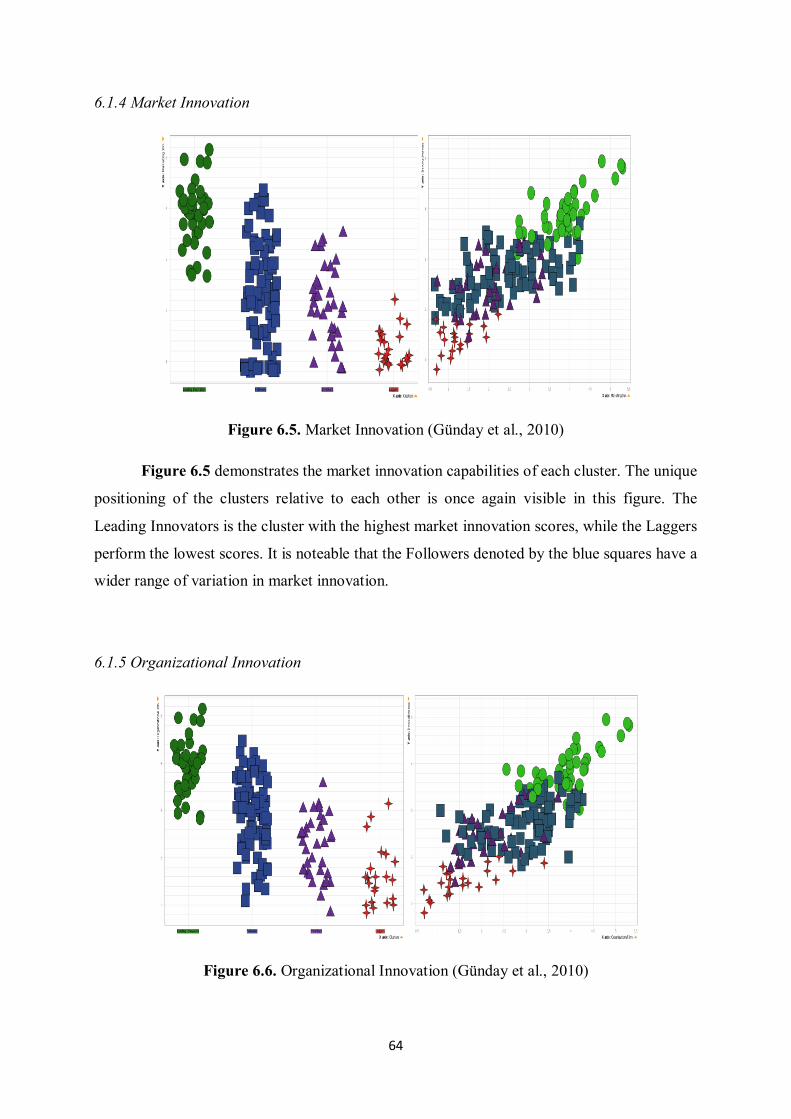
64
6.1.4 Market Innovation
Figure 6.5. Market Innovation (Günday et al., 2010)
Figure 6.5 demonstrates the market innovation capabilities of each cluster. The unique
positioning of the clusters relative to each other is once again visible in this figure. The
Leading Innovators is the cluster with the highest market innovation scores, while the Laggers
perform the lowest scores. It is noteable that the Followers denoted by the blue squares have a
wider range of variation in market innovation.
6.1.5 Organizational Innovation
Figure 6.6. Organizational Innovation (Günday et al., 2010)
65
Figure 6.6 displays the organizational innovation scores for each firm in 4 clusters.
The distribution of the firms in different clusters is similar to the previous distributions
obtained for the other innovation types. Once again, the firms in the Leading Innovators
cluster lead the others, and the firms in the Laggers cluster trail the others.
6.2 Hypothesis Testing
In this section, statistical significances among clusters obtained in Chapter 6.1 are
examined. Each section in this chapter is provided with the tabulated results of the normality
tests and the following overall and pairwise mean comparison tests.
Normality results were interpreted in accordance with a certain rule, that is when any
of the clusters exhibits statistical significance (p<0.05) for a given innovation driver or a
component of an innovation driver, it is assumed to be non-normally distributed and non-
parametric mean comparison test Kruskal-Wallis is performed, otherwise when each and
every one of the clusters exhibits no statistical significance (p>0.05), the test is assumed to
distribute normally and the parametric one-way ANOVA test was performed for multiple
mean comparisons.
Chapters 6.2.1 displays the normality and variance testing results for the drivers, while
Chapters 6.2.2 to Chapter 6.2.7 display the results for the components for each driver tested
among the four clusters.
6.2.1 Drivers of Innovativeness
The six drivers of innovativeness proposed as an integrated model framework in this
thesis were tested in terms of their normality. Table 6.1 displays the significance results, and
which variance testing method is applied in accordance with the p-values as explained in
Chapter 6.2. The red and underlined p-values under Shapiro-Wilk Significance column
indicate the statistical significance, while the regular fonts provide no statistical significance.
It is observed that among all the innovativeness drivers, only organizational structure has a
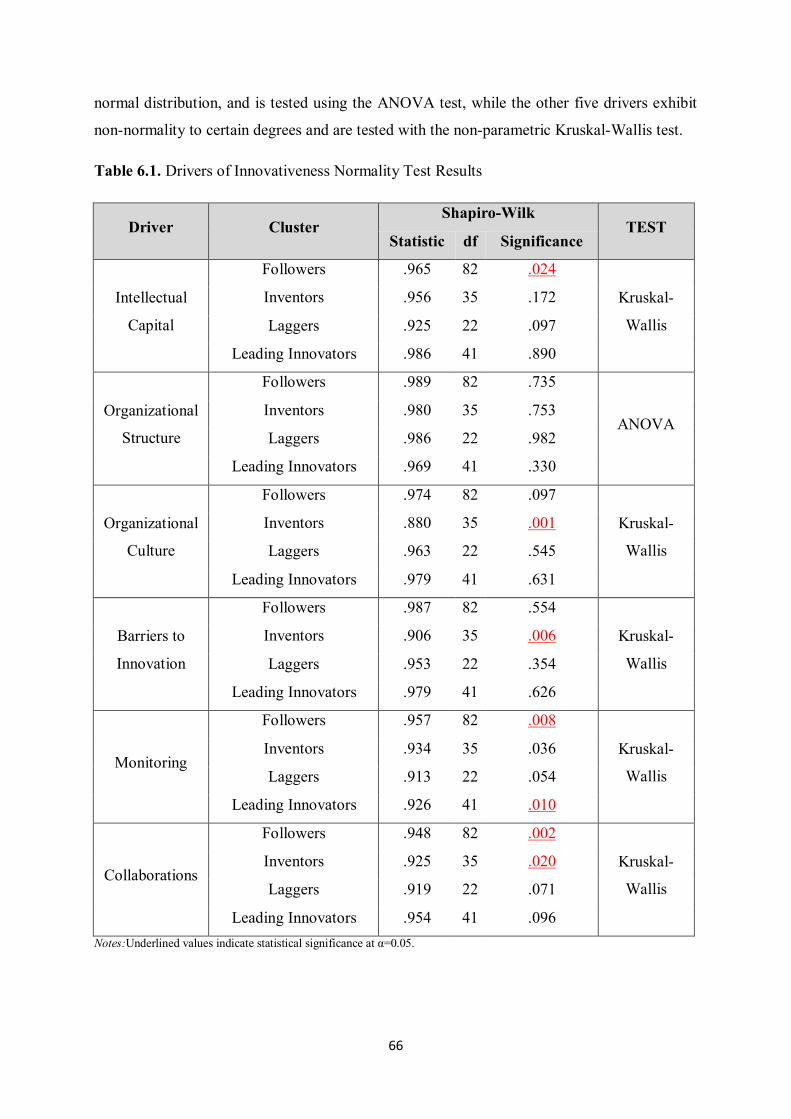
66
normal distribution, and is tested using the ANOVA test, while the other five drivers exhibit
non-normality to certain degrees and are tested with the non-parametric Kruskal-Wallis test.
Table 6.1. Drivers of Innovativeness Normality Test Results
Driver Cluster Shapiro-Wilk
TEST Statistic df Significance
Intellectual
Capital
Followers .965 82 .024
Kruskal-
Wallis
Inventors .956 35 .172
Laggers .925 22 .097
Leading Innovators .986 41 .890
Organizational
Structure
Followers .989 82 .735
ANOVA Inventors .980 35 .753
Laggers .986 22 .982
Leading Innovators .969 41 .330
Organizational
Culture
Followers .974 82 .097
Kruskal-
Wallis
Inventors .880 35 .001
Laggers .963 22 .545
Leading Innovators .979 41 .631
Barriers to
Innovation
Followers .987 82 .554
Kruskal-
Wallis
Inventors .906 35 .006
Laggers .953 22 .354
Leading Innovators .979 41 .626
Monitoring
Followers .957 82 .008
Kruskal-
Wallis
Inventors .934 35 .036
Laggers .913 22 .054
Leading Innovators .926 41 .010
Collaborations
Followers .948 82 .002
Kruskal-
Wallis
Inventors .925 35 .020
Laggers .919 22 .071
Leading Innovators .954 41 .096 Notes:Underlined values indicate statistical significance at α=0.05.
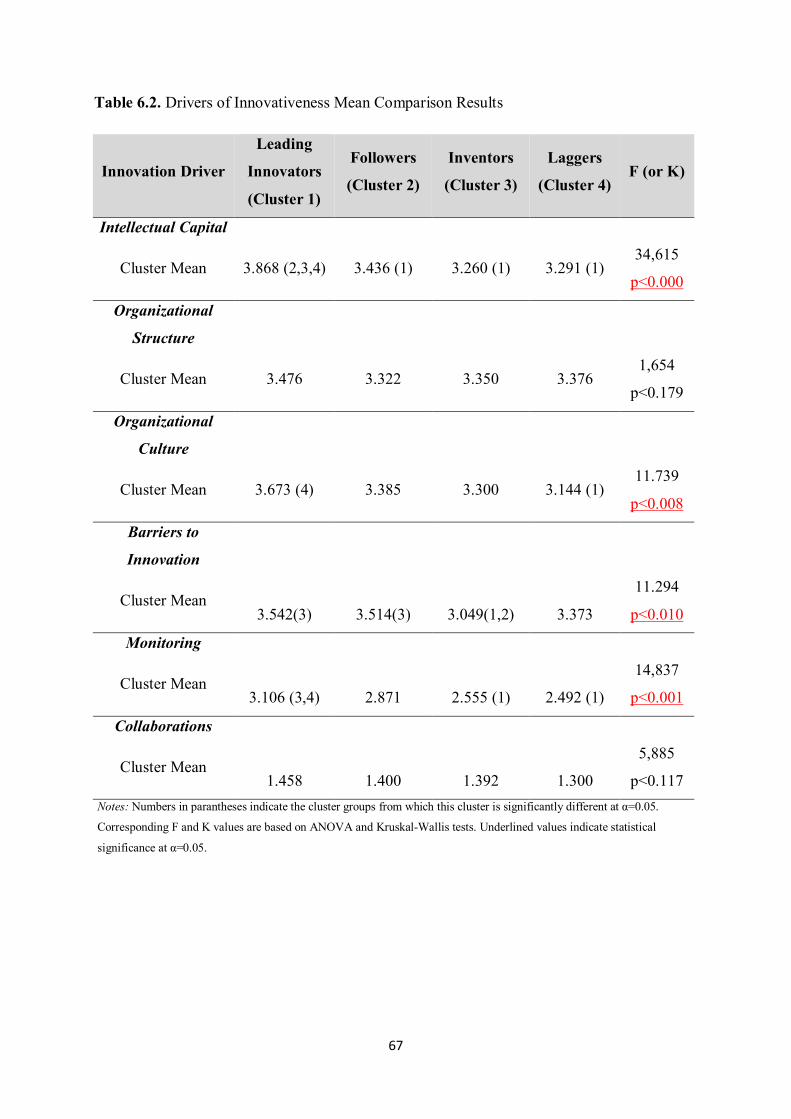
67
Table 6.2. Drivers of Innovativeness Mean Comparison Results
Innovation Driver
Leading
Innovators
(Cluster 1)
Followers
(Cluster 2)
Inventors
(Cluster 3)
Laggers
(Cluster 4) F (or K)
Intellectual Capital
Cluster Mean 3.868 (2,3,4) 3.436 (1) 3.260 (1) 3.291 (1) 34,615
p<0.000
Organizational
Structure
Cluster Mean 3.476 3.322 3.350 3.376 1,654
p<0.179
Organizational
Culture
Cluster Mean 3.673 (4) 3.385 3.300 3.144 (1) 11.739
p<0.008
Barriers to
Innovation
Cluster Mean 3.542(3) 3.514(3) 3.049(1,2) 3.373
11.294
p<0.010
Monitoring
Cluster Mean 3.106 (3,4) 2.871 2.555 (1) 2.492 (1)
14,837
p<0.001
Collaborations
Cluster Mean 1.458 1.400 1.392 1.300
5,885
p<0.117 Notes: Numbers in parantheses indicate the cluster groups from which this cluster is significantly different at α=0.05.
Corresponding F and K values are based on ANOVA and Kruskal-Wallis tests. Underlined values indicate statistical
significance at α=0.05.
68
Table 6.2 displays the variance testing results for each one of the six drivers proposed
in this study. It is observed that there is a statistically significant difference among the four
clusters in terms of their innovative capabilities on intellectual capital, organizational culture,
barriers to innovation and monitoring dimensions, and these values are p=0.000, p=0.008,
p=0.010, and p=0.001 respectively.. There exists no statistical significance in organizational
structure and collaborations drivers, as their significance values are p=0.179, and p=0.117
respectively. On a pairwise comparison, the leading innovators differ from the other three
clusters on a statistically significant level, suggesting that the leading innovators make a
difference in additional investments on the intellectual capital. Meanwhile, there also exists a
statistical difference between the leading innovators and the laggers on organizational culture.
Barriers to Innovation performance driver also suggests a pairwise difference between the
leading innovators, the followers and the inventors. On the other hand, monitoring driver
exhibits a difference suggesting that the leading innovators are overwhelmingly attaching
more importance to monitoring in-firm and out-firm resources of innovation compared to the
inventors and the laggers.
6.2.2 Intellectual Capital
The four components of intellectual capital, the human capital, social capital,
organizational capital and specialization as proposed in the integrated drivers of
innovativeness model were tested in terms of their normality for each cluster group, and the
significance results are tabulated in Table 6.3. The table also incorporates the type of variance
testing method to be applied under the Test column in accordance with the evaluation of p-
values explained in Chapter 6.2. The red and underlined p-values under Shapiro-Wilk
Significance column indicate a statistical significance while the regular fonts provide no
statistical significance.The table summarizes the p-values for normality tests conducted on
Intellectual Capital factor. As a result of the higher p-values, human and social capital were
comprehended to have normal distribution and parametric one-way ANOVA test was applied
for mean comparisons. Depending on the relatively lower p-values that are underlined for
Social Capital, Organizational Capital and Specialization factors, their distributions were
assumed to be non-normal. For this reason, non-parametric mean comparison test Kruskal-
Wallis was conducted on these three components, while the Human Capital component did
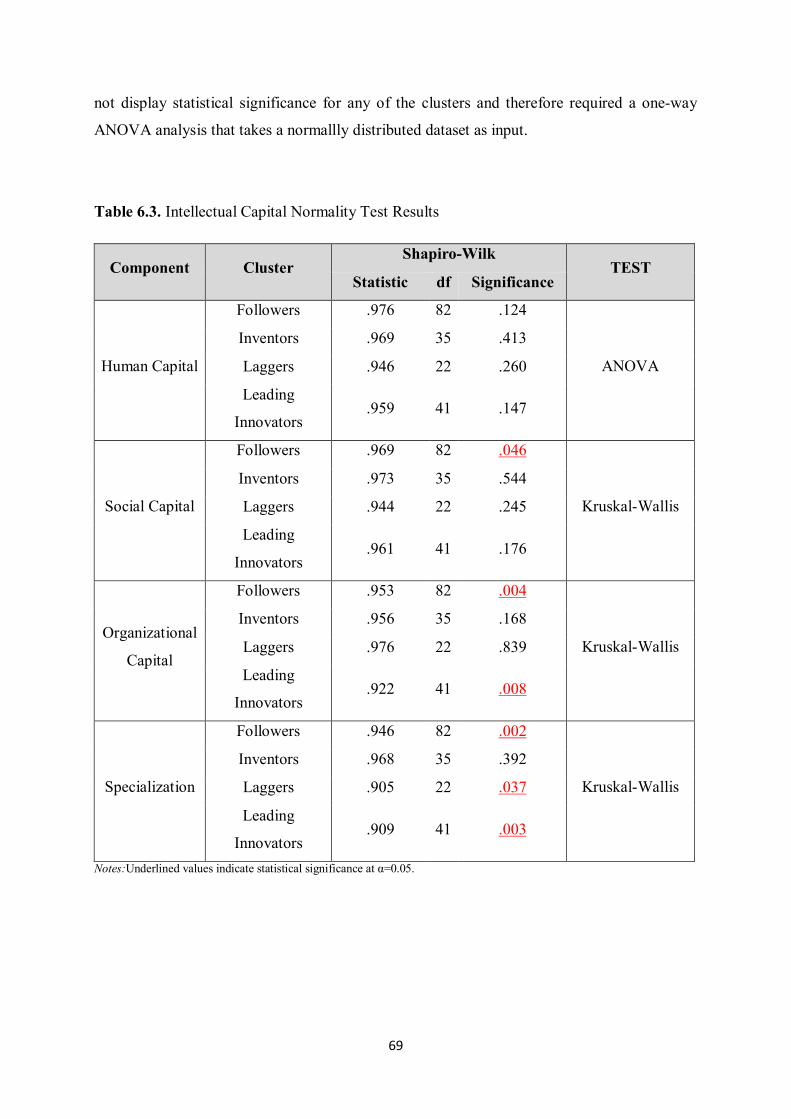
69
not display statistical significance for any of the clusters and therefore required a one-way
ANOVA analysis that takes a normallly distributed dataset as input.
Table 6.3. Intellectual Capital Normality Test Results
Component Cluster Shapiro-Wilk
TEST Statistic df Significance
Human Capital
Followers .976 82 .124
ANOVA
Inventors .969 35 .413
Laggers .946 22 .260
Leading
Innovators .959 41 .147
Social Capital
Followers .969 82 .046
Kruskal-Wallis
Inventors .973 35 .544
Laggers .944 22 .245
Leading
Innovators .961 41 .176
Organizational
Capital
Followers .953 82 .004
Kruskal-Wallis
Inventors .956 35 .168
Laggers .976 22 .839
Leading
Innovators .922 41 .008
Specialization
Followers .946 82 .002
Kruskal-Wallis
Inventors .968 35 .392
Laggers .905 22 .037
Leading
Innovators .909 41 .003
Notes:Underlined values indicate statistical significance at α=0.05.
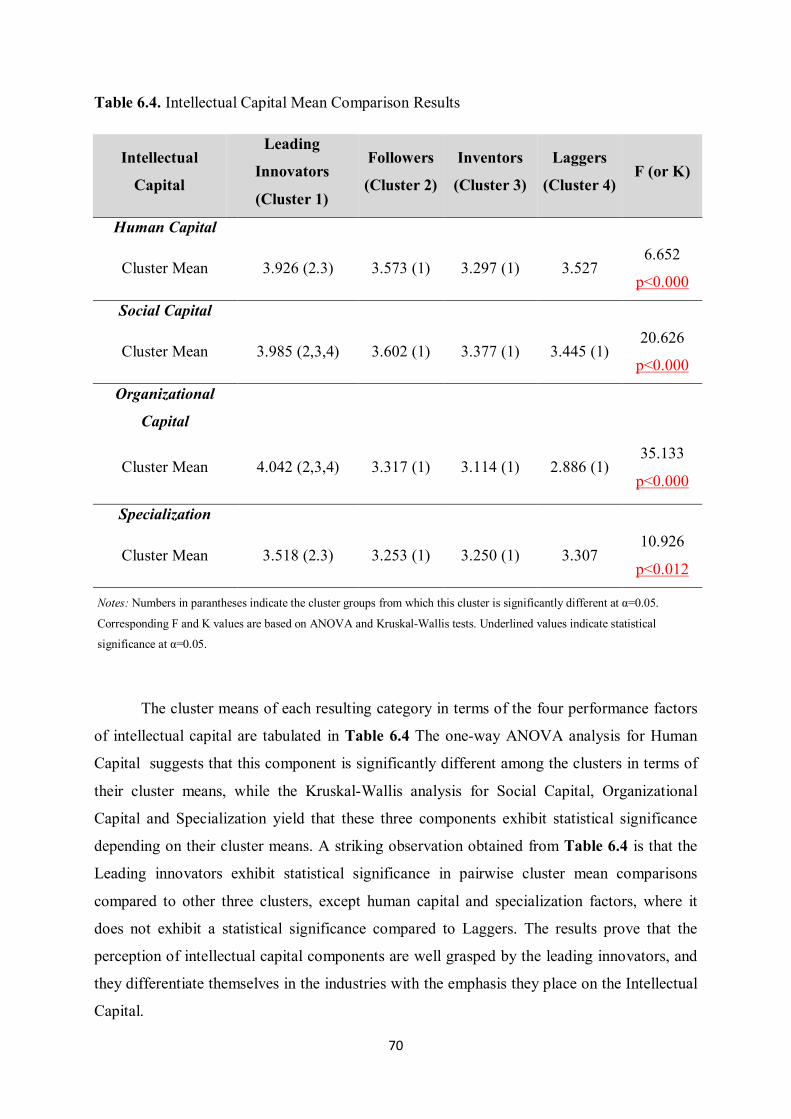
70
Table 6.4. Intellectual Capital Mean Comparison Results
Intellectual
Capital
Leading
Innovators
(Cluster 1)
Followers
(Cluster 2)
Inventors
(Cluster 3)
Laggers
(Cluster 4) F (or K)
Human Capital
Cluster Mean 3.926 (2.3) 3.573 (1) 3.297 (1) 3.527 6.652
p<0.000
Social Capital
Cluster Mean 3.985 (2,3,4) 3.602 (1) 3.377 (1) 3.445 (1) 20.626
p<0.000
Organizational
Capital
Cluster Mean 4.042 (2,3,4) 3.317 (1) 3.114 (1) 2.886 (1) 35.133
p<0.000
Specialization
Cluster Mean 3.518 (2.3) 3.253 (1) 3.250 (1) 3.307 10.926
p<0.012
Notes: Numbers in parantheses indicate the cluster groups from which this cluster is significantly different at α=0.05.
Corresponding F and K values are based on ANOVA and Kruskal-Wallis tests. Underlined values indicate statistical
significance at α=0.05.
The cluster means of each resulting category in terms of the four performance factors
of intellectual capital are tabulated in Table 6.4 The one-way ANOVA analysis for Human
Capital suggests that this component is significantly different among the clusters in terms of
their cluster means, while the Kruskal-Wallis analysis for Social Capital, Organizational
Capital and Specialization yield that these three components exhibit statistical significance
depending on their cluster means. A striking observation obtained from Table 6.4 is that the
Leading innovators exhibit statistical significance in pairwise cluster mean comparisons
compared to other three clusters, except human capital and specialization factors, where it
does not exhibit a statistical significance compared to Laggers. The results prove that the
perception of intellectual capital components are well grasped by the leading innovators, and
they differentiate themselves in the industries with the emphasis they place on the Intellectual
Capital.
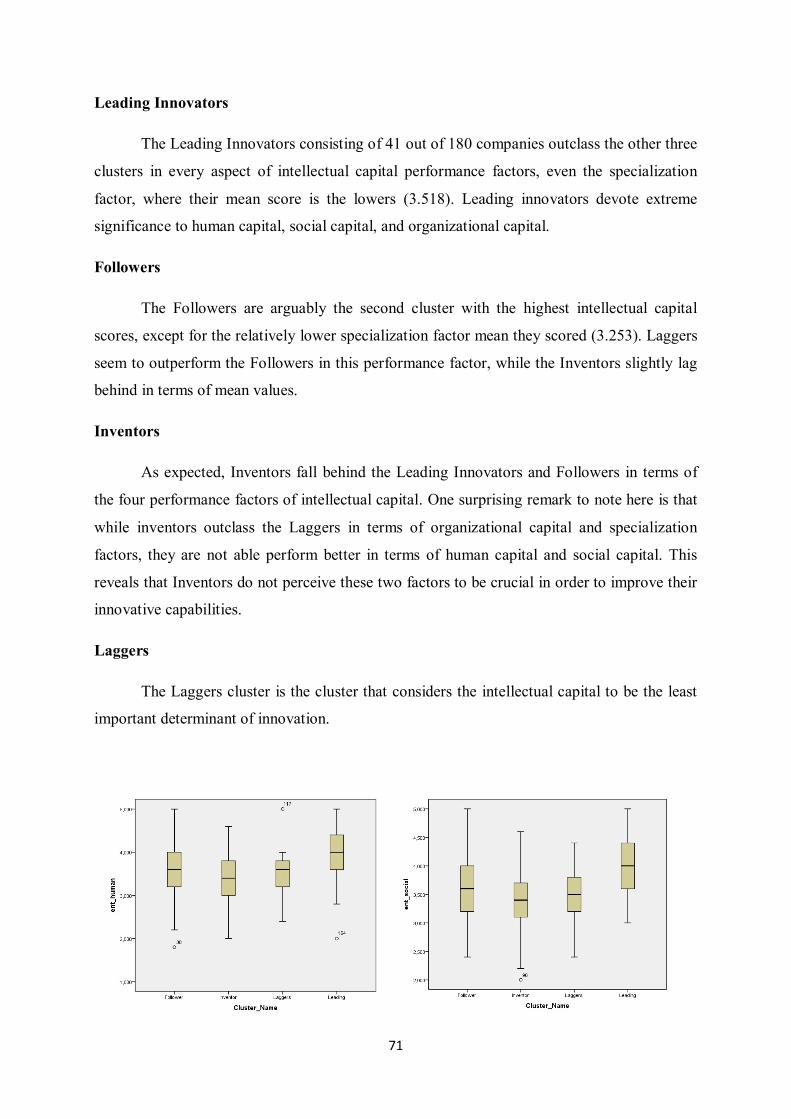
71
Leading Innovators
The Leading Innovators consisting of 41 out of 180 companies outclass the other three
clusters in every aspect of intellectual capital performance factors, even the specialization
factor, where their mean score is the lowers (3.518). Leading innovators devote extreme
significance to human capital, social capital, and organizational capital.
Followers
The Followers are arguably the second cluster with the highest intellectual capital
scores, except for the relatively lower specialization factor mean they scored (3.253). Laggers
seem to outperform the Followers in this performance factor, while the Inventors slightly lag
behind in terms of mean values.
Inventors
As expected, Inventors fall behind the Leading Innovators and Followers in terms of
the four performance factors of intellectual capital. One surprising remark to note here is that
while inventors outclass the Laggers in terms of organizational capital and specialization
factors, they are not able perform better in terms of human capital and social capital. This
reveals that Inventors do not perceive these two factors to be crucial in order to improve their
innovative capabilities.
Laggers
The Laggers cluster is the cluster that considers the intellectual capital to be the least
important determinant of innovation.
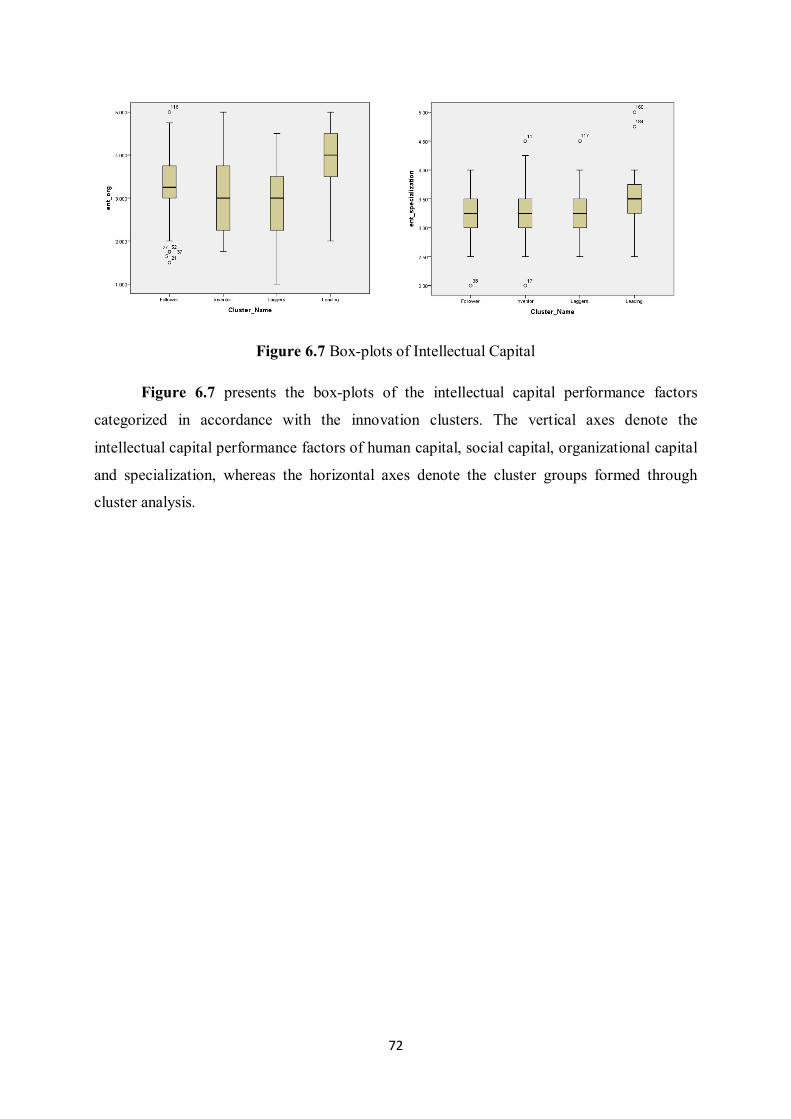
72
Figure 6.7 Box-plots of Intellectual Capital
Figure 6.7 presents the box-plots of the intellectual capital performance factors
categorized in accordance with the innovation clusters. The vertical axes denote the
intellectual capital performance factors of human capital, social capital, organizational capital
and specialization, whereas the horizontal axes denote the cluster groups formed through
cluster analysis.
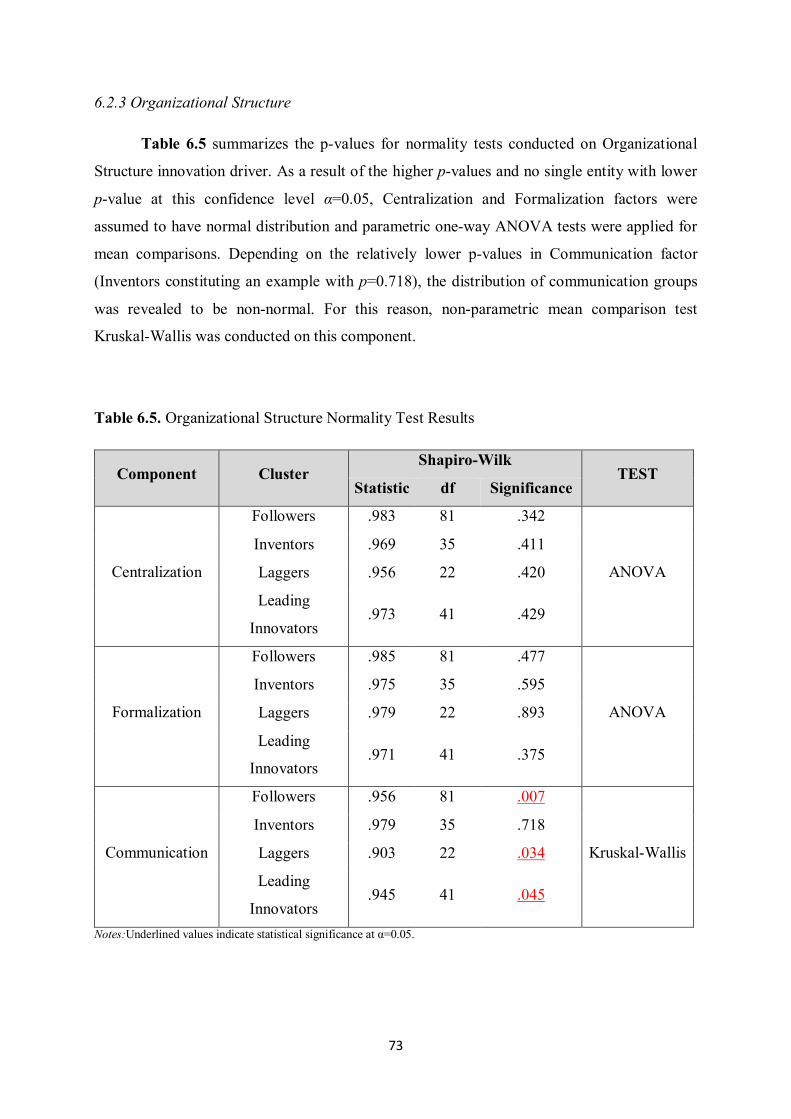
73
6.2.3 Organizational Structure
Table 6.5 summarizes the p-values for normality tests conducted on Organizational
Structure innovation driver. As a result of the higher p-values and no single entity with lower
p-value at this confidence level α=0.05, Centralization and Formalization factors were
assumed to have normal distribution and parametric one-way ANOVA tests were applied for
mean comparisons. Depending on the relatively lower p-values in Communication factor
(Inventors constituting an example with p=0.718), the distribution of communication groups
was revealed to be non-normal. For this reason, non-parametric mean comparison test
Kruskal-Wallis was conducted on this component.
Table 6.5. Organizational Structure Normality Test Results
Component Cluster Shapiro-Wilk
TEST Statistic df Significance
Centralization
Followers .983 81 .342
ANOVA
Inventors .969 35 .411
Laggers .956 22 .420
Leading
Innovators .973 41 .429
Formalization
Followers .985 81 .477
ANOVA
Inventors .975 35 .595
Laggers .979 22 .893
Leading
Innovators .971 41 .375
Communication
Followers .956 81 .007
Kruskal-Wallis
Inventors .979 35 .718
Laggers .903 22 .034
Leading
Innovators .945 41 .045
Notes:Underlined values indicate statistical significance at α=0.05.
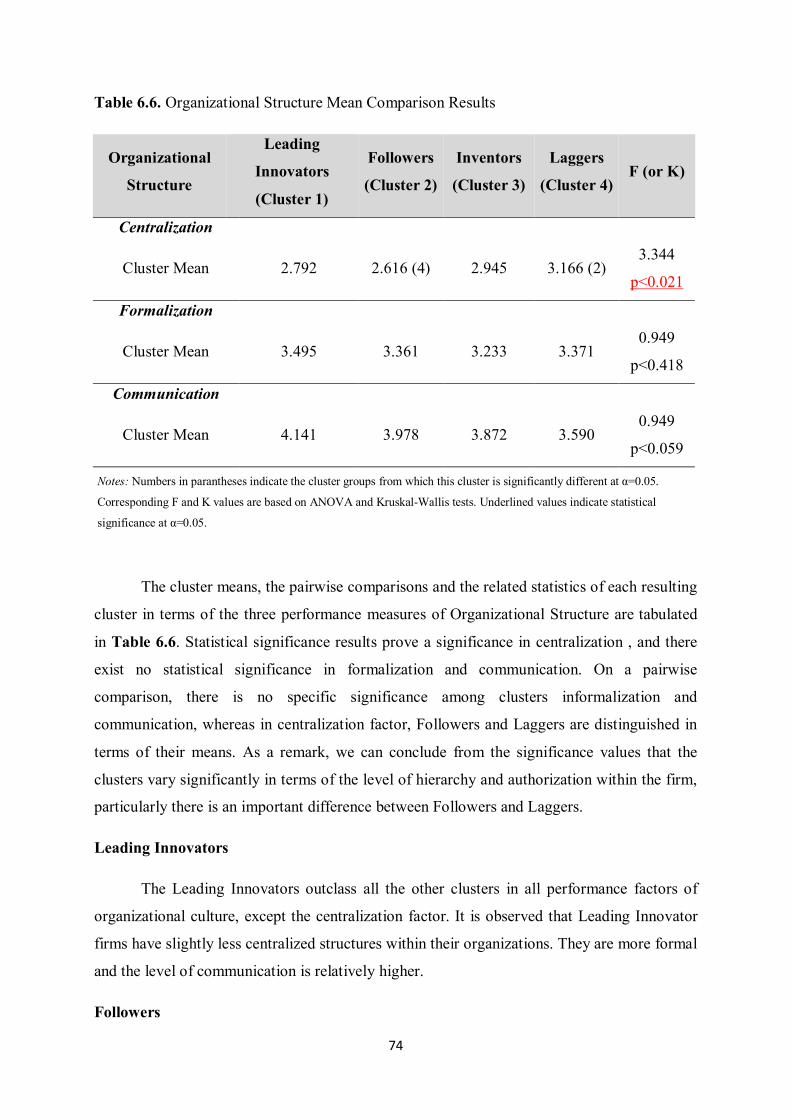
74
Table 6.6. Organizational Structure Mean Comparison Results
Organizational
Structure
Leading
Innovators
(Cluster 1)
Followers
(Cluster 2)
Inventors
(Cluster 3)
Laggers
(Cluster 4) F (or K)
Centralization
Cluster Mean 2.792 2.616 (4) 2.945 3.166 (2) 3.344
p<0.021
Formalization
Cluster Mean 3.495 3.361 3.233 3.371 0.949
p<0.418
Communication
Cluster Mean 4.141 3.978 3.872 3.590 0.949
p<0.059
Notes: Numbers in parantheses indicate the cluster groups from which this cluster is significantly different at α=0.05.
Corresponding F and K values are based on ANOVA and Kruskal-Wallis tests. Underlined values indicate statistical
significance at α=0.05.
The cluster means, the pairwise comparisons and the related statistics of each resulting
cluster in terms of the three performance measures of Organizational Structure are tabulated
in Table 6.6. Statistical significance results prove a significance in centralization , and there
exist no statistical significance in formalization and communication. On a pairwise
comparison, there is no specific significance among clusters informalization and
communication, whereas in centralization factor, Followers and Laggers are distinguished in
terms of their means. As a remark, we can conclude from the significance values that the
clusters vary significantly in terms of the level of hierarchy and authorization within the firm,
particularly there is an important difference between Followers and Laggers.
Leading Innovators
The Leading Innovators outclass all the other clusters in all performance factors of
organizational culture, except the centralization factor. It is observed that Leading Innovator
firms have slightly less centralized structures within their organizations. They are more formal
and the level of communication is relatively higher.
Followers
75
Follower firms are the least centralized firms (2.616), suggesting that these firms are
less hierarchical and less authority dependent, creating a less centralized environment for
innovation to emerge. Follower firms conduct more formal process based businesses
compared to inventors, but are less formal than the Leading Innovators and Laggers. In terms
of communication, Followers are more open to inter-department flow of information
compared to Leading Innovators, but are less open when compared with Inventors and
Laggers.
Inventors
Inventor firms are more centralized than Leading Innovators and Followers, but are
less centralized than Laggers. In terms of formalization, Inventors are the least formal cluster
(3.233) among the four clusters. This suggests that since Inventors are succesful as product
innovators, there is less bureucracy, more assisted guidance and more incentive taking in
these firms paving the way for creative ideas to proliferate.
Laggers
Lagger firms are the firms with least scores in communication (3.590), suggesting that
the flow of information both vertical and horizontal within the firms are relatively weaker
compared to the others. It is therefore understandable that these firms are lagging behind the
other three groups of firms in all types of innovation, when the communication among
employees is relatively low and the lack of interaction revealing itself as a weak point these
firms should consider improving.
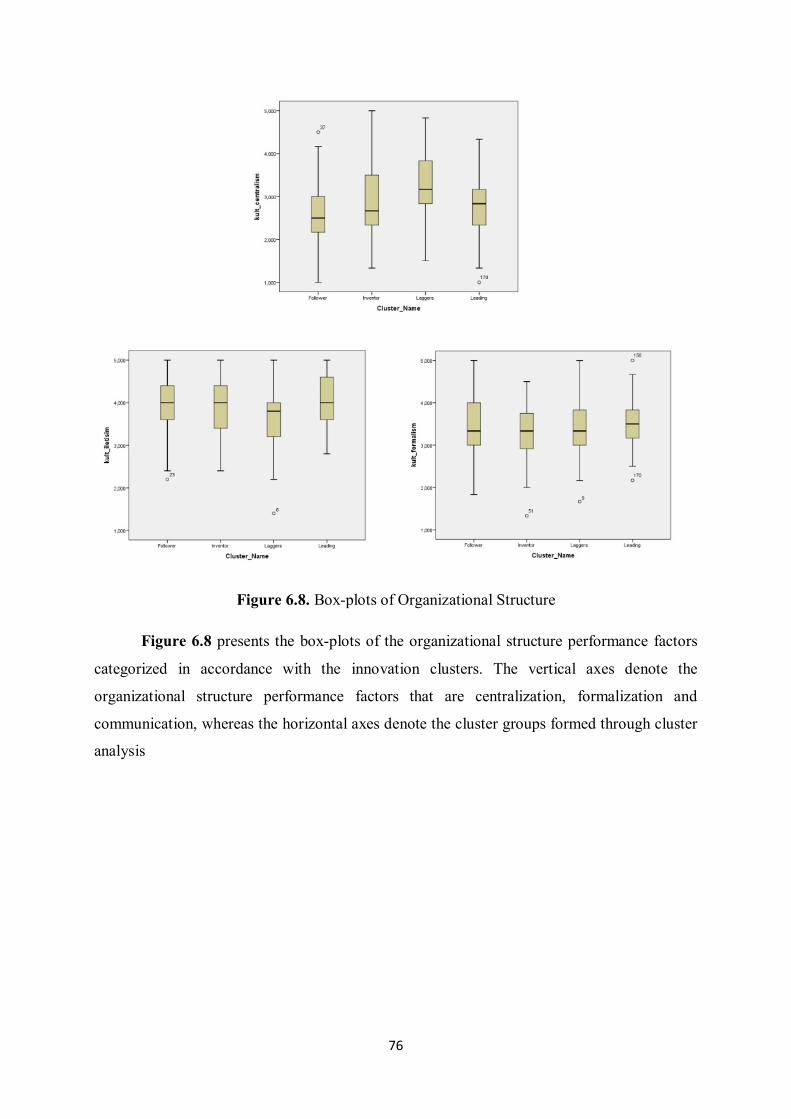
76
Figure 6.8. Box-plots of Organizational Structure
Figure 6.8 presents the box-plots of the organizational structure performance factors
categorized in accordance with the innovation clusters. The vertical axes denote the
organizational structure performance factors that are centralization, formalization and
communication, whereas the horizontal axes denote the cluster groups formed through cluster
analysis
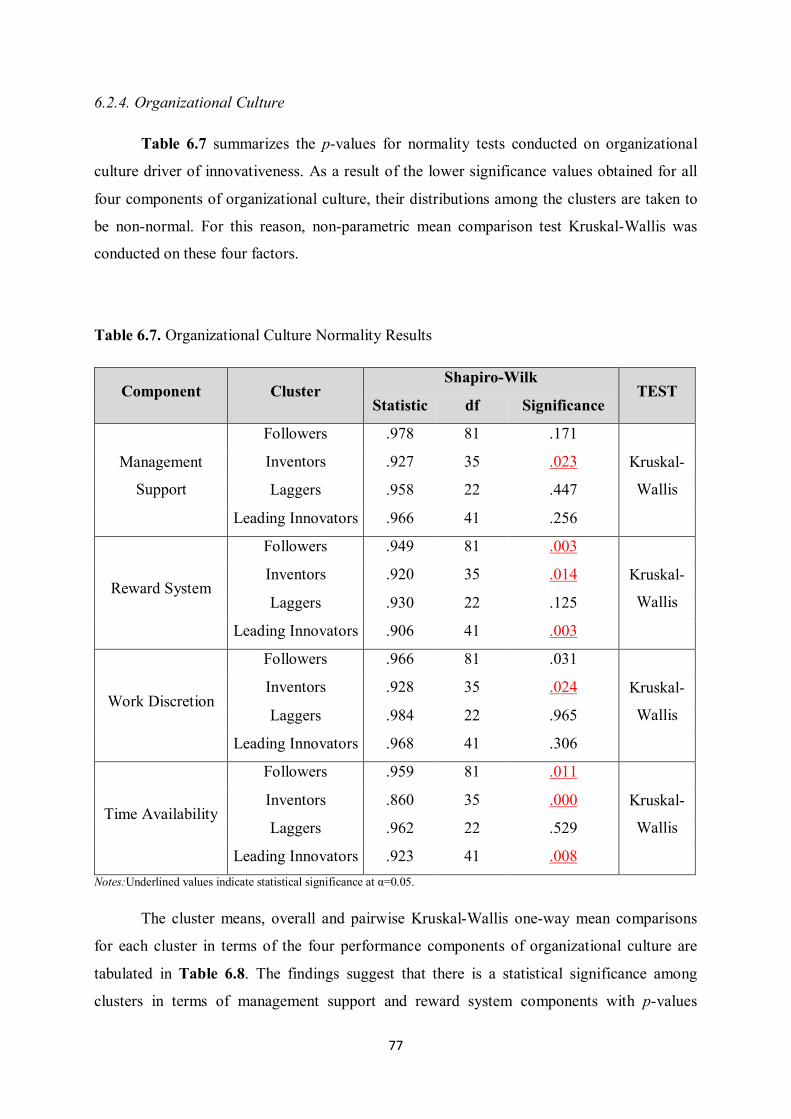
77
6.2.4. Organizational Culture
Table 6.7 summarizes the p-values for normality tests conducted on organizational
culture driver of innovativeness. As a result of the lower significance values obtained for all
four components of organizational culture, their distributions among the clusters are taken to
be non-normal. For this reason, non-parametric mean comparison test Kruskal-Wallis was
conducted on these four factors.
Table 6.7. Organizational Culture Normality Results
Component Cluster Shapiro-Wilk
TEST Statistic df Significance
Management
Support
Followers .978 81 .171
Kruskal-
Wallis
Inventors .927 35 .023
Laggers .958 22 .447
Leading Innovators .966 41 .256
Reward System
Followers .949 81 .003
Kruskal-
Wallis
Inventors .920 35 .014
Laggers .930 22 .125
Leading Innovators .906 41 .003
Work Discretion
Followers .966 81 .031
Kruskal-
Wallis
Inventors .928 35 .024
Laggers .984 22 .965
Leading Innovators .968 41 .306
Time Availability
Followers .959 81 .011
Kruskal-
Wallis
Inventors .860 35 .000
Laggers .962 22 .529
Leading Innovators .923 41 .008 Notes:Underlined values indicate statistical significance at α=0.05.
The cluster means, overall and pairwise Kruskal-Wallis one-way mean comparisons
for each cluster in terms of the four performance components of organizational culture are
tabulated in Table 6.8. The findings suggest that there is a statistical significance among
clusters in terms of management support and reward system components with p-values
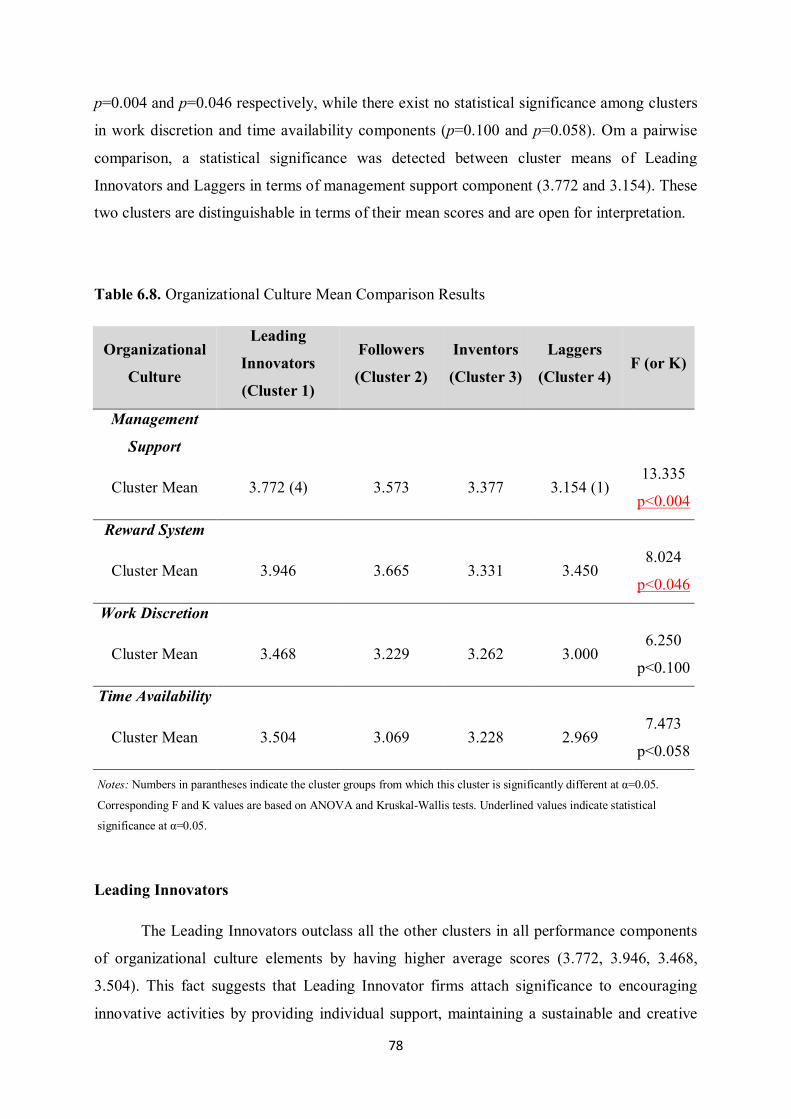
78
p=0.004 and p=0.046 respectively, while there exist no statistical significance among clusters
in work discretion and time availability components (p=0.100 and p=0.058). Om a pairwise
comparison, a statistical significance was detected between cluster means of Leading
Innovators and Laggers in terms of management support component (3.772 and 3.154). These
two clusters are distinguishable in terms of their mean scores and are open for interpretation.
Table 6.8. Organizational Culture Mean Comparison Results
Organizational
Culture
Leading
Innovators
(Cluster 1)
Followers
(Cluster 2)
Inventors
(Cluster 3)
Laggers
(Cluster 4) F (or K)
Management
Support
Cluster Mean 3.772 (4) 3.573 3.377 3.154 (1) 13.335
p<0.004
Reward System
Cluster Mean 3.946 3.665 3.331 3.450 8.024
p<0.046
Work Discretion
Cluster Mean 3.468 3.229 3.262 3.000 6.250
p<0.100
Time Availability
Cluster Mean 3.504 3.069 3.228 2.969 7.473
p<0.058
Notes: Numbers in parantheses indicate the cluster groups from which this cluster is significantly different at α=0.05.
Corresponding F and K values are based on ANOVA and Kruskal-Wallis tests. Underlined values indicate statistical
significance at α=0.05.
Leading Innovators
The Leading Innovators outclass all the other clusters in all performance components
of organizational culture elements by having higher average scores (3.772, 3.946, 3.468,
3.504). This fact suggests that Leading Innovator firms attach significance to encouraging
innovative activities by providing individual support, maintaining a sustainable and creative
79
environment, rewarding innovative success with incentives, allocating enough time for
employees to develop innovative ideas besides their workload and the authority and
responsibility to pursue the ideas that can lead to innovative benefits for the firm. As a result
of the pairwise statistical significance investigation, Leading Innovators outperform Laggers
in terms of management support component, suggesting that these firms are specifically better
at supporting their employees’ innovative endeavours compared to Laggers, the cluster that is
least innovative in all innovation types by OECD (2005).
Followers
The Followers are behind the Leading Innovators in management support and reward
system components, while they are performing slightly worse in work discretion and time
availability compared to Inventors. Followers denote more emphasis on supporting the
employees’ innovative activities and rewarding them highly, in comparison with granting
them the work discretion and time required to innovate.
Inventors
Inventors are more successful at providing work discretion and time availability to
their employees compared to the Followers. Even though the employees in Inventor firms
have less management support and less incentives to innovate, they are product innovators to
a great extend as a result of the work discretion and time availability provided to them to
innovate. This result suggests that in order to be product innovators, autonomy provision and
time allocation to employees should be more important for firms than the management
support or the highly rewarding incentive schemes.
Laggers
As expected, Laggers have the lowest scores in all components of organizational
culture, except the reward system (3.450). Similar to their name suggests, these firms lag
behind all other clusters, but are slightly better at incentivizing the innovative activities
compared to the inventors. Laggers also exhibit statistical significance in terms of its mean
value compared with the Leading Innovators for management support component (3.772 and
3.154). Employees in Lagger firms are extremely deprived of management support they need
to engage in innovative activities.
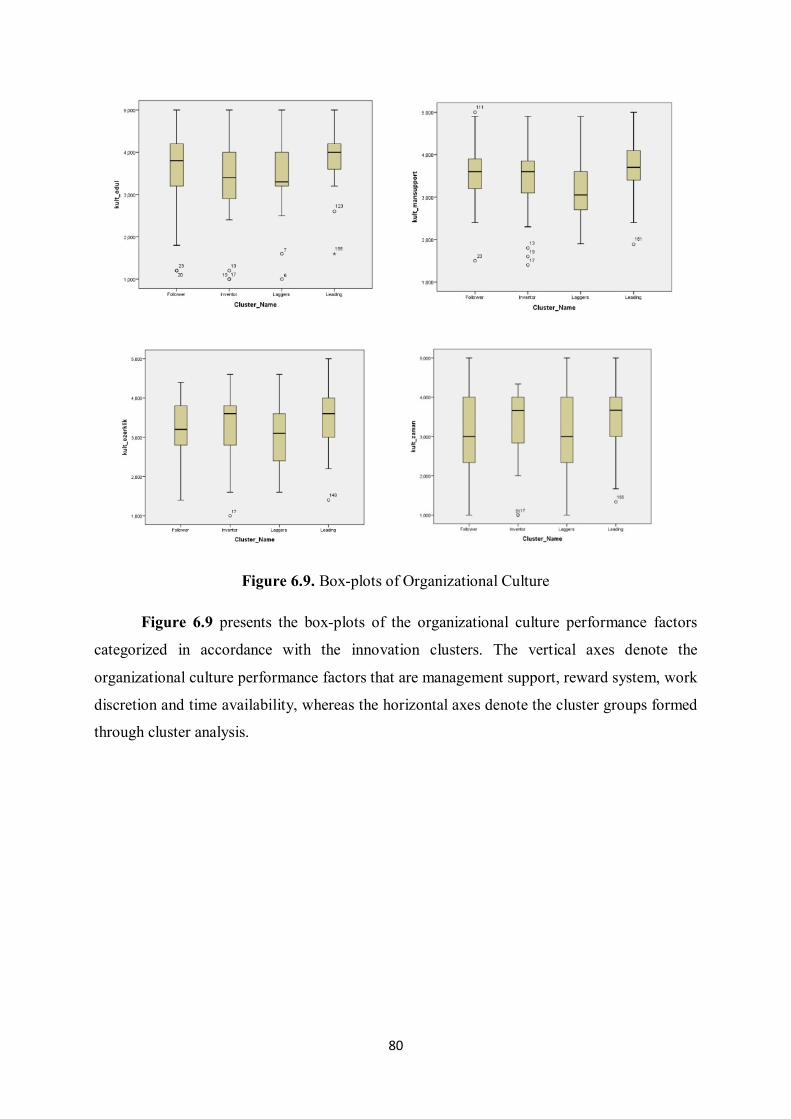
80
Figure 6.9. Box-plots of Organizational Culture
Figure 6.9 presents the box-plots of the organizational culture performance factors
categorized in accordance with the innovation clusters. The vertical axes denote the
organizational culture performance factors that are management support, reward system, work
discretion and time availability, whereas the horizontal axes denote the cluster groups formed
through cluster analysis.
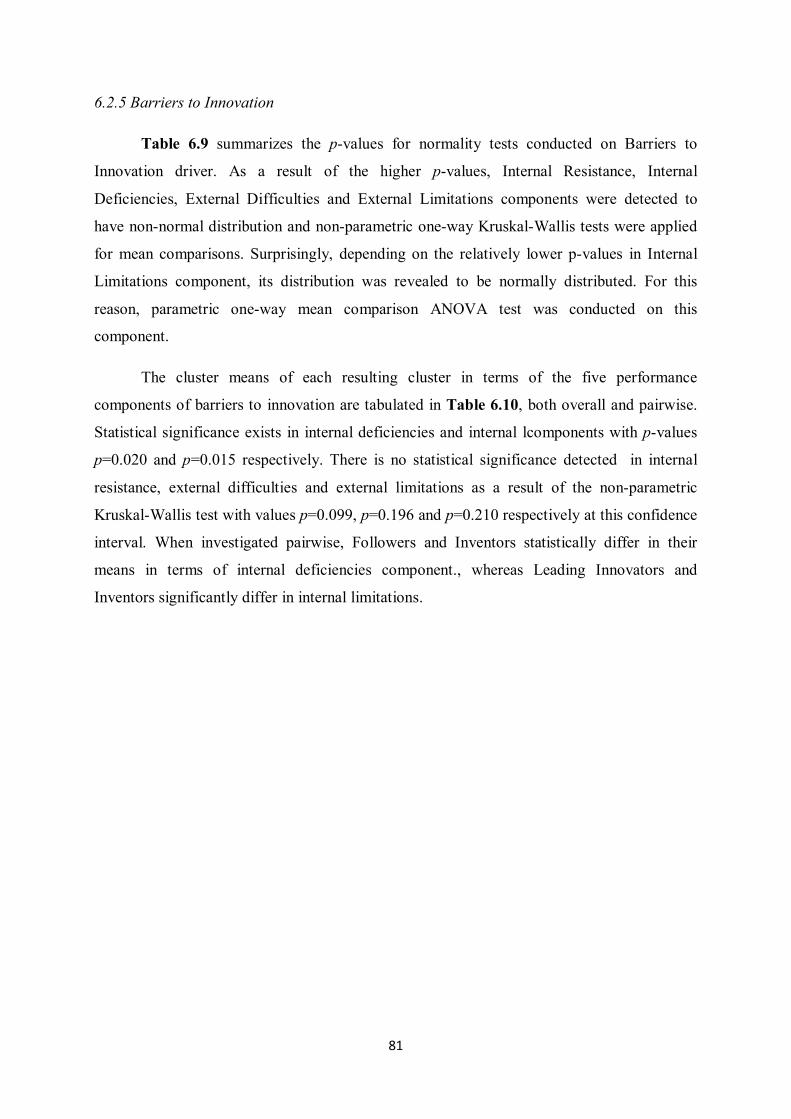
81
6.2.5 Barriers to Innovation
Table 6.9 summarizes the p-values for normality tests conducted on Barriers to
Innovation driver. As a result of the higher p-values, Internal Resistance, Internal
Deficiencies, External Difficulties and External Limitations components were detected to
have non-normal distribution and non-parametric one-way Kruskal-Wallis tests were applied
for mean comparisons. Surprisingly, depending on the relatively lower p-values in Internal
Limitations component, its distribution was revealed to be normally distributed. For this
reason, parametric one-way mean comparison ANOVA test was conducted on this
component.
The cluster means of each resulting cluster in terms of the five performance
components of barriers to innovation are tabulated in Table 6.10, both overall and pairwise.
Statistical significance exists in internal deficiencies and internal lcomponents with p-values
p=0.020 and p=0.015 respectively. There is no statistical significance detected in internal
resistance, external difficulties and external limitations as a result of the non-parametric
Kruskal-Wallis test with values p=0.099, p=0.196 and p=0.210 respectively at this confidence
interval. When investigated pairwise, Followers and Inventors statistically differ in their
means in terms of internal deficiencies component., whereas Leading Innovators and
Inventors significantly differ in internal limitations.
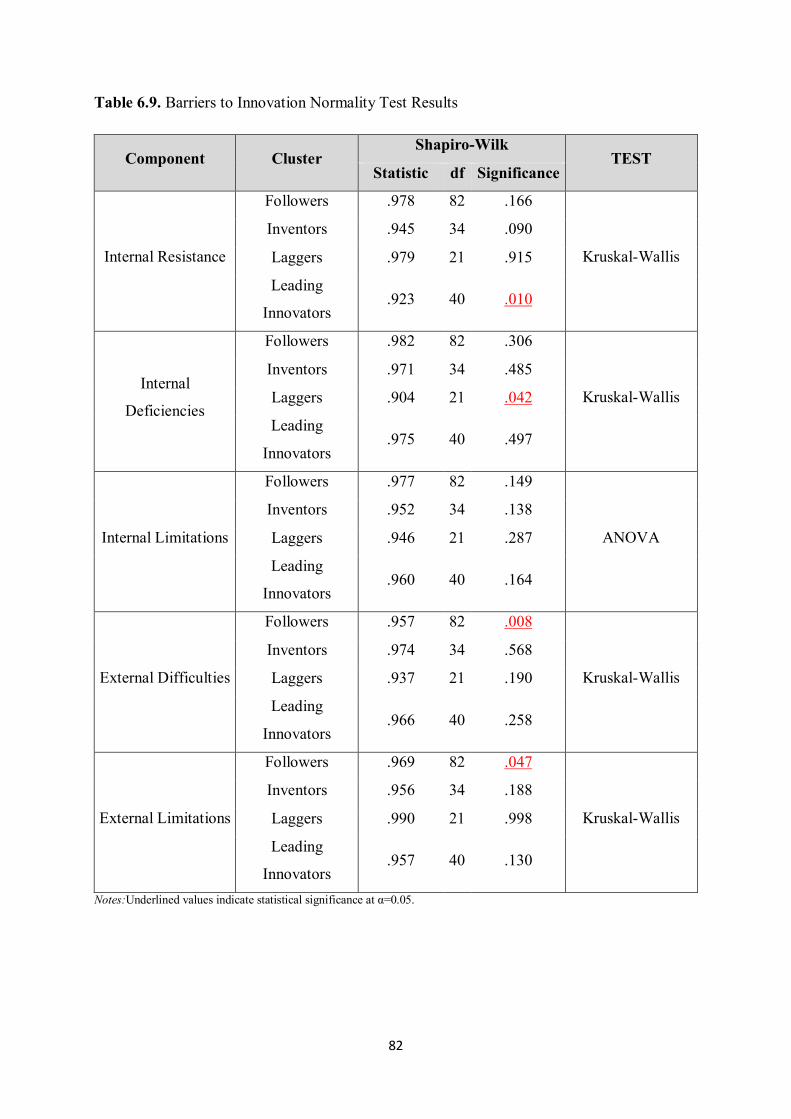
82
Table 6.9. Barriers to Innovation Normality Test Results
Component Cluster Shapiro-Wilk
TEST Statistic df Significance
Internal Resistance
Followers .978 82 .166
Kruskal-Wallis
Inventors .945 34 .090
Laggers .979 21 .915
Leading
Innovators .923 40 .010
Internal
Deficiencies
Followers .982 82 .306
Kruskal-Wallis
Inventors .971 34 .485
Laggers .904 21 .042
Leading
Innovators .975 40 .497
Internal Limitations
Followers .977 82 .149
ANOVA
Inventors .952 34 .138
Laggers .946 21 .287
Leading
Innovators .960 40 .164
External Difficulties
Followers .957 82 .008
Kruskal-Wallis
Inventors .974 34 .568
Laggers .937 21 .190
Leading
Innovators .966 40 .258
External Limitations
Followers .969 82 .047
Kruskal-Wallis
Inventors .956 34 .188
Laggers .990 21 .998
Leading
Innovators .957 40 .130
Notes:Underlined values indicate statistical significance at α=0.05.
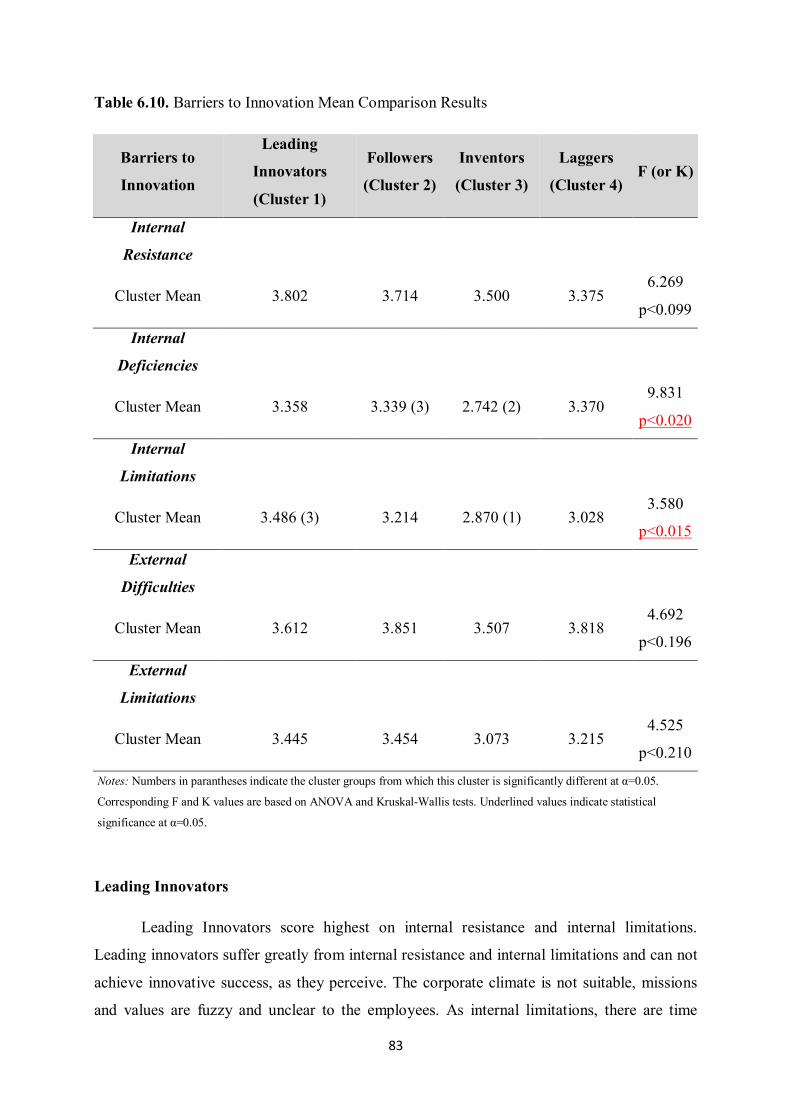
83
Table 6.10. Barriers to Innovation Mean Comparison Results
Barriers to
Innovation
Leading
Innovators
(Cluster 1)
Followers
(Cluster 2)
Inventors
(Cluster 3)
Laggers
(Cluster 4) F (or K)
Internal
Resistance
Cluster Mean 3.802 3.714 3.500 3.375 6.269
p<0.099
Internal
Deficiencies
Cluster Mean 3.358 3.339 (3) 2.742 (2) 3.370 9.831
p<0.020
Internal
Limitations
Cluster Mean 3.486 (3) 3.214 2.870 (1) 3.028 3.580
p<0.015
External
Difficulties
Cluster Mean 3.612 3.851 3.507 3.818 4.692
p<0.196
External
Limitations
Cluster Mean 3.445 3.454 3.073 3.215 4.525
p<0.210
Notes: Numbers in parantheses indicate the cluster groups from which this cluster is significantly different at α=0.05.
Corresponding F and K values are based on ANOVA and Kruskal-Wallis tests. Underlined values indicate statistical
significance at α=0.05.
Leading Innovators
Leading Innovators score highest on internal resistance and internal limitations.
Leading innovators suffer greatly from internal resistance and internal limitations and can not
achieve innovative success, as they perceive. The corporate climate is not suitable, missions
and values are fuzzy and unclear to the employees. As internal limitations, there are time
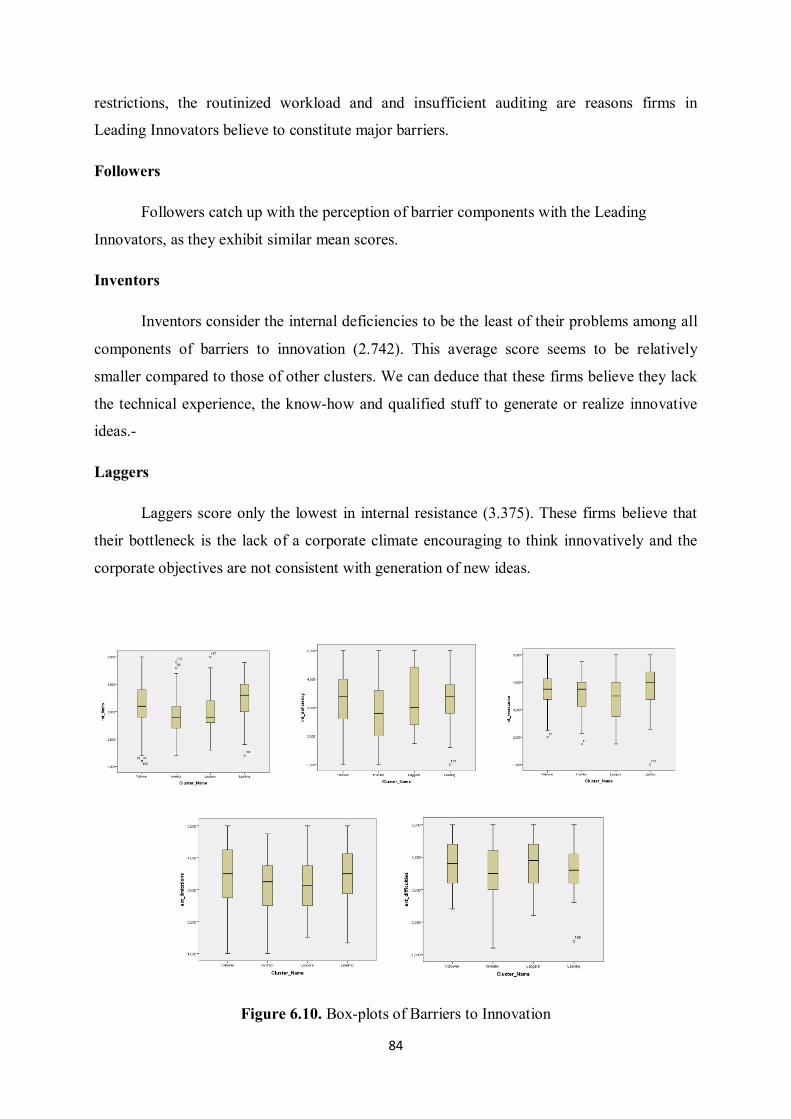
84
restrictions, the routinized workload and and insufficient auditing are reasons firms in
Leading Innovators believe to constitute major barriers.
Followers
Followers catch up with the perception of barrier components with the Leading
Innovators, as they exhibit similar mean scores.
Inventors
Inventors consider the internal deficiencies to be the least of their problems among all
components of barriers to innovation (2.742). This average score seems to be relatively
smaller compared to those of other clusters. We can deduce that these firms believe they lack
the technical experience, the know-how and qualified stuff to generate or realize innovative
ideas.-
Laggers
Laggers score only the lowest in internal resistance (3.375). These firms believe that
their bottleneck is the lack of a corporate climate encouraging to think innovatively and the
corporate objectives are not consistent with generation of new ideas.
Figure 6.10. Box-plots of Barriers to Innovation

85
Figure 6.10 presents the box-plots of the barriers to innovation performance
components categorized in accordance with the innovation clusters. The vertical axes denote
the barriers to innovation performance factors that are internal resistance, internal
deficiencies, internal limitations, external difficulties and external limitations, whereas the
horizontal axes denote the cluster groups formed through cluster analysis.
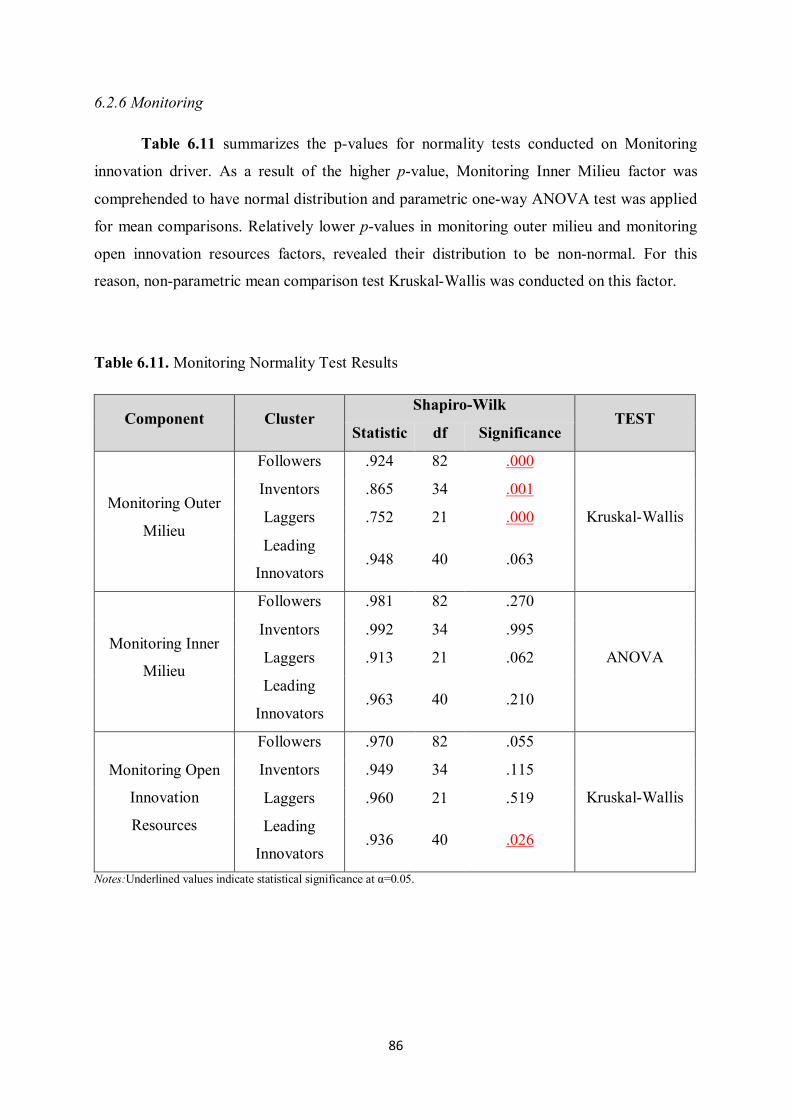
86
6.2.6 Monitoring
Table 6.11 summarizes the p-values for normality tests conducted on Monitoring
innovation driver. As a result of the higher p-value, Monitoring Inner Milieu factor was
comprehended to have normal distribution and parametric one-way ANOVA test was applied
for mean comparisons. Relatively lower p-values in monitoring outer milieu and monitoring
open innovation resources factors, revealed their distribution to be non-normal. For this
reason, non-parametric mean comparison test Kruskal-Wallis was conducted on this factor.
Table 6.11. Monitoring Normality Test Results
Component Cluster Shapiro-Wilk
TEST Statistic df Significance
Monitoring Outer
Milieu
Followers .924 82 .000
Kruskal-Wallis
Inventors .865 34 .001
Laggers .752 21 .000
Leading
Innovators .948 40 .063
Monitoring Inner
Milieu
Followers .981 82 .270
ANOVA
Inventors .992 34 .995
Laggers .913 21 .062
Leading
Innovators .963 40 .210
Monitoring Open
Innovation
Resources
Followers .970 82 .055
Kruskal-Wallis
Inventors .949 34 .115
Laggers .960 21 .519
Leading
Innovators .936 40 .026
Notes:Underlined values indicate statistical significance at α=0.05.
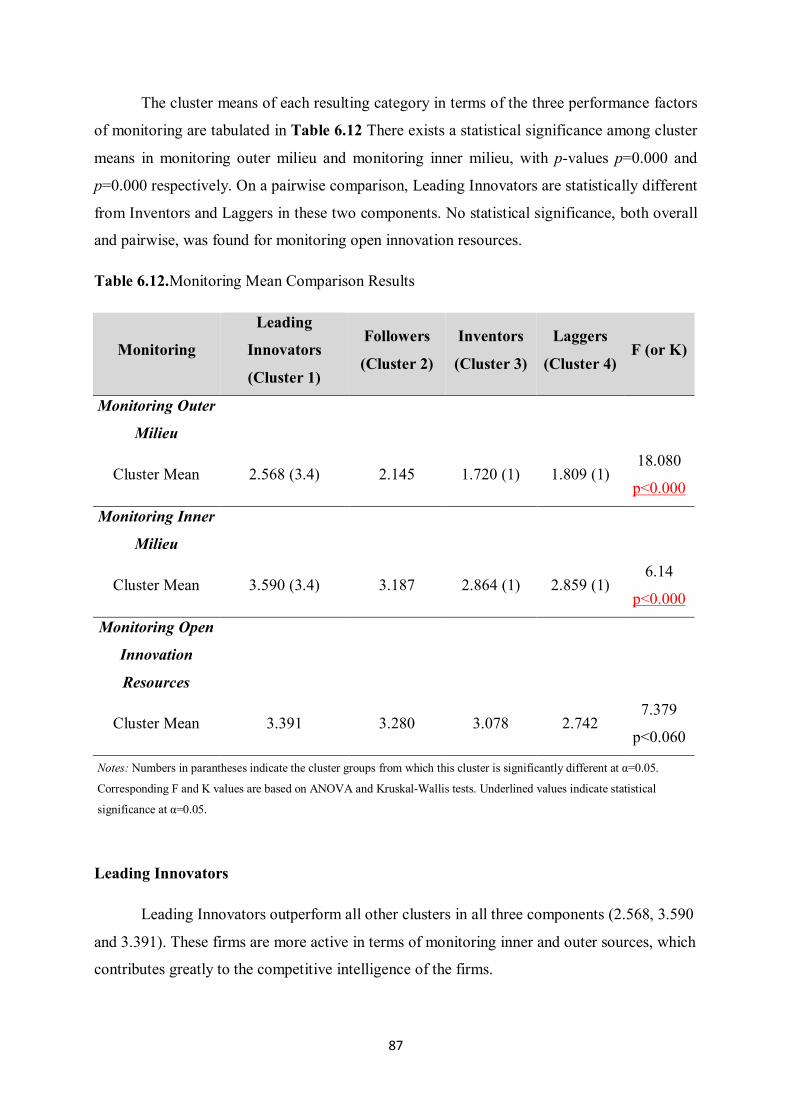
87
The cluster means of each resulting category in terms of the three performance factors
of monitoring are tabulated in Table 6.12 There exists a statistical significance among cluster
means in monitoring outer milieu and monitoring inner milieu, with p-values p=0.000 and
p=0.000 respectively. On a pairwise comparison, Leading Innovators are statistically different
from Inventors and Laggers in these two components. No statistical significance, both overall
and pairwise, was found for monitoring open innovation resources.
Table 6.12.Monitoring Mean Comparison Results
Monitoring
Leading
Innovators
(Cluster 1)
Followers
(Cluster 2)
Inventors
(Cluster 3)
Laggers
(Cluster 4) F (or K)
Monitoring Outer
Milieu
Cluster Mean 2.568 (3.4) 2.145 1.720 (1) 1.809 (1) 18.080
p<0.000
Monitoring Inner
Milieu
Cluster Mean 3.590 (3.4) 3.187 2.864 (1) 2.859 (1) 6.14
p<0.000
Monitoring Open
Innovation
Resources
Cluster Mean 3.391 3.280 3.078 2.742 7.379
p<0.060
Notes: Numbers in parantheses indicate the cluster groups from which this cluster is significantly different at α=0.05.
Corresponding F and K values are based on ANOVA and Kruskal-Wallis tests. Underlined values indicate statistical
significance at α=0.05.
Leading Innovators
Leading Innovators outperform all other clusters in all three components (2.568, 3.590
and 3.391). These firms are more active in terms of monitoring inner and outer sources, which
contributes greatly to the competitive intelligence of the firms.
88
Followers
Followers, as expected, rank the second in average scores behind the Leading
Innovators. These firms are also successful at constantly monitoring their own supply chain,
by continuous interaction with their customers, suppliers and vendors. They also excel at
monitoring outer resources and open resources to extract the know-how and keep up-to-date
with the recent trends.
Inventors
Inventors are better at monitoring inner milieu and the open innovation resources
compared to Laggers, but they are worse at monitoring the outer milieu with a slight
difference.
Laggers
Laggers are falling behind in every aspect of monitoring driver of innovativeness,
except they are better at monitoring the outer sources compared to their neighboring cluster
Inventors.
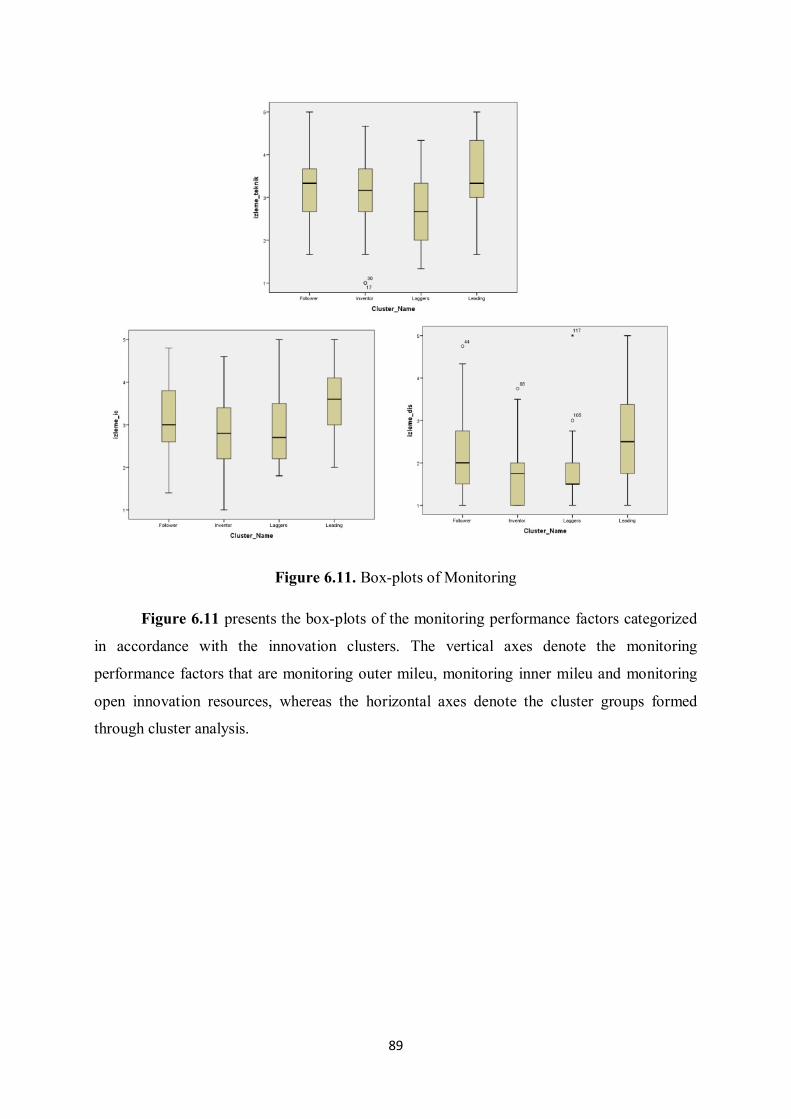
89
Figure 6.11. Box-plots of Monitoring
Figure 6.11 presents the box-plots of the monitoring performance factors categorized
in accordance with the innovation clusters. The vertical axes denote the monitoring
performance factors that are monitoring outer mileu, monitoring inner mileu and monitoring
open innovation resources, whereas the horizontal axes denote the cluster groups formed
through cluster analysis.
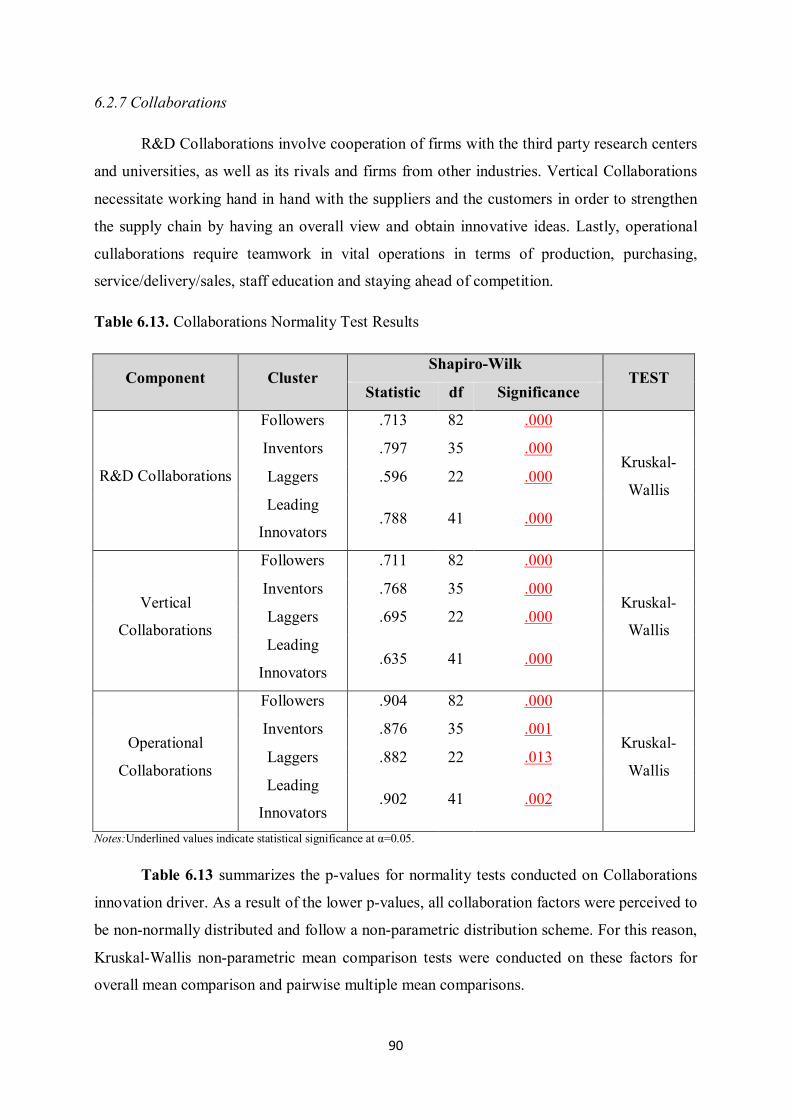
90
6.2.7 Collaborations
R&D Collaborations involve cooperation of firms with the third party research centers
and universities, as well as its rivals and firms from other industries. Vertical Collaborations
necessitate working hand in hand with the suppliers and the customers in order to strengthen
the supply chain by having an overall view and obtain innovative ideas. Lastly, operational
cullaborations require teamwork in vital operations in terms of production, purchasing,
service/delivery/sales, staff education and staying ahead of competition.
Table 6.13. Collaborations Normality Test Results
Component Cluster Shapiro-Wilk
TEST Statistic df Significance
R&D Collaborations
Followers .713 82 .000
Kruskal-
Wallis
Inventors .797 35 .000
Laggers .596 22 .000
Leading
Innovators .788 41 .000
Vertical
Collaborations
Followers .711 82 .000
Kruskal-
Wallis
Inventors .768 35 .000
Laggers .695 22 .000
Leading
Innovators .635 41 .000
Operational
Collaborations
Followers .904 82 .000
Kruskal-
Wallis
Inventors .876 35 .001
Laggers .882 22 .013
Leading
Innovators .902 41 .002
Notes:Underlined values indicate statistical significance at α=0.05.
Table 6.13 summarizes the p-values for normality tests conducted on Collaborations
innovation driver. As a result of the lower p-values, all collaboration factors were perceived to
be non-normally distributed and follow a non-parametric distribution scheme. For this reason,
Kruskal-Wallis non-parametric mean comparison tests were conducted on these factors for
overall mean comparison and pairwise multiple mean comparisons.
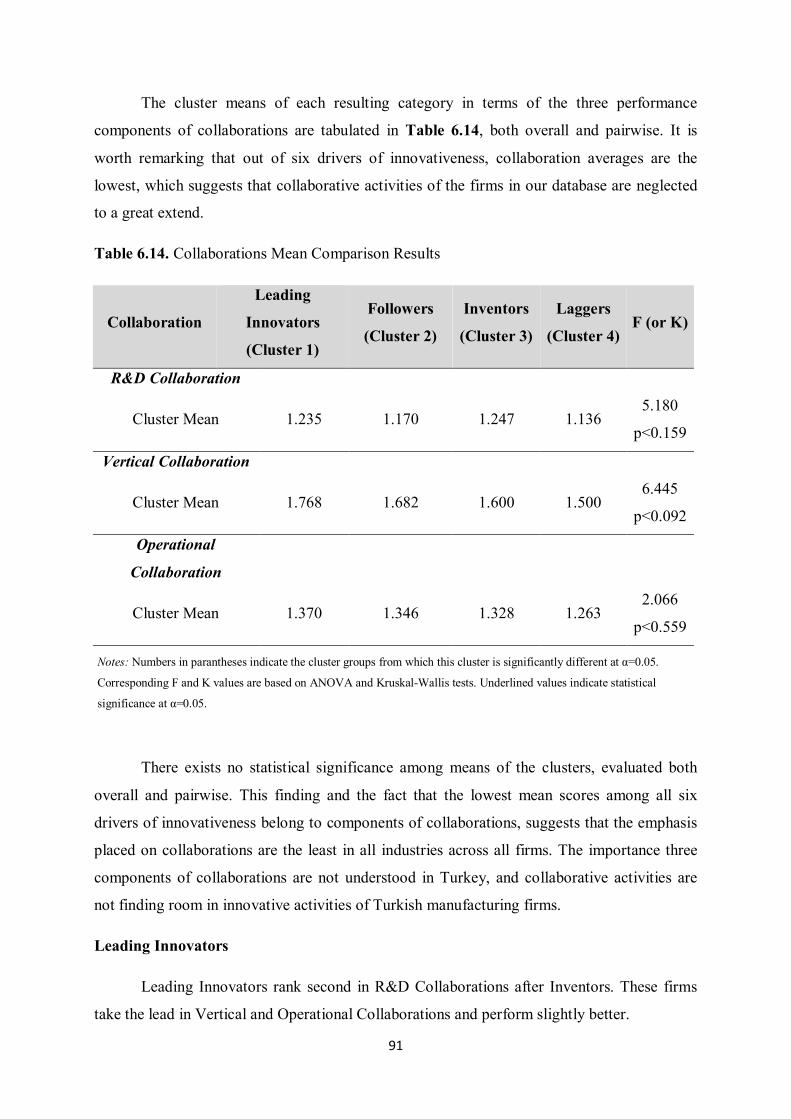
91
The cluster means of each resulting category in terms of the three performance
components of collaborations are tabulated in Table 6.14, both overall and pairwise. It is
worth remarking that out of six drivers of innovativeness, collaboration averages are the
lowest, which suggests that collaborative activities of the firms in our database are neglected
to a great extend.
Table 6.14. Collaborations Mean Comparison Results
Collaboration
Leading
Innovators
(Cluster 1)
Followers
(Cluster 2)
Inventors
(Cluster 3)
Laggers
(Cluster 4) F (or K)
R&D Collaboration
Cluster Mean 1.235 1.170 1.247 1.136 5.180
p<0.159
Vertical Collaboration
Cluster Mean 1.768 1.682 1.600 1.500 6.445
p<0.092
Operational
Collaboration
Cluster Mean 1.370 1.346 1.328 1.263 2.066
p<0.559
Notes: Numbers in parantheses indicate the cluster groups from which this cluster is significantly different at α=0.05.
Corresponding F and K values are based on ANOVA and Kruskal-Wallis tests. Underlined values indicate statistical
significance at α=0.05.
There exists no statistical significance among means of the clusters, evaluated both
overall and pairwise. This finding and the fact that the lowest mean scores among all six
drivers of innovativeness belong to components of collaborations, suggests that the emphasis
placed on collaborations are the least in all industries across all firms. The importance three
components of collaborations are not understood in Turkey, and collaborative activities are
not finding room in innovative activities of Turkish manufacturing firms.
Leading Innovators
Leading Innovators rank second in R&D Collaborations after Inventors. These firms
take the lead in Vertical and Operational Collaborations and perform slightly better.
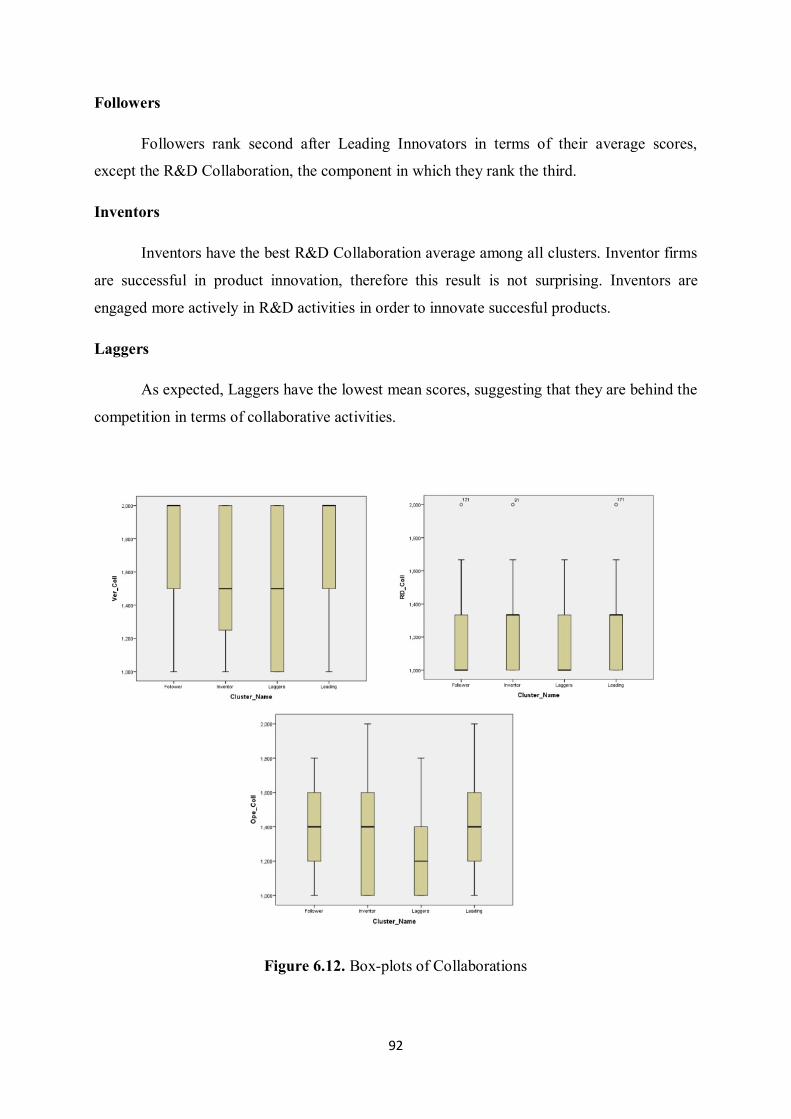
92
Followers
Followers rank second after Leading Innovators in terms of their average scores,
except the R&D Collaboration, the component in which they rank the third.
Inventors
Inventors have the best R&D Collaboration average among all clusters. Inventor firms
are successful in product innovation, therefore this result is not surprising. Inventors are
engaged more actively in R&D activities in order to innovate succesful products.
Laggers
As expected, Laggers have the lowest mean scores, suggesting that they are behind the
competition in terms of collaborative activities.
Figure 6.12. Box-plots of Collaborations
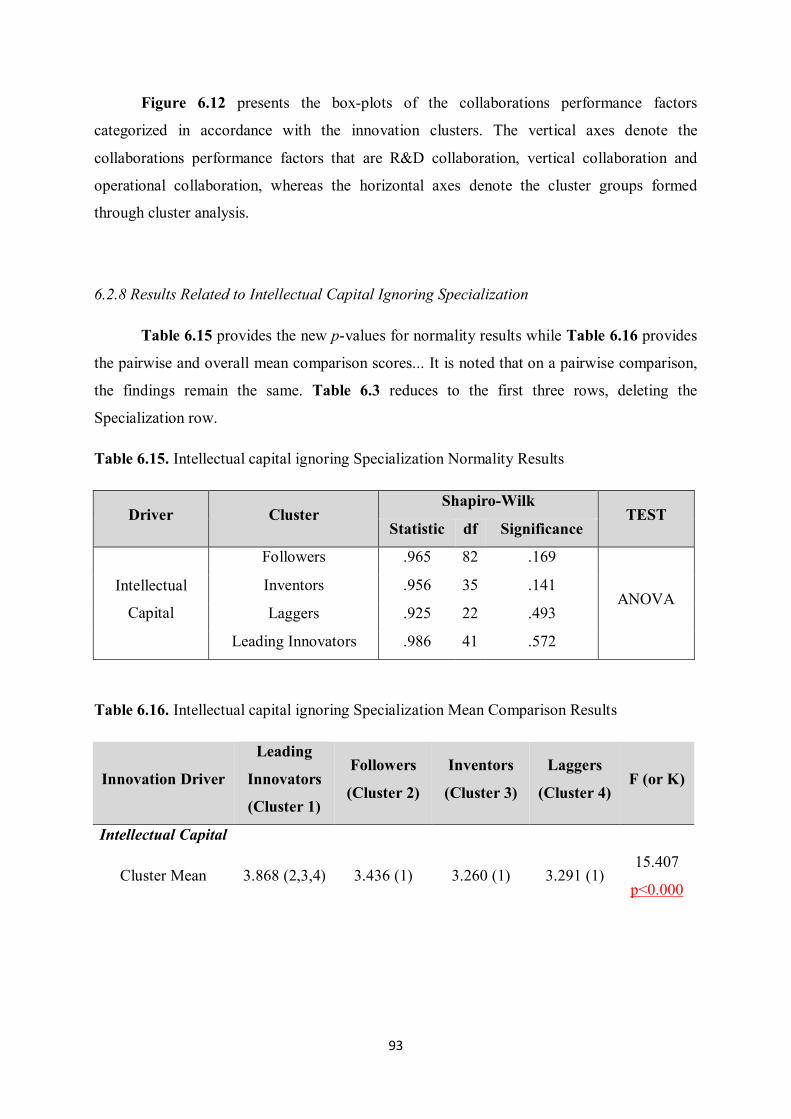
93
Figure 6.12 presents the box-plots of the collaborations performance factors
categorized in accordance with the innovation clusters. The vertical axes denote the
collaborations performance factors that are R&D collaboration, vertical collaboration and
operational collaboration, whereas the horizontal axes denote the cluster groups formed
through cluster analysis.
6.2.8 Results Related to Intellectual Capital Ignoring Specialization
Table 6.15 provides the new p-values for normality results while Table 6.16 provides
the pairwise and overall mean comparison scores... It is noted that on a pairwise comparison,
the findings remain the same. Table 6.3 reduces to the first three rows, deleting the
Specialization row.
Table 6.15. Intellectual capital ignoring Specialization Normality Results
Driver Cluster Shapiro-Wilk
TEST Statistic df Significance
Intellectual
Capital
Followers .965 82 .169
ANOVA Inventors .956 35 .141
Laggers .925 22 .493
Leading Innovators .986 41 .572
Table 6.16. Intellectual capital ignoring Specialization Mean Comparison Results
Innovation Driver
Leading
Innovators
(Cluster 1)
Followers
(Cluster 2)
Inventors
(Cluster 3)
Laggers
(Cluster 4) F (or K)
Intellectual Capital
Cluster Mean 3.868 (2,3,4) 3.436 (1) 3.260 (1) 3.291 (1) 15.407
p<0.000
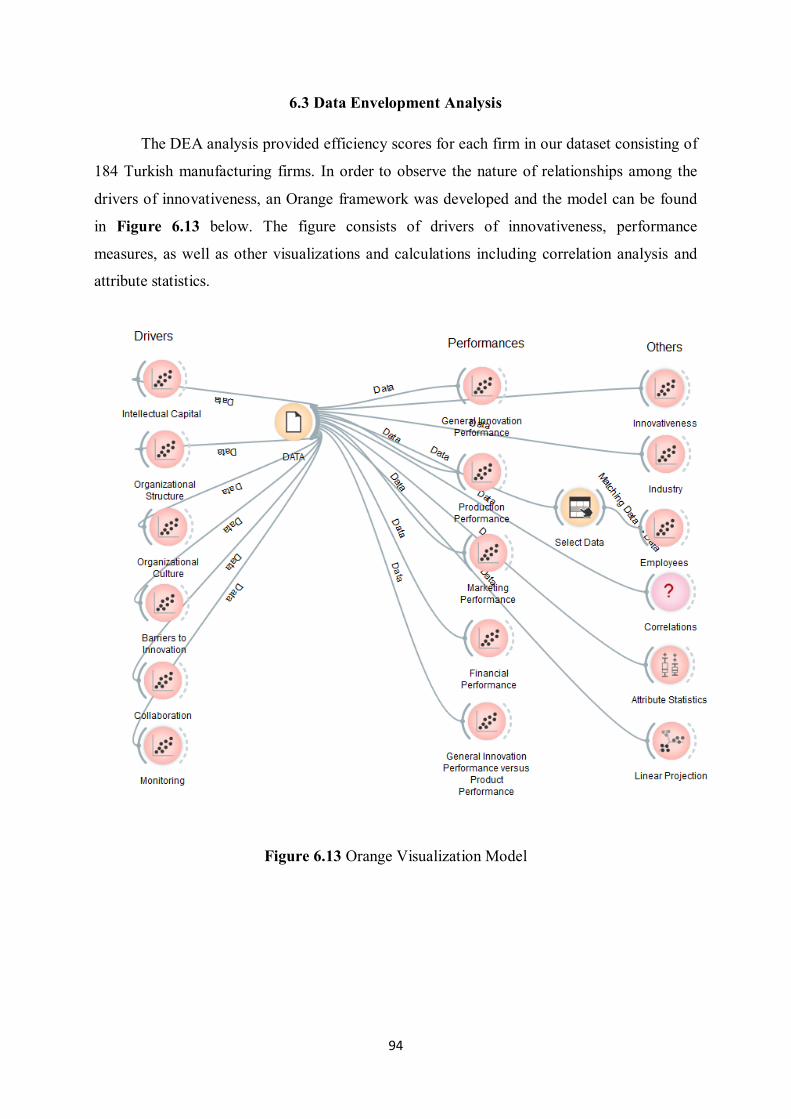
94
6.3 Data Envelopment Analysis
The DEA analysis provided efficiency scores for each firm in our dataset consisting of
184 Turkish manufacturing firms. In order to observe the nature of relationships among the
drivers of innovativeness, an Orange framework was developed and the model can be found
in Figure 6.13 below. The figure consists of drivers of innovativeness, performance
measures, as well as other visualizations and calculations including correlation analysis and
attribute statistics.
Figure 6.13 Orange Visualization Model
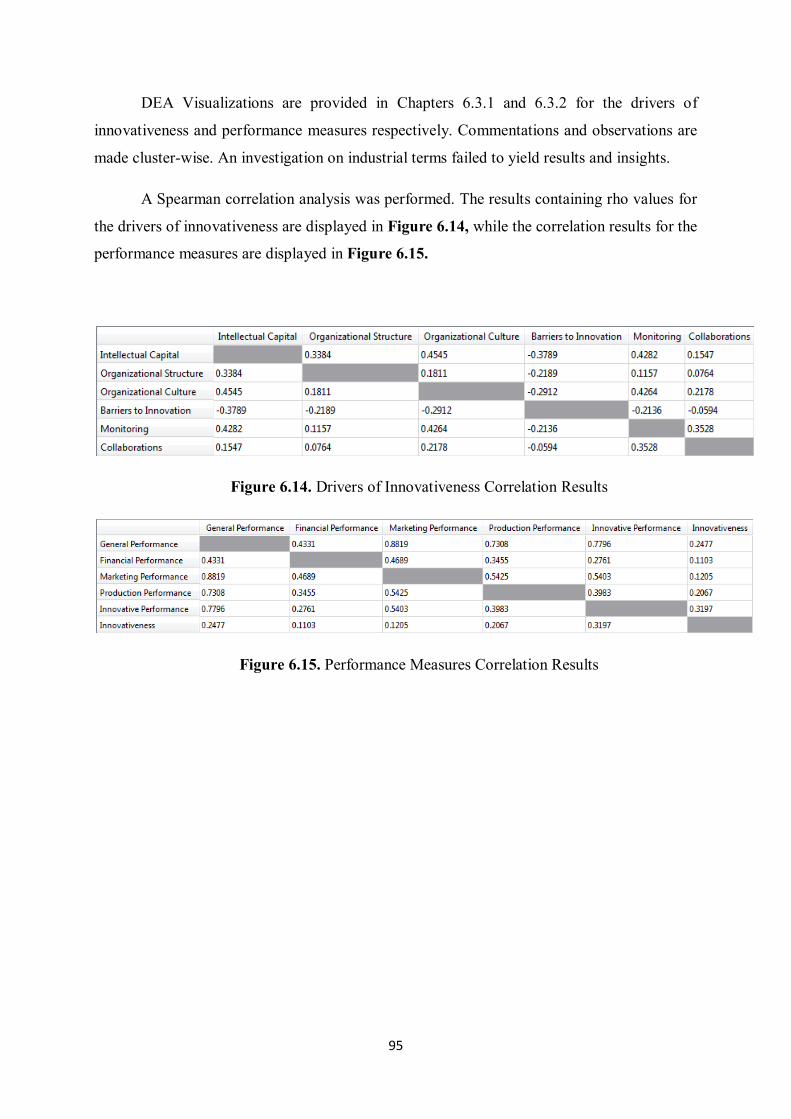
95
DEA Visualizations are provided in Chapters 6.3.1 and 6.3.2 for the drivers of
innovativeness and performance measures respectively. Commentations and observations are
made cluster-wise. An investigation on industrial terms failed to yield results and insights.
A Spearman correlation analysis was performed. The results containing rho values for
the drivers of innovativeness are displayed in Figure 6.14, while the correlation results for the
performance measures are displayed in Figure 6.15.
Figure 6.14. Drivers of Innovativeness Correlation Results
Figure 6.15. Performance Measures Correlation Results
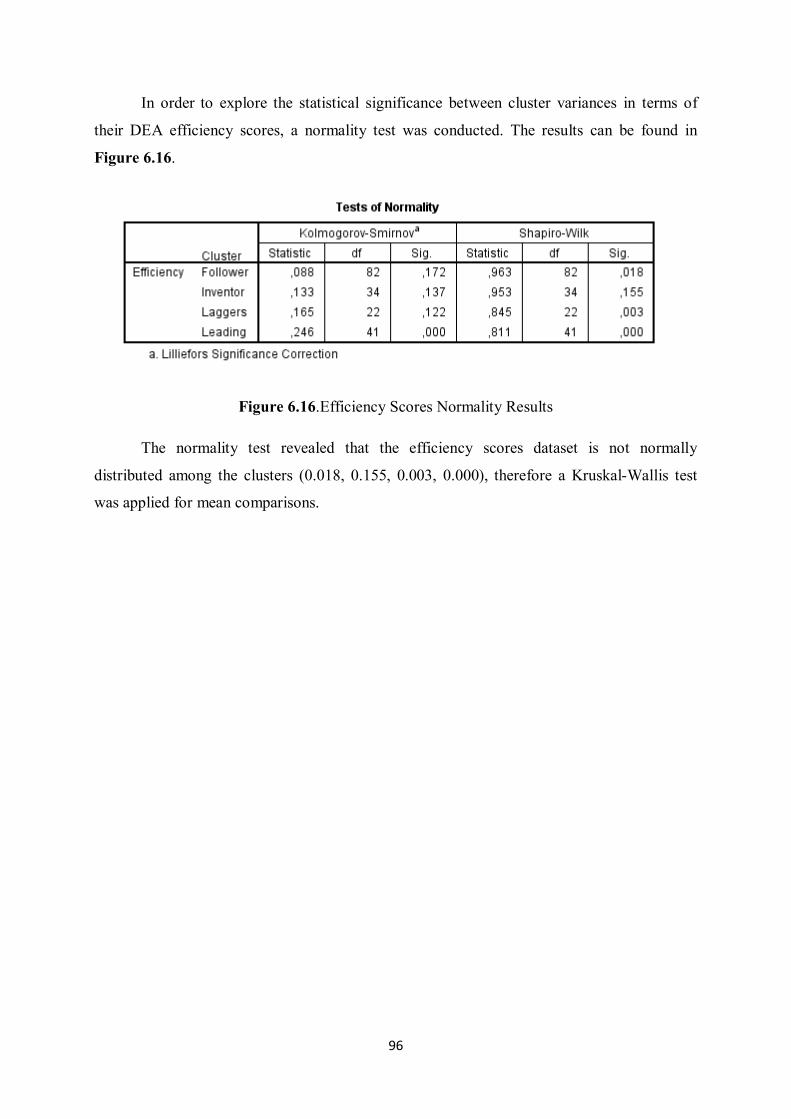
96
In order to explore the statistical significance between cluster variances in terms of
their DEA efficiency scores, a normality test was conducted. The results can be found in
Figure 6.16.
Figure 6.16.Efficiency Scores Normality Results
The normality test revealed that the efficiency scores dataset is not normally
distributed among the clusters (0.018, 0.155, 0.003, 0.000), therefore a Kruskal-Wallis test
was applied for mean comparisons.
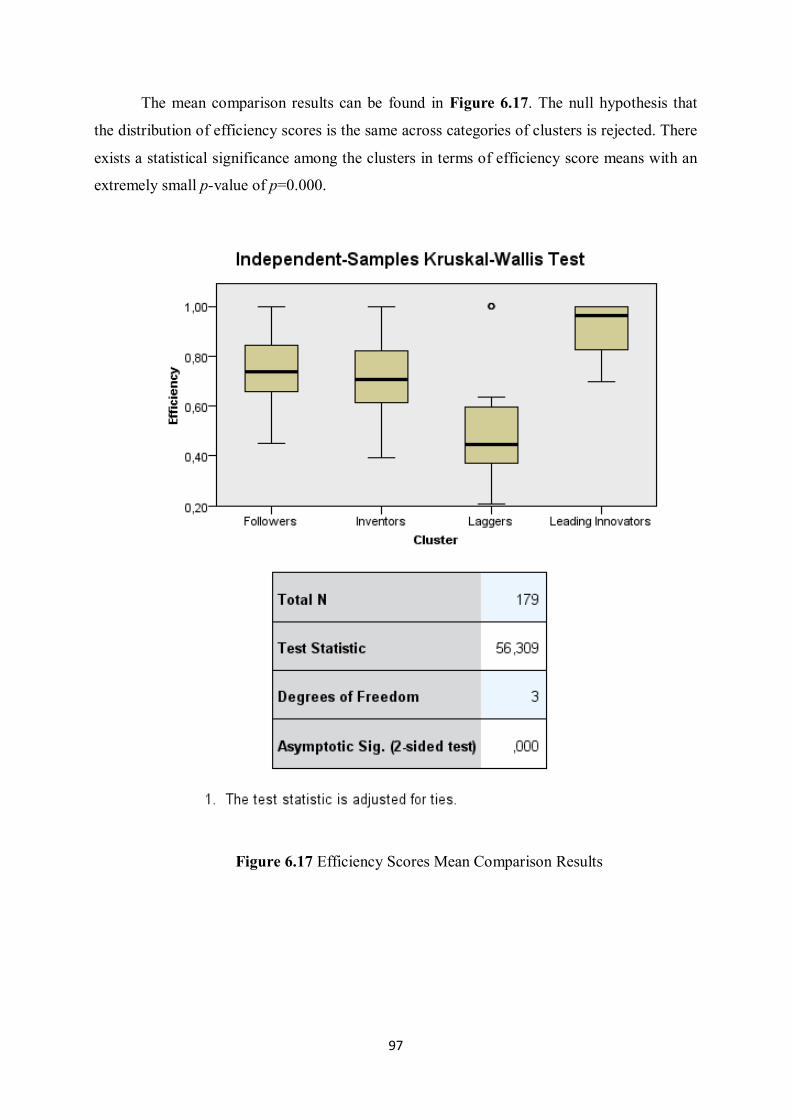
97
The mean comparison results can be found in Figure 6.17. The null hypothesis that
the distribution of efficiency scores is the same across categories of clusters is rejected. There
exists a statistical significance among the clusters in terms of efficiency score means with an
extremely small p-value of p=0.000.
Figure 6.17 Efficiency Scores Mean Comparison Results
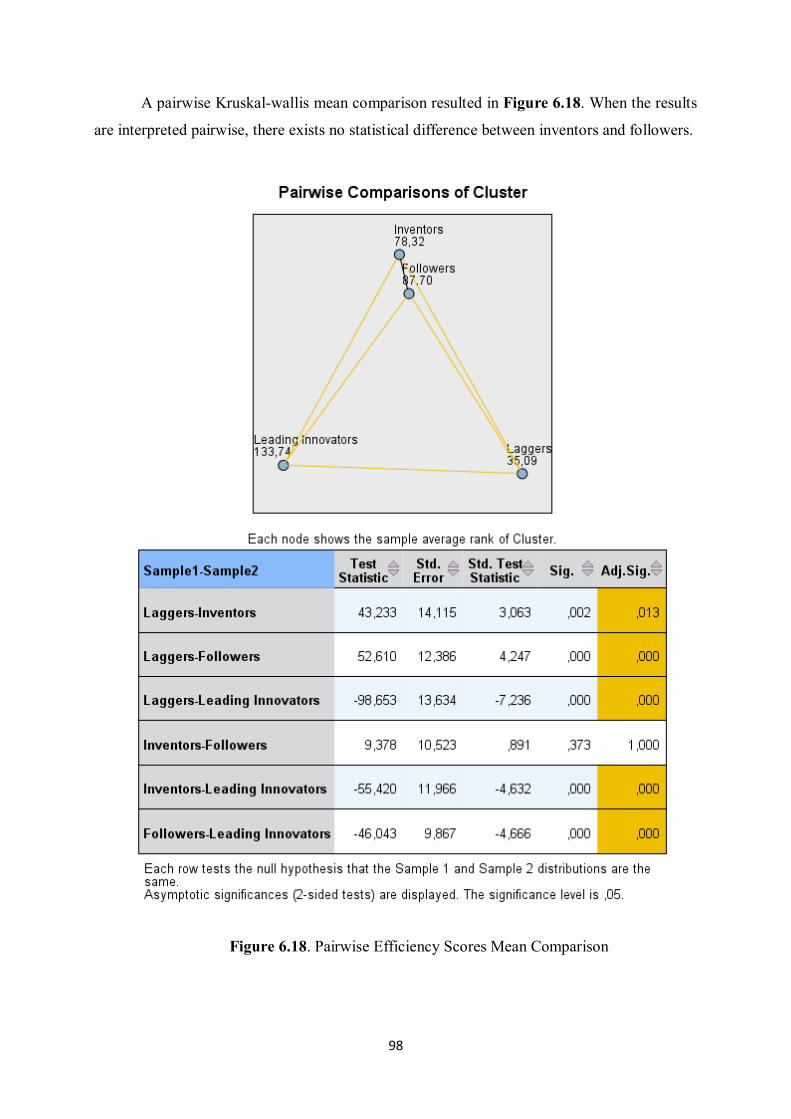
98
A pairwise Kruskal-wallis mean comparison resulted in Figure 6.18. When the results
are interpreted pairwise, there exists no statistical difference between inventors and followers.
Figure 6.18. Pairwise Efficiency Scores Mean Comparison
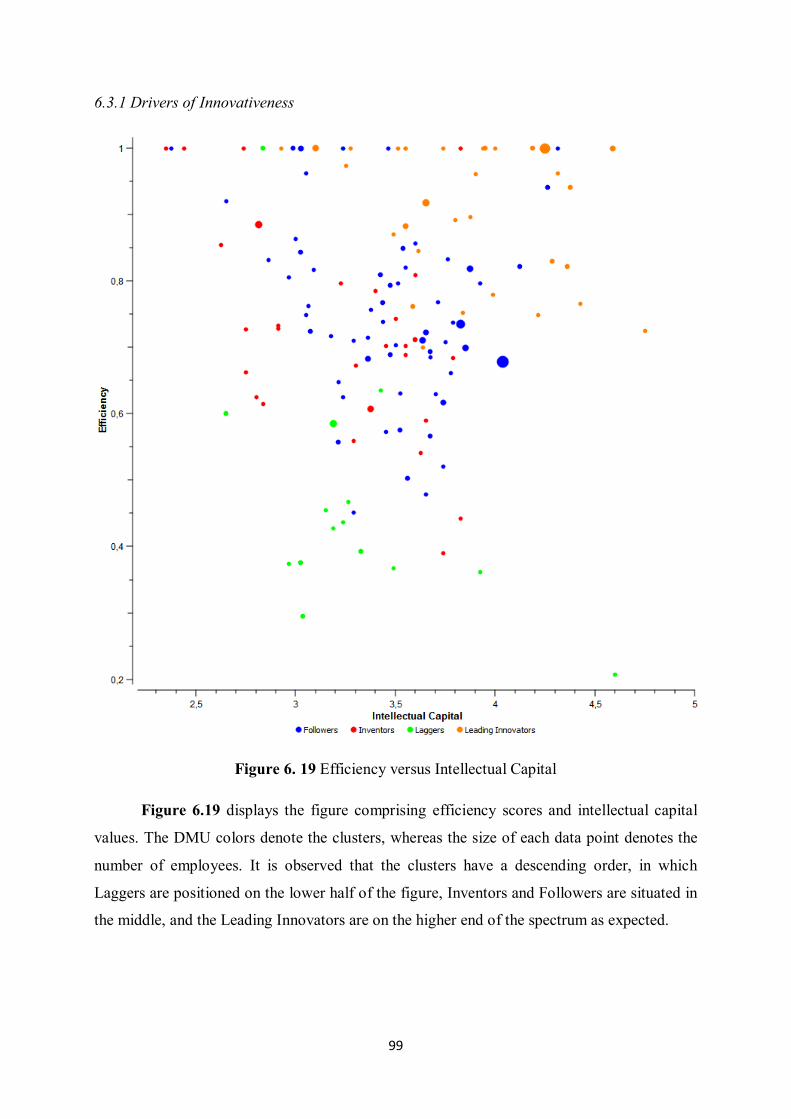
99
6.3.1 Drivers of Innovativeness
Figure 6. 19 Efficiency versus Intellectual Capital
Figure 6.19 displays the figure comprising efficiency scores and intellectual capital
values. The DMU colors denote the clusters, whereas the size of each data point denotes the
number of employees. It is observed that the clusters have a descending order, in which
Laggers are positioned on the lower half of the figure, Inventors and Followers are situated in
the middle, and the Leading Innovators are on the higher end of the spectrum as expected.
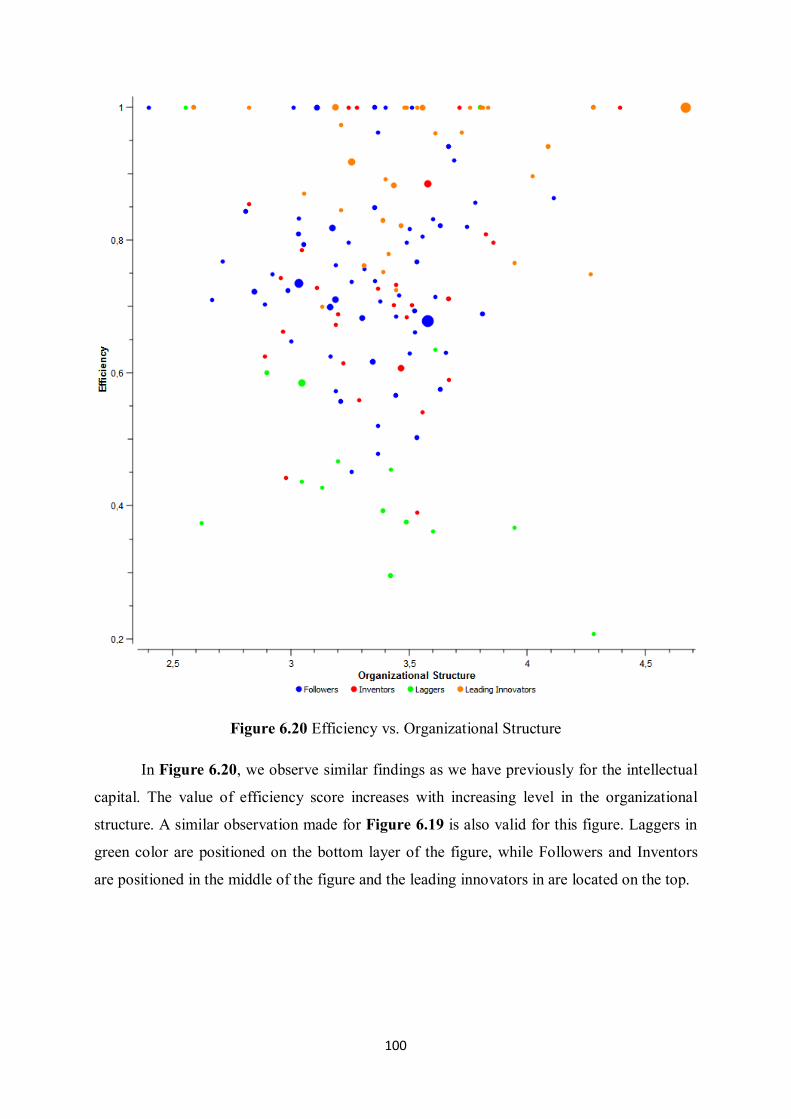
100
Figure 6.20 Efficiency vs. Organizational Structure
In Figure 6.20, we observe similar findings as we have previously for the intellectual
capital. The value of efficiency score increases with increasing level in the organizational
structure. A similar observation made for Figure 6.19 is also valid for this figure. Laggers in
green color are positioned on the bottom layer of the figure, while Followers and Inventors
are positioned in the middle of the figure and the leading innovators in are located on the top.
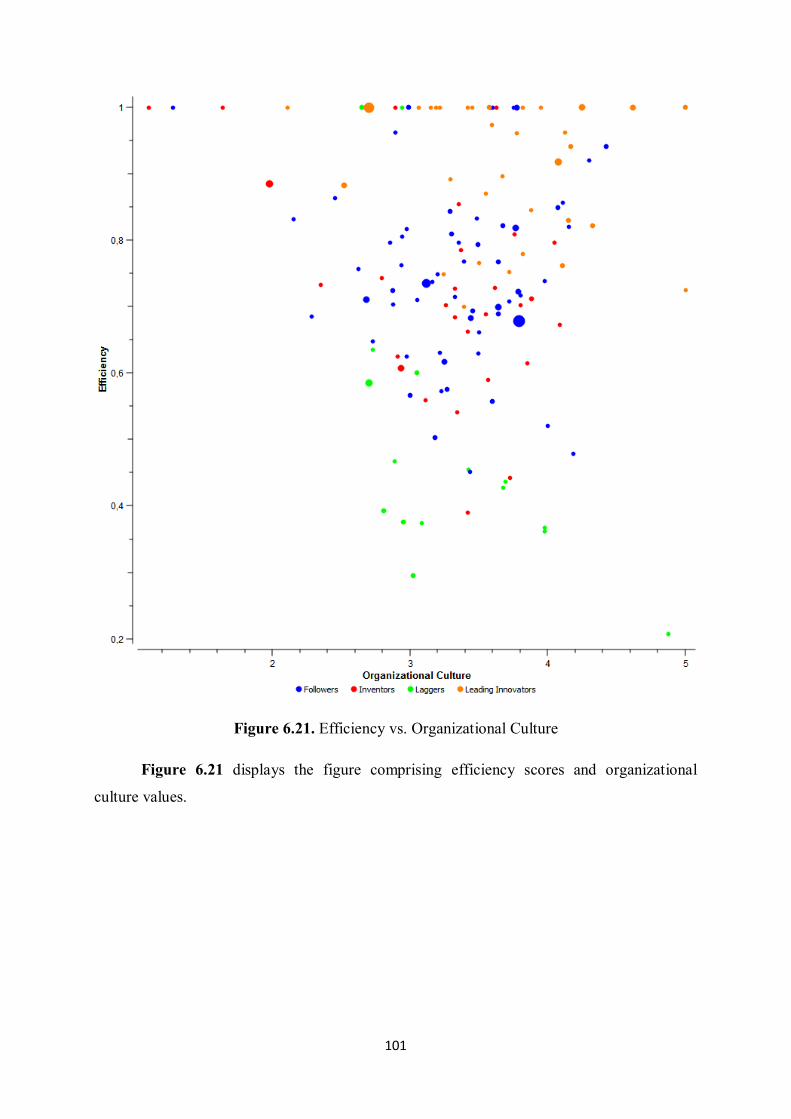
101
Figure 6.21. Efficiency vs. Organizational Culture
Figure 6.21 displays the figure comprising efficiency scores and organizational
culture values.
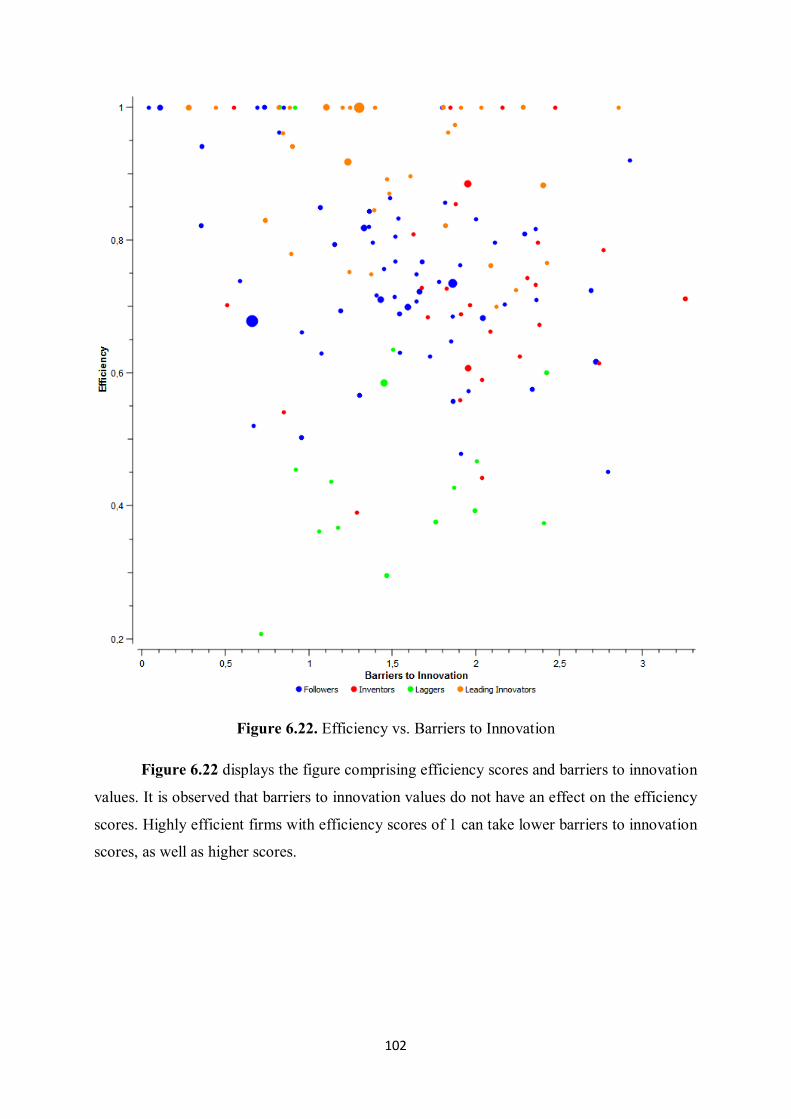
102
Figure 6.22. Efficiency vs. Barriers to Innovation
Figure 6.22 displays the figure comprising efficiency scores and barriers to innovation
values. It is observed that barriers to innovation values do not have an effect on the efficiency
scores. Highly efficient firms with efficiency scores of 1 can take lower barriers to innovation
scores, as well as higher scores.
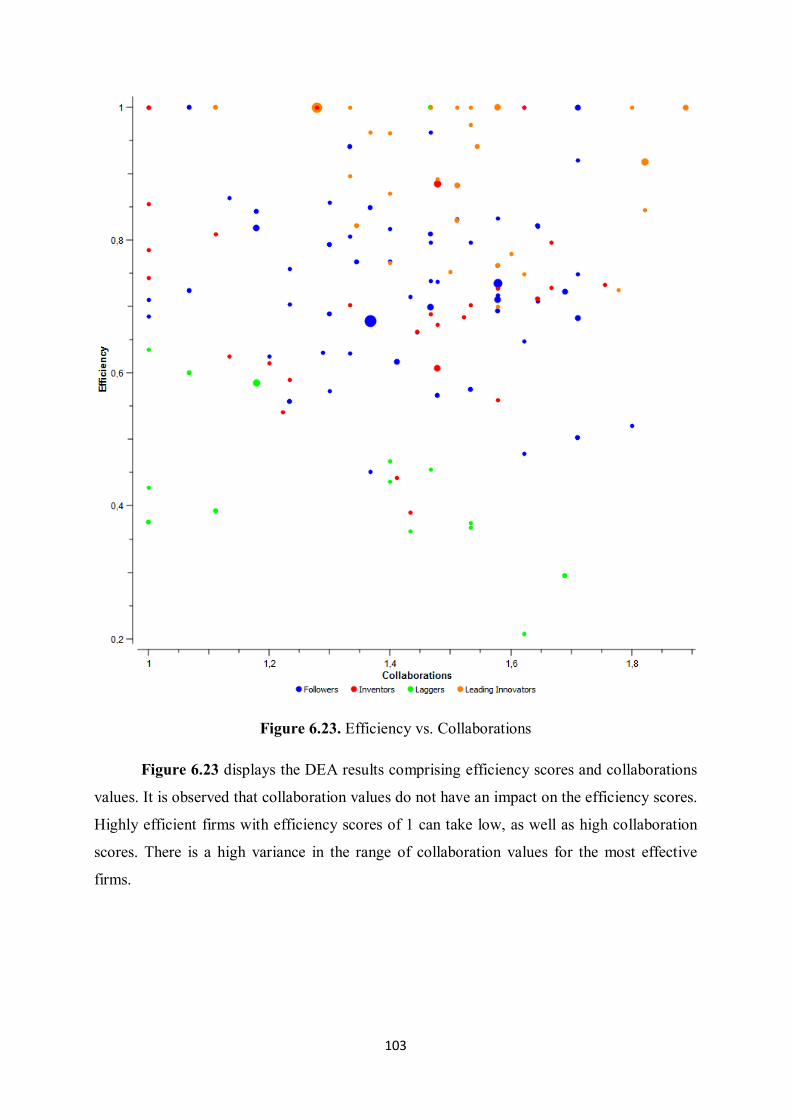
103
Figure 6.23. Efficiency vs. Collaborations
Figure 6.23 displays the DEA results comprising efficiency scores and collaborations
values. It is observed that collaboration values do not have an impact on the efficiency scores.
Highly efficient firms with efficiency scores of 1 can take low, as well as high collaboration
scores. There is a high variance in the range of collaboration values for the most effective
firms.
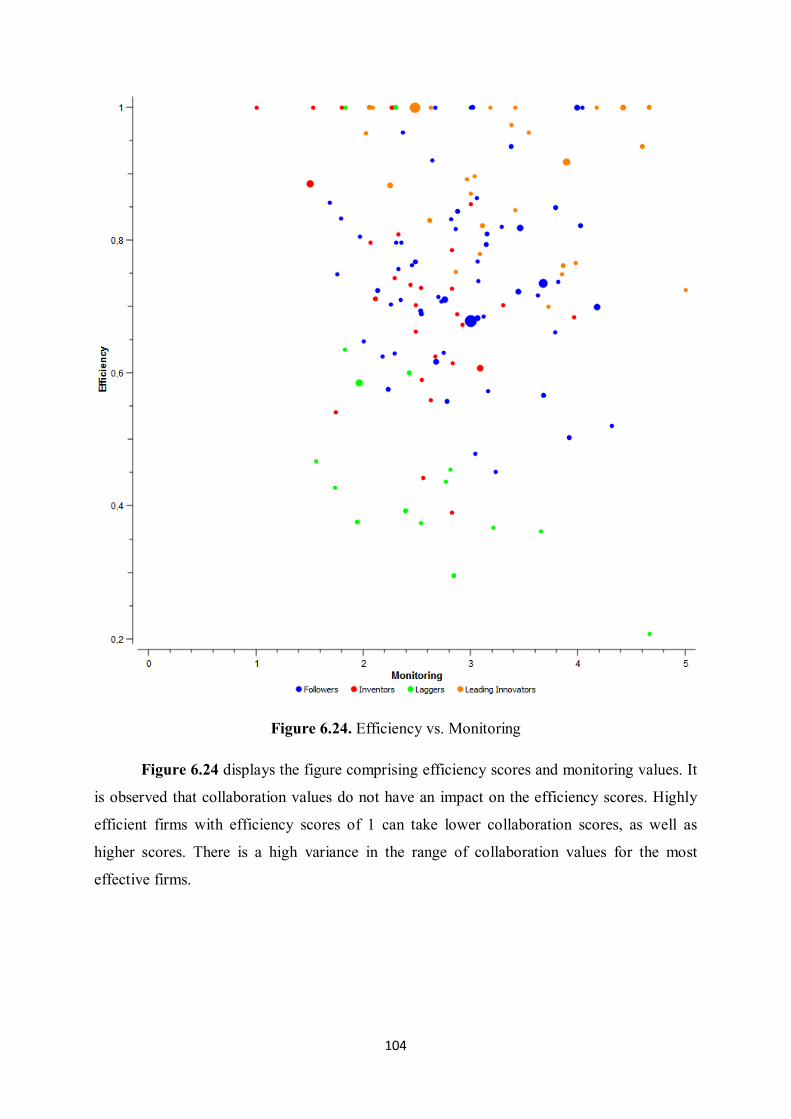
104
Figure 6.24. Efficiency vs. Monitoring
Figure 6.24 displays the figure comprising efficiency scores and monitoring values. It
is observed that collaboration values do not have an impact on the efficiency scores. Highly
efficient firms with efficiency scores of 1 can take lower collaboration scores, as well as
higher scores. There is a high variance in the range of collaboration values for the most
effective firms.
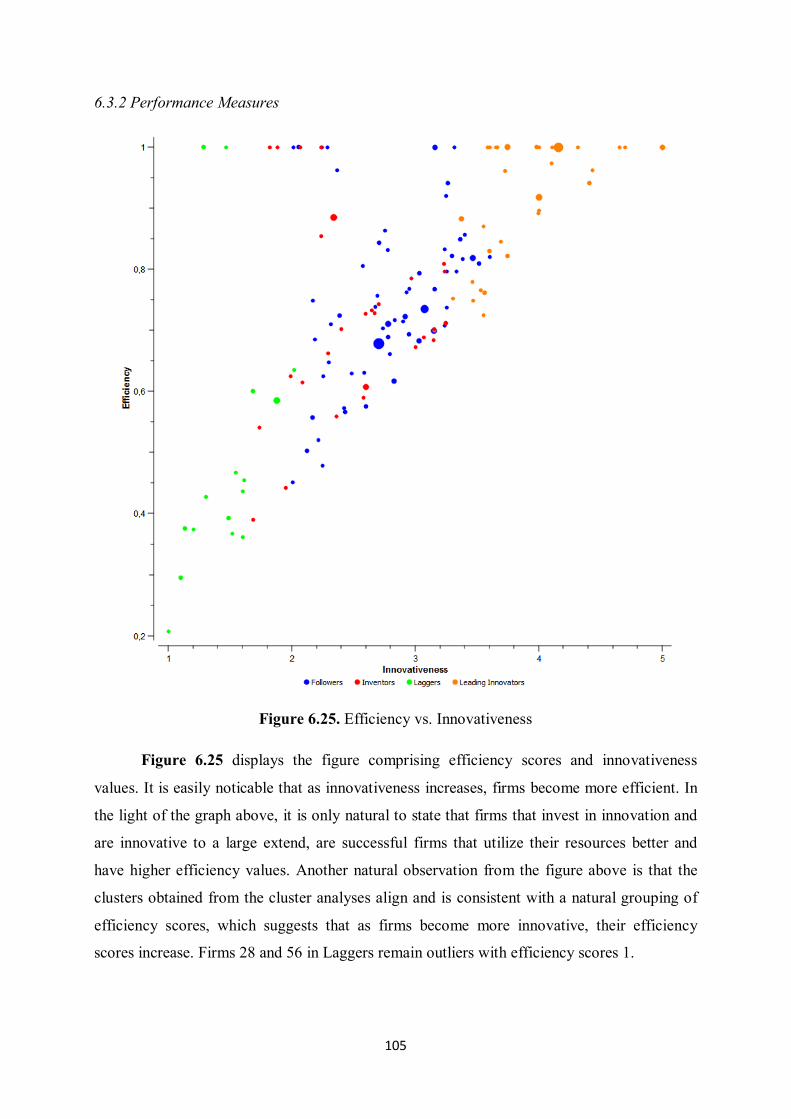
105
6.3.2 Performance Measures
Figure 6.25. Efficiency vs. Innovativeness
Figure 6.25 displays the figure comprising efficiency scores and innovativeness
values. It is easily noticable that as innovativeness increases, firms become more efficient. In
the light of the graph above, it is only natural to state that firms that invest in innovation and
are innovative to a large extend, are successful firms that utilize their resources better and
have higher efficiency values. Another natural observation from the figure above is that the
clusters obtained from the cluster analyses align and is consistent with a natural grouping of
efficiency scores, which suggests that as firms become more innovative, their efficiency
scores increase. Firms 28 and 56 in Laggers remain outliers with efficiency scores 1.
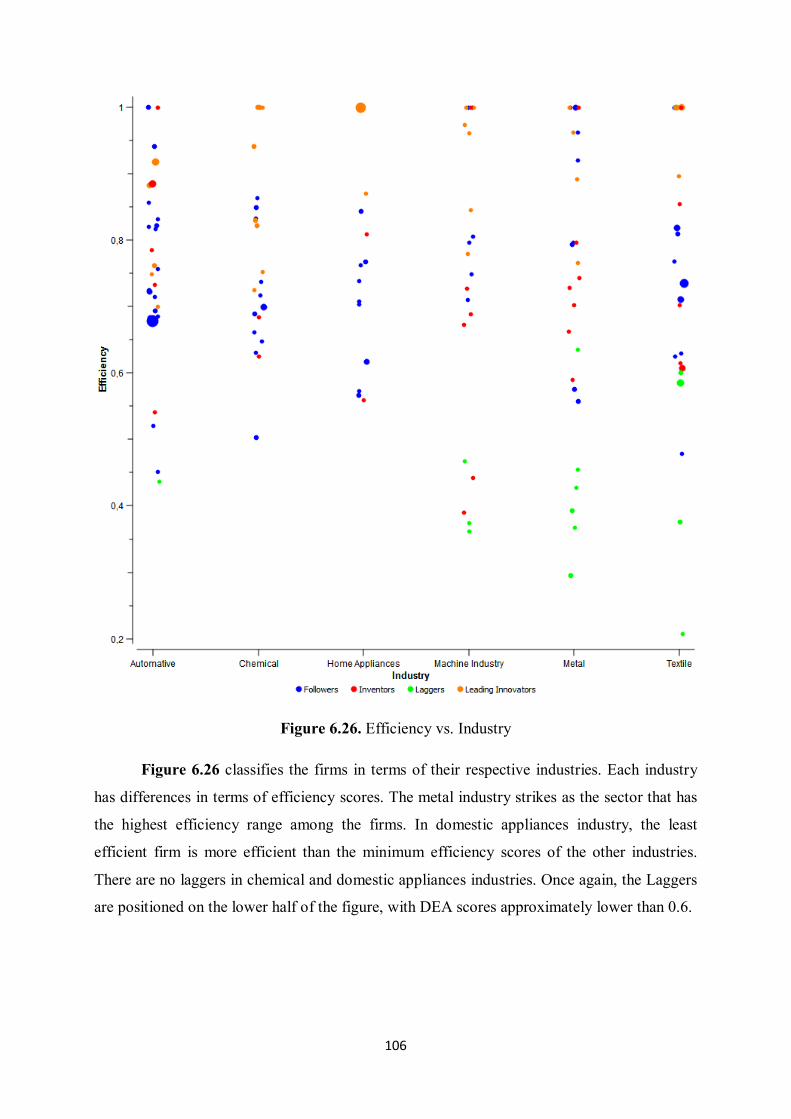
106
Figure 6.26. Efficiency vs. Industry
Figure 6.26 classifies the firms in terms of their respective industries. Each industry
has differences in terms of efficiency scores. The metal industry strikes as the sector that has
the highest efficiency range among the firms. In domestic appliances industry, the least
efficient firm is more efficient than the minimum efficiency scores of the other industries.
There are no laggers in chemical and domestic appliances industries. Once again, the Laggers
are positioned on the lower half of the figure, with DEA scores approximately lower than 0.6.
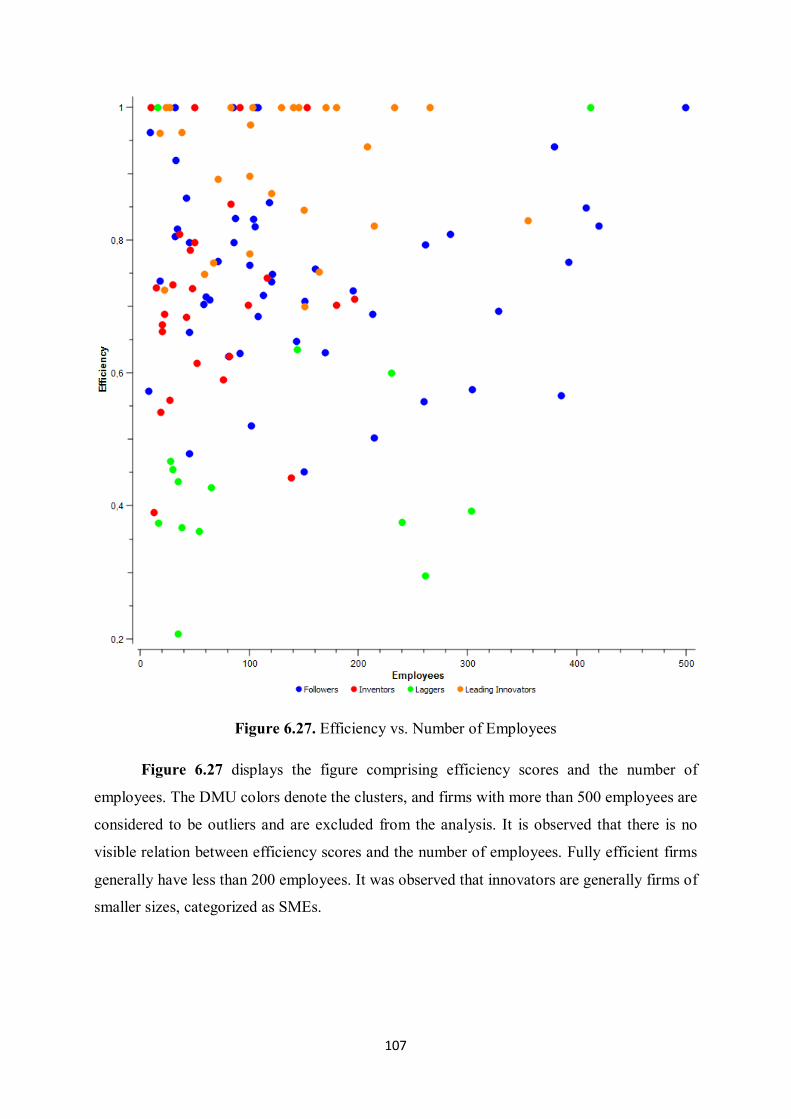
107
Figure 6.27. Efficiency vs. Number of Employees
Figure 6.27 displays the figure comprising efficiency scores and the number of
employees. The DMU colors denote the clusters, and firms with more than 500 employees are
considered to be outliers and are excluded from the analysis. It is observed that there is no
visible relation between efficiency scores and the number of employees. Fully efficient firms
generally have less than 200 employees. It was observed that innovators are generally firms of
smaller sizes, categorized as SMEs.
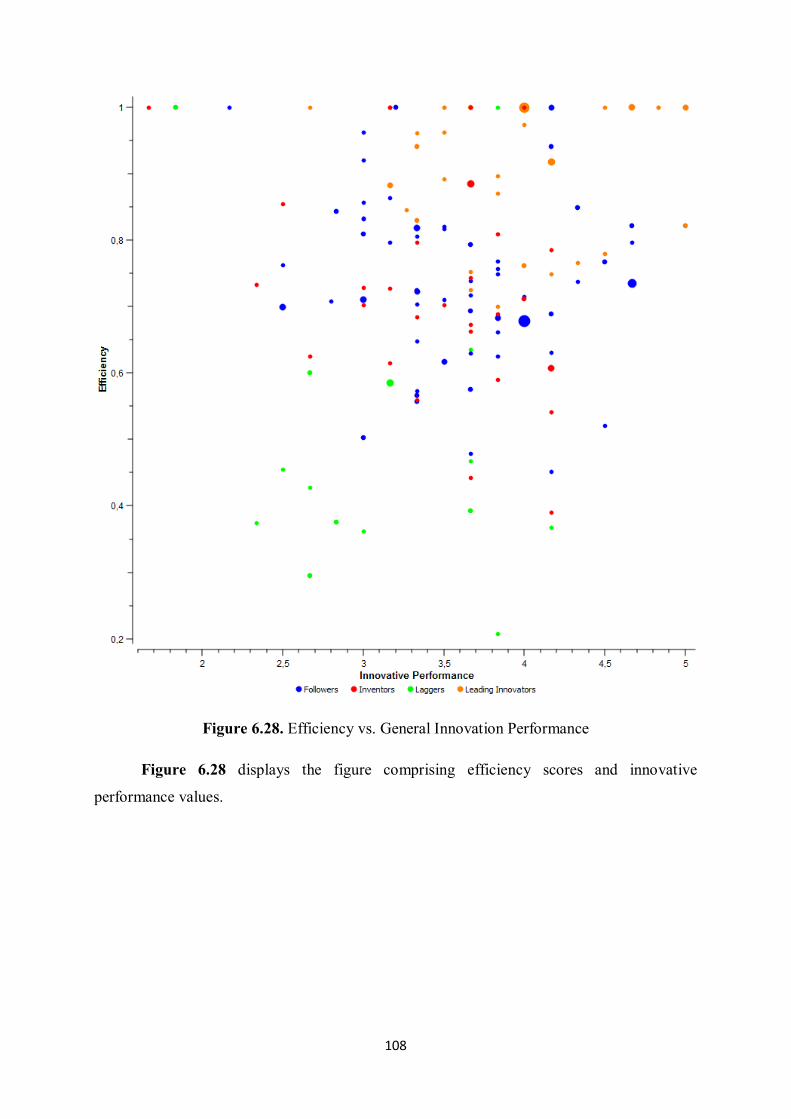
108
Figure 6.28. Efficiency vs. General Innovation Performance
Figure 6.28 displays the figure comprising efficiency scores and innovative
performance values.
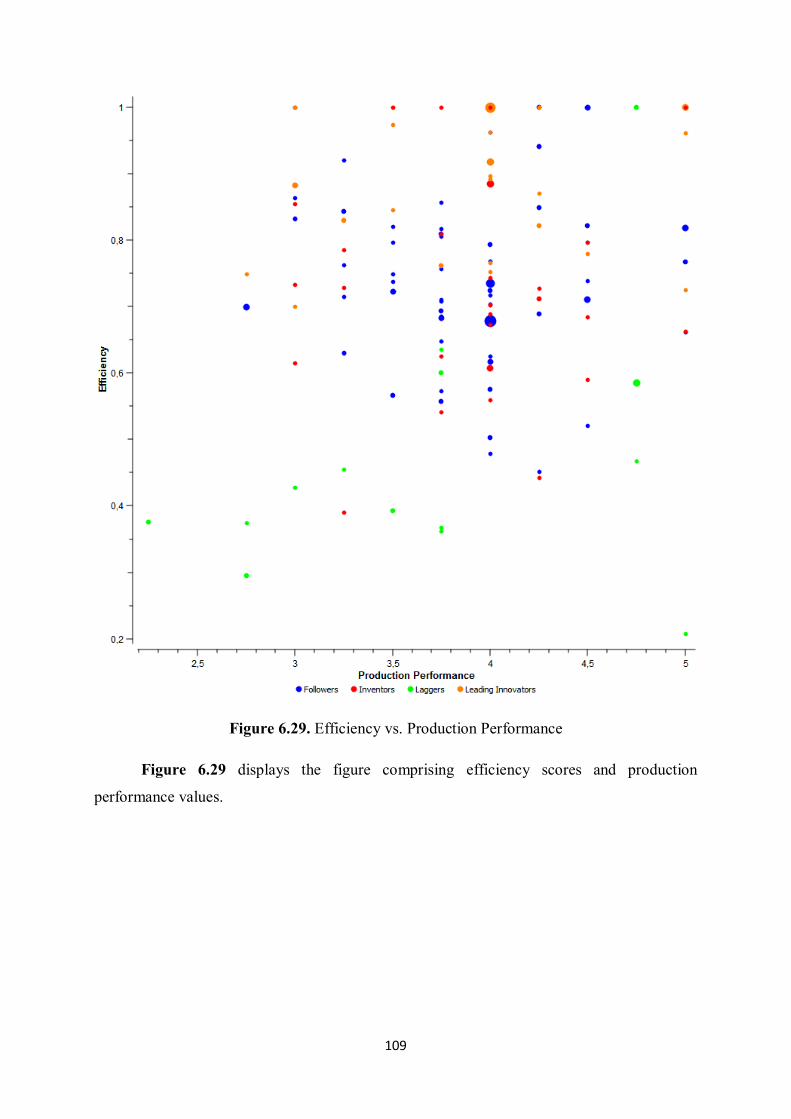
109
Figure 6.29. Efficiency vs. Production Performance
Figure 6.29 displays the figure comprising efficiency scores and production
performance values.
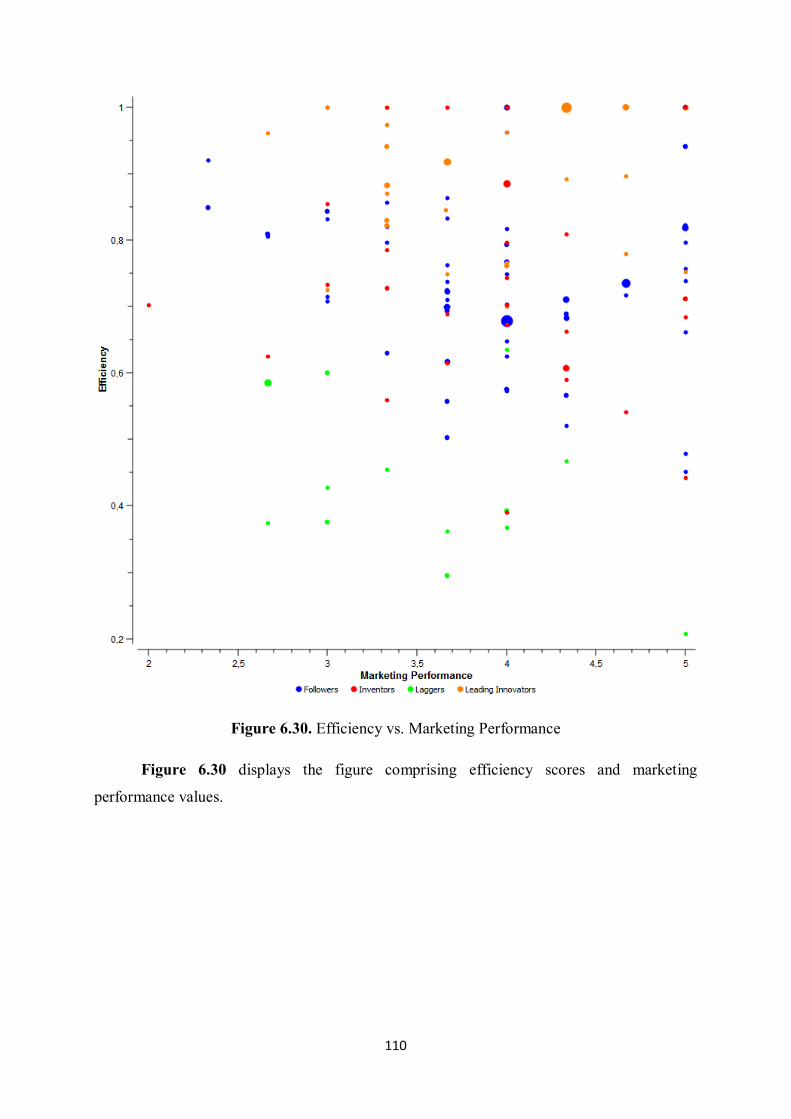
110
Figure 6.30. Efficiency vs. Marketing Performance
Figure 6.30 displays the figure comprising efficiency scores and marketing
performance values.
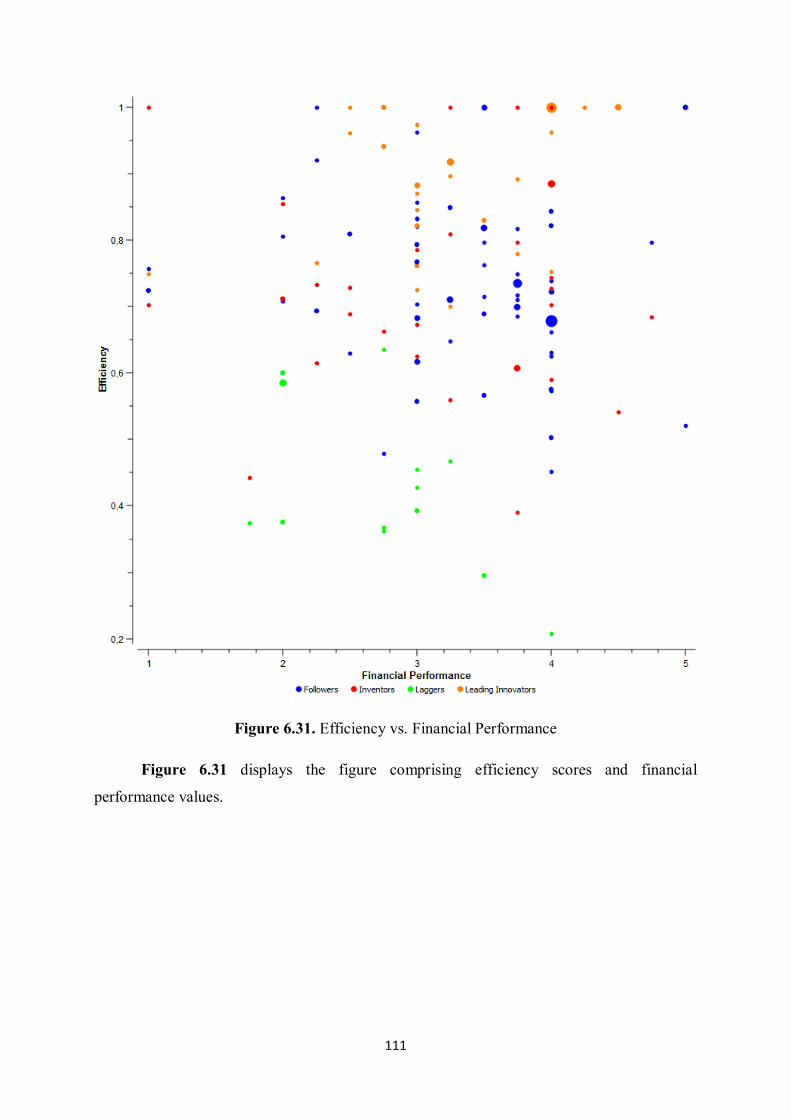
111
Figure 6.31. Efficiency vs. Financial Performance
Figure 6.31 displays the figure comprising efficiency scores and financial
performance values.
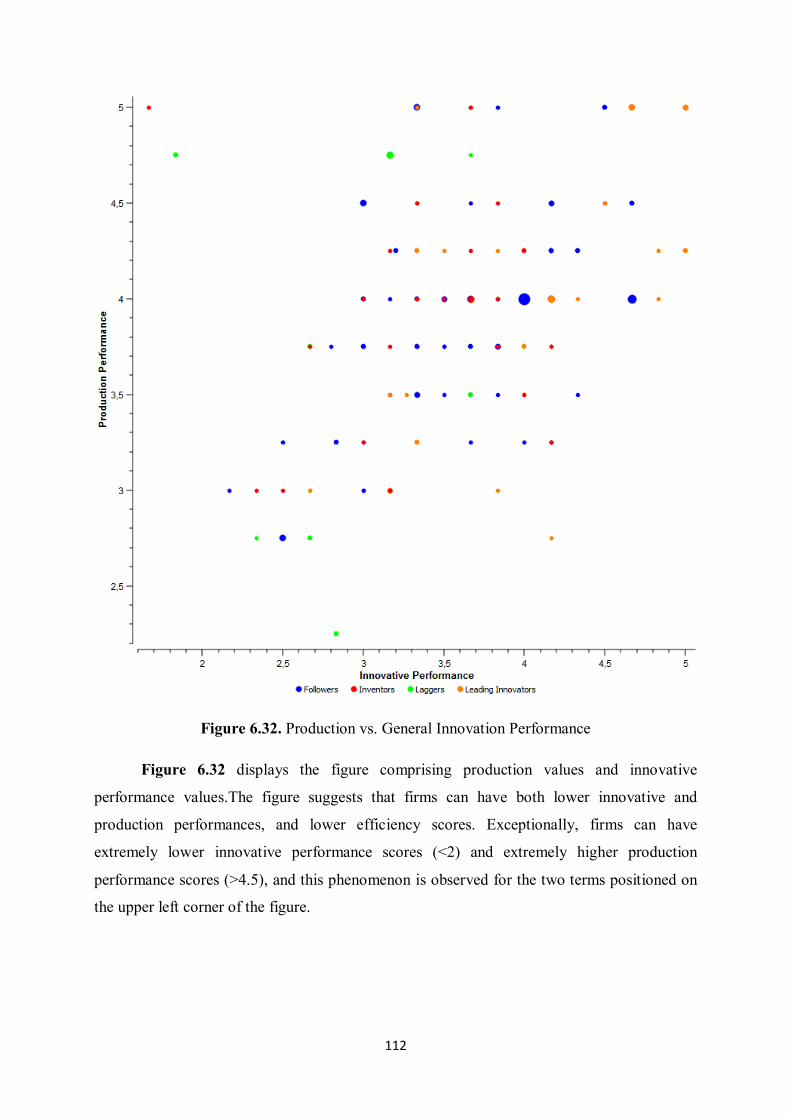
112
Figure 6.32. Production vs. General Innovation Performance
Figure 6.32 displays the figure comprising production values and innovative
performance values.The figure suggests that firms can have both lower innovative and
production performances, and lower efficiency scores. Exceptionally, firms can have
extremely lower innovative performance scores (<2) and extremely higher production
performance scores (>4.5), and this phenomenon is observed for the two terms positioned on
the upper left corner of the figure.
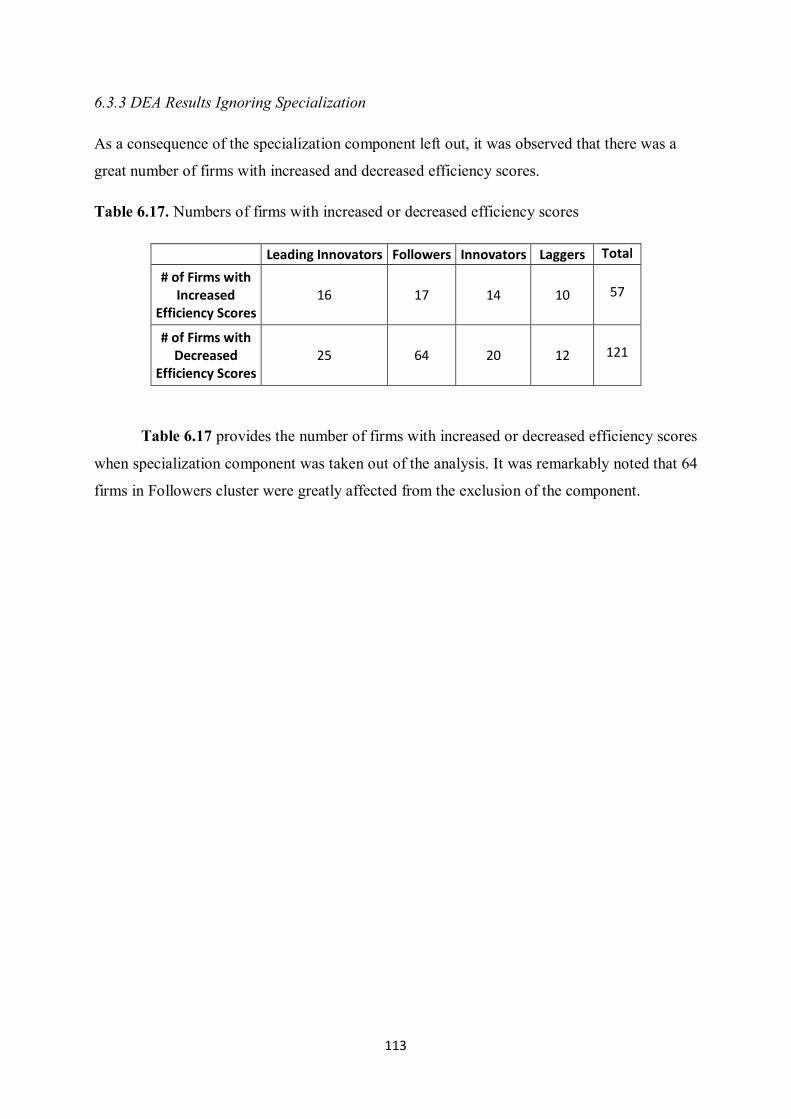
113
6.3.3 DEA Results Ignoring Specialization
As a consequence of the specialization component left out, it was observed that there was a
great number of firms with increased and decreased efficiency scores.
Table 6.17. Numbers of firms with increased or decreased efficiency scores
Leading Innovators Followers Innovators Laggers Total
# of Firms with Increased
Efficiency Scores 16 17 14 10
57
# of Firms with Decreased
Efficiency Scores 25 64 20 12
121
Table 6.17 provides the number of firms with increased or decreased efficiency scores
when specialization component was taken out of the analysis. It was remarkably noted that 64
firms in Followers cluster were greatly affected from the exclusion of the component.
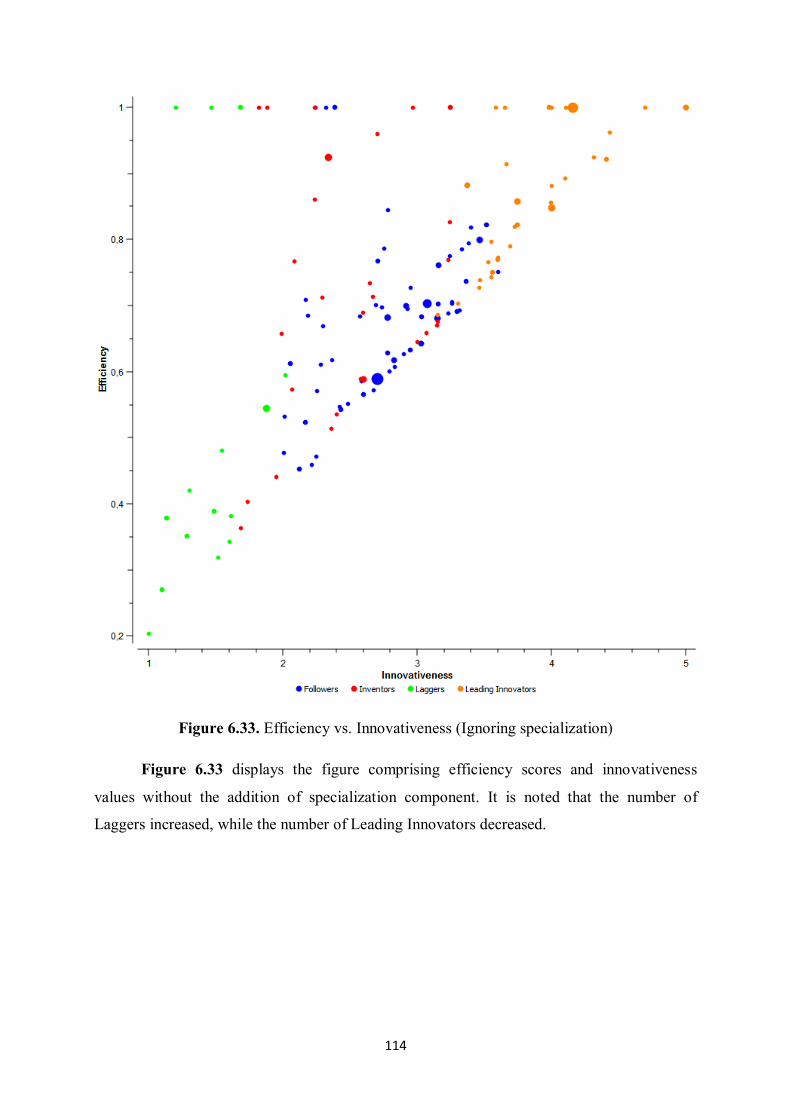
114
Figure 6.33. Efficiency vs. Innovativeness (Ignoring specialization)
Figure 6.33 displays the figure comprising efficiency scores and innovativeness
values without the addition of specialization component. It is noted that the number of
Laggers increased, while the number of Leading Innovators decreased.
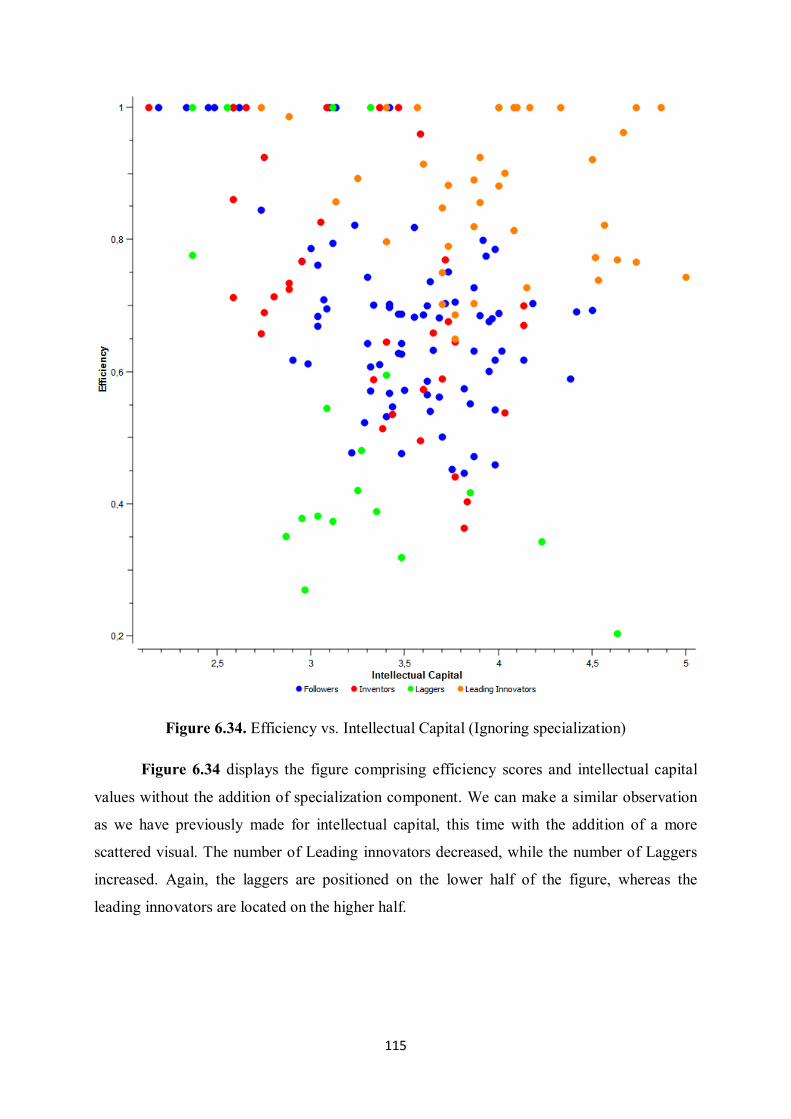
115
Figure 6.34. Efficiency vs. Intellectual Capital (Ignoring specialization)
Figure 6.34 displays the figure comprising efficiency scores and intellectual capital
values without the addition of specialization component. We can make a similar observation
as we have previously made for intellectual capital, this time with the addition of a more
scattered visual. The number of Leading innovators decreased, while the number of Laggers
increased. Again, the laggers are positioned on the lower half of the figure, whereas the
leading innovators are located on the higher half.
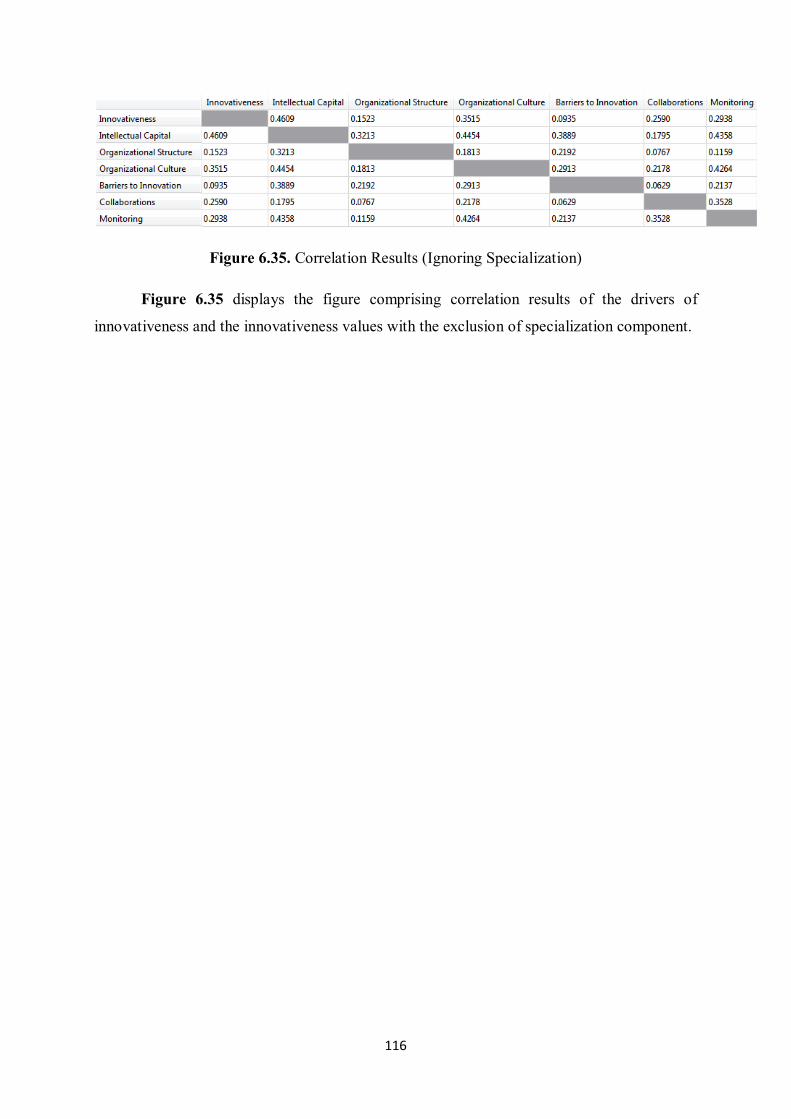
116
Figure 6.35. Correlation Results (Ignoring Specialization)
Figure 6.35 displays the figure comprising correlation results of the drivers of
innovativeness and the innovativeness values with the exclusion of specialization component.
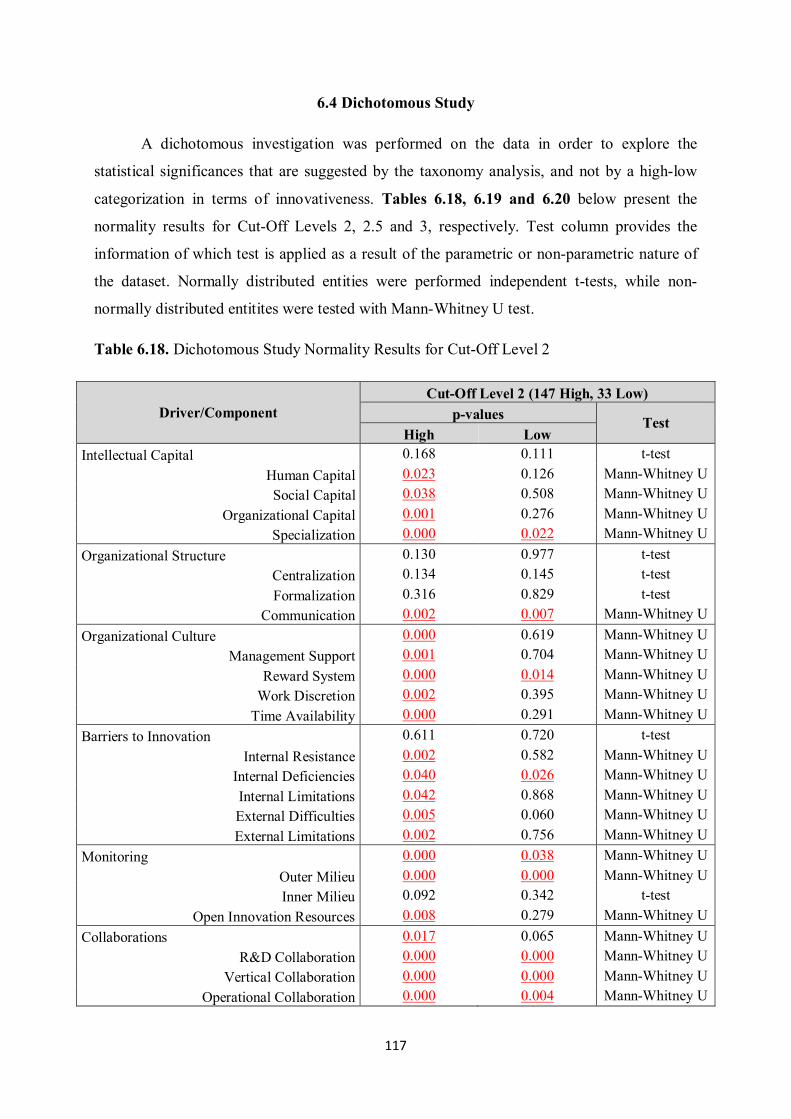
117
6.4 Dichotomous Study
A dichotomous investigation was performed on the data in order to explore the
statistical significances that are suggested by the taxonomy analysis, and not by a high-low
categorization in terms of innovativeness. Tables 6.18, 6.19 and 6.20 below present the
normality results for Cut-Off Levels 2, 2.5 and 3, respectively. Test column provides the
information of which test is applied as a result of the parametric or non-parametric nature of
the dataset. Normally distributed entities were performed independent t-tests, while non-
normally distributed entitites were tested with Mann-Whitney U test.
Table 6.18. Dichotomous Study Normality Results for Cut-Off Level 2
Driver/Component Cut-Off Level 2 (147 High, 33 Low)
p-values Test High Low
Intellectual Capital 0.168 0.111 t-test Human Capital 0.023 0.126 Mann-Whitney U Social Capital 0.038 0.508 Mann-Whitney U
Organizational Capital 0.001 0.276 Mann-Whitney U Specialization 0.000 0.022 Mann-Whitney U
Organizational Structure 0.130 0.977 t-test Centralization 0.134 0.145 t-test Formalization 0.316 0.829 t-test
Communication 0.002 0.007 Mann-Whitney U Organizational Culture 0.000 0.619 Mann-Whitney U
Management Support 0.001 0.704 Mann-Whitney U Reward System 0.000 0.014 Mann-Whitney U
Work Discretion 0.002 0.395 Mann-Whitney U Time Availability 0.000 0.291 Mann-Whitney U
Barriers to Innovation 0.611 0.720 t-test Internal Resistance 0.002 0.582 Mann-Whitney U
Internal Deficiencies 0.040 0.026 Mann-Whitney U Internal Limitations 0.042 0.868 Mann-Whitney U External Difficulties 0.005 0.060 Mann-Whitney U External Limitations 0.002 0.756 Mann-Whitney U
Monitoring 0.000 0.038 Mann-Whitney U Outer Milieu 0.000 0.000 Mann-Whitney U Inner Milieu 0.092 0.342 t-test
Open Innovation Resources 0.008 0.279 Mann-Whitney U Collaborations 0.017 0.065 Mann-Whitney U
R&D Collaboration 0.000 0.000 Mann-Whitney U Vertical Collaboration 0.000 0.000 Mann-Whitney U
Operational Collaboration 0.000 0.004 Mann-Whitney U
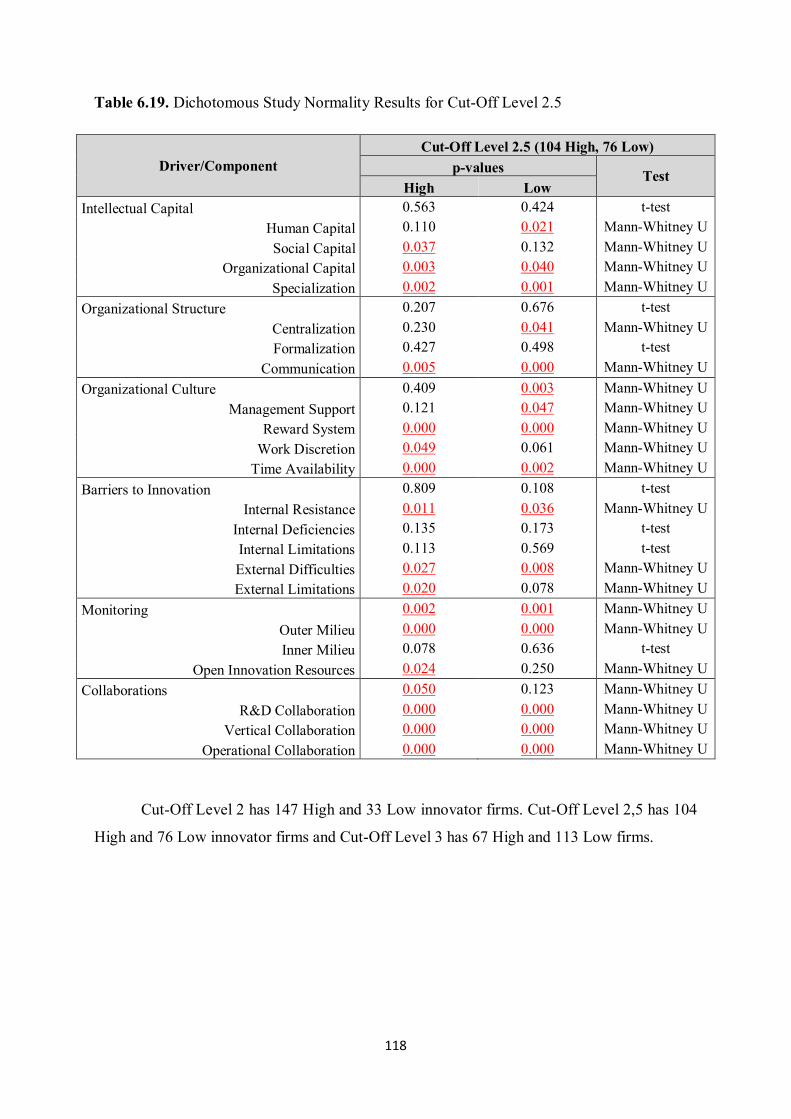
118
Table 6.19. Dichotomous Study Normality Results for Cut-Off Level 2.5
Driver/Component Cut-Off Level 2.5 (104 High, 76 Low)
p-values Test High Low
Intellectual Capital 0.563 0.424 t-test Human Capital 0.110 0.021 Mann-Whitney U Social Capital 0.037 0.132 Mann-Whitney U
Organizational Capital 0.003 0.040 Mann-Whitney U Specialization 0.002 0.001 Mann-Whitney U
Organizational Structure 0.207 0.676 t-test Centralization 0.230 0.041 Mann-Whitney U Formalization 0.427 0.498 t-test
Communication 0.005 0.000 Mann-Whitney U Organizational Culture 0.409 0.003 Mann-Whitney U
Management Support 0.121 0.047 Mann-Whitney U Reward System 0.000 0.000 Mann-Whitney U
Work Discretion 0.049 0.061 Mann-Whitney U Time Availability 0.000 0.002 Mann-Whitney U
Barriers to Innovation 0.809 0.108 t-test Internal Resistance 0.011 0.036 Mann-Whitney U
Internal Deficiencies 0.135 0.173 t-test Internal Limitations 0.113 0.569 t-test External Difficulties 0.027 0.008 Mann-Whitney U External Limitations 0.020 0.078 Mann-Whitney U
Monitoring 0.002 0.001 Mann-Whitney U Outer Milieu 0.000 0.000 Mann-Whitney U Inner Milieu 0.078 0.636 t-test
Open Innovation Resources 0.024 0.250 Mann-Whitney U Collaborations 0.050 0.123 Mann-Whitney U
R&D Collaboration 0.000 0.000 Mann-Whitney U Vertical Collaboration 0.000 0.000 Mann-Whitney U
Operational Collaboration 0.000 0.000 Mann-Whitney U
Cut-Off Level 2 has 147 High and 33 Low innovator firms. Cut-Off Level 2,5 has 104
High and 76 Low innovator firms and Cut-Off Level 3 has 67 High and 113 Low firms.
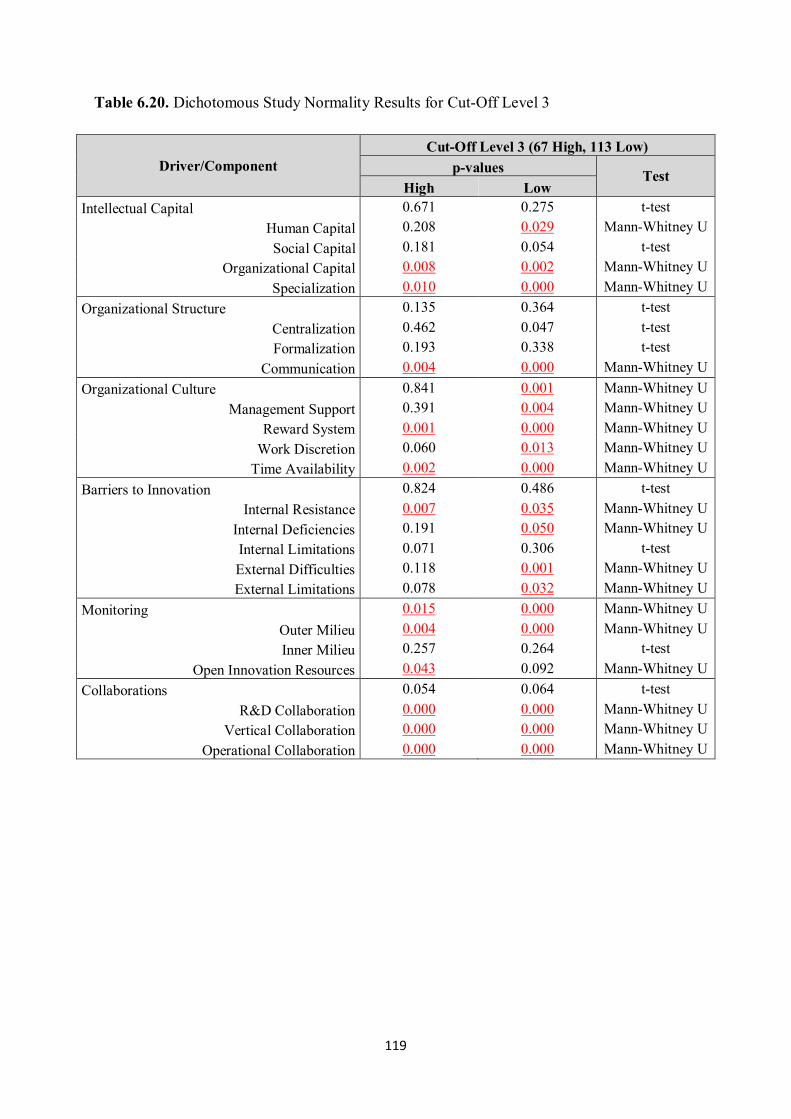
119
Table 6.20. Dichotomous Study Normality Results for Cut-Off Level 3
Driver/Component Cut-Off Level 3 (67 High, 113 Low)
p-values Test High Low
Intellectual Capital 0.671 0.275 t-test Human Capital 0.208 0.029 Mann-Whitney U Social Capital 0.181 0.054 t-test
Organizational Capital 0.008 0.002 Mann-Whitney U Specialization 0.010 0.000 Mann-Whitney U
Organizational Structure 0.135 0.364 t-test Centralization 0.462 0.047 t-test Formalization 0.193 0.338 t-test
Communication 0.004 0.000 Mann-Whitney U Organizational Culture 0.841 0.001 Mann-Whitney U
Management Support 0.391 0.004 Mann-Whitney U Reward System 0.001 0.000 Mann-Whitney U
Work Discretion 0.060 0.013 Mann-Whitney U Time Availability 0.002 0.000 Mann-Whitney U
Barriers to Innovation 0.824 0.486 t-test Internal Resistance 0.007 0.035 Mann-Whitney U
Internal Deficiencies 0.191 0.050 Mann-Whitney U Internal Limitations 0.071 0.306 t-test External Difficulties 0.118 0.001 Mann-Whitney U External Limitations 0.078 0.032 Mann-Whitney U
Monitoring 0.015 0.000 Mann-Whitney U Outer Milieu 0.004 0.000 Mann-Whitney U Inner Milieu 0.257 0.264 t-test
Open Innovation Resources 0.043 0.092 Mann-Whitney U Collaborations 0.054 0.064 t-test
R&D Collaboration 0.000 0.000 Mann-Whitney U Vertical Collaboration 0.000 0.000 Mann-Whitney U
Operational Collaboration 0.000 0.000 Mann-Whitney U
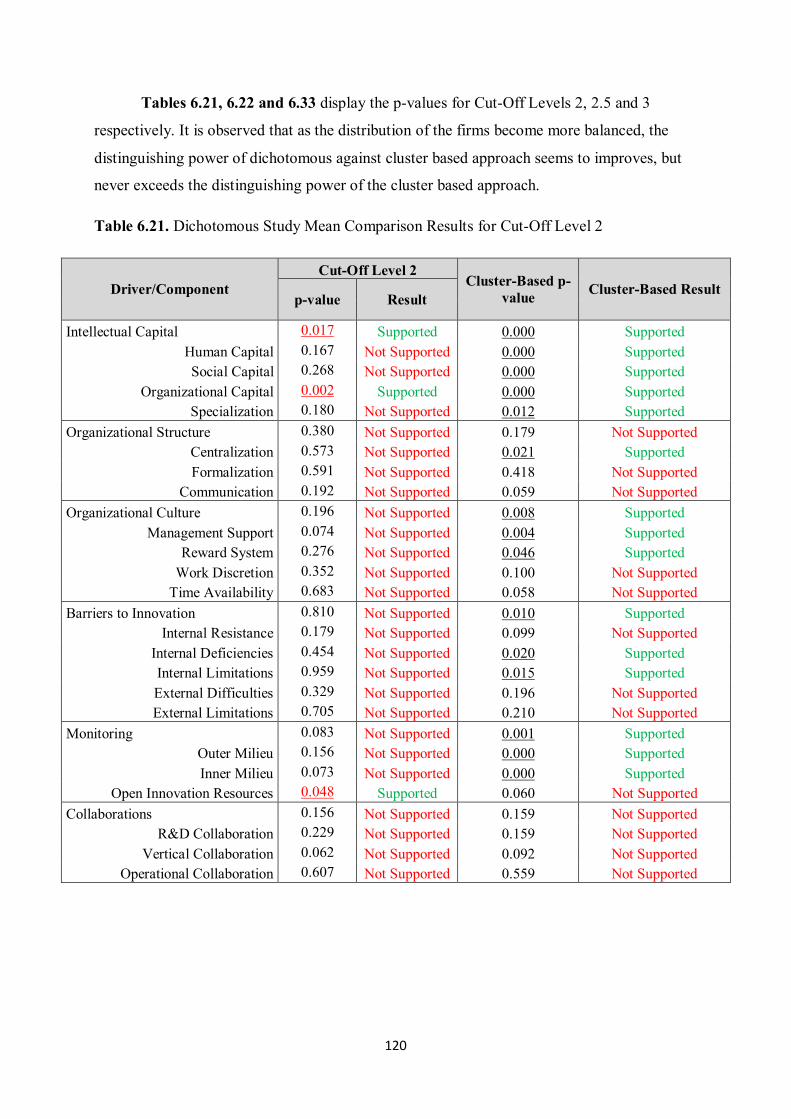
120
Tables 6.21, 6.22 and 6.33 display the p-values for Cut-Off Levels 2, 2.5 and 3
respectively. It is observed that as the distribution of the firms become more balanced, the
distinguishing power of dichotomous against cluster based approach seems to improves, but
never exceeds the distinguishing power of the cluster based approach.
Table 6.21. Dichotomous Study Mean Comparison Results for Cut-Off Level 2
Driver/Component Cut-Off Level 2
Cluster-Based p-value Cluster-Based Result
p-value Result
Intellectual Capital 0.017 Supported 0.000 Supported Human Capital 0.167 Not Supported 0.000 Supported Social Capital 0.268 Not Supported 0.000 Supported
Organizational Capital 0.002 Supported 0.000 Supported Specialization 0.180 Not Supported 0.012 Supported
Organizational Structure 0.380 Not Supported 0.179 Not Supported Centralization 0.573 Not Supported 0.021 Supported Formalization 0.591 Not Supported 0.418 Not Supported
Communication 0.192 Not Supported 0.059 Not Supported Organizational Culture 0.196 Not Supported 0.008 Supported
Management Support 0.074 Not Supported 0.004 Supported Reward System 0.276 Not Supported 0.046 Supported
Work Discretion 0.352 Not Supported 0.100 Not Supported Time Availability 0.683 Not Supported 0.058 Not Supported
Barriers to Innovation 0.810 Not Supported 0.010 Supported Internal Resistance 0.179 Not Supported 0.099 Not Supported
Internal Deficiencies 0.454 Not Supported 0.020 Supported Internal Limitations 0.959 Not Supported 0.015 Supported External Difficulties 0.329 Not Supported 0.196 Not Supported External Limitations 0.705 Not Supported 0.210 Not Supported
Monitoring 0.083 Not Supported 0.001 Supported Outer Milieu 0.156 Not Supported 0.000 Supported Inner Milieu 0.073 Not Supported 0.000 Supported
Open Innovation Resources 0.048 Supported 0.060 Not Supported Collaborations 0.156 Not Supported 0.159 Not Supported
R&D Collaboration 0.229 Not Supported 0.159 Not Supported Vertical Collaboration 0.062 Not Supported 0.092 Not Supported
Operational Collaboration 0.607 Not Supported 0.559 Not Supported
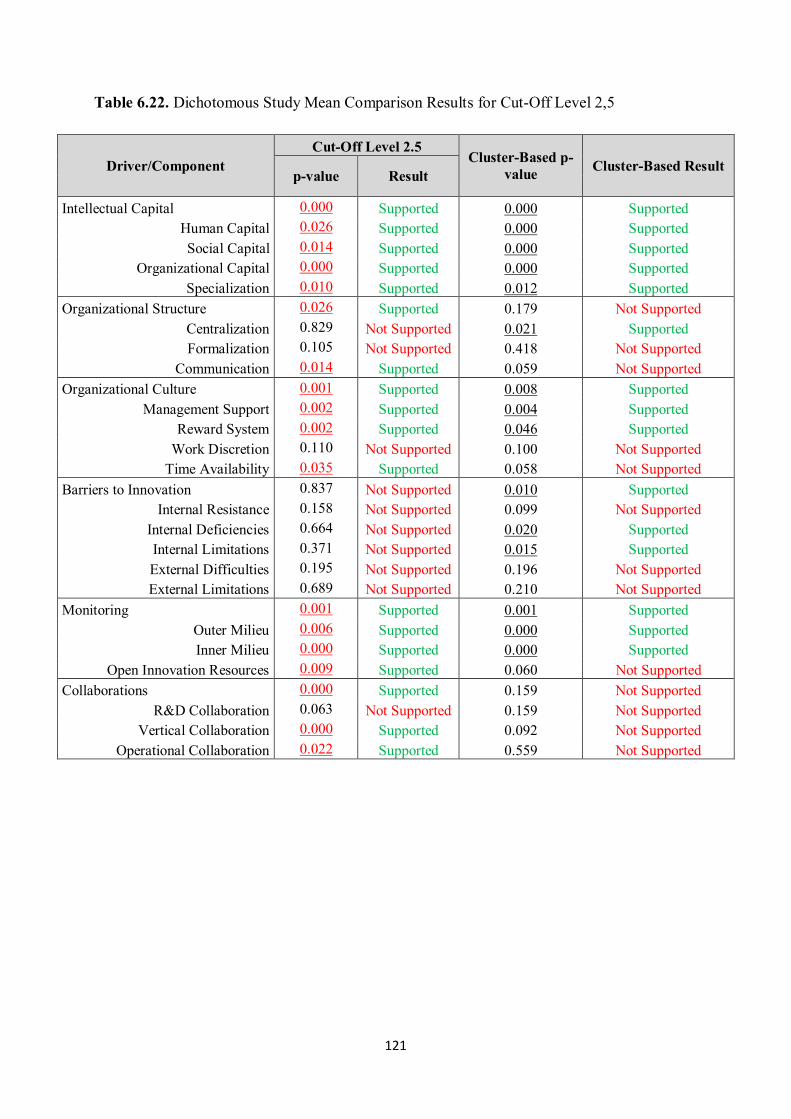
121
Table 6.22. Dichotomous Study Mean Comparison Results for Cut-Off Level 2,5
Driver/Component Cut-Off Level 2.5
Cluster-Based p-value Cluster-Based Result
p-value Result
Intellectual Capital 0.000 Supported 0.000 Supported Human Capital 0.026 Supported 0.000 Supported Social Capital 0.014 Supported 0.000 Supported
Organizational Capital 0.000 Supported 0.000 Supported Specialization 0.010 Supported 0.012 Supported
Organizational Structure 0.026 Supported 0.179 Not Supported Centralization 0.829 Not Supported 0.021 Supported Formalization 0.105 Not Supported 0.418 Not Supported
Communication 0.014 Supported 0.059 Not Supported Organizational Culture 0.001 Supported 0.008 Supported
Management Support 0.002 Supported 0.004 Supported Reward System 0.002 Supported 0.046 Supported
Work Discretion 0.110 Not Supported 0.100 Not Supported Time Availability 0.035 Supported 0.058 Not Supported
Barriers to Innovation 0.837 Not Supported 0.010 Supported Internal Resistance 0.158 Not Supported 0.099 Not Supported
Internal Deficiencies 0.664 Not Supported 0.020 Supported Internal Limitations 0.371 Not Supported 0.015 Supported External Difficulties 0.195 Not Supported 0.196 Not Supported External Limitations 0.689 Not Supported 0.210 Not Supported
Monitoring 0.001 Supported 0.001 Supported Outer Milieu 0.006 Supported 0.000 Supported Inner Milieu 0.000 Supported 0.000 Supported
Open Innovation Resources 0.009 Supported 0.060 Not Supported Collaborations 0.000 Supported 0.159 Not Supported
R&D Collaboration 0.063 Not Supported 0.159 Not Supported Vertical Collaboration 0.000 Supported 0.092 Not Supported
Operational Collaboration 0.022 Supported 0.559 Not Supported
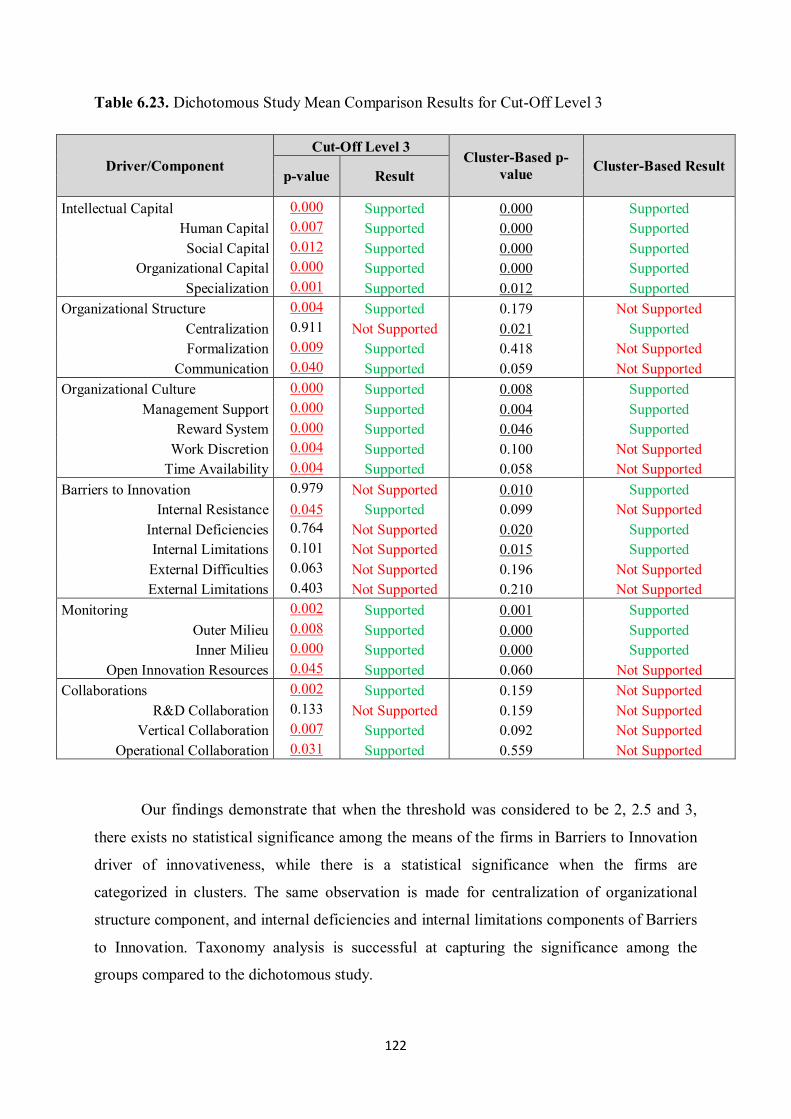
122
Table 6.23. Dichotomous Study Mean Comparison Results for Cut-Off Level 3
Driver/Component Cut-Off Level 3
Cluster-Based p-value Cluster-Based Result
p-value Result
Intellectual Capital 0.000 Supported 0.000 Supported Human Capital 0.007 Supported 0.000 Supported Social Capital 0.012 Supported 0.000 Supported
Organizational Capital 0.000 Supported 0.000 Supported Specialization 0.001 Supported 0.012 Supported
Organizational Structure 0.004 Supported 0.179 Not Supported Centralization 0.911 Not Supported 0.021 Supported Formalization 0.009 Supported 0.418 Not Supported
Communication 0.040 Supported 0.059 Not Supported Organizational Culture 0.000 Supported 0.008 Supported
Management Support 0.000 Supported 0.004 Supported Reward System 0.000 Supported 0.046 Supported
Work Discretion 0.004 Supported 0.100 Not Supported Time Availability 0.004 Supported 0.058 Not Supported
Barriers to Innovation 0.979 Not Supported 0.010 Supported Internal Resistance 0.045 Supported 0.099 Not Supported
Internal Deficiencies 0.764 Not Supported 0.020 Supported Internal Limitations 0.101 Not Supported 0.015 Supported External Difficulties 0.063 Not Supported 0.196 Not Supported External Limitations 0.403 Not Supported 0.210 Not Supported
Monitoring 0.002 Supported 0.001 Supported Outer Milieu 0.008 Supported 0.000 Supported Inner Milieu 0.000 Supported 0.000 Supported
Open Innovation Resources 0.045 Supported 0.060 Not Supported Collaborations 0.002 Supported 0.159 Not Supported
R&D Collaboration 0.133 Not Supported 0.159 Not Supported Vertical Collaboration 0.007 Supported 0.092 Not Supported
Operational Collaboration 0.031 Supported 0.559 Not Supported
Our findings demonstrate that when the threshold was considered to be 2, 2.5 and 3,
there exists no statistical significance among the means of the firms in Barriers to Innovation
driver of innovativeness, while there is a statistical significance when the firms are
categorized in clusters. The same observation is made for centralization of organizational
structure component, and internal deficiencies and internal limitations components of Barriers
to Innovation. Taxonomy analysis is successful at capturing the significance among the
groups compared to the dichotomous study.
123
CHAPTER 7
SUMMARY & CONCLUSION
7.1. Summary
The study conducted in this thesis proposes a drivers of innovativeness model and
investigates on the relationship among the model entities through a dataset consisting of 184
Turkish manufacturing firms. A framework was developed based on a cluster analysis and the
groups were tested statistically for group differences. The results obtained can be used to
assist higher levels of management within the firms for aiding decision support systems and
determining innovation policies and strategies. The hypotheses proposed in chapter 4 of this
thesis were statistically tested and the results were reported. A summary of results are
provided in Table 7.1, where the hypotheses supported and rejected are indicated. Underlined
p-values denote the supported hypotheses, where as p-values with no underline prove no
support for the hypothesis.
The hypotheses H1 to H6 related to drivers of innovativeness are presented in Table
7.1. We found support for intellectual capital, organizational culture, barriers to innovation
and monitoring, while there exists no statistical evidence for organizational structure and
collaborations.
124
Hypotheses related to intellectual capital components are supported without
exception. There are statistical significances among cluster means for humanc, social capital,
organizational capital and specialization.
Organizational structure hypotheses contained an investigation on the mean
differences. There exists a statistical significance only for centralization component, and there
is no support for formalization and communication.
Firms in our study organizational culture are different when examined cluster-wise in
terms of management support and reward systems, and there is no difference among cluster
means in work discretion and time availability components.
The statistical investigation of barriers to innovation driver of innovativeness yielded
significance among clusters in internal deficiencies and internall. There exists no statistical
significance among cluster means for internal resistance, external difficulties and external
limitations.
Monitoring driver was supported under its components monitoring the outer and inner
milieu, while there exists no statistical significance for monitoring open innovation resources.
Collaboration driver was examined among the clusters and we found no statistical
evidence for different cluster means for each of the collaboration types.
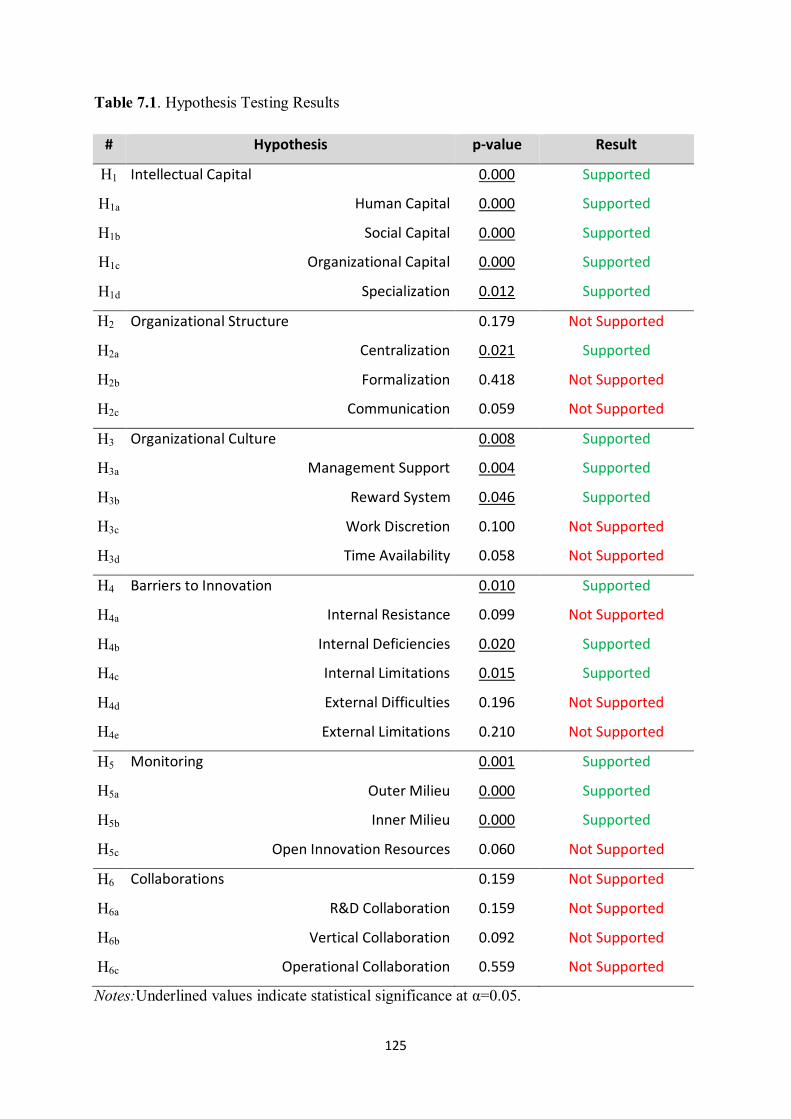
125
Table 7.1. Hypothesis Testing Results
# Hypothesis p-value Result
H1 Intellectual Capital 0.000 Supported
H1a Human Capital 0.000 Supported
H1b Social Capital 0.000 Supported
H1c Organizational Capital 0.000 Supported
H1d Specialization 0.012 Supported
H2 Organizational Structure 0.179 Not Supported
H2a Centralization 0.021 Supported
H2b Formalization 0.418 Not Supported
H2c Communication 0.059 Not Supported
H3 Organizational Culture 0.008 Supported
H3a Management Support 0.004 Supported
H3b Reward System 0.046 Supported
H3c Work Discretion 0.100 Not Supported
H3d Time Availability 0.058 Not Supported
H4 Barriers to Innovation 0.010 Supported
H4a Internal Resistance 0.099 Not Supported
H4b Internal Deficiencies 0.020 Supported
H4c Internal Limitations 0.015 Supported
H4d External Difficulties 0.196 Not Supported
H4e External Limitations 0.210 Not Supported
H5 Monitoring 0.001 Supported
H5a Outer Milieu 0.000 Supported
H5b Inner Milieu 0.000 Supported
H5c Open Innovation Resources 0.060 Not Supported
H6 Collaborations 0.159 Not Supported
H6a R&D Collaboration 0.159 Not Supported
H6b Vertical Collaboration 0.092 Not Supported
H6c Operational Collaboration 0.559 Not Supported
Notes:Underlined values indicate statistical significance at α=0.05.
126
REFERENCES
[1] Abeysekera, I. (2007). Intellectual capital reporting between a developing and
developed nation. Journal of Intellectual Capital, 8(2), pp. 329-345.
[2] Abramovsky, L., Kremp, E., Lopez, A., Schmidt, T., and Simpson, H. (2009).
Understanding co-operative innovative activity: evidence from four European
countries. Journal of Economics of Innovation and New Technology, 18(3), pp. 243-
265.
[3] Adrian, A. (2008). Intellectual Capital in the World of Information Economies.
Journal of Commercial Law and Technology, 3(4), pp. 242-246.
[4] Akçay, A.E., Ertek, G., and Büyüközkan, G. (2012). Analyzing the solutions of DEA
through information visualization and data mining techniques: SmartDEA framework.
Expert Systems with Applications, 39, pp. 7763–7775.
[5] Alpkan, L., Bulut, C., Gunday, G., Ulusoy, G., and Kılıc, K. (2010). Organizational
Support for Intrapreneurship and its Interaction with Human Capital to enhance
Innovative Performance. Journal of Management Decision, 48(5-6), pp. 732-755.
[6] Alpkan, L., Ceylan, A. and Aytekin, M. (2003). Performance impacts of operations
strategies: a study on Turkish manufacturing firms. International Journal of Agile
Manufacturing, 6, pp. 57-65.
[7] Alpkan, L., Yılmaz, C., and Kaya, N., (2007). Market Orientation and Planning
Flexibility in SMEs: Performance Implications and an Empirical Investigation.
International Small Business Journal, 25, pp. 152-172.
[8] Arto, J.R.V., and Monroy, C.R. (2009). Let others manufacture! Towards a new
manufacturing network. Journal of Intangible Capital, 5(4), pp. 347-369.
[9] Bahinipati, B.K., Kanda, A., and Deshmukh, S.G. (2009). Horizontal collaboration in
semiconductor manufacturing industry supply chain: An evaluation of collaboration
intensity index. Journal of Computers & Industrial Engineering, 57, pp. 880–895.
[10] Barney, J.B. (1986). Organizational Culture: Can It Be a Source of Sustained
Competitive Advantage? The Academy of Management Review, 11(3), pp. 656-665.
[11] Beers, C., Berghall, E., and Poot, T. (2008). R&D internationalization, R&D
collaboration and public knowledge institutions in small economies: Evidence from
Finland and the Netherlands. Research Policy, 37, pp. 294-308.
127
[12] Bellora, L., & Guenther, T.W. (2013). Drivers of Innovation capital disclosure in
intellectual capital statements: Evidence from Europe. The British Accounting
Review, 45, pp. 255-270.
[13] Bernhardt, D.C. (1994). ‘I want it fast, factual, actionable’ – Tailoring Competitive
Intelligence to Executives’ Needs. Long Range Planning Journal, 27(1), pp. 12-24.
[14] Bogers, M. (2011). The open innovation paradox: knowledge sharing and protection in
R&D collaborations. European Journal of Innovation Management, 14(1), pp. 93-117.
[15] Bose, R. (2008). Competitive intelligence process and tools for intelligence analysis.
Journal of Industrial Management & Data Systems, 108(4), pp. 510-528.
[16] Boyer, K.K. and Lewis, M.W. (2002). Competitive priorities: investigating the
need for trade-offs in operations strategy. Journal of Production and Operations
Management, 11, pp. 9–20.
[17] Buganza, T., and Verganti, R. (2009). Open innovation process to inbound knowledge:
Collaboration with universities in four leading firms. European Journal of Innovation
Management, 12(3), pp. 306-325.
[18] Calof, J.L. and Wright, S. (2008). Competitive intelligence: A practitioner, academic
and inter-disciplinary perspective. European Journal of Marketing, 42(7/8), pp. 717-
730.
[19] Camarinha-Matos, L.M., Afsarmanesh, H., Galeano, N., and Molina, A. (2009).
Collaborative networked organizations – Concepts and practice in manufacturing
enterprises. Journal of Computers & Industrial Engineering, 57, pp. 46–60.
[20] Carmona-Lavado, A., Cuevas-Rodriguez, G., and Cabello-Medina, Carmen. (2010).
Social and organizational capital: Building the context for innovation. Journal of
Industrial Marketing Management, 39, pp. 681-690.
[21] Carmona-Lavado, A., Cuevas-Rodriguez, G., and Cabello-Medina, Carmen. (2013).
Service Innovativeness and Innovation Success in Technology-based Knowledge-
Intensive Business Services: An Intellectual Capital Approach. Journal of Industry and
Innovation, 20(2), pp. 133-156.
[22] Castro, G.M., Delgado-Verde, M., Navas-Lopez, J.E., and Cruz-Gonzalez, J. (2013).
The moderating role of innovation culture in the relationship between knowledge
assets and product innovation. Journal of Technological Forecasting & Social Change,
80, pp. 351–363.
[23] Chang, C.H., and Chen, Y.S. (2012). The determinants of green intellectual capital.
Journal of Management Decision, 50(1), pp.74-94.
128
[24] Chesbrough, H. (2010). Business Model Innovation: Opportunities and Barriers.
Journal of Long Range Planning, 43, pp. 354-363.
[25] Claver, E., Llopis, J., Garcia, D., and Molina, H. (1998). Organizational Culture for
Innovation and New Technological Behaviour. The Journal of High Technology
Management Research, 9(1), pp. 55-68.
[26] Conover, W. J. (1998). Practical nonparametric statistics. John Wiley & Sons.
[27] Cooper, W.W., Seiford, L.M., and Tone, K., (2006).Introduction to Data Envelopment
Analysis and Its Uses: With DEA Solver Software and References. Springer, New
York.
[28] Curado, C. and Henriques, L. (2011). Intellectual Capital disclosure payback. Journal
of Management Decision, 49(7), pp. 1080-1098.
[29] Czarnitzki, D., Ebersberger, B. and Fier, A. (2007). The relationship between R&D
Collaboration, subsidies and R&D performance: Empirical evidence from Finland and
Germany. Journal of Applied Econometrics, 22, pp. 1347–1366.
[30] D’este, P., Iammarino, S., Savona, M., and Tunzelmann, N. (2011). What hampers
innovation? Revealed barriers versus deterring barriers. Journal of Research Policy,
41, pp. 482-488.
[31] Demirbas, D., Hussain, J.G., and Matlay, H. (2011). Owner-managers’ perceptions of
barriers to innovation: empirical evidence from Turkish SMEs. Journal of Small
Business and Enterprise Development, 18(4), pp. 764-780.
[32] Ding, Y., and Li, G. (2010). Study on the Management of Intellectual Capital.
International Journal of Business and Management, 5(2), pp. 213-216.
[33] Drejer, I., and Vinding, A.L. (2007). Searching Near and Far: Determinants of
Innovative Firms' Propensity to Collaborate Across Geographical Distance. Journal of
Industry and Innovation, 14(3), pp. 259-275.
[34] Drucker (2002). The Discipline of Innovation. Harvard Business Review.
[35] Drucker, P.F., (1985). Innovation and Entrepreneurship. Oxford, Butterworth-
Heinemann.
[36] Echebarria, C., and Barrutia, J.M. (2011). Limits of Social Capital as a Driver of
Innovation: An Empirical Analysis in the Context of European Regions. Journal of
Regional Studies, 47(7), pp. 1001-1017.
[37] Elmquist, M., Fredberg, T., and Ollila, S. (2009). Exploring the field of open
innovation. European Journal of Innovation Management, 12(3), pp. 326-345.
129
[38] European Commission Communication, (1996). Living and working in the
information society: People first. COM, (Green Paper), Jul, 389.
[39] Fagerland, M.W. and Sandvik L. (2009). The Wilcoxon–Mann–Whitney test under
scrutiny. Statistics in Medicine, 28, pp. 1487-1497.
[40] Farsi, J.Y., Rezazadeh, A., and Najmabadi, A.D. (2013). Social Capital and
Organizational innovation: the mediating effect of entrepreneurial orientation. Journal
of Community Positive Practices, 13(2), pp. 22-40.
[41] Felzenstein, C., Gimmon, E., and Carter, S. (2010). Geographical Co-Location, Social
Networks and Inter-firm Marketing Co-operation: the Case of the Salmon Industry.
Journal of Long Range Planning, 43, pp. 675-690.
[42] Fortuin, F.T.J.M. (2009). Innovation drivers and barriers in food processing. British
Food Journal, 111(8), pp. 839-851.
[43] Foxon, T., and Pearson, P. (2008). Overcoming barriers to innovation and diffusion of
cleaner technologies: some features of a sustainable innovation policy regime. Journal
of Cleaner Production, 16(1), pp. 148-161.
[44] Gaten, T. (2000). Kruskal-Wallis non-parametric ANOVA. Retrieved from
http://www.le.ac.uk/bl/gat/virtualfc/Stats/kruskal.html on 14.07.2014
[45] Gattoufi, S., Oral, M. and Reisman, A. (2004a). A taxonomy for data envelopment
analysis. Journal of Socio-Economic Planning Sciences, 34(23), pp. 141-158.
[46] Gattoufi, S., Oral, M., Kumar, A. and Reisman, A. (2004b). Content analysis of data
envelopmentanalysis literature and its comparison with that of other OR/MS fields.
Journal of the Operational Research Society, 55, pp. 911-935.
[47] Gellynck, X., and Kühne, B. (2010). Horizontal and Vertical Networks for Innovation
in the Traditional Food Sector. International Journal of Food System Dynamics, 2,
pp. 123‐132.
[48] Giesen, E., Berman, S.J., Bell, R., and Blitz, A. (2007). Three ways to successfully
innovate your business model. Journal of Strategy & Leadership, 35(6), pp. 27-33.
[49] Gunday, G. (2007). Innovation models and implementations at firm level in
manufacturing industry. [Master Thesis, Sabanci University]
[50] Gunday, G., Ulusoy, G., Kilic K. & Alpkan L. (2011). Effects of innovation types on
firm performance. International Journal of Production Economics, 133, pp. 662-676.
[51] Guo, W.C., Shiah-Hou, S.R., and Chien, W.J. (2012). A study on intellectual capital
and firm performance in biotech companies. Applied Economics Letters, 19, pp.
1603–1608.
130
[52] Gülcan, Y., Akgüngör, S., and Kuştepeli, Y. (2011). Knowledge Generation and
Innovativeness in Turkish Textile Industry: Comparison of Istanbul and Denizli.
Journal of European Planning Studies, 19(7), pp. 1229-1243.
[53] Hair, J.F., Anderson, R.E., Tatham, R.L. and Black, W.C., (2006). Multivariate Data
Analysis: With Readings. Pearson Prentice Hall, 6th edition.
[54] Hawkins, D., and Little, B. (2011). Embedding collaboration through standards.
Journal of industrial and commercial training, 43(2), pp. 106-112.
[55] Henderson, R.M., and Clark, K.B. (1990). Architectural Innovation: The
Reconfiguration of Existing Product Technologies and the Failure of Established
Firms. Administrative Science Quarterly, 35(1), pp. 9-30.
[56] Hingley, M., Lindgreen, A., Grant, D.B., and Kane, C. (2011). Using fourth-party
logistics management to improve horizontal collaboration among grocery retailers.
Supply Chain Management: An International Journal, 16(5), pp. 316–327.
[57] Hornsby, J.S., Kuratko, D.F., and Zahra, S.A. (2002). Middle managers’ perception of
the internal environment for corporate entrepreneurship: assessing a measurement
scale. Journal of Business Venturing, 17, pp. 253–273.
[58] Hornsby, J.S., Naffziger, D.W., Kuratko, D.F., and Montagno, R.V. (1993). An
Interactive Model of the Corporate Entrepreneurship Process. Entrepreneurship
Theory and Practice, pp. 29-37.
[59] Hsu C., and Sabherwal R. (2012). Relationship between Intellectual Capital and
Knowledge Management: An Empirical Investigation. Journal of Decision Sciences,
43(3), pp.489-524.
[60] Ili, S., Albers, A., and Miller, S. (2010). Open innovation in the automotive Industry.
Journal of R&D Management, 40(3), pp. 246-255.
[61] Jaworski, B.J. and Kohli A.K. (1993). Market orientation: antecedents and
consequences. Journal of Marketing, 57(3), pp. 53-70.
[62] Jaworski, B.J., Macinnis, D.J., and Kohli, A.K. (2002). Generating Competitive
Intelligence in Organizations. Journal of Market-Focused Management, 5, pp. 279–
307.
[63] Kathuria, R. (2000). Competitive priorities and managerial performance: a
taxonomy of small manufacturers. Journal of Operations Management, 18, pp. 627-
641.
131
[64] Khazanchi, S., Lewis, M. W., and Boyer, K. K (2007). Innovation-supportive culture:
the impact of organizational values on process innovation. Journal of Operations
Management, 25, pp. 871–884.
[65] Koberg, C.S., Uhlenbruck, N., and Sarason, Y. (1996). Facilitators of Organizational
Innovation: The Role of life-cycle stage. Journal of Business Venturing, 11, pp. 133-
149.
[66] Kong, E., and Thomson, S.B. (2009). An intellectual capital perspective of human
resource strategies and practices. Journal of Knowledge Management Research &
Practice, 7, pp. 356–364.
[67] Kujansivu, P. and Lönnqvist, A. (2007). Investigating the value and efficiency of
intellectual capital. Journal of Intellectual Capital, 8(2), pp. 272-287.
[68] Kuratko D.F., Montagno, R.V., and Hornsby, J.S. (1990). Developing an
Intrapreneurial Assessment Instrument for an Effective Corporate Entrepreneurial
Environment. Strategic Management Journal, 11, pp. 49-58.
[69] Lawrence, O., Goldwasser, C., Choate, K., and Blitz, A. (2008). Collaborative
innovation throughout the extended enterprise. Journal of Strategy & Leadership,
36(1), pp. 39-45.
[70] Leiponen, A., and Byma, J. (2009). If you cannot block, you better run: Small firms,
cooperative innovation, and appropriation strategies. Research Policy, 38, pp. 1478–
1488.
[71] Lhuillery, S., and Pfister, E. (2009). R&D cooperation and failures in innovation
projects: Empirical evidence from French CIS data. Research Policy, 38, pp. 45–57.
[72] Link, A.N., and Ruhm, C.J. (2011). Public knowledge, private knowledge: the
intellectual capital of entrepreneurs. Journal of Small Business and Economics, 36, pp.
1–14.
[73] Longo, M., and Mura, M. (2011). The effect of intellectual capital on employees’
satisfaction and retention. Journal of Information & Management, 48, pp. 278-287.
[74] Lopez-Cabrales, A., Real, J.C., and Valle, R. (2010). Relationships between human
resource management practices and organizational learning capability. Journal of
Personnel Review, 40(3), pp. 344-363.
[75] Lööf, H. (2009). Multinational enterprises and innovation: firm level evidence on
spillover via R&D collaboration. Journal of Evolutionary Economics, 19, pp. 41–71.
132
[76] Luno, A.P., Medina, C.C., Lavado, A.C., and Rodriguez G.C. (2011). How social
capital and knowledge affect innovation. Journal of Business Research, 64, pp. 1369-
1376.
[77] MacCormack, A., Forbath, T., Brooks, P., and Kalaher, P. (2007). Innovation through
Global Collaboration: A New Source of Competitive Advantage. Harvard Business
Case study, Retrieved from http://i-n-w.org/talking_collaboration/innovation.pdf on
12.07.2014.
[78] Madrid-Guijarro, A., Garcia, D., and Auken H.V. (2009). Barriers to Innovation
among Spanish Manufacturing SMEs. Journal of Small Business Management, 47(4),
pp. 465–488.
[79] Mann, H. B. & Whitney, D. R. (1947). On a test of whether one of two random
variables is stochastically larger than the other. The Annals of Mathematical Statistics,
18(1), p. 50-60.
[80] Marcin, K. (2013). Intellectual Capital as a Key Factor of Socio-Economic
Development of Regions and Countries. Procedia Economics and Finance, 6, pp. 288
– 295.
[81] Martins, E.C., and Terblanche, F. (2003). Building organizational culture that
stimulates creativity and innovation. European Journal of Management, 6(1), pp. 66-
74.
[82] Menon, A., Bharadwaj, S., Adidam, P. and Edison S.(1999) Antecedents and
consequences of marketing strategy making. Journal of Marketing, 63(2), pp. 18–40.
[83] Mention, A.L. (2012). Intellectual Capital, Innovation and Performance: a Systematic
Review of the Literature. Business and Economic Research, 2(1), pp. 1-37.
[84] Meredith, J. R., Raturi, A., Amoako-Gyampah, K., and Kaplan, B., (1989). Alternative
research paradigms in operations. Journal of Operations Management, 8(4), pp. 297 -
326.
[85] Metze, T., and Levelt, M. (2012). Barriers to Credible Innovations: Collaborative
Regional Governance in the Netherlands. The Innovation Journal: The Public Sector
Innovation Journal, 17(1), pp. 1-15.
[86] Molodchik, M.A., Shakina, E.A., and Andreevna, A. (2012). Intellectual Capital
Transformation Evaluating Model. Journal of Intellectual Capital, 13(4), pp. 444-461.
[87] Monroy, C.R., and Arto, J.R.V. (2010). Analysis of global manufacturing virtual
networks in the aeronautical industry. International Journal of Production Economics,
126, pp. 314–323.
133
[88] Moodysson, J., and Jonsson, O. (2007). Knowledge Collaboration and Proximity: The
Spatial Organization of Biotech Innovation Projects. Journal of European Urban and
Regional Studies, 14(2), pp. 115-131.
[89] Morrison, E.W., Robinson, S.L. (1997). When Employees Feel Betrayed: A Model of
How Psychological Contract Violation Develops. The Academy of Management
Review, 22(1), pp. 226-256.
[90] Mura, M., Lettieri, E., Spiller, N., and Radaelli, G. (2012). Intellectual Capital and
Innovative Work Behaviour: Opening the Black Box. International Journal of
Engineering Business Management, 4(39), pp. 1-10.
[91] Musteen, M., and Ahsan, M. (2011). Beyond Cost: The Role of Intellectual Capial in
Offshoring and Innovation in Young Firms. Journal of Entrepreneurship and Practice,
pp. 421-434.
[92] Nagappan, N., Murphy B. and Basili V.R. (2008). The Influence of Organizational
Structure on Software Quality: An Empirical Case Study. 30th International
Conference on Software Engineering.
[93] Nair, A. and Boulton, R. W. (2008). Innovation-oriented operations strategy typology
and stage-based model. International Journal of Operations & Production
Management, 28(8), pp. 748-771.
[94] Naranjo-Valencia, J.C., Jimenez-Jimenez, D., and Sanz-Valle, R. (2011). Innovation
or imitation? The role of organizational culture. Journal of Management Decision,
49(1), pp. 55-72.
[95] Nieto, M.J., and Santamaria, L. (2007). The importance of diverse collaborative
networks for the novelty of product innovation. Technovation, 27, pp. 367–377.
[96] Nieto, M.J., and Santamaria, L. (2010). Technological Collaboration: Bridging the
Innovation Gap between Small and Large Firms. Journal of Small Business
Management, 48(1), pp. 44–69.
[97] Noble, M.A. (1997). Manufacturing competitive priorities and productivity: an
empirical study. International Journal of Operations & Production Management, 17,
pp. 85-99.
[98] O’Reilly, C.A., Chatman, J. and Caldwell, D.F. (1991). People and Organizational
Culture: A Profile Comparison Approach to Assessing Person-Organization Fit. The
Academy of Management Journal, 34(3), pp. 487-516.
[99] OECD, ‘Oslo Manual: Proposed Guidelines for Collecting and Interpreting
Technological Innovation Data, OECD Publications, Paris, 2005.
134
[100] Olson, E.M., Slater, S.F. and Hult, G.T.M. (2005). The performance implications
of fit among business strategy, marketing organization structure, and strategic
behaviour. Journal of Marketing, 69(3), pp. 49-65.
[101] Orange [Software]. http://orange.biolab.si/open-source/
[102] Parida, V., Westerberg, M., and Frishammar, J. (2012). Inbound Open Innovation
Activities in High-Tech SMEs: The Impact on Innovation Performance. Journal of
Small Business Management, 50(2), pp. 283–309.
[103] Prescott, J.E. (1999). The Evolution of Competitive Intelligence. Journal of Proposal
Management, pp. 37-52.
[104] Qiu, T. (2008). Scanning for competitive intelligence: a managerial perspective.
European Journal of Marketing, 42(7/8), pp. 814-835.
[105] Reniers, G., Dullaert, W., and Visser, L. (2010). Empirically based development of a
framework for advancing and stimulating collaboration in the chemical industry
(ASC): creating sustainable chemical industrial parks. Journal of Cleaner Production,
18, pp. 1587-1597.
[106] Rouach, D., and Santi, P. (2001). Competitive Intelligence Adds Value: Five
Intelligence Attitudes. European Management Journal, 19(5), pp. 552–559.
[107] Ruta, C.D. (2009). HR Portal Alignment for the creation and development of
intellectual capital. The International Journal of Human Resource Management, 20(3),
pp. 562-577.
[108] Santamaria, L., and Surroca, J. (2011). Matching the Goals and Impacts of R&D
Collaboration. European Management Review, 8, pp. 95–109.
[109] Schein E.H. (1984). Coming to a New Awareness of Organizational Culture. Sloan
Management Review, 25(2), pp. 3-16.
[110] Schumpeter, J.A., (1934). The Theory of Economic Development. An Inquiry into
Profits, Capital, Credit, Interest, and the Business Cycle. Cambridge, Harvard
University Press.
[111] Segarra-Blasco, A., and Arauzo-Carod, J.M. (2008). Sources of innovation and
industry–university interaction: Evidence from Spanish firms. Research Policy, 37, pp.
1283–1295.
[112] Serrano, V., and Fischer, T. (2007). Collaborative innovation in ubiquitous systems.
Journal of Intelligent Manufacturing, 18, pp. 599–615.
[113] Shapiro, S. S. & Wilk, M. B. (1965). An analysis of variance test for normality
(complete samples). Biometrika, 52(3/4), p. 591-611.
135
[114] Shorr, B. (2010). 10 Reasons why companies resist innovation. Retrieved from
http://blog.straightnorth.com/10-reasons-why-companies-resist-innovation/ on
14.07.2014.
[115] Soosay, C.A., Hyland, P.W., and Ferrer, M. (2008). Supply chain collaboration:
capabilities for continuous innovation. Supply Chain Management: An International
Journal, 13(2), pp. 160–169.
[116] Spearman, C. (1904). The Proof and Measurement of Association between Two
Things. The American Journal of Psychology, 15(1), pp. 72-101.
[117] Spence, M.M., Maning, L.M., and Crick, D. (2008). An investigation into the use of
collaborative ventures in the internationalization of high performing Canadian SMEs.
European Management Journal, 26, pp. 412–428.
[118] SPSS (Version 20) [Software]. http://www-01.ibm.com/software/analytics/spss/
[119] Subramanian, A.M. (2012). A Longitudinal Study of the Influence of Intellectual
Human Capital on Firm Exploratory Innovation. IEEE Transactions on Engineering
Management, 59(4), pp.540-549.
[120] Subramaniam, M. and Youndt, M.A (2005). The influence of intellectual capital on
the types of innovative capabilities. Academy of Management Journal, 48, pp. 450-
463.
[121] Sundbo, J. (1999). Empowerment of employees in small and medium-sized service
firms. Journal of Employee Relations, 21(2), pp.105-127.
[122] Teo, T.S.H., and Choo, W.Y. (2001). Assessing the impact of using the Internet for
competitive intelligence. Journal of Information & Management, 39, pp. 67-83.
[123] Tomlinson, P.R. (2010). Co-operative ties and innovation: Some new evidence for UK
manufacturing. Research Policy, 39, pp. 762–775.
[124] Tsai, K.H. (2009). Collaborative networks and product innovation performance:
Toward a contingency perspective. Research Policy, 38, pp. 765–778.
[125] Ulusoy, G., Kılıç, K., Günday, G., Alpkan, L., (2014). A determinants of
innovativeness model for manufacturing firms. Accepted for publication, International
Journal of Innovation and Regional Development.
[126] Van den Ende, J., Wijnberg, N., Vogels, R. and Kerstens, M. (2003). Organizing
Innovative Projects to Interact with Market Dynamics: A Coevolutionary Approach.
European Management Journal, 21(3), pp. 273-284.
136
[127] Vargas-Hernandez, J.G., and Noruzi M.R. (2010). How Intellectual Capital and
Learning Organization can Foster Organizational Competitiveness?. International
Journal of Business and Management. 5(4), pp.183-193.
[128] Vickery, S.K., Droge, C. and Markland, R.E. (1993). Production competence and
business strategy: do they affect business performance?. Decision Science, 24, pp.
435-455.
[129] Vrande, V., Jong, J.P.J., Vanhaverbeke, W., and Rochemont, M. (2009). Open
innovation in SMEs: Trends, motives and management challenges. Technovation, 29,
pp. 423–437.
[130] Waite, P., and Williams, P. (2009). Collaboration or opportunism? The role of social
capital in developing successful export clusters. Journal of Strategic Marketing, 17(6),
pp. 499-512.
[131] Walker, O. C. and Robert W. R. (1987). Marketing’s role in the implementation
of business strategies: a critical review and conceptual framework. Journal of
Marketing, 51 (3), pp. 15–33.
[132] Wang, D., and Chen S. (2013). Does Intellectual Capital matter? High performance
work systems and bilateral innovative capabilities. Journal of Manpower, 34(8),
pp.861-879.
[133] Ward, P.T., McCrery, J.K., Ritzman, L.P. and Sharma, D. (1998). Competitive
priorities in operations management. Decision Sciences, 29, pp. 1035-1046.
[134] Weaver, R.D. (2008). Collaborative Pull Innovation: Origins and Adoption in the New
Economy. Agribusiness Journal, 24(3), pp. 388–402.
[135] Wright, S., Pickton, D.W., and Callow, J. (2002). Competitive intelligence in UK
firms: a typology. Journal of Marketing Intelligence & Planning, 20(6), pp. 349-360.
[136] Wu, W.Y., Chang, M.L., and Chen, C.W. (2008). Promoting innovation through the
accumulation of intellectual capital, social capital, and entrepreneurial orientation.
Journal of R&D Management, 38(3), pp. 265-277.
[137] Wu, X., and Sivalogathasan, V. (2013). Intellectual Capital for Innovation Capability:
A Conceptual Model for Innovation. International Journal of Trade, Economics and
Finance, 4(3), pp.139-144.
[138] Yworks [Software]. http://www.yworks.com/en/index.html
[139] Zeng, S.X., Xie, X.M., and Tam, C.M. (2010). Relationship between cooperation
networks and innovation performance of SMEs. Technovation, 30, pp. 181–194.
137
[140] Zerenler, M., Hasiloglu, S.B., and Sezgin, M. (2008). Intellectual Capital and
Innovation Performance: Empirical Evidence in the Turkish Automotive Supplier.
Journal of Technology Management and Innovation, 3(4), pp. 31-40.
[141] Zheng W., Yang, B. and McLean G.N. (2010). Linking organizational culture,
structure, strategy, and organizational effectiveness: Mediating role of knowledge
management. Journal of Business Research, 63, pp. 763-771.
[142] Zhu, Y., Wittman, X., and Peng, M.W. (2012). Institution-based barriers to innovation
in SMEs in China. Asia Pacific Journal of Management, 29, pp. 1131-1142.