Embed Size (px)
Citation preview

INORGANIC AMENDMENTS AS PUTTING GREEN CONSTRUCTION
MATERIALS
by
Douglas J. Soldat
A thesis submitted in partial fulfillment of the
requirements for a degree of
Master of Science
(Soil Science)
at the
UNIVERSITY OF WISCONSIN – MADISON
2003

ii
AKNOWLEDGEMENTS
Deepest appreciation is expressed to Dr. Wayne R. Kussow for his encouragement,
support, and guidance throughout the course of this project. He is a master of teaching by
example, and I have learned much more from watching him in the last two years than I
have in any classroom. I would also like to thank Dr. Birl Lowery and Dr. Phillip Barak for
serving on my MS committee, supplying laboratory space and materials, and for their
valuable contributions to this research project.
I am very grateful to my family for supporting me throughout my graduate studies
at the University of Wisconsin. There is nothing more relaxing than a weekend on the boat.
I would also like to thank my fiancée, Sarah, for all of her help and understanding,
especially near the end of the project. It is hard to imagine my life without her.
Finally, sincere appreciation is expressed to the members of the Wisconsin
Turfgrass Association (WTA) for the establishment of the Wayne R. Kussow Wisconsin
Distinguished Fellowship which has supported me financially for the last two years. The
unwavering dedication of the WTA to supporting turfgrass research and education makes
the University of Wisconsin a national leader in those fields.

iii
TABLE OF CONTENTS
PAGE ACKNOWLEDGMENTS ii TABLE OF CONTENTS iii LIST OF FIGURES iv LIST OF TABLES v ABSTRACT 1 LITERATURE REVIEW 2 METHODS
Field Methods 16Laboratory Methods 24Greenhouse Methods 32
RESULTS AND DISCUSSION
Root Zone Mix Properties 35Greenhouse Observations 49Field Results
Bentgrass Establishment 61Leachate Analysis 63Soil Tests 79Plant Parameters 80
SUMMARY AND CONCLUSIONS
Agronomic Merits of the Root Zone Amendments 90Environmental Merits of the Root Zone Amendments 91Economic Merits of the Root Zone Amendments 92
BIBLIOGRAPHY 96 APPENDIX 100

iv
LIST OF FIGURES
PAGEFigure 1. Cation exchange capacity of peat as a function of pH. 40Figure 2. Moisture release properties of root zone mixes. 43Figure 3. Affinity of amendments and pure sand for K. 45Figure 4. P sorption capacities of root zone mixes. 47Figure 5. Relationship between desorbable P and total P leached in
2002. 48
Figure 6. Root zone mix effects on establishment rating (greenhouse study).
50
Figure 7. Root zone mix effects on color rating (greenhouse study). 51Figure 8. Root zone mix effects on clipping yield (greenhouse study). 52Figure 9. Mean root zone mix volumetric water content at 2.5 cm (1
in.) over 48-hour period (greenhouse study). 55
Figure 10. Mean root zone mix volumetric water content at 7.6 cm (3 in.) over 48-hour period (greenhouse study).
56
Figure 11. Mean root zone mix volumetric water content at 12.7 cm (5 in.) over 48-hour period (greenhouse study).
57
Figure 12. Mean root zone mix volumetric water content at 17.8 cm (7 in.) over 48-hour period (greenhouse study).
58
Figure 13. Mean root zone mix volumetric water content at 22.9 cm (9 in.) over 48-hour period (greenhouse study).
59
Figure 14. Mean root zone mix volumetric water content at 28.0 cm (11 in.) over 48-hour period (greenhouse study).
60
Figure 15. Root zone mix effects on concentrations of P in leachate over time.
78
Figure 16. Relationship between soil Bray-1 K and %K in turfgrass tissue on 3 sampling dates.
83
Figure 17. Cost of root zone mixes and amendments for a typical 19-green construction project.
94
v
LIST OF TABLES
PAGETable 1. Recommended particle size distribution of a USGA root
zone mix. 4
Table 2. Recommended physical properties of a USGA root zone mix.
4
Table 3. Select physical and chemical properties of peat. 8Table 4. Select physical and chemical properties of zeolites and
calcined clays. 8
Table 5. Cation exchange capacity of Profile®. 10Table 6. 2002 field fertilization schedule. 18Table 7. Particle size distribution of the root zone mixes and
topdressing sand used. 25
Table 8. Physical and chemical properties of the root zone mixes used.
37
Table 9. Root zone mix effects on laboratory determined Ksat and field infiltration rates.
37
Table 10. Physical and chemical properties of the amendments and construction sand used.
39
Table 11. Particle size distribution of the root zone amendments. 42Table 12. Root zone mix effects on nutrient leaching (greenhouse
study). 54
Table 13. Volumetric water content of root zone mixes as a function of depth (greenhouse study).
54
Table 14. Root zone mix effects on turf color, density, and root mass density during establishment period (15 May 2002 – 5 Aug. 2002).
62
Table 15. Root zone mix effects on N leaching during establishment period (15 May 2002 – 5 Aug. 2002).
66
Table 16a. Nitrogen leached as NO3- in 2002. 67
Table 16b. Nitrogen leached as NO3- in 2003. 67
Table 17a. Leachate volumes collected in 2002. 69Table 17b. Leachate volumes collected in 2003. 69Table 18a. Summary of NO3-N leaching concentrations during
establishment period in 2002. 71
Table 18b. Summary of NO3-N leaching concentrations following establishment period in 2002.
71
Table 18c. Summary of NO3-N leaching concentrations in 2003. 72Table 19a. Nitrogen leached as NH4
+ in 2002. 74Table 19b. Nitrogen leached as NH4
+ in 2003. 74Table 20a. Potassium leached in 2002. 75Table 20b. Potassium leached in 2003. 75

vi
LIST OF TABLES (continued) PAGETable 21a. Phosphorus leached in 2002. 77Table 21b. Phosphorus leached in 2003. 77Table 22. Soil Bray-1 K for sampling dates in 2003. 81Table 23. University of Wisconsin soil test interpretations for golf turf. 81Table 24. Soil Bray-1 P for sampling dates in 2003. 82Table 25. Changes in root zone mix pH over time. 82Table 26. Root zone mix effects on bentgrass clipping yields for 2002. 85Table 27. Bentgrass quality ratings for 2002 and 2003. 85Table 28a. Bentgrass color ratings in 2002. 86Table 28b. Bentgrass color ratings in 2003. 86Table 29. Root zone volumetric moisture content means for sampling
dates in 2002 and 2003. 88

ABSTRACT
Recently, interest has arisen in the use of inorganic materials as amendments to
sand-matrix golf course putting greens because of their ability to hold water and nutrients.
This study was conducted to determine the agronomic, environmental, and economic
advantages and disadvantages of using AgriBoost (phillipsitic zeolite), Profile (calcined
clay), or GSA ZK406H (clinoptilolitic zeolite) in place of Canadian sphagnum peat moss
in sand-matrix putting greens. A pure sand control was also included in the study. An
experimental putting green was built in Verona, WI in the fall of 2001 and seeded with
creeping bentgrass (Agrostis palustris Huds.) in the spring of 2002. Root zone mixes had
their relevant physical and chemical properties characterized in the laboratory. Several
agronomic responses to the root zone mixes were recorded in the field. Leachate was
collected periodically from each plot and analyzed for N, P, and K concentration. An
economic analysis was conducted paying attention to root zone mix cost and differences in
water, pesticide, or fertilizer use among mixes. During the establishment period, the GSA
ZK406H treatment significantly reduced NO3-N leaching compared to the peat treatment.
The AgriBoost treatment significantly reduced P leaching compared to all other treatments
over the course of the study. The AgriBoost and peat treatments improved bentgrass
establishment compared to all other treatments. The Profile and GSA ZK406H treatments
improved bentgrass establishment compared to pure sand. After establishment, few
agronomic differences between treatments existed. An economic analysis revealed that the
use of inorganic amendments in place of peat is not justified based on agronomic responses
alone. The initial cost of the root zone mixes was too high. However, the use of inorganic
amendments in place of peat is warranted in a situation where a reduction in N or P
leaching is necessary.

LITERATURE REVIEW
In 1999, 12.3 million rounds of golf were played on 454 golf courses in Wisconsin
for an average yearly play volume of over 27,000 rounds per course (University of
Wisconsin – Extension, 1999). It is not uncommon for a busy municipal golf course to
incur foot traffic from over 40,000 rounds per year. Theoretically, over 75% of the shots
taken in a round of golf are either played on or to the putting green surface. A typical 18-
hole golf course has a par of 72. Two putts on each green are assumed in calculating par.
Adding the 36 putts to the 18 shots required to reach each of the greens makes for at total
of 54 shots out of 72 that are played on or to the green. Thus, a large portion of the play
volume is concentrated on the putting greens, which typically make up less than 2% of the
total golf course area (Beard, 2002). This large volume of play on a relatively small total
area establishes the need for a growth medium that fosters maintenance of high quality turf
on a heavily trafficked area.
The United States Golf Association (USGA) recognized the need for compaction
resistant putting greens over 40 years ago and, in 1960, (USGA, 1960) published
specifications for constructing putting greens that could withstand heavy traffic and
support healthy turfgrass. These specifications were largely based upon the research of Dr.
Marvin H. Ferguson of Texas A & M College. Several revisions to the original 1960
specifications have been made over the years, the most recent being in 1993 (USGA,
1993).
The USGA-style putting green consists of a sub-grade, subsurface drainage system,
a gravel blanket, intermediate coarse sand layer, and root zone mix. The sub-grade is

thoroughly compacted and graded to conform to the contours of the finished putting green.
A 10-cm deep pea gravel blanket with embedded drainage pipe overlays the sub-grade.
Depending on the particle size distribution of the gravel, a 5- to 10-cm intermediate coarse
sand layer may or may not be needed between the gravel layer and the root zone mix to
prevent downward migration of the mix. The root zone mix is 30 cm in depth and should
fall within the particle size limits listed in Table 1 and the physical properties in Table 2.
The purpose of these specifications is to create putting greens with high drainage rates,
compaction resistance, and porosity favorable for turfgrass growth.
By layering the finer textured root zone mix over the coarse intermediate sand and
gravel layer, a differential in matric potential is created and an accumulation of water
occurs at the root zone mix/gravel layer interface until saturation and drainage occur. The
effectiveness of such textural discontinuities in increasing the moisture retention in the root
zone mix has been demonstrated. Taylor and others (1993) set up 30 cm of a uniform root
zone mix overlaying three different coarse-textured sublayers and a control consisting of
the root zone mix over subsoil alone. The coarse-textured sublayers were 5 cm of sand
over 10 cm of gravel, 15 cm of gravel, and 15 cm of sand. Tensiometers were used to
measure soil water matric potential at 2- and 28-cm depths below the surface. The root
zones were saturated and after 48 hours of drainage, the matric potential of the root zone
mix at the 28-cm depth over gravel only, sand + gravel, sand only, and subsoil were -11, -
17, -25, and -29 cm, respectively. At the 2-cm depth the matric potentials for the
corresponding root zone mixes were -3.68, -3.99, -4.78, and -5.20 kPa. This research
clearly demonstrates the effectiveness of the gravel or coarse sand + gravel layer
Table 1. Recommended particle size distribution of a USGA root zone mix.
Name Particle diameter Recommendation
mm
Fine Gravel 2.0 - 3.4 Not more than 10% of the total particles > 1.0mm, including a maximum of 3% fine gravel(preferably none)Very Coarse Sand 1.0 - 2.0
Coarse Sand 0.5 - 1.0 Minimum of 60% of the particles must fall inthe 0.25 to 1.0 mm range
Medium Sand 0.25 - 0.5
Fine Sand 0.15 - 0.25 Not more than 20% of the particles may be finesand
Very Fine Sand 0.05 - 0.15 Not more than 5% Not more than a total of10% of the particles mayfall within the < 0.002 to0.15 mm range
Silt 0.002 - 0.05 Not more than 5%
Clay < 0.002 Not more than 3%
Table 2. Recommended physical properties of a USGA root zone mix.
Physical Properties Recommended Range
Total porosity, % 35 - 55
Air-filled porosity, % 15 - 30
Capillary porosity, % 15 - 25
Saturated conductivity:
Normal range, cm hr-1 15 - 30
Accelerated range, cm hr-1 30 - 61
Organic matter content (weight basis)†, % 1 - 5
† Recommendation dropped in 1997 (USGA, 1997)
used in putting green construction in increasing moisture retention of the root zone mix,
particularly near the interface of the root zone mix/coarse-textured sublayer.
Generally, USGA specification greens have performed well in terms of drainage
rate and compaction resistance but, because of the high sand content of these greens,
adequate moisture in the top few inches and nutrient retention are limiting factors for
turfgrass growth. In an attempt to alleviate these problems, the USGA encourages the use
of organic material in root zone mixtures to increase water retention, add cation exchange
capacity (CEC), and increase porosity. The USGA no longer recommends a particular
range in organic matter content. Rather, the quantity recommended is that arrived at
through laboratory testing of sand and organic matter mixes for a combination that meets
porosity and saturated flow rate standards (USGA, 1997). According to the USGA (1993),
the organic material needs a minimum organic matter content of 85% by weight.
Reasoning that as the organic matter decomposes, soil pores can otherwise become
clogged with mineral matter and infiltration rates decline to unacceptable levels. Some
researchers have cast serious doubt on the utility of this specification by demonstrating that
a peat containing 65% organic matter can sustain very high quality turf (Kirkman, 1996;
Carlson et al., 1998).
Traditionally, the organic amendment of choice for putting green construction has
been peat (Waddington, 1992; Petrovic, 1993). Peat consists of partially decomposed plant
residues from various species. The two characteristics having the greatest effect on the
quality of the peat are (1) plant species and (2) decomposition stage (Mastalerz, 1977).
Sphagnum is the type of peat moss used most often for putting green construction. By

definition, sphagnum peat moss is composed of plants from the genus Sphagnum, contains
at least 90% organic matter on a dry weight basis and a minimum of 75% fiber (Reed,
1996). Kussow (1992) thoroughly characterized the physical and chemical properties of
five different types of peat with potential for use as root zone amendments. Included in the
survey were Manitoba sphagnum, Michigan sphagnum, reed sedge peat, Wisconsin peat,
and Iowa peat humus. The ranges in properties (Table 3) effectively demonstrate the
degree of variability of materials classified as peat.
Although adding sphagnum peat to a root zone mix increases the CEC of the mix,
researchers have shown that peat binds divalent cations such as Ca2+ and Mg2+ more tightly
than monovalent cations such as K+ (Salmon, 1964; Kussow, 1987). A potential K
management problem arises when irrigating a peat-amended root zone mix with Ca2+- and
Mg2+-laden water. Potassium is easily leached out of the root zone and the turfgrass may
become K-deficient unless frequent fertilizer K applications are made.
Another potential disadvantage to using peat moss is its limited stability. In high
temperature and rainfall regions such as the southeastern United States, the organic matter
incorporated into a sand-matrix green oxidizes rapidly and only a small percentage remains
after the first year (Sartain, 1995). Additionally, high quality peat moss can be exceedingly
costly to obtain in these southern regions due to the cost of transporting the material from
the major production sites in Canada.
For the reasons cited above, interest has arisen in the use of inorganic amendments
in sand-matrix greens. Inorganic amendments have physical characteristics similar to sand,
thereby retaining rapid drainage and compaction resistance while adding CEC and water

retention capacity. The two inorganic amendments that appear to have the greatest
potential as root zone amendments are zeolites and calcined clays. Select physical and
chemical properties of zeolites and calcined clays are listed in Table 4. In contrast to peat,
these two amendments have a preference for bonding K+ ions over Ca2+ ions (McCoy and
Stehouwer, 1998; Li et al., 2000). This, plus the characteristics shown in Table 4, suggests
that inorganic amendments are potential substitutes for organic amendments in sand-matrix
putting greens. Yet, due to a lack of research (especially long term), the USGA does not
recommend the use of inorganic amendments in putting green construction (USGA, 1993;
Moore, 1999).
Calcined clays are derived from expanding clays such as illite and montmorillinite.
The clay is heated to temperatures ranging from 260 – 980 ºC (Waltz and McCarty, 2000;
Bigelow et al., 2000), which permanently transforms the clay into stable, porous particles.
The heating temperature determines particle physical stability. The higher the temperature,
the more stable the resulting particle. Clays that are heated to temperatures near the upper
end of the range are referred to as porous ceramics. Calcined clays can be crushed and
screened to the size range required for use as an amendment in sand root zones. Research
on calcined clays in sand-matrix root zones dates back to the early 1960’s. During that
period, several researchers demonstrated that amending sands with calcined clays
decreases bulk density, increases pore space, percolation rate, infiltration rate, and water
retention (Beard, 1973). Waddington (1992) reported that although the addition of calcined
clay to sand does increase water holding capacity, much of that water is bound so tightly
that it is unavailable for turfgrass growth. Calcined clays are sometimes added to potting

Table 3. Select physical and chemical properties of 5 peats.†
Property Range
pH‡ 2.9 - 6.2
C: N ratio 16.7 - 54.9
Cation exchange capacity, cmol kg-1§ 74.6 - 141
Organic matter content, %¶ 64.4 - 94.6
Water-holding capacity, %# 32.8 - 59.8
Bulk density, g cm-3 0.13 - 0.29
† Adapted from Kussow (1992).‡ 1: 1 soil: dilute CaCl2.§ CEC, cation exchange capacity, pH 7 ¶ from total ash content# volume basis
Table 4. Select physical and chemical properties of zeolites and calcined clays.†
Property Zeolites Calcined Clays
pH 6.5 - 8.9 5 - 7
Cation exchange capacity, cmol kg-1 40 - 240 3 - 34
Water-holding capacity, % by volume 35 23 - 35
† Adapted from Bigelow et al. (2001), Ming and Bish (2001), and Richardson and Karcher (2001).

media in the greenhouse industry primarily to increase porosity, aeration, and drainage.
The resulting increase in CEC is of secondary importance, and the water holding capacity
is not considered a benefit in the greenhouse industry (Reed, 1996). Perhaps the most
important property of any particular calcined clay used for putting green construction is its
physical stability. Particle stability can be predicted in the laboratory by resistance to
physical and chemical breakdown. Field degradation of calcined clays has been reported
(Hummel, 1993a); resulting in pore space reductions, retarded infiltration rates, and
eventual putting green failure. Yet, other calcined clay products have been found intact in
root zones after 30 years (manufacturer claim). Many early studies on calcined clays were
focused on the effects the amendment had on aeration, compaction, and moisture retention
in root zone mixes. Nutrient retention effects are more recent considerations.
The clays from which the calcined clays are derived have CEC’s ranging from 30 -
100 cmol+ kg-1 while the CEC’s of calcined clays reportedly range from 3 - 34 cmol+ kg-1
(Reed, 1996; Li et al., 2000). The CEC values reported for Profile®, a porous ceramic
material used frequently as an inorganic amendment, vary by as much as 73% (Table 5).
Two recent studies have demonstrated the effects of calcined clays on nutrient
leaching. McCoy and Stehouwer (1998) found that calcined clay exhibits selectivity for K+
over Ca2+ on exchange sites. During calcination, the authors claim, the non-selective
interlayer exchange sites are eliminated and the remaining CEC is likely associated with
highly-K+ selective edge or wedge exchange sites. Similarly, Li and others (2000) found
that amending sand with porous ceramic clay (calcined clay) resulted in a 100% increase in
exchangeable K and a 4% decrease in exchangeable Ca compared to unamended sand. A

Table 5. Cation exchange capacity of Profile®.
Citation CEC Saturating solution Displacing solution pH
cmol kg-1
Li et al., 2000 33.6 1 M NH4OAc sum of cations 7.0
McCoy and Strehouwer, 1998 9.1 0.5 M HCl 0.5 M Ba(OAc)2 NR
Richardson and Karcher, 2001 24.0 1 M NH4OAc sum of cations 7.0

second leaching study (Bigelow et al., 2000) reported that as the percentage of calcined
clay increased in a root zone mixture, NH4-N leaching decreased. The authors concluded
that the decrease in NH4-N leaching was a direct result of the increase in the CEC of the
root zone mix. In the same study, amending sand with 20% calcined clay (v/v) reduced
NH4-N leaching by 75% compared to unamended sand. The authors found no treatment
effects on NO3-N leaching.
Other reported benefits of using calcined clays have been the reduction of
localized dry spot (Minner et al., 1997) and improved turf quality during times of severe
moisture stress (Miller, 2000). McCoy and Stehouwer (1998) suggest a bimodal water
retention curve for internally porous inorganic amendments such as calcined clay resulting
from a rapid release of water at low tensions followed by another smaller release of
moisture at a higher tension (near -1000 cm H2O). The latter is attributed to release of
internal porosity water.
Another inorganic amendment which has been of interest to the golf course
industry since the 1980’s is the group of minerals known as zeolites. Zeolites are a large
class of naturally occurring secondary minerals consisting of aluminosilicate frameworks
with loosely bonded alkali and/or alkali-earth cations and water molecules that occupy
extraframework positions (Hey, 1930). They are commonly formed at low temperature and
pressure in the presence of water (Armbruster and Gunter, 2001). Over 80 natural zeolite
species have been identified (Coombs et al., 1998). Of these, chazabite, clinoptilolite,
erionite, mordenite, and phillipsite are the most commonly used zeolites for agronomic,
horticultural, and soil remediation applications (Ming and Allen, 2001). Zeolites have two

properties that make them desirable for agronomic and horticultural use: (1) a theoretical
CEC of 200 to 300 cmol+ kg-1 due to the substitution of Al+3 for Si+4 during formation
(Ming and Allen, 2001) and (2) large internal channels created by the three dimensional (3-
D) framework of silica and aluminum tetrahedron that give zeolites low bulk densities and
allow for the retention of water and exchange of cations (Ming and Allen, 2001). The size
of the internal channels determines the cation selectivity sequence of individual zeolites,
which varies among zeolite species. The selectivity sequence of chabazite reported by
Barrer et al. (1969) is:
K+ > Ag+ > Rb+ > NH4+ > Pb2+ > Na+ = Ba2+ > Sr2+ > Ca2+ > Li+.
The selectivity sequence of clinoptilolite (Ames, 1960) is:
Cs+ > Rb+ > K+ > NH4+ > Ba2+ > Sr2+ > Na+ > Ca2+ > Al3+ > Mg2+ > Li+
Large zeolite deposits exist around the globe and vary considerably in hardness and
durability (Handreck and Black, 2001). High cost and lack of research currently limit their
use as soil amendments. Studies on the effects of zeolite amendments in coarse textured
soils and putting green root zone mixes began in the 1980’s. By this time, the beneficial
properties of zeolites were already being put to use by municipal water treatment facilities
to remove NH4+ and heavy metals from wastewater (Kallo, 2001).

Researchers have found many advantages to amending sand root zones with
zeolite. The major advantages reported are:
1. Decreased NH4-N leaching in soil columns or field plots amended with zeolites
(Mackown and Tucker, 1985; Fergeson and Pepper 1987, Huang and Petrovic,
1994; Perrin et al., 1998; Bigelow et al., 2001; Handreck and Black, 2001).
2. Reductions in NO3-N leaching (Huang and Petrovic, 1994).
3. Increased shoot growth rate of creeping bentgrass without affecting
evapotranspiration rate during drought stress (Huang and Petrovic, 1996).
4. A 16 – 32% improvement in nitrogen use efficiency by creeping bentgrass
(Fergeson et al., 1986; Huang, 1994).
5. Improved turfgrass germination and establishment rates (Fergeson et al., 1986; Nus
and Brauen, 1991; Andrews et al, 1999).
6. Improved turf quality (Fergeson et al., 1986; Ok, 2001).
Disadvantages often associated with amending root zones with zeolite are high cost
(Moore, 1999; Handreck and Black, 2001; Nelson, 2003) and potential salinity problems
(Fergeson et al., 1986; Qian et al., 2001). Moore (1999) estimates that for a typical 19-
green construction project, the cost of an inorganic amendment will be over 6 times that of
peat. Nelson (2003) considered the scenario for a hypothetical 18-hole putting green
construction project and calculated that amending the greens with an average-priced
inorganic amendment at a 9: 1 ratio by volume can increase the cost of construction by

$86,594 compared to amending the greens with sphagnum peat at the same incorporation
ratio. He concluded that, based on current independent research, this cost is difficult to
justify from an agronomic perspective.
Additionally, some zeolites contain high amounts of soluble salts. This is the case
for zeolite deposits in semi-arid to arid regions where salts accumulate. Qian and others
(2001) reported that sand amended with zeolite and irrigated with irrigation waters of 3
different salinity levels [0.25 (control), 3.5, or 6.5 dS m-1] improved turf quality during the
second and third months at the two highest salinity levels. Between months 5 and 6, the
beneficial effects of the zeolite amendment diminished. The authors concluded that
although amending sand with zeolite may buffer the soil solution Na+ concentration in the
short-term, a substantial amount of Na+ may be retained concurrent with Ca2+ and Mg2+
exchange, potentially increasing sodicity and salinity problems in the long-term.
Ferguson et al. (1986) observed greater improvements in turf establishment on
plots amended with 5% clinoptilolite zeolite than with 10% of the mineral. They attributed
the difference to excessive exchangeable Na+ in the zeolite. After 1 year, there were no
statistical differences in Na+ concentrations of the leachates from the unamended control
and the 5% zeolite treatment. By that time, the Na+ concentrations in the leachate at the
10% zeolite incorporation rate had declined by 72%, and the 10% zeolite treatment began
to sustain better turf quality than the 5% zeolite treatment. The authors attributed the
difference in turf quality to leaching of excess Na+ in the root zone and greater potential for
NH4+ retention in the 10% zeolite treatment. Unfortunately, the authors failed to report the
composition and electrical conductivity of the irrigation water used. When poor quality

water such as tertiary effluent is used as irrigation water, exchangeable Na+ may not be
leached out of the root zone as readily.
To date, nearly all of the investigations of zeolites as turfgrass root zone
amendments involve those dominated by the mineral clinoptilolite, the type of zeolite most
readily available in the United States. Because zeolites vary in physical and chemical
properties; each zeolite should be thoroughly researched before it is employed as a putting
green construction material.
If and when inorganic materials are to replace organic materials as root zone
amendments, one or more compelling advantages of doing so needs to be demonstrated.
For golf courses seeking permits for construction on environmentally sensitive sites,
reductions in leaching of N and P could be crucial. However, in most cases the overriding
issue is more likely cost. The cost of the inorganic materials will have to be offset, at least
in part, by reductions in water and fertilizer use. This must be accomplished without
compromising turfgrass quality. Many factors influence water and fertilizer use and turf
quality. They include: root zone moisture retention, infiltration rate, saturated hydraulic
conductivity, root development, CEC, and root zone affinity for P and K. The objective of
this study was to investigate these factors and others to establish the agronomic, economic,
and environmental merits of using two zeolites and a porous ceramic material as root zone
amendments for golf course putting green construction.

METHODS
Field Methods
The site for the field study is a putting green constructed during the fall of 2001 at
the O.J. Noer Turfgrass Research and Education Facility in Verona, WI. The green is
comprised of twenty 1.8- by 2.4-m cells consisting of 30 cm of root zone mix overlaying a
10-cm pea gravel blanket with imbedded drain pipe. A plywood grid lined with 6-mil
plastic sheeting extends the full depth of the root zone, physically isolating each cell. Each
cell is outfitted with a 30-cm diameter well for insertion of time domain reflectometry
(TDR) probes at root zone depths of 5, 10, 15, 20 and 25 cm for volumetric soil moisture
measurement. In the center of each cell is a low tension lysimeter based on the design
described by Holder et al. (1991) for leachate collection. The top of the lysimeter is
positioned at the interface between the root zone mix and pea gravel blanket. The tension
being applied to the drainage water is determined by the length of the fiberglass wick. For
this study the tension was set to 10 cm. The diameter of the circular collection plate is 20
cm and the plastic storage bottle holds 4.6 L of leachate.
The cells are arrayed in 4 rows of 5 cells each. Each row of cells constitutes a
replicate of randomly located treatments. The treatments are root zone mixes with different
amendments. The treatments include: (1) sand + AgriBoost® (phillipsitic zeolite, ASI
Industries, Washington D.C.); (2) sand + Profile® (porous ceramic, Profile Products LLC,
Buffalo Grove, IL); (3) sand + GSA ZK406H (clinoptilolitic zeolite; GSA Resources, Inc.,
Tucson, AZ); (4) sand + Canadian sphagnum peat moss (Fafard, Inc, Agawam, MA,

Canada); and (5) pure sand (Waupaca Sand and Solutions, Waupaca, WI). The ratio of
sand: amendment in all mixes is 9: 1 (v/v).
The root zone mixes were prepared by measuring out the volume of sand required
for each treatment, placing it in a windrow on a paved surface, and spreading the proper
volume of amendment over the windrows. The sand and amendments were blended
thoroughly by making several passes through the windrow with a tractor-mounted compost
pile mixer. The root zone mixes were loaded into the cells by hand. Once the individual
cells were filled, a water-permeable cover was placed over the green to minimize wind
erosion and contamination of the mixes during the winter months. In the spring of 2002,
root zone mix was added or removed from the cells as needed to level the putting green
surface. On 15 May 2002 the plots were seeded with ‘L-93' creeping bentgrass (Agrostis
palustris Huds.). GroWin® (Emerald Isle, Ltd., Ann Arbor, MI) was incorporated into the
top 10 cm of the pure sand treatment only at a rate of 1221 kg ha-1 (25 lbs M-1)1 to aid in
establishment. GroWin® is a temporary granular root zone amendment with higher water
holding capacity and a guaranteed analysis of 5-1-2; the incorporation of GroWin®
resulted in the addition of 61 kg N ha-1 (1.25 lbs. N M-1).
Fertilizer application dates and rates for 2002 are given in Table 6. For 2002, the
grow-in season, the total quantities of N, P2O5, and K2O applied were 308, 173, and 218 kg
ha-1, respectively. Although deemed adequate based on turfgrass color, this amount of N
was modest compared to rates often employed by persons that specialize in rapid grow-in
of putting greens, who may apply 600 kg N ha-1 or more (Beard, 1973; Kussow,
1 M = 1000 ft2

Table 6. 2002 field fertilization schedule.
ApplicationDate Fertilizer Grade Fertilization Rate N Source
TreatmentsFertilized
% N - P2O5 - K2O kg N - P2O5 - K2O / ha
05/15/02 14-28-12 48.8 - 97.6 - 39.1 42% Ammoniacal N14% Urea N26% WSN†18% WIN‡
All
05/15/02 5-1-2 61.0 - 12.2 - 24.4 10% Ammoniacal N90% WIN
Sand
05/30/02 46-0-0 12.2 - 0.0 - 0.0 100% Urea N Profile,Peat, Sand
06/10/02 46-0-0 14.6 - 0.0 - 0.0 100% Urea N All
06/14/02 18-3-4 4.9 - 1.0 - 1.0 19% Ammoniacal N81% Urea N
All
06/21/02 18-3-4 4.9 - 1.0 - 1.0 19% Ammoniacal N81% Urea N
All
06/26/02 14-28-12 24.4 - 48.8 - 19.6 42% Ammoniacal N14% Urea N26% WSN†18% WIN‡
All
07/08/02 46-0-0 24.4 - 0.0 - 0.0 100% Urea N All
07/12/02 18-3-4 4.9 - 1.0 - 1.0 19% Ammoniacal N81% Urea N
All
07/25/02 46-0-0 39.1 - 0.0 - 0.0 100% Urea N All
08/02/02 18-3-18 24.4 - 4.9 - 24.4 13% Ammoniacal N22% Urea N40% WSN†25% WIN‡
All
09/03/02 14-28-12 24.4 - 48.8 - 19.6 42% Ammoniacal N14% Urea N26% WSN†18% WIN‡
All
- continued -
† WSN, water soluble nitrogen‡ WIN, water insoluble nitrogen
Table 6. (continued)
ApplicationDate Fertilizer Grade Fertilization Rate N Source
TreatmentsFertilized
10/26/02 0-0-50 0.0 - 0.0 - 78.1 All
10/27/02 24-2-12 19.5 - 1.5 - 9.8 3% Ammoniacal N38% Urea N22% WSN†37% WIN‡
All
† WSN, water soluble nitrogen‡ WIN, water insoluble nitrogen

1999). Fertilizer rates typical of those of an established putting green were used in 2003
(Appendix Table A-1).
Over the duration of the study, several plant parameters were measured and related
to physical and chemical root zone mix properties. Some of the parameters, such as
clipping weights and turfgrass clipping nutrient status are quantitative values. Others are
subjective visual ratings which rely on the interpretive skills and experience of the
evaluator.
Turfgrass is unique in that it is not grown for yield or nutritive value as are many
other agricultural crops. Therefore, a single objective measurement cannot be used to
successfully judge the quality of turfgrass. Instead, researchers use a subjective visual turf
quality rating method taking into account color, density, uniformity, and overall appeal of
the stand of turfgrass to judge turfgrass performance (Skogley and Sawyer, 1991). The
visual turf quality ratings are on a scale of 1 – 9, with 1 being dead or dormant turf and 9
being the highest quality turf possible as judged by the evaluator. A rating of 6 indicates
minimally acceptable turf quality. A study conducted on the utility of visual evaluation
techniques (Horst et al., 1984) suggests that subjective ratings can vary significantly
between evaluators and “results from national or regional turfgrass cultivar evaluation
trials should be considered with caution.” However, the authors concede that evaluations
made by individuals are still valuable for comparison because subjective ratings are usually
consistent within individual evaluators. While the authors used only visual quality and
density ratings to draw their conclusions, it is reasonable to assume that turfgrass color
ratings are subject to the same variation as other subjective ratings. For the present study,

visual turf quality ratings were taken on a monthly basis after the grow-in period had
commenced in 2002 and on a bimonthly basis in 2003.
Of the parameters included in a quality rating, color is one of the most influential.
Color is a measure of the light reflected from the turf (Turgeon, 2002). For years color
ratings have been reliably used as indicators of turfgrass health. In general, turfgrass will
begin to yellow at the onset of certain nutrient deficiencies, moisture stress, disease
pressure, and other plant-health related factors. Color ratings were taken on a weekly basis
during the 2002 growing season after the grow-in period and on a bimonthly basis during
the 2003 growing season. The color ratings were used to determine the need for
fertilization throughout the course of the study.
Another important subjective parameter included in the turf quality rating is stand
density and uniformity. Stand density is a function of turfgrass cover measured on a 1 – 9
scale, with 1 being 0% cover and 9 being 100% cover. Stand density was used to define the
grow-in period for this study. When the last plot had reached 100% cover (density rating =
9), the grow-in period was deemed complete, although the green was probably not yet
ready for heavy traffic. Uniformity is a measure of the consistency of the stand and is also
measured on a 1 – 9 scale, with 1 being no uniformity and 9 being perfect uniformity.
Intuitively, uniformity is difficult to measure independently of stand density, and for the
purposes of this study density and uniformity ratings were combined into a single
measurement and recorded on a bimonthly basis during the 2002 growing season.
Yield is an objective measure of turfgrass growth. In this study, measurement of
yield was achieved by making one pass with a Toro 1000 Greensmaster® [53.3 cm mowing

width (21 in.), 11 blade reel] down the center of each plot and collecting the grass
clippings. One pass removed clippings from an area of 1.02 m2 (10.94 ft2). The clippings
were dried at 60° C and weighed. Clipping yield is primarily a response to nutrient supply
and irrigation practices except when turfgrass growth is limited by extreme air or soil
temperatures. Throughout this study, fertilization and irrigation were held as constant as
feasible; subsequently, yield was interpreted as a measure of the plant response to root
zone mix characteristics such as available water and nutrients and, at times, heat stress.
Yield measurements were taken bimonthly over the course of the study.
Root growth was measured as root mass density to characterize any treatment
effects. Three soil cores were taken to a depth of 30 cm in each plot with a 1.91-cm
diameter soil probe. The cores were placed on a 2-mm sieve and the roots washed free of
soil by a stream of water. The roots were dried and root weight was determined by loss on
ignition at 600 ºC after 2 hours to compensate for any mineral matter still present. Root
growth measurements were taken in the spring, summer, and fall of each season.
A primary reason for amending sand with organic or inorganic materials is to
increase the water holding capacity of the root zone mix. Volumetric water content of the
root zone mixes was measured 3 times in 2002 and 3 times in 2003 by time domain
reflectometrey (TDR) to discern treatment effects. The measurement device consisted of
two 15-cm probes connected to a Tektronix 1502B TDR cable tester (Tektronix, Inc.,
Beaverton, OR). The cable tester measures the dielectric constant which is related to
volumetric water content of the root zone through the use of an equation described by
Topp and others (1980). The equation is:

Θ = -5.3E-02 + 2.92E-02Ka – 5.5E-04Ka2 + 4.3E-06Ka
3
where Θ is the volumetric water content and Ka is the dielectric constant. The Ka is
calculated by the following equation:
Ka = [(x2 – x1) / (L * Vp)]2
where x2 is the location of the inflection point of the right-most peak, x1 is the location of
the inflection point of the left-most peak, L is the probe length (0.15 m in this case), and Vp
is the relative velocity of propagation (set to 0.99 in this case). Measurements were taken
24 – 48 hours after a saturating rainfall occurred. Irrigation was withheld during this period
to ensure even moisture distribution among the root zone mixes.
Infiltration rate is another important characteristic of any putting green. The
infiltration rate is a function of the Ksat of the soil, gravitational force, and soil suction
(Beard, 1973). A green with an insufficient infiltration rate will eventually fail due to
decreased aeration and increased compaction, both of which lead to poor rooting. A green
with an excessive infiltration rate will be very susceptible to moisture stress, as
maintaining adequate soil moisture is a challenge. Root zones with high infiltration rates
also have greater potential for leaching losses due to the need for more frequent irrigation.
Infiltration rates are initially high when the soil is unsaturated. As the soil becomes
saturated the infiltration rate declines and approaches a limit controlled by the rate of soil

water movement (Beard, 1973). For this study, the infiltration rate was measured using a
double-ring infiltrometer with inner and outer ring diameters of 6.5 and 10.7 cm
respectively (Turf-Tec International, Oakland Park, FL). Infiltration rate was measured in
the fall of 2002 and again in the summer of 2003.
Because of the relatively high cost associated with building greens with inorganic
materials, the management practices of the experimental putting green were those of a
typical upscale Wisconsin golf course. After the grow-in period was complete, the green
was mowed 6 times weekly at a height of 3 mm (0.120 in.). For the 2002 season, irrigation
was applied nightly to replace 100% of estimated evapotranspiration (ET). For the 2003
season, irrigation was applied every other night to replace 100% of the estimated ET loss
from the previous day only. This change was made to account for overestimation of ET
losses that were manifested in excessive amounts of drainage. Supplemental irrigation was
applied by handwatering when necessary. The putting green was topdressed with pure sand
frequently during the first growing season to smooth the surface and facilitate low mowing
height. Topdressing was less frequent during the second growing season, with light
applications typically occurring bimonthly. The particle size distribution of the topdressing
sand is listed in Table 7. Application dates and rates of fungicides are listed in Table A-2.
Laboratory Methods
Relevant physical and chemical properties of all root zone mixes and materials
were characterized in the laboratory. These characteristics are necessary to explain the
differences found in putting green performance over the course of the study. Properties

Table 7. Particle size distribution of the root zone mixes and topdressing sand used.
Sieve #Particlediameter AgriBoost Profile
GSAZK406H Peat Pure sand
Topdressingsand
mm ----------------------------------- % ----------------------------------
10 >2.0 1.6 1.2 1.6 1.0 0.7 0.0
18 1.0 - 2.0 7.5 4.5 7.65 5.9 4.9 0.0
35 0.5 - 1.0 22.0 26.9 26.9 21.1 21.3 6.6
60 0.25 - 0.5 41.3 42.8 40.2 43.6 46.2 46.1
100 0.150 - 0.25 21.1 18.6 18.3 21.8 21.4 38.8
270 0.053 - 0.150 6.2 5.8 5.2 6.4 5.3 8.5
pan <0.053 0.3 0.2 0.2 0.2 0.2 <0.1

characterized included: particle size distribution, calcium carbonate equivalence (CCE), P
sorption and desorption, K sorption, moisture release curves, saturated hydraulic
conductivity (Ksat), and cation exchange capacity (CEC).
In Wisconsin and much of the Midwest, the sand available for putting green
construction typically contains significant amounts of carbonates. When carbonates are
present in a root zone mix, they control pH and adsorb considerable amounts of P (Brady
and Weil, 2002). Calcium carbonate equivalence of root zone mixes and materials were
measured with a method based on the neutralization of acetic acid (Loeppert and Suarez,
1996).
As mentioned above, P sorption capacity is often related to the presence of
carbonates in calcareous soils like the sand used in this study. The adsorbed P may be
unavailable for plant uptake, creating tissue P deficiency that results in a growth reduction,
especially evident during the early stages of turfgrass growth. However, in a sand-matrix
root zone without sufficient P sorption, the fertilizer P may be excessively mobile and may
be leached out of the root zone. For these reasons the P sorption capacities of the root zone
mixes were examined. Twenty-five milliliters of a 40 mg L-1 P solution (as MAP) was
mixed with 10 g of root zone mix taken from the experimental green on 09 Sept. 2002. The
soil and solution were shaken for 24 hours and filtered through Whatman 42 filter paper.
The amount of inorganic P in solution was determined using a colorimetric technique
(Murphy and Riley, 1962; Watanabe and Olsen, 1965).
To compliment the P sorption study, a P desorption study was conducted to
estimate the amount of plant available P in each root zone mix. The method described by

Kuo (1996), involving iron oxide-impregnated filter paper, was used to assess P
availability in the root zone mixes. The iron oxide sorbs P from the solution, thereby
simulating removal by roots and facilitating continuous P desorption from the mixes.
Potassium retention is also an important characteristic of a putting green root zone
mix. Traditional mixes using only sand or sand + peat do not retain significant amounts of
K, often creating deficiencies or the need for specialized K management strategies
(Kussow, 1987). The K sorption capacity of the root zone mixes was measured by shaking
1.5 g of each amendment (.15 g of peat) in 15-ml solutions containing either 0, 1, 5, 10, 50,
or 100 mg L-1 K+ for 2 hours. After 2 hours of equilibration, the solutions were analyzed
for exchangeable cations by inductively coupled plasma-atomic emission spectroscopy
(ICP-AES).
Another important chemical property of a root zone mix is its CEC. Due to the
nature of the materials used in this project, special methodology is required for reliable
CEC estimation. Separate methods were used to measure the CEC of the inorganic
amendments, the peat, and the field samples. The CEC of field samples and amendments
were determined using NaOAc saturation and displacement by NH4OAc as described by
Bower et al. (1952) and modified by Avila (1999). The CEC of the peat was determined
using a compulsive exchange method (Gilman, 1979; Avila, 1999).
Field soil samples of ~400 mg were weighed into 1.5-mL microcentrifuge tubes,
recording the weight of the soil and the weight of the tube to ± 0.1 mg. One and two-tenths
milliliters of 1 M NaOAc (pH 8.2) was added to the tubes and the samples were shaken for
10 minutes using a vortex action shaker. The high pH of the saturating solution was meant

to prevent appreciable CaCO3 dissolution. Samples were then placed in a microcentrifuge
and spun at ~10,000 rpm for 3 min. The supernatant was decanted and discarded. The
samples were treated in this manner a total of 3 times. After Na+ saturation, 1.2 mL of
deionized water was added to the samples, which were then shaken for 10 minutes using a
vortex shaker, and centrifuged at ~10,000 rpm for 3 min. The samples were rinsed with
deionized water in this manner a total of three times. After rinsing, exchangeable Na+ was
extracted three times with 1.2-mL aliquots of 1 M NH4OAc (pH 7) with mixing, shaking,
and centrifuging as described for the saturation procedure. The NH4OAc extracts of each
sample were decanted directly into a 10-mL tube, heated at 90°C to force NH4OAc
volatilization and dried. Five milliliters of deionized water was added to the tubes, and Na
was determined by flame photometery, making further dilutions when necessary.
For CEC determination of the inorganic amendments, 10 g of the material was
placed in 50-ml centrifuge tubes and 25 ml of 1 M NaOAc (pH 5.0) added. The low pH of
the saturating solution was meant to dissolve any CaCO3 present in the samples. The
amendments were suspended using a vortex mixer, shaken horizontally for 10 minutes, and
centrifuged for 10 at 3,000 rpm. The supernatant was decanted and discarded. The samples
were treated in this manner a total of 3 times. The samples were rinsed with deionized
water using the same procedure 4 times and freeze-dried. Subsamples were weighed and
added to the microcentrifuge tubes for NH4OAc extraction described above.
A compulsive exchange method (Gilman, 1979; Avila, 1999) was used to
determine the CEC of the peat amendment at pH 5, 6, 7, and 8. Approximately 50 mg
samples of the peat were placed into weighed 1.5-mL microcentrifuge tubes, 1.2 mL of

100 mM BaCl2 buffered to the proper pH was added to the tubes and shaken for 10 minutes
using a vortex shaker. After shaking, the samples were centrifuged at ~10,000 rpm for 3
minutes and the supernatant discarded. The samples were treated in this manner a total of 3
times. The samples were then washed 3 times by adding 1.2 mL of deionized water,
shaking for 10 minutes, centrifuging at ~10,000 rpm, and decanting and discarding the
supernatant. The peat samples were transferred to 30-mL centrifuge tubes and 10 mL of 5
mM MgSO4 was added to the pH 4 peat samples, and 10 mL of 10 mM MgSO4 was added
to the pH 6, 7, and 8 peat samples to compulsively exchange Ba2+ with Mg2+. The samples
were shaken for 1 hour and then filtered using Whatman 42 filter paper. The filtered
samples were sent to the University of Wisconsin Soil and Plant Testing Laboratory for
Mg analysis by ICP-AES. Cation exchange capacity was calculated as the difference
between the total amount of Mg added to each sample by the original MgSO4 solution and
the Mg remaining in solution after compulsive exchange of Ba upon BaSO4 precipitation.
Physical properties are at least as important as chemical properties in determining
the suitability of a root zone mix as a medium for turfgrass growth. Saturated hydraulic
conductivity is one of the most important physical properties of a root zone mix. The
USGA recommends that the Ksat be between 15 and 30 cm hr-1 (6 to 12 in. hr-1) for
‘normal’ regions, including southern Wisconsin, and 30 to 45 cm hr-1 (12 – 24 in. hr-1) for
‘accelerated’ regions which experience greater amounts of rainfall. The Ksat is directly
proportional to the volume of water moving through a packed soil column per unit time
and is a function of the pore diameters in the soil column (Jury et al., 1991). For this study,
root zone mixes (-40 cm H2O) were placed into 7.62-cm diameter cylinders and compacted

by dropping a 3.18-kg (7 lb.) hammer 7 times from a height of 631 mm (2.07 ft.). This
compaction level is the USGA standard for evaluating root zone mixes (Hummel, 1993b)
and is assumed to mimic a heavily trafficked putting green. The Ksat of the root zone mixes
was measured using a falling head permeameter with a diameter of 3.18 cm (1.25 in.). The
water level was measured every 10 seconds and carried out for at least 120 seconds.
Saturated conductivities of the mixes were calculated for each time interval using the
following equation and then averaged over all readings.
Ksat = [(a · L) / (A · ∆t)] · ln (H0 / H1),
where a is the cross sectional area of the water column, L is the length of the soil core, A is
the cross sectional area of the soil core, ∆t is the time interval between readings, H0 is the
height of the water column at the beginning of the time interval, and H1 is the height of the
water column at the end of the time interval.
The USGA also provides recommendations for total porosity, capillary porosity,
and air-filled porosity (Table 2). These were determined following the procedures
described by Hummel (1993b).
Moisture release is another important physical property of a root zone mix.
Moisture release curves were developed using a hanging column tension table to examine
the tensions at which water held in the root zone mixes may become available to turfgrass.
Root zone mixes were placed in 7.6-cm diameter cores and compacted according to USGA
standards (Hummel, 1993b). The cores were saturated before being placed on the hanging

column tension table (McGuire and Lowery, 1992). The volume of water extracted was
measured for each mix at tensions of -5, -10, -15, -25, -35, -60, -100, -150, and -200 cm
H2O.
Field soil samples were taken to a depth of 10 cm (4 in.) and available P and K
measured on 6 sampling dates using the Bray-1 extractant. Analysis of P and K was by
way of colorimetry and flame photometry respectively (Liegel et al., 1980). pH of soil
samples and amendments were measured using a 1: 1 soil: water ratio (Thomas, 1996).
Water soluble P was measured on 1 sampling date by way of extraction with 0.01 M CaCl2
(Kuo, 1996).
Each set of dried and weighed bentgrass clippings was analyzed for N, P, and K
concentration. Nitrogen content was determined using a micro-Kjeldahl method following
digestion of tissue in H2SO4 containing a mixture of Na2SO4, CuSO4 and Se (duPreez and
Bale, 1989). Tissue P was determined colorimetrically following the procedure of Kitson
and Mellon (1944) and tissue K was determined by flame photometry after igniting the
tissue samples in a muffle furnace for 2 hours at 500ºC and dissolving the ash in 2 N HCl
and diluting the sample to 25 ml.
Leachate samples were analyzed for mineral N, P, and K content. Ammonium and
nitrate N concentrations were determined by steam distillation (Mulvaney, 1996).
Phosphorous concentrations in the leachate were determined colorimetrically (Murphy and
Riley, 1962; Watanabe and Olsen, 1965), and K concentration was determined by flame
photometry.

Greenhouse Methods
A greenhouse study was initiated in January 2003; the primary purpose being to
determine root zone mix effects on moisture retention and drainage rates. Both factors have
implications regarding irrigation practices – the rates and frequencies of irrigation, and
ultimately, total water use.
Simulated putting greens were constructed using 20-cm diameter by 40-cm long
PVC pipe fitted with an end cap. PVC cement was used to adhere a thin layer of the
appropriate root zone mix on the inside wall of each cylinder in an attempt to lessen the
effects of preferential water flow along the cylinder wall. Thirty centimeters of each root
zone mix were placed over 10 cm of pea gravel in the cylinders. The mixes were added in
7.6-cm increments, which were compacted before adding the next increment. This process
resulted in root zone soil bulk densities ranging from 1.40 (Profile®) to 1.47 g cm-3 (pure
sand), which are typical for newly constructed putting greens. An intermediate coarse sand
layer between the root zone mix and pea gravel blanket was not used. Holes were drilled
near the bottom of each end cap to allow for the collection of leachate during the
experiment. The cylinders were seeded with ‘L-93’ creeping bentgrass at a rate of 88 kg
ha-1. Starter fertilizer was incorporated into the top 7.6 cm of the root zone mix. GroWin®
was incorporated into the top 10 cm of the pure sand treatment at a rate of 1221 kg ha-1 (25
lbs M-1) to reproduce field conditions as closely as possible.
Tap water was applied to the cylinders in equal amounts during the establishment
phase. Drainage rate was not monitored until the cylinders reached 100% turfgrass cover.

Until this time, treatment effects on bentgrass establishment, color, growth, leachate
volume and composition were recorded.
Leachate was collected intermittently during bentgrass establishment from 4 Feb. to
12 Apr. 2003. Leachate volumes were recorded and composition determined. Nitrate N and
NH4-N were determined using the micro-Kjeldahl method (duPreez and Bale, 1989), and
P, K, Ca, Mg, and Na were determined by the University of Wisconsin Soil and Plant
Testing Laboratory using ICP-AES.
Six Decagon ECH2O EC-10 (Decagon Devices, Inc., Pullman, WA) probes were
employed to measure volumetric water content at 6 different depths in the root zone
profiles. Narrow slits were cut into each PVC cylinder to accommodate the 3.17 cm wide
and 0.15 cm thick probes. The 6 depths as measured from the center of the probe to the soil
surface were 2.5, 7.6, 12.7, 17.8, 22.9, and 28.0 cm. The probes were staggered in two
columns 7.9 cm apart in an attempt to minimize any interference between neighboring
probes.
Cylinders were saturated and allowed to drain for 24 hours. At the end of the 24
hour period, 1.3 cm of water was applied evenly by adding the volume of water to a PVC
end cap with several 1-mm diameter holes placed on top of the turf. Drainage
measurements were recorded by a datalogger every minute during the first hour following
irrigation, and hourly thereafter for 48 hours, at which time another 1.3 cm of water was
applied. This procedure was followed a total of four times. At the end of the fourth 48 hour
period, irrigation was withheld and soil moisture monitored until bentgrass wilt occurred.

At this time the probes were inserted into the next cylinder to be studied and the above
process repeated.
RESULTS
Root Zone Mix Properties
The properties of the root zone mixes listed in Table 8 are used by turfgrass
professionals and researchers to quickly evaluate the suitability of the root zone mix for
putting green construction. Furthermore, values of Ksat and porosity are specifically
included in the USGA recommendations for physical properties of root zone mixes (Table
2).
The USGA considers southern Wisconsin to be in the ‘normal’ range for its Ksat
recommendations (Ksat between 15 to 30 cm hr-1). Of the mixes used in this study, only the
AgriBoost® amended mix met the USGA’s recommendation. All remaining treatments
exceeded the recommendation of 30 cm hr-1, with the GSA ZK406H and Profile®
treatments exceeding it by 67 and 75% respectively. One of the issues surrounding
laboratory measurement of Ksat is that it does not accurately reflect field values. Saturated
hydraulic conductivity is a function of soil pore radius, and thus soil particle size.
Topdressing is a common cultural practice that has a pronounced effect on Ksat.
Topdressing involves applying primarily fine and very fine sand to the surface of a putting
green and brushing it down into turfgrass canopy to smooth out the surface and dilute the
plant material accumulating below the surface (thatch). Because mower pick-up of sand
sized particles substantially decreases the life of the mowing reel and bedknife; golf course
superintendents deliberately choose sands that can be easily brushed down into the thatch
layer, thus preventing excessive contact with mowers. Years of brushing fine and very fine
sands into the greens creates a layer of finer textured materials over coarser materials,

reducing the Ksat and infiltration rate of the root zone mix. After as little as 1 year, the
effect of topdressing can become apparent. If the topdressing material is chosen to match
the particle size of the original root zone mix, it is possible the laboratory Ksat value can be
maintained in the field for a number of years; however, the additional wear on the mowers
from using coarser topdressing sand is a price most golf course superintendents are
unwilling to pay.
The widespread practice of topdressing compromises the utility of the USGA’s Ksat
recommendation. A root zone mix that initially exceeds the upper limit set by the USGA
may eventually meet the Ksat recommendation after a few years of topdressing; while a
root zone mix initially meeting the USGA’s target may fall below the recommended range
over a short period of time. Additional research on the effects of topdressing materials on
Ksat is warranted.
Infiltration rates were measured on one replicate in the fall of 2002 and on all
replications during the summer of 2003. No significant differences in infiltration rates
existed between the treatments in 2003 (Table 9). Variation within treatments was
relatively large. Results are shown along side the Ksat values determined in the laboratory.
The infiltration rates of 2003 tend to be about ½ of the 2002 values. There does not appear
to be any correlation between field infiltration rates and Ksat. It is likely that the severe
amount of compaction applied to the laboratory samples prior to Ksat determination
accounts for the inconsistencies between the laboratory Ksat and field infiltration values.
A primary reason root zone mixes are amended with organic or inorganic materials
is to increase nutrient holding capacity. The sands used for constructing sand-matrix

Table 8. Physical and chemical properties of the root zone mixes used.
Porosity
Root zone mix Db† pH‡ CEC§ Ksat# Total Capillary Air-filled 1w††
g cm-1 cmol+ kg-1 in hr-1 ---------------- % ---------------- %
AgriBoost 1.52 7.98 5.6 10.89 42.7 23.8 18.9 15.7
Profile 1.47 7.65 0.5 20.67 44.4 24.3 20.1 16.6
GSA ZK406H 1.43 7.60 1.5 19.87 46.1 25.6 20.5 17.2
Peat 1.45 7.09 0.6 13.49 45.2 24.5 20.7 16.9
Pure sand 1.54 7.85 0.2 14.53 41.8 22.7 19.1 14.7
LSD0.05 0.11 0.08 0.32 3.31 4.15 NS NS NS
† Db, dry bulk density.‡ pH 1: 1, water: material.§ CEC, cation exchange capacity pH 8.2.# Ksat, saturated hydraulic conductivity.†† 1w, water retention at -40 cm H2O.
Table 9. Root zone mix effects on laboratory determined Ksat and field infiltration rates.
Infiltration Rate
Root zone mix 2002 2003 Ksat
------------------------------ cm hr-1 -----------------------------
AgriBoost 33.6 18.0 10.9
Profile 38.6 18.3 20.7
GSA ZK406H 34.5 16.3 19.9
Peat 22.2 18.0 13.5
Pure sand 32.4 13.5 14.5
LSD0.05 NA NS 3.31

putting greens typically have negligible CECs. The CEC of the sand used in this study was
0.02 cmol+ kg-1 (Table 10). The CEC of the AgriBoost® amendment was approximately
twice as great as that of the GSA ZK406H zeolite (Table 10). The CEC of the AgriBoost®
root zone mix is comparable to the CEC of a native soil “push-up” putting green. The
CECs of the other root zone mixes were below 1.5 cmol+ kg-1, low by any standard. The
CECs of the Profile® amendment and root zone mix were 4.6 and 0.5 cmol+ kg-1
respectively. These values are lower than those that have been previously reported in the
literature (Table 5; Li et al., 2000). The CEC of the peat was very pH dependant, as
expected (Figure 1). Peat also had the greatest CEC of all amendments, but because it is a
low bulk density material and is incorporated into the root zone mix on a volume basis, the
CEC of the peat-sand mix is negligible (Table 8).
The sand used for this study contains 21.4% fine sand (0.15 – 0.25-mm particle
diameter) and 5.3% very fine sand (0.05 – 0.15-mm particle diameter) (Table 7), both
greater than allowable by USGA standards (Table 1) by 1.4% and 0.3% respectively. The
particle size distribution of AgriBoost® fails to meet USGA specifications in nearly every
size fraction. Incorporating AgriBoost® into the sand resulted in a 14.5% increase in very
fine sand content which already exceeded USGA standards. However, the superior
performance of this particular root zone mix during the course of the study suggests that, at
least for southern Wisconsin, a root zone mix having a very fine sand content up to 6.5%
or more is acceptable. Further, the particle size recommendations of the USGA might be
relaxed with more emphasis placed on maintaining a Ksat between 15 and 30 cm hr-1.
Table 10. Physical and chemical properties of the root zone amendments and constructionsand used.
Amendment pH† Bulk Density CCE‡ CEC§
g cm-3 % cmol+ kg-1
AgriBoost 8.03 1.36 3.95 66.8
Profile 6.05 0.56 0.66 4.6
GSA ZK406H 7.58 0.91 0.52 34.5
Peat 2.83 0.18 ND# 152
Pure sand 7.88 1.54 4.34 0.02
LSD0.05 0.11 NA 0.23 NA
† 1: 1 water: amendment‡ CCE, calcium carbonate equivalence§ CEC, cation exchange capacity pH 5.0 for sand and amendments, 7.0 for peat# ND, no data

60
80
100
120
140
160
180
4 5 6 7 8 9
pH
Cat
ion
exch
ange
cap
acity
, cm
ol k
g-1
Figure 1. Cation exchange capacity of peat as a function of pH.

From an economic perspective, the relatively finer particle size distribution of the
AgriBoost® treatment could prove advantageous. The greater amounts of water retained
and the slower drainage rates expected from a finer textured root zone mix could translate
into savings from lower irrigation requirements.
The USGA recommends that at least 60% of the particles in root zone mix be in the
0.25 to 1.0 mm size range (Table 1) to impart compaction resistance. Profile® had the most
uniform particles size of all the amendments used in this study. Nearly 98% of the product
was classified as either coarse or medium sand (0.25 – 1.0 mm particle diameter) (Table
11). The GSA zeolite was slightly coarser with 92% of the particles classified as very
coarse or coarse sand (0.5 – 2.0 mm particle diameter) (Table 11). The peat used in this
study was not pulverized before incorporation as is common in commercial sand-peat
blends. Thirty-seven percent of the peat was > 2.0 mm and 45.1% fell between 0.5 and 2.0
mm (Table 11). Profile® was the only amendment that met the particle size distribution
recommendations of the USGA and therefore, should have the highest compaction
resistance among the 5 root zone mixes.
Moisture release curves were established for each of the root zone mixes (Figure 2).
The peat treatment held significantly more water than the sand treatment at tensions of -5, -
10, -15, -25, -35, -45, -100, and -150 cm H2O. Peat and Profile® released significantly
greater amounts of water than pure sand and AgriBoost® at -35 cm H2O, and pure sand,
GSA zeolite, and AgriBoost® at -45 cm H2O.
Indeed, other researchers have found Profile® to release significantly more water
than pure sand (Li, 2000; McCoy and Stehouwer, 1998; Bigelow et al., 2000). These

Table 11. Particle size distribution of the root zone amendments.
Root zone amendment
Sieve # Particle Diameter Range AgriBoost Profile GSA ZK406H peat
mm ----------------------------%---------------------------
10 >2.0 1.6 0.0 0.0 37.4
18 1.0 - 2.0 18.0 0.0 26.0 23.3
35 0.5 - 1.0 24.4 60.1 66.3 21.8
60 0.25 - 0.5 19.5 37.7 7.4 11.3
140 0.106 - 0.25 20.9 2.1 0.3 4.0
270 0.053 - 0.106 9.8 < 0.1 < 0.1 2.1
pan < 0.053 5.9 < 0.1 < 0.1 < 0.1

0%
5%
10%
15%
20%
25%
30%
0 50 100 150 200
Tension, cm H2O
Volu
met
ric w
ater
con
tent
, % AgriBoostProfileGSA ZeolitePeatPure sand
Figure 2. Moisture release properties of root zone mixes.

results provide an explanation for the claims that Profile® improves turfgrass quality under
drought stress (Miller, 2000). Although some significant differences were found in this
study, the differences in water retention between the root zone mixes tended to be small
and can be attributed to the relatively fine texture of the sand used (relatively high water
holding capacity). It is important to note that the peat-amended root zone mix released
more water at every tension than all other mixes analyzed (including Profile®), suggesting
that if increased moisture holding capacity is the main goal of a putting green construction
project, peat moss should have preference over inorganic amendments.
Potassium is a cation which binds electrostatically to exchange sites in the root
zone and is required in relatively large quantities by turfgrass, typically accounting for 2 –
3 % of dry tissue weight. Root zones mixes with inadequate CECs are unable to retain
sufficient amounts of K for an entire growing season. Much of the applied K leaches out of
the root zone after a K fertilizer application. In order to maintain adequate soil test K and
prevent K deficiencies in turfgrass grown on a sand-matrix root zone, several small
applications of K are required throughout the growing season. Besides the fertilizer cost,
these additional applications increase labor costs. The CECs of the zeolite treatments
suggest that those treatments might be able to retain sufficient quantities of K for turfgrass
growth for an entire season. Potassium sorption curves (Figure 3) showed that there are
large differences in K retention among the amendments and construction sand. The peat
and construction sand appear to have very little K buffering capacity. Also evident were
differences in K buffering capacity between the zeolite amendments and the calcined clay.
The slopes of the individual sorption curves indicate that the zeolites have a greater K

-0.5
0
0.5
1
1.5
2
2.5
0 1 2 3 4 5 6
PAR - K/[(Ca + Mg)/2]1/2
∆K
- cm
ol k
g-1
AgriBoost
Profile
GSA ZK406H
Peat
Sand
Figure 3. Affinity of amendments and pure sand for K.

buffering capacity than Profile. These results suggest differences in K fertilizer
requirement and use efficiency will exist among the treatments.
Phosphorus is another nutrient required in relatively large quantities by turfgrass,
typically accounting for over 0.5 % of the dry tissue weight. Adequate buffering of the
solution P is of special importance during the establishment phase. In sand-matrix putting
greens, adsorbed P controls solution P and, in calcareous root zone mixes, carbonates
control P sorption. Phosphorus sorption properties of the root zone mixes (Figure 4) show
that the root zone mix containing AgriBoost® adsorbed nearly 50% of the P added, which
is 1.8 to 2.7 times as much P as that absorbed by remaining treatments. Surprisingly, the
root zone mix containing peat adsorbed significantly less P than all other treatments. Iron
and Al associated with this pH 2.83 sphagnum peat moss (Table 10) were expected to
significantly increase P sorption as compared to the pure sand control. The implication
here is that the organic constituents in the peat reduced P adsorption by reacting with the
carbonates in the root zone mix.
To complement the P sorption results, another study was conducted to discern
treatment effects on P desorption. Results shown in Figure 5 show that P is desorbed most
easily from the root zone mix containing Profile®, which released 1.9 to 2.7 times as much
P as the remaining treatments. Also shown in Figure 5 are the amounts of P leached during
2002 from each treatment. Understandably, there was a clear relationship between P
desorption and P leaching rates.

0
10
20
30
40
50
60
AgriBoost Profile GSAZeolite
Peat Moss Sand
ROOT ZONE MIX
Ads
orbe
d P,
mg
kg-1
Figure 4. P sorption capacities of root zone mixes.

0
5
10
15
20
25
30
AgriBoost Profile GSA Zeolite Peat Moss Sand
Root zone mix
Des
orba
ble
P / S
oil t
est P
, kg
0
2
4
6
8
10
12
14
16
P Le
ache
d kg
ha
-1
Desorbable P/soil test P (kg)
P leached (kg/ha)
Figure 5. Relationship between desorbable P and total P leached in 2002.

Greenhouse Observations
Establishment
All amendments improved establishment compared to pure sand. AgriBoost® and
peat improved establishment compared to GSA and Profile® (Figure 6). All amendments
improved turfgrass color (Figure 7) and clipping yield (Figure 8) compared to unamended
sand. Color rating and clipping yield differences among the amended treatments were
inconsistent.
The greatest amount of leachate was collected from the pure sand treatment, the
least amount from the peat treatment (Table 12). The GSA ZK406H zeolite treatment
reduced NO3-N leaching compared to all other treatments. Adding Profile® to the sand
increased P leaching compared to the other amended-sand treatments. The pure sand
treatment exhibited a large amount of P leaching compared to the other treatments.
However, 68% of the total amount occurred from one collection date, suggesting a large
isolated P leaching event due to macropore or preferential flow rather than elevated
concentrations in the leachate over time, as was demonstrated by the Profile® treatment.
The AgriBoost® treatment initially leached Na in concentrations of ~700 mg L-1. After 3
months of irrigation, a total of 3.1 L of leachate was collected, and the Na concentrations
had dropped to ~140 mg L-1. Leachate Na concentrations for the remaining treatments
ranged from 2 - 16 mg L-1.

0
1
2
3
4
5
6
0 20 40 60 80 100
Days after seeding
Esta
blis
hmen
t rat
ing,
1 -
5
AgriBoostProfileGSA ZK406Hpeatpure sand
Figure 6. Root zone mix effects on establishment rating (greenhouse study).

0123456789
10
0 20 40 60 8
Days after seeding
Col
or ra
ting,
1 -
9
0
AgriBoost
Profile
GSA ZK406H
peat
pure sand
Figure 7. Root zone mix effects on color rating (greenhouse study).

0100200300400500600700800900
1000
0 20 40 60 8
Days after seeding
Clip
ping
wei
ght -
mg
0
AgriBoostProfileGSA ZK406Hpeatpure sand
Figure 8. Root zone mix effects on clipping yield (greenhouse study).

Drainage Rates
Figures 9 - 14 display the mean volumetric water contents of each root zone mix at
various depths as a function of time over a 48-hour period. These curves show the mean
root zone mix moisture content every minute during the first hour following irrigation, and
hourly thereafter. Root zone mix differences in the appearance of peaks coinciding with
drainage existed. The height of the peaks decreased with each depth. At the first depth (2.5
cm) peaks occurred ~1 minute earlier in the two zeolite-amended root zone mixes than in
the other mixes (Figure 9). At all other depths the peak of the peat-amended mix occurred
later than in all other mixes. As expected, the difference between the peat treatment’s peak
and the other treatments’ peaks increased with depth. At the 28.0-cm depth, the differences
among the peaks of the peat treatment and remaining treatments ranged from ~ 5 to 6.5
hours (Figure 14). These data indicate that drainage rate differences exist between the peat-
amended mix and the remaining treatments. These differences could be translated into
differences in irrigation requirements.
Table 13 summarizes the treatment effects of the root zone mixes on volumetric
water content at various depths at the end of the 48 hour period. The AgriBoost®, GSA
ZK406H, and pure sand treatments had 3.5 – 5.2% greater root zone moisture contents
than the peat and Profile® treatments.

Table 12. Root zone mix effects on nutrient leaching (greenhouse study).
Root zone mixLeachatevolume NO3 NH4 P K Ca Mg Na
L ---------------------------- kg ha-1 ---------------------------
AgriBoost 3.14 3.92 0.44 0.19 10.1 83.6 35.3 282.7
Profile 3.44 1.03 0.29 0.41 9.4 99.1 27.6 17.2
GSA ZK406H 3.44 0.32 0.42 0.09 4.8 90.34 20.76 22.3
Peat 2.73 3.22 0.45 0.13 5.9 80.8 28.8 11.0
Pure sand 4.65 2.92 0.41 4.74† 16.6 119.2 37.2 22.4
†68% of this value occurred on 13 Mar. 2003.
Table 13. Mean volumetric water content of root zone mixes as a function of depth 48hours after application of 13mm of water (greenhouse study).
Depth - cm
Root zone mix 2.5 7.6 12.7 17.8 22.9 28.0 Mean
------------- % water content by volume -------------
AgriBoost 4.7 10.5 10.4 14.8 22.1 31.4 15.6
Profile 2.2 5.3 6.2 6.9 15.8 27.0 10.5
GSA ZK406H 6.8 8.6 9.8 11.2 19.4 34.7 15.1
Peat 0.0 8.5 9.0 10.7 15.2 26.0 11.6
Pure sand 8.5 9.2 9.8 12.7 19.9 34.3 15.7

0
5
10
15
20
25
30
0 1 2 3 4 5 6 7 8 9
ln minutes
Moi
stur
e by
vol
ume,
%
AgriBoostProfileGSA ZK406HPeatPure sand
Figure 9. Mean root zone mix volumetric water content at 2.5 cm (1 in.) over 48-hour
period (greenhouse study).

0
2
4
6
8
10
12
14
16
18
20
0 2 4 6 8 10
ln minutes
% m
oist
ure
by v
olum
e
AgriBoostProfileGSA ZK406HPeatPure sand
Figure 10. Mean root zone mix volumetric water content at 7.6 (3 in.) cm over 48-hour
period (greenhouse study).

0
2
4
6
8
10
12
14
16
18
0 1 2 3 4 5 6 7 8 9
ln m inutes
% m
oist
ure
by v
olum
e
AgriBoostProfileGSA ZK406HPeatPure sand
Figure 11. Mean root zone mix volumetric water content at 12.7 cm (5 in.) over 48-
hour period (greenhouse study).

0
2
4
6
8
10
12
14
16
18
20
0 2 4 6 8ln minutes
% m
oist
ure
by v
olum
e
10
AgriBoostProfileGSA ZK406HPeatPure sand
Figure 12. Mean root zone mix volumetric water content at 17.8 cm (7 in.) over 48-
hour period (greenhouse study).

0
5
10
15
20
25
30
0 2 4 6 8 1
ln minutes
% m
oist
ure
by v
olum
e
0
AgriBoostProfileGSA ZK406HPeatPure sand
Figure 13. Mean root zone mix volumetric water content at 22.9 cm (9 in.) over 48-
hour period (greenhouse study).

0
5
10
15
20
25
30
35
40
0 1 2 3 4 5 6 7 8 9ln minutes
% m
oist
ure
by v
olum
e
AgriBoostProfileGSA ZK406HPeatPure sand
Figure 14. Mean root zone mix volumetric water at content at 28.0 cm (11 in.) over 48-
hour period (greenhouse study)

Field Results
Bentgrass Establishment
An improved turfgrass establishment rate can be a valuable asset of a root zone
mix. Rapid establishment allows a golf course to open earlier, thereby creating an earlier
revenue stream on an investment of several million dollars. However, some turfgrass
managers (often under pressure from management) use excessive amounts of N fertilizer to
speed the turfgrass growth rate (Kussow, 1999). While a large amount of applied N
increases top-growth, it does so at the expense of root growth and leaching of excessive
amounts of N. The result is a healthy appearing putting green with a weak root system and
likely contamination of ground and surface waters. The green is opened for play
prematurely and the turf cannot recuperate from the damage done by ball marks and golf
shoes, and becomes particularly susceptible to annual bluegrass invasion.
Therefore, a root zone mix that can facilitate rapid establishment rates without
excessive N applications is of value to the golf course industry. This root zone mix must
also demonstrate the ability to rapidly develop and sustain a deep rooting system. A
relatively modest amount of N fertilizer was used during the grow-in period (190 - 264 kg
N ha-1) with the purpose of finding such a benefit. Fertilizer applications were based on
turfgrass color. Due to color differences evident during the grow-in period, an extra N
fertilizer application (12 kg N ha-1 as urea) was required for the pure sand, peat, and
Profile® treatments. This suggests that both zeolite treatments retained greater amounts of
N, as each was able to sustain a darker green color for an extended period of time. Table 14
summarizes treatment effects on density/uniformity, color, and root mass density during

Table 14. Root zone mix effects on turf color, density, and root mass density during establishment period (15 May 2002 – 5 Aug. 2002).
Root zone mix Mean color rating Mean density rating Root mass density†
1 - 9 1 - 9 kg m-3
AgriBoost 6.68 6.64 0.91
Profile 6.59 6.13 1.04
GSA ZK406H 6.57 6.26 1.30
Peat 6.55 6.61 1.47
Pure Sand 6.60 5.55 1.28
LSD0.05 NS 0.31 0.35
† Root mass density on 12 July 2002.

grow-in. The AgriBoost® and peat treatments had significantly greater bentgrass
density/uniformity ratings than all other treatments. The Profile® and GSA treatments
showed improved density/uniformity ratings compared to pure sand. The GSA treatment
exhibited the greatest root mass density, statistically greater than AgriBoost® and peat.
Leachate Analysis
Groundwater is the main source for drinking water in many urban areas. Therefore,
it is important to preserve the quality of the groundwater which we rely heavily upon.
Organic and ammoniacal forms of N are transformed into NO3- in aerobic soils. Nitrate is a
major groundwater pollutant because of the quantity of N inputs to soils and its high
solubility. The EPA considers drinking water with a NO3-N concentration in excess of 10
mg L-1 as unsafe for human consumption.
Nitrate leaching is a concern during the grow-in period of sand-matrix greens
because of the high water infiltration rates, lack of substantial root systems, and frequent
applications of irrigation water and soluble N fertilizers often associated with them. Soil
texture, N source and rate applied, timing of the application, and precipitation/irrigation
amounts all significantly influence NO3-N leaching (Petrovic, 1990). However, it has been
shown that N leaching losses from sand-matrix putting greens are minimal during the short
grow-in period and minimal to non-existent after this period when best management
practices are followed (Petrovic, 1990; Brauen and Stahnke, 1995).
Several researchers have examined the effects of zeolite incorporation on N
leaching in sand-matrix root zones (MacKown and Tucker, 1985; Ferguson and Pepper,

1987; Huang and Petrovic, 1994; Perrin et al., 1998; Bigelow et al., 2001). These
researchers have demonstrated that NH4-N leaching decreases with increasing root zone
CEC. Results regarding NO3-N leaching losses are mixed. Bigelow and others (2001)
reported 99% of applied NO3-N was lost through leaching when 50 kg ha-1 of N as
NH4NO3 was applied to a soil column and immediately followed by 2.5 pore volumes of
distilled water. From this they concluded that zeolite incorporation (8: 1, v/v) does not
decrease NO3-N leaching compared to an unamended control. Huang and Petrovic (1994)
examined N leaching in root zones mixes supporting bentgrass. The authors reported an 86
and 99% reduction in NO3-N and NH4-N leaching respectively over an 18-week period
when a clinoptilolitic zeolite was incorporated into sand (9: 1, v/v) and (NH4)2SO4 was
used as the N source.
Fergeson and Pepper (1987) recognized that clinoptilolite has the potential to
protect NH4+ from nitrification, thereby reducing volatilization losses. Many of the
exchange sites associated with zeolites are found within 3- to 8-Å (< 10-9 m) diameter
channels. Because of the small size of the channels, the authors speculated that the NH4+
bonded to these exchange sites is not accessible to nitrifying bacteria (~10-6 m) and,
therefore, NH3 volatilization and NO3-N leaching are retarded. Thus, it is not surprising
that Huang and Petrovic (1996) were able to quantify a reduction in NO3-N leaching and
Bigelow and others (2001) were not. Reductions in NO3-N leaching are achieved by the
retention of significant quantities of NH4+ by the root zone mix resulting in increased N use
efficiency, not by the physical retention of the NO3- ion.

Quantification of the effects of zeolite on NO3-N leaching under field conditions is
important and was an objective of the present study. If zeolites prove to be effective in
significantly reducing NO3-N leaching during grow-in periods (when NO3- is most
susceptible to leaching), golf course superintendents may incorporate zeolite into their root
zone mixes as a means of satisfying regulatory agent requirements for construction in
environmentally sensitive areas.
Leachate was collected from each plot on a monthly and bimonthly basis during
2002 and 2003 respectively. Total leachate volumes were recorded and a sample saved for
nutrient analysis. Samples were refrigerated and concentrations of NO3-N and NH4-N were
measured promptly. The concentrations of N were converted to mass of N by taking into
consideration the volumes of leachate collected. Relatively large treatment effects on N
leaching were observed during the first 3 months of the data collection coinciding with the
grow-in period (Table 15). After the grow-in period, significant differences in NO3-N
leaching between treatments were found in only 1 of 12 sampling dates (Tables 16a and
16b). Therefore, the NO3-N leaching discussion will focus on the results from the grow-in
period.
The GSA ZK406H treatment reduced NO3-N leaching by 70% compared to the
AgriBoost® treatment 79% compared to the peat treatment (Table 15). Over twice as much
NO3-N was recovered in the leachate of the pure sand and Profile® treatments compared to
the GSA ZK406H treatment; however, due to large variation within treatments these
differences were not statistically significant at the p = 0.05 level. The difference between
the GSA ZK406H and the peat treatment was the lone statistically significant difference.

Table 15. Root zone mix effects on N leaching during establishment period (15 May 2002 – 5 Aug. 2002).
Root zone mix N appliedNO3-Nleached
NH4-Nleached
TurfgrassN uptake†
Leachatecollected
Applied Nrecoveredin leachate
-----------------------kg ha-1------------------- m3 ha-1 %
AgriBoost 224.8 30.01 2.18 7.17 126 14.3
Profile 237.0 18.92 2.36 6.36 129 9.0
GSA ZK406H 224.8 9.05 2.83 7.00 129 5.3
Peat 237.0 43.02 6.10 7.43 129 20.7
Pure Sand 307.9 26.21 4.06 9.23 120 9.8
† Total N recovered in turfgrass clippings on 6/18/02, 7/8/02, 7/22/02, and 8/5/02.

Table 16a. Nitrogen leached as NO3- in 2002.
Root zone mix 6/06 7/08 8/11 9/09 9/27 10/14 11/29 Total
--------------------------------- kg N ha-1 --------------------------------
AgriBoost 21.04 5.37 1.42 1.08 0.79 1.04 1.46 32.20
Profile 9.23 5.87 1.46 1.15 1.17 1.08 1.07 21.03
GSA ZK406H 4.09 0.86 1.27 1.05 1.13 1.07 1.29 10.76
Peat 27.49 8.45 0.98 0.96 1.09 0.94 1.14 41.05
Pure Sand 14.20 6.74 1.21 1.19 0.88 1.02 1.11 26.35
LSD0.05 12.63 NS 0.21 NS NS 0.11 NS 22.80
Table 16b. Nitrogen leached as NO3- in 2003.
Root zone mix 4/23 5/01 5/06 5/13 5/27 6/10 6/24 7/08 Total
------------------------------------ kg N ha-1 ----------------------------------
AgriBoost 2.23 2.03 1.02 2.09 1.00 2.05 1.13 0.66 12.21
Profile 1.71 0.93 0.26 1.99 0.46 1.72 1.29 0.11 8.46
GSA ZK406H 0.26 0.98 0.19 0.91 0.53 4.47 1.17 0.33 8.83
Peat 0.50 1.29 0.33 1.20 1.65 4.09 0.96 0.27 10.30
Pure Sand 0.61 1.22 0.45 1.32 1.47 2.67 0.79 0.39 8.93
LSD0.05 NS NS NS NS NS NS NS NS NS

When large differences in N leaching occur, they are typically associated with large
differences in leachate volumes. In this study, leachate volumes failed to account for
differences in N leached during the grow-in period (Tables 17a and 17b). Although
significant differences in leachate volume existed on several dates, the trends found in
volume differences did not coincide with trends found in total N leaching. Total N
differences were a function of NO3-N and NH4-N concentrations in the leachate.
Surprisingly, AgriBoost® failed to reduce NO3-N leaching compared to the other
treatments except for peat. Amendment particle size appears to affect N leaching. Perrin
and others (1998) found clinoptilolite having a particle size < 0.25 mm increased NO3-N
leaching by 48% compared to the same amendment having a particle size of 2 to 4 mm.
Although not the same minerals, the NO3-N leaching difference in the two zeolites used in
this study could be attributed to the particle size differences between them.
Nus and Brauen (1991) reported that the CEC and exchangeable K content of
clinoptilolitic zeolite increased with decreasing particle size. Consistent with these results,
AgriBoost® exhibited a greater CEC than GSA ZK406H (Table 10). These two separate
studies report seemingly conflicting results. As the particle size of zeolite increases, NO3-N
leaching decreases (Perrin et al, 1998) but CEC decreases (Nus and Brauen, 1991),
suggesting a more complicated mechanism for NO3-N leaching reductions than just the
quantitative retention of NH4+. The particle size of zeolites may be just as important to the
chemical properties of the root zone mix as they are to the physical properties.
If differences in root mass between the 2 zeolite treatments are to offer an
explanation to the differences in NO3-N leaching, then treatment differences in N uptake

Table 17a. Leachate volumes collected in 2002.
Root zone mix 6/06 7/08 8/11 9/09 9/27 10/14 11/29 Total
------------------------------------ m3 ha-1 ------------------------------------
AgriBoost 40.5 42.5 42.8 43.0 42.8 42.1 32.4 286
Profile 42.0 43.9 43.2 43.3 42.8 42.4 37.9 296
GSA ZK406H 41.3 43.5 44.0 44.2 42.7 42.3 32.8 291
Peat 42.4 43.3 42.9 42.8 42.4 41.2 25.2 280
Pure Sand 38.4 41.0 41.0 41.2 40.6 39.8 32.4 274
LSD0.05 NS 2.60 2.80 2.80 NS NS 8.30 18.4
Table 17b. Leachate volumes collected in 2003.
Root zone mix 4/23 5/01 5/06 5/13 5/27 6/10 6/24 7/08 Total
------------------------------------ m3 ha-1 ------------------------------------
AgriBoost 41.2 42.3 42.0 41.7 39.7 41.6 40.6 40.8 330
Profile 38.5 42.2 41.7 41.1 32.9 40.6 41.6 42.0 320
GSA ZK406H 40.0 41.0 42.1 39.7 37.1 41.6 40.6 41.6 324
Peat 38.9 41.4 42.1 41.1 33.9 41.6 41.8 42.2 323
Pure Sand 37.3 40.6 40.2 39.6 37.9 39.9 39.7 39.8 315
LSD0.05 NS NS NS NS NS NS NS NS NS

should be apparent. The GSA ZK406H treatment had 43% greater root mass density than
the AgriBoost® treatment on 12 July 2002; however, N uptake was greater in the
AgriBoost® treatment than in the GSA treatment during the establishment period (Table
15).
By monitoring leachate from the base of the 30-cm root zone for the purposes of
examining putting green effects on groundwater quality, one is making the shaky
assumption that all or the majority of the leachate ends up moving to groundwater. USGA
putting greens are outfitted with drain tile that carries the percolate elsewhere, often to
surface waters. This should be kept in mind when discussing the effects of NO3-N leaching
from putting greens on groundwater quality.
From an environmentalist’s perspective, monitoring NO3-N concentrations in the
leachate is as important as quantifying total N loads over a prolonged period of time.
During the initial grow-in period (3 months) 12 of 60 leachate samples exceeded the
drinking water standard of 10 mg L-1 (Table 18a). Sixteen of the 60 samples exceeded 7
mg L-1 [the amount found in the irrigation water (Table A-3)], and the average NO3-N
concentration during the grow-in period was 5.7 mg L-1. After the grow-in, NO3-N
concentrations declined markedly. None of the 80 samples collected exceeded 7 mg L-
1NO3-N and the mean concentration in the 80 samples was 0.9 mg L-1 (Table 18b). In
2003, no significant differences were found between treatments on any of the 8 sampling
dates (Table 16b). The average NO3-N concentration over those sampling dates was 1.0
mg L-1 (Table 18c), less than 1/5 the concentration of the NO3-N found in the irrigation
water. No sample exceeded 10 mg L-1 NO3-N and only 2 of the 160 samples analyzed

Table 18a. Summary of NO3-N leaching concentrations during establishment period in 2002.
AgriBoost Profile GSA ZK406H Peat Pure sand All mixes
------------------------- mg NO3-N L-1 ----------------------------
Maximum conc. 24.5 8.3 8.1 31.7 22.0 31.7
Minimum conc. 0.3 0.6 0.2 0.0 0.1 0.0
Mean conc. 7.3 4.1 1.6 9.4 6.2 5.7
--------------------------Number of samples collected-----------------------
< 7 mg NO3-N L-1 7 10 11 7 9 44
> 7 mg NO3-N L-1 5 2 1 5 3 16
> 10 mg NO3-N L-1 4 0 0 5 3 12
Table 18b. Summary of NO3-N leaching concentrations following establishment period in 2002.
AgriBoost Profile GSA ZK406H Peat Pure sand All mixes
------------------------- mg NO3-N L-1 ----------------------------
Maximum conc. 2.7 1.0 1.9 2.5 1.3 2.7
Minimum conc. 0.1 0.7 0.6 0.6 0.3 0.1
Mean conc. 1.0 0.9 0.9 0.9 0.9 0.9
--------------------------Number of samples collected-----------------------
< 7 mg NO3-N L-1 16 16 16 16 16 16
> 7 mg NO3-N L-1 0 0 0 0 0 0
> 10 mg NO3-N L-1 0 0 0 0 0 0

Table 18c. Summary of NO3-N leaching concentrations in 2003.
AgriBoost Profile GSA ZK406H Peat Pure sand All mixes
------------------------- mg NO3-N L-1 ----------------------------
Maximum conc. 7.6 5.2 6.3 7.4 3.6 7.6
Minimum conc. 0.0 0.0 0.0 0.0 0.0 0.0
Mean conc. 1.3 0.9 1.0 1.0 0.9 1.0
--------------------------Number of samples collected-----------------------
< 7 mg NO3-N L-1 31 32 32 31 32 158
> 7 mg NO3-N L-1 1 0 0 1 0 2
> 10 mg NO3-N L-1 0 0 0 0 0 0

exceeded 7 mg L-1. These results are consistent with several sand-matrix putting green
NO3-N leaching studies that have been conducted over the years (Snyder et al., 1981;
Sheard et al., 1985; Brauen and Stahnke, 1995; Gonzalez-Carroscosa et al., 1995).
During the establishment period, NH4-N accounted for 7 – 31% of the total N
leached for all treatments. The peat treatment leached the greatest amount of NH4-N
followed by the pure sand treatment. The inorganic amended treatments leached
statistically similar amounts of NH4-N, 36 – 46% less than the peat treatment.
After the establishment period, significant differences in NH4-N leaching existed on 4 of
12 sampling dates (Tables 19a and 19b). The AgriBoost® and Profile® treatments
significantly reduced the total amount of NH4-N leached in 2002 compared to the peat
treatment. In 2003, NH4-N leaching accounted for 12 – 27 % of the total N leached.
Treatment differences did not exist in regard to total NH4-N leaching in 2003.
From the laboratory K sorption curves (Figure 3), treatment differences in K
leaching were expected. However, the curves failed to characterize the K leaching
observed in the field plots. In 2002, the Profile® and AgriBoost® treatments leached
significantly more K than the GSA ZK406H, peat, and pure sand treatments, which were
statistically similar to each other (Table 20a). The grow-in period appeared to have little
effect on K leaching. All amendments increased K leaching compared to the pure sand
treatment during 2002. In 2003, the pure sand and GSA treatments significantly reduced K
leaching compared to the peat treatment which exhibited significantly less K leaching than
the Profile® and AgriBoost® treatments (Table 20b). During the 2003 season the Profile®
treatment leached 71% more K than the GSA ZK406H treatment.

Table 19a. Nitrogen leached as NH4+ in 2002.
Root zone mix 06/06 07/08 08/11 09/09 09/27 10/14 11/29 Total
------------------------------- kg N ha-1 ------------------------------
AgriBoost 1.15 0.12 0.91 0.67 0.35 0.86 1.23 5.29
Profile 1.19 0.15 1.02 0.74 0.71 0.89 0.98 5.68
GSA ZK406H 1.57 0.19 1.07 0.84 0.81 0.84 1.03 6.35
Peat 5.07 0.11 0.92 0.57 0.64 0.69 0.80 8.80
Pure Sand 2.00 1.14 0.92 0.98 0.82 0.68 1.06 7.60
LSD0.05 2.42 0.99 NS NS 0.38 0.13 NS 3.08
Table 19b. Nitrogen leached as NH4+ in 2003.
Root zone mix 04/23 05/01 05/06 05/13 05/27 06/10 06/24 07/08 Total
------------------------------------- kg N ha-1 -----------------------------------
AgriBoost 1.10 0.46 1.00 0.71 0.26 0.45 0.19 0.31 4.48
Profile 0.95 0.27 0.26 0.65 0.30 0.26 0.79 0.04 3.53
GSA ZK406H 0.57 0.13 0.19 0.18 0.09 0.33 0.20 0.01 1.71
Peat 0.24 0.19 0.33 0.32 0.00 0.34 0.00 0.00 1.42
Pure Sand 0.36 0.25 0.45 0.38 0.06 0.16 0.00 0.00 1.46
LSD0.05 NS NS NS NS NS NS 0.65 0.27 NS

Table 20a. Potassium leached in 2002.
Root zone mix 06/06 07/08 08/11 09/09 09/27 10/14 11/29 Total
----------------------------------- kg K ha-1 ----------------------------------
AgriBoost 4.26 5.61 6.90 6.86 6.70 5.66 3.39 39.40
Profile 4.89 5.99 7.21 6.00 7.43 6.78 4.72 43.0
GSA ZK406H 2.96 4.32 5.88 6.20 5.50 4.77 2.89 32.5
Peat 3.50 4.03 5.66 5.43 5.40 4.78 2.33 31.1
Pure Sand 3.94 3.87 5.01 5.23 4.81 4.41 2.69 30.0
LSD0.05 NS 1.49 0.67 1.58 0.77 0.55 1.00 5.05
Table 20b. Potassium leached in 2003.
Root zone mix 04/23 05/01 05/06 05/13 05/27 06/10 06/24 07/08 Total
----------------------------------- kg K ha-1 ---------------------------------
AgriBoost 7.94 5.77 4.61 4.94 5.37 6.79 5.31 5.01 44.9
Profile 8.92 6.83 6.30 7.05 6.08 7.13 4.49 8.60 56.2
GSA ZK406H 5.23 2.81 2.42 2.64 2.72 3.56 2.76 3.89 26.1
Peat 6.06 3.90 2.92 3.66 3.02 5.78 2.83 4.54 32.7
Pure Sand 4.82 3.48 3.02 3.70 3.26 3.58 2.42 4.61 28.9
LSD0.05 3.84 0.75 0.64 1.00 0.81 1.79 0.77 2.81 6.52

Phosphorus leaching has not been quantified in many putting green root zone mix
studies conducted under field conditions. Soluble P fertilizers are perennially applied to
putting greens having relatively high infiltration rates. Although P leaching is typically low
in mineral soils, there is reason to believe that P is quite susceptible to leaching in sand-
matrix root zones. A large portion of the water that leaches through the sand-matrix root
zone is carried off by drain pipe embedded in the pea gravel layer below the root zone mix.
The final destination of the leachate is commonly a body of water of one type or another
rather than groundwater, as is often mistakenly assumed. Therefore, monitoring P in
leachate from well drained putting greens becomes important in protecting surface water
quality.
Profile® leached 3 – 11 times more P than the remaining treatments during 2002,
with concentrations of ortho-phosphate typically exceeding 1 mg L-1 in the leachate – a
level 3-4 times greater than that of a hypereutrophic body of water. Differences between
the remaining treatments were not significant (Table 21a). In 2003, P leaching was
unexpectedly high in all treatments except AgriBoost® (Table 21b). Figure 15 shows the
mean concentration of inorganic P in the leachate of each treatment on 13 sampling dates.
Three apparent trends are observed: (1) P concentrations were high for the Profile®
treatment over the entire sampling period, (2) P concentrations increased with time for the
GSA, peat, and pure sand treatments, and (3) P concentrations were consistently low for
the AgriBoost® treatment over the 2 year period. Soil testing has yet to adequately explain
these results. Water soluble P and Bray-1 P did not reveal any significant correlation with
P leaching. Brye and others (2002) studied P leaching under a restored tallgrass prairie and

Table 21a. Phosphorus leached in 2002.
Root zone mix 06/06 07/08 08/11 09/09 09/27 10/14 11/29 Total
---------------------------------- kg P ha-1 ---------------------------------
AgriBoost 0.13 0.32 0.15 0.12 0.09 0.10 0.12 1.03
Profile 2.17 3.48 1.16 1.11 0.88 1.06 1.27 11.13
GSA ZK406H 0.13 0.45 0.58 0.38 0.26 0.31 0.38 2.49
Peat 0.79 1.03 0.68 0.27 0.25 0.30 0.36 3.67
Pure Sand 0.53 0.67 0.54 0.45 0.32 0.38 0.45 3.34
LSD0.05 1.37 2.42 0.73 0.43 0.27 0.32 0.31 4.46
Table 21b. Phosphorus leached in 2003.
Root zone mix 04/23 05/01 05/06 05/13 05/27 06/10 06/24 07/08 Total
--------------------------------- kg P ha-1 -----------------------------------
AgriBoost 0.17 0.14 0.23 0.24 0.21 0.21 0.23 0.29 1.8
Profile 1.27 2.10 2.68 3.06 2.42 3.34 3.24 2.80 21.2
GSA ZK406H 0.65 1.79 2.76 2.61 2.47 5.34 2.85 2.53 21.0
Peat 1.20 1.76 2.56 2.64 2.47 4.99 2.51 2.09 20.3
Pure Sand 1.00 1.68 2.61 2.69 2.42 5.03 2.57 2.26 20.5
LSD0.05 0.63 0.62 0.50 0.70 0.65 0.88 0.82 0.48 4.13
0
0.5
1
1.5
2
2.5
3
3.5
4
4.5
0 100 200 300 400
Days after seeding
Con
cent
ratio
n of
P in
leac
hate
, mg
L-1
AgriBoostProfileGSA ZK406HPeatPure sand
Profile
AgriBoost
Pure sand Peat
GSA ZK406H
Figure 15. Root zone mix effects on concentrations of P in leachate over time.

corn agroecosystems in southern WI. The authors also failed to find any correlation
between P leaching and water soluble or Bray-1 P. The presence of carbonates in the root
zone mix can affect P leaching, although AgriBoost® has a relatively large amount of
carbonates, no significant differences in % CCE were found in soil samples taken on 17
June 2003. The mean CCE value for all treatments was 2.1% with a standard deviation of
0.43.
Soil Tests
On 21 Sept. 2002 soil samples were taken at various depths and analyzed for Bray-
1 P and K. Relatively high soil test K values were observed in the AgriBoost® treatment
compared to the remaining treatments on this sampling date (Table A-4); therefore, K
applications were based on soil test results during the 2003 season. This resulted in 195 kg
ha-1 less K applied on the AgriBoost® treatment. Bray-1 K continued to remain
significantly higher in the AgriBoost® treatment than any other treatment on all soil
testing dates (Table 22) despite not receiving any noteworthy K applications (Table A-1).
These observations imply that a root zone amended with AgriBoost® will significantly
improve fertilizer K use efficiency, resulting in economic savings.
Another approach to managing K nutrition on sand-matrix root zones is to apply K
based upon tissue testing. For creeping bentgrass, sufficient tissue K is between 2.20 –
2.60 mg K g-1 (McCarty, 2001). In this study, tissue K seemed fairly independent of Bray-
1 K. The AgriBoost® treatment had tissue K levels below optimum on 4 of 13 dates (Table
A-11), but Bray-1 K never dipped below the University of Wisconsin’s sufficient

interpretation for golf course soils (Table 23). Conversely, every treatment except
AgriBoost® exhibited low to very low Bray-1 K on all sampling dates (Table 22), yet
tissue K was at least sufficient on 8 of 13 dates (Table A-11). Soil samples and tissue
samples were taken concurrently on 3 dates in 2003. A plot of tissue K vs. Bray-1 K for
these 3 dates suggests that 6 mg kg-1 Bray-1 K was sufficient for sand-matrix putting
greens and that UW soil test interpretations (Table 23) for golf turf require separate soil
test K interpretations for sand-matrix putting greens (Figure 16).
The AgriBoost® treatment consistently had the highest soil test P for all sampling
dates, and maintained significantly more Bray-1 P than the Profile®, peat, and GSA
ZK406H treatments throughout the 2003 season (Table 24). The soil test P of any
treatment never dipped below the University of Wisconsin’s ‘Medium’ soil test
interpretation for golf turf (Table 23). Additionally, most values were in the sufficient
range for all sampling dates.
Changes in root zone mix pH were observed over time (Table 25). The general
trend observed is that of decreasing pH with time until July 2003 when the pH values of all
treatments appear to be increasing. Additional measurements in coming years are needed
to draw more extensive conclusions.
Plant Parameters
Turfgrass clipping yield, color, and quality are the ultimate indicators the
agronomic performance of a root zone mix. In an effort to explain treatment differences
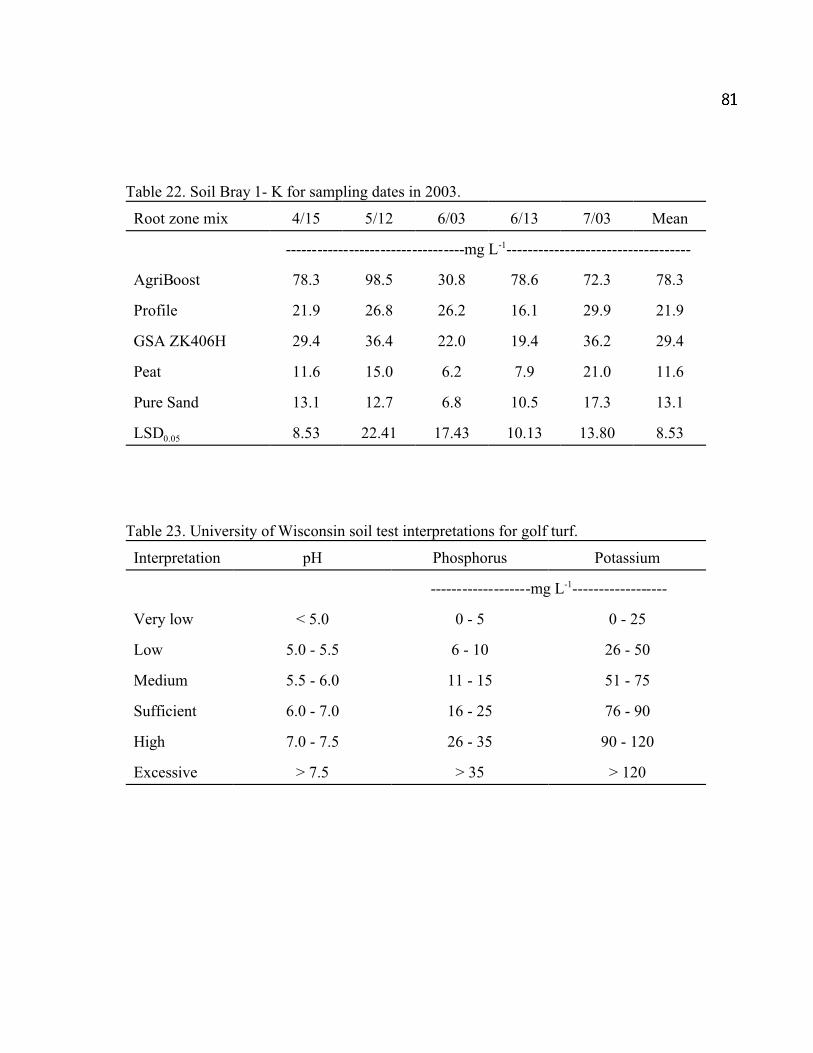
Table 22. Soil Bray 1- K for sampling dates in 2003.
Root zone mix 4/15 5/12 6/03 6/13 7/03 Mean
----------------------------------mg L-1-----------------------------------
AgriBoost 78.3 98.5 30.8 78.6 72.3 78.3
Profile 21.9 26.8 26.2 16.1 29.9 21.9
GSA ZK406H 29.4 36.4 22.0 19.4 36.2 29.4
Peat 11.6 15.0 6.2 7.9 21.0 11.6
Pure Sand 13.1 12.7 6.8 10.5 17.3 13.1
LSD0.05 8.53 22.41 17.43 10.13 13.80 8.53
Table 23. University of Wisconsin soil test interpretations for golf turf.
Interpretation pH Phosphorus Potassium
-------------------mg L-1------------------
Very low < 5.0 0 - 5 0 - 25
Low 5.0 - 5.5 6 - 10 26 - 50
Medium 5.5 - 6.0 11 - 15 51 - 75
Sufficient 6.0 - 7.0 16 - 25 76 - 90
High 7.0 - 7.5 26 - 35 90 - 120
Excessive > 7.5 > 35 > 120

Table 24. Soil Bray 1- P for sampling dates in 2003.
Root zone mix 4/15 05/12 06/03 06/17 07/01 Mean
----------------------------------mg L-1------------------------------
AgriBoost 24.5 26.0 17.5 18.7 18.1 24.5
Profile 16.4 21.4 16.5 14.6 12.1 16.4
GSA ZK406H 18.5 20.5 15.1 14.7 14.0 18.5
Peat 14.3 15.2 11.9 9.27 10.0 14.3
Pure Sand 21.2 21.4 16.8 16.6 14.7 21.2
LSD0.05 4.59 4.96 NS 3.88 6.50 4.57
Table 25. Changes in root zone mix pH over time.
Root zone mix Initial pH† 09/21/02 04/15/03 07/01/03
AgriBoost 9.03 8.48 7.81 7.86
Profile 8.68 8.04 7.43 7.53
GSA ZK406H 9.01 8.20 7.50 7.53
Peat 8.16 7.20 7.21 7.41
Pure Sand 8.94 8.04 7.35 7.58
LSD0.05 0.16 0.28 0.16 0.13
† pH of root zone mixes prior to putting green construction.

0
0.5
1
1.5
2
2.5
3
3.5
0 20 40 60 80 1
Bray-1 K, mg kg-1
Tiss
ue K
, %
00
3-Jun-03
17-Jun-03
1-Jul-03
Figure 16. Relationship between soil Bray-1 K and %K in turfgrass tissue on 3 sampling dates.

among these parameters, other parameters such as clipping nutrient content, root mass
density, and root zone moisture content were measured.
Significant differences among treatments in bentgrass clipping yields were
observed only for the first 3 clipping collection dates in 2002 (Table 26). These differences
appeared to reflect grow-in differences between the treatments in that they followed the
trend of density ratings (Table 14). An exception to this relationship was that the sand
treatment consistently had the greatest clipping yields but the lowest density ratings.
Turf quality ratings were taken routinely following the establishment period. The
AgriBoost® treatment had the highest quality rating when averaged over data from 2002
and 2003, and had a statistically better turf quality rating than the Profile® treatment
(Table 27). Differences among all other treatments over the same period were not
significant at the p = 0.05 level.
Turf color ratings were taken periodically throughout the 2002 and 2003 season,
including during the establishment period. In 2002, color rating differences among the
treatments were non-significant (Table 28a); while in 2003, the peat treatment produced a
statistically higher mean turf color rating than the Profile® treatment (Table 28b).
Differences among all other treatments were non-significant at the p = 0.05 level.
In this study, based on the 3 indicators of agronomic performance mentioned
above, the root zone amendments did not significantly affect the agronomic performance
of the putting greens after the establishment period, except in the comparison of the peat
and AgriBoost® treatments, which demonstrated certain agronomic advantages (turf color
and quality) compared to the Profile® treatment.

Table 26. Root zone mix effects on bentgrass clipping yields for 2002.
Root zone mix 06/18 07/08 07/22 08/05 08/19 09/17 10/01 10/15 Mean
------------------------------------- kg ha-1 ------------------------------------
AgriBoost 24.3 93.2 49.1 29.6 22.3 45.5 23.2 12.8 37.5
Profile 19.0 80.6 45.7 34.2 25.7 51.7 25.3 16.6 37.4
GSA ZK406H 22.5 86.7 48.5 34.6 22.1 49.1 22.5 13.6 37.4
Peat 32.0 89.7 53.2 32.1 22.5 49.0 20.5 13.3 39.0
Pure Sand 39.1 106.2 58.2 33.0 24.0 55.1 25.2 17.2 44.7
LSD0.05 15.23 20.89 10.90 NS NS NS NS NS NS
Table 27. Bentgrass quality ratings in 2002 and 2003†.
2002 2003
Root zone mix 8/05 9/09 5/01 5/13 5/27 6/09 6/24 7/08 Mean
AgriBoost 7.75 8.25 5.50 6.38 6.25 7.25 8.50 7.38 7.16
Profile 7.75 8.25 4.38 5.75 6.00 7.25 7.00 7.13 6.69
GSA ZK406H 7.63 8.13 5.13 6.13 6.50 7.25 7.50 7.13 6.92
Peat 7.63 8.13 5.75 6.63 6.25 7.38 7.63 7.50 7.11
Pure sand 7.25 8.25 5.50 6.25 6.00 7.25 7.75 7.25 6.94
LSD0.05 0.25 NS 0.74 0.69 NS NS 1.21 NS 0.43
†1 - 9 scale where 1 = dead or dormant turf, 6 = minimally acceptable, 9 = highest quality possible

Table 28a. Bentgrass color ratings in 2002†.
Root zone mix 5/30 6/06 6/14 6/27 7/12 8/02 8/20 9/09 10/01 Mean
AgriBoost 6.58 3.65 5.68 6.53 6.90 7.48 7.83 7.85 7.90 7.03
Profile 4.95 6.73 6.05 6.35 7.08 8.00 7.83 7.85 7.85 6.96
GSA ZK406H 5.90 6.35 5.85 6.33 6.90 7.75 7.85 7.88 7.98 6.98
Peat 4.08 6.95 6.35 6.30 7.05 8.15 7.85 7.90 8.10 6.97
Pure sand 3.88 6.63 6.63 6.75 6.93 8.00 7.95 7.98 8.05 6.98
LSD0.05 0.37 0.46 0.51 0.23 NS 0.52 NS 0.12 0.23 NS
†1 - 9 scale where 1 = brown, 6 = minimally acceptable color, 9 = darkest green possible
Table 28b. Bentgrass color ratings in 2003†.
Root zone mix 5/13 5/27 6/09 6/24 7/08 Mean
AgriBoost 6.55 6.00 7.73 7.98 7.75 7.20
Profile 6.20 5.75 7.75 7.63 7.25 6.92
GSA ZK406H 6.50 6.10 7.70 7.95 7.55 7.16
Peat 6.68 6.13 7.85 7.90 7.80 7.27
Pure sand 6.40 5.93 7.73 7.88 7.40 7.07
LSD0.05 NS 0.35 NS 0.26 0.53 0.31
†1 - 9 scale where 1 = brown, 6 = minimally acceptable color, 9 = darkest green possible

The clipping N, P, and K concentrations (Tables A-6 – A-11) and root growth
results (Table A-12) failed to account for the differences in color and quality among the
AgriBoost®, peat and Profile® treatments. The greater clipping yield produced by the sand
treatment was supported by that treatment’s relatively high N, P, and K tissue
concentrations.
Soil moisture readings were taken on 3 dates each in 2002 and 2003. Measurements
were taken at 5 depths within each root zone. AgriBoost® had the greatest volumetric
moisture content of all the root zone mixes in 2002 and 2003 (Table 29). The moisture
content of the Profile® treatment was statistically similar to that of the peat treatment in
2002 and 2003. These results do not reflect the differences in turf color and quality found
among the AgriBoost®, peat, and Profile® treatments. This may be expected, given that
root zone moisture content measurement by way of TDR does not estimate plant available
water. Waddington (1992) has shown that calcined clays hold water at tensions unavailable
for turfgrass use. The benefit of the calcined clay amendment is seen only during times of
extreme moisture stress (Miller, 2000), which never occurred during this study. Under
typical climatic conditions, the available water content of the Profile® is thought to be
lower than in other treatments, thus providing an explanation for the root zone mix
performance differences among the AgriBoost®, peat, and Profile® treatments.
Similar to findings reported by Kirkman (1996), a decrease in volumetric water
content of all root zone mixes was observed from the 1st year to the 2nd year (Table 29).
Kirkman (1996) attributed this decrease to the loss of organic matter through oxidation.
The same trend was observed in the present study for inorganic-amended root zone mixes

Table 29. Root zone volumetric moisture content means for sampling dates in 2002 and 2003.
2002 2003
Root zone mix 7/23 8/15 10/03 Mean 6/12 6/25 7/16 Mean
--------------------- % water by volume ----------------------
AgriBoost 14.9 15.3 13.7 14.6 7.1 10.5 10.5 9.4
Profile 15.0 12.8 13.0 13.6 3.6 7.5 8.9 6.7
GSA ZK406H 14.1 11.2 11.3 12.2 4.2 6.7 5.5 5.5
Peat 13.8 11.7 10.6 12.0 4.6 7.3 7.1 6.3
Pure sand 14.0 12.4 11.1 12.5 5.0 7.3 5.9 6.0
LSD0.05 1.31 2.75 1.04 1.55 0.83 1.36 1.58 1.04

devoid of organic matter. This suggests an explanation for the decrease lies elsewhere.
Tucker et al. (1990) documented the presence of hydrophobic organic coatings on sand
particles coinciding with the presence of localized dry spot. It is possible that an
accumulation of these hydrophobic coatings led to the decrease in soil moisture content in
this study from one year to the next.

SUMMARY AND CONCLUSIONS
The purpose of this research project was to assess the agronomic, environmental,
and economic advantages and disadvantages of using inorganic amendments in place of
sphagnum peat or no amendment in sand-matrix golf putting green root zone mixes. Data
collected from a 15-month field trial, a greenhouse investigation of water retention and
drainage rates, and numerous laboratory measurements support the following conclusions.
Agronomic Merits of the Root Zone Amendments
Over the course of this study, several agronomic responses to the various root zone
mixer were recorded. They included turfgrass quality, color, and establishment rate. Rapid
bentgrass establishment is a desirable characteristic with economic implications. During
the establishment period, The AgriBoost® and peat treatments improved bentgrass
establishment compared to all other treatments while the GSA ZK406H and Profile®
treatments significantly improved turfgrass establishment compared to the pure sand
treatment (Table 14). Once the putting greens are in play, the ability to sustain a high
quality playing surface is of paramount importance. The AgriBoost® treatment out-
performed the Profile® treatment in terms of turfgrass quality over the duration of the
study. The peat treatment had a significantly better mean color rating than the Profile®
treatment in 2003 (Table 28b). No single root zone mix characteristic could account for
these differences.

Although relatively large differences in root mass density were found among
treatments, those differences were not manifested in visual ratings. The GSA ZK406H,
Profile®, and pure sand treatments had significantly greater root mass density than the
AgriBoost® and peat treatments during the 2002 and 2003 seasons (Table A-12).
In summary, greens amended with AgriBoost® or Canadian sphagnum peat
provided agronomic advantages over unamended greens and those amended with GSA
ZK406H and Profile®.
Environmental Merits of the Root Zone Amendments
Environmental merits are more difficult to quantify in comparison to agronomic
and economic merits. The primary environmental parameter measured in this study was
nutrient leaching. The AgriBoost® treatment greatly reduced the amount of P leached
compared to all other treatments during the first 2 growing seasons (Tables 21a and 21b).
The GSA ZK406H treatment decreased NO3-N leaching significantly compared to the peat
treatment during establishment (Table 15). The value of each of these reductions in
nutrient leaching is specific to the needs of the individual construction site. The reduction
of NO3-N leaching attained by amending a root zone mix with GSA ZK406H pertained
only to the three month establishment period, after which the leaching of NO3-N from all
treatments declined to a level 7 times lower than the NO3-N concentration found in the
irrigation water when common management practices were followed. However, P leaching
increased with respect to time for most treatments and K leaching appeared to be relatively
constant over time throughout the course of the study.

Many golf courses use a small on-site pond (often replenished by well water) as the
irrigation water supply. The pond is also a reservoir for the drainage water from nearby
putting greens. Long-term P loading from the drainage water will degrade the quality of
the surface water, leading to a hypereutrophic system which invites costly renovations.
Therefore, a putting green amendment with the potential to reduce P loads in the drainage
water can be of enormous economic benefit to a golf course in this situation. Furthermore,
golf courses discharging drainage water into streams running through the course may be
subject to scrutiny by local, state, or national regulatory agencies. Amelioration costs could
be substantial.
Economic Merits of the Root Zone Amendments
Historically, prices of inorganic amendments have been relatively high compared to
organic amendments like peat. A typical 19-green construction project requires 5,352 m3 of
root zone mix (Moore, 1999). Using this figure to create a 90% sand 10% amendment mix
(v/v), 535 m3 of each amendment would be required. Figure 17 shows the cost of the
amendments and mixes used in this study using Moore’s (1999) calculations for amount of
root zone mix needed. The costs do not include shipping or blending. There is little doubt
that in this study the use of inorganic amendments greatly increased the total cost of the
corresponding root zone mix. Interestingly, amending the mix with peat actually decreased
the cost of the mix as the cost of peat was less than that of sand on a volume basis
(blending costs aside). AgriBoost® was the least expensive of the inorganic materials used

- 40% and 60% less expensive than GSA ZK406H on a volume and weight basis
respectively (Figure 17).
Nelson (2003) correctly reports that several researchers failed to show agronomic
benefits from using inorganic amendments in place of peat and uses this as the basis for
concluding that the use of inorganic amendments is not economically justifiable. However,
the author failed to mention studies that have shown environmental benefits of using
inorganic amendments. Although a price cannot be put on the 79% reduction in NO3-N
leaching during grow-in when GSA ZK406H was substituted as an amendment for peat in
this study (Table 15), it is unfair to conclude that this benefit does not have any value to
the turf industry. Similarly, the incorporation of AgriBoost® significantly reduced P
leaching compared to all other treatments including peat over the first two seasons of this
study (Figure 15). The value of such characteristics was alluded to in the previous section.
The root zone mixes did not differ significantly in pesticide or N and P fertilizer
requirements. However, the AgriBoost® treatment required only a fraction of the K
fertilizer needed by the other treatments to maintain adequate soil test K. During the 2003
season, soil test results indicated no need for K applications to the AgriBoost® green,
whereas other greens received 195 kg K2O ha-1 and soil tests still indicated the need for
additional K. This translates into a significant economic savings not only in reductions in
K fertilizer use, but also the labor required to make extra K applications.
In this study, the only economic variables that differed among treatments were the
cost of root zone mix materials, and the K fertilizer requirement. The AgriBoost® green
required 90% less fertilizer K in 2003 than all other treatments. Assuming a conservative

0
50,000
100,000
150,000
200,000
250,000
300,000
350,000
400,000
450,000
500,000
AgriBoost Profile GSAZK406H
Peat Pure Sand
Root zone amendment
Cos
t, D
olla
rs
AmedmentRoot zone mix
Figure 17. Cost of root zone mixes and amendments for a typical 19-green construction
project.

75% reduction in K fertilizer requirement each year for the life of the green (1 vs. 4 lb K2O
M-1), and a price of $1.10 kg-1 K2O, the fertilizer savings for 13,006 m2 [from Nelson
(2003)] of AgriBoost®-amended putting green surfaces compared to the other greens
examined in this study would be $1050, $2100, and $4200 after 5, 10, and 20 years
respectively.
During bentgrass grow-in, a 12 kg N ha-1 application was skipped on both zeolite
treatments due to color differences among treatments. Although the economic savings was
insignificant, reductions in fertilizer N use are known to increase root mass density. The
enhancement of the root system is more valuable than the fertilizer savings.
Reductions in water use could contribute to economic savings in situations where
the golf course uses municipal water for irrigation (urban areas). The results from the field
volumetric moisture content measurement of the root zone mixes suggests that
AgriBoost® has the potential to reduce water use compared to all other amendments.
Laboratory moisture release curves indicate that peat is an effective amendment for
increasing plant available water. Due to the limitations of the field irrigation system,
treatment differences regarding water use were not quantified.
Based on the results from this research project, the substitution of inorganic
materials in place of sphagnum peat is not warranted based on agronomic merits alone.
However, in situations where a reduction in N or P leaching is necessary, the high initial
cost of the inorganic-amended root zone mix is justified.
BIBLIOGRAPHY Ames, L.L. 1960. The cation sieve properties of clinoptilolite. Am. Mineral. 45:689-700. Andrews, R.D., A.J. Koski, J.A. Murphy, and A.M. Petrovic. 1999. Zeoponic materials
allow rapid greens grow-in. Golf Course Mgmt. 67(2):68-72. Armbruster, T., and M.E. Gunter. 2001. Crystal structures of natural zeolites, p. 1-57, In D.
L. Bish and D. W. Ming, eds. Natural zeolites: occurrence, properties, applications, Vol. 45. Mineralogical Society of America, Washington D.C.
Avila, M. 1999. Techniques for evaluating changes in chemical and mineralogical properties of acidified soils. M.S., University of Wisconsin, Madison, WI.
Barrer, R.M., J.A. Davies, and L.V.C. Rees. 1969. Thermodynamics and thermochemistry of cation exchange in chabazite. J. Inorg. Nucl. Chem. 29:2047-2063.
Beard, J.B. 2002. Turf management for golf courses. 2 ed. Ann Arbor Press, Chelsea, MI. Bigelow, C.A., D.C. Bowman, and D.K. Cassel. 2000. Sand-based rootzone modification
with inorganic soil amendments and sphagnum peat moss. USGA Green Sect. Rec. 38(4):7-13.
Bigelow, C.A., D.C. Bowman, and D.K. Cassel. 2001a. Nitrogen leaching in sand-based rootzones amended with inorganic soil amendments and sphagnum peat. J. Am. Soc. Hort. Sci. 126:151-156.
Bigelow, C.A., D.C. Bowman, D.K. Cassel, and T.W. Rufty, Jr. 2001b. Creeping bentgrass response to inorganic soil amendments and mechanically induced subsurface drainage and aeration. Crop Sci. 41:797-805.
Brady, N.C., and R.R. Weil. 2002. The nature and properties of soils. 13th ed. Prentice Hall, Upper Saddle River, NJ.
Carlson, M.S., C.L. Kerkman, and W.R. Kussow. 1998. Peats and supplements for root zone mixes. Golf Course Mgmt. 66(9):70-74.
Coombs, D.S., A. Alberti, T. Armbruster, G. Artioli, C. Colella, E. Galli, J.D. Grice, F. Liebau, J.A. Mandarino, H. Minato, E.H. Nickel, E. Passaglia, D.R. Peacor, S. Quartieri, R. Rinaldi, M. Ross, R.A. Sheppard, E. Tillmanns, and G. Vezzalini, (eds.) 1998. Recommended nomenclature for zeolite minerals: report of the subcommittee on zeolites of the International Mineralogical Association, Commission on New Minerals and New Names. Am Mineral Special Feature.
Ferguson, G.A., and I.L. Pepper. 1987. Ammonium retention in sand amended with clinoptilolite. Soil Sci. Soc. Am. J. 51:231-234.
Ferguson, G.A., I.L. Pepper, and W.R. Kneebone. 1986. Growth of creeping bentgrass on a new medium for turfgrass growth: clinoptilolite zeolite-amended sand. Agron. J. 78:1095-1098.
Gilman, G.P. 1979. A proposed method for the measurement of exchange properties of highly weathered soils. Aust. J. Soil Res. 17:129-139.
Gonzalez-Carrascosa, R., B.E. Branham, and P.E. Rieke. 1995. Leaching of nitrates during establishment of creeping bentgrass on high sand soils. CSSA Annual Meeting. 1995 Agronomy Abstracts:153.

Handreck, K.A., and N.D. Black. 2002. Growing media for ornamental plants and turf. 3rd. ed. University of New South Wales Press, Randwick, NSW, Australia.
Hey, M. 1930. Studies on zeolites: part I. general review. Mineral Mag.:422 - 437. Holder, M., K.W. Brown, J.C. Thomas, D. Zabcik, and H.E. Murray. 1991. Capillary-wick
unsaturated zone soil pore water sampler. Soil Sci. Soc. Am. J. 55:1195-1202. Horst, G.L., M.C. Engelke, and W. Meyers. 1984. Assessment of visual evaluation
techniques. Agron. J 76:619-622. Huang, Z.T., and A.M. Petrovic. 1994. Clinoptilolite zeolite influence on nitrate leaching
and nitrogen use efficiency in simulated sand based golf greens. J. Environ. Qual. 23:1190-1194.
Huang, Z.T., and A.M. Petrovic. 1996. Clinoptilolite zeolite effect on evapotranspiration rate and shoot growth rate of creeping bentgrass on sand base greens. J. Turf. Mgmt. 1:1-9.
Hummel, N.W., Jr. 1993a. Rationale for the revisions of the USGA green construction specifications. USGA Green Sect. Rec. 31(2):7-21.
Hummel, N.W., Jr. 1993b. Laboratory methods for evaluation of putting green root zone mixes. USGA Green Sect. Rec. 31(2):23-33.
Kallo, D. 2001. Applications of natural zeolites in water and wastewater treatment, p. 519-546, In D. L. Bish and D. W. Ming, eds. Natural zeolites: occurrence, properties, applications, Vol. 45. Mineralogical Society of America, Washington D.C.
Kerkman, C.L. 1996. Root zone amendment effects on the quality and nutritional status of creeping bentgrass putting greens. MS Thesis, University of Wisconsin, Madison, WI.
Kuo, S. 1996. Phosphorus, p. 869-920, In D. L. Sparks, ed. Methods of Soil Analysis: Part 3 Chemical Methods. American Society of Agronomy, Soil Science Society of America, Madison, WI.
Kussow, W.R. 1987. Peat in greens: knowns, unknowns and speculations. USGA Green Sect. Rec. 25(5):5-7.
Kussow, W.R. 1992. Performance standards for amendments in sand matrix putting greens: Submitted to O.J. Noer Turfgrass Research Foundation. University of Wisconsin, Madison, WI.
Kussow, W.R. 1999. My putting green grow-in program. The Grass Roots 28(1):23-35. Li, D., Y.K. Joo, N.E. Christians, and D.D. Minner. 2000. Inorganic soil amendment
effects on sand-based sports turf media. Crop Sci. 40:1121-1125. Liegel, E.A., C.R. Simson, and E.E. Schulte. 1980. Wisconsin soil testing plant analysis
and feed and forage analysis procedures. Soil fertility series no. 6 Dept. of Soil Science The University of Wisconsin, Madison, WI.
Loeppert, R.H., and D.L. Suarez. 1996. Carbonate and Gypsum, p. 437-474, In D. L. Sparks, ed. Methods of Soil Analysis: Part 3 Chemical Methods. American Society of Agronomy, Soil Science Society of America, Madison, WI.
MacKown, C.T., and T.C. Tucker. 1985. Ammonium nitrogen movement in a coarse-textured soil amended with zeolite. Soil Sci. Soc. Am. J. 49:235-238.
Mastalerz, J.W. 1977. The greenhouse environment : the effect of environmental factors on the growth and development of flower crops Wiley, New York.

McCarty, L.B. 2001. Best Golf Course Management Practices Prentice Hall, Upper Saddle River, NJ.
McCoy, E.L., and R.C. Stehouwer. 1998. Water and nutrient retention properties of internally porous inorganic amendments in high sand content root zones. J. Turf. Mgmt. 2:49-69.
McGuire, P.E., and B. Lowery. 1992. Evaluation of several vacuum solution samplers in sand and silt loam at several water potentials. Ground Water Monitoring Review 11:151-160.
Miller, G.L. 2000. Physiological response of bermudagrass grown in soil amendments during drought stress. HortScience 35:213-216.
Ming, D.W., and E.R. Allen. 2001. Use of natural zeolites in argonomy, horticulture, and environmental soil remediation, p. 619-649, In D. L. Bish and D. W. Ming, eds. Natural zeolites: occurrence, properties, applications, Vol. 45. Mineralogical Society of America, Washington D.C.
Minner, D.D., J.H. Dunn, S.S. Bughrara, and B.F. Fresenburg. 1997. Effect of topdressing with "Profile M" porous ceramic clay on putting green quality, incidence of dry spot and hydraulic conductivity. Int. Turfgrass Soc. Res. J. 8:1240-1249.
Mulvaney, R.L. 1996. Nitrogen-inorganic forms, p. 1131-1139, In D. L. Sparks, ed. Methods of Soil Analysis: Part 3 Chemical Methods. American Society of Agronomy, Soil Science Society of America, Madison, WI.
Murphy, J.A., and H.P. Riley. 1962. A modified single solution method for the determination of phosphate in natural waters. Anal. Chim. Acta 27:31-36.
Nelson, M. 2003. Dollars and "sense" to improve soil properties. USGA Green Sect. Rec. 41(3):10-13.
Ok, C.-H., E.H. Ervin, S.H. Anderson, and J.H. Dunn. 2001. Amendments and constructions systems for improving performance of sand-based greens. CSSA Annual Meeting. ASA Abstracts.
Petrovic, A.M. 1993. Research Update: Potential for natural zeolite uses on golf courses. USGA Green Sect. Rec. 31(1):11-14.
Qian, Y.L., A.J. Koski, and R. Welton. 2001. Amending sand with isolite and zeolite under saline conditions: leachate composition and salt deposition. HortScience 36:717-720.
Reed, D.W. 1996. A Grower's guide to water, media, and nutrition for greenhouse crops Ball Pub., Batavia, Ill., USA.
Salmon, R.C. 1964. Cation exchange reactions. J. Soil Sci. 15:273-283. Sartain, J.B. 1995. Effects of clay and polymer amendments on the physical and chemical
properties of soil. J. Turf. Mgmt. 1:1-18. Sheard, R.W., M.A. Haw, G.B. Johnson, and J.A. Ferguson. 1985. Mineral nutrition of
bentgrass on sand rooting systems, p. 469-485, In F. L. Lemaire, ed. Proc 5th Int. Turfgrass Research Conf., Avignon, France. 1-5 July. INRA Paris, France.
Skogley, C.R., and C.D. Sawyer. 1992. Field Research, p. 590-614, In D. V. Waddington, ed. Turfgrass, Vol. 32. ASA CSA SSSA, Madison, WI.
Snyder, G.H., E.O. Burt, and J.M. Davidson. 1981. Nitrogen leaching in Bermudagrass turf: 2. Effect of nitrogen sources and rates, p. 313-324, In R. W. Sheard, ed. Proc.

4th Int. Turfgrass Research Conf., Univ. Guelph, Ontario. 19-23 July. Univ. of Guelph, Guelph, Canada and Int. Turfgrass Soc.
Taylor, D.H., S.D. Nelson, and C.F. Williams. 1993. Sub-root zone layering effects on water retention in sports turf soil profiles. Agron. J. 85:626-630.
Thomas, G.W. 1996. Soil pH & Soil Activity, p. 487, In D. L. Sparks, ed. Methods of Soil Analysis: Part 3 Chemical Methods. American Society of Agronomy, Madison, WI.
Tucker, K.A., K.J. Karnok, D.E. Radcliffe, G. Landry, Jr., R.W. Roncadori, and K.H. Tan. 1990. Localized dry spots as caused by hydrophobic sands on bentgrass greens. Agron. J. 82:549-555.
Turgeon, A.J. 2002. Turfgrass management. 6th ed. Prentice Hall, Upper Saddle River, NJ. USGA. 1960. Specifications for a method of putting green construction. USGA J. Turf
Mgmt. 13(5):24-28. USGA. 1993. Specifications for a method of putting green construction. USGA Green
Sect. Rec. 31(2):1-3. USGA. 1997. Organic matter minimum dropped from USGA green construction
recommendations. USGA Green Section Record 35(3):24. Waddington, D.V. 1992. Soil mixtures and amendments, p. 331-384, In D. V. Waddington,
et al., eds. Turfgrass, Vol. 32. ASA CSSA SSSA, Madison, WI. Waltz, C., and B. McCarty. 2000. Soil amendments affect turf establishment rate. Golf
Course Mgmt. 68(7):59-63. Watanabe, F.S., and S.R. Olsen. 1965. Test of an ascorbic acid method for determining
phosphorus in water and NaHCO3 extracts from soil. Soil Sci. Soc. Am. Proc. 29:677-678.
Weber, M.A., K.A. Barbarick, and D.G. Westfall. 1983. Ammonium adsorption by a zeolite in a static and a dynamic system to reduce the leaching losses of nitrogen fertilization. J. Environ. Qual. 12:549-552.

APPENDIX

Table A-1. 2003 field fertilization schedule
ApplicationDate Fertilizer Grade Fertilization Rate N source
TreatmentsFertilized
% N - P2O5 - K2O kg N - P2O5 - K2O / ha
04/15/03 46-0-0 19.5 - 0.0 - 0.0 100% Urea N All
05/03/03 18-3-4 2.9 - 0.5 - 0.5 19% Ammoniacal N81% Urea N
All
05/08/03 24-4-12 26.4 - 4.4 - 13.2 3% Ammoniacal N38% Urea N22% WSN†37% WIN‡
All
05/21/03 18-0-3 4.9 - 0.0 - 1.0 74% Ammoniacal N26% WIN‡
All
05/27/03 46-0-0 29.2 - 0.0 - 0.0 100% Urea N All
06/09/03 0-0-50 0.0 - 0.0 - 97.6 Profile,GSA, Peat,Pure sand
06/25/03 0-0-50 0.0 - 0.0 - 97.6 Profile,GSA, Peat,Pure sand
07/08/03 46-0-0 12.2 - 2.0 - 6.1 100% Urea N All
07/10/03 18-0-3 4.9 - 0.0 - 1.0 74% Ammoniacal N26% WIN‡
All
† WSN, water soluble nitrogen‡ WIN, water insoluble nitrogen

Table A-2. 2002 - 03 fungicide applications.
Application Date Pesticide Name Rate
06/14/02 fosetyl-aluminum 8 oz/M
07/05/02 fosetyl-aluminum 8 oz/M
08/28/02 chlorothalonil 6 oz/M
09/23/02 iprodione 4 oz/M
11/02/02 chlorothalonil 2.75 oz/M
11/02/02 iprodione 2 oz/M
11/11/02 chlorothalonil 2.75 oz/M
11/11/02 iprodione 2 oz/M
06/13/03 chlorothalonil 6 oz/M

Table A-3. Chemical properties of irrigation water.
Chemical property Value
pH 8.2
Bicarbonate, ppm 359.3
Electrical conductivity, mmhos cm-1 0.70
Total soluble salts, ppm 448
Sodium Absorption Ratio, meq L-1 0.50
Na, ppm 9.0
Cl, ppm 43
B, ppm 0.01
NO3, ppm 7.10
PO4, ppm 0.01
K, ppm 1.30
Mg, ppm 46.0
Ca, ppm 68.9
SO4, ppm 21.0
Mn, ppm 0.01
Fe, ppm 0.02

Table A-4. Bray-1 P and K by depth for root zone mixes sampled on 21 Sept. 2002.
Root zone mix Depth Bray-1 P Bray-1 K
cm -------------- mg kg-1 -------------
AgriBoost 0 to 1 61.7 69.6
1 to 2 25.4 83.3
2 to 3 18.6 91.7
3 to 4 13.2 109.9
4 to 5 11.4 121.0
5 to 7 8.7 74.5
7 to 9 7.6 110.1
9 to 11 7.2 112.4
11 to 13 6.5 125.8
13 to 15 6.0 110.2
15 to 19 5.9 99.7
below 19 5.2 122.5
Profile 0 to 1 58.4 18.5
1 to 2 24.8 15.2
2 to 3 16.3 14.8
3 to 4 10.6 15.3
4 to 5 8.8 15.4
5 to 7 7.7 15.7
7 to 9 7.2 16.0
9 to 11 6.1 17.2
11 to 13 5.4 16.2
13 to 15 5.2 16.8
- continued -

Table A-4. (continued)
Root zone mix Depth Bray-1 P Bray-1 K
cm -------------- mg kg-1 -------------
Profile 15 to 19 5.1 16.8
below 19 4.9 17.2
GSA ZK406H 0 to 1 70.6 26.1
1 to 2 28.6 21.4
2 to 3 17.2 21.4
3 to 4 12.8 20.9
4 to 5 10.9 21.0
5 to 7 11.1 20.5
7 to 9 8.6 22.6
9 to 11 6.5 22.5
11 to 13 6.1 22.2
13 to 15 5.9 21.1
15 to 19 5.8 22.1
below 19 4.1 22.6
Peat 0 to 1 44.4 13.8
1 to 2 21.7 12.9
2 to 3 13.7 12.7
3 to 4 11.7 12.8
4 to 5 10.1 12.7
5 to 7 9.7 12.7
7 to 9 8.3 12.7
- continued -

Table A-4. (continued)
Root zone mix Depth Bray-1 P Bray-1 K
cm -------------- mg kg-1 -------------
Peat 9 to 11 7.1 12.6
11 to 13 6.6 12.7
13 to 15 5.7 12.7
15 to 19 4.6 12.7
below 19 3.3 12.7
Pure sand 0 to 1 60.4 14.1
1 to 2 36.6 12.9
2 to 3 22.2 12.7
3 to 4 13.5 12.8
4 to 5 8.7 12.7
5 to 7 7.7 12.8
7 to 9 6.4 12.7
9 to 11 6.2 12.8
11 to 13 5.0 12.7
13 to 15 4.7 12.7
15 to 19 4.8 12.7
below 19 3.5 12.7

Table A-5. Root zone mix effects on bentgrass clipping yields in 2003.
Root zone mix 05/21 06/03 06/17 07/01 Mean
------------------------------ kg ha-1 -----------------------------
AgriBoost 14.53 26.08 30.98 27.08 24.67
Profile 13.11 24.02 29.71 34.80 25.41
GSA ZK406H 16.77 26.96 30.15 30.61 26.12
Peat 18.65 27.99 31.79 34.76 28.30
Pure Sand 18.46 25.37 34.78 31.59 27.55
LSD0.05 NS NS NS NS NS
Table A-6. Nitrogen concentrations in bentgrass clippings in 2002..
Root zone mix 06/18 07/08 07/22 08/05 08/19 09/17 10/01 10/15 Mean
---------------------------------- mg N g-1 ---------------------------------
AgriBoost 2.72 3.47 4.02 4.34 3.29 4.20 3.20 3.49 3.56
Profile 2.65 3.36 3.93 4.24 3.26 3.75 3.23 3.44 3.49
GSA ZK406H 3.12 3.47 3.75 4.23 3.35 4.10 3.35 3.51 3.60
Peat 2.96 3.43 3.92 4.05 3.26 3.95 3.35 3.68 3.59
Pure Sand 3.43 3.87 3.99 4.30 3.54 4.00 3.20 3.44 3.73
LSD0.05 0.52 0.32 NS NS NS 0.17 NS 0.27 0.15

Table A-7. Nitrogen concentrations in bentgrass clippings in 2003.
Root zone mix 05/21 06/03 06/17 07/01 Mean
---------------------------- mg N g-1 ---------------------------
AgriBoost 3.45 3.94 3.59 2.96 3.48
Profile 3.38 3.94 3.40 2.90 3.42
GSA ZK406H 3.51 4.04 3.61 2.90 3.51
Peat 3.46 4.08 3.63 2.72 3.47
Pure Sand 3.45 4.15 3.55 2.82 3.49
LSD0.05 NS NS NS NS NS

Table A-8. Phosphorus concentrations in bentgrass clippings in 2002.
Root zone mix 06/18 07/08 07/22 08/05 08/19 09/17 10/01 10/15 Mean
----------------------------------- mg P g-1 ----------------------------------
AgriBoost 0.40 0.44 0.48 0.41 0.39 0.47 0.39 0.34 0.41
Profile 0.33 0.40 0.43 0.43 0.38 0.42 0.39 0.33 0.39
GSA ZK406H 0.42 0.46 0.51 0.47 0.42 0.50 0.40 0.34 0.44
Peat 0.40 0.48 0.50 0.45 0.41 0.49 0.39 0.34 0.43
Pure Sand 0.40 0.48 0.52 0.46 0.40 0.51 0.39 0.35 0.44
LSD0.05 NS 0.03 0.04 0.04 0.02 0.07 NS 0.01 0.01
Table A-9. Phosphorus concentrations in bentgrass clippings in 2003.
Root zone mix 05/21 06/03 06/17 07/01 Mean
---------------------------- mg K g-1 ---------------------------
AgriBoost 0.76 0.80 0.79 0.61 0.74
Profile 0.70 0.78 0.74 0.56 0.69
GSA ZK406H 0.78 0.87 0.81 0.75 0.80
Peat 0.73 0.85 0.86 0.62 0.76
Pure Sand 0.75 0.89 0.80 0.71 0.79
LSD0.05 0.06 0.05 0.08 0.10 0.05

Table A-10. Potassium concentrations in bentgrass clippings in 2002.
Root zone mix 06/18 07/08 07/22 08/05 08/19 09/17 10/01 10/15 Mean
----------------------------------- mg K g-1 ----------------------------------
AgriBoost 1.72 2.16 3.17 2.58 2.48 2.63 2.16 2.44 2.42
Profile 1.29 2.06 2.87 2.75 2.68 2.40 2.02 2.36 2.30
GSA ZK406H 1.68 1.82 3.43 2.90 2.53 2.83 2.38 2.47 2.51
Peat 1.49 1.68 2.71 2.53 2.51 2.87 2.25 2.42 2.31
Pure Sand 1.81 2.03 3.08 2.83 2.55 3.09 2.25 2.52 2.52
LSD0.05 0.26 0.46 0.58 0.24 NS 0.49 0.22 NS 0.16
Table A-11. Potassium concentrations in bentgrass clippings in 2003.
Root zone mix 05/21 05/27 06/03 06/17 07/01 Mean
---------------------------- mg K g-1 ---------------------------
AgriBoost 2.21 2.64 2.52 2.51 1.74 2.32
Profile 2.07 2.48 2.59 2.64 1.54 2.27
GSA ZK406H 2.08 2.59 2.65 2.79 1.74 2.37
Peat 2.05 2.45 2.54 2.98 1.86 2.38
Pure Sand 2.14 2.54 2.49 2.89 1.86 2.39
LSD0.05 NS 0.09 NS 0.36 NS NS

Table A-12. Root zone mix effects on root mass density on 5 sampling dates.
Root zone mix 7/12/02 9/21/02 10/30/02 5/13/03 7/8/03 Mean
-----------------------------------kg m-3----------------------------------
AgriBoost 0.91 2.06 2.15 2.63 1.35 1.82
Profile 1.04 3.10 3.09 1.89 1.99 2.22
GSA ZK406H 1.30 3.75 2.73 1.99 1.71 2.30
Peat 1.47 2.21 1.58 2.31 1.76 1.86
Pure sand 1.28 2.79 2.98 1.91 1.82 2.16
LSD0.05 0.35 0.51 0.84 0.34 0.22 0.24
Table A-13. Volumetric water contents of all treatments averaged by depth.
2002 2003
Depth 7/23 8/15 10/03 Mean 6/12 6/25 7/16 Mean
cm ------------------------- % water by volume --------------------------
5 8.5 4.8 6.6 6.6 5.1 4.5 5.5 5.0
10 10.3 7.3 ND 8.8 3.6 4.2 3.2 3.7
15 12.8 10.8 7.8 10.5 3.7 5.7 4.7 4.7
20 16.6 14.8 ND 15.7 4.9 9.4 8.5 7.6
25 23.4 25.8 11.3 20.1 7.2 15.1 16.1 12.8
LSD0.05 1.31 2.75 0.40 NA 0.83 1.36 1.58 1.04

Table A-14. Volumetric water contents of treatments by depth.
Root zone mix Depth 7/23 8/15 10/03 6/12 6/25 7/16
cm ---------------% volumetric water content---------------
AgriBoost 5 8.0 4.9 7.6 6.6 7.0 7.6
10 10.4 8.7 ND 4.9 6.3 5.0
15 13.3 13.5 8.3 5.2 8.2 7.3
20 18.3 17.0 ND 7.5 12.6 13.1
25 24.2 32.6 12.7 11.4 18.5 19.5
Profile 5 9.0 4.0 7.1 3.8 2.3 4.1
10 10.0 6.6 ND 2.8 3.8 3.4
15 13.3 10.9 8.6 3.3 5.7 5.5
20 17.3 15.9 ND 3.3 9.7 10.8
25 25.3 26.9 13.6 4.9 15.8 20.5
GSA ZK406H 5 9.0 4.6 6.5 3.8 2.3 3.6
10 10.6 7.3 ND 2.7 3.3 1.6
15 12.9 9.8 7.7 3.8 4.9 2.9
20 17.0 14.7 ND 4.4 8.9 6.8
25 20.6 19.5 10.6 6.1 14.0 12.5
Peat 5 10.2 7.0 6.6 6.0 7.4 7.6
10 11.1 8.7 ND 4.4 5.4 5.0
15 12.9 10.9 7.3 3.3 5.9 4.8
20 15.1 13.5 ND 3.9 7.7 6.8
25 19.7 18.7 8.7 5.2 10.1 11.4
Pure sand 5 6.3 3.3 5.3 5.3 3.5 4.6
10 9.2 5.3 ND 3.2 2.3 0.7
15 11.7 9.1 6.9 2.9 3.9 2.7
20 15.3 12.7 ND 5.4 7.9 5.1
25 27.2 31.5 10.9 8.4 17.0 16.5