Embed Size (px)
Citation preview
CRITERIA FOR A RECOMMENDED STANDARD. OCCUPATIONAL EXPOSURE TO
INORGANIC LEADRevised Criteria - 1978
U. S. DEPARTMENT OF HEALTH, EDUCATION, AND WELFARE Public Health Service Center for Disease ControlNational Institute for Occupational Safety and Health

criteria for a recommended standard. . .
OCCUPATIONAL EXPOSURE TO
INORGANIC LEADR ev i se d C r i t e r i a - 1978
U.S. DEPARTM ENT OF HEALTH, EDUCATIO N, A N D W ELFARE
Public Health Service
Center for Disease Control
National Institute for Occupational Safety and Health
May 1978F o r » a le b y th e S u p e r in te n d e n t of D o c u m e n t* , U .S . G o v e r n m e n t
P r in t in g O f f ic e , W a sh in g to n . D .C . 20402
DISCLAIMER
Mention of company name or product does not constitute
endorsement by the National Institute for Occupational
Safety and Health.
DHEW (NIOSH) Publication No. 78-158
PREFACE TO THE REVISED RECOMMENDED STANDARD
The original criteria document for an Occupational Exposure to
Inorganic Lead was published January 5, 1973.
On January 15, 1976, the Occupational Safety and Health Administration
published a proposal for a revised occupational health standard for
inorganic lead. At the same time NIOSH initiated an evaluation of the
scientific literature published since the original document was issued.
The Occupational Safety and Health Administration held hearings during the
period of July 1-15, 1977, at which NIOSH presented testimony. This
revised criteria document is based on the new information gained from the
literature evaluation and reflects the NIOSH testimony which is included as
Appendix V.
The primary changes in the recommended standard are a lowering of the
permissible exposure level from 150 to 100 jtg/m3, lowering of the maximum
blood level from 80 to 60 ¿tg/100 g, revised recommendations for respiratory
protection, and more up-to-date recommendations regarding work practices
and sanitation.
New information on biologic effects, sampling qpd analysis, and work
practices and sanitation are included £^ Appendix
Dpnatislstiint Surgeon General
.ccing Director, National Institute for Occupational Safety and Health
ill
The Office of Research and Standards Development,
National Institute for Occupational Safety and
Health, had primary responsibility for development
df the criteria and recommended standard for
itiotganic lead. Keith H. Jacobson, Ph.D., had
plrogram responsibility and Robert E. Seiter served
as criteria manager. Frank W. Mackison had program
responsibility for preparation of the revised
recommended standard for inorganic lead.
iv
NIOSH REVIEW COMMITTEE FOR
REVISED RECOMMENDED INORGANIC LEAD STANDARD
Edward L. Baker, M.D.Bureau of EpidemiologyCenter for Disease Control
Kenneth Bridboard, M.D.Office of Extramural Coordination
and Special Projects
John M. BryantDivision of Physical Science
and Engineering
Frank L. Mitchell, D.O.Division of Criteria Documentation
and Standards Development
Theodore Thoburn, M.D.Division of Surveillance, Hazard Evaluation
and Field Studies
Robert H. SchützDivision of Safety Research
v
PREFACE
The Occupational Safety and Health Act of 1970 emphasizes the need
for standards to protect the health and safety of workers exposed to an
ever-increasing number of potential hazards at their workplace. To
provide relevant data from which valid criteria and effective standards
can be deduced, the National Institute for Occupational Safety and
Health has projected a formal system of research, with priorities
determined on the basis of specified indices.
It is Intended to present successive reports as research and
epidemiologic studies are completed and sampling and analytical methods
are developed. Criteria and standards will be reviewed periodically to
ensure continuing protection of the worker.
I am pleased to acknowledge the contributions to this report on
Inorganic lead by my staff and the valuable constructive comments by the
Review Consultants on Inorganic Lead, by the ad hoc committee of the
American Academy of Industrial Hygiene, by Robert P. O'Connor, M. T).,
NIOSH consultant in occupational medicine, and Edwin C. Hyatt on
respiratory protection. The NIOSH recommendations for standards are not
necessarily a consensus of all of the consultants and professional
societies that reviewed this criteria document on inorpanic lead. A
list of the NIOSH Review Committee members and of the Review Consultants
appears on pages iii and iv.[revised pages vii and viii].
Marcus M. Key, M.D. \ y Director, National Institute for Occupational Safety and Health
NIOSH REVIEW COMMITTEE ONINORGANIC LEAD
Thomas L. AnaniaDivision of Technical Services
John M. Bryant Acting Deputy DirectorDivision of Laboratories and Criteria Development
Paul E. Caplan Deputy Director,Division of Technical Services
Herbert E. Christensen, D.Sc.Deputy Assistant Institute Director for
Research and Standards Development
Lester D. Scheel, Ph.D.Division of Laboratories and Criteria Development
Robert N. Ligo, M.D.Division of Technical Services
Harry GilbertOccupational Safety and Health Administration Office of Standards Department of Labor
vii

NIOSH REVIEW CONSULTANTS ONINORGANIC LEAD
Frederick A. LindePresidential Assistant for Health and SafetyOil, Chemical and Atomic Workers International UnionDenver, Colorado 80201
Kenneth W. NelsonDirector, Department of Environmental Sciences American Smelting & Refining Company Salt Lake City, Utah 84119
Leonard D. PagnottoChief of LaboratoryDivision of Occupational HygieneMassachusetts Department of Labor and IndustriesBoston, Massachusetts 02116
Lawrence T. SchaferAssociate Professor of Environmental Health University of Cincinnati College of Medicine Cincinnati, Ohio 45219
Ralph G. Smith, Ph.D.Professor of Environmental and Industrial Health University of Michigan School of Public Health Ann Arbor, Michigan 48104
Carl Zenz, M.D.Medical Director,Allis-Chalmers Manufacturing Company West Allis, Wisconsin 53214
CRITERIA DOCUMENT: REVISED RECOMMENDATIONS FOR ANOCCUPATIONAL EXPOSURE STANDARD FOR INORGANIC LEAD
CONTENTS
PREFACE TO THE REVISED RECOMMENDED STANDARD................................. iii
REVIEW COMMITTEES FOR REVISED RECOMMENDED STANDARD............................ v
PREFACE........................................................................ vi
REVIEW COMMITTEES............................................................. viii
I. REVISED RECOMMENDATIONS FOR AN INORGANIC LEAD STANDARD........... 1-1
Section 1 - Environmental........................................... 1-1Section 2 - Medical................................................. 1-2Section 3 - Labeling (Posting)............. '...................... 1-4Section 4 - Personal Protective Equipment and Work Clothing 1-5Section 5 - Apprisal of Employees of Hazards from Inorganic
Lead............................................................... 1-9Section 6 - Work Practices and Emergency Procedures............... 1-10Section 7 - Sanitation Practices....................................1-10Section 8 - Monitoring, Recordkeeping, and Reporting
Requirements.......................................................1-11
II. INTRODUCTION....................................................... II-l
III. BIOLOGIC EFFECTS OF EXPOSURE......................................III-l
Extent of Exposure................................................ III-lEarly Historical Reports......................................... III-2Effects on Humans................................................. III-3Epidemiologic Studies............................................ III-6Animal Toxicity................................................... 111-10Correlation of Exposure and Effect.............................. 111-15
IV. ENVIRONMENTAL DATA............................................... IV-1
V. DEVELOPMENT OF STANDARD.......................................... V-l
Basis for Previous Standards..................................... V-lBasis for Recommended Environmental Standard and Biologic
Monitoring, (see NIOSH testimony, Appendix V. page XII-1)... V-2Basis for Environmental Sampling and Analytical Method......... V-8Basis for Biologic Analytical Method............................ V-9
VI. REFERENCES........................................................ VI-1
VII. APPENDIX I - Method for Sampling of Lead in air............... VII-1
VIII. APPENDIX II - Dithizone Method of Analysis of Leadand Biologic Samples.............................. VIII-1
IX. APPENDIX III - Material Safety Data Sheet....................... IX-1
X. TABLES.............................................................. xi
XI. APPENDIX IV - Review, Evaluation, and Summarization of Literatureto Support the Update and Revision of Criteria Documents: Inorganic Lead........................ Xl-i
XII. APPENDIX V - Statement of Edward J. Baier, Deputy Director,National Institute for Occupational Safety andHealth Before the Department of Labor PublicHearing on Occupational Lead Standard, March 1977.XII-1
x
I. REVISED RECOMMENDATION FOR AN INORGANIC LEAD STANDARD
The National Institute for Occupational Safety and Health (NIOSH)
recommends that employee exposure to inorganic lead in the workplace be
controlled by adherence to the following sections. The standard is
designed to protect the health and safety of workers for a 10-hour day, 40-
hour week over a working lifetime; compliance with the standard should
therefore prevent adverse effects of lead on the health and safety of
workers. The standard is measurable by techniques that are valid,
reproducible, and available to industry and government .agencies.
Sufficient technology exists to permit compliance with the recommended
standard. The criteria and standard will be subject to review and revision
as necessary.
"Inorganic lead" means lead oxides, metallic lead, and lead salts
(including organic salts such as lead soaps but excluding lead arsenate).
"Exposure to inorganic lead" is defined as exposure above half the recom
mended workroom environmental standard. Exposures at lower environmental
concentrations will not require adherence to the following sections, except
for Section 7(a).
Section 1 - Environmental (workplace air) - (see NIOSH testimony Appendix V
- page XII-1)
(a) Concentration
Occupational exposure to inorganic lead shall be controlled so that
workers shall not be exposed to inorganic lead at a concentration greater
than 0.10 mg Pb/m^ determined as a time-weighted average (TWA) exposure for
an 10-hour workday, 40-hour work week.
(b) Sampling and Analysis
1-1

Procedures for collection of environmental samples shall be as
provided in Appendix I, or by an equivalent method. Analysis of samples
shall be as provided in Appendix II, or by any method shown to be
equivalent in precision and accuracy to the method specified in Appendix
II.
Section 2 - Medical - (see NIOSH testimony Appendix V - page XII-1)
Medical monitoring (biologic monitoring and medical examinations)
shall be made available to workers as outlined below.
(a) Biologic monitoring
Biologic monitoring shall be made available to all workers subject to
"exposure to inorganic lead." This consists of sampling and analysis of
whole blood for lead' content. Such monitoring shall be performed to ensure
that no worker absorbs an unacceptable amount of lead. Unacceptable
absorption of lead posing a risk of lead poisoning is demonstrated at
levels of 0.060 mg Pb/100 g of whole blood or greater.
Procedures for sampling and analysis of blood for lead shall be as
described in Appendix II, or by any method shown to be equivalent in
precision and accuracy.
All workers subject to "exposure to inorganic lead" shall be offered
biologic monitoring at least every 6 months. The schedule of biologic
monitoring may be made more frequent if indicated by a professional
industrial hygiene survey. If environmental sampling and analysis show
that environmental levels are at or greater than the recommended
environmental levels, the Interval of biologic monitoring shall be halved,
I.e. blood analysis shall be conducted quarterly. This increased frequency
shall be continued for at least 6 months after the high environmental level
has been shown.
1-2
If a blood lead level of 0.060 mg Pb/100 g or greater is found, and
confirmed by a second sample to be taken within two weeks, steps to reduce
absorption of lead shall be taken as soon as the high levels are confirmed.
Steps to be considered should include improvement of environmental
controls, of personal protection or personal hygiene, and use of
administrative controls. A medical examination for possible lead poisoning
shall be made available to workers with unacceptable blood lead levels.
(b) Medical examination
Medical examinations should be made available prior to employee
placement and annually thereafter unless a different frequency is indicated
by professional medical judgment based on such factors as emergencies,
variations in work periods, and prexisting health status of individual
worker. These examinations should focus on the blood-forming elements, the
kidney, and the nervous and reproductive systems. They should include a
physical examination, complete blood counts, blood lead determinations,
routine urinalysis (specific gravity, sugar and protein determinations, and
microscopic examination), and should record any signs or symptoms of
plumbism, if present. It should be noted that, in addition to the
recommended methods for blood analysis, zinc protoporphyrin (ZPP) shows
promise of being a very useful, more direct measure of lead activity. This
additional blood test may be considered as an adjunct to the biologic
monitoring program.
Each employee who absorbs unacceptable amounts of lead as indicated by
biologic monitoring shall be examined as soon as practicable after such
absorption is demonstrated and confirmed, and at least every 3 months
thereafter until blood lead levels have returned to below the acceptable
limit, i.e. below 0.060 mg/100 g of blood. If clinical evidence of
1-3
plumbism is developed from these medical examinations, the worker shall be
kept under a physician's care until the worker has completely recovered or
maximal improvement has occurred.
Medical records shall include information on all biologic
determinations and on all required medical examinations. These records
shall be available to the medical representatives of the employer, of the
Secretary of Labor, of the Secretary of Health, Education, and Welfare,
and, at the employee's request, to the employee's physician. These records
shall be kept for at least 30 years after the last occupational exposure to
inorganic lead.
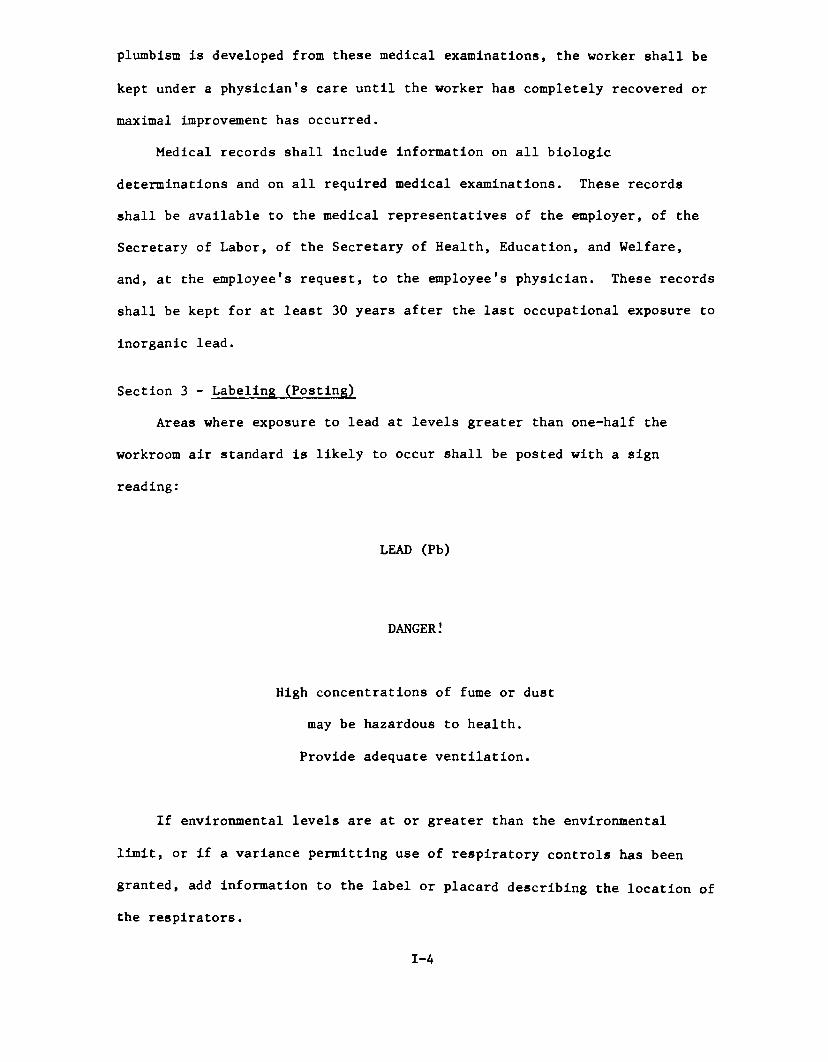
Section 3 - Labeling (Posting)
Areas where exposure to lead at levels greater than one-half the
workroom air standard is likely to occur shall be posted with a sign
reading:
LEAD (Pb)
d a n g e r :
High concentrations of fume or dust
may be hazardous to health.
Provide adequate ventilation.
If environmental levels are at or greater than the environmental
limit, or if a variance permitting use of respiratory controls has been
granted, add information to the label or placard describing the location of
the respirators.
1-4

Section 4 - Personal Protective Equipment and Work Clothing
The employer shall use engineering controls if needed to maintain
concentrations of airborne inorganic lead at or below the limits specified
in Section 1 (a) and shall provide protective work clothing as specified in
subsection (b) of this Section. When the limits of exposure to inorganic
lead prescribed in Section 1 (a) cannot be met by limiting the
concentration of inorganic lead in the work environment, an employer must
utilize, as provided in subsection (a) of this Section, a program of
respiratory protection to effect the required protection of every worker
exposed.
(a) Respiratory Protection
Engineering controls shall be used wherever feasible to maintain
inorganic lead concentrations at or below the prescribed limits.
Compliance with the prescribed limits by the use of respirators is allowed
only when inorganic lead concentrations are in excess of the workplace
environmental limit because required engineering controls are being
installed or tested, when nonroutine maintenance or repair is being
accomplished, or during emergencies. Appropriate respirators as described
in Table 1-1 shall only be selected and used pursuant to the following
requirements:
(1) For the purpose of determining the class of respirator to be
used, the employer shall measure the atmospheric concentration of inorganic
lead in the workplace initially and thereafter whenever process, worksite,
climate, or control changes occur which are likely to increase the
inorganic lead concentration.
(2) The employer shall ensure that no employee is exposed to
inorganic lead above the recommended limit because of improper respirator
selection, fit, use, or maintenance.
1-5
(3) Employees experiencing breathing difficulty while using
respirators shall be referred to a physician for evaluation. This
evaluation should investigate if the employee has adequate ventilatory
capacity, any evidence of obstructive lung disease, and the employees
ability to use negative or positive pressure respirators.
(4) A respiratory protective program meeting the requirements of
29CFR 1910.134 and 30 CFR 11 which incorporate the American National
Standards Institute Practices for Respiratory Protection Z88.2-1969 shall
be established and enforced by the employer.
(5) The employer shall provide respirators in accordance with the
Table 1-1, below and shall assure that the employee uses the respirator
provided at all times when the concentration of inorganic lead exceeds the
permissible limit.
(6) If both fume and dust are present, the recommended usage is
that for fume.
(7) The employer shall provide respirators in accordance with
Table 1-1 and shall ensure that the employees properly use the respirators
provided when wearing respirators is required. The respiratory protective
devices provided in conformance with Table 1-1 shall be those approved by
NIOSH and the Mining Enforcement and Safety Administration (MESA) as
specified under the provision of 30 CFR 11.
(8) The employer shall ensure that employees are properly
instructed in the use of respirators assigned to them and on how to test
for leakage, proper fits, and proper operation.
1-6

TABLE 1-1
Requirements for Respirator Usage
at Concentrations Above the Standard
Airborne Particulate
Concentration of Lead Required Respirator
Not in excess of 0.5 mg/m3 Any dust and mist respirator, except single-use,
Not in excess of 1 mg/m3 Any dust and mist respirator, except single-use
respirator or quarter mask.
Any fume respirator or high efficiency particulate
filter respirator.
Not in excess of 5 mg/m^
Any supplied-air respirator.
Any self-contained breathing apparatus.
A high efficiency particulate filter respirator with
a full facepiece.
Any supplied-air respirator with a full facepiece.
Any self-contained breathing apparatus with a full
facepiece.
Not in excess of 100 mg/m^ A powered air-purifying respirator with a high
efficiency particulate filter.
1-7
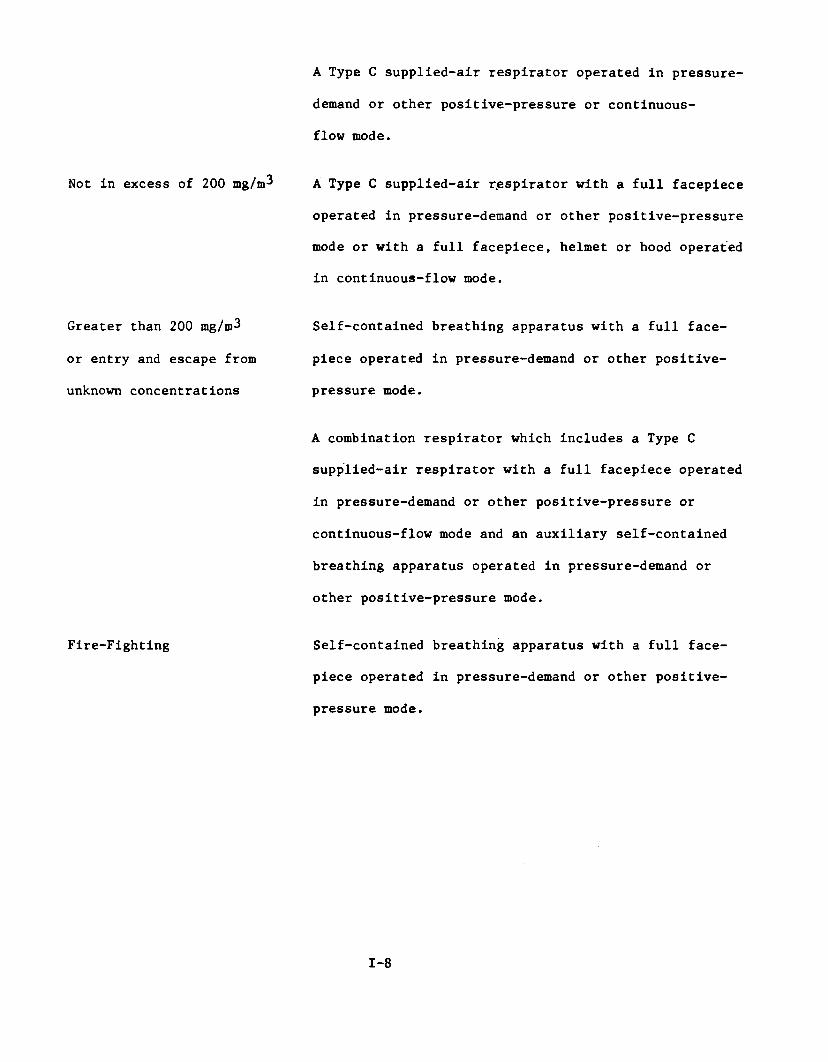
Not in excess of 200 mg/m^
Greater than 200 mg/m^
or entry and escape from
unknown concentrations
Fire-Fighting
A Type C supplied-air respirator operated in pressure-
demand or other positive-pressure or continuous-
flow mode.
A Type C supplied-air r.espirator with a full facepiece
operated in pressure-demand or other positive-pressure
mode or with a full facepiece, helmet or hood operated
in continuous-flow mode.
Self-contained breathing apparatus with a full face
piece operated in pressure-demand or other positive-
pressure mode.
A combination respirator which includes a Type C
supplied-air respirator with a full facepiece operated
in pressure-demand or other positive-pressure or
continuous-flow mode and an auxiliary self-contained
breathing apparatus operated in pressure-demand or
other positive-pressure mode.
Self-contained breathing apparatus with a full face
piece operated in pressure-demand or other positive-
pressure mode.
1-8
(b) Work Clothing
(1) Coveralls or other full-body protective clothing shall be
worn in areas where there is occupational exposure to inorganic lead.
Protective clothing shall be changed at least daily at the end of the shift
and more frequently if it should become grossly contaminated.
(2) The employer shall ensure that all personal protective
devices are inspected regularly and maintained in clean and satisfactory
working condition.
(3) Work clothing and shoes shall not be taken home by employees.
The employer shall provide for maintenance and laundering of protective
clothing.
(4) The employer shall ensure that precautions necessary to
protect laundry personnel are taken when soiled protective clothing is
laundered.
Section 5 - Appraisal of Employees of Hazards from Inorganic Lead
(a) Each employee exposed to lead shall be apprised at the beginning
of his employment or assignment to a lead area of all hazards, relevant
symptoms, appropriate emergency procedures, and proper conditions and
precautions for safe use or exposure and shall be instructed as to
availability of such information which shall be kept on file, including
that prescribed in (b) below, and shall be accessible to the worker at each
place of employment where lead is involved in unit processes and
operations.
(b) Information as specified in Appendix III shall be recorded on U.S.
Department of Labor Form 0SHA-2C), "Material Safety Data Sheet", (see page
IX-4 and IX-5), or on a similar form approved by the Occupational Safety
and Health Administration, U.S. Department of Labor.
1-9

Section 6 - Work Practices
(a) Emergency Procedures
(1) Procedures including fire fighting procedures shall be
established and implemented to meet foreseeable emergency events.
(2) Respirators shall be available for wearing during evacuation
procedures if long distances need to be traversed; supplied air respirators
shall be available for employee use where equipment or operations cannot be
abandoned.
(b) Exhaust Systems
Where a local exhaust ventilation and collection system is used, it
shall be designed and maintained to prevent the accumulation of lead dust
and fume.
(1) Hazardous types of exposure should not be scattered
throughout a plant but, rather, concentrated in a single area where special
control procedures can be utilized.
(2) Air from the exhaust ventilation systems shall not be
recirculated into the workroom, and should not be discharged outside the
plant so as to create an air pollution problem.
(c) General Housekeeping
(1) Vacuuming shall be used wherever practicable and no dry
sw ̂eping or blowing shall be performed.
(2) Emphasis shall be placed upon cleanup of spills, periodic
repair of equipment and leaks, proper storage of materials, and collection
of lead-containing dust.
Section 7 - Sanitation
(a) Food preparation, dispensing (including vending machines), and
1-10
eating shall be prohibited in lead work areas.
(b) Work and street clothing should not be stored in the same locker.
(c) Smoking or smoking materials shall not be permitted in areas
where exposure to inorganic lead may occur.
Section 8 - Monitoring, Recordkeeping, and Reporting Requirements
Workroom areas where it has been determined, on the basis of an
industrial hygiene survey or the judgment of a compliance officer, that
environmental levels do not exceed half the environmental standard shall
not be considered to have inorganic lead exposure. Records of these
surveys, including the basis for concluding that air levels are below half
the environmental standard, shall be kept. Surveys shall be repeated at
least annually and within 30 days of any changes likely to result in
increased concentrations of airborne inorganic lead.
(a) Employers shall monitor environmental levels of inorganic lead at
least every 6 months, except as otherwise indicated by a professional
industrial hygiene survey. If environmental levels are at or above the
standard, enviromental levels shall be monitored every 3 months. This
increased frequency of monitoring shall be continued at least 6 months
(i.e. two more quarterly monitoring periods) after the last sampling that
demonstrated levels at or above the environmental limit.
Periodic environmental sampling shall be performed to coincide with
periodic biologic sampling, i.e. shall be performed within 2 weeks of
biologic sampling.
1-11

Breathing zone samples shall be collected to permit construction of a time-
weighted average exposure for every operation.*
(b) Records shall be maintained for all sampling schedules to include
the sampling methods, analytical methods, type of respiratory protection in
use (if applicable), and the concentrations of inorganic lead in each work
area. Records shall be maintained so that they can be classified by
employee. Each employee shall be able to obtain information on his own
environmental exposure.
(c) Medical records shall include information on all biologic
determinations and of all required medical examinations. These records
shall be kept for at least 30 years following the last occupational
exposure to inorganic lead.
*Guidance for establishing worker exposure measurements are given in
DHEW(NIOSH) Publication No 77-173, Occupational Exposure Sampling Strategy
Manual, available from the Division of Technical Services, 4676 Columbia
Parkway, Cincinnati, Ohio 45226.
1-12
II. INTRODUCTION
This report presents the criteria and the recommended standard
based thereon which were prepared to meet the need for preventing
occupational diseases arising from exposure to inorganic lead. The
criteria document fulfills the responsibility of the Secretary of
Health, Education, and Welfare, under Section 20(a)(3) of the Occu
pational Safety and Health Act of 1970 to . . develop criteria
dealing with toxic materials and harmful physical agents and substances
which will describe . . . exposure levels at which no employee will
suffer impaired health or functional capacities or diminished life
expectancy as a result of his work experience."
The National Institute for Occupational Safety and Health (NIOSH),
after a review of data and consultation with others, formalized a system
for the development of criteria upon which standards can be established
to protect the health of workers from exposure to hazardous chemical
and physical agents. It should be pointed out that any recommended
criteria for a standard should enable management and labor to develop
better engineering controls resulting in more healthful work practices
and should not be used as a final goal.
These criteria for a standard for inorganic lead are in a
continuing series of criteria developed by NIOSH. The proposed standard
applies only to the processing, manufacture, and use of lead products
as applicable under the Occupational Safety and Health Act of 1970.
II-l
The occupational safety and health aspects of the mining and milling
of lead ores are covered by provisions of the Federal Metal and Non-metallic
Mine Safety Act (30 U.S.C. 725 et seq.) under which provisions the Bureau of
Mines has responsibility.
These criteria were developed to assure that the standard based thereon
would (1) protect against development of acute and chronic plumbism, (2) be
measureable by techniques that are valid, reproducible, and available to
industry and governmental agencies, and (3) be attainable with existing
technology.
II-2
III. BIOLOGIC EFFECTS OF EXPOSURE
Extent of Exposure
In excess of a million tons of lead are processed yearly. The total
usage of lead has remained relatively stable during recent years, but
the consumption by various industries has changed. For example, there
has been a decrease of lead usage in the manufacture of house paints and
a simultaneous increase in the manufacture of lead storage batteries.
The particular properties of lead (Table X-l^) have made it useful
for many applications.oScrutiny of Table X-2 (from U. S. Bureau of Mines ) gives an
idea as to the relative proportion of lead usage for various industries.
Metal products and miscellaneous categories account for the bulk of lead
consumption. The refining and processing necessary to form these products
include heating, grinding, and volatilization and therefore produce
potentially hazardous industrial atmospheres. The impression should not
be left that all workers in these industries are jeopardized, but rather
that such uses of lead places them at risk of lead absorption.3Table X-3 (Gafafer ) lists specific occupations and trades where
lead exposure occurs. The diversity of occupations displayed in these
tables shows why a precise measure of the extent of lead exposure is non
existent. The National Academy of Sciences' recently published document 4
on lead agrees, stating, "A reliable definition of the extent of risk of
occupational lead exposure is unavailable." Because of the changing usage
of lead in industry and the widely varied trades where exposure occurs, the
United States has no reporting system whereby the prevalence of occupational
lead poisoning can be analyzed.
III-l
Consider Table X-4 which gives examples of general exposure from
industrial operations utilizing lead. Simultaneous examination of these
tables should give at least a general overview of the extent of occupational
exposure to lead. Specific levels for operations within lead-using
industries are presented in Part IV, Environmental Data.
Historical
Lead has been used for thousands of years because of its availability
and desirable properties. Its low melting point (327 C), ductility,
malleability, and weathering resistance enabled its use without the
need for the more complex equipment that, in m o d e m times, has enabled
the use of other metals such as steel that have more desirable properties
for many applications.
In the 1800's, there was an increasing recognition of hazards to
health associated with lead. It was found that lead could be absorbed
by inhalation and ingestion, and that lead absorption was responsible
for loss of movement in printers' fingers exposed to heated lead type and
for "dry grippes" in pottery and glass workers. In 1839, Tanquerel des
Planches^ published a treatise on lead diseases, to which Dana later added
notes on the effects of using lead pipes. Progress in recognizing
signs of lead absorption was made during the 19th Century also. Burton,^
described in 1840 the "Burtonian Line", a blue line on the gums,
as a sign of lead absorption, and chemical methods for detection of lead
in blood or urine were developed.
The prevalence of lead poisoning in ancient times is speculated upon,
and it has been suggested that Rome fell because of the prevalence of lead
III-2
poisoning (plumbism) in its citizens. It seems likely that, with the
ignorance that existed on the hazards of lead and on methods of limiting
exposure, there was a significant incidence of plumbism until Its
recognition in recent times generated preventive procedures.
Effects on Humans
A description of effects of lead absorption can be graphic If based0
on effects seen in industries earlier In this century. Thus, Mayers can
describe effects of lead poisoning, from studies of many years ago, such
as loss of appetite, metallic taste In the mouth, constipation and
obstipation, anemia, pallor, malaise, weakness, insomnia, headache,
nervous irritability, muscle and joint pains, fine tremors, encephalopathy,
and colic. In lead colic, there may be severe abdominal pain, such that
abdominal surgery has occasionally been performed. In workers, as pointed 8out by Mayers, who have had repeated attacks of lead colic over many years,
there is a tendency towards the occurrence of weakness of extensor muscle
groups. This weakness may progress to palsy, often observed as a
characteristic "wrist drop" or "foot drop."
The important routes of absorption of lead by man and animals are
ingestion and Inhalation. Eating of lead-bearing paint by children and
drinking of lead-contaminated, illicitly distilled whiskey are important
sources of non-industrial poisoning. Other sources Include exposure to
buring battery casings, drinking of liquids from improperly fired, lead-
glazed containers, and high levels of airborne lead. But man absorbs
lead in small amounts not normally leading to poisoning from his food and
water, and from the air. These sources lead to the "normal" body burden
III-3

of lead. Thus, the lead absorbed In the course of occupational exposure
is superimposed on lead abosrbed from other means.
Descriptions of lead poisoning appear in many texts and reviews,
for example Airborne Lead in Perspective, a report of the National4 9Academy of Sciences, and The Diseases of Occupations by Hunter. The
rest of this section pertains to the occupational aspects of lead
poisoning, with a few notes on effects seen only in children.
Lead can interfere with the synthesis of heme, thereby altering
the urinary or blood concentration of enzymes and intermediates In heme
synthesis or their derivatives. Thus, lead poisoning can lead to accumu
lation of non-heme iron and protoporphyrin-9 in red blood cells, an Increase
in delta-aminolevulinic acid (ALA) in blood and urine, an increase in
urinary coproporphyrin, uroporphyrin, and porphobilinogen, inhibition of
blood ALA-dehydratase (ALA-D), and an increased proportion of immature
red cells in the blood (reticulocytes and basophilic stippled cells).
Anemia from lead poisoning is associated with a reduced red cell
life span and with reticulocytosis and basophilic stippled cells In
peripheral blood. Symptoms of this anemia include Irritability, fatigue,
pallor, and sallow complexion. Bone marrow preparations show Increased
numbers of slderoblasts, and this is useful In differential diagnosis of
lead poisoning from iron deficiency anemia.
III-4

Gastrointestinal sequelae of lead poisoning include intestinal
colic, nausea often without vomiting, and constipation (or, occasionally,
diarrhea). Headache usually occurs before or about the time of onset of
colic.
Peripheral and central nervous system effects occur in severe
poisoning. Peripheral neuropathy of lead poisoning involves considerable
loss of motor function but little loss of sensory function. Extensor
muscles of the hand and feet are often involved; extensor weakness
normally precedes wrist drop or palsy.
Encephalopathy may be either acute or chronic. Acute encephalopathy
may follow ingestion or inhalation of large amounts of lead, and may
develop quickly to seizures, coma, and death from cardiorespiratory
arrest. Chronic encephalopathy usually occurs in children after excessive
ingestion of lead, and leads to loss of motor skills and of speech, and to
development of behavioral disorders. Lead encephalopathy, often involving
psychosis, also occurs from absorption of alkyl lead compounds.
Nephropathy is another effect of lead poisoning. There may be a
progressive and irreversible loss of kidney function, with progressive
azotemia, and occasionally hyperuricemia with or without gout. Children
have developed renal dwarfism, hypertension, marked retention of urea,
and low urinary concentration; some children with acute encephalopathy
have developed a form of Fanconi syndrome, a kidney disease indicative
of severe Injury of the promixal renal tubules. Nephritis in adults is
not common, but Ischemic nephritis may occur after prolonged ab’sorption
of lead.
III-5
Epidemiologic Studies
L a n e ^ examined the causes of death of storage battery workers, including
retired workers, and compared data from this group with data from all
English and Welsh males of similar ages during the same period of time.
Among the retirees who had been exposed to lead, there were found to be
greater numbers of deaths than would have been expected, for their ages,
from data on the population as a whole. Most of this excess in expected
mortality was accounted for by vascular lesions in the central nervous
system. Lead workers who died during employment also showed an excess of
deaths from this cause.
Another study of electric storage battery workers was conducted by the
Public Health Service over 30 years a g o . ^ In this study, the incidence of
various disease states was studied in relation to lead exposure of 766
workers, most of whom (75%) had worked in storage battery plants for more
than five years and some of whom (12%) had worked there for twenty years
or more. The Incidence of disease (other than plumblsm) in men exposed at3levels of 0.15 mg/m and higher (high exposure group) was compared to the
3incidence in men exposed below 0.15 mg/m (low exposure group). Special
attention was given to cardiovascular disease because of the common belief
that chronic plumblsm results in arteriosclerosis; however, the data
developed by the PHS team did not show that more severe exposure to lead
is associated with a significantly higher incidence of vascular disease.
The incidence of arteriosclerotic-hypertensive disease was not significantly
different in the high and low exposure groups. The responses to a standard
III-6

exercise, in terms of return to pre-exercise pulse rates and to systolic
and diastolic blood pressure, were also compared, and again the two groups
were found not to be significantly different from each other. These lead
workers were also found not to be significantly different from other,
non-lead, workers in terms of blood pressure. From this, it was concluded
that exposure to lead in the storage battery industry does not cause
cardiovascular effects.
A contrary conclusion was reached by Dingwall-Fordyce and Lane 12 ±n a
study of British battery workers. A significant excess of deaths from cerebro
vascular accidents was found in pensioners who had had exposure to lead of
sufficient degree to have caused mean urinary lead levels of 0.25 mg/liter
during many years of lead work. They compared three groups of workers— those
with no occupational lead exposure, those with negligible exposure, and those
occupationally exposed to lead*— with the general population of English
and Welsh males of similar ages. They found a significant excess of death,
over that predictable from the population at large, among retirees in
the highest exposure group, and this was largely attributable to
cerebrovascular accidents. They also examined records of deaths due to
cancer in lead workers, both employed and retired, and concluded that
there was no association between malignant disease and lead absorption.
While they found an excess of deaths from cancer in the negligible
exposure group (in the last decade of the 35-year figures only), there was
♦Urinary lead levels in this group averaged between 0.10 and 0.25 mg/liter for a 20-year period.
III-7
a slight decrease In deaths, from that expected from statistics on the
whole population, among workers absorbing more than negligible amounts
of lead, hence their conclusion that malignant disease is not related to
lead absorption. As improved working conditions decreased lead exposure,
the excess of cerebrovascular deaths diminished.13Malcolm recently conducted similar Investigations of past and present
employees exposed to lead. Since 1927, airborne lead to which these men3
had been exposed had been limited to 0.15 mg/m , according to Malcolm.
He divided the workers into three groups: (A) no exposure, (B) mild exposure,
and (C) severe exposure. Average blood lead* in group (C) workers, since
1961, has been 0.065 mg/100 g, from which it may be Inferred that the3
0.15 mg/m air concentration was sometimes exceeded. Urinary leads in
subgroups averaged 0.09 to 0.180 mg/liter, and averaged 0.119 mg/liter
for the entire group of workers.
Based on comparison of blood pressures of the two exposed groups (B
and C) with the control group (A), it was concluded that there was no
occupationally Induced hypertension (although there might have been lead-
induced hypertension before Improved hygienic measures were instituted).
There was a non-significant increase in chest disease among older retired
workers, attributed to other causes, since most of these pensioners lived
in an urban area with a higher rate of death from chest disease than
that in the country as a whole.
Concentrations of lead In blood are expressed as weight units (such as mg) per 100 ml or 100 g of whole blood. European workers more commonly express blood lead as weight units per 100 ml of blood, while American workers more commonly express blood lead as weight units per 100 g of blood. This document will follow the American custom except In referring to studies reporting blood lead in weight units per 100 ml. The difference between the two expressions Is small, about 5% or less. Thus, a blood lead concentration of0.080 mg/100 g would be equivalent to about 0.084 mg/100 ml.
III-8
12Unlike the findings of earlier investigators (Dingwall-Fordyce and Lane,
and Lane Malcolm found no evidence of increased frequency of cerebrovascular
death in his study, which included deaths occurring between 1963
and 1967, while data from the two earlier reports included deaths
from 1926 to 1960. Thus, if all three reports are correct in their
conclusions, it would seem that improving hygiene has diminished lead-
induced cerebrovascular disease.
For years, chronic nephritis was thought to be a consequence of
plumbism, and an analysis of death rates in the U.K. in 1921^9and in131931 shows a considerable excess in plumbers and painters due to
nephritis and to cerebrovascular disease. The question of nephropathy14from lead has also been raised by Henderson and Inglis, who showed
a relationship between chronic nephritis and excessive lead absorption as
indicated by elevated lead levels in bone.
L ane^ described 9 deaths from renal failure in lead workers, men3who had been exposed for long periods at lead concentrations around 0.5 mg/m .
Terminally, they all had evidence of chronic azotemic nephritis. These men,
all of whom worked in storage battery industries for over 20 years, died
between the ages of 42 and 52 (average age at death was 48.4). Other than
two episodes of colic, there had been no previous history of lead intoxication.
In the United States, there have been few reports of renal disease in13lead workers, though the PHS survey of storage battery workers discovered
an increased incidence of albuminuria in affected workers.
III-9

Animal Toxicity
Unlike toxicologic studies of many industrial substances,
experimental animal studies of either inorganic or organic lead have
contributed far less to an understanding of the toxicology of lead and
its compounds than studies on man, and hence have directly contributed very
little to the criteria for the standard for lead. The reason is that
until recently, much of the investigative effort was directed to the
effects of lead on the red blood cell, its urinary intermediates and lead
content of blood and urine, all readily investigated in man. Moreover, many
of the studies in man or animals relate to detecting changes in biologic
constituents of the blood and urine, and hence are relevant more to
criteria for biologic standards than to air standards. Thus, the experimental
studies discussed herein will be confined to those that confirm or extend the
findings in man in these areas and which are related, even if only indirectly,
to the criteria for the air standard.I
In recent years, research investigations have broadened to include
biologic systems other than the erythropoietic, and in this way may
ultimately provide new criteria for standards. Lead intoxication has been
studied for its effects on the rat thyroid, comparative changes in kidneys
of rat and man, and the effect of certain trace metal deficiencies on the
toxicity of lead. But only a beginning has been made in our understanding
of the action of lead ou the nervous system; behavioral effects have been
studied in rats following exposure to tetraethyl lead after the finding of
marked metabolic changes in the brain from its administration.
a. Experimental Animal Toxicology. The USPHS-sponsored conference on16environmental lead in 1965, although oriented towards the community
111-10
environment, marked a turning point in experimental animal investigations on
lead. Up to this time, animal studies relating to standards criteria used
hematologic disturbances for the most part as a focal point of investigations
because of their practical usefulness as criteria for judging harmful
exposures to lead.17 18b. Biosynthesis of Heme. Following the first evidence by Rimington *
that lead interfered with the incorporation of iron into the protoporphyrin19molecule, and the subsequent demonstration by Eriksen and others that lead
also interfered with an early step in heme synthesis catalyzed by delta-amino-20levulinic acid dehydratase (ALA-D), Kreimer-Birnbaum and Grinstein confirmed
in rabbits poisoned by lead the earlier findings of Eriksen and others. As
determination of ALA-D in the red blood cell became recognized as the most
sensitive criterion of response to lead exposure yet discovered, it was
applied to the control of lead exposures among industrial workers. It was
soon suspected, however, when red cell ALA-D was markedly inhibited in the
absence of subjective symptoms of lead poisoning and at blood levels within21-23currently accepted normal limits that, as a criterion for overexposure
of lead workers, ALA-D was of less value than had been anticipated. Studies23in dogs confirmed this suspicion; dogs that had been given lead acetate for
a period (46 weeks) until their red cell ALA-D was nearly or completely
inhibited and were bled to a reduction of from 30 to 40% in hemoglobin, red
cell count and hematocrit ratio, recovered to normal hematologic values as
well as did controls not treated with lead. Thus, animal studies resolved
the important issue of the relative usefulness of the measure, reduction
in red cell ALA-D, as an indicator of response to lead exposure, and hence
as a criterion for a lead standard, albeit a criterion only indirectly
related to an air standard; measurement of changes in ALA-D is too sensitive
III-ll
to be usefully applied to workers exposed to lead at this stage of knowledge.*
c. Other Animal Studies on Hematologic Effects of Lead. In addition to the
inhibitory effects of lead on the biosynthesis of heme, animal studies have
included 1) the stimulation of erythropoietic activity^; 2) increased
rate of basophilic stippling^; 3) reticulocytosis A) concentration
of coproporphyrins in urine and certain t i s s u e s a n d 5) the effect of
lead on iron metabolism in hemoglobin formation. ^
d. Serum Protein Changes. Changes in the patterns of the proteins in human
blood serum, consisting of a decrease in albumin-globulin ratio with marked
increases in the alpha- and beta-globulins, have been confirmed in animals.28
Similar confirmation has been made in animals of the findings in man of
reduced quantities of mucoid and sialic acid, prosthetic groups of conjugated 29proteins, reductions of which were used as a warning of impending lead
poisoning in industry. Unfortunately, other common conditions such as
inflammation also cause changes in the amounts of these blood constituents.
A distinct relationship has been found between lead poisoning andO Athe metabolism of nicotinic acid ; animals poisoned by lead showed a marked
decrease in the nicotinic acid content of blood (and urine), indicating
an increased utilization of this constituent by lead, and suggesting that
lead exerts serious effects on the pyridine nucleotides, either by blocking
*This is not to detract from the major recommendation of the PHS conference on lead ® to search for ever-more sensitive indicators of response, because much of value on the mechanism of lead in the biosynthesis of heme has resulted, but it does clearly point out 1) that ultra-sensitive methods may not always have practical utility in estimating and controlling workers exposure, and 2) that, inasmuch as highly sensitive methods are used as the criteria for many, if not most, of the air standards in the U.S.S.R., these standards must be carefully reexamined in the light of their appropriateness and suitability.
III-12

their synthesis or by accelerating the degradation of nicotinic acid.
These changes have been suggested as a means of assessing the severity
of lead poisoning.
In line with the general opinion that toxic substances adversely
affect the body's resistance to disease by interfering with natural31immunologic processes, Fonzi et al. showed that lead-treated and actively
immunized animals developed lesser amounts of gamma globulin than did
immunized controls. Similarly, lysozyme, another part of the defense
mechanisms of the body, was progressively reduced in the blood serum of32dogs administered lead salts for a prolonged period.
Although shifts in the body's inorganic elements (copper, calcium33phosphorus, sodium and potassium ) from lead poisoning have been
34reported , their significance in over-all body metabolism is yet to be
clearly demonstrated.
e. Endocrine Changes. The effects of lead exposure on some aspects of
endocrine function have been studied in animals, as well as in man. The
excretion of steroids was studied in the urine under different conditions of
lead exposure in the hope of finding some evidence of their relation to lead
absorption. Adrenal steroids were reported at first to decrease, then to35increase considerably during advanced stages of lead intoxication.
Vitamin C content of the adrenal gland was decreased in the guinea pig36following exposure to lead.
Relatively little use has been made of animals in the study of other
endocrine functions, these functions being readily studied in man. Sandstead
has, however, reported that lead, like other heavy metals, impairs the uptake
of iodine by the thyroid, and that the conversion of iodine to protein-
bound iodine is retarded; females were more affected than males.
III-13
37
f. Renal Changes» Goyer has recently reviewed the current state of
knowledge of the effects of lead on the kidney; his review is based in large
part on his investigations and those of his associates. Prominent among
their findings of acute lead poisoning in animals were 1) formation of
intranuclear inclusion bodies, 2) mitochondrial swelling with impairment of
oxidative and phosphorylative processes, and 3) aminoaciduria (apart from
the long-recognized delta-aminolevulinic aciduria); the intranuclear
inclusion bodies were a lead-protein complex that may have adaptive function
in excessive lead exposure. The acute renal changes progress to a diffuse
nephropathy with tubular atrophy and dilation. Rats developed hyperuricemia
and in chronic lead poisoning, renal adenocarcinoma. In all but the last,
the findings made in rats paralleled those seen in man.
g. Trace Metal Interactions. In recognition that lead poisoning is often
associated with an iron-deficiency anemia, the interaction of lead on39iron deficiency was studied in the rat. An enhancement of lead retention
and toxicity was found in the iron-deficient animals as measured by elevated
ALA excretion.
h. Effects on the Nervous System. Despite the fact that the nervous system
can be affected by lead, comparatively little experimental attention has
been directed to gaining an understanding of the manner in which lead acts
on this system. Behavioral response studies in animals, predominantly by
Soviet scientists, comprise most of the research effort, although of late,
Xintaras and associates have initiated investigations in behavioral toxi
cology.4Using a range of atmospheric concentrations of lead oxide dust, Gusev
3found that at a level of 11 yg/m disturbed reflexes began to occur at 1.5
38
III-14
to 2 months of exposure, whereas no impairment of reflexes was seen at
levels averaging about 1 yg/m , base-line conditioned reflex activity
returned 10 to 23 days after cessation of exposure. Although no changes in the
formed elements of the blood were seen, despite a lead content in rat bone of
10-fold higher than that of animals on the lower dose, histopathologic
changes in the central nervous system were seen in both rats and rabbits at
the 11 yg/m level.
Shalamberidze^reported disturbed conditioned reflexes in rats exposed
to lead sulfide ore dust at a level averaging 48 yg Pb/m , 6 hours daily for
6 months. However, because of the insolubility of the sulfide supported by
health experience with lead sulfide, responses to lead sulfide at that level
are unlikely.
Xintaras studied the applicability of evoked response in the rat's
cortex in air pollution t o x i c o l o g y ^ ; in rats intoxicated with lead acetate
he found electroencephalographic changes similar to changes in m a n . ^ From
studies of alterations in rapid eye movements during sleep, he concluded/ *5that lead may cause impaired neural control in rats.
i. Developmental Effects. Although mice nursing on dams fed diets containing
high levels (1% or 4%) of lead carbonate showed evidence of faulty growth
and various neurologic changes,^ recent evidence reveals a low degree of
teratogenic effects in rats and mice.^
Correlation of Exposure and Effect
Tsuchiya and Harashima^ studied storage battery workers and compared
airborne lead with urinary lead, urinary coproporphyrin, basophilic
stippling of erythrocytes, and specific gravity of blood as indications
of anemia.
HI-15

To control urinary coproporphyrin to normal levels (below 50 pg/liter),
they recommended a TLV of about 0.12 mg/m for daily 8- to 10-hour exposures.
However, the workers studied by these investigators worked 48 to 60 hours
a week. With the increased lead absorption from these working hours, a
lower standard than that suitable for a 40-hour week would be indicated.
If other criteria were chosen on which to base an air limit, other limits3
would have been selected; 0.10 mg/m would have been recommended to keep
urinary lead levels below 0.15 mg/liter, 0.14 mg/m to keep basophilic3stippling at 0.3 per thousand, and 0.14 to 0.15 mg/m to prevent anemia.
They did not use blood lead as a criterion of effect.47The study of Williams, King, and Walford was based on observations
of storage battery workers who worked a 40-hour week, and were stable
in their exposure. They had worked without job change for a year, there
was no recent absence for sickness or vacation, and no change in overtime
or productivity for 6 months.
Workers in the plastics department were exposed to airborne lead levels3of about 0.01 mg/m , while workers in lead handling departments were exposed
to higher levels, up to about 0.3 mg/m . Specific gravities of urine samples
averaged 1.020 in the morning and 1.022 at lunch time. They concluded that
air levels of 0.20 or 0.15 would result in the blood and urinary lead' levels
given in Table X-5 (urinary lead levels were corrected for a specific gravity
of 1.024; it should be noted that a urinary level of 0.20 mg/liter corrected
to a specific gravity of 1.024 would be 0.133 mg/liter corrected to 1.016).
These investigators also showed a very low correlation (r ■ 0.09) between
airborne lead and blood hemoglobin levels.
III-16
Selander and Cramer compared blood lead, urinary lead, and urinary ALA
in lead workers. They found several workers with high urinary lead and ALA
values in relation to blood lead and attributed' this to a metabolic influence
of lead; ALA excretion in these workers had seldom fallen to normal values.
They recommended that workers removed from lead overexposure not be allowed
to return until ALA excretion was normal.
A statement by a group of experts (R.E. Lane, D. Hunter, D. Malcolm,
M.K. Williams, T.G.F. Hudson, R.C. Browne, R.I. McCallum, A.R. Thompson,
A.J. deKretser, R.L. Zielhuis, K. Cramer, P.S.I. Barry, A. Goldberg,49
T. Beritic, E.C. Vigliani, R. Truhaut, R.A. Kehoe, and E. King) on
diagnosis of inorganic lead poisoning suggests ranges of indices of lead
absorption for occupationally acceptable exposures with the following
upper limits:
Blood lead: 0.08 mg/100 ml Urinary lead: 0.15 mg/liter Urinary coproporphyrin: 0.50 mg/literUrinary ALA: 20 mg/liter
They point out that these values may not be applicable when there are
low hemoglobin levels or where chelating agents have been used.
Stankovic^ reported on blood and urine lead concentrations, urinary
coproporphyrin, and urinary ALA in workmen exposed to lead at various
concentrations of lead in air. In workmen exposed to 0.15 mg/m^ and below,
the highest individual blood lead found was 0.06 mg/100 g, the highest
urine lead 0.12 mg/liter, the highest urinary coproporphyrin 0.186 mg/liter,
and the highest urinary ALA 11.85 mg/liter. There were 48 workers exposed
to air lead levels of 0.025 to 0.15 mg/m , whose mean blood lead level
was 0.05 mg/100 g (range of 0.03 to 0.06). However, the number of workers
exposed to or near 0.15 mg/m was not stated.
III-17

Zielhuifi^1 has reviewed and analyzed the data of several other inyestl-
gators of human absorption of lead, in terms of the relationships between
blood lead, ALA, and coproporphyrin. He concluded from analysis of these
data that a combination of blood lead greater than 0.08 mg/100 g with values
of urinary lead greater than 0.15 mg/liter or urinary ALA greater than
20 mg/liter or urinary coproporphyrin greater than 0.80 mg/liter is evidence
of an unacceptable degree of occupational exposure to lead. He did not
review the relationships between airborne lead and the several indices of
biological effect of absorbed lead.
The selection of 0.08 mg Pb/100 g of whole blood has been described by52Kehoe as the critical concentration of lead in blood below which no case
of even mild poisoning has been induced by lead. The higher the concentration
of blood lead above 0.08, the greater the likelihood of lead poisoning,
though higher concentrations did not mean lead poisoning in all individuals.
The scientific consensus supports the view of Kehoe as it applies to
adults.
However, even in the hands of the best analyst, there may be a 10%
error in a specific lead determination. Thus, an analysis showing a blood
level of 0.08 mg/100 g may have a true value of almost 0.09. This
may account for the recommendation of some authorities^® that blood
lead levels be kept below 0.07 mg/100 g.
111-18
IV. ENVIRONMENTAL DATA
Information presented in this section was selected to satisfy two
purposes: (1) link measured environmental and biological levels to
specific lead using industries, and (2) to link exposure levels to
clinical lead intoxication. Table X-4 (from Elkins'*) gives an
overview of in-plant lead levels from various industries. Specific data for
industries and a discussion of the exposures therein follow. The principal
plant types covered are printing, storage battery manufacturing, and
welding operations. Note that the general concentrations of lead in in-plant
air range from negligible to those indicative of imminent danger.
Scrutiny of specific plant operations is necessary to determine where the
hazards exist and how priorities for control should be developed.
(a) Printing
The necessary characteristics of type metal prescribe the use53of lead alloys. Examinations of Table X~6 (from Brandt ) shows
that many areas could presently comply with a 0.15 mg/m standard. Others
such as the remelt room and stereotype room will require additional control
measures.
Table X-7 (from Ruf^) associates exposure levels to
significant functions performed by workers in the printing industry. They
are obviously not 8-hour TWA levels but are nevertheless indicative of
conditions. Most of the higher exposures occur while either some mechanical
action is applied either to the metal (such as drossing and filing) or near the
melting pots. In the former, large amounts of dust are generated, and in
the latter the lead fumes present the problem.
IV-1
Table X-8 shows data of Belknap on calculated exposures in
printing industries. The calculations were based on time spent by54printers at various tasks and used data of Ruf summarized in Table X-7.
Calculated air exposures and urinary lead levels are shown for various
operations. These air concentrations (or urinary levels) may be
erroneous, because much less urinary lead would be expected at the listed
air concentrations.
(b) Storage Battery Manufacture
Tables X-9 and X-10 furnish data on levels found in plants
where storage batteries are produced. The percentages of workers exposed3
to air-lead levels greater than 0.15 mg/m is important. Table X-9
directs attention to the operations where the serious hazards occur. The
levels shown are serious in that they are above the recommended concentration,
but also appear to be in a range that are responsive to conventional
industrial hygiene control techniques.
(c) Welding and Cutting of Steel
Welding or cutting of lead bearing steels results in the
generation of lead fume in significant concentrations. This is also the
case when these operations are performed on steels which are either
galvanized, zinc-silicate coated, or painted with lead pigmented paints.
Elkins ^ observed that at 507 C the vapor pressure of lead (VP = 0.000016 mm3
Hg) is high enough to produce a concentration after oxidation of 0.18 mg/m
of lead fume. During welding or cutting temperatures may reach 1000 to
3000 C.
IV-2

Table X-ll contrasts lead fume exposures when welding galvanized
steel and zinc-silicate coated steel. The worst exposures occurred
when welding the zinc-silicate coated steel. Electric arc welding
produced an average concentration of 5.63 mg/m^ and oxy-acetylene pro
duced 1.96 mg/nP of lead. The information presented in Table X-ll56developed by Pegues . Samples are well identified, providing a clear
picture of lead exposure in these welding operations. Note that with
good ventilation breathing zone samples can be controlled to within
the recommended standard. Note also that room air samples downwind from
the welder can rise to levels which jeopardize the health of other workers.
In Table X-12 (from Tabershaw , limited data are presented to illustrate
the exposures of those workers who perform cutting operations on painted
structural steels. The urinary lead data indicate that sufficient pro
tection from lead fume is not given through the use of the indicated
respirators, and further controls are needed.
(d) Workers Whose Occupational Exposure is Out-of-Doors
Policemen, firemen, taxi drivers, vehicle tunnel attendants,
garage mechanics, and service station attendants are examples of occupational
groups who work out-of-doors, but are nonetheless exposed to lead. The
primary source of this exposure is the lead salts emitted from internal
combustion engines which burn leaded gasoline. Tables X-13 and X-1458were taken from a U.S. Public Health Service survey of lead in the
atmosphere and describe lead levels in blood and urine. This same
survey shows that these workers are placed in atmospheres containing various
amounts of lead for their 8-'nour workday. Few of the samples indicate
levels which even approach the biologic standard; however, the distribution of
the samples does demonstrate the need for monitoring these individuals for lead
exposure. There are many levels shown in these tables which are in excess
IV-3
of normal (not occupationally exposed) levels, and this fact shows that
there is absorption of lead on the job.
(e) Miscellaneous
Limited data for lead exposures in many other industries prevent
a detailed analysis here. Nonferrous foundries often utilize lead alloys.59Berg and Zenz reported on one such foundry and stated that atmospheric lead
concentrations have risen in the past twenty years. They stated that from
108 samples collected between 1943 and 1947, there were average concentrations3 ias follows: 0.14 mg/m in the melting room and 0.18 mg/m in the pouring
floor area. The results from 40 samples of 1953-1954 produced the following3 3increases: 0.28 mg/m in the melting room and 0.29 mg/m in the pouring
floor area. Extensive modification and increased ventilation reduced the3 3concentration from 0.28 mg/m to 0.03 mg/m . Attention to the processes
and analysis of what operations produced the high concentrations facilitated
the control of the lead hazard.
Leaded steel production sometimes generates hazardous occupational
exposures to lead. R u h f ^ reported that the highest atmospheric lead concentra
tions prevailed during the steel pouring operation in which the lead is added.
Other elevated exposures were measured in processes such as the rolling mills.
However, because of the intermittent nature of the operations the time weighted
average exposure was below the then current limit of 0.20 mg/m^. Ruhf further
described control measures and manufacturing techniques whereby lead exposure
can be minimized.
IV-4
V. DEVELOPMENT OF STANDARD
Basis for Previous Standards
The American Conference of Governmental Industrial Hygienists
(ACGIH)^ has reviewed previous standards for lead in the work environment,
and has commented that there are few meaningful data relating to the
threshold limit value, probably because most authorities rely primarily
on other tests for estimating lead hazards, such as urinary and blood
leads, urinary coproporphyrin and ALA, as well as examination of the
blood for stippled cells.
Nevertheless, attempts were made to control occupational lead
poisoning by establishing acceptable air levels to guide engineering
control measures. Although the point is not documented, it seems that3at one time an air limit value of 0.5 mg/m was used. In the 30's and
340's, a value of 0.15 mg/m was a common, but often unachieved, goal
based on a recommendation of a 1928 PHS survey of storage battery workers6 2published in 1933.
This value continued to be the one most often accepted until 1957,3
when the ACGIH increased the TLV to 0.20 mg/m , based in part on data5 3of Elkins showing that exposure at 0.20 mg/m would result in urinary
excretion at 0.20 mg/liter.
In 1971, the Conference recommended lowering of this value back to 3
0.15 mg/m • This appears to have been based in part on the recommendations
of the International Subcommittee for Occupational Health, Permanent63Commission and International Association of Occupational Health at
a 1968 meeting in Amsterdam, and on the results of the study by Williams,47King, and Walford.
V-l

The International Subcommittee recommended a time-weighted average
concentration for a 40-hour week of 0.15 mg/m^, on the basis that it
corresponded to an acceptable blood concentration of 0.07 mg/100 ml.
The current workroom air standard established under the Occupational
Safety and Health Act of 1970 (published in Part 1.910.93 of the Federal
Register, Volume 36, Number 157, pages 15101-15107, dated August 13, 1971)
is 0.2 mg/m^; this is a time weighted average, and is based on American
National Standards Institute Z37.11-1969.^ This ANSI standard provided
no basis for its recommendation.
Basis for Recommended Environmental Standard and Biologic Monitoring
(See Appendix V - NIOSH Testimony Presented at DOL Hearing on a Lead
Standard.)
Earlier in this century, efforts to reduce occupational lead poisoning
were based on adherence to hygienic workroom air guides. As more knowledge
developed, increasing attention was given to blood and urinary lead levels
as guides to reduction of occupational poisoning. Concomitantly, there was
increasing attention to better lead analyses. There was also an increasing
knowledge of the relationship between levels and rates of absorption and
excretion, blood lead levels, and health status.
The PHS study by Dreessen et a l . ^ was undertaken during the period
that the workroom air guide of 0.15 mg/m^ was accepted,, but failure to
achieve control of airborne lead to this level was common, so findings of
slight effects among workers in lead-using industries by Dreessen and
co-workers did not invalidate the guide. Though not documented, it appears
that many industries have rotated their workers to various jobs to keep
blood lead levels below 0.08 mg/100 g; thus, exposure to unsafe workplace
air levels did not result in adverse effects on health.
V-2
Consequently, there is a little definitive information from experience
in the United States and other countries on the suitability of 0.15 or
0.20 mg/m as an air-lead level to which workers can be safely exposed over
a working lifetime.
However, much experience has accrued to show that absorption of lead
in amounts resulting in blood lead concentrations of 0.08 mg/100 g or less
will not lead to adverse effects on health, and there is information from
studies in other countries relating airborne lead levels to blood lead.
It was previously concluded (III. Biologic Effects of Exposure;
Correlation of Exposure and Effect) that a blood lead level of 0.08 mg/100 g
is useful for delineating acceptable from nonacceptable lead absorption.
While levels below 0.08 mg/100 g are indicative of acceptable occupational
lead absorption and, if also representative of past absorption of lead by
an individual person, also indicative of insignificant risk of lead poisoning,
it should not be concluded that lead poisoning will occur if blood lead
levels exceed 0.08 mg/100 g. However, there is an increasing risk of
poisoning as levels increase above 0.08 mg/100 g, so absorption of lead
should be held to amounts that will result in blood lead levels less than
0.08 mg/100 g. As Rehoe^ has stated, "...lead poisoning occurs in man
only when certain well-defined conditions have been fulfilled" and that
this is quantitatively applied by "...the relationship between the current
rate and the extent of the absorption of the inorganic compounds of lead,
and the concentration of lead in an accessible tissue of the living body,
namely, the blood." Thus, a biologic standard of 0.08 mg of lead per 100 v
of whole blood is recommended; it provides a margin of safety in adults,
V-3
but probably not in children. The extent of this margin of safety is not
known, but it seems likely that there will be few, if any, cases of lead
poisoning below 0.09 mg/100 g.
Kehoe^"* also pointed out the usefulness of urinary lead as an index of
current absorption of lead, but added that it was a quantitatively less
certain index than blood lead. It may be consistent with this view that47Williams, King, and Walford found that the best correlation between air
borne lead and biochemical index of effect was with blood lead (r = 0.90) and
less correlation with urinary lead (r ■ 0.82). The study of Williams and 47co-workers indicates that blood levels of 0.08 mg/100 ml is associated
with a urinary lead level of 0.20 mg/liter. It has been commonly accepted
that 0.20 mg/liter is a safe level in urine, based in part on the findings
of Elkins."* However, it is important to note that Elkins' studies involved
calculation of specific gravity of urine to a value of 1.024. The studies 47of Williams et al. also calculated urinary specific gravity to 1.024.
(Urinary lead levels of 0.20 mg/liter, adjusted to a specific gravity of
1.024, would be 0.133 mg/liter if the specific gravity were calculated to
1.016.) Thus, the conclusion of Zielhuis^ that urinary lead greater than
0.15 mg/liter, uncorrected for specific gravity, represents unacceptable
absorption of lead is consistent with the selection of a biologic standard
for urinary lead of 0.20 mg/liter, so long as the specific gravity correction
is used.
ALA and coproporphyrin assays, and blood examinations for hemoglobin,
reticulocytes, and stippled cells are useful in the assessment of worker
health, but are less useful than blood lead as a single criterion for
V-4
interpreting the acceptability of lead absorption, since no one of these
measurements is a specific index of lead absorption, as is urinary or
blood lead.
It should be emphasized that blood lead and urinary lead are good
indices of current absorption of lead (in the absence of anemia or
absorption of chelating agents), but are not necessarily indications of
body burden of lead or of the state of health of the individual. Bone
lead is probably more indicative of total body burden than is blood lead,
but it is not feasible to sample bone for routine lead assay. As to
state of health, overabsorption of lead by an individual in the past may
have led to a high body burden of lead and may ’also have contributed to
a state of current ill-health in the individual, all without causing
currently high blood or urinary levels of lead.
Since the studies of relationship between health and airborne lead
levels are inadequate, it is concluded that an air standard should be
recommended from data on the relationship between airborne lead and bio
chemical indices of effect, most importantly, blood lead. There are several
studies that point to^D.15 mg/m^ as the level of airborne lead that will
result in biochemical indices showing acceptable absorption of lead, in
other words, showing that occupational exposure at 0.15* mg/m^ will not
result in adverse effects on the health of workers.
Tsuchiya and H a r a s h i m a ^ studied storage battery workers in Japan and
compared airborne lead with urinary lead, urinary coproporphyrin, basophilic
stippling of erythrocytes, and, as an index of anemia, specific gravity of
blood. They recommended airborne lead levels on the basis of acceptable
*See appendix V for basis for revised recommendation for an occupational exposureto inorganic lead.
V-5

levels of these biochemical indices. On the basis of acceptable urinary
lead levels of 0.15 mg/liter, corrected to a specific gravity of 1.024, they
recommended a threshold limit value of 0.10 mg/m . If a higher urinary lead
level is accepted, as recommended in the preceding discussion of the relation
ship between acceptable lead absorption and urinary lead excretion, a higher
air standard would result. It should be noted that the workers studied by
Tsuchiya and Harashima worked 8 to 10 hours, 6 days a week, and they
observed that a higher air level would have been recommended for a 40-hour
week.
The study most directly relevant to the development of a recommended47workplace air standard is the study of Williams, King, and Walford. Their
data (Table X-5), from studies of storage battery workers stable in their
employment (40-hour work week, no job change in the past year, no recent
absence or sickness, no change in overtime or productivity), showed that3exposure at 0.15 mg/m resulted in a mean blood lead of 0.060 mg/100 ml.
Were mean blood lead the criterion of effect, an air standard much higher 3than 0.15 mg/m could be recommended, but in order to keep most or all
workers' blood lead below 0.084 mg/100 ml (0.080 mg/100 g), it is believed
that a mean of about 0.060 mg/100 ml should be achieved. The data of47Williams and associates does not provide a basis for Interpreting the
3percentage of workers exposed at 0.15 mg/m that will have blood levels
above 0.084 mg/100 ml. However, It is believed that a small percentage
will have blood lead levels at or above 0.084 mg/100 ml or 0.080 mg/100 g,
so it is recomnended that workers be monitored biologically, by periodic
assays of blood lead, or of blood and urinary lead.
V-6

Stankovic^ also compared airborne lead with blood and urinary lead,3and in workmen exposed to lead at 0.15 mg/m and below, the highest individual
blood lead found was 0.06 mg/100 g, and the highest urinary lead 0.12 mg/liter.3
However, the number of workers exposed at or near 0.15 mg/m was not stated,
so his finding of 0.06 mg/100 g as the highest individual blood lead is not
believed to contradict the previously stated inference that some workers
exposed at 0.15 mg/m will have blood lead levels at or above 0.08 mg/100 g
(especially those workers absorbing abnormal amounts of lead from nonoccu-
pational sources).63It is of interest that conclusions of experts support the recommended
standard, but since data and arguments supporting their conclusions were not
presented, their recommendations have not been given weight in deriving the
recommended occupational air standard.
The rationale for the recommended work practices and sanitation practices
was principally derived from Kehoe.^ They are normal industrial hygiene
procedures used to control occupational exposures to various dusts and
fumes.oIf worker exposures exceed 40 hours a week, the same TWA of 0.15 mg/m
should be used unless exposures so greatly exceed 40 hours a week that
nonworking (excretion) time is significantly reduced; exposures up to
50 hours a week should not significantly affect the time for excretion
of absorbed lead. However, maintenance of the same TWA means a proportionate
reduction in average concentration as exposures exceed 40 hours a week.3To achieve a TWA of 0.15 mg/m , the average concentration should be 0.15
3 3mg/m for a 40-hour week and 0.12 mg/m for a 50-hour week.
V-7
Basis for Environmental Sampling and Analytical Method
Various methods of sampling air and of analysis of these samples
have been considered, and recommended methods' are presented in Appendixes
I and II.
The recommended method of sampling air involves collection of 100
liters of air or more, use of breathing zone samplers with sampling at a rate
of 2 liters/min., and collection on 0.45y cellulose membrane filters. Other
sampling rates and other collection media (filter paper, nitric acid impinger,
electrostatic precipitation) are capable of giving equivalent results.
The recommended procedure is described in Appendix I.
For analysis of lead in blood, atomic absorption spectrophotometry^ ^72 73and dithizone colorimetry * were considered. Appreciable consonance can
be demonstrated between results obtained with atomic absorption and dithizone
methods. Both methods have been used for analysis of air samples, and both
are concluded to be capable of giving accurate results. After a review of
the several procedures involving atomic absorption spectrophotometry, it was
concluded that no one of these procedures has been sufficiently standardized.
Individual laboratories get excellent results with a specific procedure,
but these procedures have not been compared in a “number of laboratories.
Dithizone colorimetry, on the other hand, has been used for a long time and
has been thoroughly studied. The procedures, interferences, sensitivity,
and replicability have been studied and are described by Keenan, Byers,72Saltzman, and Hyslop. The recommended procedure is described in Appendix II.
Dithizone colorimetry is a wet chemical method requiring equipment
found in most chemical laboratories, but requires meticulous attention
to detail and to the prevention of loss and the exclusion of contamination.
V-8
Results of lead analysis by this method obtained by well trained technicians
are often superior to results obtained by other methods of analysis.
Basis for Biologic Analytical Method
Blood lead was selected as the best method, and urinary lead as an accept
able method, for judging lead absorption, for reasons discussed in earlier
sections (see "Basis for Recommended Environmental Standard and Biologic
Monitoring").
Specific details for collection of biologic specimens for lead
analysis have been described in a booklet Methods for determining lead in
air and in biological materials, published by the American Public Health
Association. Keppler et a l . ^ described the initiation of interlaboratory
evaluations of lead in an attempt to improve accuracy and reproducibility
of laboratory analyses through a system of accreditation. Subsequent
reports 76»77 have described some of the results, from which it is apparent
that lead analysis is subject to significant error unless a very high degree
of care is used.
Methods for the collection of blood and urine are described by72Keenan et al. (Appendix II). While lead-free Vacutainers are convenient,
any lead-free tube can be used for collection and shipment or storage
of blood prior to analysis. No aliquots can be taken unless blood-clotting
has been prevented, either by taking aliquots before clotting or by
prevention of clotting, e.g., by heparinization. Single use needles
("throw-aways") are acceptable, but must be lead-free, thus must not be
lead-soldered.
V-9
Methods for the determination of lead in biological materials include72 73 78 79 ftOdithizone colorimetry, * * spectrography, polarography, and atomic
absorption spectrophotometry.69,71,81 addition, many biochemical tests,82reviewed by Chisolm, have been developed; these depend on the lead-induced
upset in heme synthesis. Among these biochemical tests are determination
of coproporphyrin excretion,®^ urinary ALA^ > 8 4 and ALA-D in blood.85,86
Additional methods, such as cell stippling, porphobilinogen determinations,
and examination of intranuclear inclusion bodies have received less
acceptance. These biochemical indices are not recommended at this time.
They can be sensitive, perhaps too sensitive, but they are not specific for
lead, and are judged to be less useful than blood and urinary lead deter
minations for estimating the absorption of lead. However, future develop
ments may resolve some of the present objections to the routine use of
these indices of alterations of heme synthesis in the assessment of lead
absorption.
The dithizone procedure is recommended for analysis of lead in blood
and urine. As discussed in the previous section (Basis for Environmental
Sampling Method), the method is capable of good results if meticulous
attention is given to details, including sources of contamination and loss.87Cholak has stated that with careful control the procedure can detect as
little as 0.5 ig, with a precision of + 0.5 pg, and that, with modifications,
as little as 0.2 + 0.1 pg can be determined. The recommended method as72described by Keenan et al. is given in Appendix II. Bismuth is a
possible, but uncommon, interfering substance, which can be removed by
extraction.
V-10
VI. REFERENCES
1. Weast RC (ed): Handbook of Chemistry and Physics— A Ready Reference Book of Chemical and Physical Data, ed 52, Cleveland, Chemical Rubber Publishing Co, 1971-1972
2. Minerals Yearbook 1969: Metals, Minerals and Fuels. US Bureauof Mines, US Government Printing Office, 1969, vol I-II, p 638
3. Gafafer WM (ed) : Occupational Diseases— A Guide to Their Recognition, PHS publication 1097. US Dept Health, Education, and Welfare, Public Health Service, 1966, pp 170-72
4. Committee on Biologic Effects of Atmospheric Pollutants:Airborne Lead in Perspective. National Academy of Sciences, National Research Council, Division of Medical Sciences, 1971
5. ^lkins HB: The Chemistry of Industrial Toxicology, ed 2. New York, John Wiley & Sons Inc, 1959, pp 49-57
6 . Tanquerel des Planches L: Lead Diseases: A Treatise (fromTratte des maladies de plomb, ou saturnines, Paris, 1839) as cited in Hunter D: The Diseases of Occupations, ed 4. Boston,Little, Brown & Co, 1969, p 330
7. Surton H: Med-Chir Tr, London, 1840, XXIII, 63-79, as cited inGarrison FH: An Introduction to the History of Medicine— With21edical Chronology Suggestions for Study and Bibliographic Data, ed 4. Philadelphia, WB Saunders Co, 1929, p 444
8 . Mayers MR: Occupational Health— Hazards of the Work Environment. Baltimore, Williams & Wilkins Co, 1969, pp 69-70
9. Hunter D: The Diseases of Occupations, ed 4. Boston, Little,Brown & Co, 1969, pp 234-89
10. Lane RE: Health control in inorganic lead industries— A follow-up of exposed workers. Arch Environ Health 8:243-50, 1964
11. Dreessen WC, Edwards TI, Reinhart WH, Page RT, Webster SH, Armstrong DW, Sayers RR: The Control of the Lead Hazard in the Storage Battery Industry, PH bulletin 262. Federal Security Agency, US Public Health Service, US Government Printing Office, 1941
12. Dingwall-Fordyce I, Lane RE: A follow-up study of lead workers.Br J Ind Med 20:313-15, 1963
VI-1
13. Malcolm D: Prevention of long-term sequelae following theabsorption of lead. Arch Environ Health 23:292-98, 1971
14. Henderson DA, Inglis JA: The lead content of bone in chronicBright’s disease. Australasian Ann Med 6:145-54, 1957
15. Lane RE: The care of the lead worker. Br J Ind Med 6:125-63,1949
16. Symposium on Environmental Lead Contamination, Dec 1965, PHS publication No 1440, 0-210-345. US Dept Health, Education, and Welfare, Public Health Service, 1966
17. Rimington C: Haems and porphyrins in health and disease. I.Acta Med Scand 143(fasc III):161-96, 1952
18. Rimington C: The biosynthesis of haemoglobin. Br Med J 2:189-93, 1956
19. Eriksen L: Lead intoxication— I. The effect of lead on the invitro biosynthesis of heme and free erythrocyte porphyrins.Scand J Clin Lab Invest 7:80—85, 1955
20. Kreimer-Birnbaum M, Grinstein M: Porphyrin biosynthesis— III.Porphyrin metabolism in experimental lead poisoning. Biochen Biophys Acta 111:110-23, 1965
21. Hernberg S, Nikkanen J, Hellin 0, Lilius H: 5 -Aminolevulinicacid dehydrase as a measure of lead exposure. Arch Environ Health 21:140-45, 1970
22. Millar JA, Cumming RLC, Battistini V, Carswell F, Goldberg A: Lead and 6-aminolaevulinic acid dehydratase levels in mentally retarded children and in lead-poisoned suckling rats. Lancet 2:695-98, 1970
23. Uaxfield ME, Stopps GJ, Barnes JR, Snee RD, Azar A: Effect oflead on blood regeneration following acute hemorrhage in dogs. (Accepted for publication by Am Ind Hyg Assoc J)
24. Goldblatt MW, Goldblatt J: Some Aspects of IndustrialToxicology, in Merewether ERA: Industrial Medicine and Hygiene.London, Butterworth Co Publishers Ltd, vol 3, p 459, 1956
25. Baikie AG, Valtis DJ: The oxygen consumption of the blood inexperimental lead poisoning. Br J Exp Pathol 35:434-38, 1954
26. Haeger-Aronsen B: Studies on urinary excretion of Ô-aminolaevulic acid and other haem precursors in lead workers and
VI-2

lead-intoxicated rabbits. Scand J Clin Lab Invest 12(suppl.A7) : 1-128, 1960
27. Vannotti A, Imholz A: Die Beziehungen des Reticulumendothels sumUmsatz des Nichthamoglobineisens. Z Gesamte Exp Med 106:597-611, 1939
28. Afonova VN: The metabolism of proteins in the blood serum in experimental lead poisoning. Sb Nauch Tr Ryazan Med Inst 12:129- 32, 1960
29. Camerada P, Congiu M, Leo P: Comportamento del seromucoide edell'acido sialico (sangue e tessuto nervoso) nell'intossicazione sperimentale da piombo nell ratto. Rass Med Sarda 66:253-63,1964
30. Caccuri S: Primi risultate sull'azione dell'acido nicotinico pulla porfirinuria nell'saturnismo sperimentale. Folio Med 26:345, 1940
31. Fonzi S, Pengue L, Raddi R: Processi immunitari nellaintossicazione sperimentale da piombo— Nota VI. Variazioni degli anticorpi antitifici (completi ed incompleti) in corso di immunizzazione attiva specifica. Lav Umano 19:324-28, 1967
32. Ambrosio L, Mazza V: Comportamento del lisozima nel siero disangue e negli organi nelle intossicazioni sperimentali (piombo, benzolo, manganese). Riv 1st Sieroter Ital 29:252-62, 1954
33. Rubino GE, Pagliardi E, Prato V, Giangrandi E: Erythrocytecopper and porphyrins in lead poisoning. Br J Haemat 4:103-07, 1958
34. Kosmider S, Grabski J, Stradowski J: Plasma sodium, calcium andpotassium levels in rabbits during experimental acute lead poisoning. Arch Immunol Ther Exp 11:303-06, 1963
35. Kanner NL: [Influence of lead on the functional state of theadrenal cortex.] Probi Endokr Gorraonoter 11:83-88, 1965 (Rus)
36. Gontea I, Sutescu P, Stanciu V, Lungu D: [Vitamin C in leadpoisoning in the guinea pig.] Igiena 13:501-09, 1964 (Rum)
13137. Sandstead HH: Effect of chronic lead intoxication on vJ.vo Iuptake by the rat thyroid. Proc Soc Exp Biol Med 124:18-20, 1967
38. Goyer RA: Lead and the kidney, in Current Topics in Pathology. New York, Springer-Verlag, 1971, voi 55, pp 147-76
VI-3
39. Six KM, Goyer RA: The influence of iron deficiency on tissuecontent and toxicity of ingested lead in the rat. J Lab Clin Med79:128-36, 1972
40. Gusev MI: [Limits of allowable lead concentrations in the air ofinhabited localities], in Ryazanov VA (ed) : [Limits of AllowableConcentrations of Atmospheric Pollutants], Bk 4, pp 5-31, 1960, translation, US Dept Commerce, Off Tech Serv, 1961 (Rus)
41. Shalamberidze OP: [Limit of allowable concentration of leadsulfide in atmospheric air], in Ryazanov VA (ed): [Limits of Allowable Concentrations of Atmospheric Pollutants], Bl; 5, pp 29-38, translation, US Public Health Service, 1962 (Rus)
42. Xintaras C, Johnson BL, Ulrich CE, Terrill RE, Sobecki MF: Application of the evoked response technique in air pollution toxicology. Toxicol Appl Pharmacol 8:77-87, 1966
43. Xintaras C, Sobecki MF, Ulrich CE: Sleep: Changes in rapid-eye-novement phase in chronic lead absorption. Toxicol Appl Pharmacol 10:384, 1967; abst
44. Rosenblum WI, Johnson MG: Neuropathologie changes produced insuckling mice by adding lead to the maternal diet. Arch Pathol 85:640-48, 1968
45. McClain RM, Becker BA: Placental transport and teratogenicity oflead in rats and mice. Fed Proc 29:347, 1970; abst
46. Tsuchiya K, Harashima S: Lead exposure and the derivation ofmaximum allowable concentrations and threshold limit values. Br J Ind Med 22:181-86, 1965
47. Williams MK, King E, Walford J: An investigation of leadabsorption in an electric accumulator factory with the use of personal samplers. Br J Ind Med 26:202-16, 1969
48. Selander S, Cramer K: Interrelationships between lead in blood,lead in urine, and ALA in urine during lead work. Br J Ind Med 27:28-39, 1970
49. Lane RE, Hunter D, Malcolm D, Williams MK, Hudson TGF, Browne RC,McCallum RI, Thompson AR, deKretser AJ, Zielhuis RL, Cramer K, Barry PSI, Goldberg A, Beritic T, Vigliani EC, Truhaut R, Kehoe RA, King E: Diagnosis of inorganic lead poisoning: A statement.Br Med J 4:501, 1968
50. Stankovic MK: Biochemical tests for the appraisal of exposure tolead. Arch Environ Health 23:265-69, 1971
VI-4
51. Zielhuis RL: Interrelationship of biochemical responses to the absorption of Inorganic lead. Arch Environ Health 23:299-311, 1971
52. Kehoe RA: The Harben Lectures 1960. The metabolism of lead inman in health and disease— Present hygienic problems relating to the absorption of lead, lecture 3. J R Inst Public Health 24:177-203, 1961
53. Brandt AD, Reichenbach GS: Lead exposures at the government printing office. J Ind Hyg Toxicol 25:445-50, 1943
54. Ruf HW: Studies on the lead hazards in certain phases ofprinting. I. Actual lead exposures as measured by the amount of lead in printing atmospheres. J Ind Hyg Toxicol 22:445-63, 1940
55. Belknap EL: Studies on the lead hazards in certain phases ofprinting— II. Actual lead absorption as measured by physical examinations, blood and urine studies. J Ind Hyg Toxicol 22:463- 71, 1940
56. Pegues WL: Lead fume from welding on galvanized and zinc- silicate coated steels. Am Ind Hyg Assoc J 21:252-55, 1960
57. Tabershaw I, Ruotolo BPW, Gleason RP: Plumbism resulting fromoxyacetylene cutting of painted structural steel. J Ind Hyg Toxicol 25:189-91, 1943
58. Survey of Lead in the Atmosphere of Three Urban Communities, PHS publication 999-AP-12. US Dept Health, Education, and Welfare, Public Health Service, 1965
59. Berg BA, Zenz C: Environmental and clinical control of lead exposure in a non-ferrous foundry. Am Ind Hyg Assoc J 28:175-78,1967
60. Ruhf PC: Lead exposure control in the production of leadedsteel. Am Ind Hyg Assoc J 24:63-67, 1963
61. Anerican Conference of Governmental Industrial Hygienists: Transactions of the thirty-third annual meeting of the American Conference of Oovernnental Industrial Hyp.ienists, Toronto,Canada, May 24-28, 1971. Lead, pp 129-132
62. Bussell AE, Jones RR, Bloomfield JJ, Britten RH, Thompson LR:Lead poisoning, in a storage battery plant, PHS bulletin 205. US Treasury Dept, Public Health Service, 1933
63. Permanent Coimission and International Association ofOccupational Health: Report on the Meeting of International
VI-5
Subcommittee for Occupational Health in International Conference on Inorganic Lead - 28-29 Nov, 1968, Amsterdam. Ind Med Surg 38:10-11, 1969
64. USA Standard Acceptable Concentrations of Lead and its Inorganic Compounds, USAS Z37.11-1969 (revision of Z37.11-1943). New York, United States of America Standards Institute Inc (now American National Standards Institute Inc), 1969
65. Kehoe RA: Standards with respect to atmospheric lead. ArchEnviron Health 8:348-54, 1964
6 6 . Kehoe RA: Industrial Lead Poisoning, in Patty FA: IndustrialHygiene and Toxicology, revised ed 2. New York, John Wiley &Sons Inc, vol II, pp 941-80, 1963
67. Analytical Methods for Atomic Absorption Spectroscopy. The Perkin Elmer Corp, 1971
68. Slavin W: Atomic Absorption Spectroscopy. New York,Interscience Publishers, pp 118-22, 1968
69. Farrelly RO, Pybus J: Measurement of lead in blood and urine byatomic absorption spectrophotometry. Clin Chem 15:566-74, 1969
70. Hwang JY, Ullucci PA, Smith SB Jr, Malenfant AL: Atomic Absorption Spectrometric Determination of Lead in Blood by the Solid Phase Sampler Technique. Application Report, Lexington, Mass, Instrumentation Laboratory Inc, 1971
71. Pierce JO II, Cholak J: Lead, chromium, and molybdenum by atomicabsorption. Arch Environ Health 13:208-12, 1966
72. Keenan RG, Byers DH, Saltzman BE, Hyslop FL: The "USPHS" methodfor determining lead in air and in biological materials. Am Ind Hyg Assoc J 24:481-91, 1963
73. Cholak J, Hubbard DM, Burkey RE: Microdetermination of lead inbiological material with dithizone extraction at high pH. Anal Chem 20:671-72, 1948
74. Subcommittee on Chemical Methods, Committee on Ventilation andAtmospheric Pollution, Industrial Hygiene Section: Methods forDetermining Lead in Air and in Biological Materials. New York, American Public Health Association, 1944
75. Keppler JF, Maxfield ME, Moss WD, Tietjen G, Linch AL:Interlaboratory evaluation of the reliability of blood leadanalyses. Am Ind Hyg Assoc J 31:412-23, 1970
VI-6

76. Weil CS: Critique of interlaboratory evaluation of the reliability of blood-lead analyses. Am Ind Hyg Assoc J 32:304- 12, 1971
77. Donovan DT, Vought VM, Rakow AB: Laboratories which conduct leadanalysis on biologic specimens. Arch Environ Health 23:111-13, 1971
78. Vinter P: The estimation of lead in blood. J Med Lab Technol 21:281-86, 1964
79. Cholak J, Story RV: Spectrographic and analysis of biological material— III. Lead, tin, aluminum, copper, and silver. Ind Eng Chem Anal Ed 10:619-22, 1938
80. Cholak J, Bambach K: Determination of lead in biological material: A polarographic method. Ind Eng Chem Anal Ed 13:583- 8 6, 1941
81. Berman E: The determination of lead in blood and urine by atomicabsorption spectrophotometry. Atomic Absorp Newsletter 3:111-14, 1964
82. Chisolm JJ Jr: Disturbances in the biosynthesis of heme in leadintoxication. J Pediatr 64:174-87, 1964
83. Askevold R: Routine analysis of porphyrines in urine. Scand JClin Lab Invest 3:318-19, 1951
84. Mauzerall D, Granick S: The occurrence and determination of 6-aminolevulinic acid and porphobilinogen in urine. J Biol Chem 219:435-46, 1956
85. Granick S, Mauzerall D: Porphyrin biosynthesis in erythrocytes:II. Enzymes converting 6-aninolevulinic acid to coproporphyrinogen. J Biol Chem 232:1119-40, 1958
8 6 . Bonsignore D: [The erythrocyte aminolevulinic (ALA) dehydrataseactivity as a diagnostic test in occupational lead poisoning] Med Lav 57:647-54, 1966 (It)
87. Cholak J: Analytical methods for determination of lead. ArchEnviron Health 8:222-31, 1964
VI-7
VII. APPENDIX I
METHOD FOR SAMPLING OF LEAD IN AIR
Lead dust or fume is collected on 0.45 V cellulose membrane filters
mounted in either 2- or 3-piece filter cassettes. Air is drawn through the
filter by means of a pump at a rate of 2 liters a minute (not less than 1
nor more than 4 liters per minute). A minimum sample of 100 liters shall
be collected. Larger sample volumes are encouraged provided the filters
do not become loaded with dust to the point that loose material would
fall off or the filter would become clogged.
With each group of samples, one filter, labeled as a blank, shall be
submitted; no air shall be drawn through this filter.
The sample cassettes, if shipped, must be packed in a suitable
container to prevent damage in transit. Loss of sample shall be prevented;
loss of loose deposits on the filter can be prevented by mounting a clean
filter in the cassette on top of the sample filter.
Ash the filter and analyze for lead as described in Appendix II.
Other collection methods shown to be equivalent may be used.
VII-1
VIII. APPENDIX II.
•DITHIZONE METHOD OF ANALYSIS OF
LEAD IN AIR AND BIOLOGIC SAMPLES*
The following directions for analysis of lead are taken from the first
part of the report, "The 'USPHS' Method for Determining Lead in Air and
in Biological Materials" by Keenan, Byers, Saltzman, and Hyslop.^^ Additional
information on the reproducibility and accuracy of the method is given in
other portions of the report.
REAGENTS
Analytical grade reagents are used. Purification is essential when
analyzing biological tissues and fluids because of the very low levels of
lead in these materials; purification of reagents may not be required for
air samples containing quantities of lead sufficiently greater than that
present in the reagent blank. A reagent blank sample is carried through
the entire procedure with each set of unknown samples (air, biological,
or other type) and its analyzed lead content is subtracted from each
analytical result to calculate the net quantity of lead in each unknown
sample.
A boiling rod is used to prevent bumping in the flasks when distilling
reagents. This is prepared by cutting 3 or 4 mm O.D. glass tubing to a
length which is one cm greater than the height of the flask. The tubing
is sealed at a spot about one cm above the bottom end which is fire-
polished but left open. Before each use, the liquid is shaken out of
*Alternite methods for analyzing for lead in air (method 5341) and in blood (method P & CAm 262) are given in the NIOSH manual of analytical methods,2nd Edition 1977 DHEW (NIOSH) Publications No-77-157A and 157B.Available from the Government Printing office, Washington, D.C.
VIII-1
the bottom section and the rod inserted in the flask. As the flask
is heated a steady stream of air and vapor bubbles issues from the
open space, thus providing nuclei for smooth boiling.
Double-distilled Water - To distilled water in an all borosilicate-
glass still add a crystal each of potassium permanganate and barium
hydroxide and redistill. Use for reagent and biological sample solutions
unless tests indicate that single-distilled water is satisfactory;
single-distilled water is usually adequate for determinations on air
samples.
Nitric Acid, Concentrated - Redistill in an all borosilicate-glass
still the ACS reagent grade acid, 69.0% minimum, specific gravity 1.42.
Use an electric heating jacket on the boiling flask to minimize danger
of its breakage, and a boiling rod to prevent bumping, which otherwise
would be severe. Discard the first 50 ml of distillate; this may be
combined with the acid allowed to remain in the flask at the end of the
distillation and used for washing glassware. The reagent is conveniently
dispensed from a small automatic burette. No grease should be used on
the stopcock.
Nitric Acid, 1:99 - Dilute 10 ml of the redistilled, concentrated
acid to one liter with doubled-distilled water.
Ammonium Hydroxide, Concentrated - Distill in an all borosilicate-
glass still 3 liters of the ACS reagent grade, 28.0% minimum specific
gravity 0.8957 at 60 F, into 1.5 liters of double-distilled water,
VIII-2
contained in a 2 -liter reagent bottle which is chilled in an ice bath.
Continue the distillation until the bottle is filled up to the pre
viously marked 2-liter level. Submerge the condenser tube deeply in
the water in the receiver, but withdraw it before discontinuing the
heat to avoid siphoning back of distillate. This reagent may be pre
pared more conveniently from tank ammonia, using a small wash bottle
to scrub the gas and a sintered glass delivery tube which extends to
the bottom of the reagent bottle. The ammonia gas is absorbed in
double-distilled water until the solution reaches the desired specific
gravity.
Chloroform - Use a brand with a statement on the label that the
chloroform passes the American Chemical Society test for suitability
for use in dithizone procedures. In addition, each batch of chloroform
should be purchased in glass containers only and should be tested as
follows in the laboratory to make sure that it is satisfactory for
preparing the dithizone solutions: add a minute quantity of dithizone
to a portion of the chloroform in a test tube, shake gently, then
stopper with a cork. The faint green color should be stable for one
day. Our experience has indicated that the procedures for reclaiming
used chloroform are tedious, time-consuming, sometimes unsuccessful,
and no longer warranted in view of the commercial availability of
acceptable reagent grades.
Extraction Dithizone - Dissolve 16 mg of diphenylthiocarbazone
(dithizone), Eastman Kodak Co. No. 3092, or equivalent, in one liter
of chloroform. Store in a brown bottle in the refrigerator.
VIII-3
Standard Dithizone - Dissolve 8 mg of diphenythiocarbazone in
one liter of chloroform. Store in a brown bottle in the refrigerator
but allow to warm to room temperature before using. Age for at least
one day, then standardize as described in the procedure. Restandardize
every few months.
Sodium Citrate - Dissolve 125 g of the 2 Na^CgH^Oy•11 H2 O salt in
sufficient distilled water to provide a solution nearly 500 ml in volume.
Adjust the pH to 9-10, using a very small quantity of phenol red indi
cator solution (strong red color) and fresh, pHydrion test paper to
check the pH. Extract in a large separatory funnel with a 100 mg per4
liter solution of dithizone and finally with the extraction dithizone
reagent until- a green extract is obtained with the latter reagent. Add
a small volume of lead-free citric acid until an orange color (pH 7)
appears. Extract the excess dithizone repeatedly with chloroform until
a colorless extract is obtained. Remove the last traces of chloroform.
Hydroxylamine Hydrochloride - Dissolve 20 g of the salt in distilled
water to provide a volume of 65 ml. Add a few drops of m-cresol purple
indicator, then add ammonia until the indicator turns yellow (pH 3).
Add a sufficient quantity of a 4% solution of sodium diethyldithio-
carbamate to combine with metallic impurities, then mix. After a few
minutes extract repeatedly with chloroform until the excess carbamate
reagent has been removed, as indicated by the absence of a yellow color
in the final chloroform extract tested with a dilute copper solution.
VIII-4
To the aqueous solution of the hydroxylamine hydrochloride add redistilled,
6N hydrochloric acid until the indicator turns pink, and adjust the
volume to 1 0 0 ml with double-distilled water.
Potassium Cyanide - (Danger! Highly poisonous!!) To 50 g of potassi
um cyanide in a beaker, add sufficient distilled water to make a sludge.
Transfer the sludge to a separatory funnel previously marked to show
100-ml volume. Add a small amount of distilled water to the beaker and
warm. (Potassium cyanide cools the solution as it dissolves, thus
retarding the solution process.) Add this warm water to the separatory
funnel but do not permit contents to exceed the 100-ml mark. Shake,
then let stand until the contents come to room temperature. A practically
saturated solution results.
Extract the lead b"y shaking repeatedly with portions of the extrac
tion dithizone solution until the lead has been removed. Part of the
dithizone dissolves in the aqueous phase but enough remains in the
chloroform to color it. A green extract indicates that all the lead
has been completely extracted. Most of the dithizone in the aqueous
phase is then removed by repeated extractions with pure chloroform.
Dilute the concentrated solution of potassium cyanide with double-distilled
water to 500 ml. It should not be necessary to filter the solution, if
the directions are followed precisely. Extraction is carried out before
dilution because the higher pH of the dilute solution is less favorable.
VII1-5
(NOTE: A colorless solution usually results if above directions
are followed. Occasionally aging results in a brown color or precipitate
due to polymerization of hydrogen cyanide. This does not interfere with
use of the reagent if it is carefully decanted. Old potassium cyanide
reagent may lose enough strength to cause insufficient complexing of
large amounts of zinc.)
Ammonia-cyanide Mixture - Mix 200 ml of the purified 10% potassium
cyanide reagent with 150 ml of distilled ammonium hydroxide (specific
gravity 0.9, corresponding to 28.4% NH^) and dilute to one liter with
double-distilled water. If the measured specific gravity of the ammonia
is not 0.9, use the equivalent volume as calculated from a table of
specific gravity vs. percentage ammonia.
Standard Lead Solution - Dissolve 1.5984 g of pure lead nitrate
in one liter of 1:99 nitric acid to provide a strong stock solution
containing one mg Pb per ml. Pipet exactly 20 ml into a 500-ml volumetric
flask and make to mark with 1:99 nitric acid to give a dilute stock
solution containing 40 p g Pb per ml. (A standard lead solution, 10 Ug
Pb/ml, was stable in 1:99 nitric acid for three years.) Prepare a
working solution, containing 2 P g Pb per ml, just before it is needed
by pipetting 5 ml of the dilute stock solution into a 100-ml volumetric
flask and making to mark with 1:99 nitric acid.
Phenol Red - 0.1% aqueous solution.
Ashing Aid Acid - Dissolve 25 g potassium sulfate in sufficient
redistilled concentrated nitric acid to make 1 0 0 ml.
VIII-6
White Petrolatum - Supplied in a glass jar, for greasing stopcocks.
To check on the purity, put a pinch of this petrolatum in a beaker, add
a few milliliters of the standard dithizone and swirl. If the dithizone
is no longer green after a few minutes, the material is unsatisfactory
for greasing stopcocks.
APPARATUS
A Beckman Model DU Spectrophotometer has been used in this laboratory
since this instrument became available in the 1940s. However, the
Beckman Model B and the Bausch and Lomb Spectronic 20 have been shown
to give comparable results for blood lead determinations, provided that
appropriate standardizations are conducted with each instrument. Other
laboratories, whose results are reported in this paper, have presumably
used a diversity of available photometers and spectrophotometers. In
our laboratory, 22 x 175 mm matched test tubes are used in most spectro-
photometric procedures employing the Model DU, which is fitted with a
tube holder which does not interfere with the use of the instrument
with regular cells. These same tubes are used in the Model B fitted
with a test tube adaptor. A 3/4-inch tube, supplied by the manufacturer,
is used in the Bausch and Lomb Spectronic 20.
Borosilicate glassware is used throughout the procedures (except
for vacutainers used for blood sampling). Ashing is performed in 125-
or 250-ml Phillips beakers. Automatic burettes are used for the addition
of most reagents. The extractions are conducted in the Squibb-type,
125-ml separatory funnels supported in electrically operated shakers
provided with timer switches. The stopcocks of the separatory funnels
VIII-7

are greased with white petrolatum (purchased in a glass jar rather
than in a metal can or tube) unless Teflon stopcocks, which require
no grease, are used. All glassware should be reserved for trace
analysis only to avoid possible gross contamination.
Soak all ashing beakers in a detergent solution (Alconox or
Duponol is suitable) immediately after each usage to prevent any
material from drying on the surfaces. Rinse 8-10 times with hot water
and store in a dust-proof drawer or cabinet until needed. Use the
following acid cleaning, lead-freeing techniques immediately before the
next use of the glassware: Rinse the ashing beakers with a saturated
solution of sodium dichromate in concentrated sulfuric acid. Leave a
1 - 2 ml portion in the beaker or flask (proportionally less in a small
volumetric flask!). Add about 5-10 ml of warm tap water and allow the
hot solution to flow over all inner surfaces to remove the last traces
of grease. Rinse with three or four portions of cold tap water. Rinse
with one portion of either concentrated or 1 : 1 nitric acid, as preferred.
(This wash nitric acid may be used repeatedly until it loses its strength.)
Then rinse successively with three or four portions each of tap water,
distilled and double-distilled water. Set the beakers upright on the
bench and cover with a clean dust-case or a large piece of filter paper
(or otherwise protect from dust). Under no circumstances
is glassware turned upside down to drain on a towel or cheesecloth
placed on a laboratory bench. Use an oven operating at 105 C if dry
glassware is required.
VIII-8
Separatory funnels are rinsed with tap water immediately after use. If
a high lead sample was present or if a visible precipitate remains on the inside,
it is rinsed with a small portion of 1:1 wash nitric acid (which is discarded),
followed by tap water. The stoppered funnels are stored in double-deck racks.
Immediately before use, stopcocks are regreased if necessary. Then the funnels
are rinsed with wash acid, four times with tap water, and four times with dis
tilled water. Each rinse is accomplished by shaking with the stopper, then
draining through the stopcock with two or three turns.
Spectrophotometer tubes are rinsed four times each with tap and distilled
water immediately after use. They are placed upright in a large beaker and
dried in an oven at 105 C, then stored under a dust-cover. Occasionally they
are cleaned with dichromate-sulfuric acid and nitric acid as described above.
(NOTE: With this method of cleaning glassware we have never encountered
cross-contamination from chromium, lead, or from any other trace element being
determined routinely in this laboratory.)
ANALYTICAL PROCEDURE
1. Warm the sample ash (prepared as described in the following sections)
with 2 ml of concentrated nitric acid for a few minutes, then add 25 ml of
distilled water, heating on the hotplate until a clear solution is obtained.
2. Cool to room temperature. Add to the solution in the beaker one ml
of hydroxylamine hydrochloride, 4 ml of sodium citrate (10 ml is required for
a urine sample), one drop of phenol red indicator, and titrate to a strong
red color with concentrated ammonia reagent. Add a few drops excess of
ammonia to make sure that the pH is between 9 and 10, using fresh pHydrion
test paper to check the pH.
(NOTE: Phenol red has a weak orange-red color in strong acid, yellow
in weak acid, and a red color in alkaline solution. Do not mistake the
VIII-9
first color for that produced in alkaline medium!)
3. Transfer the sample quantitatively with double-distilled water
rinsings to a 125-ml Squibb separatory funnel containing 5 ml of the potassium
cyanide reagent.
4. Add 5 ml of the extraction dithizone and shake two minutes, after
releasing the initial pressure by momentarily opening the stopcock of the
inverted separatory funnel. Allow the chloroform layer to settle.
5. Draw off most of the extraction dithizone into a second funnel
containing exactly 30 ml of 1:99 nitric acid.
6 . Add a second 5-ml portion of extraction dithizone to the first
funnel and shake as before. Allow the layers to separate and combine the
extracts in the second funnel. Continue this process with fresh portions
of extraction dithizone until the reagent remains green. A rough estimate
of the lead present in the sample may be made on the basis of 2 0 Ug for each
cherry-red 5-ml extract portion.
7. Shake the second funnel for two minutes to transfer the lead to
the 1:99 nitric acid layer. Allow the layers to separate. Discard the
chloroform layer.
8 . Shake the nitric acid solution with approximately 5 ml of reagent
chloroform and let settle. Drain the settled chloroform through the stop
cock bore as completely as possible without loss of the aqueous layer.
Evaporate the last drop of chloroform clinging to the upper surface of the
liquid.
(NOTE 1: Start a zero lead standard at the beginning of this step
by placing 30 ml of 1:99 nitric acid in a separatory funnel. This zero lead
standard will be used to set the spectrophotometer at zero absorbance for
VIII-10
each series of samples being analyzed.)
(NOTE 2: If the quantity of lead estimated for any sample exceeds the
25 vg range of the colorimetric determination, pipet an appropriate aliquot
of the nitric acid solution at the end of step 7 into a clean separatory
funnel containing 5 ml 1:99 nitric acid to minimize errors caused by possible
leakage of the stopcock, add sufficient additional 1:99 nitric acid to make
30 ml total volume, and continue with step 8 .)
(NOTE 3: Start lead standards at this point if required. Add 5-ml
portions of 1:99 nitric acid to each of four separatory funnels, then 2.5,
5.0, 7.5, and 12.5 ml of dilute standard lead solution (2 Pg Pb/ml) from
a burette, respectively to the separatory funnels, finally add the proper
quantity of 1:99 nitric acid to make total volume 30 ml in each. Continue
with step 8 .)
9. Add 6.0 ml of the ammonia-cyanide mixture, exactly 15.0 ml of the
standard dithizone, and shake two minutes. Allow the layers to separate.
Drain the chloroform layer containing the lead dithizonate into a clean,
dry test tube, and cork the tube immediately.
10. Decant this solution carefully into a dry photometer tube leaving
the water behind. If any water spots are visible in the optical light path,
transfer again to another photometer tube.
11. Set the spectrophotometer at a wavelength of 510 nm.
12. Set the instrument at zero absorbance using the zero lead
standard solution.
13. Read the absorbances of the samples and of the reagent blank.
VIII-11
14. Calculate the lead content of each by multiplying its absorbance
by the standardization factor (which is the slope of the standardization
plot in micrograms of lead per unit of absorbance.) Subtract the blank
value from the gross lead content of each sample to obtain the net amount
of lead expressed in micrograms.
SPECIAL MATERIALS FOR BLOOD SAMPLING
1. Vacutainers, Becton-Dickinson, No. 3208, 20-ml or 10-ml, complete
with stoppers are used for blood sampling. The vacutainers are used repeat
edly and are lead-freed by the technique described previously. Blood is
removed from the vacutainers and the stoppers, after each use, by soaking
in cold tap water. When no further visible trace of blood remains on these
items, they are soaked overnight in the detergent solution. They are then
rinsed repeatedly with hot tap water to remove alkaline materials. The
vacutainers are then subjected to the chromic and nitric acid cleaning
procedures. The stoppers are soaked for 20- to 30-minute periods, three
times, with single distilled water and finally three times with double
distilled water. The lead-freed vacutainers are dried at 105 C, fitted with
clean stoppers, and stored in a drawer reserved for them. Layers of cheese
cloth are placed between the separate layers of vacutainers and the drawer is
sealed with masking tape to prevent the admittance of any dust. They are
evacuated just before shipment to the field. A vacuum tester is used both
in the laboratory and field to test for loss of vacuum, which usually will
not occur until stoppers have been used several times.
2. Vacuum Tester, High Frequency, Fisher Cat. No. 1-179, or equivalent.
VIII-12
3. Needles, Becton-Dickinson, Gauge 20, one and one-half inches in
length, stainless steel, B-D No. 3200 N. As these needles are used
repeatedly, check the tips for burrs by drawing them across the thumb
nail. When burrs develop either discard the needles or file off the
burrs. After filing, they must be recleaned. Vacutainer needles are soaked
in a dilute detergent solution. A Becton-Dickinson Needle Cleaner, No. 3200
C, is used to force detergent solution and subsequent rinse water through
the needles. Needles are subjected to thorough rinsing with distilled
water. They are then placed in steritubes and either autoclaved or heated
for two hours in a drying oven operating at 180 C. The steritubes are then
fitted with rubber caps.
4. Steritubes, Becton-Dickinson, No. 3200 D, with rubber caps.
5. Stillets for No. 3200 N needles, 20 Gauge, two and seven-eighths
inches long.
(These BD items are available from the Becton-Dickinson Company,
Rutherford, New Jersey.)
COLLECTING AND ASHING BLOOD SAMPLES
Collect a 10-ml sample of whole blood using a lead-free vacutainer
and a sterilized, stainless steel needle. In the laboratory, transfer the
sample to a weighed, lead-free, 125-ml borosilicate Phillips beaker. No
aliquoting of the blood is permissible, as most of the lead is present in
the clot. Determine the weight of the blood sample to the nearest 0.01
gram, weighing rapidly to minimize evaporation. Add 2 ml of ashing aid
acid reagent. Add 7 ml of concentrated nitric acid. (This ashing system
VIII-13
permits the analyst to handle a large number of samples at a time as the
blood clot breaks up readily and smoothly without bumping and without requir
ing the constant attention of the analyst.) Place the samples on a hotplate
operating about 130 C and evaporate just to dryness. After the water is
driven off in the Initial evaporation to dryness, keep the beaker covered
with a lead-free watchglass to increase the reflux action of the concentrated
acid. This serves to wash solids down from the sides to the hotter zone
at the bottom, and also reduces the amount of acid needed. Cool the beaker
briefly and then add successive portions of the nitric acid ranging from
2 ml down to 0.5 ml as the ashing proceeds. Do not remove the watchglass at
any time but merely slide it back sufficiently to facilitate each new addition
of the acid. Each time, as soon as the residue becomes light colored, heat on
a 400 C hotplate just long enough to blacken the residue, then remove and cool
the sample. Throughout the remainder of the ashing procedure, alternately heat
the sample with a few drops of nitric acid on the 130 C hotplate and bake the
residue for the few minutes required to darken it on the 400 C hotplate.
Finally, the residue will remain pale yellow or light brown (due to iron con
tent) after heating for 5-10 minutes at the high temperature. Avoid excess
baking at this stage as the ash will become decomposed to a difficultly soluble
form. It is now ready for solution and analysis. Report results as milligrams
of lead per 1 0 0 grams of whole blood.
COLLECTING AND ASHING URINE SAMPLES
Use lead-free, narrow-mouthed, reagent-type, borosilicate, 250-ml
bottles provided with standard taper glass stoppers to collect grab samples of
VIII-14
urine. Add 2.0 ml of a 37% formalin solution as a preservative, shaking
the bottle 1 0 - 1 2 times after the contribution of the urine to mix the specimen
with the formalin thoroughly.
Alternatively, urine specimens may be collected in 125-ml polyethylene
bottles containing as a preservative 100-200 mg of EDTA (acid form) per bottle.
This is convenient and economical for shipping samples considerable distances.
If the urine sample is clear and only one or two days old, measure a
50 ml portion into a graduated cylinder. However, if the sample is older,
much of the lead may be in a sediment or on the walls of the bottle and must
be dissolved before aliquoting. Transfer the entire specimen to a glass-
stoppered graduated cylinder, record the volume, rinse the sample bottle with
three small portions of concentrated nitric acid and add these rinsings to
the cylinder. Mix thoroughly (Caution! Old samples may foam over.) Note
the total volume and remove an aliquot equivalent to 50 ml of urine for
analysis. Transfer the aliquot portion to a lead-free, 250-ml borosilicate
Phillips beaker and add 5 ml of redistilled concentrated nitric acid.
Evaporate just to dryness on a hotplate operating at about 130 C. Cool, add
sufficient nitric acid to moisten the residue and cover the beaker with a
lead-free watchglass. Heat on the 130 C hotplate and then alternately bake
for a few minutes and digest with minimal amounts of nitric acid (as des
cribed in the ashing method for blood) until a white residue remains after
the final heating for 5-10 minutes at the high temperature. The sample is
now ready for solution and analysis. Report results as milligrc:,« of lead
per liter of urine.
VIIT-1S
PROCEDURE FOR AIR SAMPLES
It is convenient to wash out samples in electrostatic precipitator
tubes with redistilled ethanol, using a special policeman made with a
rubber disc cut to fit the tube like a piston, and transferring the
sample through a short stem funnel into a 250-ml Phillips beaker; gently
evaporate just to dryness. (Ethanol is helpful in removing greasy deposits
on the walls of the precipitator tube. Some chemists may prefer hot 1 to
5% nitric acid to transfer the sample.) Transfer impinger samples or
membrane filter samples to Phillips beakers. If little ash is expected
(usually for impinger or membrane filter samples), add 2 ml of ashing aid
acid reagent. (The presence of this salt will prevent loss of lead by
glazing onto the surface of the beaker during ashing.) Otherwise add 1-2
ml nitric acid. Evaporate to dryness. Continue ashing with nitric acid
at a moderate heat until organics are destroyed.
Dissolve the ash in 2 ml of concentrated nitric acid and distilled
water and then transfer quantitatively to a 1 0 0 -ml volumetric flask and
make to mark. Pipet a suitable aliquot into a separatory funnel, contain
ing about 5 ml of double-distilled water, add sufficient additional
double-distilled water to make the total volume about 25 ml,
and apply the Analytical Procedure, starting with step 2. In step 3,
as the sample is already in a separatory funnel, merely add the cyanide.
The amount of lead present in the aliquot may be estimated as described
in step 6 . If it is less than a few micrograms, an additional aliquot
may be added to the same funnel, and the pH readjusted with ammonia.
The extraction Is then continued, and extracts combined with those
collected previously in the second funnel. If the estimated amount
VIII-16
of lead exceeds the range of the method (25 micrograms), take an aliquot
as described in Note 2, step 8 .
When calculating the results, make allowance for the total number
of aliquots. If convenient, aliquot the reagent blank in the same manner
so that the correction represents the same amounts of ashing and extraction
reagents as are present in the sample. However, the blank correction is
usually small for air samples. Report results as milligrams of lead per
cubic meter of air.
VIII-17
IX. _ APPENDIX III MATERIAL SAFETY DATA SHEET
The following items of information which are applicable to a specific
product or material containing lead shall be provided in the appropriate
section of the Material Safety Data Sheet or other approved form. If a
specific item of information is inapplicable (i.e. flash point) initials
"n.a." (not applicable) should be inserted.
(i) The product designation in the upper left hand corner of both
front and back to facilitate filing and retrieval. Print In upper case
letters in as large print as possible.
(ii) Section I. Name and Source
(A) The name, address, and telephone number of the manufacture? or
supplier of the product.
(B) The trade name and synonyms for a mixture of chemicals, a basip
structural material, or for a process material; and the trade name and
synonyms, chemical name and synonyms, chemical family, and formula for a
single chemical.
(iii) Section II. Hazardous Ingredients
(A) Chemical or widely recognized conmon name of all hazardous
ingredients.
(B) The approximate percentage by weight or volume (indicate b*sls)
which each hazardous ingredient of the mixture bears to the whole mixture.
This may be indicated as a range of maximum amount, i.e., 10-20Z V; 10Z
max. W.
IX-1
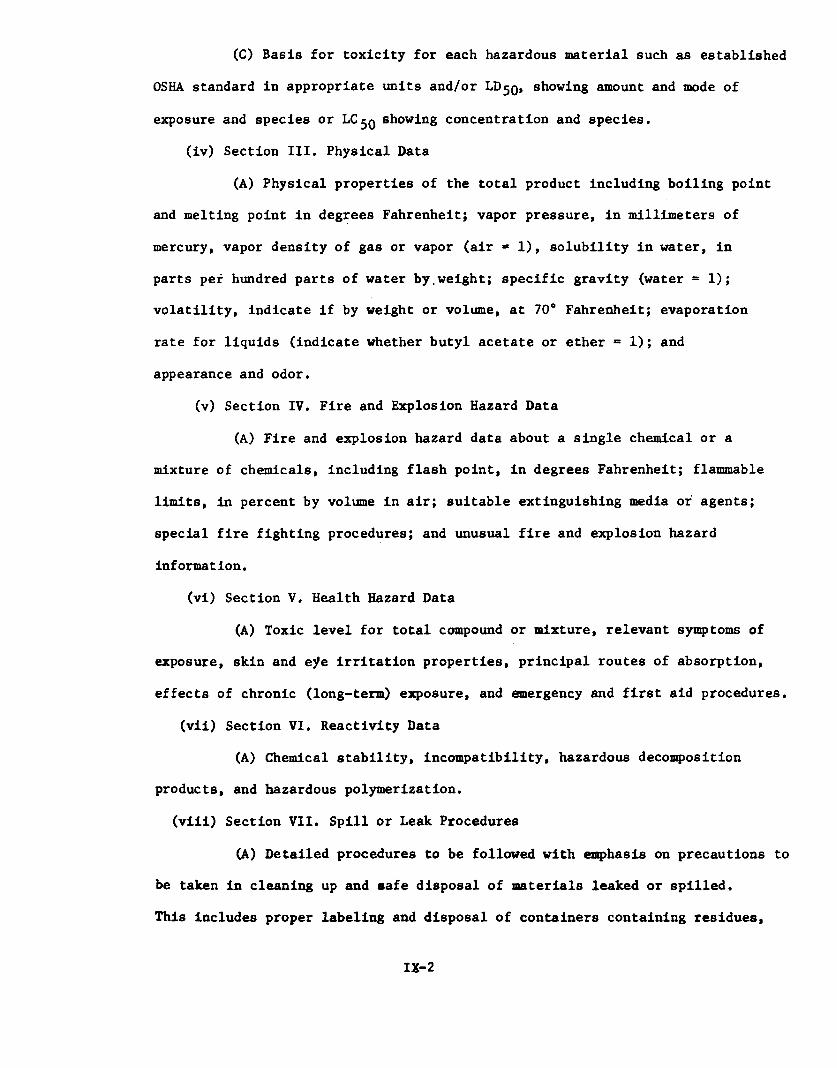
(C) Basis for toxicity for each hazardous material such as established
OSHA standard in appropriate units and/or LD5Q, showing amount and mode of
exposure and species or LCijq showing concentration and species.
(iv) Section III. Physical Data
(A) Physical properties of the total product including boiling point
and melting point in degrees Fahrenheit; vapor pressure, in millimeters of
mercury, vapor density of gas or vapor (air « 1 ), solubility in water, in
parts per hundred parts of water by.weight; specific gravity (water = 1 );
volatility, indicate if by weight or volume, at 70° Fahrenheit; evaporation
rate for liquids (indicate whether butyl acetate or ether = 1 ); and
appearance and odor.
(v) Section IV. Fire and Explosion Hazard Data
(A) Fire and explosion hazard data about a single chemical or a
mixture of chemicals, including flash point, in degrees Fahrenheit; flammable
limits, in percent by volume in air; suitable extinguishing media or agents;
special fire fighting procedures; and unusual fire and explosion hazard
information.
(vi) Section V. Health Hazard Data
(A) Toxic level for total compound or mixture, relevant symptoms of
exposure, skin and eye irritation properties, principal routes of absorption,
effects of chronic (long-term) exposure, and emergency and first aid procedures,
(vii) Section VI. Reactivity Data
(A) Chemical stability, incompatibility, hazardous decomposition
products, and hazardous polymerization.
(viii) Section VII. Spill or Leak Procedures
(A) Detailed procedures to be followed with emphasis on precautions to
be taken in cleaning up and safe disposal of materials leaked or spilled.
This includes proper labeling and disposal of containers containing residues,
IX-2
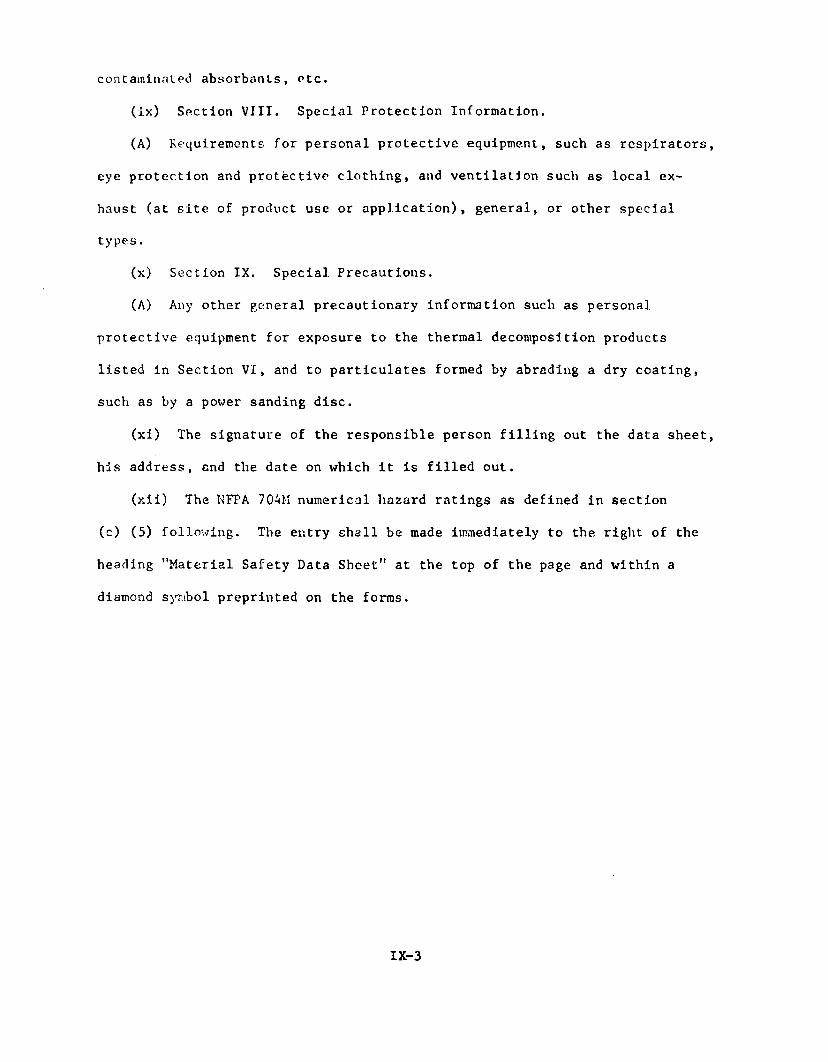
contaminated absorbanls, etc.
(ix) Section VIII. Special Protection Information.
(A) Requirements for personal protective equipment, such as respirators,
eye protection and protective clothing, and ventilation such as local ex
haust (at site of product use or application), general, or other special
types.
(x) Section IX. Special Precautions.
(A) Any other general precautionary information such as personal
protective equipment for exposure to the thermal decomposition products
listed in Section VI, and to particulates formed by abrading a dry coating,
sucVi as by a power sanding disc.
(xi) The signature of the responsible person filling out the data sheet,
his address, and the date on which it is filled out.
(xii) The NFPA 70AM numerical hazard ratings as defined in section
(c) (5) following. The entry shall be made immediately to the right of the
heading "Material Safety Data Sheet" at the top of the page and within a
diamond symbol preprinted on the forms.
IX-3
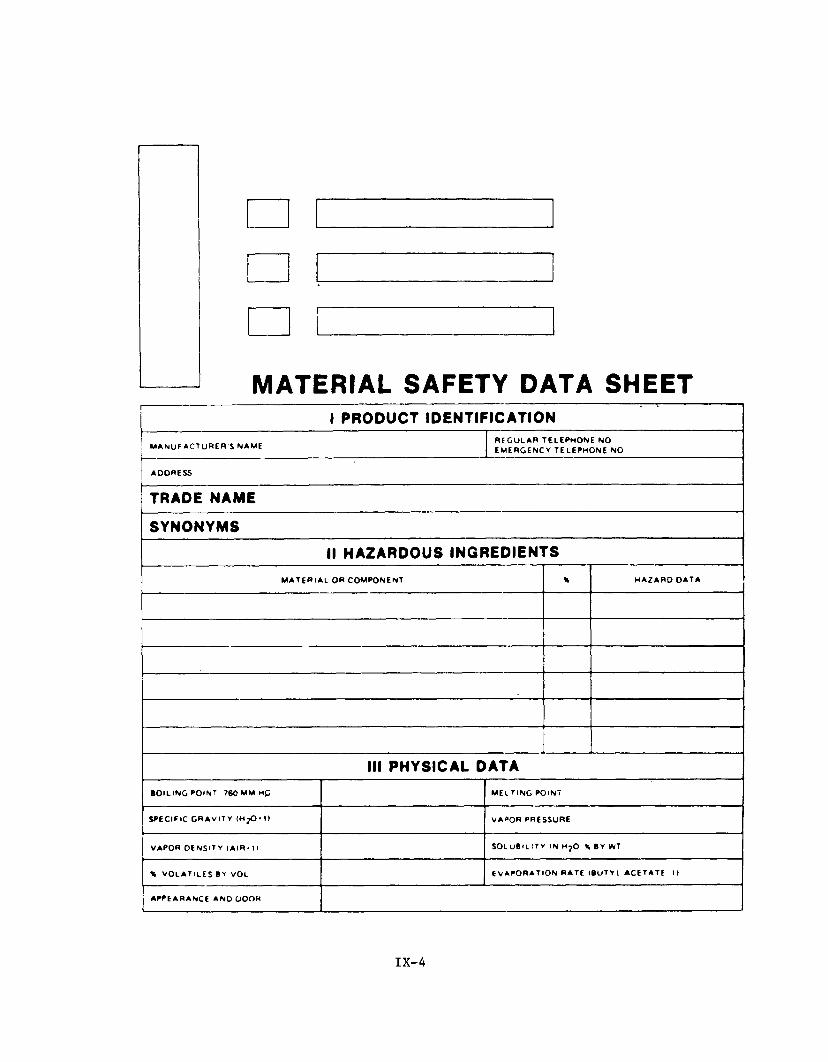
MATERIAL SAFETY DATA SHEET1 PRODUCT IDENTIFICATION
M A N U F A C T U R E R S NAME RE GU LAR TELEPHONE NO EM E RGE NCY TELEPHONE NO
ADDRESS
TRADE NAME
SYNONYMSII HAZARDOUS INGREDIENTS
MATERIAL OR COMPONENT \ H A Z A R D OATA
III PHYSICAL DATABOILING POINT ?60 M M M£ MELTING POINT
SPECIFIC GRAVITY (HpO-l) VAPOR PRESSURE
VAPOR OENSlTY (AIR'11 SOLuBaiTY IN H ?0 \ BY WT
% v o l a t i l e s VOL E v a p o r a t i o n r a t e <Bu t y i a c e t a t e u
APPEARANCE AN O OO OH
IX-4
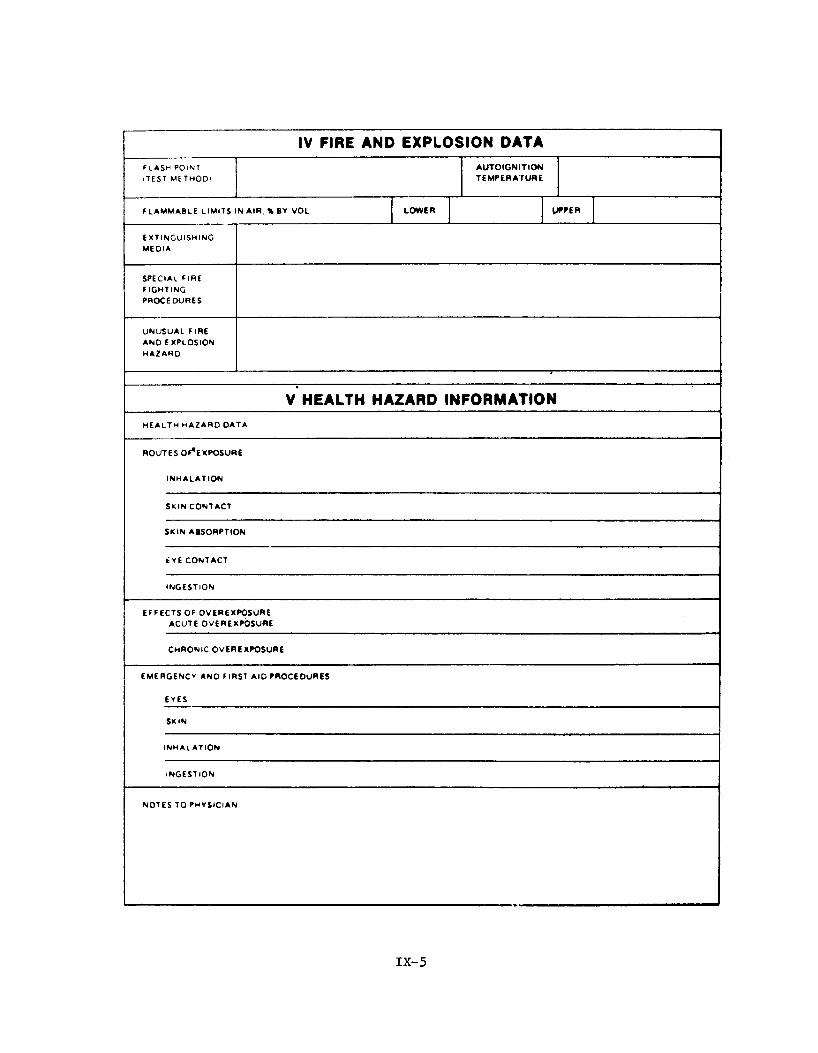
IV FIRE AND EXPLOSION DATAF l a s h p o i n t
<TEST M E T H O D )AUTOIGNITIONTEMPERATURE
FLAMMABLE LIMITS in AIR. % BY VOL LOWER UPPEREXTINGUISHINGMEDIA
s pe ci al fireFIGHTINGPROCEDURES
UNUSUAL FIRE AND EXPLOSION HAZA RD
V HEALTH HAZARD INFORMATIONh e a l t h h a z a r o o a t a
ROUTES OF,EXPOSURE
INHALATION
SKIN CONTACT
SKIN ABSORPTION
ÉYE CONTACT
INGESTION
EFFECTS OF OVEREXPOSURE ACUTE OVEREXPOSURE
CHRONIC OVEREXPOSURE
EMERGENCY ANO FIRST AID PROCEDURES
EYES
SKIN
INHALATION
INGESTION
NOTES TO PHYSICIAN
IX-5
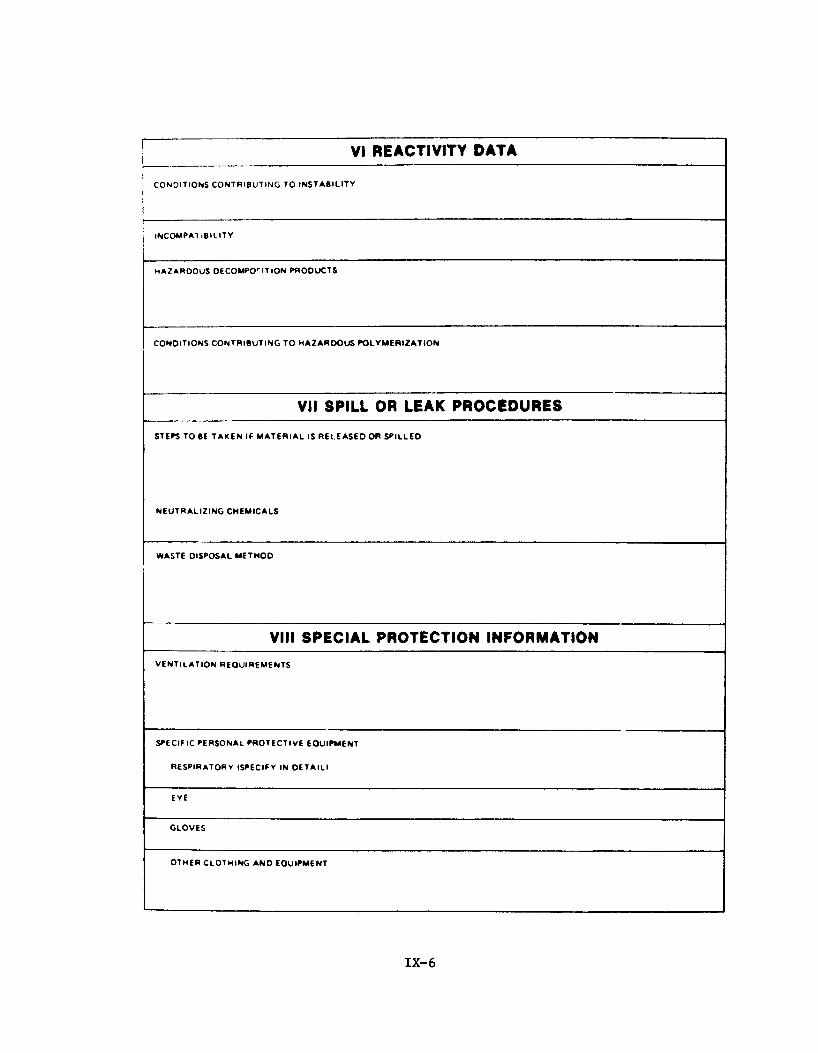
VI REACTIVITY DATA
CONDITIONS CONTRIBUTING TO INSTABILITY
INCOMPA1 iBI LITY
HA ZARDOUS DECOMPOSITION PRODUCTS
CONDITIONS CONTRIBUTING TO HA Z AR D OU S POLYMERIZATION
VII SPILL OR LEAK PROCEDURES
STEPS TO BE TAKEN If MATERIAL IS RELEASED OR SPILLED
NEUTRALIZING CHEMICALS
WASTE DISPOSAL M E T HO D
VIII SPECIAL PROTECTION INFORMATIONv e n t i l a t i o n r e q u i r e m e n t s
SPECIFIC PERSONAL PROTECTIVE EQUIPMENT
RESPIRATORY (SPECIFY IN OETAIll
EYE
GLOVES
o t h e r c l o t h i n g a n d e q u i p m e n t
IX-6
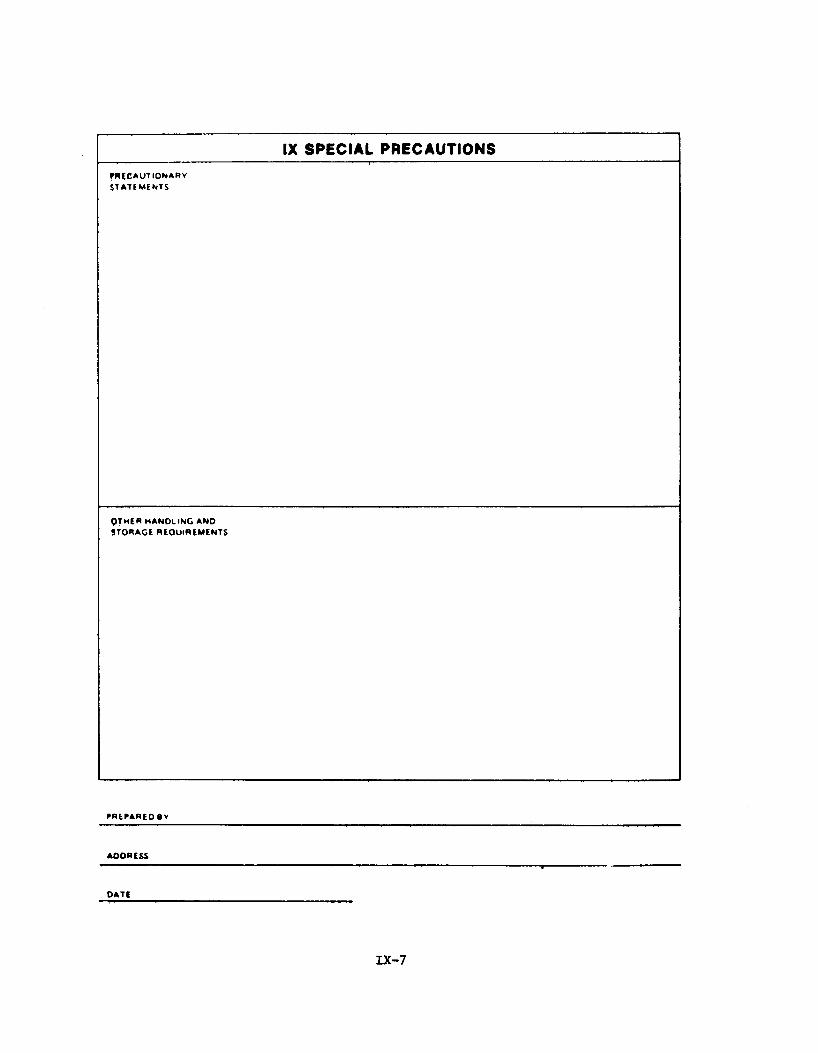
IX SPECIAL PRECAUTIONSPr e c a u t i o n a r ySTATEMENTS
QTHER HANDLING A ND STORAGE REQUIREMENTS
PREPAREO BY
AOORESS
DATE

Physical
Property
Atomic Number
Atomic Weight
Thermal Conductivity
Density
Melting Point
Boiling Point
Electrical Resistivity
Adapted from reference^
TABLE X-l
Properties of Lead
Value
82
207.19
0.346 watts/cm C
11.344 g/ml
327.5 C
1744 C
20.6 pohm-cm
(25 C)
(16 C)
(20 C)
X-l

TABLE X-2
Lead consumption In the United States, by products 1969
(Short tons)
Product 1969
Metal products:Ammunition 79,233Bearing metals 17,406Brass and bronze 21,512Cable covering 54,203Calking lead 44,857Casting metals 9,918Collapsible tubes 12,484Foil 5,881Pipes, traps, and bends 19,407Sheet lead 25,818Solder 72,626Storage batteries:
Battery grids, posts, etc. 280,386Battery oxides 302,160
Teme metal 1,583Type metal 25,660
Tota! 973,134
Pigments:White lead 6,617Red lead and litharge 79,898Pigment colors 14,670Other 1,201
Total 102,386
Chemicals :Gasoline antiknock additives 271,128Miscellaneous chemicals 602
Total 271.730
Miscellaneous uses:Annealing 4,252Galvanizing 1,797Lead plating 406Weights and ballast 17,366
Total 23,821
Other, unclassified 18.287
Grand total 389,358
Adapted from Reference 2X-2

Potential Occupational Exposures to Inorganic Lead
TABLE X-3
Babbitters Battery makers Bookbinders Bottle cap makers Brass founders Brass polishers Braziers Brick burners Brick makers Bronzers Brush makers Cable makers Cable splicers CannersCartridge makers Ceramic makers Chemical equipment makers Chippers Cutlery makers Demolition workers Dental technicians Diamond polishers Dye makersElectronic device makersElectroplatersElectrotypersEmery wheel makersEnamel burnersEnamelersEnamel makersFarmersFile cuttersFilersFlower makers, artificial Foundry molders Galvanizers Glass makers Glass polishers
Gold refiners Gun barrel browners Incandescent lamp makers Insecticide makers Insecticide users Japan makers Japanners JewelersJunk metal refiners Lacquer makers Lead burnersLead counterweight makersLead flooring makersLead foil makersLead mill workersLead minerBLead pipe makersLead salt makersLead shield makersLead smeltersLead stearate makersLead workersLinoleum makersLinotypersLithographersMatch makersMetal burnersMetal cuttersMetal grindersMetal minersMetal polishersMetal refinersMirror silverersMotor fuel blendersMusical instrument makersPaintersPaint makersPaint pigment makers
Patent leather makers Pearl makers, imitation Pipe fitters Plastic workers PlumbersPottery glaze mixers Pottery workers Putty makers Riveters RoofersRubber buffers Rubber makers Scrap metal workers Sheet metal workers Shellac makers Ship di8mantler8 Shoe stainers Shot makers Solderers Solder makers Steel engravers Stereotypers Tannery workers TemperersTetraethyl lead makersTetramethyl lead makersTextile makersTile makersTin foil makersTinnersType foundersTypesettersVarnish makersWallpaper printersWeldersZinc mill workers Zinc smelter chargers
From reference 3
X-3
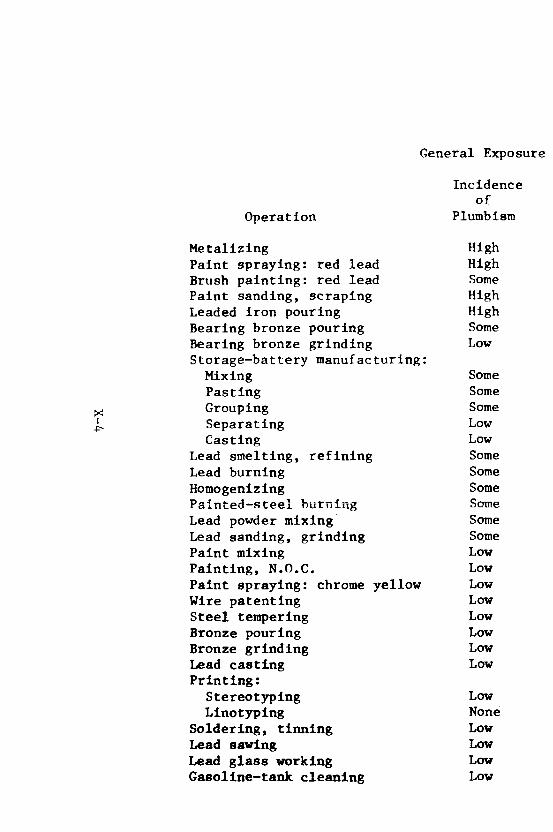
X-4
General Exposure
Operation
Incidenceof
Plumbism
Metalizing HighPaint spraying: red lead HighBrush painting: red lead SomePaint sanding, scraping HighLeaded iron pouring HighBearing bronze pouring SomeBearing bronze grinding LowStorage-battery manufacturing: Mixing SomePasting SomeGrouping SomeSeparating LowCasting Low
Lead smelting, refining SomeLead burning SomeHomogenizing SomePainted—steel burning SomeLead powder mixing SomeLead sanding, grinding SomePaint mixing LowPainting, N.O.C. LowPaint spraying: chrome yellow LowWire patenting LowSteel tempering LowBronze pouring LowBronze grinding LowLead casting LowPrinting:
Stereotyping LowLinotyping None
Soldering, tinning LowLead sawing LowLead glass working LowGasollne-tank cleaning Low
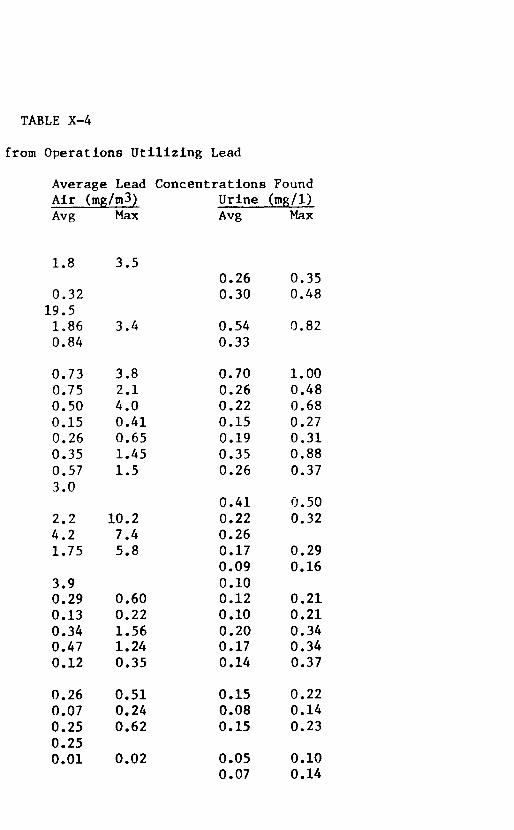
TABLE X-4
from Operations Utilizing Lead
Average Lead Concentrations Found Air (mg/m3) Urine (mg/1)Avg Max Avg Max
1.8 3.50.26 0.35
0.32 0.30 0.4819.51,86 3.4 0.54 0.820.84 0.33
0.73 3.8 0.70 1.000.75 2.1 0.26 0.480.50 4.0 0.22 0.680.15 0.41 0.15 0.270.26 0.65 0.19 0.310.35 1.45 0.35 0.880.57 1.5 0.26 0.373.0
0.41 0.502.2 10.2 0.22 0.324.2 7.4 0.261.75 5.8 0.17 0.29
0.09 0.163.9 0.100.29 0.60 0.12 0.210.13 0.22 0.10 0.210.34 1.56 0.20 0.340.47 1.24 0.17 0.340.12 0.35 0.14 0.37
0.26 0.51 0.15 0.220.07 0.24 0.08 0.140.25 0.62 0.15 0.230.250.01 0.02 0.05 0.10
0.07 0.14
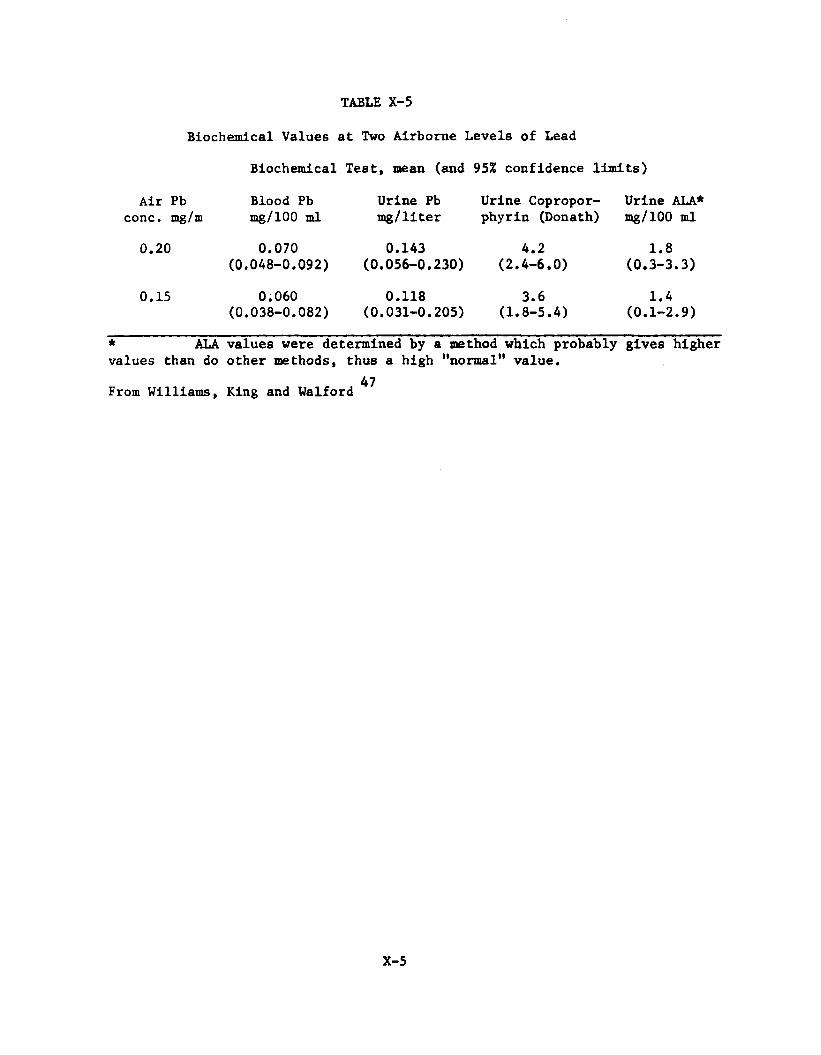
TABLE X-5
Biochemical Values at Two Airborne Levels of Lead
Biochemical Test, mean (and 95% confidence limits)
Air Pb Blood Pb Urine Pb Urine Copropor- Urine ALA*conc. mg/m mg/100 ml mg/liter phyrin (Donath) mg/100 ml
0.20 0.070 0.143 4.2 1.8(0.048-0.092) (0.056-0.230) (2.4-6.0) (0.3-3.3)
0.15 0.060 0.118 3.6 1.4(0.038-0.082) (0.031-0.205) (1.8-5.4) (0.1-2.9)
* ALA values were determined by a method which probably gives highervalues than do other methods, thus a high "normal" value.
47From Williams, King and Walford
X-5
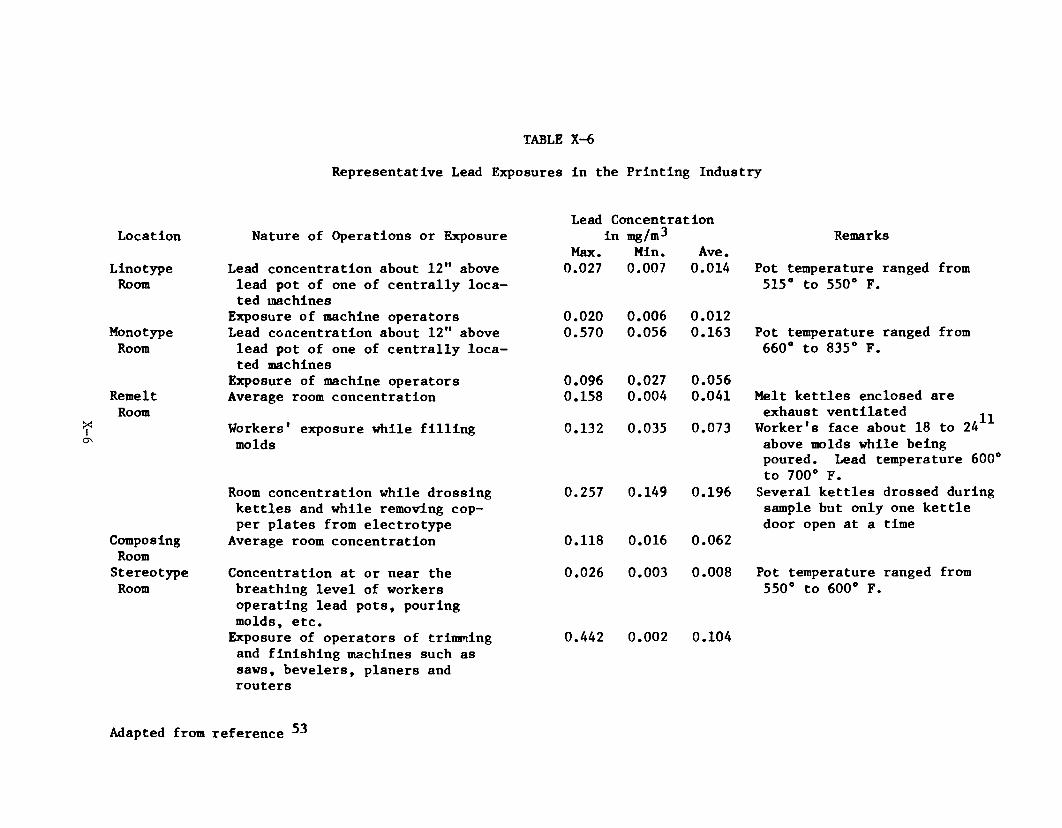
X-6
TABLE X-6
Representative Lead Exposures in the Printing Industry
Location Nature of Operations or ExposureLead Concentration
in mg/m^ RemarksMax. Min. Ave.
Linotype Lead concentration about 12" above 0.027 0.007 0.014 Pot temperature ranged fromRoom lead pot of one of centrally loca
ted machines515° to 550° F.
Exposure of machine operators 0 . 0 2 0 0.006 0 . 0 1 2Monotype Lead concentration about 12" above 0.570 0.056 0.163 Pot temperature ranged fromRoom lead pot of one of centrally loca
ted machines660° to 835° F.
Exposure of machine operators 0.096 0.027 0.056Remelt Average room concentration 0.158 0.004 0.041 Melt kettles enclosed areRoom exhaust ventilated ^
Worker '8 face about 18 to 24Workers' exposure while filling 0.132 0.035 0.073molds above molds while being
poured. Lead temperature 600 to 700° F.
Room concentration while drossing 0.257 0.149 0.196 Several kettles drossed duringkettles and while removing cop sample but only one kettleper plates from electrotype door open at a time
Composing Average room concentration 0.118 0.016 0.062RoomStereotype Concentration at or near the 0.026 0.003 0.008 Pot temperature ranged fromRoom breathing level of workers
operating lead pots, pouring molds, etc.
550° to 600° F.
Exposure of operators of trimming 0.442 0 . 0 0 2 0.104and finishing machines such as saws, bevelers, planers and routers
Adapted from reference ^
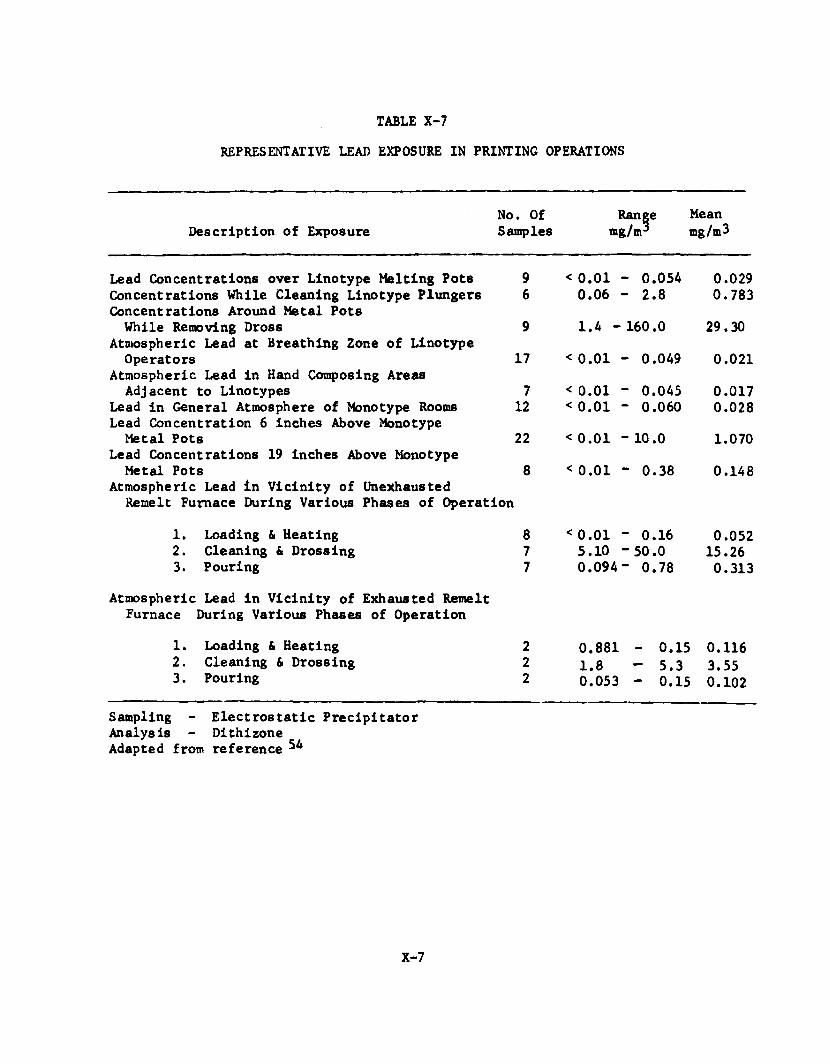
REPRESENTATIVE LEAD EXPOSURE IN PRINTING OPERATIONSTABLE X-7
Description of ExposureNo. Of Samples
Rangemg/m*
Meanmg/m3
Lead Concentrations over Linotype Melting Pots 9 < 0 .0 1 - 0.054 0.029Concentrations While Cleaning Linotype Plungers 6 0.06 - 2 .8 0.783Concentrations Around Metal PotsWhile Removing Dross 9 1.4 - 160.0 29.30
Atmospheric Lead at Breathing Zone of LinotypeOperators 17 < 0 .0 1 - 0.049 0 .0 2 1
Atmospheric Lead in Hand Composing AreasAdjacent to Linotypes 7 < 0 .0 1 - 0.045 0.017
Lead in General Atmosphere of Monotype Rooms 12 < 0 .0 1 - 0.060 0.028Lead Concentration 6 inches Above MonotypeMetal Pots 22 < 0 .0 1 - 10 .0 1.070
Lead Concentrations 19 inches Above MonotypeMetal Pots 8 < 0 .0 1 - 0.38 0.148
Atmospheric Lead in Vicinity of UnexhaustedRemelt Furnace During Various Phases of Operation
1. Loading & Heating 8 < 0 .0 1 - 0.16 0.0522. Cleaning & Drossing 7 5.10 -50.0 15.263. Pouring 7 0.094- 0.78 0.313
Atmospheric Lead in Vicinity of Exhausted Remelt Furnace During Various Phases of Operation
1. Loading & Heating 2 0.881 - 0.15 0.1162. Cleaning & Drossing 2 1.8 - 5.3 3.553. Pouring 2 0.053 - 0.15 0 .10 2
Sampling - Electrostatic Precipitator Analysis - Dithizone Adapted from reference ̂
X-7

X-8
TABLE X-8
Representative Lead Exposure in the Printing Industry
Linotype Operators
Monotype Operators
Remelt Men
Years in CalculatedPrinting Exposure mg/m
* 0.0316 0.0315 0.10
6 0.0220 0.0215 0.0219 0.0238 0.0212 0.0222 0.021 1 0.0240 0.0918 0.023 0.028 0.046 0.024 0.02
15 0.1020 0.10
3 0.0410 0.0919 0.067 0.04
17 0.06
2 0.387 0.151 0.04
10 0.093 0.505 0.039 0.13
Urine Lead mg/liter
0 . 1 10.04
0.170 . 1 10.17
0.160 . 1 10.320.210.190.240.280.26
0.030.280.170.100.18
0.170.130.280.06
0.19

TABLE X-8 Cont.
Years in Printing
Stereotypers1
1041
Others26
126
10
Sampling - Electrostatic Precipitator Analysis - Dithizone
Adapted from Reference 55
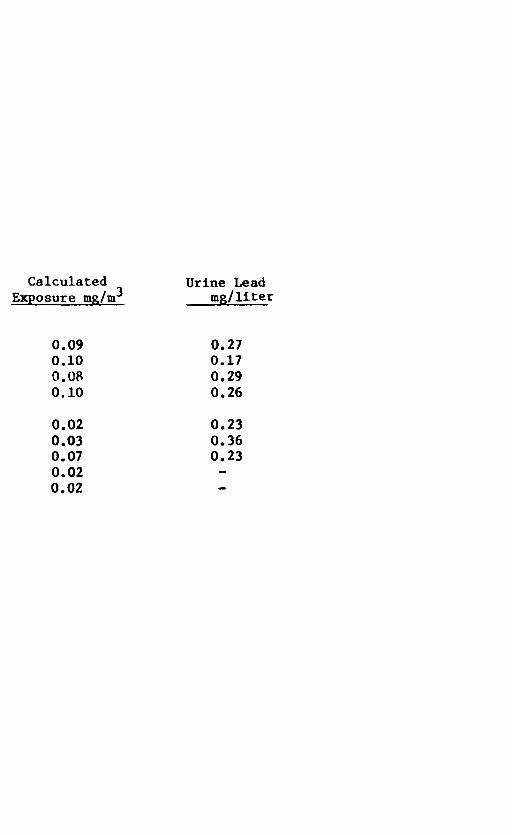
Exposure mg/m^Urine Lead
mg/liter
0.090.100.080.10
0.020.030.070.020.02
0.270.170.290.26
0.230.360.23

TABLE X-9
Representative Mean Lead Exposures and Biologic Lead Levelsfor Workers in the Storage Battery Industry
Number
Air Lead Concentration,
Blood Lead Urine Lead Concentration, Concentration,
Job Workers Mean SE Mean SE Mean SE
Machine pasting 6 0.218 0.025 74.2 4.7 163.8 2 1 .2Hand pasting 8 0.150 0.029 63.2 9.2 111.3 14.1Forming 9 0.134 0.013 63.0 2.7 114.0 7.2Casting 6 0.052 0.003 - - 87.9 6.8Plastics department A 5 0 .0 12 0.0008 27.2 1.4 34.5 3.2Plastics department B 5 0.009 0.0008 29.1 1 . 6 34.8 2.0
Adapted from reference 47
X-10
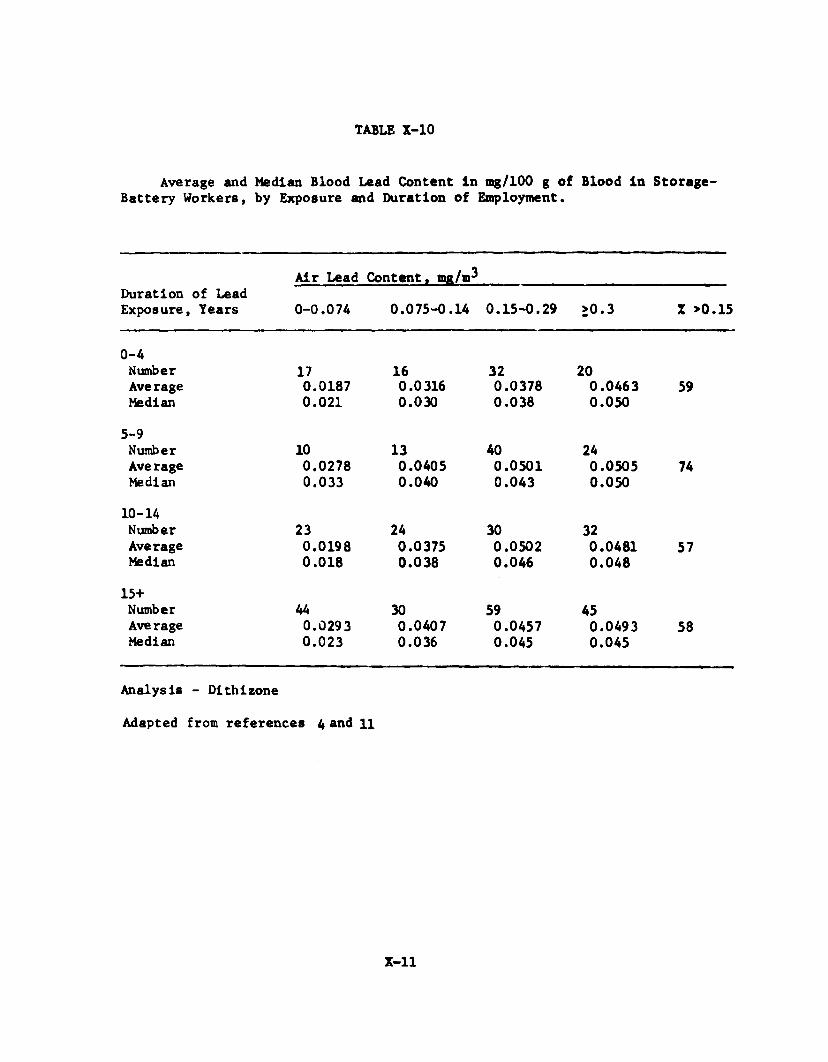
TABLE X-10
Average and Median Blood Lead Content in mg/100 g of Blood in Storage- Battery Workers, by Exposure and Duration of Employment.
Air Lead Content, nw/m^Duration of Lead Exposure, Years 0-0.074 0.075-0.14 0.15-0.29 >0.3 X >0.15
0-4NumberAverageMedian
170.01870.021
160.03160.030
320.03780.038
200.04630.050
59
5-9NumberAverageMedian
100.02780.033
130.04050.040
400.05010.043
240.05050.050
74
10-14NumberAverageMedian
230.01980.018
240.03750.038
300.05020.046
320.04810.048
57
15+NumberAverageMedian
440.02930.023
300.04070.036
590.04570.045
450.04930.045
58
Analysis - Dithizone
Adapted from references 4 and 11
X-ll

REPRESENTATIVE LEAD EXPOSURES WHILE PERFORMING
WELDING OPERATIONS UNDER VARIOUS CONDITIONS
TABLE X-ll
Coating Type weld Location of sampling probe Lead Avg.
POOR VENTILATION* EXPERIMENTAL AREA mg/m^
Zinc-silicate Elect. a r c 2 ' directly above welding 15.2ft If If it 3 ' above and 2- 1 / 2 back of welding* 0 .8 6II ft fl ii 3' above and 2' back of welding* 3.27 5 .63If II ff i ? 3' above and 2' back of welding* 3.65Il II II ti Attached to welder's shoulder* 5.16
Zinc-sillcate Oxy-ace tylene l f above and l f back of welding* 3.53fl II ?f If 3' above and 2-1/2' back of welding* 1.24If 1« ff If 3' above and 2-1/2 back of welding* 1.56Il II »1 If 3' above and 2' back of welding* 1.80 1.9 6Il il II f 1 3 ' above and 2 ' back of welding* 1.80If II II Tt
3 1 above and 2' back of welding* 1.76Il II II II 3' above and 2' back of welding* 2 . 0 0
Galvanized steel Elect. a r c 2 1 above and 1 ' back of welding* 0.40»1 II It it 2 ' above welder's face 0.69M ft ft h 6 ' above floor, 5' in front of welder 0.35 0.52Il II It it Attached to welder's shoulders* 0 . 6 4
Galvanized steel Oxy-ace tylene 2 'above and 2 ' back of welding* 0 .6 6fl fl II II 3' above and 2-1/2' back of welding* 0.24ff It It ff 2 ' above and 1 ' back of welding* 0.41 0.43II tf It II 6 ' above and 5' back of welder 0.30Il II ft If 3' above and 1' back of welding 0.55
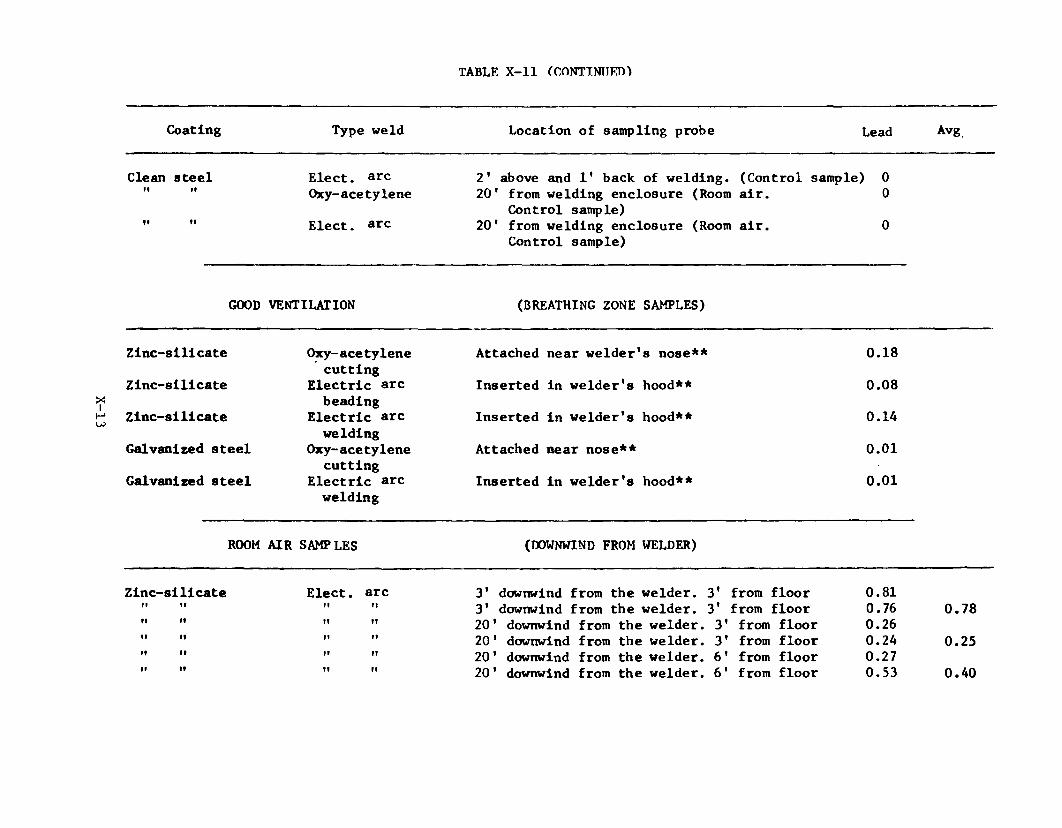
TABLE X-ll (CONTINU FD)
Coating Type weld Location of sampling probe Lead Avg
Clean steel Elect, arc 2' above and 1* back of welding. (Control sample) 0II II Oxy-acetylene 20' from welding enclosure (Room air. 0Control sample)II 1« Elect. arc 20' from welding enclosure (Room air. 0Control sample)
GOOD VENTILATION (BREATHING ZONE SAMPLES)
Zlnc-sillcate Oxy-ace tylene Attached near welder's nose** 0.18cutting
Zinc-silicate Electric arc Inserted in welder's hood** 0.08beading
Zinc-silicate Electric arc Inserted in welder's hood** 0.14welding
Galvanized steel Oxy-ace tylene Attached near nose** 0 . 0 1cutting
Galvanized steel Electric arc Inserted in welder's hood** 0 . 0 1welding
ROOM AIR SAMPLES (DOWNWIND FROM WELDER)
Zinc-silicate Elect, arc 3' downwind from the welder. 3' from floor 0.81Il II II It 3' downwind from the welder. 3' from floor 0.76 0.78• 1 If It II 20' downwind from the welder. 3' from floor 0.26M It II It 20' downwind from the welder. 3' from floor 0.24 0.25If If Il II 2 0 ' downwind from the welder. 6 ' from floor 0.27II If II ft 2 0 ' downwind from the welder. 6 ' from floor 0.53 0.40
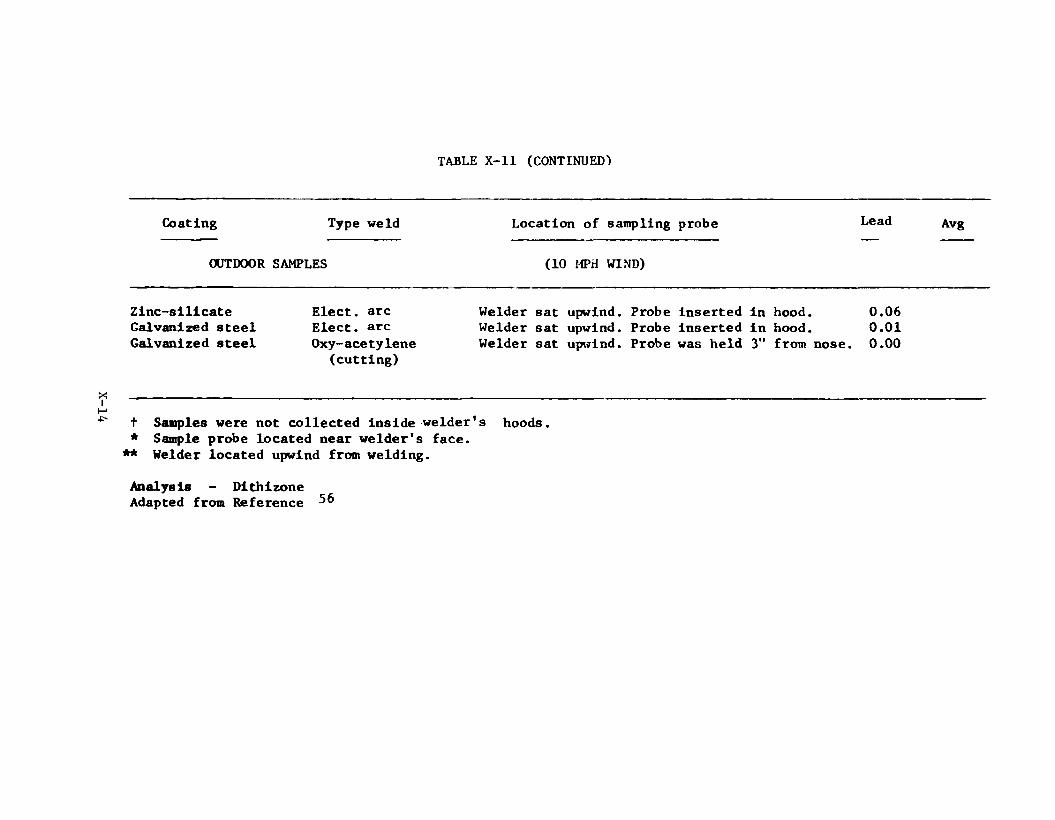
TABLE X-ll (CONTINUED-)
Coating Type weld Location of sampling probe Lead Avg
OUTDOOR SAMPLES (10 MPH WIND)
Zinc-silicate Galvanized steel Galvanized steel
Elect, arc Elect, arc Oxy-ace tylene
(cutting)
Welder sat upwind. Probe inserted in hood. 0.06Welder sat upwind. Probe inserted in hood. 0.01Welder sat upwind. Probe was held 3" from nose. 0.00
t Samples were not collected inside welder's hoods. * Sample probe located near welder's face.
** Welder located upwind from welding.
Analysis - Dithizone Adapted from Reference ^ 6
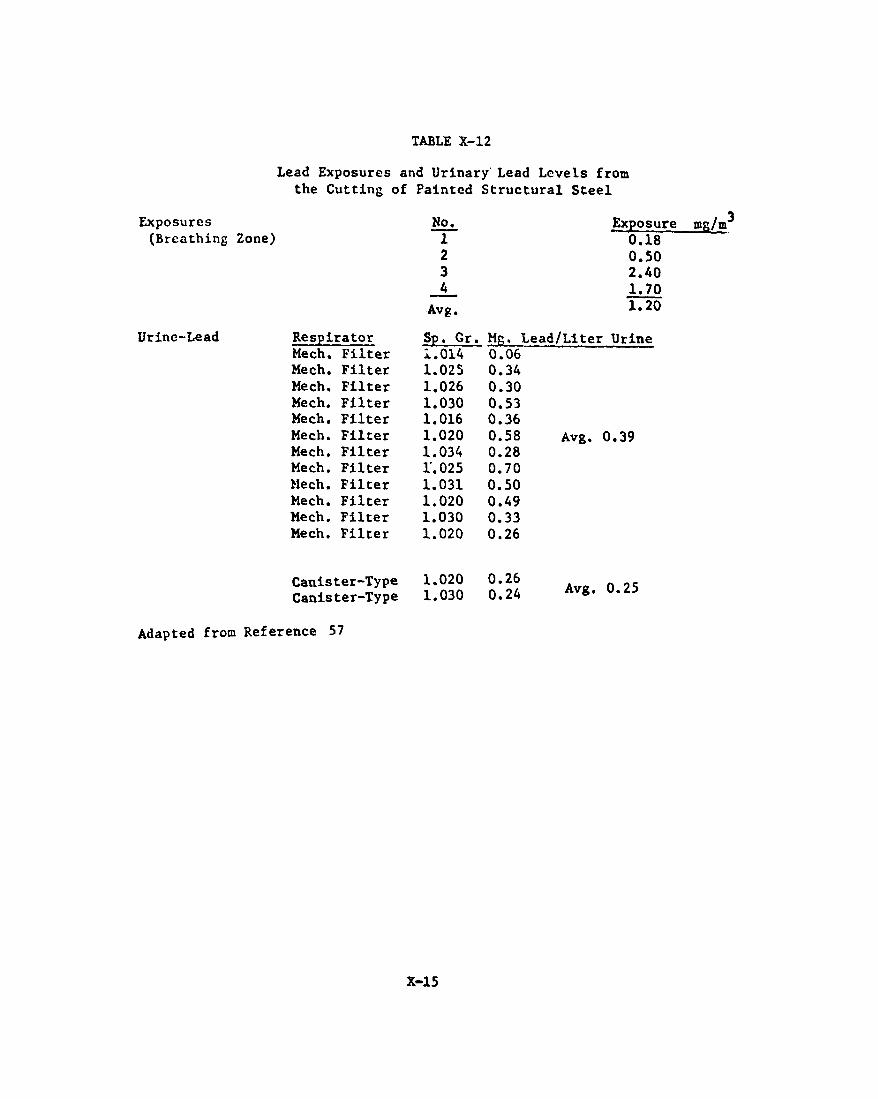
TABLE X-12
Exposures(Breathing
Urine-Lead
Lead Exposures and Urinary Lead Levels from the Cutting of Painted Structural Steel
Zone)No.
1234
Avg.
Exposure 0.18 0.50 2.40 1.70 1.20
Respirator Sp. Gr. M r . :Mech. Filter i.014 0.06Me ch. Filter 1.025 0.34Mech. Filter 1.026 0.30Mech. Filter 1.030 0.53Mech. Filter 1.016 0.36Mech. Filter 1 . 0 2 0 0.58Mech. Filter 1.034 0.28Mech. Filter 1.025 0.70Mech. Filter 1.031 0.50Mech. Filter 1 . 0 2 0 0.49Mech. Filter 1.030 0.33Mech. Filter 1 . 0 2 0 0.26
Canister-Type 1 . 0 2 0 0.26Canister-Type 1.030 0.24
Lead/Liter Urine
Avg. 0.39
Avg. 0.25
Adapted from Reference 57
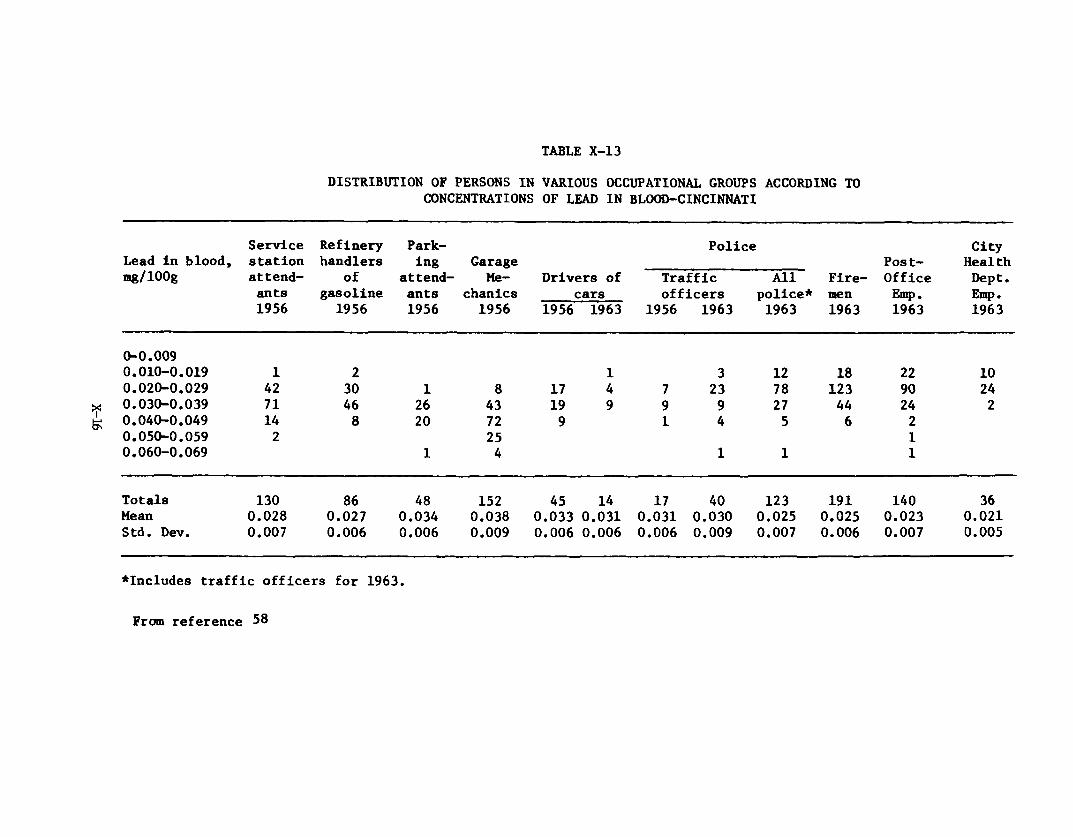
X-Ió
TABLE X-13
DISTRIBUTION OF PERSONS IN VARIOUS OCCUPATIONAL GROUPS ACCORDING TO CONCENTRATIONS OF LEAD IN BLOOD-CINCINNATI
Service Refinery Park Police CityLead in blood, station handlers ing Garage Post- Healthmg/lOOg attend of attend Me Drivers of Traffic All Fire Office Dept.
ants gasoline ants chanics cars officers police* men Emp. Emp.1956 1956 1956 1956 1956 1963 1956 1963 1963 1963 1963 1963
0-0.0090.010-0.019 1 2 1 3 1 2 18 2 2 1 00.020-0.029 42 30 1 8 17 4 7 23 78 123 90 240.030-0.039 71 46 26 43 19 9 9 9 27 44 24 20.040-0.049 14 8 2 0 72 9 1 4 5 6 20.050-0.059 2 25 10.060-0.069 1 4 1 1 1
Totals 130 86 48 152 45 14 17 40 123 191 140 36Mean 0.028 0.027 0.034 0.038 0.033 0.031 0.031 0.030 0.025 0.025 0.023 0 . 0 2 1Std. Dev. 0.007 0.006 0.006 0.009 0.006 0.006 0.006 0.009 0.007 0.006 0.007 0.005
♦Includes traffic officers for 1963.
From reference 58

X-17
TABLE X-14DISTRIBUTION OF PERSONS IN VARIOUS OCCUPATIONAL GROUPS ACCORDING TO
CONCENTRATIONS OF LEAD IN URINE-CINCINNATI
Service Refinery Park Police CityLead In urine, station handlers ing Garage Post- Healthmg/1 0 0 g attend of attend Me Drivers of Traffic All Fire Office Dept.
ants gasoline ants chanics cars officers police* men Emp. Emp.1956 1956 1956 1956 1956 1963 1956 1963 1963 1963 1963 1963
0-0.009 1 1 1 4 1 2 20.010-0.019 1 4 2 28 9 6 47 49 1 20.020-0.029 74 49 2 1 39 1 1 5 5 13 29 71 52 180.030-0.039 33 2 2 1 2 33 2 4 7 2 1 36 19 60.040-0.049 13 9 7 30 2 4 3 8 30 19 9 10.050-0.059 5 2 2 1 1 2 1 2 9 10.060-0.069 3 4 1 16 1 7 20.070-0.079 4 1 1 3 10.08-0.12 1 3 3 6
Totals 130 86 48 152 45 14 17 37 116 185 130 37Mean 0.027 0.028 0.028 0.040 0 . 0 2 0 0.036 0.023 0.039 0.038 0.027 0 . 0 2 2 0 . 0 2 2
Std. Dev. 0 . 0 1 0 0.013 0 . 0 1 1 0 . 0 2 0 0 . 0 1 1 0 . 0 1 0 0 . 0 1 1 0 . 0 2 0 0.018 0 . 0 1 1 0.009 0.007
¿Includes traffic officers for 1963.
From reference 5b
XI - Appendix IV
FINAL REPORT
Syracuse Research Corporation Center for Chemical Hazard Assessment
Merrill Lane Syracuse, New York 13210
REVIEW, SUMMARIZATION, AND EVALUATION OF LITERATURE TO SUPPORT THE UPDATE AND
REVISION OF CRITERIA DOCUMENTSINORGANIC LEAD
Joseph Santodonato Sheldon Lande
Contract No. 210-76-0167 SRC No. LI302-05
September 1977
Project Officer - Frank Mackison
Prepared For:
National Institute for Occupational Safety and Health 5600 Fishers Lane
Rockville, Maryland 20852
Xl-i

Table of Contents
Page
I . INTRODUCTION 1
II. SAMPLING AND ANALYSIS 3
A. Presently Recommended Analysis 3B. Confirming Studies 3C. New Methods for Sampling 4D. New Analytical Methods 5
1. Atomic Absorption Spectroscopy 5
a. Biological Samples 5b. Atmospheric Samples 20
2. Methods of Lead Analyses Other than Atomic Absorption 23Spectroscopy
3. Biological Indices of Body Lead Burden 28
III. HUMAN EFFECTS 31
A. Biological Monitoring - Measures of Lead Exposure and 3 1Biochemical Indicators of Response
B. Relationship of Inorganic Lead Exposure to Biological Effects 3 5C. Epidemiologic Investigations 3 9D. Lead Toxicity in Humans 4 7
1. Neurotoxicity 4 72. Renal Damage 483. Cytogenetic Effects 494. Reproductive Effects 5 15. Developmental and Behavioral Effects 52
IV. ANIMAL STUDIES 5 7
A. Developmental and Behavioral Effects 5 7B. Lead Toxicity 5 g
V. WORK PRACTICES AND ENGINEERING CONTROLS 64
VI. MISCELLANEOUS 6 5
A. Chelation Therapy 5 5
VII. SUMMARY AND CONCLUSIONS 66
Xl-ii
Table of Contents (Cont'd)
Page
VIII. RESEARCH NEEDS 68
Appendix A - Literature Search 69
References 70
Xl-iii
I . INTRODUCTION
This report presents a review and evaluation of the recent scientific
literature relevant to an occupational hazard assessment of Inorganic lead.
It is intended to provide an update for the existing NIOSH criteria document
for inorganic lead by considering the results of published research which have
appeared since the preparation of the original document.
In assembling this update report, pertinent new information was sought
in the areas of: (a) human and animal toxicity, (b) analytical, and sampling
methods, (c) work practices and engineering controls, and (d) miscellaneous
aspects regarding biological monitoring and medical surveillance. Identifica
tion of relevant articles published since 1972 was accomplished through a search
of the scientific literature utilizing both computerized and manual searching
of various data systems and published secondary bibliographic sources (see
Appendix A).
Environmental pollution* by inorganic lead is a widespread problem attri
butable to various sources. Exposure occurs from dietary contamination, and
inhalation of lead-containing automobile emissions, as well as by direct
occupational contact. Because of the vast literature concerning the health
effects of inorganic lead, it was necessary to restrict much of the dis
cussion in this report to those data which have relevance in establishing
damage risk criteria in occupational situations. Selections have been made
from the large body of literature on lead poisoning in children in those
cases where specific analytical techniques, biological monitoring Indices,
or unique lead-induced effects can be extrapolated to the overall occupational
setting. It should be recognized from the outset, however, that children are
XI-1

generally regarded as being more susceptible to lead Intoxication than adults.
Thus, the derivation of safe exposure limits is compounded in difficulty by
the inherent variability of dose-response parameters with age.
Several major conferences have been held in recent years which dealt
specifically with the health effects of inorganic lead. Among these meetings
are the National Conference on Health Effects of Occupational Lead and
Arsenic Exposure, Chicago, February 24-25, 1975; International Conference on
Heavy Metals in the Environment, Toronto, October 27-31, 1975; Conference on
Low Level Lead Toxicity, Raleigh, N.C., October 1-2, 1973 (papers published in
Environmental Health Perspectives, Exp. Issue No. 7, 1974); and Conference on
Standards for Occupational Lead Exposure, Washington, D. C., February 28, 1974
(proceedings published in Journal of Occupational Medicine, Vol. 17, No. 2,
1975).
XI— 2
II. SAMPLING AND ANALYSIS
A. Presently Recommended Analysis
The NIOSH document [1] specifies methods for sampling and analysis of
workplace air and biological indices of inorganic lead poisoning in occupation
ally exposed workers. It recommends the dithizone colorimetric method for
analysis of both air and biological specimens for lead content. The stated
limit of detection is 0.2 ± 0.1 ug of lead. Bismuth is the only acknowledged
interference, but its presence is rare. The document mentions several alter
native methods which were ruled out in favor of the dithizone procedure.
Although it recognizes that numerous atomic absorbance spectroscopic methods
were available and competitive with the dithizone method, the document con
cludes that an acceptable standard atomic absorbance format had not been de
veloped and adequately tested.
The document [1] specifies that air samples should be collected by
breathing zone samplers. Air samples are to consist of 100 or more liters
pumped at a rate of ca. 2 liters per minute (allowed range of 1 to A liters per
minute) through 0.45 y cellulose membrane filters.
While the document [1] prefers blood lead concentration as an index
of exposure, it accepts urine lead as an alternative (although not quantita
tively as good an index). Other biological indices of lead exposure, which are
based upon lead-induced upset of heme synthesis, are not considered acceptable.
They include urinary delta-aminolevulinic acid (ALA), coproporphyrin excretion,
and delta-aminolevulinic acid dehydratase (ALAD) in erythrocytes.
B. Confirming Studies
Lerner [2] has evaluated the analytical error in the dithizone colori
metric method for blood lead analysis performed at the Kettering Laboratory.
XI-3
Thirty specimens, with an average size of 14 g, were taken in a single col
lection from one volunteer, then stored and frozen in vacutainers. Over the
next ten months, blind samples were removed and .sent for routine analysis.
Blood lead values for the thirty specimens ranged from 12 to 28 yg lead/100 g
blood. One sample which had a concentration of 42 yg/100 g was rejected from
further statistical analysis, since it was an outlying value. The mean value
and standard deviation of the thirty samples was 18.37 ± 3.90 yg/100 g. This
exceeded the expected variability of ± 3.50 yg/100 g.
C. New Methods for Sampling
Since many of the new analytical methods for biological lead measure
ment use small volumes of blood (less than 50 yl), they offer an advantage
toward sampling. Suitable samples are obtained by finger-stlck. While this
new method is faster and less painful than the macro-scale blood collection
technique recommended by the NIOSH document [1], it is prone to contamination
by inadvertant environmental lead sources and requires diligent attention
[3,4]. Cooke et al. [3], for example, found that the soap which they were
using for hand washing was contaminated by traces of lead. This contamination
apparently affected their results which are discussed in the section on New
Analytical Methods. Bratzel and Reed [4] suggest the following procedure for
the flnger-stlck method: hands should be washed with a lead-free soap ("pHlsohex”
is acceptable), preferably with a scrub brush; rinse with deionized water; dry
with gauze; spray with collodion and let dry; puncture the finger from the
side with a lancet; wipe off the first drop of blood; and squeeze gently to
bring up sample blood.
Some of the micro-scale analytical techniques discussed herein have
used micro-scale blood specimens collected by two different methods: collection
XI-4
in capillary tubes or as spots taken on filter paper. Marcus et al. [5] dis
cussed some of the experimental problems of collecting blood in capillary
tubes. The major difficulty concerns the inability of some commercially avail
able tubes to adequately heparinize blood. While several commercially avail
able heparinized capillary and caraway type tubes did not prevent some blood
clotting, Marcus ejt al. [5] did judge one tube (distributed by Environment
Sciences Associates of Burlington, Mass.) as suitable. The filter paper method
consists of forming a blood spot (approximately 2-4 cm) by touching the paper
to the finger blood drop, allowing it to dry and then punching small discs from
the spot with a standard office paper punch. While the method is fast and
simple, some experimental error can arise from variations in the lead distribu
tion over the spot. Although lead content is apparently greater toward the
periphery of the spot, the relative error can be neglected when discs of 4 to
6 mm are punched [6 ].
Rahn et _al. [7] have developed an automatic filter changer for use in
atmospheric lead sampling. The device is capable of changing 24 filters. Its
design and use Is applicable to the procedure designated by the NIOSH document
[1].
Biles and Ellison [8 ] have evaluated three cellulose filter papers
for atmospheric lead collection: Whatman No. 1, No. 4, and No. 541. Air was
pumped through the filters at face velocities of approximately 6 . 5 cm/sec at
the filter. They concluded that these filter papers were not suitable since
more than half the atmospheric lead passed through.
D. New Analytical Methods
1. Atomic Absorption Spectroscopy
a. Biological Samples
XI-5

Several procedures have been developed for lead analysis,
especially for biological specimens, which use atomic absorption spectroscopy
(AAS) to measure lead concentration. Kahn [9] and Sunderman [10] have re
viewed basic principles of AAS and its application to lead analysis. The
sample to be analyzed is nebulized by either a flame or other heat sources.
This atomization reduces most of the lead to the atomic state, which can then
absorb light from a hollow cathode lamp (usually using the lead wavelength at
283.3 nm). The measurement can use either the conventional flame system
(usually air-acetylene) or one of several semi- or non-flame systems: Delves
cup; graphite furnace; or carbon rod atomizer. The conventional flame system
requires the aspiration of dissolved lead into the flame. For blood lead
analysis the usual sample size is 5 to 10 ml of whole blood, which is compar
able to the size needed for the recommended dithizone method [1]. The conven
tional system then requires a fairly long work-up to extract the lead from all
organic matter and dissolve It into an aqueous medium. The semi- and non-flame
procedures require micro samples (50 yl or less) and shorter work-up prior to
AAS analysis. The disadvantages of the semi- and non-flame systems are that
the small samples are more prone to contamination from extraneous sources and
non-atomlc absorbance Interference during the measurement.
Murthy et al. [11] have developed a method for digesting and
extracting lead from tissues and hair with tetramethylammonium hydroxide. The
lead is subsequently measured by the conventional air aspiration method.
Koplto e_t al. [12] have evaluated sources of error and how to
minimize them in four methods for blood lead work-up. The four procedures are
those of Berman [13]; Blanksma [14]; Einarsson and Lindstedt [15]; and Koplto
and Shwachman [16]. All require macro-scale blood samples and are used in
XI-6
conventional flame AAS measurement. The methods of Berman [13] and Blanksma
[14] are similar and consist of three stages: (1 ) precipitation of blood protein
with trichloroacetic acid (TCA); (2) wash with water to remove the lead; and (3)
lead removal from the wash by first chelating it with ammonium-l-pyrrolidine
dithiocarbamate (APDC) and then extracting the complex into methyl isobutyl
ketone (MIBK). The primary source of error is in the efficiency of removing
lead from precipitated protein. With several washes, however, lead recovery is
quantitative. The Einarsson and Lindstedt [15] procedure consists of precipi
tating whole blood with a mixture of TCA and perchloric acid. Lead is collected
from the supernatant. When one precipitation is used, lead losses ranged from
23 to 30%; multiple precipitations reduce the percentage of lead lost. Kopito
and Shwachman [16] wet ash the whole blood with a mixture of nitric and perchloric
acids, and then coprecipitate the lead with bismuth chloride or nitrate. The
critical step is the complete oxidation of all organic matter before the pre
cipitation.
NIOSH has developed procedures for lead analysis in air [182],
and blood and uriue [183, 184]. Atmospheric lead determination requires the
collection of particulates on a 0.8 ym (37 mm diameter) cellulose filter. The
air is sampled (at 2 1 pm and a minimum of 1 0 0 1 ) by a personal monitoring
pump. The filter is wet ashed and the lead is dissolved with concentrated
nitric acid. The sample is then diluted (with water) to a 10 ml volume and
the lead Is assayed by conventional flame AAS. The sensitivity is 2.3 ug lead
(0.013 mg/cu m). In the range of 0.128 to 0.399 mg Pb/cu m the coefficient
of variation was 0.072. Biological lead is digested with either poncentrated
nitric acid or a perchloric acid-nitric acid mixture. The lead is chelated
and extracted into an organic solvent. P&CAM 101 [183] suggests chelation
XI-7
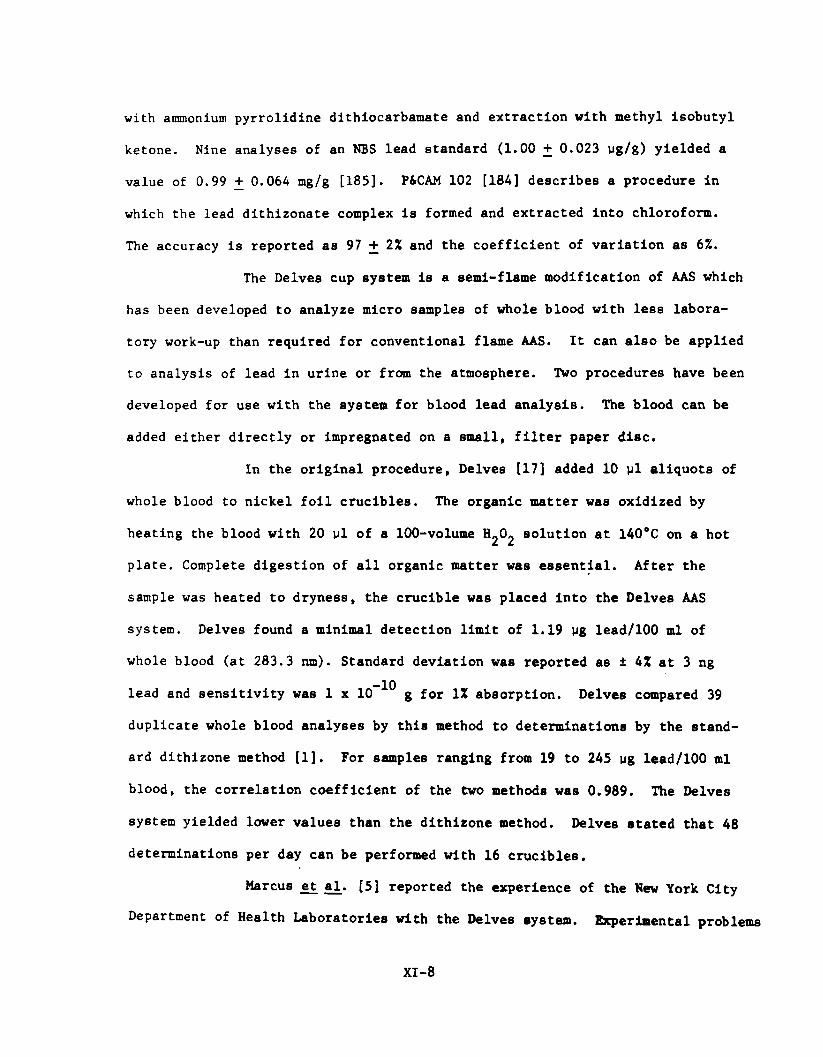
with ammonium pyrrolidine dithiocarbamate and extraction with methyl isobutyl
ketone. Nine analyses of an NBS lead standard (1.00 + 0.023 yg/g) yielded a
value of 0.99 + 0.064 mg/g [185]. P&CAM 102 [184] describes a procedure in
which the lead dithizonate complex is formed and extracted into chloroform.
The accuracy is reported as 97 + 2% and the coefficient of variation as 6%.
The Delves cup system is a semi-flame modification of AAS which
has been developed to analyze micro samples of whole blood with less labora
tory work-up than required for conventional flame AAS. It can also be applied
to analysis of lead in urine or from the atmosphere. Two procedures have been
developed for use with the system for blood lead analysis. The blood can be
added either directly or Impregnated on a small, filter paper disc.
In the original procedure, Delves [17] added 10 yl aliquots of
whole blood to nickel foil crucibles. The organic matter was oxidized by
heating the blood with 20 yl of a 100-volume ^ © 2 solution at 140°C on a hot
plate. Complete digestion of all organic matter was essential. After the
sample was heated to dryness, the crucible was placed into the Delves AAS
system. Delves found a minimal detection limit of 1.19 yg lead/100 ml of
whole blood (at 283.3 nm). Standard deviation was reported as i 42 at 3 ng
lead and sensitivity was 1 x 10⁻¹^ g for IX absorption. Delves compared 39
duplicate whole blood analyses by this method to determinations by the stand
ard dithizone method [1], For samples ranging from 19 to 245 ug lead/100 ml
blood, the correlation coefficient of the two methods was 0.989. The Delves
system yielded lower values than the dithizone method. Delves stated that 48
determinations per day can be performed with 16 crucibles.
Marcus et al. [5] reported the experience of the New York City
Department of Health Laboratories with the Delves system. Experimental problems
XI-8
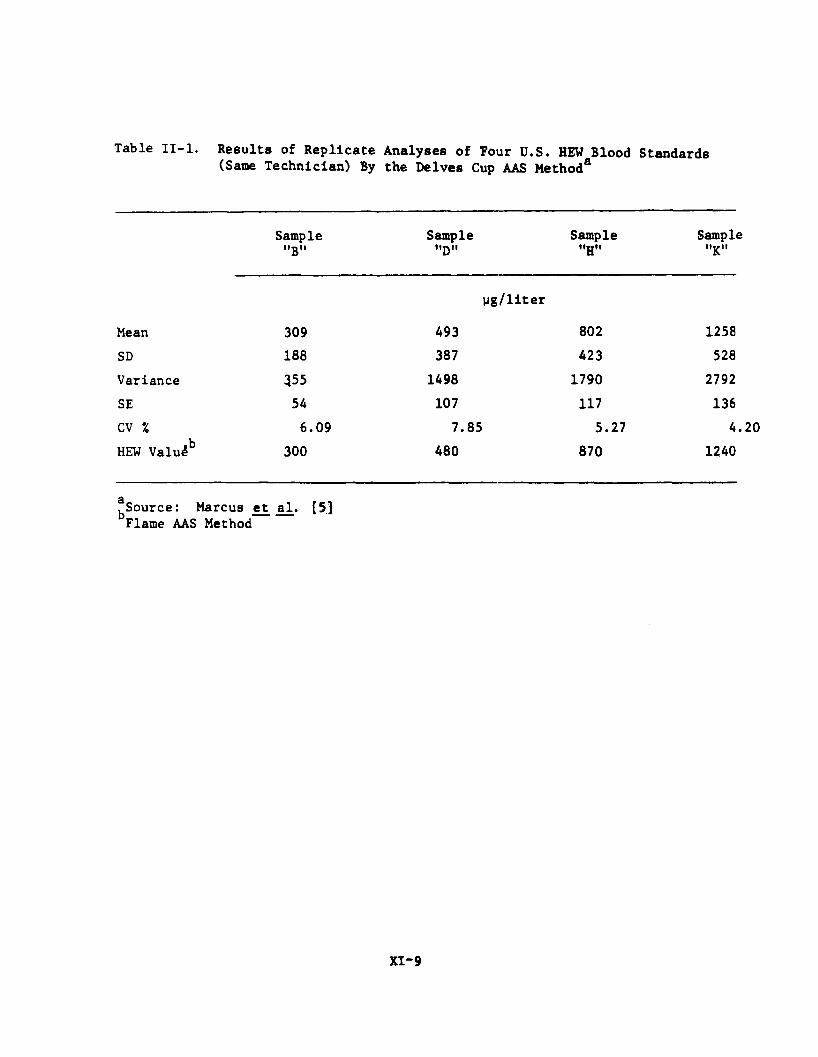
Table II-l. Results of Replicate Analyses of Four U.S. HEW Blood Standards (Same Technician) By the Delves Cup AAS Methoda
Sample"B"
Sample"D"
Sample"H"
Samplt"K"
yg/liter
Mean 309 493 802 1258SD 188 387 423 528Variance 355 1498 1790 2792SE 54 107 117 136CV % 6.09 7.85 5.27 4HEW Valu4b 300 480 870 1240
g^Source: Marcus et al. [5.3Flame AAS Method
XI-9
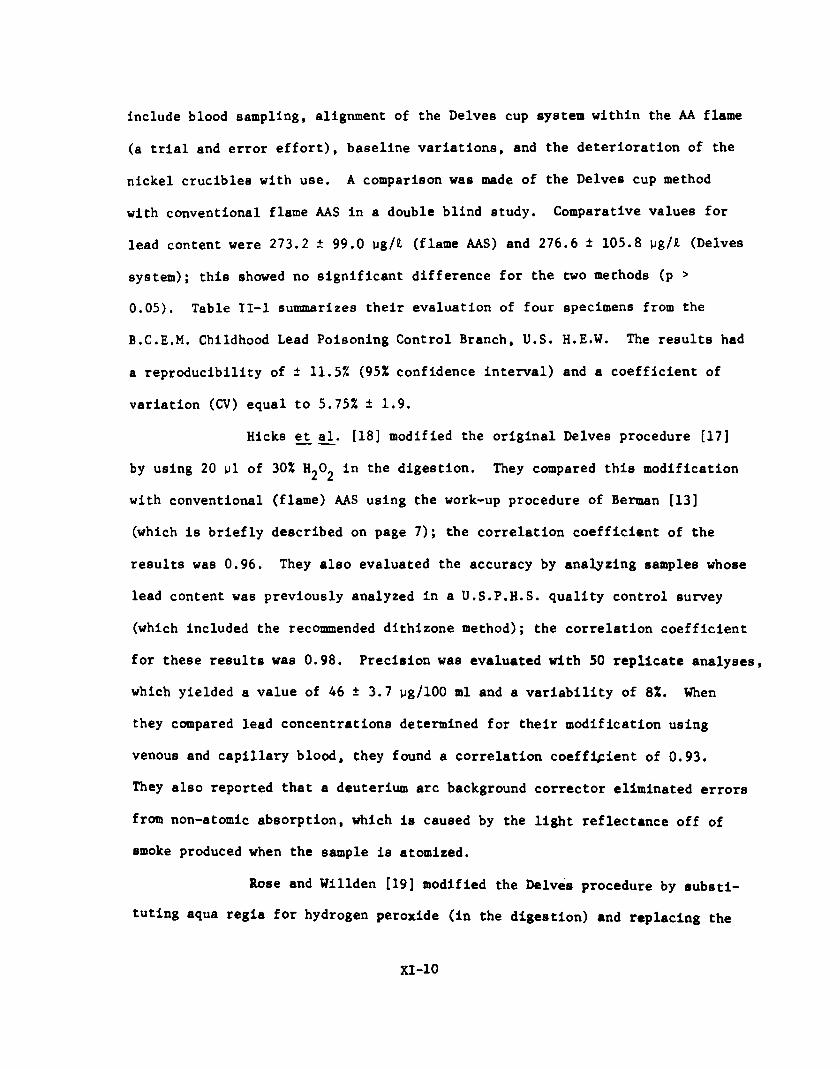
Include blood sampling, alignment of the Delves cup system within the AA flame
(a trial and error effort), baseline variations, and the deterioration of the
nickel crucibleB with use. A comparison was made of the Delves cup method
with conventional flame AAS in a double blind study. Comparative values for
lead content were 273.2 ± 99.0 yg/fc (flame AAS) and 276.6 ± 105.8 yg/K. (Delves
system); this showed no significant difference for the two methods (p >
0.05). Table II-l summarizes their evaluation of four specimens from the
B.C.E.M. Childhood Lead Poisoning Control Branch, U.S. H.E.W. The results had
a reproducibility of ± 11.5% (95% confidence interval) and a coefficient of
variation (CV) equal to 5.75% ± 1.9.
Hicks et̂ al. [18] modified the original Delves procedure [17]
by using 20 yl of 30% ^ 0 ^ in the digestion. They compared this modification
with conventional (flame) AAS using the work-up procedure of Berman [13]
(which is briefly described on page 7); the correlation coefficient of the
results was 0.96. They also evaluated the accuracy by analyzing samples whose
lead content was previously analyzed in a U.S.P.H.S. quality control survey
(which included the recommended dithizone method); the correlation coefficient
for these results was 0.98. Precision was evaluated with 50 replicate analyses,
which yielded a value of 46 ± 3.7 yg/100 ml and a variability of 8 %. When
they compared lead concentrations determined for their modification using
venous and capillary blood, they found a correlation coefficient of 0 .9 3 .
They also reported that a deuterium arc background corrector eliminated errors
from non-atomic absorption, which is caused by the light reflectance off of
smoke produced when the sample is atomized.
Rose and Willden [19] modified the Delves procedure by substi
tuting aqua regia for hydrogen peroxide (in the digestion) and replacing the
XI-10
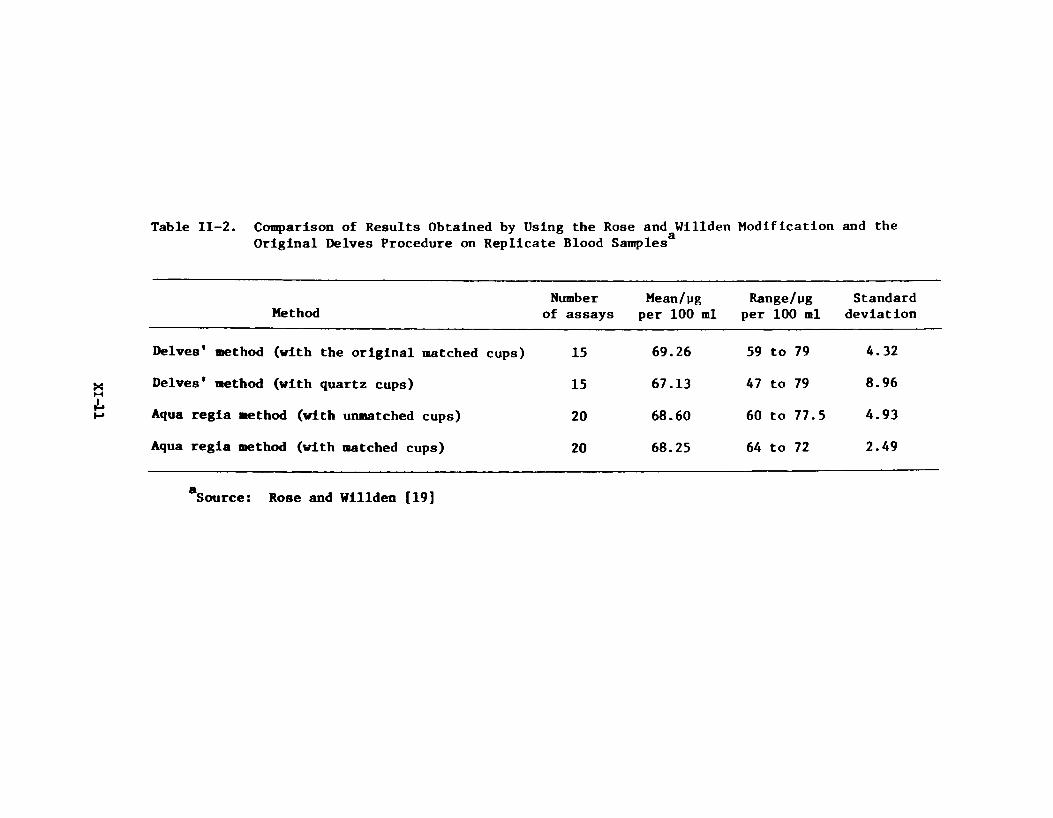
Table II-2. Comparison of Results Obtained by Using the Rose and Willden Modification and the Original Delves Procedure on Replicate Blood Samples
MethodNumber
of assaysMean/pg
per 1 0 0 mlRange/tig
per 1 0 0 mlStandard
deviation
Delves' method (with the original matched cups) 15 69.26 59 to 79 4.32
Delves' method (with quartz cups) 15 67.13 47 to 79 8.96
Aqua regia aethod (with unmatched cups) 2 0 68.60 60 to 77.5 4.93
Aqua regia method (with matched cups) 2 0 68.25 64 to 72 2.49
£Source: Rose and Willden [19]
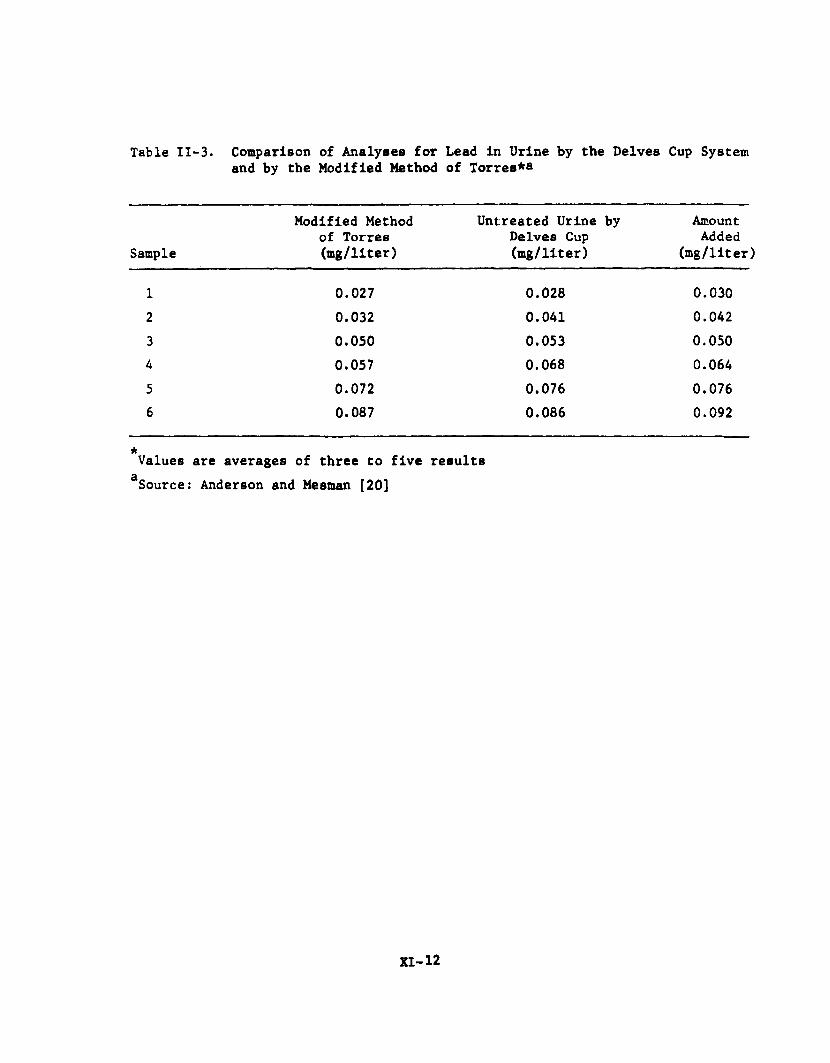
Table II-3. Comparison of Analyses for Lead in Urine by the Delves Cup System and by the Modified Method of Torres*®
Sample
Modified Method of Torres (mg/liter)
Untreated Urine by Delves Cup (mg/liter)
AmountAdded
(mg/liter)
1 0.027 0.028 0.0302 0.032 0.041 0.0423 0.050 0.053 0.0504 0.057 0.068 0.0645 0.072 0.076 0.0766 0.087 0.086 0.092
*Values are averages of three to five results Source: Anderson and Mesman [20]
XI-12
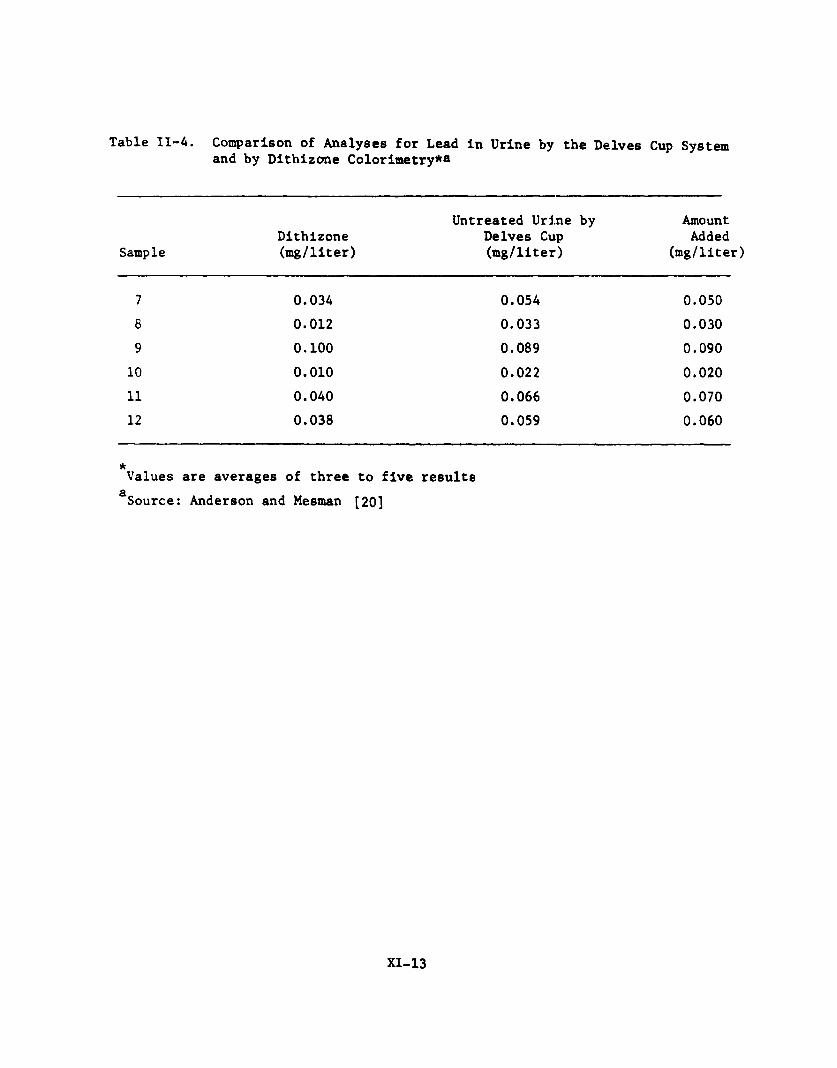
Table 11-4. Comparison of Analyses for Lead in Urine by the Delves Cup System and by Dithizone Colorimetry*®
SampleDithizone(mg/liter)
Untreated Urine by Delves Cup (mg/liter)
AmountAdded
(mg/liter
7 0.034 0.054 0.0508 0 . 0 1 2 0.033 0.0309 0 . 1 0 0 0.089 0.090
1 0 0 . 0 1 0 0 . 0 2 2 0 . 0 2 0
1 1 0.040 0.066 0.0701 2 0.038 0.059 0.060
aValues are averages of three to five results
£Source: Anderson and Mesman [20]
XI-13
nickel crucibles with quartz crucibles. This modification provides a better
digestion of organic matter in the blood. Table II-2 compares values of rep
licate samples analyzed by the modified procedure using matched and unmatched
quartz crucibles and by the original Delves procedure. Matched and unmatched
refer to equal or unequal numbers of analyses in each cup.
Anderson and Mesman [20] used the Delves cup system for urine
lead analysis. They used a deuterium arc background corrector to eliminate
errors from non-atomic absorption. A simplified procedure was evaluated in
which 20 p i of untreated urine in a nickel Delves cup was dried and smoked to
remove organic matter before AAS measurement. An additional procedure was
examined (method of Torres [21]) in which lead is extracted from the urine into
methyl isobutyl ketone with dithizone and then returned to aqueous solution
followed by analysis in the Delves cup system. A comparison was made of the
basic procedure with the modified method of Torres (Table II-3) and with the
colorimetric dithizone method (Table II-4). While the Delves procedure and the
modified method compared well, the colorimetric method did not. Anderson and
Mesman [20] acknowledged that they were not familiar with the colorimetric
method and attributed the low values to their lack of experience. Among 60
samples analyzed by the basic Delves procedure, they found a minimal detection
limit of 0.02 mg lead/1 urine (or 0.4 wg lead) and an error of +5%.
The carbon furnace and carbon rod atomizer are non-flame AAS
adaptations [9, 10]. Samples are Introduced with or without laboratory pretreat
ment, dried, organic matter destroyed during an ashing stage, and lead is
atomized. All operations require an inert gas atmosphere. Since smoke is
generated during the atomization phase, a deuterium background corrector Is
necessary to compensate for non-atomic absorption.
XI- 14
Evenson and Pendergast [22] and Fernandez [23] have evaluated
the use of the Perkin-Elmer Models HGA-2000 and HGA-2100 graphite furnaces for
the analysis of whole blood specimens for lead. Results from both laboratories
[22,23] were similar. Blood specimens were heparinized, diluted, introduced
into the graphite furnace, dried (ca. 125°C), and ashed (ca. 525°C) prior to
AAS measurement. Evenson and Pendergast reported that ash build-up accompanied
by an increase in lead absorbance occurred, but stabilized with time. Using
the older model HGA-2000 only, they found lead recovery from spiked, whole
blood samples ranged from 62 to 87% (mean 75%). Fernandez [23] found a 98%
recovery from whole blood, which contained lead at 150 to 1000 yg/1, using the
HGA-2100. Fernandez also compared the use of both model furnaces to conven
tional AAS analysis in a double blind study. While he found a correlation
coefficient of 0.98 for the HGA-2100, he found a consistently lower correla
tion (range from 0.79 to 0.88) for the HGA-2000. Table II-5 describes the
reproducibility for day-to-day measurements and within-run variations using
the HGA-2100. These investigators [22,23] also examined the effects of some
anticoagulents, cations, anions, and acids on the lead AAS signal. The most
noticeable effects were decreases in absorbance caused by high concentrations
of potassium, sodium, or citrate or pH > 5.
Baily and Kilroe-Smith [24] have evaluated the following seven
procedures for whole blood work-up in the graphite furnace measurement of
blood lead:
(1) 0.5 ml of blood plus 4.5 ml of doubly distilled water
(2) 0.5 ml of blood plus 4.5 ml of 0.01 M HC1
XI- 15
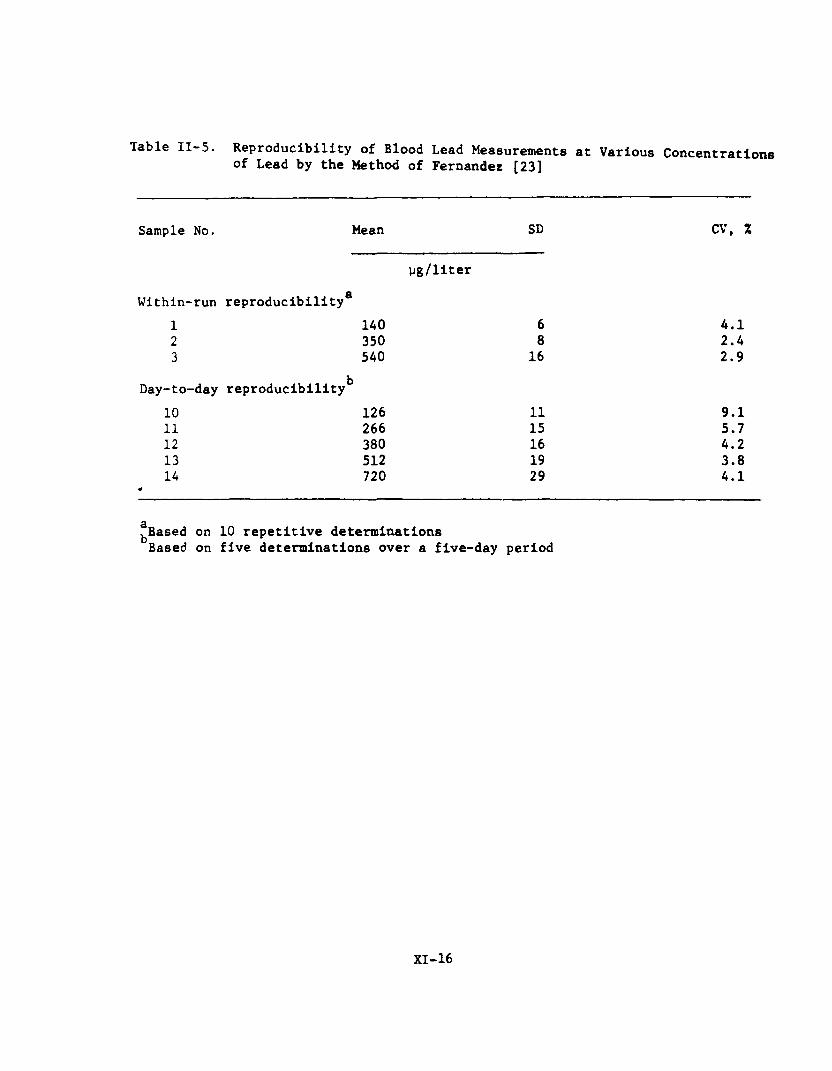
Table II-5. Reproducibility of Blood Lead Measurements at Various Concentrations of Lead by the Method of Fernandez [23]
Sample No. Mean SD CV, %
yg/litergWithin-run reproducibility
1 140 6 4.12 350 8 2.43 540 16 2.9
Day-to-day reproducibility^10 126 11 9.111 266 15 5.712 380 16 4.213 512 19 3.814 720 29 4.1
£̂Based on 10 repetitive determinations Based on five determinations over a five-day period
XI-16
(3) 0.5 ml of blood plus 4.5 ml of 2% Triton X
(4) 0.5 ml blood plus 1.0 ml of Unisol. Let the mixture stand overnight, then add 3.5 ml of doubly distilled water
(5) Similar to (4) except the 3.5 ml of water was not added until the solution was clear
(6) A modified Einarsson and Lindstedt [15] procedure (see page 7) in which blood was digested with a perchloric and trichloroacetic acid mixture
(7) The method of Mahin and Lofberg [25] in which heparinized blood is treated with perchloric acid and ^ 0 ^
They found that lead losses occurred when ashing temperatures
exceeded 500°C, but that high background non-atomic absorbances interferred if
temperatures below 5008C were used with methods 1 through 5. They concluded
that the Einarsson-Lindstedt modification (method 6) was the most convenient,
reproducible, and reliable method of analysis.
Posma et al. [26], Ealy et al. [27], and Kubasik and Volosin
[28] have examined carbon rod atomization (CRA) for blood lead analysis;
Kubasik and Volosin [29] have also used it for urinary lead determination.
These investigators used either the Varian CRA Model 61 or Model 63 and
corrected for non-atomic absorbance with a deuterium arc background corrector.
The general procedure for CRA corresponds to the steps used in graphite furnace
techniques: the sample is transferred to the carbon rod, dried, ashed, and
then atomized for AAS measurement.
Ealy et al. [27] diluted heparinized whole blood with doubly
deionized water before injecting a 10 yl sample into the CRA. With this pro
cedure, they observed a detection limit of 2 yg lead/ 1 0 0 g blood and a sensi
tivity of 5 yg lead/100 g blood (for IX absorption). They compared this
method to analysis by isotopic-dilutlon spark source mass spectrometry using
204 Pb, and found that the values agreed.
XI- 17

Kubasik and Volosin [28] compared direct CRA analysis of heparin
ized whole blood to analysis of a sample diluted 2:1 with Triton X-100. The
dilution technique yielded better results. While the coefficient of variation
of three pooled blood specimens ( 2 0 samples for each group) ranged from 6 . 1 to
1 0 .7% for direct analysis, the dilution procedure results ranged from 2 . 1 to
4.8%. They also noted that ashing was a greater problem with the direct pro
cedure .
Posma e_t al. [26] used nitric acid to aid the digestion of
organic matter in blood. In their method, 10 ul of a 1% nitric acid solution
and 5 to 10 yl of heparinized whole blood are placed into the CRA cup. The
usual procedure of drying, ashing, and atomization was then followed. Since
their modification released less smoke than direct CRA analysis, the back
ground non-atomic absorbance was also reduced. They compared the method with
conventional AAS analysis (chelation by ammonium-pyrrolidlne dithlocarbamate
and extraction into methyl lsobutyl ketone) and obtained a correlation co
efficient of 0.9974. Table II- 6 provides the results for the two procedures.
Filter paper discs impregnated with blood have been used for
lead analysis by the Delves cup system [3,30-32] and CRA [6 ]. The technique
requires that a blood spot Is formed on a piece of filter paper, allowed to
dry in air, and discs are punched from the spot with a standard office paper
punch. The advantages of the paper disc method include the elimination of the
need for heparinizing or refrigerating blood collected in tubes. Cernick [6 ]
noted sampling problems as the result of red cells distributing with a slight
build-up along the periphery of the blood spot. He found that this difficulty
will not affect results if blood drops of 0 . 0 2 to 0.04 ml are applied to the
filter paper and discs are cut to 4.0 nan (diameter) or larger.
XI-18

Table II-6 . Comparison of Results for the Carbon Rod Atomization Procedure of Posma and Cbworkers [26] with Conventional Atomic Absorption for Analysis of Heparinized Whole Blood
Carbon Rod Method of
Posma and Coworkers
Detection Limit (ppb)
95% Confidence Interval (ppb)
Sensitivity (1% Absorption Signal)
gAnalytical Rate
15.0
±38
5.0
40.0
Macro Analysis by Conventional
Atomic Absorbance
40.0
±33
160.0
20.0
Number of analyses which can be performed per day
XI-19
Cooke ejt a_l* [3], Fox and Sayers [30], Mehkeri et̂ ad. [31], and
Bogden and Joselow [32] used the Delves cup system with punched paper discs.
Their procedure was to ash the sample, then analyze. Because of sample
smoking, deuterium arc background correctors were used. The four groups
compared the punch disc approach with a variety of alternative analytical
techniques (Table II-7). The best correlations (ca. 90%) were obtained when
multiple samples were analyzed and averaged. Although Cooke et al. [3] found
a correlation coefficient of the disc in a cup method with dithizone colori
metry of 0.78, they considered the method an adequate procedure for routine
screening to evaluate whether an individual had exceeded the safe blood lead
limit (ca. 400 yg/1). They found that the micro disc method tended to yield
false positive rather than false negative results. It was suggested that the
high false positives might have resulted in part from inadvertent sample
contamination.
Cernick [6 ] noted that nickel Delves cups are rapidly deteri
orated by the burning discs and evaluated CRA as an alternative procedure. He
found that the carbon rod resisted deterioration. Absolute sensitivity of the -12method was 25 x 10 g. Standard deviation was calculated for three blood
lead concentrations ( 1 1 replications for each concentration): at 16 (±1.65);
at 67 (±3.87); and at 99 Mg lead/100 ml blood (±3.85).
b. Atmospheric Samples
Kneip et̂ al. [33] replaced the colorimetric dithizone
method with conventional (flame) atomic absorption for the analysis of atmos
pheric lead. Atmospheric samples were collected by drawing the air through
membrane or glass fiber filters. The filters were ashed and lead was extracted
with a mixture of nitric and hydrochloric acids. The resulting aqueous lead
XI- 20
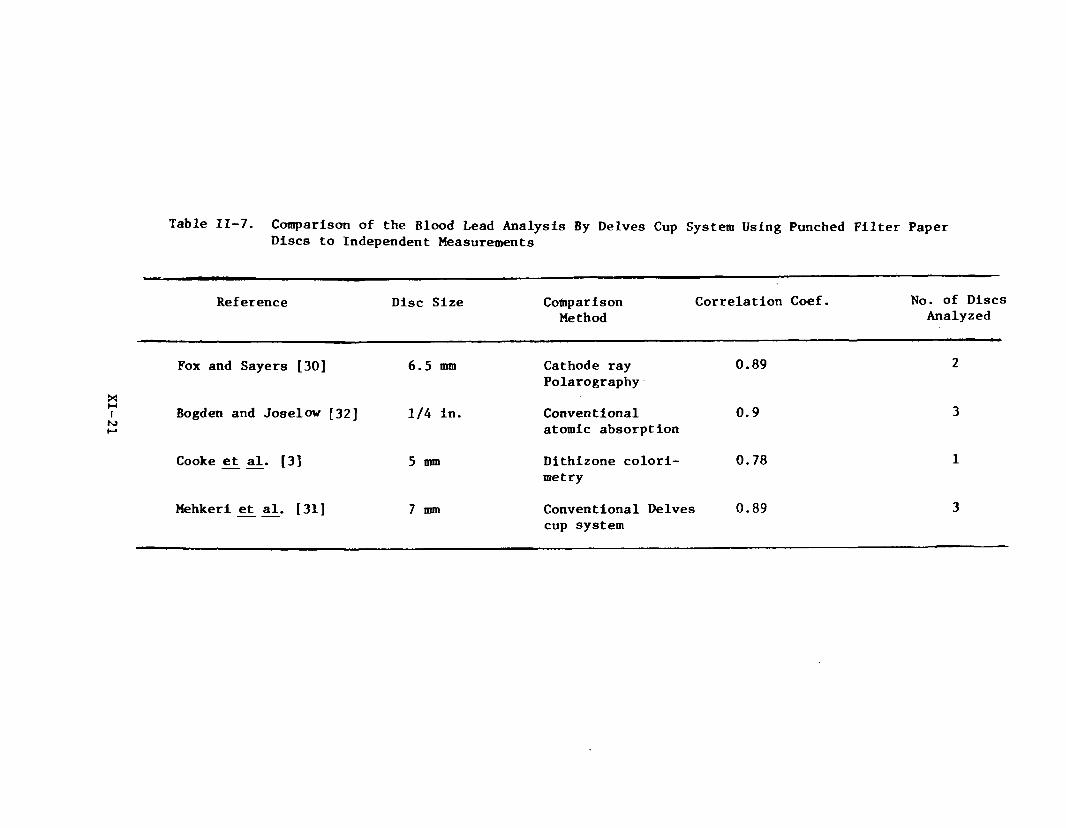
Table II-7. Comparison of the Blood Lead Analysis By Delves Cup System Using Punched Filter Paper Discs to Independent Measurements
Reference Disc Size ComparisonMethod
Correlation Coef. No. of Discs Analyzed
Fox and Sayers [30] 6.5 mm Cathode ray Polarography
0.89 2
Bogden and Joselow [32] 1/4 in. Conventional atomic absorption
0.9 3
Cooke et al. [3] 5 mm Dithizone colorimetry
0.78 1
Mehkeri et al. [31] 7 mm Conventional Delves cup system
0.89 3
solution was then analyzed by air aspiration into an air-acetylene flame. The
217 nm wavelength was used rather than the more often employed 283.3 nm wave
length. Standard deviation was estimated at +10% (and recovery at 82%). This
method requires a 2 0 0 liter sample for an atmospheric concentration of 0 . 0 1 mg
lead/cu m air.
Woodriff and Lech [34] have developed a method for AAS analysis
of atmospheric lead which does not require any laboratory work-up. The atmos
pheric samples must be pumped through crucibles made of spectral grade graphite
and with dimensions of 16 mm long by 6 mm O.D., and 4.77 mm I.D., and drilled to
7 mm. Sample volumes were 100 to 500 cc of air. After sampling, the crucible
is placed into a graphite furnace and the AAS measured. Sensitivity was-125 x 10 g (for 1% scale deflection) and the reported coefficient of varia
tion was + 1 .2 %.
Matousek and Brodie [35] used e slightly modified approach
for analysis of atmospheric lead. They pumped samples (volumes of 200 cc)
through graphite sampling cups fitted with Milllpore filters. Excess phosphoric
acid was added to the cup; it was inserted into a CRA (Varian Model 63), and the
sample was treated by the usual drying, ashing, and atomization sequence.
Absolute sensitivity (for 1% absorption) was 1.7 x 10 ^ g (or 0.1 yg lead/ cu m
for a 200 ml sample). Relative standard deviation (for approximately 1 yg
lead/ cu m) was +4.2%.
N o H e r and Bloom [36] used the Matousek and Brodie [35]
procedure in field studies. They found a sensitivity (for 1% absorption) of
1.7 yg/cu m lead and a detection limit of 0.48 yg/cu m for a 200 cc volume
sample. The relative standard deviation ranged from 7.8 to 51.1% for samples
containing 0.3 to 8 . 6 yg lead/cu m air.
XI-22
2. Methods of Lead Analyses Other than Atomic AbsorptionSpectroscopy
Seeley and Skogerboe [37] used graphite cups similar to the
design of those reported by Woodriff and Lech [34] for atmospheric lead sampling
and subsequent analysis by emission spectroscopy. They added indium as an
internal standard to each graphite filter prior to sampling. Samples were
analyzed with the carbon rod atomizer at the 283.3 nm lead line. Absolute
detection limit for lead (added directly to the filters) was 3 ng. They estimated
precision for the emission method at +10 to 20% whereas standard AAS had a
precision of +5% or better. Human and Norval [38] employed atomic fluorescence
spectroscopy for lead analysis on whole blood specimens. The only pretreatment
consisted of diluting the blood with doubly deionized water. Analysis was made
with an argon-hydrogen-oxygen flame using the 405.8 nm lead wavelength, which
yielded a better signal to noise ratio than the 283.3 nm wavelength. The
detection limit for this method was 0 . 0 0 1 2 yg lead/ml blood and precision was
better than 4% at 200 yg lead/ml blood. Sodium was the only reported inter
ference.
Direct current arc emission spectrography has been used for
lead analysis in tissues [39] and in atmospheric samples [40]. The method is
able to simultaneously analyze for several metals rather than for lead alone.
The technique consists of adding a known amount of a metal (germanium or
indium) not present in the sample as an internal standard, obtaining the
emission spectrum, and then measuring lead concentration by comparison of the
relative intensities of lead lines (to the internal standard) with standard
XI-23
curves. Yoakum et al. [39], who measured lead concentration in biological
tissues, wet ashed the samples with sulfuric acid. They reported a detection
limit for lead at approximately 0 . 0 1 to 0 . 0 2 Mg lead/electrode and a precision
of ±15% or better. Sugimae [40] determined atmospheric lead, which was
collected on membrane filters (Gelman DM-800). Preliminary work-up consisted
of dissolving the membrane in acetone and collecting residues, which included
the lead, by centrifuge. Standard deviation (8 determinations) was 6.1% for
samples containing 2 2 0 0 yg lead/g residue.
Searle et al. [41] and Duic et al. [42] have evaluated anodic
stripping voltametry (ASV) for blood and urinary analyses. Sampling and pre
treatment used by both groups of investigators were similar. Blood samples of
50 yl or urine samples of 500 yl were digested with perchloric acid or a
mixture of perchloric-sulfuric acid; the mixed acid apparently digested blood
samples faster than perchloric acid alone. The digested samples were then
diluted with distilled water and lead was measured. Duic e_t al. [42] reported
a ±5% deviation for blood lead measurements. Both Searle £t al_. [41] and Duic
et_ a^. [42] compared ASV to conventional AAS lead determination. Duic et al.
[42] found that AAS yielded consistently lower lead concentrations. Searle eit
al. [41] obtained a correlation coefficient of 0.87 between ASV and AAS for
200 blood samples. Table II- 8 compares replicate analyses of blood lead by
conventional AAS and ASV. Searle £t a_l. noted that equipment costs are less
for ASV than for AAS and that both methods require equivalent technician
skills. They suggest that ASV method would be suitable in laboratories where
less than 25 samples per day were analyzed.
Several relatively simple methods for rapid and efficient lead
analyses have been developed which use colorimetry or simple fluorescence
XI-24
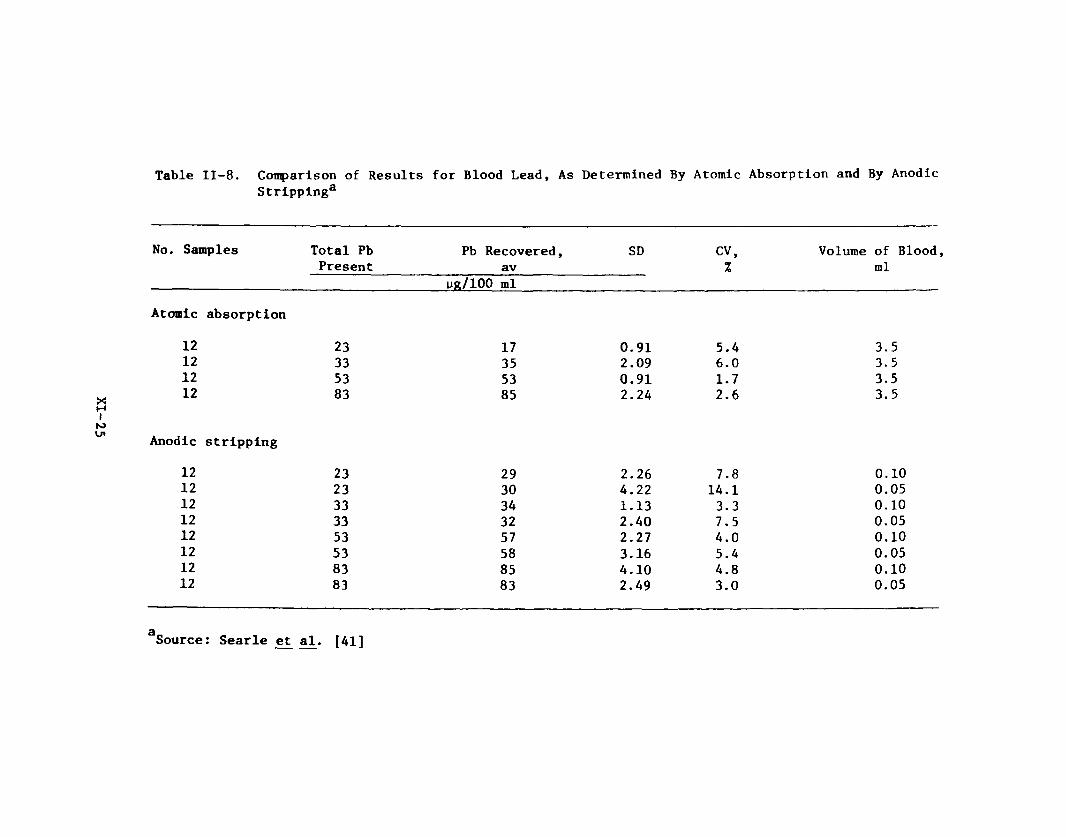
Table II-8. Comparison of Results for Blood Lead, As Determined By Atomic Absorption and By Anodic Stripping3
No. Samples Total Pb Present
Pb Recovered, av
yg/ 1 0 0 ml
SD CV,%
Volume of Blood ml
Atomic absorption
1 2 23 17 0.91 5.4 3.51 2 33 35 2.09 6 . 0 3.51 2 53 53 0.91 1.7 3.51 2 83 85 2.24 2 . 6 3.5
itoAnodic stripping
1 2 23 29 2.26 7.8 0 . 1 01 2 23 30 4.22 14.1 0.051 2 33 34 1.13 3. 3 0 . 1 01 2 33 32 2.40 7.5 0.051 2 53 57 2.27 4.0 0 . 1 01 2 53 58 3.16 5.4 0.051 2 83 85 4.10 4.8 0 . 1 01 2 83 83 2.49 3.0 0.05
aSource: Searle et al. [41]
measurements. Reisfeld et_ al. [43], Skuric £t al. [44], and Ronneau et al.
[4 5 ] have developed methods for atmospheric lead analysis in which particulates
are collected and analyzed on filter paper. Ryan elt al.. [46] has developed a
rapid method for blood lead analysis.
Reisfeld e£ ¿1. [43] used the complex between lead (II) and
carminic acid under alkaline conditions to form a blue colored derivative.
Lead concentration was measured by reflectance spectroscopy at 600 run. The
lower detection limit was 5 ppm. While copper (II) and iron (II) were inter
ferences, twelve other cations were not, including Ba (Ba), Ca (II), Mg (II),
Na (I), K (I), Cd(II), Fe (III), and Ni (II).
Skuric ejt al. [44] used a ring oven method for analysis of lead
in atmospheric samples collected on filter paper. The filter paper sample was
treated with sulfuric acid and soluble sulfates were washed off. The tetra-_2chloroplumbate ion, (PbCl^) , was subsequently formed by treatment with 0.1 M
sodium chloride. Lead concentration was measured by comparing the fluorescence
of the sample rings under a mercury vapor lamp with that of standard rings.
They reported a sensitivity of 0.5 yg lead and a standard deviation of 20 to
30% for the range 0.1 to 5 yg lead. They evaluated the potential interferences
of 29 anions and cations and reported interferences by permanganate, barium,
and bismuth.
Ronneau et al. [45] developed a variation of the ring oven
method in which lead is eluted off the collection filter paper with 0.1 M
nitric acid onto a cellulose strip and concentrated into a 0 . 5 to 1 mm zone.
The strip was then sprayed with sodium rhodizonate, which forms a red complex
with lead. Estimation by visual comparison to standards was possible down to a
minimal detection limit of 1 0 ng.
XI-26
Ryan ££ al. [46] have developed a fluorescence method for blood
lead determination. Their procedure required ihixing and heating the sample
with nitric acid, calcium chloride, and ammonium oxalate. Lead and calcium
were coprecipitated by titration with ammonium hydroxide and the CaO:Pb phosphor
was subsequently produced by igniting the precipitate at 850 to 900°C. Lead
was measured by its luminescence at 530 nm. The analytical working range was
5 to 2 0 0 0 ng/ml. Co (II), Mn (II), and Ni (II) were reported to interfere
with this method.
Activation analysis and X-ray fluorescence have been evaluated
for measurement of lead on filters from atmospheric sampling [47-49].
The advantages of the methods include that the filters used for atmospheric
sampling do not require any laboratory treatment, that filters can be re
analyzed, and that several metals can simultaneously be analyzed. Disadvan
tages include equipment costs and analytical time per sample. Hammerle et: al.
[4 7] compared X-ray fluorescence measurement to AAS for analysis of lead on
three filters used for collecting atmospheric samples. The two methods
yielded values of lead concentrations which were within experimental error.
Aras et al. [48] measured lead concentrations by photon activation analysis;
accuracy for the method was estimated at ±5%. The required analytical time
(about one week) and equipment limit the use of this method for any moni-
toring. Parsa and Markowitz [49] developed a He activation analysis proce
dure for lead. The ^He reacts with lead to yield the radioactive 2 0 7Pb. The
lead content on a sampling filter can be calculated by the increase in radio-oactivity. The detection limit was about 50 pg/cm of collecting filter sur
face area. Absolute accuracy was estimated at 9 to 12X and agreed with X-ray
fluorescence measurement within 3 to 5 %.
XI-27
3. Biological Indices of Body Lead Burden
Several biological parameters provide indices of body lead
burden [1,50]. Most indices reviewed herein measure lead interference with
erythrocyte porphyrin metabolism [51-58]; one paper evaluated radiological
analysis of skeletal lead deposits [63].
Lead interferes with the metabolic processes of the enzyme
6-aminolevulinic acid dehydrogenase (ALAD). ALAD catalyzes the dimerization
of two moles of 6-aminolevulinic acid to yield one mole of porphobilinogen
[51]57). Lead concentration is inversely related to the activity of erythro
cyte ALAD activity and directly to urine 6-aminolevulinic acid (ALA) concen
tration, and can be assessed by either measurement. Both approaches ultimately
depend upon the method of ALA measurement. Basically all ALA measurements
consist of the following approach: ALA is first condensed with either ethyl
acetoacetate or acetylacetone to produce ALA-pyrrole, which is then reacted
with a modified Ehrlich's reagent (para-dimethylamlnobenzaldehyde in glacial
acetic acid plus perchloric acid). ALA concentration is subsequently measured
by the absorbance of the pink derivative at 553 nm.
While 23 to 440 yg ALA/100 ml urine is considered a normal
adult range, adults with heavy occupational exposure to lead range from 380 to
28,500 yg ALA/100 ml urine. Roels et al. [52] has compared four methods for
urine ALA measurement: Mauzerall and Granick [59]; Davis and Andelman [60];
Grabecke et al. [61]; and Lauwerys et al. [62]. The former two methods are
similar procedures in which ALA is first separated from the interference por
phobilinogen by ion exchange chromatography. Both methods yield consistently
identical results. Lauwerys £t al. [62] developed an automated procedure in
XI-28

which ALA is added as an internal standard. While its results are slightly
lower than the former two methods at ALA concentrations less than 6 mg/ml
(urine), they were almost identical above that concentration. The Grabecki eit
al. [61] method yielded results consistently lower by about one-third.
Tomokuni and Ogata [53] and Tomokuni [54.55] found that extracting the ALA-
pyrrole with ethyl acetate is a simplified replacement for the ion exchange
chromatography method to remove porphobilogen.
ALAD activity as a body lead burden index measures the rate of
porphobilinogen production (ALA loss) per ml of blood erythrocytes in one
hour at 38°C [50,51,54-57], Kneip et̂ al. [56] evaluated sources of error in
ALAD determination and concluded that the major source of error is lead loss
to walls of vacutainers, which are used for blood sampling. The Vacutainers
are treated with acid to remove any traces of lead. Vacutainer walls retain
anions which can compete with ALAD for lead. Lead loss to the wall results in
enzyme reactivation.
Lamola et al. [57] used zinc protoporphyrin (ZPP) concentration
as an index of blood lead concentration. Analysis of ZPP consists of diluting
whole blood (1:500), adding dimethyldodecylamlnoxide and measuring the fluor
escence at 594 rim (excitation at 424 nm). Lamola et al. found a correlation
coefficient of 0.87 for ZPP and blood lead concentration (by AAS). Iron de
ficiency anemia will also reduce ZPP concentration.
Soulsby and Smith [58] have developed a simplified method for
estimating urinary coproporphyrin aB a lead exposure index [50]. Urine
samples are acidified with acetic acid and coproporphyrin is extracted into
ether. The ether extract is shaken with an iodine-hydrochloric acid solution
XI-29
which oxidizes any coproporphyrinogen to coproporphyrin. Concentration is
measured by absorbance at the Soret band peak (ca. 401 ran).
Smulewicz [63] has discussed the use of lead lines at the iliac
crest to diagnose the early stages of lead poisoning in children. The method
was not discussed for adults, and does not appear to be a viable method for
occupational monitoring.
XI-30
III. HUMAN EFFECTS
A. Biological Monitoring - Measures of Lead Exposure and BiochemicalIndicators of Response
Exposure to inorganic lead is manifested by alterations in a number
of biologic parameters which can be readily assayed and quantified. In addi
tion to the direct measurement of lead in whole blood or urine, other available
techniques are based on the well-known inhibitory effect of lead on heme
synthesis, with its associated enzyme inhibitions and product accumulations.
Thus it is possible to monitor for responses to lead exposure by measuring
urinary coproporphyrin, urinary delta-aminolevulinic acid (ALA), erythrocyte
delta-aminolevulinic acid dehydrase (ALAD), and erythrocyte protoporphyrins.
The presence of lead in the blood and urine is clearly the result of
exposure, but indicates nothing about a biological response. The present
criteria document regarding inorganic lead considers the most practical test
for monitoring lead absorption to be the determination of lead in whole blood
(expressed as pg/100 g or wg/100 ml). This conclusion is supported by the Lead
Industries Association [64]. However, several investigators have recently
suggested that blood lead is an inadequate measure of occupational exposure.
Vitale and coworkers [65] reported that abnormal renal function attributable to
lead nephropathy had occurred among workers whose blood lead levels were below
the recommended maximum concentration (80 yg/100 g). Similarly, McRoberts [6 6 ]
examined several cases of lead poisoning in which whole blood lead levels were
unreliable indicators of overexposure; however, a positive shift in the cir
culating plasma/erythrocyte lead concentration ratio was associated with symp
toms of intoxication. On the other hand, asymptomatic individuals showed a
constant plasma/erythrocyte lead concentration ratio. Additional evidence has
XI-31
been provided to further support the contention that whole blood lead levels are
merely a reflection of transport to body tissues [8 8 ], and do not provide a
meaningful indication of total body burden [87]. Therefore, it is suggested
[89, 1 1 1 ] that whole blood lead is a reliable indicator only for very recent
exposure. Moreover, wide fluctuations in blood lead levels are known to occur
as a result of mobilization of stored lead [6 8 , 71, 72], variabilitv in ana
lytical methods of analysis [69] and other dietary and physiological factors >
[67, 71, 84-86]. The significance of individual blood lead values must also
take into account the number of circulating erythrocytes present at the time of
measurement in order to adequately protect those who might be anemic [64, 69,
90].
The determination of lead in urine is generally considered to be a
less reliable monitoring technique than analysis of whole blood. Nelson [73]
has noted a poor correlation between blood lead and urine lead values among
certain individuals, due to variability in urinary excretion capability.
Stokinger [74] pointed out that urinary lead determination is more accurate
than blood lead only for exposure to alkyl leads; probably because organic lead
has a much shorter residence time in the blood. Vitale and coworkers [65] found
urinary lead to be an insensitive measure of absorption, while Tola et al. [75]
found urinary lead determination to be useful at the beginning of exposure but
still less reliable than blood lead measurements. Recently, Kawal [76] studied
the value of measuring urinary non-precipitable lead as an index of exposure as
well as intoxication. The underlying theory was that in normal subjects urinary
lead is excreted entirely as precipltable lead, but in workers chronically
exposed or intoxicated by lead, a major fraction was found as non-precipitable
XI-32
lead. Kawai found that the urinary non-precipitable lead fraction did not
correlate with symptoms of intoxication or duration of exposure, but related
only to the magnitude of current or recent lead absorption.
Numerous investigators have concluded that measurement of ALAD activity
is one of the most sensitive biologic indexes of lead exposure currently avail
able [65, 74, 75, 77-81], Indeed, changes in ALAD have been called too sensitive
an indicator, since its activity is partly inhibited at lead concentrations much
lower than required for the production of adverse clinical symptoms [78].
Furthermore, ALAD serves no biological function in the mature red blood cell
[82]. On the other hand, Secchi and coworkers [83] were able to show a direct
correlation between erythrocyte ALAD activity and liver tissue ALAD activity; an
organ in which ALAD has a significant function. The relatively slow regenera
tion of ALAD activity following cessation of lead exposure may also be a useful
Indication of lead absorption in the recent past [80, 96]. It is suggested that
in screening programs for the prevention of lead intoxication, erythrocyte ALAD
should be considered as a sensitive and reliable method of early detection from
the lowest exposure levels up to those doses which produce clinical symptoms of
poisoning [75, 78]. However, at least one recent study [91] has suggested that
at subcllnlcal concentrations of lead in whole blood (mean, 2 2 . 8 yg / 1 0 0 ml),
ALAD activity did not significantly correlate. It is apparent that the accuracy
of ALAD assays can be Influenced by blood storage time and temperature [92]; and
the effect of lead on ALAD can be partly reversed by lowering of the Incubation
pH or heating at 60°C for five minutes [93]. Comparative studies [94, 95] have
established that erythrocyte ALAD activity is specifically altered by lead
exposure, and not by other heavy metals such as cadmium or mercury.
XI-33
The determination of ALA in urine is regarded as a useful technique
for biological monitoring in cases where lead exposure has exceeded the thresh
old level [74]. Several investigators have noted that increased urinary ALA
excretion does not occur until erythrocyte ALAD activity has been markedly
reduced [75, 77-79]. Thus, ALA in urine can be a more specific indicator of
potentially toxic lead exposures than erythrocyte ALAD, which is severely de
pressed after absorption of lead in subclinical amounts. Tola [78] and others
[77] have observed a rise in urine ALA only when blood lead levels reach approxi
mately 40-50 yg/lOO ml. The sensitivity of the urine ALA assay as a measure of
lead-induced alteration in heme synthesis can be improved by correction for
urine osmolality [97].
Recent advancements have been made in the development of accurate and
sensitive Indicators of lead exposure and its biological consequences. Clark [98]
used fluorescence microscopy for excess erythrocyte porphyrin as a sensitive
confirmatory method for the detection of chronic lead intoxication. Fluorescent
erythrocytes appeared at blood lead concentrations of 50 ug/100 ml and preceded
any significant decrease in hemoglobin values. The procedure is rapid, requires
little blood, and may be performed on stored samples. Chisolm and coworkers [87]
have reported that serial measurement of erythrocyte protoporphyrin by a simple
fluorometric assay technique is a better predictor of the internal (chelatable)
dose of lead than whole blood lead determination. This screening procedure is
said to be highly useful for long-term monitoring of subclinical exposures and
responses to therapy. Tomokuni and Ogata [106] have confirmed that the sensi
tivity of the fluorometric assay for erythrocyte protoporphyrin was almost equal
to that of the erythrocyte ALAD test. Increases in erythrocyte protoporphyrin
XI-34
appeared before elevated urinary excretion of ALA was evident. Most recently,
measurement of zinc protoporphyrin blood levels has been employed as a sensitive
and reliable index of biological response to lead absorption [111,179,180].
Therefore, as a measure of the toxic effects of lead on heme synthesis, many
have found that erythrocyte protoporphyrin levels have good predictive value
both as an initial screening test and in long-term follow-up [89, 107-110].
Moreover, in cases where blood lead levels and erythrocyte protoporphyrin
levels disagree, it is probable that the latter index is more reliable and
provides a better estimate of soft tissue lead [119].
Determination of the lead content of hair has been suggested as a
possible screening procedure for measurement of the severity of exposure [99].
However, this technique has apparent limitations with regard to the age and
sex of those exposed [1 0 0 ].
B. Relationship of Inorganic Lead Exposure to Biological Effects
Investigators in the past have favored the opinion that clinical
signs of poisoning do not occur at concentrations of lead in whole blood less
than 80 Mg/100 g in adults or less than 40 yg/100 g in children [64, 70, 74,
82, 101]. This biological limit, however, is not particularly valid for all
cases of lead intoxication, especially in adults [111,125,180]. Subclinical
neuropathy has recently been reported in a group of 26 workers whose blood
lead values had never exceeded 70 yg/100 ml [102]. On the other hand, a case
has been presented [103] where levels of blood lead as high as 1,050 yg/100 ml
were associated with only minor clinical symptoms. Differentiation between
lead exposure and lead poisoning is obviously a difficult task based on blood
lead values alone.
XI-35

The concept of a blood lead threshold, however, has been addressed as
a valid parameter for the setting of environmental standards [64]. Based on a
statistical treatment of reference blood lead values obtained from a normal
population, individual laboratories may adopt their own standards for excessive
exposure. That is, for adults, blood lead values equivalent to the normal
population mean +3 SD (standard deviations) would be the maximum allowable
level. In children, the mean +2 SD would provide a reasonable measure of
safety. Recognizing that interlaboratory variations in blood lead analysis are
practically unavoidable, absolute reference values for normal blood lead cannot
be formulated. Nevertheless, a reasonable degree of consistency should be
evident in view of the belief that a worldwide mean for blood lead in adults is
about 15-20 pg/100 g [82, 104]. Using the most recent data of McLaughlin and
coworkers [105] as an example, mean blood lead values in 1971 from 798 non
exposed duPont workers throughout the U.S. was 19.5 pg/100 g (SD ■ 8.0). Thus,
by the +3 SD guideline, a clearly "abnormal" blood lead value might be regarded
as any level in excess of 43.5 pg/100 g. This figure does not Imply, however,
that signs of lead poisoning will be evident at this concentration; but it
should alert medical officials to the need for reduction of exposure.
Correlation of subjective symptoms of intoxication with specific lead
exposures in humans Is difficult to generalize. Variability in results is
commonly encountered due to differences in absorption, excretion, age, sex, and
physiologic state [72, 102]. Adult male volunteers exposed to lead aerosols
23 hours per day for about 18 weeks at levels of 10.9 or 3.2 pg/m achieved
blood lead concentrations of 37 pg/100 ml and 27 yg/100 ml, respectively [72].
Blood lead reached a plateau concentration after about three months of exposure,
XI ~36
and returned to normal values two months after cessation of exposure. Urinary
excretion of lead and depression of erythrocyte ALAD activity was evident only
in the group treated at the higher dose; neither treatment, however, altered the
excretion of heme precursors or produced symptoms of lead intoxication. Con
sistent with these results are the observations by Sakurai and coworkers [113]
of 228 male workers exposed to varying amounts of lead. They showed that no
dose-related increase in the subjective symptom rate occurred when blood lead
values were 50 yg/100 g or less. Moreover, this level was shown to be an appar
ent threshold for obvious increases in urinary. ALA excretion, and thus for
biological response manifested as an alteration in heme synthesis. Three cases
of mild lead poisoning were reported [114] in which blood levels of lead ranged
from 109 to 139 yg/100 ml. Measurement of free erythrocyte protoporphyrin and
urinary ALA confirmed the existence of a biological response; whereas urine lead
level and urinary coproporphyrin excretion were unreliable indicators of exposure.
A synthesis of the results reported by numerous investigators provides
a rough framework for the analysis of lead absorption and its subsequent bio-3
logic effects (Table III-l). Although it has been shown that each 1 yg lead/m
of air contributes about 1 - 2 yg lead / 1 0 0 g of blood [82, 1 1 2 , 113, 115, 116],
extrapolation of this guideline to workroom situations may not be accurate
without giving due consideration to particle sizes and solubilities, and varia
bility from differences between samplers, days, and time-weighted versus actual
values. Furthermore, the contribution to total body lead burdens from dietary
sources and ambient air pollution is difficult to integrate into assessments of
occupational exposure. Thus, current emphasis in the prevention of lead poisoning
is being placed on prudent biological monitoring [64, 70] coupled with the
control of lead emissions.
XI-37
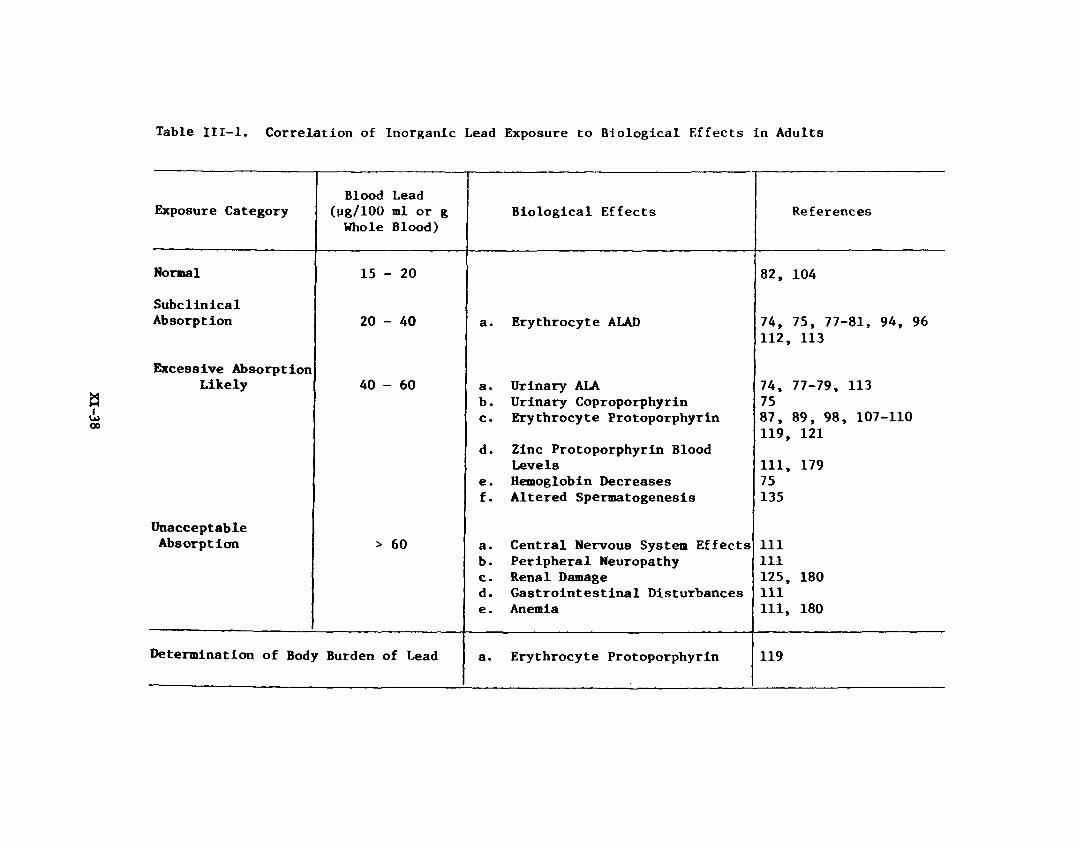
Table III-l. Correlation of Inorganic Lead Exposure to Biological Effects in Adults
Exposure CategoryBlood Lead
(tig/ 1 0 0 ml or g Whole Blood)
Biological Effects References
Normal 15 - 20 82, 104
SubcllnicalAbsorption 20 - 40 a. Erythrocyte ALAD 74, 75, 77-81, 94, 96
112, 113
Excessive AbsorptionLikely 40 - 60 a. Urinary ALA 74, 77-79, 113
b . Urinary Coproporphyrin 75c. Erythrocyte Protoporphyrin 87, 89, 98, 107-110
119, 121d. Zinc Protoporphyrin Blood
Levels 111, 179e. Hemoglobin Decreases 75f. Altered Spermatogenesis 135
UnacceptableAbsorption > 60 a. Central Nervous System Effects 1 1 1
b. Peripheral Neuropathy 1 1 1c. Renal Damage 125, 180d. Gastrointestinal Disturbances 1 1 1e . Anemia 1 1 1 , 180
Determination of Body Burden of Lead a. Erythrocyte Protoporphyrin 119
C. Epidemiologic Investigations
It is often hoped that a systematic investigation of worker popula
tions will supply the basis for a truly definitive association between the
degree of occupational exposure to a harmful agent and its subsequent effect
on health. In the case of inorganic lead, however, the data do not provide a
completely satisfying explanation of dose-response relationships.
A retrospective examination of mortality data on 7,032 men employed
in lead production facilities and battery plants from 1947 to 1970 was under
taken by Cooper and Gaffey [117]. Although problems were encountered in
accurately interpreting death certificates, it was established that an excess
number of deaths was attributable to "chronic nephritis or other renal sclerosis"
and "other hypertensive disease." It was not possible to show an occupation-
related effect on death due to stroke or hypertensive heart disease; however,
suggestive evidence of increased deaths due to respiratory and gastrointestinal
cancer was obtained. Life expectancy of lead workers did not differ significantly
from U.S. males In general. Data taken from five U.S. lead plants in 1975 and
1976 showed evidence of hematologic, neurologic, and renal damage among numer
ous workers [180]. In every plant studied, unequivocal symptoms of lead
poisoning were encountered; even among persons having blood lead levels of
81 Mg/100 ml and with only two months of exposure.
A very recent report on the mortality of workers exposed to lead
chromate [118] indicated that an excess of deaths due to respiratory cancer
had occurred, and a high incidence of stomach cancer may also have been occupa
tionally related. The small number of deaths involved, however, made statis
tical analysis of the data unjustifiable. In all of the plants studied,
estimated time-weighted averages for both lead and chromium (VI) in air exceeded
current and proposed standards.
XI-39

Studies on symptoms of morbidity are somewhat more revealing than
mortality studies in characterizing the adverse health effects of lead absorp
tion at various levels. For example, Taylor and coworkers [120] have tabulated
the incidence of lead poisoning symptoms among 35 men engaged in oxy-gas
burning of lead-painted metal. Interpretation of their results (Table III-2)
must take into account both that the mean hemoglobin value in exposed workers
was 14.8 g/100 ml and that breathing zone lead concentrations in air ranged3
from 4,000 to 14,000 yg/m . The mean duration of employment in the worker
group was 8 . 8 years (mean age 41 years). Biological testing to determipe body
burdens of lead (e.g., erythrocyte protoporphyrin or chelatable lead) was not
performed.
A comprehensive study has recently been completed on lead disease
among 158 secondary lead smelter workers [111]. Numerous biologic parameters
were measured, including blood counts, blood chemistry, zinc protoporphyrin,
nerve conduction velocity, reaction time, and the presence of classical clinical
symptoms. A striking prevalence of central nervous system symptoms (fatigue,
nervousness, anxiety, slowed mental function) was encountered even among
workers with less than one year of exposure and blood values below 60 yg / 1 0 0 ml
(Table III-3). The Incidence of central nervous system complaints was directly
proportional to blood levels of zinc protoporphyrin but not blood lead (Table III-
4). Other symptoms, including lead colic, reduced nerve conduction velocity,
and reduced hemoglobin levels, were also associated with relatively short
periods of lead exposure (typically less than one year). Symptoms of lead
toxicity associated with long-term exposures were peripheral neuropathy and
biochemical evidence of kidney function impairment. An important principle
emerging from this investigation is the apparent unreliability of blood lead
XI- 40
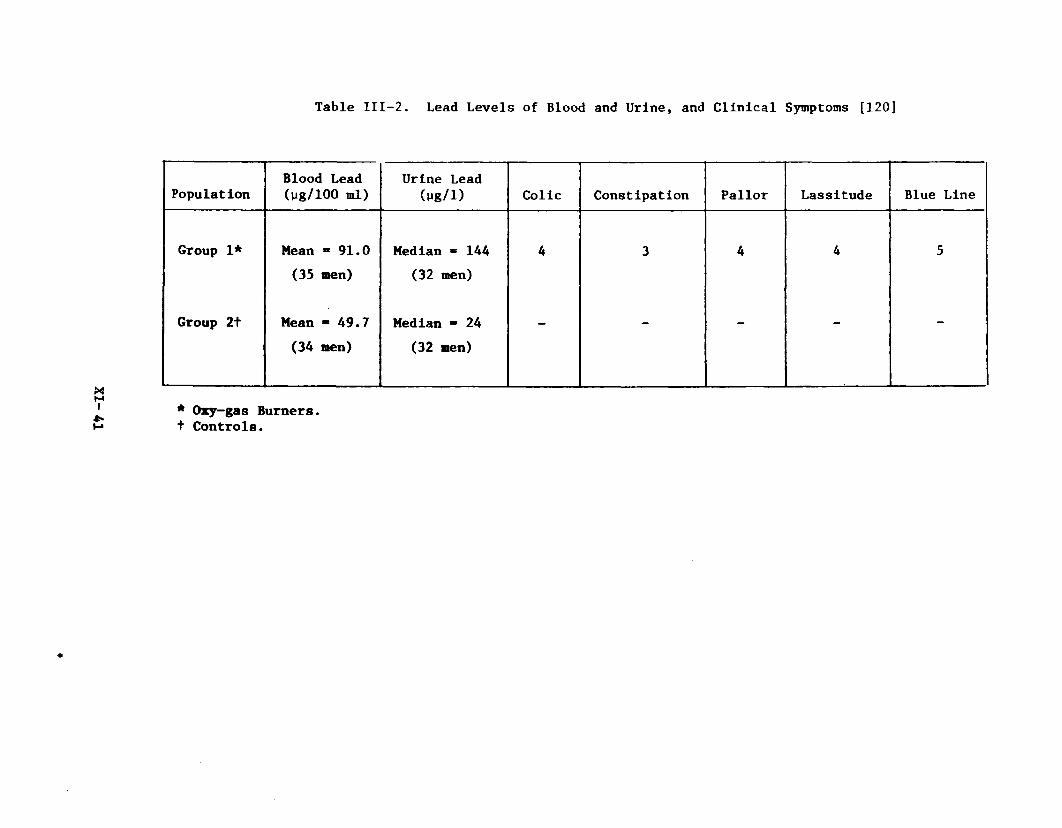
Table III-2. Lead Levels of Blood and Urine, and Clinical Symptoms [120]
PopulationBlood Lead (ug/ 1 0 0 ml)
Urine Lead (ug/1 ) Colic Constipation Pallor Lassitude Blue Line
Group 1* Mean - 91.0 (35 men)
Median * 144 (32 men)
4 3 4 4 5
Group 2t Mean - 49.7 (34 men)
Median * 24 (32 men)
- - — —
* Oxy-gas Burners, t Controls.
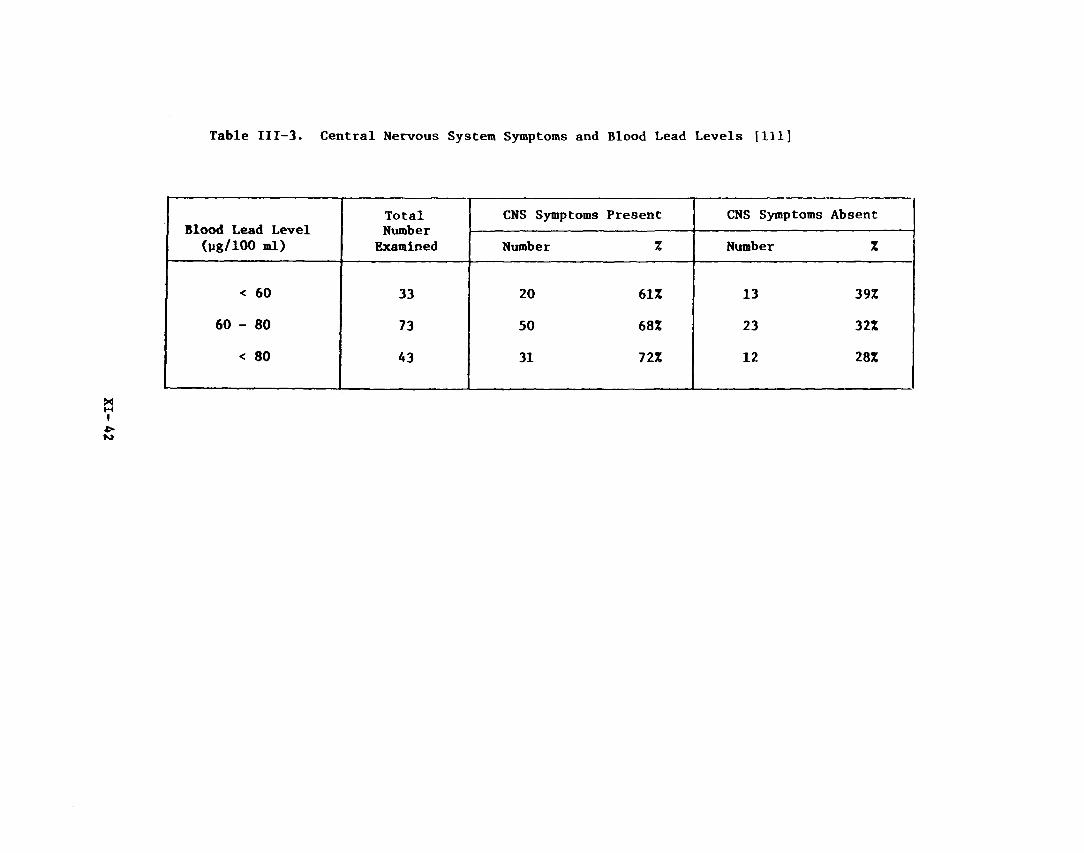
Table III-3. Central Nervous System Symptoms and Blood Lead Levels [111]
Blood Lead Level (pg/ 1 0 0 ml)
TotalNumber
Examined
CNS Symptoms Present CNS Symptoms Absent
Number % Number %
< 60 33 2 0 61% 13 39%
60 - 80 73 50 6 8% 23 32%
< 80 A3 31 72% 1 2 28%

Table III-4. Central Nervous System Symptoms and Zinc Protoporphyrin Levels [111]
ZPP Mg/100 ml
TotalNumber
Examined
CNS Symptoms
Number %
Less than 100 15 6 40%
1 0 0 - 2 0 0 28 15 53%
201 - 500 83 66 80%
More than 500 18 1 1 61%
XI-43
levels in defining excessive absorption, and the good correlation of zinc
protoporphyrin levels with anorexia, weight loss, lead colic, central nervous
system symptoms, peripheral neuropathy, hemoglobin levels, and duration of
exposure (Table III-5). Unfortunately, data were not available regarding
levels of airborne lead in the plants studied. The distribution of blood lead
levels among the workers and controls is shown in Table IIX-6 . Although many
of these workers had undergone chelation therapy, the mean level of blood lead
in these men was actually higher than the mean level in those without a past
history of chelation therapy. In addition, elevated levelB of zinc protopor
phyrin and a higher prevalence of clinical symptoms were found among those
having undergone chelation therapy. The high incidence of lead Intoxication
in the absence of elevated blood lead values in this study indicates that
biological monitoring for responses to lead (as opposed to air and/or blood
lead sampling) may be necessary for adequate worker protection.
When Shannon and coworkers [122] examined rates of sickness absence
among a group of 955 male lead workers they found no increases which were attrib
utable to the lead exposure. The mean blood lead concentration for all workers
was 55.4 yg/100 ml.
Very recently, a new dimension was added to the occupational hazards
of lead exposure when reports were made of increased lead absorption in the
children of lead workers [153, 154]. Contamination of household dust by lead
brought home on the worker's clothing was believed responsible for the observed
effects in children. These effects Included elevated blood lead values and
erythrocyte protoporphyrin levels. In some of the lead Intoxicated children,
hospitalization and chelation therapy were required.
XI-44
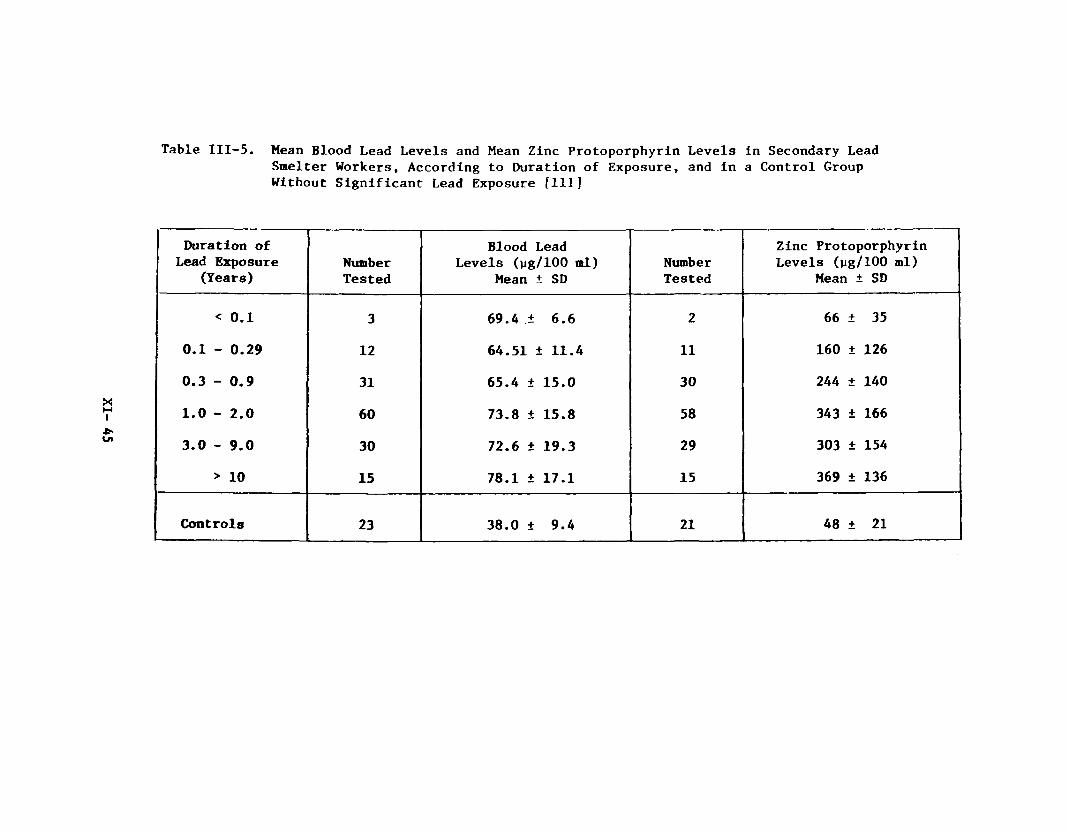
Table III-5. Mean Blood Lead Levels and Mean Zinc Protoporphyrin Levels in Secondary Lead Smelter Workers, According to Duration of Exposure, and in a Control Group Without Significant Lead Exposure [111]
Duration of Lead Exposure
(Years)NumberTested
Blood Lead Levels (yg/100 ml)
Mean ± SDNumberTested
Zinc Protoporphyrin Levels (pg/100 ml)
Mean ± SD
< 0 . 1 3 69.4 ± 6 . 6 2 66 ± 35
0.1 - 0.29 1 2 64.51 ± 11.4 1 1 160 ± 126
0.3 - 0.9 31 65.4 ± 15.0 30 244 ± 140
1 . 0 - 2 . 0 60 73.8 ± 15.8 58 343 ± 166
3.0 - 9.0 30 72.6 ± 19.3 29 303 ± 154
> 1 0 15 78.1 ± 17.1 15 369 ± 136
Controls 23 38.0 ± 9.4 2 1 48 ± 21
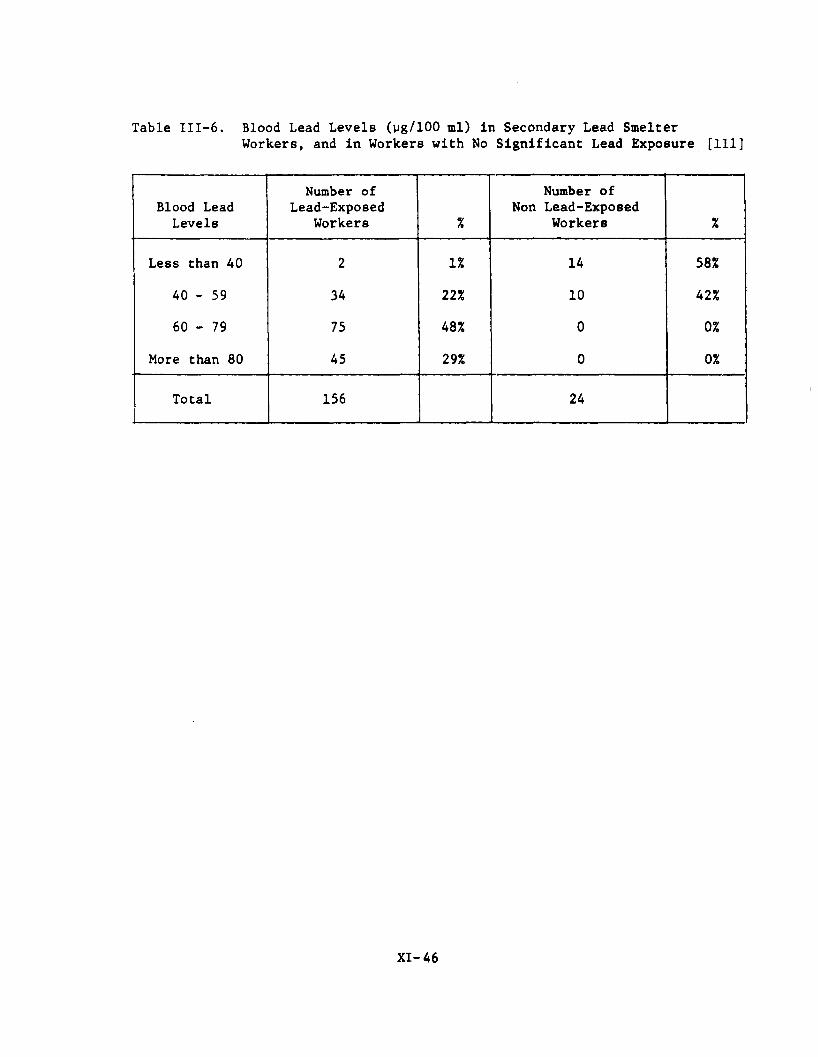
Table III-6 . Blood Lead Levels (yg/100 ml) in Secondary Lead SmelterWorkers, and in Workers with No Significant Lead Exposure [111]
Blood Lead Levels
Number of Lead-Exposed
Workers %
Number of Non Lead-Exposed
Workers %
Less than 40 2 1 % 14 58%
40 - 59 34 2 2 % 1 0 42%
60 - 79 75 48% 0 0%
More than 80 45 29% 0 0%
Total 156 24
XI-46
D. Lead Toxicity in Humans
1. Neurotoxicity
In 1972, Whitfield and coworkers [123] reviewed 54 cases of
lead encephalopathy in adults; 31 identified from the scientific literature,
and 23 from the records of the University of Alabama Medical Center. Lead
exposure usually occurred by ingestion of moonshine liquor, and symptoms
ranged from confusion and disorientation to seizures, coma, and death. The
authors pointed out that while the differential diagnosis of lead encephalo
pathy is extremely difficult, this condition is the most life-threatening
consequence of lead exposure. It was further noted that lead encephalopathy
rarely occurs from industrial exposure. However, Segal et al. [124] described
three cases in 1974 of lead encephalopathy from industrial poisoning. All
three patients (2 men and 1 woman) had elevated blood levels (90, 316, and
180 yg / 1 0 0 ml) and presented a diversity of neurological signs.
SeppHlfiinen and coworkers [102] recently presented important
evidence documenting the existence of subclinical neuropathy associated with
low levels of lead in the blood. Measurements of motor nerve-conduction
velocity in 18 men and eight women with occupation-associated blood lead »
values ranging from 20 to 70 yg/100 ml showed reduced function in comparison
to sex-matched controls (p <.001). These results were in agreement with
previous findings by the same investigators. The authors felt that the demon
stration of subclinical neuropathy attributable to lead absorption should be
considered more serious than alterations in heme synthesis, due to the poor
regenerative capacity of the nervous system.
Petkau and associates [129] have described a case of amyotropic
lateral sclerosis (ALS) possibly related to a six month exposure to high levels
XI-47
of white lead. Early clinical symptoms in this patient were more consistent
with lead-induced polyneuropathy than ALS, and elevated urinary excretion of
lead confirmed excessive exposure. At necropsy, increased levels of lead were
found in the spinal cord, nerve, and muscle. Other cases of ALS examined by the
authors in which exposure to lead was not suspected similarly revealed elevated
levels of lead in the tissues. In 1976, Conradi and coworkers [181] confirmed
the association of excessive lead absorption with ALS. These investigators
observed that the lead content of cerebrospinal fluid was elevated in 1 2 patients
with ALS when compared to controls having non-degenerative neurological condi
tions. A hypothesis was offered concerning the pathogenesis of lead in ALS
based on the abnormal availability of lead to the nervous system in the disease.
Westerman and coworkers [130] were not able to correlate lead absorption with
the development of multiple sclerosis in humans.
2. Renal Damage
Occupational lead nephropathy in adults is a relatively uncommon
occurrence in the United States and, thus far, has been poorly characterized
in its pathogenesis. However, recent studies have suggested that chronic lead
nephropathy may be going unrecognized due to a lack of correlation with blood
lead concentrations. An excessive incidence of kidney dysfunction (elevated
blood urea nitrogen and creatinine) was found among lead plant workers [1 1 1 ,
180]. The prevalence of abnormal findings was strongly correlated with duration
of exposure to lead, even though blood lead levels did not correlate with length
of exposure. Wedeen and associates [125] examined 13 lead workers suspected
of having excessive body burdens of lead. Two of the patients had been hospital
ized for lead colic, but none of the group displayed clinical symptoms of
renal dysfunction. Laboratory tests revealed that one patient was suffering
XI’-48
from asymptomatic renal failure, while five others showed signs of preclinical
renal dysfunction. Based on blood lead values alone, only one worker would
have been suspected of having lead poisoning (Table III-7). Renal biopsies
taken from three of the patients demonstrated proximal tubule abnormalities
with damage to the cellular mitochondria; intranuclear inclusion bodies were
not found in these men.
Cramer and coworkers [126] postulated that two or three stages
may be involved in the response of the human kidney to chronic lead exposure.
Lead-induced nuclear inclusion bodies in the proximal renal tubular cells were
thought to result from short-term exposures (less than one year). This early
phase is also associated with a high urinary lead output, but no impairment of
renal function occurs and cell damage is probably reversible. During the
second phase (requiring at least four years of exposure) the proximal tubular
cells show a decreased formation of nuclear inclusions; lead excretion is
decreased and moderate interstitial fibrosis is present in the kidneys. Renal
function may not be impaired, but morphological changes are considered to be
irreversible. A possible third phase of lead nephropathy, characterized by
renal failure, was not demonstrated by Cramer and associates [126], but never
theless was suggested as a potential consequence from prolonged severe lead
exposure. The authors stressed that diagnosis of renal dysfunction and proper
staging of lead nephropathy depends on the timing of individual tests.
3. Cytogenetic Effects
Concern has recently mounted regarding the potential for lead
to induce mutagenic and/or teratogenic effects in humans. However, the extrap
olation of data from somatic cell studies to suggest possible effects on germ
cells cannot be performed with great confidence. O'Riordan and Evans [127]
XI- 49
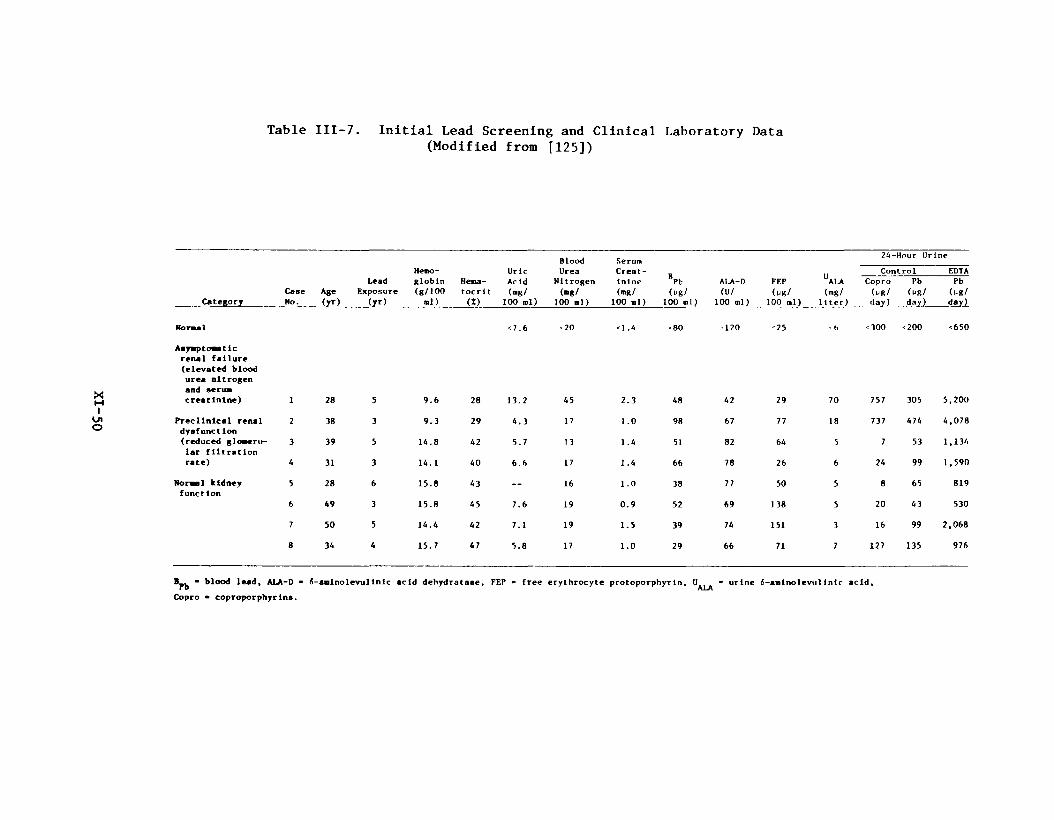
Table III-7. Initial Lead Screening and Clinical Laboratory Data(Modified from [125])
Control_______ EDTAFEP ALA Copro Pb Pb(ug/ (mg/ (ug/ (ug/ (ug/
100 ml) liter) day) day)_____day)
Normal
Asymptomatic renal failure (elevated blood urea nitrogen and serum creatinine) 1 28 5 9-6 28
<7.6
13.2
<20
45
<\.4
2.3
<80
48
-120
42
"25
29
' t>
70
<300
757
<200
305
<650
5,200
Precllnlcal renal 2 38 3 9.3 29 4.3 17 1.0 98 67 77 18 737 474 4,078dysfunction (reduced glomeru 3 39 5 14.8 42 5.7 13 1.4 51 82 64 5 7 53 1,134lar filtration rate) 4 31 3 14.1 40 6.6 17 1.4 66 78 26 6 24 99 1,590
Normal kidney 5 28 6 15.8 43 __ 16 1 .0 38 77 50 5 8 65 819function
6 49 3 15.8 45 7.6 19 0.9 52 69 138 5 20 43 530
7 50 5 14.4 42 7.1 19 1.5 39 74 151 3 16 99 2,068
8 3 4 4 15.7 47 5.8 17 1.0 29 66 71 7 127 135 976
■ blood lead, ALA-D - Copro ■ coproporphyrlns.
6-aminolevullnic acid dehydratase, FEP - free erythrocyte protoporphyrin. ^ALA * ur^ne 6-aminolevulinlc acid,
Blood SerumHemo- Uric Urea Creat-
Lead globln Hema- Acid Nitrogen inine Pb ALA-DCase Age Exposure (g/100 tocrit (mg/ (mg/ (mg/ (ug/ (U/
Category_________ No. (yr) (yr) nl) (X) 100 ml) 100 al) 100 ml) 100 ml) 100 ml)
were unable to demonstrate a significant increase over control values in the
frequency of chromosome or chromatid aberrations in cultured lymphocytes taken
from 35 lead workers. Blood lead concentrations among the men ranged from 40
to more than 120 pg/100 ml. More recently, however, Forni and associates 1128]
established a correlation between the duration of early exposure to lead and
the rate of abnormal metaphases in cultured lymphocytes from 65 male workers.
The incidence of abnormalities doubled after one month of exposure, increased
further by two months, and remained steady up to seven months of exposure;
thereafter the rate decreased somewhat. Levels of lead in the air during the
study period did not exceed 800 pg/m ; blood lead values were in the range 32
to 64 Mg/100 ml. The results of Deknudt and coworkers [132] likewise confirmed
that among 14 workers with symptoms of lead poisoning, an increased prevalence
of chromosome abnormalities could be found. The concurrent exposure to cadmium
and zinc was not thought to be correlated with the incidence of abnormalities.%
However, Bauchinger and associates [133] observed a group of similarly exposed
workers and concluded that increased chromosome aberrations were most likely
attributable to cadmium exposure. The possibility of synergistic effects
cannot be ruled out.
4. Reproductive Effects
It has long been suspected that exposure to inorganic lead has
an adverse effect on pregnancy, manifested as an increased incidence of still
births and miscarriages. Investigators have shown that transport of lead can
readily occur across the placenta, such that the lead level of the newborn
Infant reflects that of its mother [131].
Fahim and coworkers [134] recently examined the incidence of
term pregnancies with early membrane rupture and the incidence of premature
XI- 51
deliveries among 502 women living near lead mining regions in Missouri.
Lead concentration in blood (maternal and cord) and fetal membranes were not
elevated in term pregnancies. However, in term deliveries with early membrane
rupture, lead concentrations were increased in blood and membrane tissues. In
addition, premature deliveries were associated with higher blood levels of
lead. The authors suggested a possible effect of lead on the outcome of
pregnancy. The lack of a suitable control group makes these results difficult
to extrapolate, however.
The reproductive ability of men was also shown to be adversely
affected by "moderate" absorption of lead [135]. Concentrations of lead in
blood greater than 52 yg/100 ml (groups a and b of Table III-8 ) were associated
with a high frequency of altered spermatogenesis (Table III-9). Disorders of
sexual dynamics were evident with blood lead values greater than 41 pg/100 ml
(Table III-10). Among the workers with highest concentrations of lead in
blood (mean, 74.50 ± 26 ug/100 ml), 75% were Judged to be hypofertile, and 50%
considered to be infertile. It was not possible, however, to demonstrate a
reliable association between lead absorption in these men and the number of
normal pregnancies per couple or the frequency of miscarriages, ectopic preg
nancies, or premature births. Nevertheless, these results were interpreted to
indicate that lead clearly has a direct toxic action on the male gonads at
relatively low levels of absorption.
5. Developmental and Behavioral Effects
Many systematic studies with lead-poisoned children have strongly
suggested an increased susceptibility to the effects of lead during the period
of growth and organ development. However, documentation of lead absorption in
Infancy has traditionally been a major obstacle in relating exposures to effects.
XI- 52

Table III-8. Mean Values of Lead in Blood and Urine of Coproporphyrin and 6-ALA[135]
GroupLead in Blood
pg/100 mlLead in Urine pg/liter
Coproporphyr in Wg/liter
6-ALA mg/liter
A. (a) Lead-poisoned workmen, 23 74.50 ± 26 385 ± 71 394 ± 116 56.52 ± 20
(b) Lead workmenwith moderately Increased absorption, 42 52.80 ± 21 251 ± 106 295 ± 132 22.44 ± 8 . 8
(c) Lead workmen with slightly increased absorption, 35 41 ± 12 100.6 ± 41 00 © 1+ ■P* ■B* 7.7 ± 4.2
B. Men with physiologic absorption of lead working in a polluted environment, 23 23 ± 14 92 ± 34 35 ± 16 4,4 ± 2.2

Table I1I-9. Sexual Dynamics and Decrease in Libido in Workmen [135]
GroupLibido
Decrease %Pathologic Erections %
Pathologic Ejaculation %
Orgasm Decrease %
A. (a) Lead-poisoned workmen, 23 2 1 48 30 3
(b) Lead workmen with moderate increased absorption, 42 33 33 38 4
(c) Lead workmen with slight increased absorption, 35 28 2 2 40 5
B. Men with physiologic absorption of lead working in a polluted environment, 50 16 14 16 2
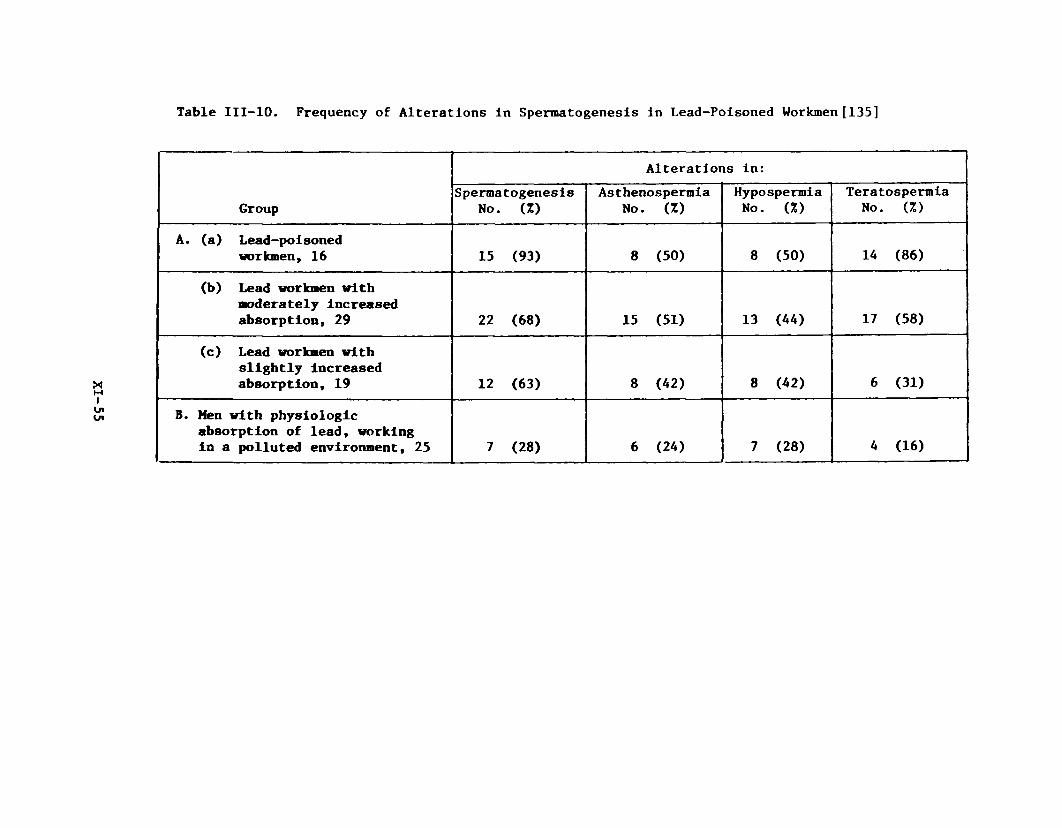
Table 111-10. Frequency of Alterations In Spermatogenesis in Lead-Poisoned Workmen [135]
Group
Alterations in:Spermatogenesis
No. (Z)As thenospermia
No. (Z)Hypospermia No. (Z)
Teratospermia No. (%)
A. (a) Lead-poisoned workmen, 16 15 (93) 8 (50) 8 (50) 14 (8 6)
(b) Lead workmen withmoderately increased absorption, 29 2 2 (6 8) 15 (51) 13 (44) 17 (58)
(c) Lead workmen with slightly increased absorption, 19 12 (63) 8 (42) 8 (42) 6 (31)
B. Men with physiologicabsorption of lead, working in a polluted environment, 25 7 (28) 6 (24) 7 (28) 4 (16)

However, in homes with excessive water-lead levels occupied by children during
the first year of life, an increased number of children were found to be men
tally retarded [136]. Blood lead levels in the retarded children were higher
than in non-retarded control children. The possible contribution of the men
tally retarded child's mother drinking contaminated water during pregnancy
must also be considered.
Blood lead values in children ranging from 40 to 80 pg/100 ml
seem to be associated with adverse neuropsychological effects. Landrigan and
coworkers [137] compared a group of 70 children, aged 3 to 15 years (mean
blood lead 48 pg/100 ml) living near a lead smelter to a group of 78 matched
controls having blood lead values under 40 yg/100 ml. They found that higher
lead levels were associated with decreased intelligence and slowing in a
finger-wrist tapping test. Similar results were obtained in a group of seven-
year-old children who were exposed to lead between one and three years of
age [138]. Persistent deficits were noted in global IQ and associative
abilities, and visual motor and fine motor coordination. In addition, behavioral
disturbances were evident among the lead-exposed children that were suggestive
of permanent damage caused by early lead exposure. Furthermore, Baloh and
coworkers [139] demonstrated a significantly increased incidence of hyperactive
behavior among children with elevated blood levels (greater than 50 yg / 1 0 0 ml).
On the other hand, Lansdown and associates [140] saw no relationship between
blood lead levels in children under 17 years of age and various measures of
mental function.
Preliminary results on the effects of lead on mental functions
of adult workers have shown deficits in specific areas of performance [141].
The authors suggested that increasing body burdens of lead reduce a worker's
ability only during periods of hlgh-demand performance.
XI-56
Exposure of the developing fetus to lead occurs by trans-placental
passage from maternal sources. A number of studies with laboratory animals have
confirmed this phenomenon and emphasized its importance in the pathogenesis of
lead-induced abnormalities in growth and development. Green and Gruener [142]
found that, in rats, a rapid equilibrium is reached between maternal and fetal
blood lead concentrations. Moreover, even higher quantities of lead were trans
ported with milk to the nursing offspring when dams were injected with inorganic
lead on the day of delivery. Localization of lead in the newborn occurred
primarily in the head. Kostial and Momcilovid [143] confirmed these findings
and noted further that the highest transport of lead in the nursing rat occurred
during the late lactation period. In the golden hamster, lead nitrate (3 mg/kg;
i.v.) given on day 7 or 8 of gestation crossed the placental membranes in sub
stantial amounts within 15 minutes [144]. Thus, the permeability of the pla
centa to lead ions was demonstrated at low doses even during the critical period
of organogenesis in this species.
Parental exposure to lead acetate has been shown to exert a detri
mental effect on the subsequent learning ability of rat offspring [145]. Single
parental exposure, either male or female, and dual parental exposure to lead all
caused significant learning deficits. Similarly, a study has shown that rats
exposed to 5 or 50 ppm of lead from conception (via maternal exposure) to adult
hood resulted in delayed nervous system development [146]. As adults, the lead-
exposed animals displayed hypoactivity and decreased responsiveness to the
stimulatory effects of amphetamine. These results contrast with the ability of
IV. ANIMAL STUDIES
A. Developmental and Behavioral Effects
XI-5 7
lead to produce hyperactivity in juveniles. Additional studies conducted with
rats [147, 148] and mice [149] treated neonatally with lead confirmed that
growth and development are retarded, learning ability is reduced, and subtle
behavioral changes result from low level exposures early in life. Lead intoxi
cated neonatal rat6 showed retardation of new cell formation in the cerebellum,
with ataxia, paraplegia, and cerebellar vascular damage after three weeks of
life [150].
When ewes were fed lead acetate in amounts sufficient to maintain a
blood lead concentration of 34 yg/100 ml throughout gestation, learning deficits
were demonstrated in their offspring [151]. Lambs from lead-exposed ewes had
blood lead values of 24 yg/100 ml. Between 10 and 15 months of age these
animals had reduced abilities to learn a visual discrimination task. Lambs were
not affected by maternal blood concentrations of 17 yg/100 ml, which implied
that a threshold for neurologic damage in the offspring of sheep may lie in that
region which produces 17 to 34 yg lead/100 ml in the maternal circulation.
B. Lead Toxicity
There is considerable Interest in developing a suitable animal model
for lead toxicity [152]. Thus far, no one species has proven to be consistently
reliable in responding to lead in a fashion analogous to humans. Consequently,
the recent scientific literature contains an abundance of reports detailing
specific lead-induced effects In various animals. Data derived from studies
conducted with several animal species exposed to lead are summarized in
Table IV-1. Taken together, these results demonstrate that the toxic effects of
lead In mammals are primarily involved with damage to the hematopoietic system,
the central nervous system, and the kidneys. The accumulated observations
XI-58
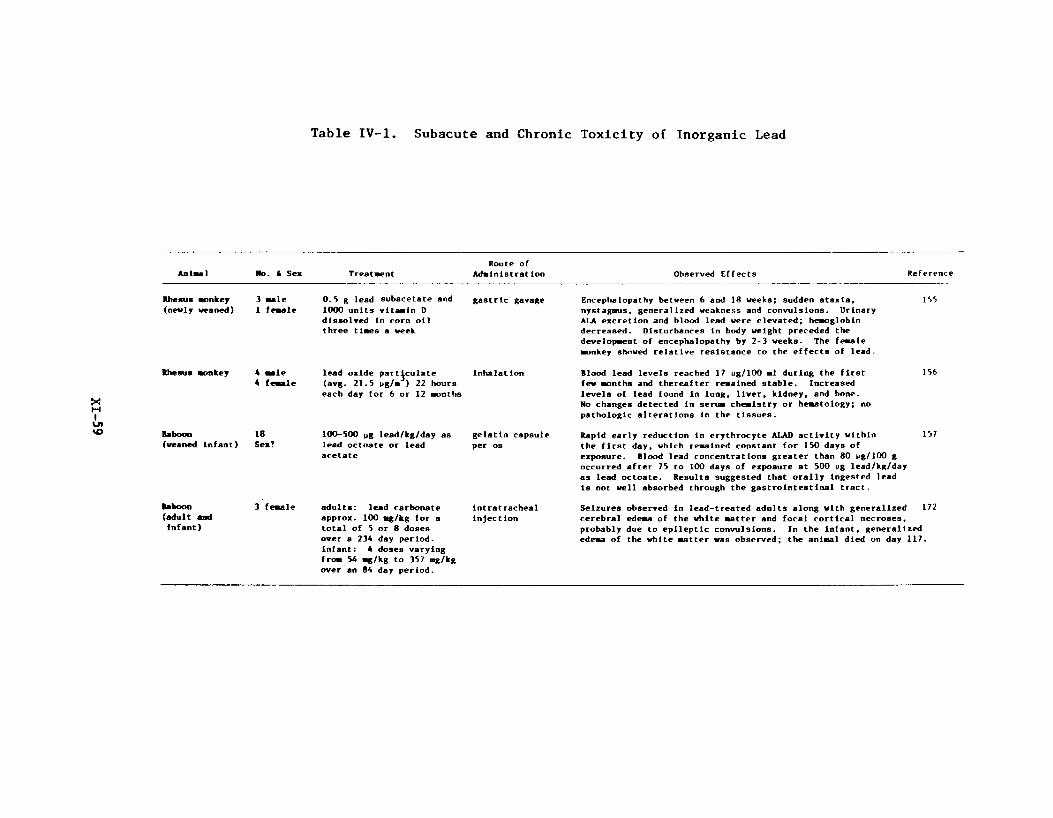
XI-59
Table IV-1. Subacute and Chronic Toxicity of Inorganic Lead
Animal Ho. 6 Sex TreatmentRoute of
Admin1strat ion Observed Effects Reference
Rhesus monkey (nevlj veaned)
3 male 1 female
0.5 g lead subacetate and 1000 units vitamin D dissolved in corn oil three times a week
gastric gavage Encephalopathy between 6 and 18 weeks; sudden ataxia, nystagmus, generalized weakness and convulsions. Urinary ALA excretion and blood lead were elevated; hemoglobin decreased. Disturbances in body weight preceded the development of encephalopathy by 2-3 weeks. The female monkey showed relative resistance to the effects of lead.
1S5
Rhesus monkey 4 male 4 female
lead oxide particulate(avg. 21.5 Mg/oi ) 22 hours each day for 6 or 12 months
inhalation Blood lead levels reached 17 ug/100 ml during the first few months and thereafter remained stable. Increased levels of lead found in lung, liver, kidney, and bone.No changes detected in serum chemistry or hematology; no pathologic alterations in the tissues.
156
Baboon(veaned Infant)
18Sex?
100-500 ug lead/kg/day as lead octoate or lead acetate
gelatin capsule per os
Rapid early reduction in erythrocyte ALAD activity within the first day, which remained constant for 150 days of exposure. Blood lead concentrations greater than 80 ug/100 g occurred after 75 to 100 days of exposure at 500 ug lead/kg/day as lead octoate. Results suggested that orally Ingested lead is not well absorbed through the gastrointestinal tract.
157
Baboon (adult and Infant)
3 female adults: lead carbonate approx. 100 ag/kg for a total of 5 or 8 doses over a 234 day period. Infant: 4 doses varying from 54 mg/kg to 357 mg/kg over an 84 day period.
Intratrachealinjection
Seizures observed in lead-treated adults along with generalized 172 cerebral edema of the white matter and focal cortical necroses, probably due to epileptic convulsions. In the infant, generalized edema of the white matter was observed; the animal died on day 117.
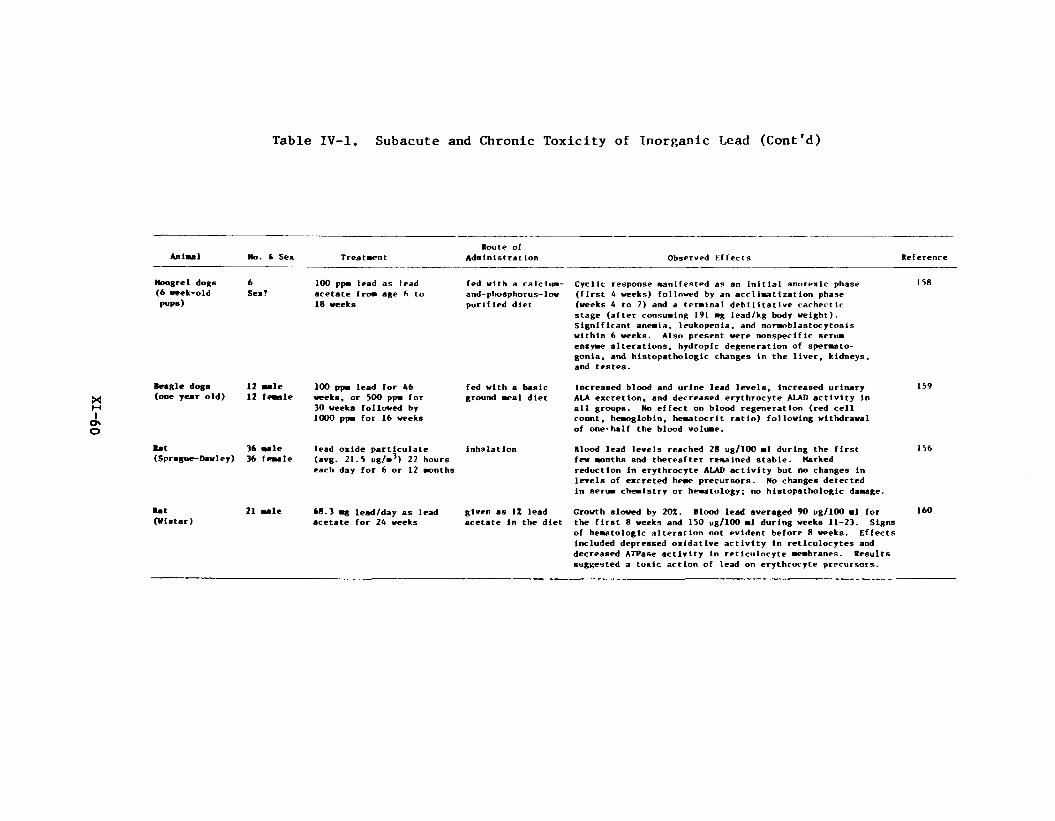
09-I
X
Table IV-1. Subacute and Chronic Toxicity of Inorganic Lead (Cont'd)
Animal No. fc Sex TreatmentRoute of
Administrat ion Observed Effects Reference
Mongrel dogs (6 week-old P«P®)
6Sex?
100 ppm lead as lead acetate from age 6 to 18 weeks
fed with a calcium- and-phosphorus-low purified diet
Cyclic response manifested as an initial anorexic phase (first 4 weeks) followed by an accIimatization phase (weeks 4 to 7) and a terminal debilitatlve cachectic stage (after consuming 191 mg lead/kg body weight). Significant anemia, leukopenia, and normoblastocytosis within 6 weeks. Also present were nonspecific serum enzyme alterations, hydropic degeneration of spermatogonia, and histopathologic changes in the liver, kidneys, and testes.
158
Beagle dogs (one year old)
12 male 12 female
100 ppm lead for 46 weeks, or 500 ppm for 30 weeks followed by 1000 ppm for 16 weeks
fed with a basic ground meal diet
Increased blood and urine lead levels. Increased urinary ALA excretion, and decreased erythrocyte ALAD activity in all groups. No effect on blood regeneration (red cell count, hemoglobin, hematocrit ratio) following withdrawal of one-half the blood volume.
159
■at(Sprague-Dawley)
36 male 36 female
lead oxide particulate(avg. 21.5 ug/m3) 22 hours each day for 6 or 12 months
inhalation Blood lead levels reached 28 ug/100 ml during the first few months and thereafter remained stable. Harked reduction in erythrocyte ALAD activity but no changes in levels of excreted heme precursors. No changes detected in serum chemistry or hematology; no histopathologic damage.
I bb
Rat(Vlatar)
21 male 68.3 mg lead/day as lead acetate for 24 weeks
given as 1Z lead acetate In the diet
Growth slowed by 20X. Blood lead averaged 90 pg/100 ml for the first 8 weeks and 150 ug/100 ml during weeks 11-23. Signs of hematologic alteration not evident before 8 weeks. Effects included depressed oxidative activity in reticulocytes and decreased ATPase activity in reticulocyte membranes. Results suggested a toxic action of lead on erythrocyte precursors.
160
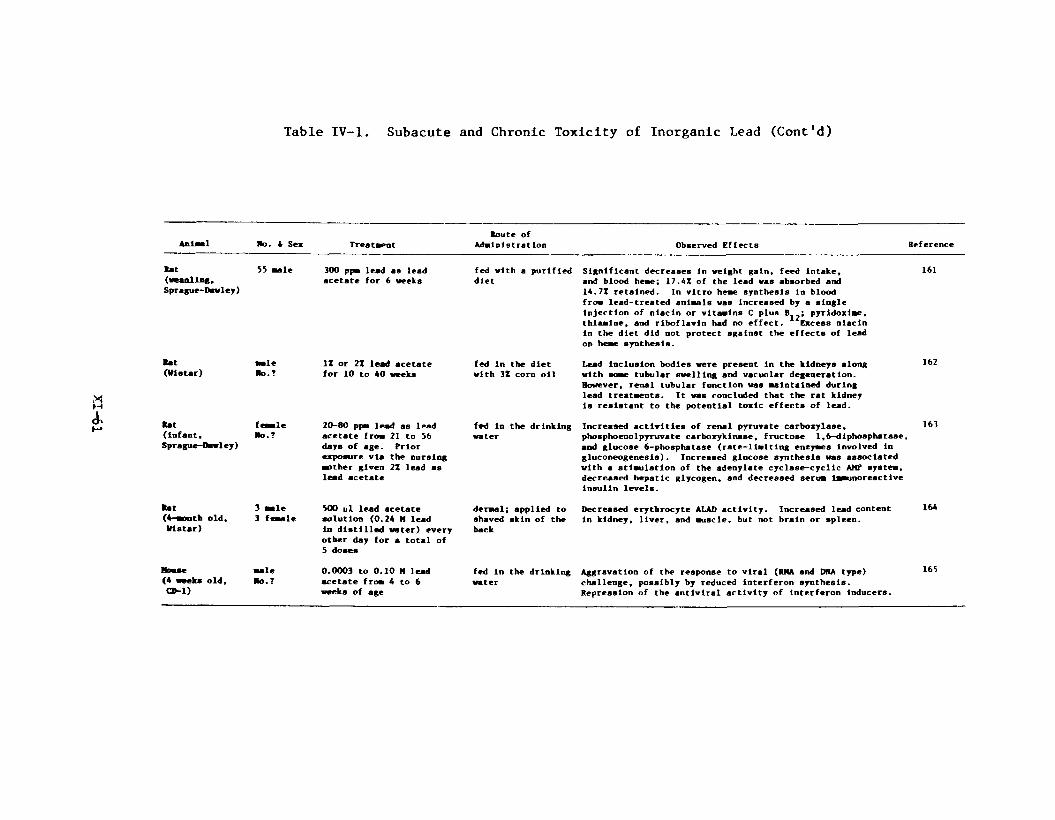
Table IV-1. Subacute and Chronic Toxicity of Inorganic Lead (Cont'd)
Animal No . 4 Sex TreatmentRoute of
AdalnlstratIon Observed Effects Reference
lit(weanling,Sprague-Dawley)
55 wale 300 pfm lead as lead acetate for 6 weeks
fed with a purified diet
Significant decreases in weight gain, feed intake, and blood heae; 17.4Z of the lead was absorbed and 14.7Z retained. In vitro heae synthesis in blood froa lead-treated anlaals was Increased by a single injection of niacin or vltaalns C plus pyridoxlae, thlaalne, and riboflavin had no effect. Excess niacin in the diet did not protect sgalnst the effects of lead on heae synthesis.
161
Bat(Vistar)
■aleHo.?
1Z or 2Z lead acetate for 10 to 40 weeks
fed in the diet with 3Z corn oil
Lead inclusion bodies were present in the kidneys along with soae tubular swelling and vacuolar degeneration. However, renal tubular function was aalntained during lead treatments. It was concluded that the rat kidney is resistant to the potential toxic effects of lead.
162
Bat(infant, Sprague-Davley)
feaileHo.?
20-80 ppai lead as lead acetate froa 21 to 56 days of age. Prior exposure via the nursing ■other given 2Z lead as lead acetate
fed in the drinking water
Increased activities of renal pyruvate carboxylase, phosphoeoolpyruvate carboxykinase, fructose 1,6-dlphosphatase, and glucose 6-phosphatase (rate-1lalting enzyaes involved in gluconeogenesis). Increased glucose synthesis «ms associated with a stimulation of the adenylate cyclase-cyclic AMP systea, decreased hepatic glycogen, and decreased s e n s iaaunoreactlve insulin levels.
163
Bat(4-aonth old. Vistar)
3 wale 3 female
500 pi lead acetate solution (0.24 M lead in distilled water) every other day for a total of 5 doses
deraal; applied to shaved skin of the back
Decreased erythrocyte ALAD activity. Increased lead content in kidney, liver, and auscle, but not brain or spleen.
164
Moose(4 weeks old, CD-I)
■aleHo.?
0.0003 to 0.10 M lead acetate froa 4 to 6 weeks of age
fed in the drinking water
Aggravation of the response to viral (RNA and DNA type) challenge, possibly by reduced interferon synthesis. Repression of the antiviral activity of interferon inducers.
165

Table IV-1. Subacute and Chronic Toxicity of Inorganic Lead (Cont'd)
Animal No. & Sex TreatmentRoute of
Adminlstrat ion Observed Effects Reference
Mouse(6 vetka old, Swiss)
14 male 2Z lead subacetate for 28 days (total mean lead intake ■ 1.64 g)
fed In the drinking water
Incidence of pregnancy In mates of lead-treated mice greatly reduced in comparison to controls (27.6Z vs. 52,7X in controls). Mutagenicity index (No. of early fetal deaths/total Implants) was elevated in lead- treated mice.
166
Rabbit (New Zeland and pigmented)
14Sex?
0.5Z lead subacetate for periods up to 2 years
fed with a standard diet
Multifocal lesions of the retinal pigment epithelium and photoreceptor degeneration.
167
Pi*(4 weeks old, Yorkshire)
6Sex?
1000 ppm lead as lead acetate for 13 weeks
fed with a diet supplemented with calcium and phosphorus
Intranuclear inclusion bodies occurred in liver cord cells, renal tubular epithelium, and osteoclasta. Inhibition of osteocytlc activity occurred, leading to necrosis of the oateocytes and osteoclasis. Effect was most prominent in metaphyseal trabeculae, the bone tissue with highest turnover rate. Effects were less pronounced in pigs with highest levels of dietary calcium.
168
Sheep(yearling,Columbla-ftamboullet)
20 female 4.5 and 2.5 mg metallic lead/kg/day for 6 months
fed with a supplemented diet
No signs of clinical lead poisoning or in hematology, serum chemistry, or reproductive performance. Significant differences from controls were seen in packed cell volume, hemoglobin, and alkaline phosphatase, but were not linear with lead exposure.
169
Gerbil(Mongolian)
15 male 15 female
0.125Z and 0.25Z lead as lead acetate for 12 weeks
fed with a ground diet
Intranuclear lead inclusion bodies in epithelial cells of the proximal convoluted tubules of the kidney were observed afteT 4 weeks. Cytoplasmic changes observed In p r o x i M l tubule cells containing lead inclusions were considered Indicative of acute lethal Injury. After 12 weeks, gerbll kidneys accumulated 4 to 6 times the amount of lead as rat kidneys.
170
Bamster(Syrian golden, 6 weeks old)
30 male 30 female
1 mg lead oxide, alone or with 1 mg benzo{a]pyrene once a week for 10 weeks
Intratrachealinjection
Lead oxide alone induced alveolar metaplasia (19) and adenomatous proliferation (3) in the lungs. In combination with benzo[a]pyrene, lead oxide caused adenoma (9) and adenocarcinoma (1) in the peripheral area of the lungs, as well as alveolar metaplasia (23) and adenomatous proliferation (5).
171

by numerous Investigators of the toxic effects of lead in humans are in agreement
with this impression. In addition, animal studies have provided evidence of lead
involvement in reproductive failure [104], fetal teratogenesis [178], and cocar
cinogenesis [171].
XI-63
V. WORK PRACTICES AND ENGINEERING CONTROLS
Effective control of occupational exposure to lead requires the integration
of proper industrial hygiene practice with adequate housekeeping, work habits,
and employee personal hygiene. The hazards of lead exposure have long been
recognized, and thus, protective measures have been in use for many years. Con
sequently, the recent literature has provided relatively little guidance in
improving the occupational environment with respect to lead.
Nevertheless, VanderKolk and Schuman [153a] have recently outlined the
latest opinions regarding a program of occupational lead control. Emphasis is
placed on air sampling (including personal samples), engineering controls,
housekeeping practices, biological testing, employment physicals, and proper work
habits. In an earlier report, Hernberg [173] discussed in greater detail the
factors which determine the magnitude of risk associated with various industrial
situations Involving potential lead exposure. Prevention of lead poisoning was
logically divided into technical means of prevention (e.g., substitute chemicals,
process automation, ventilation) and medical control (e.g., pre-employment exami
nation, biological monitoring).
XI-64
A. Chelation Therapy
In past years the administration of chelating agents to lead workers as
prophylactic therapy has been employed to a limited degree. Whereas chelating
agents (edetate disodium calcium, penicillamine) are generally useful in the
therapy of acute lead intoxication, the value of prophylactic chelation therapy
is highly questionable. In fact, a number of adverse effects can result from
long-term chelation therapy.
Recent reviews on chelation therapy among workers exposed to lead
conclude that the administration of chelating agents under conditions of con
tinued exposure to lead is strongly contraindicated [71, 174]. Damage to the
kidneys, increased absorption of lead from the gastrointestinal tract, and
interference with metal-dependent enzymatic activity are known to occur under
these circumstances. In addition, it has been noted that workers who had chela
tion therapy may display greater lead-induced abnormalities than those without a
history of such therapy [111]. Furthermore, it was suggested that, by tempor
arily lowering blood lead levels, chelation therapy may nullify the diagnostic
significance of elevated blood lead values while having no beneficial effect on
body lead burden.
Although chelation therapy for acute lead poisoning in children is a
recommended course of action [6 8 , 119], studies with lead-intoxicated rats sug
gested that chelating compounds are less efficient In immature animals [175].
Other investigations with rats have shown that penicillamine did not reduce soft
tissue lead, nor was it as effective as ethylenediaminetetraacetate [176, 177].
VI. MISCELLANEOUS
XI-65
VII. SUMMARY AND CONCLUSIONS
It is apparent that occupational exposure to inorganic lead may lead to
disturbances of the hematopoietic system, the central and peripheral nervous
system, the reproductive system, and the kidneys. The correlation of damage in
specific organs with levels of lead in the blood, however, is neither consistent
nor reliable. Nevertheless, it is apparent that blood lead concentrations sub
stantially below 80 yg / 1 0 0 ml in adults are often associated with adverse effects.
Thus, it is doubtful whether an industrial standard based on the maintenance of
blood lead values at or below 80 yg / 1 0 0 ml will be successful in the prevention
of lead poisoning. Similarly, the difficulties involved in accurately predicting
blood lead levels from concentrations of lead in air will prevent this parameter
from being useful as the only measure of occupational hazard. On the other hand,
recent studies have demonstrated a relatively good correlation between levels of
erythrocyte protoporphyrins and physiologic signs of lead exposure.
Among the recent studies which demonstrated adverse physiologic effects with
low-level lead exposure, reproductive failure, kidney function abnormalities, and
effects on the developing fetus are of major importance. Epidemiologic investi
gations suggest that the prevalence of these disorders may have been underesti
mated in the past, or not properly attributed to lead exposure. On the other
hand, retrospective studies of mortality among lead workers have failed to
clearly define a lead-associated elevation in any specific cause of death.
However, reported excesses of deaths in lead workers attributable to "chronic
nephritis or other renal sclerosis" and "other hypertensive disease" may, in
fact, have an etiological basis in lead nephropathy.
The literature on biological specimens clearly demonstrates that the micro
stick method for drawing capillary blood combined with any one of several micro
determinations by atomic absorption spectroscopy yields a screening procedure
XI-66

comparable in accuracy and precision to the NIOSH - recommended dithizone colori
metric procedure. The micro-determinations are also superior in the number of
samples which can be analyzed per day, the apparent analytical costs, and the
comfort to the worker. Several analytical possibilities exist, but no one
method is clearly superior. The favored choices are atomic absorption spectro
metry with graphite furnace, the Delves cup system using heparinized whole
blood, or carbon rod attachment using either heparinized blood, whole blood, or
the punched filter paper disc method. Anodic stripping voltametry also appears
a promising alternative analytical method to atomic absorption spectrometry, but
few references were found to document its practical utility.
Atmospheric sampling and analysis have also been evaluated in comparison to
the dithizone colorimetric procedure as recommended in the criteria document.
Several methods for micro-determinations appear promising, but documentation is
not as strong as with biological specimens. Atomic absorption spectrometry has
two potential applications for direct analysis of grab samples: (1 ) analyses of
filter samples collected according to the NIOSH document recommendations using
carbon cup, or (2 ) collection using spectral grade carbon crucibles and direct
AAS analyses on the crucibles. These methods, however, are not suitable for
integrated time-weighted sampling. An alternative, X-ray fluorescence spectro
metry, for direct analysis of sample filters, has excellent potential but does
not yet appear well enough documented.
XI-67
There are presently many unanswered questions regarding the dose-response
parameters of lead intoxication. Major areas of uncertainty generally relate to
the relationship between air lead exposure and blood lead levels, and the sig-I
nificance of specific blood lead values with respect to the development of
potentially adverse effects. With these concerns in mind, there is obviously a
pressing need for the development and validation of suitable biological moni
toring techniques which can reliably predict excessive lead absorption. The
emphasis in this case is on the concept of excessive absorption, as opposed to
lead absorption causing alterations which may be physiologically insignificant
(e.g., erythrocyte ALAD activity). In this regard, it appears that the assay of
erythrocyte protoporphyrins may prove a valuable tool in the prevention of lead
poisoning.
An area of great concern which has only recently received any systematic
attention is the effect of lead on reproductive function and fetal development.
Presently available data suggest that these processes may be among the most
sensitive to the detrimental effects of lead. The significance of adverse
effects on human reproduction demands the initiation of further investigation.
Moreover, the effects of lead upon renal function are poorly understood and also
require additional research.
It is unlikely that we will soon be able to fully evaluate the contribution
of the many factors involved in lead poisoning. Thus far, it is known that
dietary sources, physiological state, age, sex, and parameters of exposure
conditions (e.g., solubility, particle size) are all involved in the production
of lead intoxication. Properly designed studies may be able to more fully
characterize these relationships, while also identifying situations where
individuals may be at increased risk of poisoning.
VIII. RESEARCH NEEDS
XI-68
The literature search strategy employed in preparing this update consisted
of both computerized and manual techniques. Major reliance for bibliographic
information was placed on a computer-generated NIOSHTIC search. In order to
supplement this citation source, several steps were taken to insure that:
(1 ) all relevant articles would be retrieved, and (2 ) very recent articles of
relevance to the literature review would not be overlooked.
An on-line search using lead and related keywords (e.g., plumbism, pica,
ALAD, protoporphyrin) was undertaken using the following data bases:
1. Chemical Abstracts (1972 to December 1976)
2. U.S. National Technical Information Service (1972 to December 1976)
3. Biological Abstracts (1972 to December 1976)
4. Science Citation Index (1972 to December 1976)
5. National Library of Medicine - TOXLINE (1973 to December 1976)
In addition to the computer-readable data bases detailed above, a manual
search of Current Contents was conducted for the period November 1975 through
December 1976. Pertinent articles located by manual and computer searching
were examined to determine whether additional references could be located by
tree searching.
Appendix A - Literature Search
XI-69
References
1. National Institute for Occupational Safety and Health (1972), "Criteria for a Recommended Standard. . .Occupational Exposure to Inorganic Lead,"U.S. Nat. Tech. Inf. Serv., PB-214 265, Springfield, Virginia.
2. Lerner, S. (1975), "Blood Lead Analysis - Precision and Stability,"J. Occup. Med., .17.(3), 153-4.
3. Cooke, R.E., Glynn, K.L., Ullmann, W.W., Lurie, N . , and Lepow, M. (1974),"Comparative Study of a Micro-Scale Test for Lead in Blood, for Use inMass Screening Programs," Clin. Chem., 20(5), 582-5.
4. Bratzel, M.P., Jr. and Reed, A.J. (1974), "Microsampling for Blood-Lead Analysis," Clin. Chem., 20(2), 217-21.
5. Marcus, M., Hollander, M., Lucas, R.E., and Pfeiffer, N.C. (1975), "Micro-Scale Blood Lead Determinations in Screening: Evaluation of Factors Affecting Results," Clin. Chem., 21(4), 533-6.
6 . Cemik, A.A. (1974), "Determination of Blood Lead Using a 4.0 mm PaperPunched Disc Carbon Sampling Cup Technique," Brit. J. Ind. Med., 31, 239-44.
7. Rahn, K.A., Beke, G., and Windeis, G. (1974), "An Automatic Filter Changer for Collection of Short-Period High-Volume Aerosol Samples," Atmos. Environ., 8 , 635-43.
8 . Biles, B. and Ellison, J. M. (1975), "The Efficiency of Cellulose Fibre Filters with Respect to Lead and Black Smoke in Urban Aerosol," Atmos. Environ. , j), 1030-2.
9. Kahn, H.L. (1972), "The Use of Atomic Absorption in Analysis of the Environment," Annals of N.Y. Acad. Sei., 199, 145-60.
10. Sunderman, F.W., Jr. (1973), Atomic Absorption Spectrometry of TraceMetals in Clinical Pathology," Human Path., 4^(4), 549-82.
11. Murthy, L., Menden, E.E., Eller, P.M., and Petering, H.G. (1973),"Atomic Absorption Determination of Zinc, Copper, Cadmium, and Lead in Tissues Solubilized by Aqueous Tétraméthylammonium Hydroxide,"Analyt. Blochem. , J53, 365-72.
12. Koplto, L.E., Davis, M.A., and Shwachman, H. (1974), "Sources of Error in Determining Lead in Blood by Atomic Absorption Spectrophotometry,"Clin. Chem., 20(2), 205-11.
13. Berman, E. (1964), "The Determination of Lead in Blood and Urine by AtomicAbsorption Spectrophotometry," At. Absorp. Newsletter, Perkin-ElmerCorp., 3, 110.
XI- 70
14. Blanksma, L. (1968), "Atomic Absorption Method for Lead in Blood and Urine," Clinical Laboratory Diagnosis, 7th ed. (Lea and Febiger, Philadelphia, Pa.), 461.
15. Einarsson, 0. and Lindstedt, G. (1969), "A Non-Extraction Atomic Absorption Method for the Determination of Lead in Blood," Scan. J. Clin. Lab. Invest., 23, 367.
16. Kopito, L. and Shwachman, H. (1972), "Measurement of Lead in Blood, Urine, and Scalp Hair by Atomic Absorption Spectrophotometry," Stand. Methodsin Clin. Chem. , ]_, 151.
17. Delves, H.T. (1970), "A Micro-sampling Method for the Rapid Determinationof Lead in Blood by Atomic-absorption Spectrophotometry," Analyst, 95, 431-8.
18. Hicks, J.M., Gutierrez, A.N., and Worthy, B.E. (1973), "Evaluation of theDelves Micro System for Blood Lead Analysis," Clin. Chem., 19(3), 322-5.
19. Rose, G.A. and Willden, E.G. (1973), "An Improved Method for the Determination of Whole Blood Lead by Using an Atomic-absorption Technique,"Analyst, 9£J, 243-5.
20. Anderson, M.P. and Mesman, B.B. (1973), "Determination of Lead in Untreated Urine by the Delves Cup System," Am. Ind. Hyg. Assoc. J., 34, 310-4.
21. Torres, F. (1969), "Atomic Absorption Micro-Sampling of Lead, Cadmium,Indium, and Thallium in Urine," Report SC-69-784, Ind. Hyg. Div.,Sandia Laboratories, Albuquerque, New Mexico.
22. Evenson, M.A. and Pendergast, D.D. (1974), "Rapid Ultramicro Direct Determination of Erythrocyte Lead Concentration by Atomic Absorption Spectrophotometry, with Use of a Graphite-Tube Furnace," Clin. Chem.,20(2), 163-71.
23. Fernandez, F.J. (1975), "Micromethod for Lead Determination in Whole Blood by Atomic Absorption, with Use of the Graphite Furnace," Clin. Chem.,21(4), 558-61.
24. Baily, P. and Kilroe-Smith, T.A. (1975), "Effect of Sample Preparation on Blood Lead Values," Analyt. Chim. Acta, 77.» 29-36.
25. Mahin, D.T. and Lofberg, R.T. (1966), "A Simplified Method for Determination of Tritium, Carbon-14, or Sulfur-35 in Blood or Tissue by Liquid Scintillation Counting," Anal. Biochem., 16, 500-9.
26. Posma, F.D., Balke, J. , Herber, R.F.M., and Stulk, E.J. (1*975), "Microdetermination of Cadmium and Lead in Whole Blood by Flameless Atomic Absorption Spectrometry Using Carbon-Tube and Carbon-Cup as Sample Cell and Comparison with Flame Studies," Anal. Chem., 47(6), 834-8.
XI- 71

27. Ealy, J.A., Bolton, N.E., McElheny, R.J., and Morrow, R.W. (1974), Determination of Lead in Whole Blood by Graphite Furnace Atomic Absorption Spectrophotometry," Am. Ind. Hyg. Assoc. J., 35^ 566-70.
28. Kubasik, N.P. and Volosin, M.T. (1974), "Use of the Carbon Rod Atomizerfor Direct Analysis of Lead in Blood," Clin. Chem., 2()(2), 300-1.
29. Kubasik, N.P. and Volosin, M.T. (1973), "A Simplified Determination of Urinary Cadmium, Lead, and Thallium, with Use of Carbon Rod Atomization and Atomic Absorption Spectrophotometry," Clin. Chem., 19(9), 954-8.
30. Fox, A.J. and Sayers, M.H.P. (1973), "Accuracy and Precision of Two Methods of Blood Lead Estimation," Brit. J. Ind. Med., 3£, 394-5.
31. Mehkeri, K.A., Romanowski, M. and Smallbone, B. (1976), "Use of a FilterDisc Micro-Sampling Atomic Absorption Method for Blood Lead LevelScreening," Am. Ind. Hyg. Assoc. J., 541-5.
32. Bogden, J.D. and Joselow, M.M. (1974), "A Micro-Method for the Collectionand Analysis of Trace Metals by Paper-in-a-Cup Atomic Absorption Spectrophotometry," Am. Ind. Hyg. Assoc. J., 35, 88-92.
33. Kneip, T.J., Ajemian, R.S., Carlberg, J.R., Driscoll, J., Kornreich, L.,Loveland, J.W., Moyers, J.L., and Thompson, R.J. (1974), "Tentative Method of Analysis for Lead Content of Atmospheric Particulate Matter by Atomic Absorption Spectroscopy," Health Lab. Sci., 11(2), 122-7.
34. Woodriff, R. and Lech, J.F. (1972), "Determination of Trace Lead in the Atmosphere by Furnace Atomic Absorption," Analyt. Chem., 44(7), 1323-5.
35. Matousek, J.P. and Brodie, K.G. (1973), "Direct Determination of Lead Airborne Particulates by Nonflame Atomic Absorption," Analyt. Chem.,45(9), 1606-9.
36. Noller, B.N. and Bloom, H. (1975), "The Determination of Atmospheric Particulate Lead Using Low Volume Sampling and Non-Flame Atomic Absorption," Atmos. Environ. , j), 505-11.
37. Seeley, A.L. and Skogerboe, R.K. (1974), "Combined Sampling-Analysis Method for the Determination of Trace Elements in Atmospheric Particulates," Analyt. Chem., 4£(3), 415-21.
38. Human, H.G.C. and Norval, E. (1974), "The Determination of Lead in Blood by Atomic Fluorescence Flame Spectrometry," Analyt. Chim. Acta, 21* 73-80.
39. Yoakum, A.M., Stewart, P.L., and Sterrett, J.E. (1975), "Method Development and Subsequent Survey Analysis of Biological Tissues for Platinum,Lead, and Manganese Content," Env. Health Perspec. , 10, 85-93.
XI-72
40. Sugimae, A. (1974), "Emission Spectrographic Determination of Trace Elements in Airborne Particulate Matter," Analyt. Chem., 46^(8), 1123-5.
41. Searle, B., Chan, W., and Davidow, B. (1973), "Determination of Lead in Blood and Urine by Anodic Stripping Voltammetry," Clin. Chem., 19(1), 76-80.
42. Duic, L., Szechter, S., and Srinivasan, S. (1973), "Microdetermination of Lead in Blood: A Derivative Pulse Stripping Voltammetric Method,"Electroanal. Chem. Int. Electrochem., 41, 89-93.
43. Reisfeld, R., Levi, S., Greenberg, E., and Levene, W.J. (1975), "Microdetermination of Lead as Its Carminio Acid Complex by Reflectance Spectroscopy,"Analyt. Chim. Acta, J7j6, 477-82.
44. Skurié, Z., Valid, F., and Prpid-Marecid, J. (1974), "Microdetermination of Lead by a Fluorescent Ring-Oven Technique," Analyt. Chim. Acta, 21» 213-5.
45. Ronneau, C.J-M., Jacob, N.M., and Apers, D.J. (1973), "Detection of Lead in Air Filters at the Submicrogram Level," Analyt. Chem., 45.(12), 2152.
46. Ryan, D.E., Holzbecher, J. and Rollier, H. (1974), "The Determination ofTraces of Lead(II) by Solid-State Luminescence," Analyt. Chim. Acta.,23, 49-52.
47. Hammerle, R.H., Marsh, R.H., Rengan, K., Giauque, R.D., and Jaklevic, J.M. (1973), "Test of X-Ray Fluorescence Spectrometry as a Method for Analysis of the Elemental Composition of Atmospheric Aerosols," Analyt. Chem.,45(11), 1939-40.
48. Aras, N.K., Zoller, W.H., Gordon, G.E., and Lutz, G.J. (1973), "Instrumental Photon Activation Analysis of Atmospheric Particulate Material," Analyt.Chem., 45^(8), 1481-90.
49. Parsa, B. and Markowitz, S.S. (1974), "Determination of Lead in Atmospheric Air and in Aluminum by Helium-3-Induced Nuclear Reactions," Analyt. Chem.,46(2), 186-9.
50. Baloh, R.W. (1974), "Laboratory Diagnosis of Increased Lead Absorption,"Arch. Environ. Health, 2Ü, 198-208.
51. Garber, B. and Wei, E. (1973), "Lead Toxicity in Mice with Genetically Different Levels of 6-Aminolevulinic Acid Dehydratase," Bull. Env. Contam.Toxic. , 9., 80-3.
52. Roels, H., Lauwerys, R., Buchet, J-P., Berlin, A., and Smeets, J. (1974), "Comparison of Four Methods for Determination of 6-Aminolevulinic Acid in Urine, and Evaluation of Critical Factors," Clin. Chem., 20(7), 753-60.
53. Tomokuni, K. and Ogata, M. (1972), "Simple Method for Determination of Urinary 6-Aminolevulinic Acid as an Index of Lead Exposure," Clin. Chem.,18(12), 1534-6.
XI-73

54. Tomokuni, K. (1974), "6-Aminolevulinic Acid Dehydratase Test for Lead Exposure,"Arch. Environ. Health, 29., 274-81.
55. Tomokuni, K. (1974), "New Method for Determination of AminolaevulinateDehydratase Activity of Human Erythrocytes as an Index of Lead Exposure,"Clin. Chem., 20(10), 1287-91.
56. Kneip, T.J., Cohen, N . , and Rulon, V. (1974), "Potential Sources of AnalyticalError in the Erythrocytic 6-Aminolevulinic Acid Dehydratase Test for LeadExposure," Analyt. Chem., 46(12), 1863-6.
57. Lamola, A.A., Joselow, M., and Yamane, T. (1975), "Zinc Protoporphyrin(ZPP): A Simple, Sensitive, Fluorometric Screening Test for Lead Poisoning,"Clin. Chem., 2_1(1), 93-7.
58. Soulsby, J. and Smith, R.L. (1974), "A Simplified Method for the Quantitative Determination of Urinary Coproporphyrin in Lead Workers," Brit. J. Ind.Med. , n . 7 2 _4-
59. Mauzerall, D. and Granick, S. (1956), "The Occurrence and Determination of 6-Aminolevulinic Acid and Porphobilinogen in Urine," J. Biol. Chem., 219,435.
60. Davis, J.R. and Andelman, S.L. (1967), "Urinary Delta-Aminolevulinic Acid» (ALA) Levels in Lead Poisoning," Arch. Environ. Health, 15, 53.
61. Grabecki, J., Haduch, T., and Urbanowicz, H. (1967), "The Simple Method of Determination of 6-Aminolevulinic Acid in Urine," Int. Arch. Gewerbepathol. Gewerbehyg., 23, 226.
62. Lauwerys, R . , Delbroeck, R., and Vens, M. (1972), "Automated Analysis of Delta-Aminolevulinic Acid in Urine," Clin. Chim. Acta, 4(), 443.
63. Smulewicz, J.J. (1974), "Lead Lines at the Iliac Crest and "Early" Diagnosis of Lead Poisoning," Amer. J. Med. Sci. , 267(1), 49-51.
64. Lynam, D.R. (1975), "Lead Industries Association Position," J. Occup. Med., 17(2), 84-90.
65. Vitale, L.F., Joselow, M.M., Wedeen, R.P., and Pawlow, M. (1975), "Blood Lead - An Inadequate Measure of Occupational Exposure," J. Occup. Med.,17(3), 155-6.
6 6 . McRoberts, W. (1973), "Alteration in the Fractionated Blood Lead Concentrations in the Development of Inorganic Lead Poisoning, and the Conceptof the Role of "Lead Integration" in Lead Absorption," J. Soc. Occup. Med.,23, 3-18.
67. Oehme, F.W. (1972), "Mechanisms of Heavy Metal Toxicities," Clin. Tox.,5(2), 151-67.
XI-74
6 8 . Green, V.A., Wise, G.W., and Callenbach, J. (1976), "Lead Poisoning,"Clin. Tox. , 9/1), 33-51.
69. Lerner, S. (1975), "Blood Lead Analysis - Precision and Stability,"J. Occup. Med., 17(3), 153-4.
70. Smith, R.G. (1975), "Discussion of a Justification for NIOSH Recommended Biological Limits," J. Occup. Med., 17_(2), 97-9.
71. Lilis, R., Fischbein, A. (1976), "Chelation Therapy in Workers Exposed to Lead," J. Am. Med. Assoc., 235(26), 2823-4.
72. Goyer, R.A. and Mahaffey, K.R. (1972), "Susceptibility to Lead Toxicity,"Env. Health Perspec., Exp. Issue No. 2, 73-80.
73. Nelson, K.W. (1975), "Usefulness of Biologic and Air Standards for Lead,"J. Occup. Med., 17.(2), 113-4.
74. Stokinger, H.E. (1975), "Usefulness of Biologic and Air Standards for Lead,"J. Occup. Med., 17(2), 108-12.
75. Tola, S., Hernberg, S., Nikkanen, J. (1973), "Parameters Indicative of Absorption and Biological Effect in New Lead Exposure: A Prospective Study," Brit. J. Industr. Med., 30, 134-41.
76. Kawai, M. (1976), "Urinary Non-Precipitable Lead in Lead Workers," Brit.J. Industr. Med., 22» 187-92.
77. Lauwerys, R., Buchet, J.P., Roels, H.A., Materne, D. (1974), "Relationship Between Urinary 6-Aminolevulinic Acid Excretion and the Inhibition of Red Cell 6-Aminolevulinate Dehydratase by Lead," Clin. Tox., 2 ^ ) * 383-8.
78. Tola, S. (1973), "The Effect of Blood Lead Concentration, Age, Sex andTime of Exposure Upon Erythrocyte 6-Aminolevulinic Acid Dehydratase Activity," Work-Environm.-Hlth., 10, 26-35.
79. Wada, 0., Yano, Y., Ono, T., and Toyokawa, K. (1973), "The Diagnosis of Different Degrees of Lead Absorption; In Special References to Choice and Evaluation of Various Parameters Indicative of an Increased Lead Absorption," Ind. Health, 11, 55-67.
80. Haeger-Aronsen, B., Abdulla, M., and Frlstedt, B. (1974), "Effect of Lead on 6-Aminolevulinic Acid Dehydratase Activity in Red Blood Cells.II. Regeneration of Enzyme After Cessation of Lead Exposure," Arch. Environ. Health, 29, 150-3.
XI-75
81. Hernberg, S., Tola, S., Nlkkanen, J., and Valkonen, S. (1972), "Erythrocyte 6-Aminolevulinic Acid Dehydratase in New Lead Exposure," Arch. Environ. Health, 25, 109-13.
82. Hammond, P.B. (1976), "Air Standards for Lead and Other Metals," J. Occup.Med. , 18(5), 351-5.
83. Secchi, G.C., Erba, L. , Cambiaghi, G. (1974), "Delta-Aminolevulinic Acid Dehydratase Activity of Erythrocytes and Liver Tissue in Man," Arch. Environ. Health, 2j5, 130-2.
84. Gross, S.B., Tsay, J-Y., and Middendorf, M. (1976), "Kehoe Lead Balance Data in Humans: Variability," Toxicol. Appl. Pharmacol., ^7, 159-60.
85. Rabinowitz, M . , Wetherill, G.W., and Kopple, J.D. (1974), "Studies of Human Lead Metabolism by Use of Stable Isotope Tracers," Env. Health Perspec.,May, 145-53.
8 6 . Waldron, H.A. (1975), "Subclinical Lead Poisoning: A Preventable Disease," Prev. Med., 4̂, 135-53.
87. Chisolm, J.J., Jr., Barrett, M.B., and Harrison, H.V. (1975), "Indicators ^of Internal Dose of Lead in Relation to Derangement in Heme Synthesis,"The Johns Hopkins Med. J., 137, 6-12.
8 8 . Rosen, J.F. and Trinidad, E.E. (1974), "Significance of Plasma Lead Levelsin Normal and Lead-Intoxicated Children," Env. Health. Perspec., May, 139-44.
89. Reigart, J.R. and Whitlock N.H. (1976), "Longitudinal Observations of the Relationship Between Free Erythrocyte Porphyrins and Whole Blood Lead," Pediatrics, J37.(l), 54-9.
90. Angle, C.R. and Mclntire, M.S. (1974), "Red Cell Lead, Whole Blood Lead, and Red Cell Enzymes," Env. Health Perspec., May, 133-7.
91. Fllndt, M.L.H., King, E., and Walsh, D.B. (1976), "Blood Lead and Erythrocyte¿-Aminolevulinic Acid Dehydratase Levels In Manchester Taxi Drivers,"Brit. J. Ind. Med., 33, 79-84.
92. Prpic-Majic, D., Mueller, P.K., Lew, V.C., and Twiss, S. (1973), "¿-Aminolevulinic Acid Dehydratase (ALAD) Stability in Human Blood,"Am. Ind. Hyg. Assoc. J., 34(7), 315-9.
93. Tomokuni, K. (1975), "Different Behaviors of Erythrocyte 6-AminolevulinicAcid Dehydratase," Arch. Environ. Health, 30, 148-52.
94. Lauwerys, R.R., Buchet, J.-P., and Roels, H.A. (1973), "Comparative Studyof Effect of Inorganic Lead and Cadmium on Blood 6-Aminolevulinate Dehydratase in Man," Brit. J. Ind. Med., 30, 359-64.
XI-76

95. Hernberg, S., Tola, S., Nikkanen, J., and Valkonen, S. (1972), "Erythrocyte 6-Aminolevulinic Acid Dehydratase in New Lead Exposure," Arch. Environ. Health, 2_5, 109-13.
96. Secchi, G.C. and Alessio, L. (1974), "Laboratory Results of Some Biological Measures in Workers Exposed to Lead," Arch. Environ. Health, 2£, 351-4.
97. Barnes, J.R., Smith, P.E., and Drummond, C.M. (1972), "Urine Osmolality and 6-Aminolevulinic Acid Excretion," Arch. Environ. Health, Z5, 450-5.
98. Clark, K.G.A. (1976), "Erythrocyte Fluorescence and Lead Intoxication,"Brit. J. Ind. Med., 33, 193-5.
99. El-Dakhakhny, A.-A., and El-Sadik, Y.M. (1972), "Lead in Hair Among Exposed Workers," Am. Ind. Hyg. Assoc. J., 33.(1), 31-4.
100. Petering, H.G., Yeager, D.W., and Witherup, S.O. (1973), "Trace Metal Content of Hair. II. Cadmium and Lead of Human Hair in Relation to Age and Sex," Arch Environ. Health, 2]_t 327-30.
101. Golz, H.H. (1973), "EPA's Position on the Health Effects of Airborne Lead," J. Occup. Med., 13(4), 369-73.
102. Seppalainen, A.M., Tola, S., Hernberg, S., and Kock, B. (1975), "Subclinical Neuropathy at "Safe" Levels of Lead Exposure," Arch. Environ. Health,30, 180-3.
103. Chamberlain, M.J. and Massey, P.M.O. (1972), "Mild Lead Poisoning With an Excessively High Blood Lead," Brit. J. Industr. Med., 2£, 458-61.
104. Waldron, H.A. (1974), "The Blood Lead Threshold," Arch. Environ. Health,29, 271-3.
105. McLaughlin, M., Linch, A.L., and Snee, R.D. (1973), "Longitudinal Studies of Lead Levels in a US Population," Arch. Environ. Health, 27, 305-11.
106. Tomokuni, K. and Ogata, M. (1976), "Relationship Between Lead Concentration in Blood and Biological Response for Porphyrin Metabolism in Workers Occupationally Exposed to Lead," Arch. Toxicol., 35, 239-46.
107. Tomokuni, K., Osaka, I., and Ogata, M. (1975), "Erythrocyte Protoporphyrin Test for Occupational Lead Exposure," Arch. Environ. Health, 30, 588-90.
108. Sassa, G., Granick, J.L, Granick, S., Kappas, A., and Levere, R.D. (1973), "Studies in Lead Poisoning. I. Microanalysis of Erythrocyte Protoporphyrin Levels by Spectrophotometry in the Detection of Chronic Lead Intoxication in the Subclinical Range," Biochem. Med., 8., 135-48.
XI-77
109. RoeIs, H.A., Lauwerys, R.R., Buchet, J.P., and Urelust, M.T. (1975), "Response of Free Erythrocyte Porphyrin and Urinary 6-AminolevulinicAcid in Men and Women Moderately Exposed to Lead," Int. Arch. Arbeitsmed., 34, 97-108.
110. Piomelli, S . , Davidow, B., Guinee, V.F., Young, P., and Gay, G. (1973), "The FEP (Free Erythrocyte Porphyrins) Test: A Screening Micromethod forLead Poisoning," Pediatrics, 51, 254-9.
111. Mount Sinai School of Medicine of the City University of New York, Environmental Sciences Laboratory (1976) , "Lead Disease Among Workers in Secondary Lead Smelters," Report to the National Institute of Environmental Health Sciences, May 15.
112. Griffin, T.B., Coulston, F., Wills, H . , Russell, J.C., and Knelson, J.H. (1975), "Clinical Studies on Men Continuously Exposed to Airborne Particulate Lead," Env. Qual. and Saf., Supp. Vol. 2, 221-40.
113. Sakurai, H., Sugita, M. , and Tsuchiya, K. (1974), "Biological Response andSubjective Symptoms in Low Level Lead Exposure," Arch. Environ. Health,29, 157-63.
114. Landrigan, P.J., McKinney, A.S., Hopkins, L.C., Rhodes, W.W., Jr.,Price, W.A., and Cox, D.H. (1975), "Chronic Lead Absorption," JAMA,234(4), 394-7.
115. Stuik, E.J. (1974), "Biological Response of Male and Female Volunteers to Inorganic Lead," Int. Arch. Arbeitsmed., 32, 83-97.
116. Chamberlain, A.C., Clough, W.S., Heard, M.J., Newton, D . , Scott, A.N.B., and Wells, A.C. (1975), "Uptake of Inhaled Lead from Motor Exhaust," Postgrad. Med. J. , 5JL, 790-4.
117. Cooper, W.C. and Gaffey, W.R. (1975), "Mortality of Lead Workers,"J. Occup. Med., .17(2), 100-7.
118. Equitable Environmental Health, Inc. (1976), "An Epidemiological Study of Lead Chromate Plants: Final Report," prepared for The Dry ColorManufacturers Association, July, 1976.
119. Center for Disease Control (1975), "Increased Lead Absorption and Lead Poisoning in foung Children," J. of Pediatrics, 87(5), 824-30.
120. Taylor, W., Molyneux, M.K.B., and Blackadder, E.S. (1974), "Lead Over-Absorption in a Population of Oxy-gas Burners," Nature, 247, 53-4.
121. Chisolm, J.J., Barrett, M.B., and Mellite, E.D. (1975), "Dose-Effeet andDose-Response Relationships for Lead in Children," J. of Pediatrics, 87(6), 1152-60.
XI-78
122. Shannon, H.S., Williams, M.K., and King, E. (1976), "Sickness Absence of Lead Workers and Controls," Brit. J. Ind. Med., 33̂ , 236-42.
123. Whitfield, C.L., Ch'ien, L.T., and Whitehead, J.D. (1972), "Lead Encephalopathy in Adults," Am. J. Med., jv2, 289-98.
124. Segal, I., Saffer, D. , Segal, F. (1974), "Diverse Neurological Manifestatipns of Lead Encephalopathy," S.A. Med. J., 48(40), 1721-2.
125. Wedeen, R.P., Maesaka, J.K., Weiner, B., Lipat, G.A., Lyons, M.M., Vitale, L.F. , Joselow, M.M. (1975), "Occupational Lead Nephropathy," Am. J. Med., 59, 630-41.
126. Cramér, K . , Goyer, R.A., Jagenburg, R., and Wilson, M.H. (1974), "Renal Ultrastructure, Renal Function, and Parameters of Lead Toxicity in Workers with Different Periods of Lead Exposure," Brit. J. Ind. Med., 31, 113-27.
127. O'Riordan, M.L. and Evans, H.J. (1974), "Absence of Significant Chromosome Damage in Males Otcupationally Exposed to Lead," Nature, 247, 50-3.
128. Forni, A., Cambiaghi, G., and Secchi, G.C. (1976), "Initial Occupational Exposure to Lead," Arch. Environ. Health, 31/2), 73-8.
129. Petkau, A., Sawatzky, A., Hillier, C.R., and Hoogstraten, J. (1974),Lead Content of Neuromuscular Tissue in Amyotrophic Lateral Sclerosis:Case Report and Other Considerations," Brit. J. Ind. Med., 31, 275-87.
130. Westerman, M.P., Bruetman, M., and Pfitzer, E. (1974), "Lead Poisoning and Multiple Sclerosis," Arch. Environ. Health, 2£, 355-6.
131. Gershanik, J.J., Brooks, G.G., and Little, J.A. (1974), "Blood Lead Valuesin Pregnant Women and Their Offspring," Am. J. Obstet. Gynecol., 119(4),508-11.
132. Deknudt, Gh., Léonard, A., and Ivanov, B. (1973), Chromosome Aberrations Observed in Male Workers Occupationally Exposed to Lead," Environ. Physiol. Biochem., 3̂ , 132-8.
133. Bauchinger, M . , Schmid, E., Einbrodt, H.J., and Dresp, J. (1976),"Chromosome Aberrations in Lymphocytes After Occupational Exposure to Lead and Cadmium, " Mutation Res., 40, 57-62.
134. Fahim, M.S., Fahim, Z., and Hall, D.G. (1976), "Effects of Subtoxic LeadLevels on Pregnant Women in the State of Missouri," Res. Comm, in Chem.Path, and Pharm., 13(2).
135. Lancranjan, I., Popescu, H.I., Gavanescu, 0., Klepsch, I., and Serbanescu, M. (1975), "Reproductive Ability of Workmen Occupationally Exposed to Lead,"Arch. Environ. Health, 30, 396-401.
XI-79

136. Beattie, A.D., Moore, M.R., Goldberg, A., Finlayson, M.J.W., Graham, J.F., Mackie, E.M., Main, J.C., McLaren, D.A., Murdoch, R.M., and Stewart, G.T. (1975), "Role of Chronic Low-Level Lead Exposure in the Aetiology of Mental Retardation," Lancet, March 15, 589-92.
137. Landrigan, P.J., Whitworth, R.H., Baloh, R.W., Staehling, N.W., Barthel, W.F., and Rosenblum, B.F. (1975), "Neuropsychological Dysfunction in Childrenwith Chronic Low-Level Lead Absorption," Lancet, March 29, 708-12.
138. de la Burdg, B. and Choate, M.S. (1975), "Early Asymptomatic Lead Exposure and Development at School Age," Behav. Pediat., 87/4), 638-42.
139. Baloh, R., Sturm, R., Green, B., and Gleser, G. (1975), "Neuropsychological Effects of Chronic Asymptomatic Increased Lead Absorption," Arch. Neurol.,32, 326-30.
140. Lansdown, R.G., Shepherd, J., Clayton, B.E., Delves, H.T., Graham, P.J., and Turner, W.C. (1974), "Blood-Lead Levels, Behaviour, and Intelligence," Lancet, March 30, 538-41.
141. Morgan, B.B., Jr., and Repko, J.D. (1974), "Evaluation of Behavioral Functions in Workers Exposed to Lead," HEW Pub. No. (NIOSH) 74-126,248-66.
142. Green, M. and Gruener, N. (1974), "Transfer of Lead via Placenta and Milk," Res. Comm, in Chem. Path, and Pharm.., 8/4), 735-8.
143. Kostial, K. and Momcilovid, B. (1974), "Transport of Lead 203 and Calcium 47 from Mother to Offspring," Arch. Environ. Health, 23, 28-30.
144. Carpenter, S.J., Ferm, V.H., and Gale, T.F, (1973), "Permeability of the Golden Hamster Placenta to Inorganic Lead: Radioautographic Evidence,"Experientia, ^9/3), 311-13.
145. Brady, K., Herrera, Y . , and Zenick, H. (1975), "Influence of Parental Lead Exposure on Subsequent Learning Ability of Offspring," Pharm.Biochem. and Behav., 3̂ , 561-5.
146. Reiter, L.W., Anderson, G.E., Laskey, J.W., and Cahill, D.F. (1975), Developmental and Behavioral Changes in the Rat During Chronic Exposure to Lead," Env. Health Perspec., 12, 119-23.
147. Brown, D.R. (1975), "Neonatal Lead Exposure in the Rat: Decreased Learningas a Function of Age and Blood Lead Concentrations," Tox. and Appl. Pharm.,32, 628-37.
148. Sobotka, T.J., Brodle, R.E., and Cook, M.P. (1975), "Psychophyslologlc Effects of Early Lead Exposure," Toxicology, 5_, 175-91. ........
XI- 80
149. Silbergeld, E.K. and Goldberg, A.M. (1973), "A Lead-Induced Behavioral Disorder," Life Sciences, 13, 1275-83.
150. Michaelson, I.A. (1973), "Effects of Inorganic Lead on RNA, DNA and Protein Content in the Developing Neonatal Rat Brain," Tox. and Appl. Pharm., 26, 539-48.
151. Carson, T.L., Van Gelder, G.A., Karas, G.C., and Buck, W.B. (1974), "Slowed Learning in Lambs Prenatally Exposed to Lead," Arch. Environ. Health, 29, 154-6.
152. Scharding, N.N. and Oehme, F.W. (1973), "The Use of Animal Models for Comparative Studies of Lead Poisoning," Clin. Tox., 6/3), 419-24.
153. Center for Disease Control (1977), "Increased Lead Absorption in Children of Lead Workers - Vermont," Morbidity and Mortality Weekly Report, 26(8),.
153a. VanderKolk, A. and Schuman, M. (1976), "Lead Exposure Evaluation," Michigan's Occupational Health, Fall, 22/1), 1-3.
154. Baker, E.L., Jr., Folland, D.S., Taylor, T.A., Frank, M., Peterson, W., Lovejoy, G., Cox, D., Housworth, J., and Landrigan, P.J. (1977),"Lead Poisoning in Children of Lead Workers - Home Contamination with Industrial Dust," New Eng. J. Med., 296(5), 260-1.
155. Clasen, R.A., Hartmann, J.F., Coogan, P.S., Pandolfi, S., Laing, I., and Becker, R.A. (1974), "Experimental Acute Lead Encephalopathy in the Juvenile Rhesus Monkey," Environ. Health Perspec., Exp. Issue No. 7,175-85.
156. Griffin, T.B., Coulston, F., Wills, H., and Russell, J.C. (1975),"Biologic Effects of Airborne Particulate Lead on Continuously Exposed Rats and Rhesus Monkeys,” from Environmental Quality and Safety, Suppl.Vol. II., Coulston, F. and Korte, F. (eds.), Academic Press, New York,San Francisco, and London.
157. Goldstein, D.H., Kneip, T.J., Rulon, V.P., and Cohen, N. (1975), "Erythrocytic Aminolevulinic Acid Dehydratase (ALAD) Activity as a Biologic Parameter for Determining Exposures to Lead," J. Occup. Med., 17(3), 157-62.
158. Stowe, H.D., Goyer, R.A., Krigman, M.M., Wilson, M., and Cates, M. (1973), "Experimental Oral Lead Toxicity in Young Dogs," Arch. Pathol., 95, 106-16.
159. Maxfield, M.E., Stopps, G.J., Barnes, J.R., D'Snee, R., and Azar, A.(1972), "Effect of Lead on Blood Regeneration Following Acute Hemorrhage in Dogs," Am. Ind. Hyg. Assoc. J., 33/5), 326-37.
XI-81
160. Cardona, E. and Lessler, M.A. (1974), "Time Course of Hematologic ChangesDuring Chronic Lead Poisoning," Proc. Soc. Exp. Biol, and Med. 145,663-8.
161. Kao, R.L.C., and Forbes, R.M. (1973), "Lead and Vitamin Effects on Heme Synthesis," Arch. Environ. Health., 2]_, 31-5.
162. Hirsch, G.H. (1973), "Effect of Chronic Lead Treatment on Renal Function,"Toxic. Appi. Pharmacol., j25, 84-93.
163. Stevenson, A., Merali, Z., Kacew, S., and Singhal, R.L. (1976), "Effects of Subacute and Chronic Lead Treatment cm Glucose Homeostasis and Renal Cyclic AMP Metabolism in Rats," Toxicology, 6 ,̂ 265-75.
164. Rastogi, S.C. and Clausen, J. (1976), "Absorption of Lead Through the Skin," Toxicology, 6_, 371-6.
165. Gainer, J.H. (1974), "Lead Aggravates Viral Disease and Represses the Antiviral Activity of Interferon Inducers," Environ. Health Perspec.,7_, 113-9.
166. Varma, M.M., Joshi, S.R., and Adeyemi, A.O. (1974), "Mutagenicity and Infertility Following Administration of Lead Sub-Acetate to Swiss Male Mice," Experientia, _30(5), 486-7.
167. Hughes, W.F. and Coogan, P.S. (1974), "Pathology of the Pigment Epithelium and Retina in Rabbits Poisoned with Lead," Am. J. Pathol., 72, 237-54.
168. Hsu, F.S., Krook, L., Shively, J.N., and Duncan, J.R. (1973), "Lead Inclusion Bodies in Osteoclasts," Science, 181, 447-8.
169. Carson, T.L., Van Gelder, G.A., Buck, W.B., Hoffman, L.J., Mick, D.L., and Long, K.R. (1973), "Effects of Low Level Lead Ingestion in Sheep,"Clin. Tox., 6(3), 389-403.
170. Port, C.D., Baxter, D.W., and Richter, W.R. (1974), "The Mongolian Gerbil as a Model for Lead Toxicity," Am. J. Pathol., 76, 79-94.
171. Kobayashi, N. and Okamoto, T. (1974), "Effects of Lead Oxide on the Induction of Lung Tumors in Syrian Hamsters," J. Nat. Cancer Inst., 5^(5), 1605-8.
172. Hopkins, A.P. and Dayan, A.D. (1974), "The Pathology of Experimental Lead Encephalopathy in the Baboon (Papio anubis)," Brit. J. Ind. Med., 31, 128-33.
173. Hemberg, S. (1973), "Prevention of Occupational Poisoning from Inorganic Lead," Work-Environm.-Hlth., 10, 53-61.
174. Bridbord, K. and Blejer, H.P. (1976), "Prophylactic Chelation Therapy in Occupational Lead Poisoning: A Review," prepublication draft, Dec. 15, 1976, National Institute for Occupational Safety and Health and City of Hope Medical Center.
XI- 82
175. Jugo, S., Maljkovi6 , T. and Kostial, K. (1975), "The Effect of Chelating Agents on Lead Excretion in Rats in Relation to Age," Environ. Res., 10,271-9.
176. Hammond, P.B. (1973), "The Relationship Between Inhibition of 6-Aminolevulinic Acid Dehydratase by Lead and Lead Mobilization by Ethylenediamine Tetraacetate (EDTA)," Toxicol. Appl. Pharmacol., 26, 466-75.
177. Hammond, P.B. (1973), "The Effects of D-Penicillamine on the Tissue Distribution and Excretion of Lead," Toxicol. Appl. Pharmacol., Z6 , 241-6.
178. McClain, R.M. and Becker, B.A. (1975), "Teratogenicity, Fetal Toxicity, and Placental Transfer of Lead Nitrate in Rats," Toxicol. Appl. Pharmacol.,31, 72-82.
XI-83
175. Jugo, S., MaljkoviC, T. and Kostial, K. (1975), "The Effact of Chelating Agents on Lead Excretion in Rats in Relation to Age," Environ. Res., 10,271-9.
176. Hammond, P.B. (1973), "The Relationship Between Inhibition of 5-Aminolevulinic Acid Dehydratase by Lead and Lead Mobilization by Ethylenediamine Tetraacetate (EDTA)," Toxicol. Appl. Pharmacol., 2!6, 466-75.
177. Hammond, P.B. (1973), "The Effects of D-Penicillamine on the Tissue Distribution and Excretion of Lead," Toxicol. Appl. Pharmacol., 21» 241-6.
178. McClain, R.M. and Becker, B.A. (1975), "Teratogenicity, Fetal Toxicity, and Placental Transfer of Lead Nitrate in Rats," Toxicol. Appl. Pharmacol.,31, 72-82.
179. Joselow, M.M. and Flores, J. (1977), "Application of the Zinc Protoporphyrin (ZP) Test as a Monitor of Occupational Exposure to Lead,"An. Ind. Hyg. Assoc. J., (38), 63-6.
180. A Report of Recent Medical Studies of Five U.S. Lead Plants (March 1977), Bureau of Epidemiology and National Institute for Occupational Safety and Health, Center for Disease Control, Dept, of Health, Education, and Welfare.
181. Conradi, S., Ronnevl, L-0, and Vesterber, 0. (1976), "Abnormal Tissue Distribution of Lead in Amyotrophic Lateral Sclerosis," J. Neurological Sci., .29, 259-65.
182. Crable, J.V. and Taylor, D.G. (1974), "Laad in Air," PiCAM 155, NIOSH Manual of Analytical Methods, HEW Publication No. (NIOSH) 75-121,Supt. of Documents, USG-PO, Washington, D.C. 20402.
183. Ibid, "Lead in Blood and Urine," PiCAM 101.
184. Ibid, "Lead in Blood and Urine," P&CAM 101,
185. National Institute for Occupational Safety and Health, Physical and Chemical Analysis Branch, "Laad in Blood and Urine, P&CAM 262."
XI-84

XII - Appendix V
Statement of
Edward J. Baier, Deputy Director National Institute for Occupational Safety and Health
Center for Disease Control Department of Health, Education, and Welfare
Before the
Department of Labor Occupational Safety and Health Administration Public Hearing on Occupational Lead Standard
March 1977
XII-1

I welcome this opportunity to appear here today to discuss the
effects of occupational lead exposure upon human health including the
results of recent NIOSH studies of lead workers. With me today are
the following: Dr. Kenneth Bridbord, Office of Extramural
Coordination and Special Projects, Dr. Edward Baker, Bureau of
Epidemiology, Dr. Theodore Thoburn, Division of Surveillance, Hazard
Evaluation and Field Studies, Mr. John Bryant, Division of Physical
Sciences and Engineering, and Mr. Robert Schütz, Testing and
Certification Branch.
As early as the first century A.D., lead was recognized as an
occupational hazard, but it was not until the 1800's, however, that
systematic studies were conducted on health effects of lead exposure.
Symptoms associated with excessive lead absorption have been
documented in painters, printers, potters and glass workers. Exposure
to excessive quantities of lead is known to have significant effects
on the kidney, the peripheral and central nervous systems, and the
hematopoietic system.
NIOSH estimates that more than 1 million American workers are
occupationally exposed to lead. Some of the highest exposures are
likely to occur in industrial processes such as primary and secondary
lead smelters and lead battery operations. Lead exposure occurs in
more than 100 other occupations. Relatively high exposures can be
encountered in occupations such as welding, metal burning, painting
and printing, and lower exposures occur among workers exposed to the
XII-2

handling or combustion of gasoline containing lead additives. These
occupational exposures increase the underlying "body burden of lead
which is derived from ambient air, food, and water. Not included in
our estimates are workers exposed to lead in mining, crushing, and
milling operations, for which the Department of the Interior has
regulatory responsibility.
Occupational exposure to inorganic lead was high on the NIOSH
list of priorities and was the subject of one of the first criteria
documents we issued. The criteria document, dated in 1972 and trans
mitted to the Occupational Safety and Health Administration (OSHA) in
January, 1973, recommended reducing the existing Federal standard for
maximum lead concentration from 200 to 150 micrograms per cubic meter
of air as a time weighed average (TWA) exposure for an 8-hour workday,
40-hour workweek. In August, 1975 NIOSH recommended this level be3reduced below 150 ug/m . NIOSH felt at the time that available data
3were not sufficient to define precisely how much below 150 ug/m the3air lead concentration should be set, although a level below 50 ug/m
was not felt to be necessary. In October, 1975, OSHA proposed a3standard of 100 ug/m .
There is no existing OSHA standard for maximum permissible blood
lead levels. For that matter, there is no existing biological stand
ard for any substance in the workplace. The 1972 criteria document
recommended a biological standard of 80 ug per 100 grams of whole
blood in adults. In 1975, NIOSH recommended reducing the maximum
XII-3
permissible level to 60 ug/100 g and that level was proposed by OSHA
in October 1975.
In testimony last March before the Subcommittee on Manpower, Com
pensation, and Health and Safety, House Committee on Education and
Labor, the Director of NIOSH reviewed the occupational lead problem
and also sharply criticized the routine, prophylactic use of chelating
agents in workers continually exposed to lead. Since that testimony,
the Food and Drug Administration circulated warnings to practicing
physicians throughout the country against prophylactic chelation, and
OSHA also took action against this practice. Today, NIOSH wants to
reiterate its concerns about prophylactic chelation. While NIOSH
believes that the use of chelating agents may be justified in acute
lead intoxication, the evidence does not exist t:o justify their use on
a prophylactic basis. A further evaluation of the chelating agent
problem is being submitted for the record with this testimony.
The toxicology and metabolism of lead have been extensively
studied. Inorganic lead is absorbed from the lungs and the digestive
tract. Lead is transported in the blood throughout the body. Lead is
stored in the bones and affects the bone marrow, causing an
interference in the production of hemoglobin which can lead to anemia.
The interference with the synthesis of heme causes an accumulation of
heme precursors in the blood, which are useful for measuring the
degree of lead intoxication, as well as the quantity of lead absorbed
into the body. It is apparent from the analysis of heme precursors
XII-4
that lead interferes in at least two sites in the hemoglobin synthesis
pathway. At one site lead interferes with the enzyme aminolevulinic
acid dehydrase (ALAD) leading to an increase of aminolevulinic acid
(ALA) which can be measured in the urine. Lead interferes with the
incorporation of iron into the protoporphyrin ring, resulting in an
accumulation of protoporphyrins in the blood. The protoporphyrins may
be measured as free erythrocyte protoporphyrin (FEP) by extraction
from the red blood cells, or are measured directly in the blood in the
form of zinc protoporphyrin, or ZPP. FEP and ZPP thus measure the
same biological phenomenon.
In addition to the bone, lead is also stored in other vital
organs and tissues including the kidneys and the nervous system. Lead
can be mobilized from various storage sites and excreted from the
intestinal tract and the kidneys.
Repeated exposure to lead can result in accumulation in the
amount of lead stored in the body. Continued chronic exposures to
high levels of lead, even intermittent, can cause death or permanent
damage to the nervous system, serious damage to the kidneys and
impairment of red blood cell production. Once the kidneys are damaged
by lead, the ability of the body to excrete lead through the kidneys
is impaired, thus making lead in urine a poor screening test for lead
absorption.
rii-b
Workers exposed to excessive levels of lead may feel weak, tired,
and irritable. They may experience trembling, severe colic and
digestive disturbances, and convulsions. A characteristic sign of
severe lead poisoning is "wrist drop", caused by damage to the nerves
controlling the extensor muscles of the forearm, wrist and fingers.
Of considerable concern are the effects resulting from long-term
lead exposure. There is evidence that prolonged exposure can increase
the risk of nephritis, mental deficiency, premature aging, and high
blood pressure.
Another category of adverse effects includes the so-called
"subclinical" changes produced by lower exposures to lead. These
changes are generally measured only by laboratory tests and would not
necessarily be evident by routine physical examination. These workers
may have early damage to the nervous system, muscular weakness,
behavorial disturbances, and interference with red blood cell pro
duction. The use of the* term "subclinical", however, does not mean
that these changes are without significance from a health point of
view.
One of the most frequently measured of these "subclinical"
changes is the excretion of ALA in the urine. Increased excretion of
ALA in the urine is observed in workers as blood lead levels rise
above ¿0 to 50 ug/100 g. A report by a National Academy of Science
committee studying the effects of airborne lead concluded that this
XII-6
increased excretion is significant. Another National Academy of
Science committee, this time studying the effects of lead poisoning in
children, concluded that . . . ."environmental limits set to prevent
reversible effects in the hematopoietic system should serve to prevent
potentially irreversible effects in the nervous system."
Perhaps the most frequently employed measure of lead absorption
into the body is the quantity of lead in the blood. Most clinical
measures of lead toxicity have been related to blood lead
measurements. One of the greatest difficulties with the measurement
of blood leads is the high level of skill required in analytical
techniques and the great care demanded to avoid the risk of sample
contamination by lead or of lead loss. The proficiency record of
laboratories in blood lead determinations has at times been less than
adequate as shown by a recently completed Center for Disease Control
(CDC) study of commercial clinical laboratories. It was disturbing to
find that only one-third of all commercial laboratories in this study
performed acceptably, but it is encouraging that in another CDC
proficiency testing survey about two-thirds of State and public
laboratories did perform well. A copy of the commercial laboratory
proficiency testing study is being submitted for the hearing record.
The poor record of commercial laboratories on blood lead testing is
but one of the reasons why NIOSH opposses setting an occupational lead
standard based solely upon blood lead levels.
XII-7
In contrast to blood lead, the ZPP test offers certain
advantages. For example, ZPP is a relatively stable indicator
reflecting lead absorption over a several month period; ZPP does not
suffer from problems of lead contamination or lead loss; and ZPP
provides an index not only of lead absorption, but also of lead
effect. A major advantage of the ZPP test is that rapid, reliable and
economic instruments are available which allow instantaneous readout
of ZPP tests following finger stick blood specimens. One of the major
problems with ZPP is that this is a very recently developed test and
only limited data are available on blood lead-ZPP correlations.
Further, ZPP may present calibration problems, and careful attention
must also be given to quality control procedures. Under these
circumstances, it would seem wise to develop a biologic screening
approach which incorporates ZPP or an equivalent screening test with
blood lead determinations. Provisions for biologic monitoring must,
however, be accompanied by specific quality control requirements.
Another reason why’ NIOSH opposes setting an occupational standard
based solely on biologic monitoring is that this would discourage the
development and implementation of adequate engineering controls and
would place undue reliance upon personal protective equipment such as
respirators. NIOSH believes it is necessary to reiterate its basic
recommendation that employee exposure should be reduced to the lowest
possible level by use of engineering controls. Respirators may be
used to protect employees while engineering controls are being
installed or to temporarily supplement such controls. NIOSH does not
XII-8

recommend continual respirator use as the primary method of control
ling any employee's exposure. Respirators must be regarded as
temporary solutions to problems or as devices available for emergency
respiratory protection, not as permanent answers to employee exposure.
A list of respirator requirements for the lead standard is being
submitted for the record.
NIOSH endorses the concept of an occupational standard for lead
which includes provisions for both environmental and biological
monitoring. For example, air lead determinations can help to prevent
excess lead absorption. The principal advantage of an air lead
determination is to prevent excessive exposure. Since lead is
absorbed by routes in addition to inhalation, a biological measure of
lead absorption is necessary.
NIOSH's concern about the lead problem is evidenced by our
continuing research and health hazard evaluations and other activities
in lead operations. NIOSH is currently updating the lead criteria
document. NIOSH and the Bureau of Epidemiology, Center for Disease
Control (CDC), have conducted comprehensive occupational surveys of
lead exposure at primary and secondary lead smelters. The largest of
these studies, undertaken in response to requests by union
representatives and state health officials, was conducted at a primary
lead smelter at Kellogg, Idaho, and involved about 500 workers.
Within approximately the last year NIOSH-CDC has examined nearly 1,000
workers occupationally exposed to lead, including those at Kellogg.
XII-9
An interim report of our results from certain aspects of the Kellogg
study is being submitted for the record as are results from other
recently completed NIOSH-CDC lead studies. These studies included
investigations at a secondary lead smelter in Memphis, Tennessee; a
lead chemicals plant in Joplin, Missouri; a secondary lead smelter in
Salt Lake City, Utah; a secondary lead smelter in Eagen, Minnesota,
and a secondary lead smelter in Atlanta, Georgia. In addition, NIOSH
has also supported other lead studies such as the investigation of a
secondary lead smelter at Vernon, California, to be presented later at
these hearings by scientists at the Mount Sinai School of Medicine.
This study is being submitted for the record by NIOSH.
Among the major findings of our studies are the following:
First, epidemiologic studies of workers at 5 different lead
plants across the U.S. have shown unacceptably high blood lead levels
and symptoms of lead poisoning in every plant studied. Hematologic,
neurologic, and renal damage due to lead were also encountered.
Inappropriate medical practices were noted including the misuse of
oral chelating drugs and the allowing of lead-poisoned workers to
continue to be exposed to lead during chelation therapy.
Second, the usefulness of monitoring blood lead and/or
protoporphyrin levels as indicators of lead toxicity was clearly shown
by the high degree of correlation between these measurements and the
XII-10
signs and symptoms of lead toxicity. The newly developed portable
method of zinc protoporphyrin (ZPP) determination has been shown to be
a promising method of screening lead-exposed workers.
Third, in several locations, home contamination with lead dust
from lead plants resulted in increased lead absorption among workers'
children; and in one location several cases of lead poisoning were
observed. These studies illustrate the importance of good work
practices such as not bringing contaminated work clothes and shoes
home and showering before going home, and other practices minimizing
exposure to the worker and to his Or her family.
Fourth, chronic neurologic and renal effects of lead exposure
were demonstrated in our studies. Neuropathy was noted at a
relatively low blood lead level (81ug/100 ml) and after only 2 months
of exposure. Abnormal glomerular function (elevated blood urea
nitrogen and creatinine levels and decreased glomerular filtration
rates) and abnormal tubular function (impaired urinary concentrating
ability and reduced lead clearance rates) were noted in lead workers.
These studies clearly demonstrated an increase in symptoms compatible
with lead intoxication and a decrease in hemoglobin concentrations as
blood lead levels rise above 60 ug/100 ml.
These findings emphasize the need for improved industrial hygiene
measures in the lead industry and the importance of biological
monitoring in preventing lead toxicity. Based on the data contained
XII-11
in these studies, a blood lead standard no higher than 60 ug/100 ml is
recommended. These data clearly establish the need to reduce the
maximum blood lead levels for an individual worker from 80 ug/100 ml
to 60 ug/100 ml. A blood lead level of 60 ug/100 ml is equivalent to
a blood lead level of 57 ug/100 g, but this difference is well within
the analytic variability for blood lead determinations. The decreased
urinary lead excretion observed in workers with evidence of kidney
damage ar,gues against the retention of urinary lead as a screening
test.
The results from these studies demonstrate that workers in this
country are being exposed to high concentrations of lead in the air
and are absorbing dangerous amounts of lead into their bodies. This
is occurring despite the fact that hazards of lead exposure are well
recognized and technology to reduce these hazards is, in our opinion,
available.
This situation clearly demonstrates the inadequacy of current
OSHA compliance programs aimed at reducing lead exposure. Data on
lead compliance activities supplied to us from OSHA further confirm
the inadequate enforcement of the existing lead standard. The fact
that these compliance programs are inadequate reflects a lack of
vigorous enforcement of the existing lead standard, not a lack of
knowledge of how to control the lead hazard.
XII-12
Data supplied to us from General Motors involving a lead battery
plant at Muncie, Indiana, clearly demonstrate what can be done to
control lead exposure at an older battery plant. The majority of
departments tested at this plant had average air lead exposures during31976 below 100 ug/m based upon personal monitors. Blood lead levels
in over 90% of the workers were 60 ug/100 ml or lower. Average
exposures at this plant using personal monitors were below 1003 3ug/m in the assembly areas and below 150 ug/m in the oxide pasting
and grid casting areas.
If blood lead levels are used as criteria for technical
feasibility, the data reported recently from Finland are especially
encouraging. Assuming that keeping 90% or more of individual blood
lead levels at 60 ug/100 g or lower is a good indication of technical. 3feasibility to meet a 100 ug/m standard and, assumbing that respira
tors were not generally used in these industries, then, the following
industries or operations in Finland have clearly demonstrated such
feasibility: crystal glass manufacturing, car radiator repair, lead
glazing, cable manufacturing, scrap metal shop work, car repair,
machine shop work, aluminum manufacturing, sheet metal work, paint
manufacturing, shipbuilding, iron and steel founding, painting,
service station work, plumbing, manufacturing electric lamps,
telephone repair and installation, manufacturing radio and telephone
equipment, and traffic police work.
X I I - 1 3
The Finnish experience also confirms what is generally known in
the United States, i.e., that lead scrap smelting and storage battery
manufacturing present significant problems with respect to lead
absorption, but not problems which are insurmountable.
One of the important issues to be considered at this hearing
involves the relationship between exposure to lead in air and
absorption of lead into the body, measured in terms of blood lead
level. The OSHA proposal concluded that in order to keep blood lead
levels in individual workers below 60 ug/100 g, air lead levels would3have to be reduced below 100 ug/m , caculated as an 8-hour time
weighed average, 40-hour workweek. The data available to NIOSH
generally support this conclusion.
The basis for our agreement with this earlier assessment is
spelled out in two attachments to this testimony. One attachment
reviews the published studies relating blood lead levels to air lead
exposure covering primarily the equivalent occupational exposure range 3up to 50 ug/m . This assessment, based on about 10 studies, concluded
that to keep blood lead levels in male workers below 40 ug/100 g, air. 3lead exposures have to be kept under 50 ug/m . An additional
observation from the general population is that men have higher blood
lead levels than women with comparable environmental exposures. The
reason for this is not clearly understood. The second assessment
involves an extensive analysis of air lead and blood lead data at the
General Motors battery plant at Muncie. These important data indicate
X I I -1 4
that a good correlation exists between air lead exposure (especially
when based on personal samplers) and blood lead over a range of air
leads up to about 200 ug/m . These data further indicate that if
yearly average personal sampler air lead exposure in a department is
kept below 100 ug/m , yearly average blood leads in over 90% of
workers will be under 60 ug/100 ml. Similarly, if yearly average3
personal sampler air leads in a department are kept under 50 ug/m ,
yearly average blood leads will be 40 ug/100 ml or lower over half of
the workers. One of the greatest impacts of reducing lead exposure in. 3air from 2 0 0 to 1 0 0 ug/m is a great increase in the number of workers
with blood lead levels 40 ug/100 ml or lower.
In reviewing the relationship between air lead exposure and blood
lead level, it is also apparent that a linear relationship between air
lead and blood lead does not occur over the whole range of exposures.
Incremental changes in air lead exposure in the range up to 100
ug/m produce greater increases in blood lead than do similar3increases in the range from 1 0 0 - 2 0 0 ug/m .
A problem of special significance in setting a lead standard, in
part because of our national commitment to equal employment
opportunity, is the concern for female employees of childbearing age.
Lead absorbed in the bloodstream of pregnant women can cross the
placenta and enter the blood of the fetus where it may cause
neurologic damage to the child. Lead is also found in mothers' milk.
Other special concerns are susceptible workers known to have certain
XII-15
clinical conditions such as kidney problems, neurologic disorders, and
anemias. Enzyme disorders and inherited hemoglobin abnormalities may
also pose a similar problem.
Adequate data do not currently exist to estimate what percentage
of the workforce is made up of individuals with increased suscepti
bility to lead intoxication. Blood lead levels required to adequately
protect susceptible individuals are not well established. The fact
that certain individuals may be more susceptible to lead effects is an
argument for setting a blood lead standard to protect against early
biochemical changes induced by lead. Protecting against these earlier
changes will hopefully assure protection against the more serious and
potentially irreversible lead effects, even in susceptible
individuals. Women show early abnormalities in heme synthesis at
lower blood leads than men, and show greater abnormalities in heme
synthesis at the same blood lead level as men. Conversely, women in
the general population tend to have lower blood lead levels than men
exposed to similar environmental levels. NIOSH does not believe that
adequate data exist to fully evaluate whether women per se are more
susceptible than men to lead effects.
The real issue of susceptibility to lead and women involves
effects of lead upon the fetus. NIOSH does not recommend that women
of childbearing age be excluded from work involving exposure to lead,
but NIOSH does recommend that present and future lead standards be
XII-16
vigorously enforced as one way to provide additional protection to the
fetus.
The issues of lead reproductive effects on men, as well as women,
chromosomal damage, and lead carcinogenicity were discussed in a
recent Department of Health, Education and Welfare report dealing with
human health consequences due to lead exposure from automobile
emissions. A copy of this report is being submitted for the record.
The data on chromosomal damage among workers occupationally exposed to
lead provide contradictory results, and no clearcut conclusions can be
drawn. The data on carcinogenicity are also not substantial enough to
consider lead a human carcinogen, although lead remains a suspect
carcinogen based upon limited animal data. Further studies could, of
course, change this conclusion.
Historic data involving undoubtedly very high exposures document
that lead compounds can be used as abortifacients and that women
occupationally exposed to lead have increased miscarriage rates. Lead
is known to cross the placenta and lead concentrations in maternal
blood and fetal/newborn blood correlate with each other, with newborn
blood lead levels being somewhat lower. Recent studies have shown
that blood lead levels between 50 and 80 ug/100 ml are associated with
diminished fertility of male workers based upon analysis of sperm.
What is not clear, is precisely the level of blood lead ‘in the mother
or father which would protect against lead effects in the newborn,
including those involving the nervous system. Limited data in
XII-17
experimental animals suggest that blood lead levels in the 35 to 45
ug/100 g range at birth may be associated with subtle neurologic
damage. Data from young children suggest that the risk of neurologic
damage increases as blood lead levels rise above 40 ug/100 g. Among
the factors which make extrapolation of these data to precise
standards difficult are the relative hemoconcentration of the newborn,
the relative hemodilution of the pregnant woman and the possibility,
not proven, of mobilization of lead from the skeleton during
pregnancy. The fact that a nursing infant can be exposed to lead via
mother's milk is an additional complicating factor.
The existence of potentially susceptible groups to lead, the
possibility of damage to the fetus at blood lead levels in the 30 to
40 ug/100 g range and the possibility of damage to male germ cells at
blood lead levels of about 50 ug/100 ml present difficult questions in
recommending biologic standards for lead absorption.
Studies suggesting the need for establishing a blood lead
standard at less than 60 ug/100 g would place considerable emphasis
upon a limited number of observations which have not been confirmed by
multiple investigators. To do this would place the recommendation of
a blood lead level in the workplace on less firm ground than if NIOSH
continued to endorse a blood lead maximum of 60 ug/100 g. The opinion
of the Institute is to adhere to its earlier recommendation, i.e., 60
ug/100 g particularly since recent studies clearly support the need to
reduce blood lead levels from 80 to 60 ug/100 g.
X I I - 1 8
In adhering to the 60 ug/100 g figure, NIOSH has not relinquished
its concern for possible effects that may occur below 60 ug/100 g.
Adherence to this 60 ug/100 g figure should not be interpreted as firm
NIOSH opposition to establishing a lower blood lead standard. In
fact, NIOSH endorses a lower blood lead standard as a future goal to
provide greater assurances of safety. The OSHA proposal would
establish an action level of 50 ug/m^ for lead in air. As notedOabove, exposures of 50 ug/m or less would keep blood lead levels in
virtually all workers at about 40 ug/100 g or lower. This should
protect against "subclinical" effects of lead including the
hematopoietic system and against other potential effects of lead as
noted above. For workers exposed above the action level but below the3
maximum air lead level of 100 ug/m , NIOSH endorses a vigorous medical
surveillance program involving, for example, ZPP testing or other
screening tests 'to identify workers with blood lead levels of 40
ug/100 g or higher. This 40 ug/100 g figure corresponds to a
biological "action level". Workers with blood lead levels of 40
ug/100 g or higher should have periodic medical exams to identify, as
early as possible, any adverse effects which may occur. Such a
program of medical surveillance will also help to identify workers who
may be highly susceptible to lead effects. NIOSH estimates that even
at the proposed air standard of 100 ug/m , less than half of the
workers will have blood lead levels above 40/100 g.
Before closing our formal presentation, I should like to list the
additional information which NIOSH is now submitting for the record.
XII-19
Letter from Director, NIOSH to Acting Deputy Assistant Secretary, OSHA, August 4, 1975.
A report of recent medical studies of five U.S. lead plants.
Initial report of an investigation of employees of a secondary lead smelter in Vernon, California.
Interim report on analysis of blood and air lead data from General Motors, Delco Battery Plant, Muncie, Indiana.
A report on the relationship between air lead exposure and blood lead levels in occupational situations.
Summary report on proficiency testing of blood lead, 1976.
A review of the recent literature concerning the relationship of free erythrocyte protoporphyrin, zinc protoporphyrin and blood lead level.
A review of prophylactic chelation therapy in occupational lead poisoning.
Recommendations for respirator selection.
Follow-up of a health hazard evaluation, involving lead exposure and kidney disease.
Supplemental information on sampling and analytic procedures and engineering control technology.
Interim report on Bunker Hill Study.
Report on human health consequences due to lead exposure from automobile emissions.
Recommendations for the prevention of lead poisoning in children.*
We are now ready to respond to questions concerning our prepared remarks or the backup material submitted for the record.
*A copy of these above listed attachments to the testimony may be obtained from the National Technical Information Service» Springfield, Virginia 22161, PB281735/AS.
i*U .S. GO V ERN M EN T PR IN TIN G OFFICE:! 9 8 7 -7*4 8 - 1 2 2 / 6 0 5 1 0
XII-20

D E P A R T M E N T O F HEALTH, EDUCATION, A N D W E L F A R E
PUBLIC HEALTH SERVICE
C E N T E R F O R D I S E A S E C O N T R O L
N A T I O N A L I N S T I T U T E F O R O C C U P A T I O N A L S A F E T Y A N D H E A L T H
R O B E R T A. T A F T L A B O R A T O R I E S
4 6 7 6 C O L U M B I A P A R K W A Y , C I N C I N N A T I . O H I O 4 5 2 2 6
OFFICIAL BUSINESS
P E N A L T Y F O R P R I V A T E U S E . $ 3 0 0
P O S T A G E A N D F E E S P A I D
U . S . D E P A R T M E N T O F H . E . W
H E W 3 9 6
DHEW (NIOSH) Publication No. 78-15 8


![Enhancement of the heat conduction performance of boron ...kjc.njfu.edu.cn/uploads/file/20180926/20180926235621_32980.pdf · lead to electrical conduction [17]. However, inorganic](https://img.pdfslide.net/doc/110x75/5f7f714c562de8554b2d28d7/enhancement-of-the-heat-conduction-performance-of-boron-kjcnjfueducnuploadsfile201809262018092623562132980pdf.jpg)