Embed Size (px)
Citation preview
Inorganic Phosphorus Uptake in a Carbonate-dominated
Seagrass Ecosystem
OLE I. NIELSEN1, MARGUERITE S. KOCH1,*, and CHRISTOPHER J. MADDEN2
1 Aquatic Plant Ecology Laboratory, Department of Biological Sciences, Florida Atlantic University,777 Glades Road, Boca Raton, Florida 33431
2 South Florida Water Management District, Coastal Ecosystems Division, 8894 Belvedere Road,West Palm Beach, Florida 33411
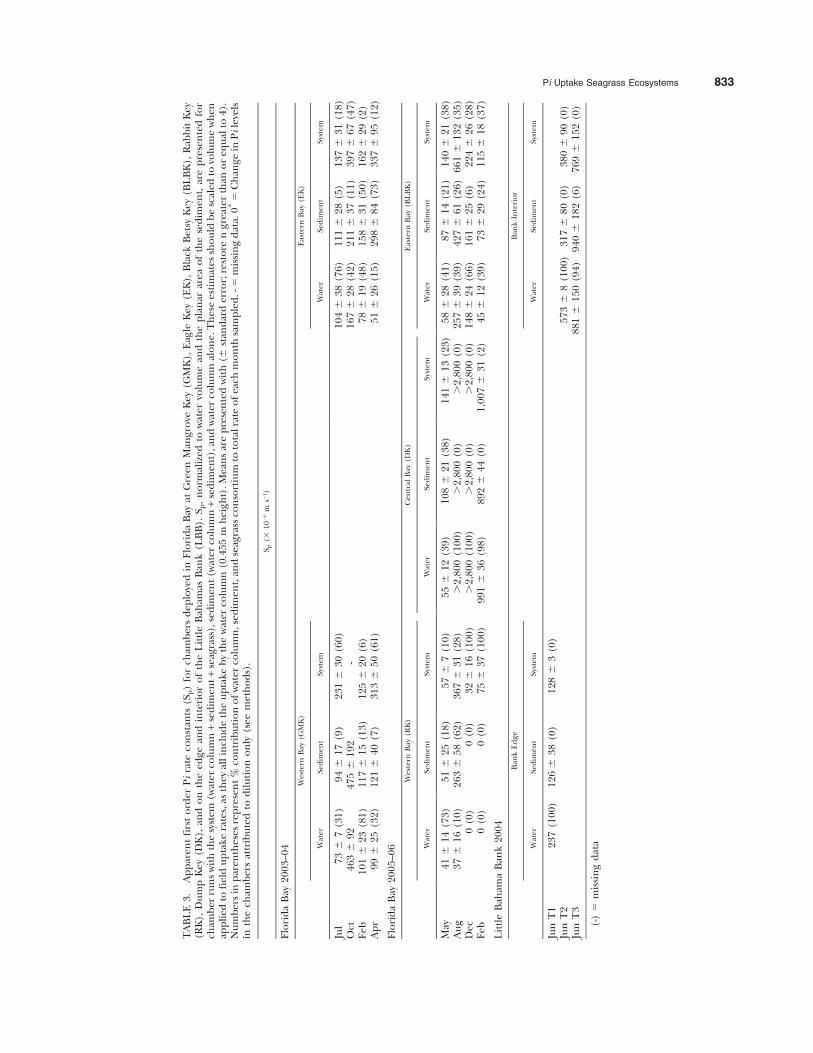
ABSTRACT: Seasonal phosphate (Pi) uptake kinetics were determined using chambers encompassing the water column,sediment and the entire system (water column + sediment + seagrass/epiphyte) in Florida Bay (FB) during 2003–2006 and onthe Little Bahama Bank (LBB) during a cruise June, 2004. Pi uptake was a linear function of concentration at low Pi levels (,2 mmol l21). Applying the Pi system rate constant (Sp) from western (177 6 50 3 1026 m s21) and eastern (272 6 66 3 1026 ms21) bay sites, and using Pi measured during the study (0.02 to 0.177 mmol Pi l21), we calculated a Pi uptake rate of 0.30 to2.62 mmol Pi m22 d21 for western and 0.47 to 4.16 mmol Pi m22 d21 for eastern bay sites which includes phytoplanktonuptake (0.455 m height). During non-bloom conditions, phytoplankton dominated Pi uptake in the east (46%) and bothphytoplankton and the seagrass-epiphyte consortium in the west (32 and 52%, respectively), with a smaller contribution by thesediment (15–20%). On LBB interior sites, the water column always dominated ($94%) Pi uptake with a higher Sp (573–8813 1026 m s21) than FB. During cyanobacterial blooms in FB (chl a 17 mg l21), the water column dominated Pi uptake (,100%)and Sp was the highest (.2,800 3 1026 m s21) measured. Phytoplankton accounted for 88% of this sequestered Pi with only12% in the acid extractable fraction, likely as calcium bound and/or adsorbed P, and only 1% attributable to smallheterotrophs. When chl a levels declined (2 mg l21) Pi uptake was still dominated by phytoplankton (77%), the acid extractablepool increased (18%) and the heterotrophic community became more important (22%). In carbonate-dominated seagrasssystems, Pi is primarily taken up by the water column biota and is subsequently remineralized/hydrolyzed in the water columnor settles to the benthos where it becomes available to benthic primary producers.
Introduction
Tropical and subtropical estuaries with autoch-thonous internal sediment generation are dominat-ed by fine carbonate particles that efficientlysequester inorganic phosphorus (Pi) (Howarth1988; McGlathery et al. 1994; Jensen et al. 1998;Koch et al. 2001). This capacity to readily bind Piinto solid phase pools, such as fluoroapatite (Kitanoet al. 1978), and low terrestrial phosphorus (P)loads, have led to P limitation of tropical seagrassproduction (Powell et al. 1989; Short et al. 1990;Fourqurean et al. 1992a,b). P cycling in thesecarbonate-dominated ecosystems is not well un-derstood. While Pi uptake has been examined oncoral reef flats (Atkinson 1987; Bilger and Atkinson1995; Steven and Atkinson 2003), to date littleinformation is available on P uptake kinetics incarbonate-dominated seagrass ecosystems with theexception of a few studies focused on the watercolumn (Cotner et al. 2000; Glibert et al. 2004;Thingstad et al. 2005). Partitioning of P uptakeamong the various components of a seagrass system,
including the water column, seagrass, and sediment,has not been elucidated.
Isotherm experiments with calcite and aragonite(de Kanel and Morse 1978; Kitano et al. 1978;Millero et al. 2001) and field carbonate sediments insuspension (Nielsen et al. 2006) indicate a highcapacity for carbonate sediments to sequester Pi.Picoplankton, principally cyanobacteria and bacte-ria in tropical oligotrophic marine environmentsalso take up Pi at nanomolar levels (Phlips et al.1999; Cotner et al. 2000; Glibert et al. 2004;Thingstad et al. 2005), suggesting that the watercolumn biota can efficiently compete for labile Pwith carbonate particles suspended in the water, orat the sediment-water interface. Seagrass leaves alsohave been shown to take up Pi at nanomolarconcentrations (Nielsen et al. 2006) on par withmicroorganisms (Currie and Kalff 1984; Falkner etal. 1989).
In this study, we develop Pi uptake kineticparameters for the water column, the sediment,and the entire system (water column + sediment +seagrass) of carbonate seagrass ecosystems with verylow Pi concentrations. Small chambers were used toisolate the various components of the system anddetect small differences in concentration at low
* Corresponding author; tele: 561/297-3325; fax: 561/297-2749; e-mail: [email protected]
Estuaries and Coasts Vol. 30, No. 5, p. 827–839 October 2007
� 2007 Estuarine Research Federation 827
ambient Pi levels. Kinetics were established inFlorida Bay (FB), a carbonate seagrass-dominatedestuary, over several seasons and across an estab-lished nutrient gradient (Fourqurean et al. 1992a,b;Zhang et al. 2004). We hypothesized that finesediments in the eastern bay would rapidly seques-ter Pi and dominate Pi uptake in the system, whilelow chlorophyll a (chl a) in this region of the bay(Phlips et al. 1999) would limit water columnuptake. We also hypothesized that Pi uptake rateswould be low in the western bay, which receivesa relatively higher P load from the Gulf of Mexico(Boyer et al. 1997; Rudnick et al. 1999), resulting inP-enriched sediments relative to the eastern bay(Zhang et al. 2004). In this study, we also com-pared FB Pi uptake kinetics to those measured onLittle Bahama Bank (LBB), a highly oligotrophicsite remote from anthropogenic nutrient sources,particularly in the bank interior. FB and LBBsupport extensive seagrass meadows dominated bythe tropical seagrass Thalassia testudinum. Watercolumn biotic and abiotic fractions responsible forPi sequestration were also discriminated when weexamined the mechanism of water column uptakein FB. We present a conceptual model illustrating Puptake and cycling in a carbonate seagrass-domi-nated estuary, using FB as a case study.
Methods
STUDY AREA
Pi uptake experiments were conducted bothseasonally and interannually (2003–2006) at five
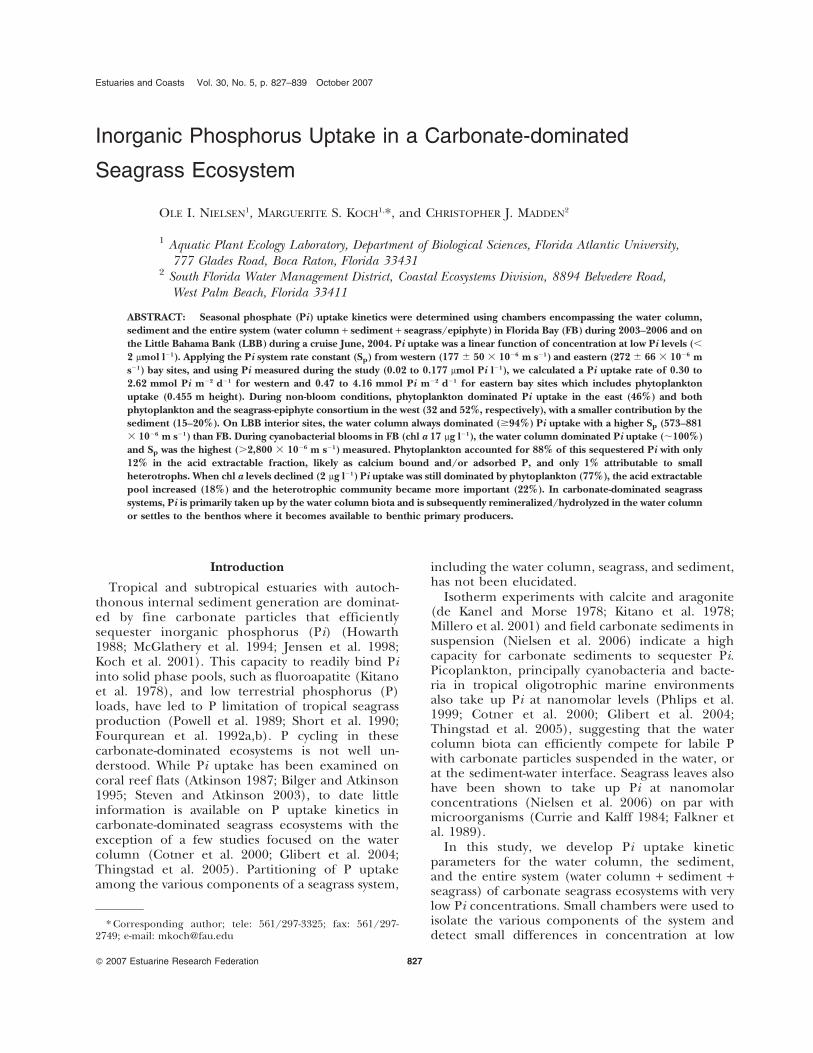
sites in FB, a shallow (, 3 m) semi-enclosedcarbonate estuarine lagoon (ca. 2,000 km2) at thesouthern tip of the Florida peninsula (Fig. 1). Piuptake kinetics were also determined shipboard ona cruise ( June 6–9, 2004 onboard the RV Bellows)along three transects on LBB, a highly oligotrophicshallow (, 20 m) carbonate bank situated north ofGrand Bahama Island. In FB, T. testudinum biomassand primary production decrease from the westernto the eastern regions as a consequence of de-creasing P availability, evidenced by sediment Pconcentrations (Zhang et al. 2004), sediment Pisotherms (Nielsen et al. 2006), and leaf carbon:-phosphorus (C:P) stoichiometry (Fourqurean et al.1992a,b). The bay sites chosen for this studyencompass this nutrient gradient with sites in thewestern bay, Green Mangrove Key (GMK;24u559200N, 80u479330W) and Rabbit Key (RK;24u589500N, 80u509110W), in the eastern bay, EagleKey (EK; 25u099300N, 80u349590W) and BlackBetsy Key (BLBK; 25u089230N, 80u389510W), and inthe central bay, Dump Key (DK; 25u069400N,80u469150W).
On LBB (Fig. 1), the first site on transect one(T1) was located close to the western edge of thebank, while sites on transect two (T2) and three (T3)were located in the bank interior. These sites werealso dominated by T. testudinum and represent a Ptrophic gradient based on leaf tissue molar C:Pstoichiometry (1097, 1161, and 1361, respectively;Koch unpublished data), although C:P ratiossuggest all bank sites have low P availability.
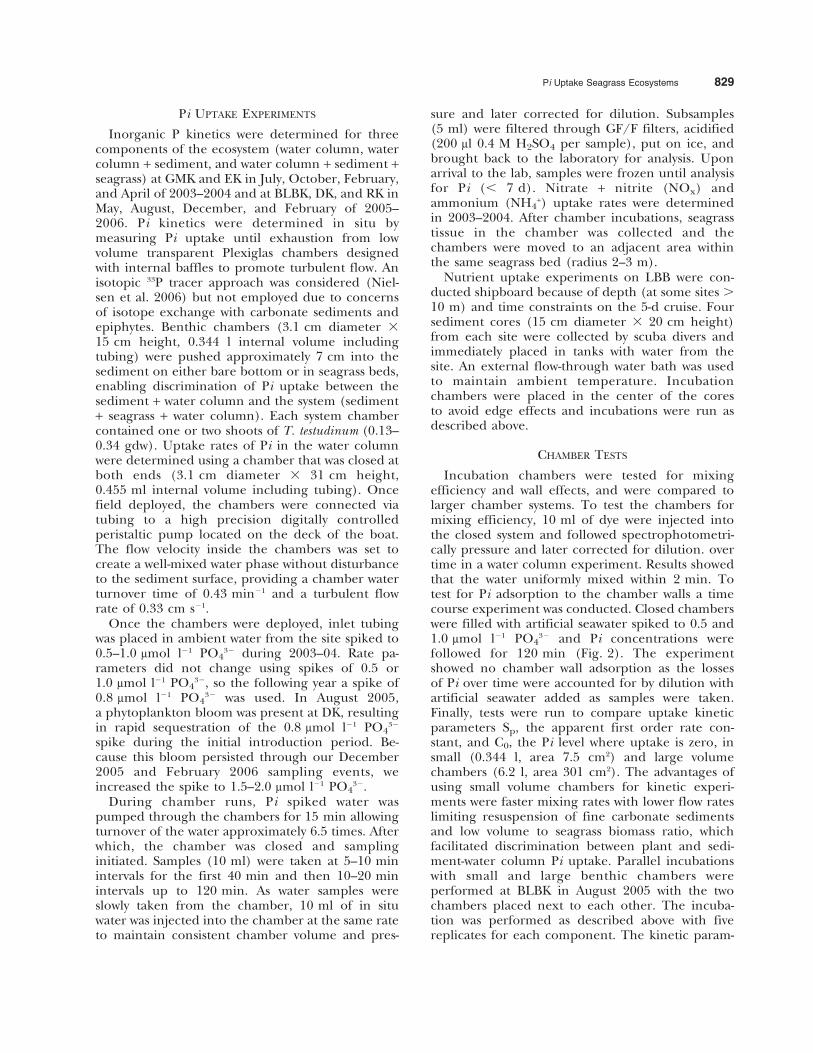
Fig. 1. Florida Bay at the terminus of the south Florida peninsula and the Little Bahama Bank to the north of Grand Bahama Island.The left panel identifies the five sites in Florida Bay where seasonal (2003–2006) in situ Pi uptake kinetics were determined: Rabbit Key(RK) and Green Mangrove Key (GMK) along the southwestern edge of the bay bordering the Gulf of Mexico, Dump Key (DK) in thenorthcentral bay, and Black Betsy Key (BLBK) and Eagle Key (EK) in the northeastern region of the bay. The right panel identifies theLittle Bahama Bank depicting three cruise transects just north of Grand Bahama Island along which sites (starred) were selected forshipboard Pi uptake incubations ( June 2004).
828 O. I. Nielsen et al.
Pi UPTAKE EXPERIMENTS
Inorganic P kinetics were determined for threecomponents of the ecosystem (water column, watercolumn + sediment, and water column + sediment +seagrass) at GMK and EK in July, October, February,and April of 2003–2004 and at BLBK, DK, and RK inMay, August, December, and February of 2005–2006. Pi kinetics were determined in situ bymeasuring Pi uptake until exhaustion from lowvolume transparent Plexiglas chambers designedwith internal baffles to promote turbulent flow. Anisotopic 33P tracer approach was considered (Niel-sen et al. 2006) but not employed due to concernsof isotope exchange with carbonate sediments andepiphytes. Benthic chambers (3.1 cm diameter 315 cm height, 0.344 l internal volume includingtubing) were pushed approximately 7 cm into thesediment on either bare bottom or in seagrass beds,enabling discrimination of Pi uptake between thesediment + water column and the system (sediment+ seagrass + water column). Each system chambercontained one or two shoots of T. testudinum (0.13–0.34 gdw). Uptake rates of Pi in the water columnwere determined using a chamber that was closed atboth ends (3.1 cm diameter 3 31 cm height,0.455 ml internal volume including tubing). Oncefield deployed, the chambers were connected viatubing to a high precision digitally controlledperistaltic pump located on the deck of the boat.The flow velocity inside the chambers was set tocreate a well-mixed water phase without disturbanceto the sediment surface, providing a chamber waterturnover time of 0.43 min21 and a turbulent flowrate of 0.33 cm s21.
Once the chambers were deployed, inlet tubingwas placed in ambient water from the site spiked to0.5–1.0 mmol l21 PO4
32 during 2003–04. Rate pa-rameters did not change using spikes of 0.5 or1.0 mmol l21 PO4
32, so the following year a spike of0.8 mmol l21 PO4
32 was used. In August 2005,a phytoplankton bloom was present at DK, resultingin rapid sequestration of the 0.8 mmol l21 PO4
32
spike during the initial introduction period. Be-cause this bloom persisted through our December2005 and February 2006 sampling events, weincreased the spike to 1.5–2.0 mmol l21 PO4
32.During chamber runs, Pi spiked water was
pumped through the chambers for 15 min allowingturnover of the water approximately 6.5 times. Afterwhich, the chamber was closed and samplinginitiated. Samples (10 ml) were taken at 5–10 minintervals for the first 40 min and then 10–20 minintervals up to 120 min. As water samples wereslowly taken from the chamber, 10 ml of in situwater was injected into the chamber at the same rateto maintain consistent chamber volume and pres-
sure and later corrected for dilution. Subsamples(5 ml) were filtered through GF/F filters, acidified(200 ml 0.4 M H2SO4 per sample), put on ice, andbrought back to the laboratory for analysis. Uponarrival to the lab, samples were frozen until analysisfor Pi (, 7 d). Nitrate + nitrite (NOx) andammonium (NH4
+) uptake rates were determinedin 2003–2004. After chamber incubations, seagrasstissue in the chamber was collected and thechambers were moved to an adjacent area withinthe same seagrass bed (radius 2–3 m).
Nutrient uptake experiments on LBB were con-ducted shipboard because of depth (at some sites .10 m) and time constraints on the 5-d cruise. Foursediment cores (15 cm diameter 3 20 cm height)from each site were collected by scuba divers andimmediately placed in tanks with water from thesite. An external flow-through water bath was usedto maintain ambient temperature. Incubationchambers were placed in the center of the coresto avoid edge effects and incubations were run asdescribed above.
CHAMBER TESTS
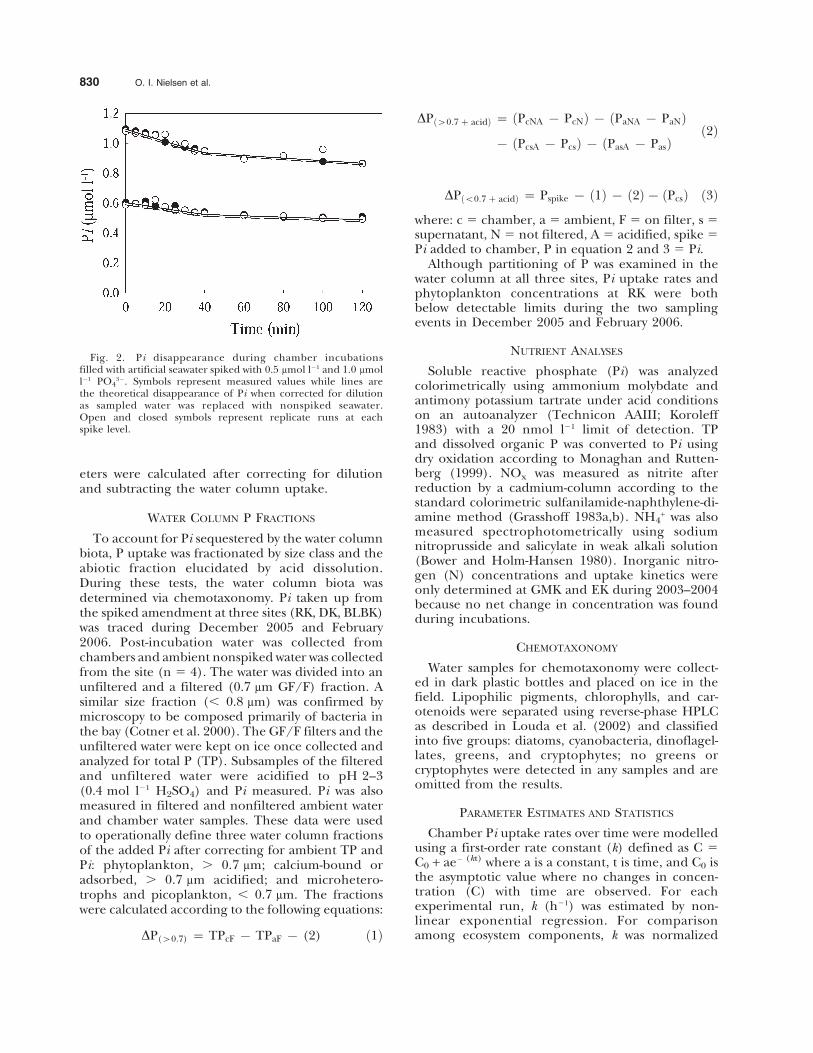
Incubation chambers were tested for mixingefficiency and wall effects, and were compared tolarger chamber systems. To test the chambers formixing efficiency, 10 ml of dye were injected intothe closed system and followed spectrophotometri-cally pressure and later corrected for dilution. overtime in a water column experiment. Results showedthat the water uniformly mixed within 2 min. Totest for Pi adsorption to the chamber walls a timecourse experiment was conducted. Closed chamberswere filled with artificial seawater spiked to 0.5 and1.0 mmol l21 PO4
32 and Pi concentrations werefollowed for 120 min (Fig. 2). The experimentshowed no chamber wall adsorption as the lossesof Pi over time were accounted for by dilution withartificial seawater added as samples were taken.Finally, tests were run to compare uptake kineticparameters Sp, the apparent first order rate con-stant, and C0, the Pi level where uptake is zero, insmall (0.344 l, area 7.5 cm2) and large volumechambers (6.2 l, area 301 cm2). The advantages ofusing small volume chambers for kinetic experi-ments were faster mixing rates with lower flow rateslimiting resuspension of fine carbonate sedimentsand low volume to seagrass biomass ratio, whichfacilitated discrimination between plant and sedi-ment-water column Pi uptake. Parallel incubationswith small and large benthic chambers wereperformed at BLBK in August 2005 with the twochambers placed next to each other. The incuba-tion was performed as described above with fivereplicates for each component. The kinetic param-
Pi Uptake Seagrass Ecosystems 829
eters were calculated after correcting for dilutionand subtracting the water column uptake.
WATER COLUMN P FRACTIONS
To account for Pi sequestered by the water columnbiota, P uptake was fractionated by size class and theabiotic fraction elucidated by acid dissolution.During these tests, the water column biota wasdetermined via chemotaxonomy. Pi taken up fromthe spiked amendment at three sites (RK, DK, BLBK)was traced during December 2005 and February2006. Post-incubation water was collected fromchambers and ambient nonspiked water was collectedfrom the site (n 5 4). The water was divided into anunfiltered and a filtered (0.7 mm GF/F) fraction. Asimilar size fraction (, 0.8 mm) was confirmed bymicroscopy to be composed primarily of bacteria inthe bay (Cotner et al. 2000). The GF/F filters and theunfiltered water were kept on ice once collected andanalyzed for total P (TP). Subsamples of the filteredand unfiltered water were acidified to pH 2–3(0.4 mol l21 H2SO4) and Pi measured. Pi was alsomeasured in filtered and nonfiltered ambient waterand chamber water samples. These data were usedto operationally define three water column fractionsof the added Pi after correcting for ambient TP andPi: phytoplankton, . 0.7 mm; calcium-bound oradsorbed, . 0.7 mm acidified; and microhetero-trophs and picoplankton, , 0.7 mm. The fractionswere calculated according to the following equations:
DP(w0:7) ~ TPcF { TPaF { (2) ð1Þ
DP w0:7 z acidð Þ ~ PcNA { PcNð Þ{ PaNA { PaNð Þ
{ PcsA { Pcsð Þ{ PasA { Pasð Þð2Þ
DP v0:7 z acidð Þ ~ Pspike { 1ð Þ{ 2ð Þ{ Pcsð Þ ð3Þ
where: c 5 chamber, a 5 ambient, F 5 on filter, s 5supernatant, N 5 not filtered, A 5 acidified, spike 5Pi added to chamber, P in equation 2 and 3 5 Pi.
Although partitioning of P was examined in thewater column at all three sites, Pi uptake rates andphytoplankton concentrations at RK were bothbelow detectable limits during the two samplingevents in December 2005 and February 2006.
NUTRIENT ANALYSES
Soluble reactive phosphate (Pi) was analyzedcolorimetrically using ammonium molybdate andantimony potassium tartrate under acid conditionson an autoanalyzer (Technicon AAIII; Koroleff1983) with a 20 nmol l21 limit of detection. TPand dissolved organic P was converted to Pi usingdry oxidation according to Monaghan and Rutten-berg (1999). NOx was measured as nitrite afterreduction by a cadmium-column according to thestandard colorimetric sulfanilamide-naphthylene-di-amine method (Grasshoff 1983a,b). NH4
+ was alsomeasured spectrophotometrically using sodiumnitroprusside and salicylate in weak alkali solution(Bower and Holm-Hansen 1980). Inorganic nitro-gen (N) concentrations and uptake kinetics wereonly determined at GMK and EK during 2003–2004because no net change in concentration was foundduring incubations.
CHEMOTAXONOMY
Water samples for chemotaxonomy were collect-ed in dark plastic bottles and placed on ice in thefield. Lipophilic pigments, chlorophylls, and car-otenoids were separated using reverse-phase HPLCas described in Louda et al. (2002) and classifiedinto five groups: diatoms, cyanobacteria, dinoflagel-lates, greens, and cryptophytes; no greens orcryptophytes were detected in any samples and areomitted from the results.
PARAMETER ESTIMATES AND STATISTICS
Chamber Pi uptake rates over time were modelledusing a first-order rate constant (k) defined as C 5C0 + ae2 (kt) where a is a constant, t is time, and C0 isthe asymptotic value where no changes in concen-tration (C) with time are observed. For eachexperimental run, k (h21) was estimated by non-linear exponential regression. For comparisonamong ecosystem components, k was normalized
Fig. 2. Pi disappearance during chamber incubationsfilled with artificial seawater spiked with 0.5 mmol l21 and 1.0 mmoll21 PO4
32. Symbols represent measured values while lines arethe theoretical disappearance of Pi when corrected for dilutionas sampled water was replaced with nonspiked seawater.Open and closed symbols represent replicate runs at eachspike level.
830 O. I. Nielsen et al.
to water volume (V) and the planar area of thesediment (A; 0.344 1/7.54 cm2 5 0.455 m height ofwater column) and expressed as the apparent first-order rate constant for Pi, Sp (5 kV/A). Allestimates of Sp should be converted to a volumewhen applying the calculated rates to field estimatesof benthic uptake, as they include the water columnuptake (0.455 m height). During runs where initialuptake rates were slow and there was not a cleardistinction of the asymptotic value (C0) after120 min, estimates of C0 were either overestimatedor underestimated depending on the interpolation.In cases where C0 was negative, values were omittedfrom further calculations, while overestimated C0
values were kept, as we had no criteria to discrim-inate overestimated values from actual values.Estimates of C0 reported herein are probablyoverestimated.
Nonlinear exponential decay regressions wereperformed using SigmaPlot (version 9.1, SystatSoftware Inc., San Jose, California). The resultingPi uptake rate constants (Sp) were ranked, becauseof data non-normality, and compared using a three-way analysis of variance (ANOVA; site 3 month 3ecosystem component) for data collected in 2003–
2004 at EK and GMK and 2005–2006 at BLBK andRK (SAS version 9.1, SAS Institute Inc., Cary, NorthCarolina). Multiple mean comparisons within maineffects were performed using the Tukey test with allsignificant differences reported at the p , 0.05 level(SAS version 9.1). Comparisons between small andlarge chambers were made using a t-test (SigmaStatversion 3.1, Systat Software Inc., San Jose, Califor-nia). Because of limited data sets, statistical compar-isons of C0 within Florida Bay, as well as compar-isons of C0 and Sp between FB and LBB, were madeonly in a qualitative manner.
Results
Pi UPTAKE KINETICS
In the majority of chamber experiments, Piconcentration with time fit an exponential decaymodel (R2 . 0.92), demonstrating that Pi uptake isa linear function of concentration at low Pi levels inFB and LBB across a range of salinity andtemperature regimes (Table 1). There was alwaysa net uptake of Pi from the various ecosystemcomponents using Pi spikes # 2.0 mmol l21 (2.0, 1.5,1.0, 0.8, or 0.5 mmol l21). In nonspiked controls, no
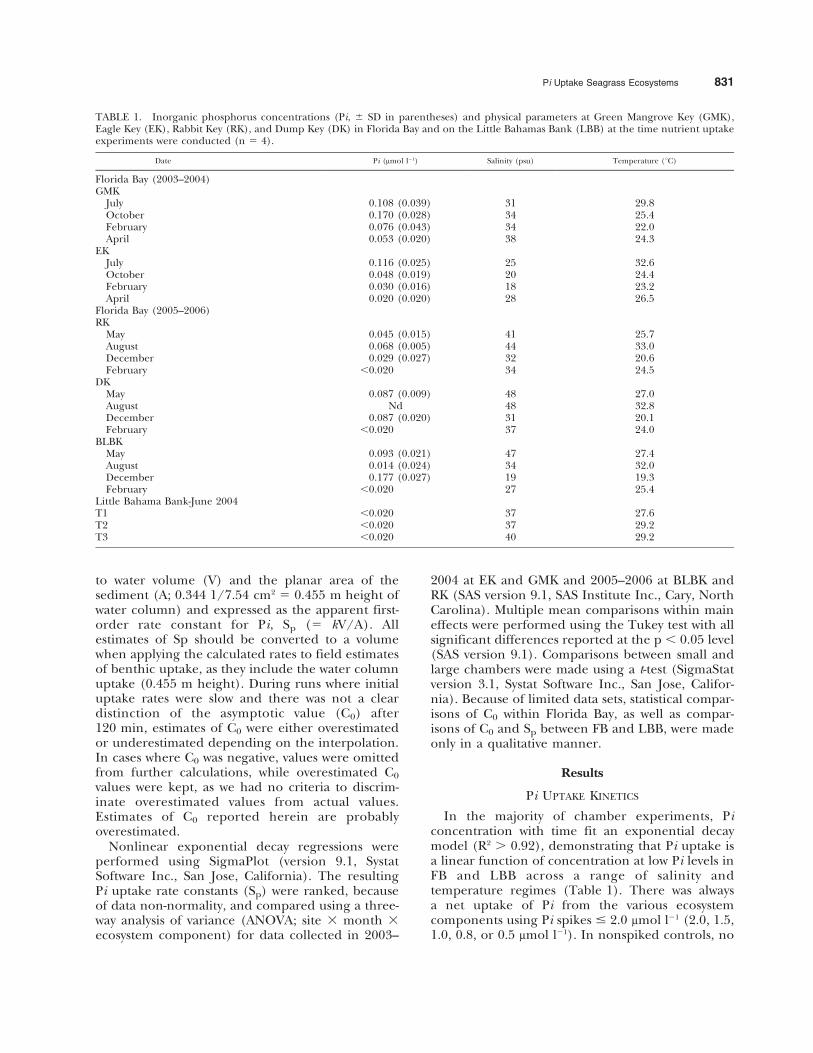
TABLE 1. Inorganic phosphorus concentrations (Pi, 6 SD in parentheses) and physical parameters at Green Mangrove Key (GMK),Eagle Key (EK), Rabbit Key (RK), and Dump Key (DK) in Florida Bay and on the Little Bahamas Bank (LBB) at the time nutrient uptakeexperiments were conducted (n 5 4).
Date Pi (mmol l21) Salinity (psu) Temperature (uC)
Florida Bay (2003–2004)GMK
July 0.108 (0.039) 31 29.8October 0.170 (0.028) 34 25.4February 0.076 (0.043) 34 22.0April 0.053 (0.020) 38 24.3
EKJuly 0.116 (0.025) 25 32.6October 0.048 (0.019) 20 24.4February 0.030 (0.016) 18 23.2April 0.020 (0.020) 28 26.5
Florida Bay (2005–2006)RK
May 0.045 (0.015) 41 25.7August 0.068 (0.005) 44 33.0December 0.029 (0.027) 32 20.6February ,0.020 34 24.5
DKMay 0.087 (0.009) 48 27.0August Nd 48 32.8December 0.087 (0.020) 31 20.1February ,0.020 37 24.0
BLBKMay 0.093 (0.021) 47 27.4August 0.014 (0.024) 34 32.0December 0.177 (0.027) 19 19.3February ,0.020 27 25.4
Little Bahama Bank-June 2004T1 ,0.020 37 27.6T2 ,0.020 37 29.2T3 ,0.020 40 29.2
Pi Uptake Seagrass Ecosystems 831
net release of Pi was detectable, indicating a high Piaffinity in these carbonate systems.
Although we found rapid uptake of Pi amendedto surface waters in the bay, dissolved inorganicnitrogen (Ni) flux was not significantly differentfrom zero (one-sided t-test, p , 0.05, data notshown) during incubations at GMK and EK (2003–2004) with no Ni spike. The fact that no net uptakeof Ni was found in benthic chambers could havebeen the result of high porewater NH4
+ in baysediments (range 6 to 2,400 mmol l21, median 579); Ni in the water column chambers did notchange during 120-min incubations. N availability inthe water column, evidenced by high NH4
+ concen-trations (0.6–3.3 mmol l21) and Ni:Pi ratios . 10 mayhave influenced Ni uptake rates. Longer-termincubations or Ni spikes would probably be re-quired to elucidated Ni dynamics, but this was notwithin the scope of the present study.
Pi UPTAKE RATE CONSTANT (SP)
Chamber tests showed no significant difference inthe system kinetic parameters Sp and C0 betweenthe large and small chambers, respectively, support-ing the data presented herein (Table 2). Based onseasonal chamber Pi uptake experiments in FB, Sp
for the system was between 0 and 367 3 1026 m s21
for western bay sites and 115 and 661 3 1026 m s21
for eastern bay sites, averaging (6 standard error)171 6 50 and 272 6 66 3 1026 m s21, respectively(Table 3). Applying these average Pi system rateconstants and the range of Pi concentrationsmeasured in situ (0.02 to 0.177 mmol Pi l21;Table 1), we calculated Pi uptake rates rangingfrom 0.30 to 2.62 mmol Pi m22 d21 at western baysites and 0.47 to 4.16 mmol Pi m22 d21 at easternbay sites a benthic estimate that includes the watercolumn uptake (Sp m s21 3 min and max watercolumn Pi mmol l21 3 86,400 s d21 3 1,000 l m23).
These results suggest a higher average Pi uptakein the eastern versus western bay sites, but naturalseasonal and interannual variance in the systemtempers this conclusion. During 2003–2004 nosignificant site differences were found in Sp betweeneastern (EK) and western (GMK) sites, while in2005–2006 there was a significantly higher Pi uptakerate at the eastern bay site (BLBK, Table 4). The low
average rate of Pi uptake at RK in 2005–2006 washighly influenced by no Pi uptake recorded duringDecember and February in both the water columnand sediment components, reflected in the signif-icant season and component interactive terms inthe three-way ANOVA (Table 4).
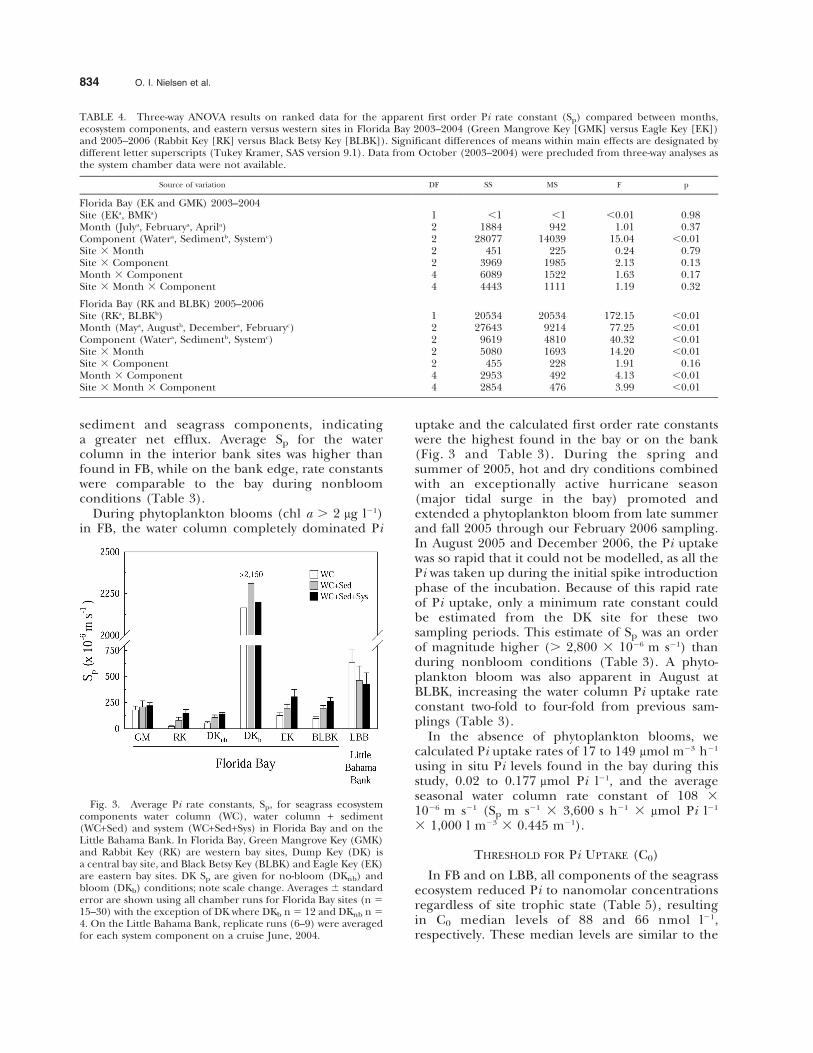
The lowest uptake rate across seasons was foundin February during both years studied, with theexception of DK, which experienced algal blooms inthe winter (Table 3). Sp was significantly lower inFebruary compared to spring values measured inMay 2005–2006 (Table 4). While the interannual Pirate constant was inconsistent between sites andamong seasons, there was a notable pattern thatemerged across seagrass ecosystem components.During nonbloom conditions, Sp of the system wassignificantly higher than the water and water +sediment alone for all years and sites in FB(Table 4). Sp increased in the order of system .water + sediment . water (Fig. 3 and Table 4).
The lack of a clear increase in Sp as a function ofincreasing seagrass biomass (Fig. 3), which washigher in the chambers at western (0.29–0.34 gdwper chamber) than eastern (0.13–0.29 gdw perchamber) bay sites, suggests that small statureseagrass with their associated epiphytes may at timesbe important for Pi uptake. The P-limited status ofthe eastern bay plant-epiphyte complex, while lowerin stature, and surface area, may more efficientlysequester Pi. Based on Sp, the proportion of thetotal system Pi uptake (calculated above) by theseagrass-epiphyte consortium is 27% in the easternbay and 52% in the western bay or 0.13 to 1.12 and0.15 to 1.36 mmol Pi m22 d21, respectively. Normal-izing these rates to seagrass biomass from chambersin eastern (100 g m22) and western (300 g m22)sites, the mass specific uptake rate is between 0.05 to0.47 mmol P gdw21 h21 and 0.02 to 0.19 mmol Pgdw21 h21, respectively (mmol Pi m22 d21 31,000 mmol mmol21 3 d 24 h21 3 m2 g21).
Even though Sp was consistently higher with thecontribution of the seagrass component, in FB thiswas not the case on the highly oligotrophic LBB(Fig. 3 and Table 3). The Sp was highest in thewater column and always dominated ($ 94%) Piuptake in the system (Fig. 3 and Table 3). Pi uptakerates were lower on average with the addition of the
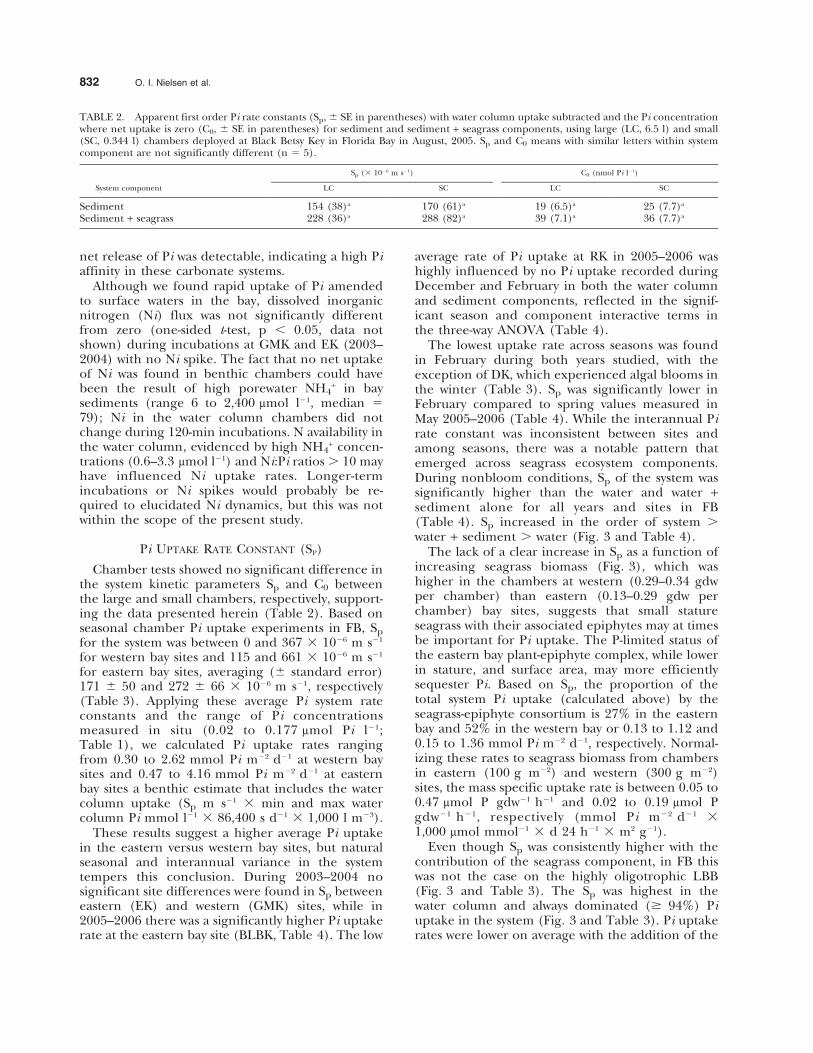
TABLE 2. Apparent first order Pi rate constants (Sp, 6 SE in parentheses) with water column uptake subtracted and the Pi concentrationwhere net uptake is zero (C0, 6 SE in parentheses) for sediment and sediment + seagrass components, using large (LC, 6.5 l) and small(SC, 0.344 l) chambers deployed at Black Betsy Key in Florida Bay in August, 2005. Sp and C0 means with similar letters within systemcomponent are not significantly different (n 5 5).
System component
Sp (3 1026 m s21) C0 (nmol Pi l21)
LC SC LC SC
Sediment 154 (38)a 170 (61)a 19 (6.5)a 25 (7.7)a
Sediment + seagrass 228 (36)a 288 (82)a 39 (7.1)a 36 (7.7)a
832 O. I. Nielsen et al.
TA
BL
E3.
Ap
par
ent
firs
to
rder
Pi
rate
con
stan
ts(S
p)
for
cham
ber
sd
eplo
yed
inF
lori
da
Bay
atG
reen
Man
gro
veK
ey(G
MK
),E
agle
Key
(EK
),B
lack
Bet
syK
ey(B
LB
K),
Rab
bit
Key
(RK
),D
um
pK
ey(D
K),
and
on
the
edge
and
inte
rio
ro
fth
eL
ittl
eB
aham
asB
ank
(LB
B).
S p,
no
rmal
ized
tow
ater
volu
me
and
the
pla
nar
area
of
the
sed
imen
t,ar
ep
rese
nte
dfo
rch
amb
erru
ns
wit
hth
esy
stem
(wat
erco
lum
n+
sed
imen
t+
seag
rass
),se
dim
ent
(wat
erco
lum
n+
sed
imen
t),a
nd
wat
erco
lum
nal
on
e.T
hes
ees
tim
ates
sho
uld
be
scal
edto
volu
me
wh
enap
pli
edto
fiel
du
pta
kera
tes,
asth
eyal
lin
clu
de
the
up
take
by
the
wat
erco
lum
n(0
.455
mh
eigh
t).M
ean
sar
ep
rese
nte
dw
ith
(6st
and
ard
erro
r;re
sto
ren
grea
ter
than
or
equ
alto
4).
Nu
mb
ers
inp
aren
thes
esre
pre
sen
t%
con
trib
uti
on
of
wat
erco
lum
n,s
edim
ent,
and
seag
rass
con
sort
ium
toto
tal
rate
of
each
mo
nth
sam
ple
d.-
5m
issi
ng
dat
a.0*
5C
han
gein
Pi
leve
lsin
the
cham
ber
sat
trib
ute
dto
dil
uti
on
on
ly(s
eem
eth
od
s).
S p(3
102
6m
s21)
Flo
rid
aB
ay20
03–0
4
Wes
tern
Bay
(GM
K)
Eas
tern
Bay
(EK
)
Wat
erSe
dim
ent
Syst
emW
ater
Sed
imen
tSy
stem
Jul
736
7(3
1)94
617
(9)
231
630
(60)
104
638
(76)
111
628
(5)
137
631
(18)
Oct
463
692
475
619
2-
167
628
(42)
211
637
(11)
397
667
(47)
Feb
101
623
(81)
117
615
(13)
125
620
(6)
786
19(4
8)15
86
31(5
0)16
26
29(2
)A
pr
996
25(3
2)12
16
40(7
)31
36
50(6
1)51
626
(15)
298
684
(73)
337
695
(12)
Flo
rid
aB
ay20
05–0
6
Wes
tern
Bay
(RK
)C
entr
alB
ay(D
K)
Eas
tern
Bay
(BL
BK
)
Wat
erSe
dim
ent
Syst
emW
ater
Sed
imen
tSy
stem
Wat
erSe
dim
ent
Syst
em
May
416
14(7
3)51
625
(18)
576
7(1
0)55
612
(39)
108
621
(38)
141
613
(23)
586
28(4
1)87
614
(21)
140
621
(38)
Au
g37
616
(10)
263
658
(62)
367
631
(28)
.2,
800
(100
).
2,80
0(0
).
2,80
0(0
)25
76
39(3
9)42
76
61(2
6)66
16
132
(35)
Dec
0(0
)0
(0)
326
16(1
00)
.2,
800
(100
).
2,80
0(0
).
2,80
0(0
)14
86
24(6
6)16
16
25(6
)22
46
26(2
8)F
eb0
(0)
0(0
)75
637
(100
)99
16
36(9
8)89
26
44(0
)1,
007
631
(2)
456
12(3
9)73
629
(24)
115
618
(37)
Lit
tle
Bah
ama
Ban
k20
04
Ban
kE
dge
Ban
kIn
teri
or
Wat
erSe
dim
ent
Syst
emW
ater
Sed
imen
tSy
stem
Jun
T1
237
(100
)12
66
38(0
)12
86
3(0
)Ju
nT
257
36
8(1
00)
317
680
(0)
380
690
(0)
Jun
T3
881
615
0(9
4)94
06
182
(6)
769
615
2(0
)
(-)
5m
issi
ng
dat
a
Pi Uptake Seagrass Ecosystems 833
sediment and seagrass components, indicatinga greater net efflux. Average Sp for the watercolumn in the interior bank sites was higher thanfound in FB, while on the bank edge, rate constantswere comparable to the bay during nonbloomconditions (Table 3).
During phytoplankton blooms (chl a . 2 mg l21)in FB, the water column completely dominated Pi
uptake and the calculated first order rate constantswere the highest found in the bay or on the bank(Fig. 3 and Table 3). During the spring andsummer of 2005, hot and dry conditions combinedwith an exceptionally active hurricane season(major tidal surge in the bay) promoted andextended a phytoplankton bloom from late summerand fall 2005 through our February 2006 sampling.In August 2005 and December 2006, the Pi uptakewas so rapid that it could not be modelled, as all thePi was taken up during the initial spike introductionphase of the incubation. Because of this rapid rateof Pi uptake, only a minimum rate constant couldbe estimated from the DK site for these twosampling periods. This estimate of Sp was an orderof magnitude higher (. 2,800 3 1026 m s21) thanduring nonbloom conditions (Table 3). A phyto-plankton bloom was also apparent in August atBLBK, increasing the water column Pi uptake rateconstant two-fold to four-fold from previous sam-plings (Table 3).
In the absence of phytoplankton blooms, wecalculated Pi uptake rates of 17 to 149 mmol m23 h21
using in situ Pi levels found in the bay during thisstudy, 0.02 to 0.177 mmol Pi l21, and the averageseasonal water column rate constant of 108 31026 m s21 (Sp m s21 3 3,600 s h21 3 mmol Pi l21
3 1,000 l m23 3 0.445 m21).
THRESHOLD FOR Pi UPTAKE (C0)
In FB and on LBB, all components of the seagrassecosystem reduced Pi to nanomolar concentrationsregardless of site trophic state (Table 5), resultingin C0 median levels of 88 and 66 nmol l21,respectively. These median levels are similar to the
TABLE 4. Three-way ANOVA results on ranked data for the apparent first order Pi rate constant (Sp) compared between months,ecosystem components, and eastern versus western sites in Florida Bay 2003–2004 (Green Mangrove Key [GMK] versus Eagle Key [EK])and 2005–2006 (Rabbit Key [RK] versus Black Betsy Key [BLBK]). Significant differences of means within main effects are designated bydifferent letter superscripts (Tukey Kramer, SAS version 9.1). Data from October (2003–2004) were precluded from three-way analyses asthe system chamber data were not available.
Source of variation DF SS MS F p
Florida Bay (EK and GMK) 2003–2004Site (EKa, BMKa) 1 ,1 ,1 ,0.01 0.98Month (Julya, Februarya, Aprila) 2 1884 942 1.01 0.37Component (Watera, Sedimentb, Systemc) 2 28077 14039 15.04 ,0.01Site 3 Month 2 451 225 0.24 0.79Site 3 Component 2 3969 1985 2.13 0.13Month 3 Component 4 6089 1522 1.63 0.17Site 3 Month 3 Component 4 4443 1111 1.19 0.32
Florida Bay (RK and BLBK) 2005–2006Site (RKa, BLBKb) 1 20534 20534 172.15 ,0.01Month (Maya, Augustb, Decembera, Februaryc) 2 27643 9214 77.25 ,0.01Component (Watera, Sedimentb, Systemc) 2 9619 4810 40.32 ,0.01Site 3 Month 2 5080 1693 14.20 ,0.01Site 3 Component 2 455 228 1.91 0.16Month 3 Component 4 2953 492 4.13 ,0.01Site 3 Month 3 Component 4 2854 476 3.99 ,0.01
Fig. 3. Average Pi rate constants, Sp, for seagrass ecosystemcomponents water column (WC), water column + sediment(WC+Sed) and system (WC+Sed+Sys) in Florida Bay and on theLittle Bahama Bank. In Florida Bay, Green Mangrove Key (GMK)and Rabbit Key (RK) are western bay sites, Dump Key (DK) isa central bay site, and Black Betsy Key (BLBK) and Eagle Key (EK)are eastern bay sites. DK Sp are given for no-bloom (DKnb) andbloom (DKb) conditions; note scale change. Averages 6 standarderror are shown using all chamber runs for Florida Bay sites (n 515–30) with the exception of DK where DKb n 5 12 and DKnb n 54. On the Little Bahama Bank, replicate runs (6–9) were averagedfor each system component on a cruise June, 2004.
834 O. I. Nielsen et al.
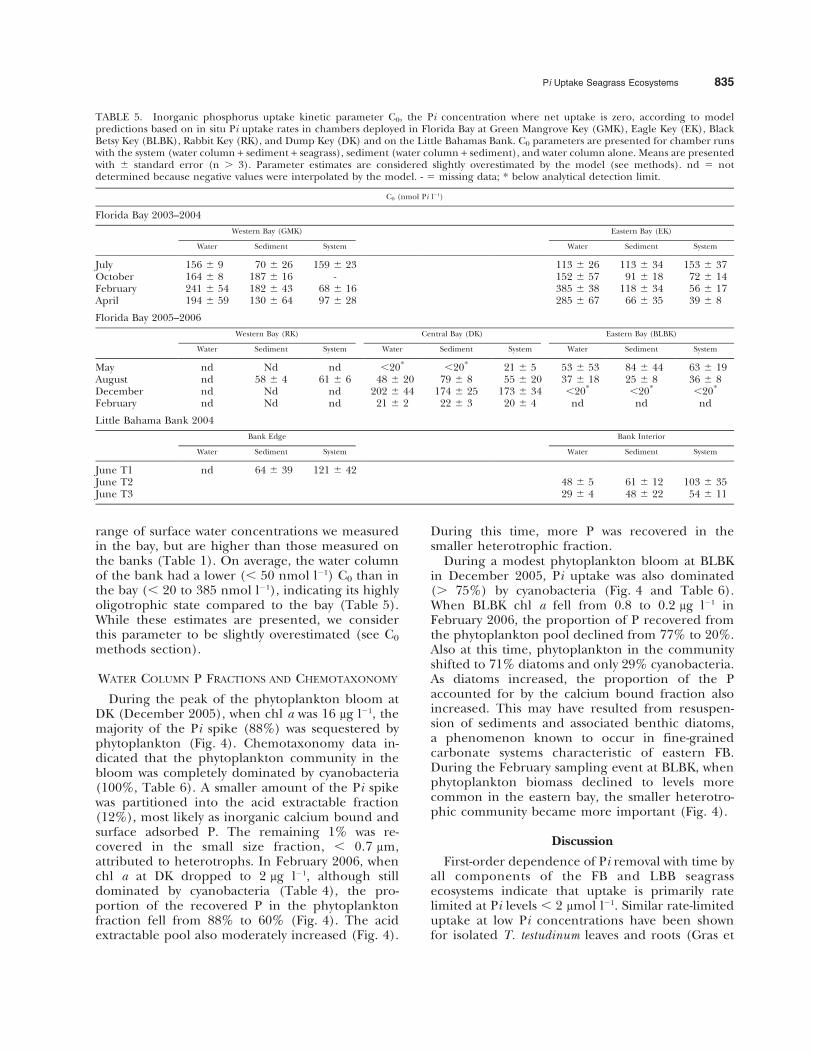
range of surface water concentrations we measuredin the bay, but are higher than those measured onthe banks (Table 1). On average, the water columnof the bank had a lower (, 50 nmol l21) C0 than inthe bay (, 20 to 385 nmol l21), indicating its highlyoligotrophic state compared to the bay (Table 5).While these estimates are presented, we considerthis parameter to be slightly overestimated (see C0
methods section).
WATER COLUMN P FRACTIONS AND CHEMOTAXONOMY
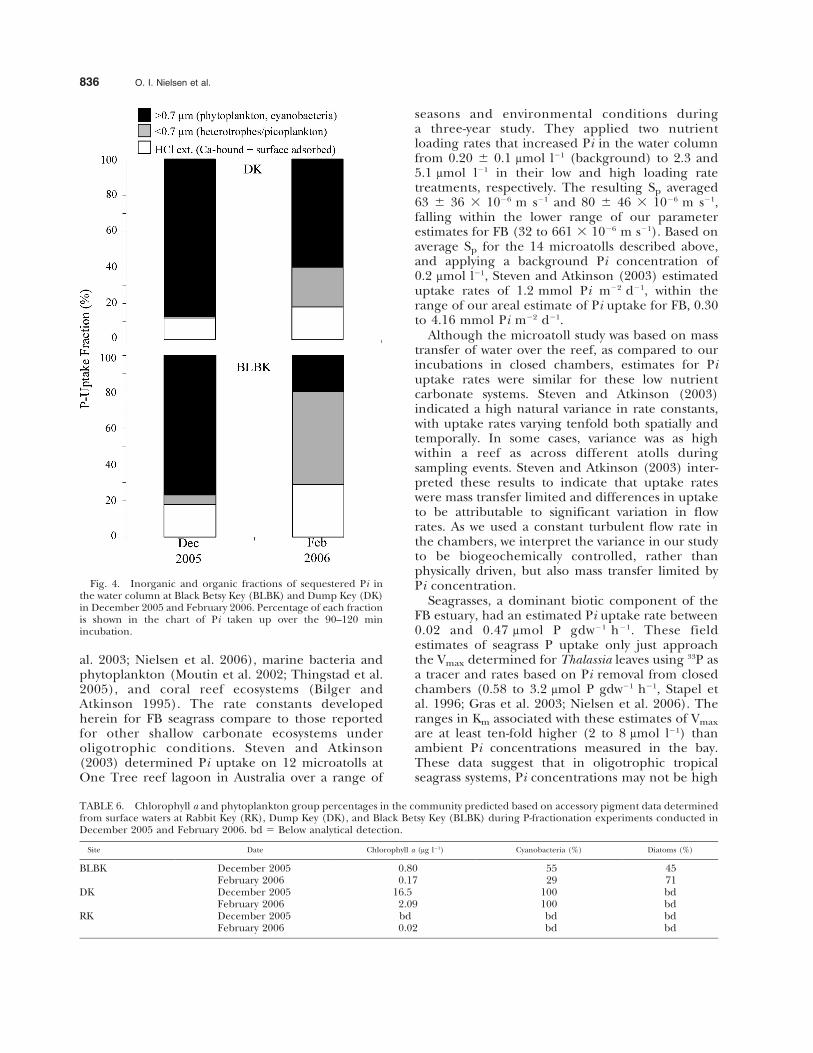
During the peak of the phytoplankton bloom atDK (December 2005), when chl a was 16 mg l21, themajority of the Pi spike (88%) was sequestered byphytoplankton (Fig. 4). Chemotaxonomy data in-dicated that the phytoplankton community in thebloom was completely dominated by cyanobacteria(100%, Table 6). A smaller amount of the Pi spikewas partitioned into the acid extractable fraction(12%), most likely as inorganic calcium bound andsurface adsorbed P. The remaining 1% was re-covered in the small size fraction, , 0.7 mm,attributed to heterotrophs. In February 2006, whenchl a at DK dropped to 2 mg l21, although stilldominated by cyanobacteria (Table 4), the pro-portion of the recovered P in the phytoplanktonfraction fell from 88% to 60% (Fig. 4). The acidextractable pool also moderately increased (Fig. 4).
During this time, more P was recovered in thesmaller heterotrophic fraction.
During a modest phytoplankton bloom at BLBKin December 2005, Pi uptake was also dominated(. 75%) by cyanobacteria (Fig. 4 and Table 6).When BLBK chl a fell from 0.8 to 0.2 mg l21 inFebruary 2006, the proportion of P recovered fromthe phytoplankton pool declined from 77% to 20%.Also at this time, phytoplankton in the communityshifted to 71% diatoms and only 29% cyanobacteria.As diatoms increased, the proportion of the Paccounted for by the calcium bound fraction alsoincreased. This may have resulted from resuspen-sion of sediments and associated benthic diatoms,a phenomenon known to occur in fine-grainedcarbonate systems characteristic of eastern FB.During the February sampling event at BLBK, whenphytoplankton biomass declined to levels morecommon in the eastern bay, the smaller heterotro-phic community became more important (Fig. 4).
Discussion
First-order dependence of Pi removal with time byall components of the FB and LBB seagrassecosystems indicate that uptake is primarily ratelimited at Pi levels , 2 mmol l21. Similar rate-limiteduptake at low Pi concentrations have been shownfor isolated T. testudinum leaves and roots (Gras et
TABLE 5. Inorganic phosphorus uptake kinetic parameter C0, the Pi concentration where net uptake is zero, according to modelpredictions based on in situ Pi uptake rates in chambers deployed in Florida Bay at Green Mangrove Key (GMK), Eagle Key (EK), BlackBetsy Key (BLBK), Rabbit Key (RK), and Dump Key (DK) and on the Little Bahamas Bank. C0 parameters are presented for chamber runswith the system (water column + sediment + seagrass), sediment (water column + sediment), and water column alone. Means are presentedwith 6 standard error (n . 3). Parameter estimates are considered slightly overestimated by the model (see methods). nd 5 notdetermined because negative values were interpolated by the model. - 5 missing data; * below analytical detection limit.
C0 (nmol Pi l21)
Florida Bay 2003–2004
Western Bay (GMK) Eastern Bay (EK)
Water Sediment System Water Sediment System
July 156 6 9 70 6 26 159 6 23 113 6 26 113 6 34 153 6 37October 164 6 8 187 6 16 - 152 6 57 91 6 18 72 6 14February 241 6 54 182 6 43 68 6 16 385 6 38 118 6 34 56 6 17April 194 6 59 130 6 64 97 6 28 285 6 67 66 6 35 39 6 8
Florida Bay 2005–2006
Western Bay (RK) Central Bay (DK) Eastern Bay (BLBK)
Water Sediment System Water Sediment System Water Sediment System
May nd Nd nd ,20* ,20* 21 6 5 53 6 53 84 6 44 63 6 19August nd 58 6 4 61 6 6 48 6 20 79 6 8 55 6 20 37 6 18 25 6 8 36 6 8December nd Nd nd 202 6 44 174 6 25 173 6 34 ,20* ,20* ,20*
February nd Nd nd 21 6 2 22 6 3 20 6 4 nd nd nd
Little Bahama Bank 2004
Bank Edge Bank Interior
Water Sediment System Water Sediment System
June T1 nd 64 6 39 121 6 42June T2 48 6 5 61 6 12 103 6 35June T3 29 6 4 48 6 22 54 6 11
Pi Uptake Seagrass Ecosystems 835
al. 2003; Nielsen et al. 2006), marine bacteria andphytoplankton (Moutin et al. 2002; Thingstad et al.2005), and coral reef ecosystems (Bilger andAtkinson 1995). The rate constants developedherein for FB seagrass compare to those reportedfor other shallow carbonate ecosystems underoligotrophic conditions. Steven and Atkinson(2003) determined Pi uptake on 12 microatolls atOne Tree reef lagoon in Australia over a range of
seasons and environmental conditions duringa three-year study. They applied two nutrientloading rates that increased Pi in the water columnfrom 0.20 6 0.1 mmol l21 (background) to 2.3 and5.1 mmol l21 in their low and high loading ratetreatments, respectively. The resulting Sp averaged63 6 36 3 1026 m s21 and 80 6 46 3 1026 m s21,falling within the lower range of our parameterestimates for FB (32 to 661 3 1026 m s21). Based onaverage Sp for the 14 microatolls described above,and applying a background Pi concentration of0.2 mmol l21, Steven and Atkinson (2003) estimateduptake rates of 1.2 mmol Pi m22 d21, within therange of our areal estimate of Pi uptake for FB, 0.30to 4.16 mmol Pi m22 d21.
Although the microatoll study was based on masstransfer of water over the reef, as compared to ourincubations in closed chambers, estimates for Piuptake rates were similar for these low nutrientcarbonate systems. Steven and Atkinson (2003)indicated a high natural variance in rate constants,with uptake rates varying tenfold both spatially andtemporally. In some cases, variance was as highwithin a reef as across different atolls duringsampling events. Steven and Atkinson (2003) inter-preted these results to indicate that uptake rateswere mass transfer limited and differences in uptaketo be attributable to significant variation in flowrates. As we used a constant turbulent flow rate inthe chambers, we interpret the variance in our studyto be biogeochemically controlled, rather thanphysically driven, but also mass transfer limited byPi concentration.
Seagrasses, a dominant biotic component of theFB estuary, had an estimated Pi uptake rate between0.02 and 0.47 mmol P gdw21 h21. These fieldestimates of seagrass P uptake only just approachthe Vmax determined for Thalassia leaves using 33P asa tracer and rates based on Pi removal from closedchambers (0.58 to 3.2 mmol P gdw21 h21, Stapel etal. 1996; Gras et al. 2003; Nielsen et al. 2006). Theranges in Km associated with these estimates of Vmax
are at least ten-fold higher (2 to 8 mmol l21) thanambient Pi concentrations measured in the bay.These data suggest that in oligotrophic tropicalseagrass systems, Pi concentrations may not be high
Fig. 4. Inorganic and organic fractions of sequestered Pi inthe water column at Black Betsy Key (BLBK) and Dump Key (DK)in December 2005 and February 2006. Percentage of each fractionis shown in the chart of Pi taken up over the 90–120 minincubation.
TABLE 6. Chlorophyll a and phytoplankton group percentages in the community predicted based on accessory pigment data determinedfrom surface waters at Rabbit Key (RK), Dump Key (DK), and Black Betsy Key (BLBK) during P-fractionation experiments conducted inDecember 2005 and February 2006. bd 5 Below analytical detection.
Site Date Chlorophyll a (mg l21) Cyanobacteria (%) Diatoms (%)
BLBK December 2005 0.80 55 45February 2006 0.17 29 71
DK December 2005 16.5 100 bdFebruary 2006 2.09 100 bd
RK December 2005 bd bd bdFebruary 2006 0.02 bd bd
836 O. I. Nielsen et al.
enough to promote saturation, limiting the appli-cability of Vmax and Km for modelling P uptake.
If we examine first order Pi uptake kinetics ofThalassia leaves (Stapel et al. 1996; Gras et al. 2003;Nielsen et al. 2006), using a similar range of Pi levelsfound in FB (# 0.26 mmol l21), uptake rates (0.0016to 0.05 mmol P gdw21 h21) fall within the range offield uptake rates measured herein, although at thelower end. The higher uptake rates calculated fromthe seagrass component in the field, compared tolaboratory uptake experiments with seagrass leavessuggest that the epiphytic consortium is important insequestering Pi in these systems. This was alsoevidenced in the fact that only a two-fold differencein benthic uptake was found between western andeastern sites, even though plant biomass changedthree-fold. While the seagrass epiphytic consortiumand sediment-phytomicrobenthos communities werefound to increase the efficiency in which Pi wassequestered from the chambers by approximately38% on average, Pi uptake was primarily controlledby the water column, particularly during phytoplank-ton blooms and during all incubations on LBB.
Water column Pi uptake rates in the bay rangedfrom 17 to 149 mmol m23 h21 in nonbloom condi-tions, comparing closely with rates calculated forMoreton Bay in subtropical Australia, 7 to 140 mmolm23 h21, using radioisotope (32PO4
32) assays underambient Pi concentrations # 2 mmol l21 (Glibert etal. 2006). In the ultra-oligotrophic gyre in theMediterranean Sea with extreme P limitation andambient Pi concentrations of only 0.002 mmol l21,
a maximum Pi uptake rate of 1.6 mmol m23 h21 wasestimated by Thingstad et al. (2005). Maximum Piuptake rates of 0.2 to 0.7 mmol m23 h21, close to thetheoretical maximum for diffusion limitation, wereestimated at ambient Pi concentrations along a west-east transect across the Mediterranean Sea (Moutinet al. 2002). If we use the seasonal average Sp fromFB and our data from LBB, and apply the very low Pilevels of the Mediterranean Sea (0.002 mmol l21), Piuptake would be 1.8 and 14 mmol m23 h21, re-spectively. FB water column kinetics align with thosefrom the Mediterranean, while the uptake rates onLBB interior are quite high. A fractionationexperiment at LBB would be required to determineif abiotic adsorption or biotic processes wereinfluencing these rapid rates of Pi sequestration.The only time we found comparable rates in FB wasduring phytoplankton blooms dominated by cyano-bacteria.
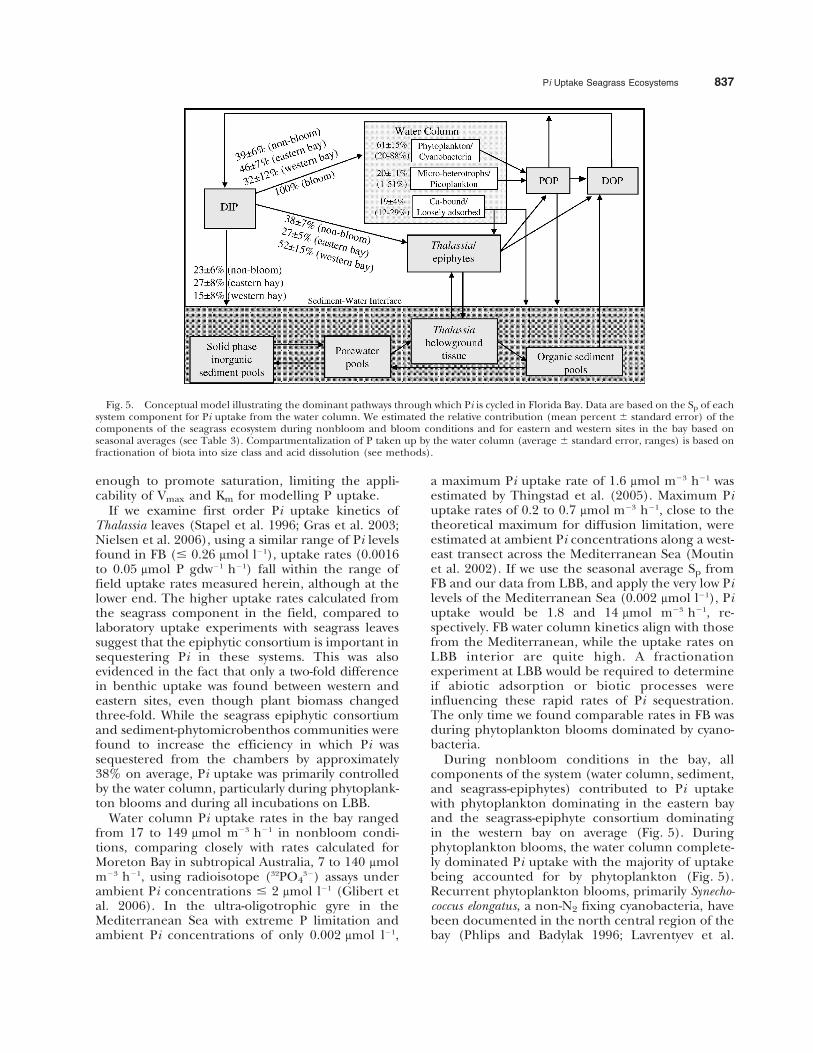
During nonbloom conditions in the bay, allcomponents of the system (water column, sediment,and seagrass-epiphytes) contributed to Pi uptakewith phytoplankton dominating in the eastern bayand the seagrass-epiphyte consortium dominatingin the western bay on average (Fig. 5). Duringphytoplankton blooms, the water column complete-ly dominated Pi uptake with the majority of uptakebeing accounted for by phytoplankton (Fig. 5).Recurrent phytoplankton blooms, primarily Synecho-coccus elongatus, a non-N2 fixing cyanobacteria, havebeen documented in the north central region of thebay (Phlips and Badylak 1996; Lavrentyev et al.
Fig. 5. Conceptual model illustrating the dominant pathways through which Pi is cycled in Florida Bay. Data are based on the Sp of eachsystem component for Pi uptake from the water column. We estimated the relative contribution (mean percent 6 standard error) of thecomponents of the seagrass ecosystem during nonbloom and bloom conditions and for eastern and western sites in the bay based onseasonal averages (see Table 3). Compartmentalization of P taken up by the water column (average 6 standard error, ranges) is based onfractionation of biota into size class and acid dissolution (see methods).
Pi Uptake Seagrass Ecosystems 837
1998; Phlips et al. 1999; Cotner et al. 2000; Glibertet al. 2004). Phlips et al. (1999) traced theformation of Synechococcus blooms from the north-central bay into the south-central bay during a 51-month study. The periodic movement of theseSynechococcus blooms through the bay can modifyP-cycling in the system, based on this group’sunique P uptake kinetics. We found cyanobacteriain the bay to have Sp constants several orders ofmagnitude greater than what is commonly foundunder nonbloom conditions. This genus has alsobeen shown to have the ability to sequester Pi at sub-micromolar levels (Moutin et al. 2002). Moutin etal. (2002) determined that Synechococcus (sizefraction 0.6–2 mm) had higher maximum specificPi uptake rates than heterotrophic bacteria andeukaryotic algae in the Mediterranean Sea where Piwas 0.2 to 2 nM, while heterotrophic bacteriashowed the greatest increase in affinity at Pi levels, 0.5 nM. They concluded that Synechococcus, witha high Pi affinity system and high rate of uptake, iscompetitively dominant over heterotrophic bacteriaduring episodic pulses of Pi in P-limited regions ofthe Mediterranean. Synechococcus may also be poisedto take advantage of pulses of Pi in FB generatedallochthonously or autochthonously via externalphosphatases (Cotner and Wetzel 1992; Cotner etal. 2000; Glibert et al. 2004; Thingstad et al. 2005;Koch unpublished data). Heterotrophic bacteriaappear to dominate in the bay when phytoplanktonbiomass is reduced, as was also observed by Cotneret al. (2000), perhaps related to their highersurface:volume ratio.
In FB, all components of the seagrass ecosystemreduced Pi to nanomolar concentrations, similar tothe range of surface water concentrations measuredin situ, suggesting a redundancy in the system tosequester Pi. Efficient uptake of Pi by several systemcomponents (Fig. 5) probably explains the observa-tion of consistently low water column Pi concentra-tions in carbonate-dominated seagrass ecosystems inthe tropics and subtropics (Patriquin 1972; Morse etal. 1987; Fourqurean et al. 1993; Jensen et al. 1998;Koch et al. 2001), including FB (long-term median0.04 mmol l21, Boyer et al. 1997, 1999) acrossa nutrient gradient. This may be controlled by P-limited biota rapidly scavenging Pi from the watercolumn and carbonate sediments sequestering Pover the long term into solid phase pools such asfluorapatite (Ruttenberg and Berner 1993; Jensen etal. 1998; Koch et al. 2001; Zhang et al. 2004).Although the sediment is a major sink for P incarbonate-dominated estuaries (Koch et al. 2001;Zhang et al. 2004), on average Pi sequestered acrossthe sediment-water interface was limited to 15% to27% on average in this study (Fig. 5). The poten-tially slower process of P incorporation into solid
phase inorganic P sediment pools, as well as higherporewater Pi, may have accounted for lower net Pisequestration at the sediment-water interface basedon Pi uptake kinetics.
We propose that in carbonate-dominated seagrasssystems, Pi is primarily taken up by the watercolumn biota, particularly when driven by cyano-bacteria with extremely rapid Pi uptake rates(Fig. 5). In the absence of algal blooms, suspendedsediments and heterotrophs in the water column, aswell as the benthos (seagrass $ sediment) becomemore important; although in highly oligotrophicsystems, such as on the interior of LBB, Pi uptakeappears to always be controlled by the watercolumn, even in the absence of phytoplanktonblooms. Once sequestered by the water column, P isremineralized or hydrolyzed in the water column orsettles to the benthos where it is incorporated intosediment porewater or solid phase pools supportingbenthic primary production (Fig. 5).
ACKNOWLEDGMENTS
This research was funded by the National Oceanic andAtmospheric Administration’s Coastal Ocean Program grantNA160P2547 and supplemented by the Danish Natural ScienceResearch Council grant 21030013/21040034. Everglades NationalPark’s Florida Bay Interagency Science Center in Key Largo,Florida, and the South Florida Water Management District, WestPalm Beach, Florida, provided field logistical support. FloridaInstitute of Oceanography provided logistical support forshiptime on the R.V. Bellow for our work on the Little BahamaBank. Dr. Louda and his laboratory at Florida Atlantic Universityanalyzed water samples for chemotaxonomy and chl a. We thankstudents and technicians at Aquatic Plant Ecology Lab for theirassistance in the field, and Dr. Henning Jensen for valuablecomments on the research and discussions on P cycling incarbonate environments. Two anonymous reviewers and oneanonymous editor in particular are sincerely thanked forsignificantly improving the manuscript.
LITERATURE CITED
ATKINSON, M. J. 1987. Rates of phosphate uptake by coral reef flatcommunities. Limnology and Oceanography 32:426–435.
BILGER, R. W. AND M. J. ATKINSON. 1995. Effects of nutrientloading on mass-transfer rates to a coral-reef community.Limnology and Oceanography 40:279–289.
BOWER, C. E. AND T. HOLM-HANSEN. 1980. A salicylate-hypochloritmethod for determining ammonia in seawater. CanadianJournal of Fisheries and Aquatic Sciences 37:794–798.
BOYER, J. N., J. W. FOURQUREAN, AND R. D. JONES. 1997. Spatialcharacterization of water quality in Florida Bay and WhitewaterBay by multivariate analysis: Zones of similar influence. Estuaries20:743–758.
BOYER, J. N., J. W. FOURQUREAN, AND R. D. JONES. 1999. Seasonaland long-term trends in water quality in Florida Bay (1989–1997). Estuaries 22:417–430.
COTNER, J. B., H. BOOTSMA, T. JOHENGEN, J. F. CAVALETTO, AND W. S.GARDNER. 2000. Nutrient limitation of heterotrophic bacteria inFlorida Bay. Estuaries 23:611–620.
COTNER, J. B. AND R. G. WETZEL. 1992. Uptake of dissolvedinorganic and organic phosphorus-compounds by phytoplank-ton and bacterioplankton. Limnology and Oceanography 37:232–243.
838 O. I. Nielsen et al.
CURRIE, D. J. AND J. KALFF. 1984. A comparison of the abilities offreshwater algae and bacteria to acquire and retain phosphorus.Limnology and Oceanography 29:298–310.
DE KANEL, J. AND J. W. MORSE. 1978. The chemistry oforthophosphate uptake from seawater on to calcite andaragonite. Geochimica et Cosmochimica Acta 42:1335–1340.
FALKNER, G., R. FALKNER, AND A. J. SCHWAB. 1989. Bioenergeticcharacterization of transient state phosphate uptake by thecyanobacterium Anacystis nidulans. Archives of Microbiology 152:353–361.
FOURQUREAN, J. W., R. D. JONES, AND J. C. ZIEMAN. 1993. Processesinfluencing water column nutrient characteristics and phos-phorus limitation of phytoplankton biomass in Florida Bay, FL,USA: Interferences from spatial distributions. Estuarine, Coastaland Shelf Science 36:295–314.
FOURQUREAN, J. W., J. C. ZIEMAN, AND G. V. N. POWELL. 1992a.Phosphorus limitation of primary production in Florida Bay –evidence from C-N-P ratios of the dominant seagrass Thalassiatestudinum. Limnology and Oceanography 37:162–171.
FOURQUREAN, J. W., J. C. ZIEMAN, AND G. V. N. POWELL. 1992b.Relationships between porewater nutrients and seagrasses insubtropical carbonate environments. Marine Biology 114:57–65.
GLIBERT, P. M., C. A. HEIL, D. HOLLANDER, M. REVILLA, A. HOARE, J.ALEXANDER, AND S. MURASKO. 2004. Evidence for dissolvedorganic nitrogen and phosphorus uptake during a cyanobacterialbloom in Florida Bay. Marine Ecology Progress Series 280:73–83.
GLIBERT, P. M., C. A. HEIL, J. M. O’NEIL, W. C. DENNISON, AND
M. J. H. O’DONOHUE. 2006. Nitrogen, phosphorus, silica, andcarbon in Moreton Bay, Queensland, Australia: Differentiallimitation of phytoplankton biomass and production. Estuariesand Coasts 29:209–221.
GRAS, A. F., M. S. KOCH, AND C. J. MADDEN. 2003. Phosphorusuptake kinetics of a dominant tropical seagrass Thalassiatestudinum. Aquatic Botany 76:299–315.
GRASSHOFF, K. 1983a. Determination of nitrite, p. 139–142. In K.Grasshoff, M. Ehrhardt, and K. Kremling (eds.), Methods ofSeawater Analysis, 3rd edition. Verlag Chemie, Weinheim,Germany.
GRASSHOFF, K. 1983b. Determination of nitrate, p. 143–150. In K.Grasshoff, M. Ehrhardt, and K. Kremling (eds.), Methods ofSeawater Analysis, 3rd edition. Verlag Chemie, Weinheim,Germany.
HOWARTH, R. W. 1988. Nutrient limitation of net primaryproduction in marine ecosystems. Annual Review of Ecology andSystematics 19:89–110.
JENSEN, H. S., K. J. MCGLATHERY, R. MARINO, AND R. W. HOWARTH.1998. Forms and availability of sediment phosphorus incarbonate sand of Bermuda seagrass beds. Limnology andOceanography 43:799–810.
KITANO, Y., M. OKUMURA, AND M. IDOGAKI. 1978. Uptake of phos-phate ions by calcium carbonate. Geochemical Journal 12:29–37.
KOCH, M. S., R. E. BENZ, AND D. T. RUDNICK. 2001. Solid-phasephosphorus pools in highly organic carbonate sediments ofnortheastern Florida Bay. Estuarine, Coastal and Shelf Science 52:270–291.
KOROLEFF, F. 1983. Determination of phosphorus, p. 125–139. InK. Grasshoff, M. Ehrhardt, and K. Kremling (eds.), Methods ofSeawater Analysis. Verlag Chemie, Weinheim, Germany.
LAVRENTYEV, P. J., H. A. BOOTSMA, T. H. JOHENGEN, J. F. CAVALETTO,AND W. S. GARDNER. 1998. Microbial plankton response toresource limitation: Insight from community structure andseston stoichiometry in Florida Bay, USA. Marine Ecology ProgressSeries 165:45–57.
LOUDA, J. W., L. LIU, AND E. W. BAKER. 2002. Senescence- anddeath-related alteration of chlorophylls and carotenoids inmarine phytoplankton. Organic Geochemistry 33:1635–1653.
MCGLATHERY, K. J., R. MARINO, AND R. W. HOWARTH. 1994.Variable rates of phosphate uptake by shallow marine carbon-ate sediments: Mechanisms and ecological significance. Bio-geochemistry 25:127–146.
MILLERO, F. J., F. HUANG, X. ZHU, X. LIU, AND J. Z. ZHANG. 2001.Adsorption and desorption of phosphate on calcite andaragonite in seawater. Aquatic Geochemistry 7:33–56.
MONAGHAN, E. AND K. RUTTENBERG. 1999. Dissolved organicphosphorus in the coastal ocean: Reassessment of availablemethods and seasonal phosphorus profiles from the Eel RiverShelf. Limnology and Oceanography 44:1702–1714.
MORSE, J. W., J. J. ZULLIG, R. L. IVERSON, G. R. CHOPPIN, A. MUCCI,AND F. J. MILLERO. 1987. The influence of seagrass beds oncarbonate sediments in the Bahamas. Marine Chemistry 22:71–83.
MOUTIN, T., T. F. THINGSTAD, F. V. WAMBEKE, D. MARIE, G. SLAWYK,P. RAIMBAULT, AND H. CLAUSTRE. 2002. Does competition fornanomolar phosphate supply explain the predominance of thecyanobacterium Synechococcus? Limnology and Oceanography 47:1562–1567.
NIELSEN, O. I., M. S. KOCH, H. S. JENSEN, AND C. J. MADDEN. 2006.Thalassia testudinum phosphate uptake kinetics at low in situconcentration using a 33P radioisotope technique. Limnology andOceanography 51:208–217.
PATRIQUIN, D. G. 1972. The origin of nitrogen and phosphorus forgrowth of marine angiosperm Thalassia testudinum. MarineBiology 15:33–46.
PHLIPS, E. J. AND S. BADYLAK. 1996. Spatial variability inphytoplankton standing crop and composition in a shallowinner-shelf lagoon, Florida Bay, Florida. Bulletin of Marine Science58:203–216.
PHLIPS, E. J., S. BADYLAK, AND T. C. LYNCH. 1999. Blooms of thepicoplankton cyanobacterium Symechococcus in Florida Bay,a subtropical inner-shelf lagoon. Limnology and Oceanography44:1166–1175.
POWELL, G. V. N., W. J. KENWORTHY, AND J. W. FOURQUREAN. 1989.Experimental evidence for nutrient limitation of seagrassgrowth in a tropical estuary with restricted circulation. Bulletinof Marine Science 44:324–340.
RUDNICK, D. T., Z. CHEN, D. L. CHILDERS, J. N. BOYER, AND T. D.FONTAINE, III. 1999. Phosphorus and nitrogen inputs to FloridaBay: The importance of the Everglades watershed. Estuaries 22:398–416.
RUTTENBERG, K. C. AND R. A. BERNER. 1993. Authigenic apatiteformation and burial in sediments from non-upwelling,continental-margin environments. Geochimica et CosmochimicaActa 57:991–1007.
SHORT, F. T., W. C. DENNISON, AND D. G. CAPONE. 1990.Phosphorus-limited growth of the tropical seagrass Syrengodiumfiliforme in carbonate sediments. Marine Ecology Progress Series 62:169–174.
STAPEL, J., T. L. AARTS, B. H. M. VAN DUYNHOVEN, J. D. DE GROOT,P. H. W. VAN DEN HOOGEN, AND M. A. HEMMINGA. 1996. Nutrientuptake by leaves and roots of the seagrass Thalassia hemprichii inthe Spermonde Archipelago, Indonesia. Marine Ecology ProgressSeries 134:195–206.
STEVEN, A. D. L. AND M. J. ATKINSON. 2003. Nutrient uptake bycoral-reef microatolls. Coral Reefs 22:197–204.
THINGSTAD, T. F., M. D. KROM, R. F. C. MANTOURA, G. A. F. FLATEN,S. GROOM, B. HERUT, N. KRESS, C. S. LAW, A. PASTERNAK, P.PITTA, S. PSARRA, F. RASSOULZADEGAN, T. TANAKA, A. TSELEPIDES,P. WASSMANN, E. M. S. WOODWARD, C. WEXELS RISER, G.ZODIATIS, AND T. ZOHARY. 2005. Nature of phosphoruslimitation in the ultraoligtrophic eastern Mediterranean. Science309:1068–1071.
ZHANG, J.-Z., C. J. FISHER, AND P. B. ORTNER. 2004. Potentialavailability of sedimentary phosphorus to sediment resuspen-sion in Florida Bay. Global Biogeochemical Cycles 18, GB4008.doi:10.1029/2004GB002255.
Received, September 5, 2006Revised, July 11, 2007
Accepted, July 19, 2007
Pi Uptake Seagrass Ecosystems 839