Embed Size (px)
Citation preview


INOX WIND LIMITED Q3FY18 INVESTOR UPDATE

DISCLAIMER
2
This presentation and the following discussion may contain “forward looking statements” by Inox Wind Limited (“IWL” or “the
Company”) that are not historical in nature. These forward looking statements, which may include statements relating to
future state of affairs, results of operations, financial condition, business prospects, plans and objectives, are based on the
current beliefs, assumptions, expectations, estimates, and projections of the management of IWL about the business, industry
and markets in which IWL operates.
These statements are not guarantees of future performance, and are subject to known and unknown risks, uncertainties, and
other factors, some of which are beyond IWL’s control and difficult to predict, that could cause actual results, performance or
achievements to differ materially from those in the forward looking statements.
Such statements are not, and should not be construed, as a representation as to future performance or achievements of IWL.
In particular, such statements should not be regarded as a projection of future performance of IWL. It should be noted that the
actual performance or achievements of IWL may vary significantly from such statements.
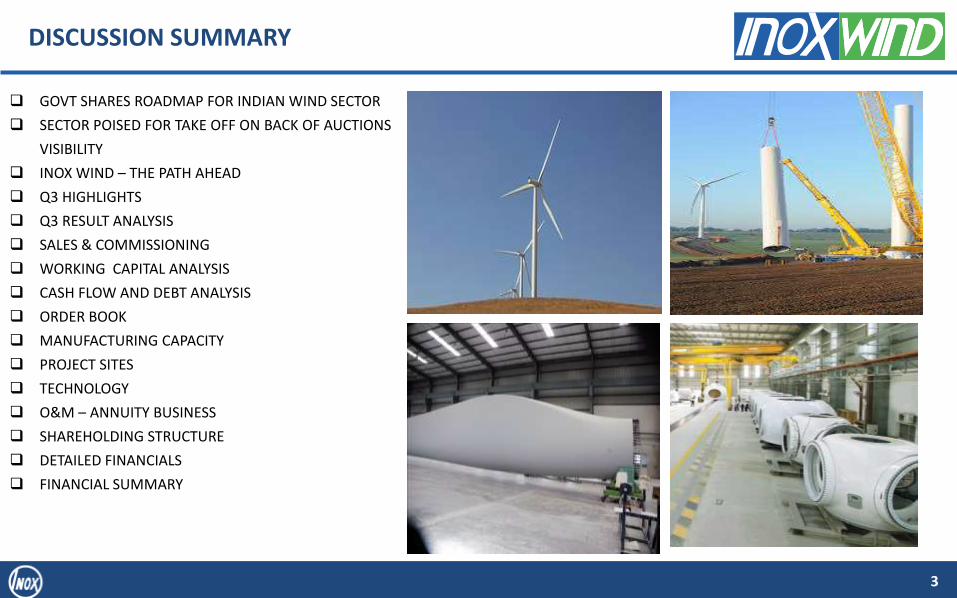
DISCUSSION SUMMARY
3
GOVT SHARES ROADMAP FOR INDIAN WIND SECTOR
SECTOR POISED FOR TAKE OFF ON BACK OF AUCTIONS
VISIBILITY
INOX WIND – THE PATH AHEAD
Q3 HIGHLIGHTS
Q3 RESULT ANALYSIS
SALES & COMMISSIONING
WORKING CAPITAL ANALYSIS
CASH FLOW AND DEBT ANALYSIS
ORDER BOOK
MANUFACTURING CAPACITY
PROJECT SITES
TECHNOLOGY
O&M – ANNUITY BUSINESS
SHAREHOLDING STRUCTURE
DETAILED FINANCIALS
FINANCIAL SUMMARY

4
GOVT SHARES ROADMAP FOR INDIAN WIND SECTOR
Q3FY18 was a landmark quarter for the Indian wind energy sector on back of the following policy announcements-:
Stronger than expected roadmap – Provides clarity on future auction volumes. The Honourable Power Minister, Shri R K
Singh, announced the roadmap to reach the government’s target of 60GW of wind power installations by 2022 through wind
auctions of 10GW in FY19 & FY20 each.* This is a major step in providing an order pipeline of the future wind auctions to
come for all stakeholders in the wind sector including IPPs, WTG manufacturers , financial institutions etc.
FY18 set for a strong finish on the auctions front. Government all set to finish FY18 by conducting over 4000MW of auctions
in the Jan-March quarter via SECI-3 (2000MW), Maharashtra (500MW) ** and SECI-4. This is on back of the 3000MW auctions
already done so far in the year (SECI-1, SECI-2, Tamil Nadu & Gujarat state auctions) which, if they happen as scheduled,
should take the total volume of auctions in FY18 to 6GW-7GW. ***
PPA ratification issue in Karnataka resolved. Karnataka govt invokes Section 108 of Electricity Act & KERC starts to ratify and
honour earlier signed PPA’s . ****
Auction regime drives higher & faster adoption of renewable energy. The reduced cost of power from renewable auctions
provide a strong economic rationale for preferring renewables vs. Fossil fuels. At today’s auction prices, wind energy is the
lowest cost of power amongst the various options available for discoms.
* http://www.livemint.com/Industry/1yhOAeUgYHEolNADdwPS3L/India-to-auction-100GW-of-green-energy-contracts-by-March-20.html ** http://www.mahadiscom.in/TCIL_W_22122017.shtm *** http://www.livemint.com/Industry/z29lEYul5Gl995os5zSqHK/India-readies-green-energy-auction-rounds.html **** https://economictimes.indiatimes.com/industry/energy/power/kerc-okays-wind-ppa-at-old-tariff-to-assess-other-projects/articleshow/61826953.cms

5
SECTOR POISED FOR TAKE OFF ON BACK OF AUCTIONS VISIBILITY
Central Auctions – SECI
SECI-1 (1000MW) & SECI-2 (1000MW) already conducted .
SECI 3 (2000MW) – Bid documents submitted. Auction expected to be held in February, 18.
SECI 4 (2000MW) – Expected to be conducted by March, 18 *
FY19 – 10GW via central and state auctions.**
FY20 - 10GW via central and state auctions.**
State Auctions
Tamil Nadu (500MW) and Gujarat (500MW) state auctions already conducted.
Maharashtra – 500MW auctions announced. ***
Rajasthan – Announced 250MW wind auctions. Would follow up with tender documents and guidelines.
Other windy states are working on their tender documents which should be released in due course of time.
PSU/Captives
Over 500MW of PSU tenders in the public domain.
*http://www.livemint.com/Industry/z29lEYul5Gl995os5zSqHK/India-readies-green-energy-auction-rounds.html ** http://www.livemint.com/Industry/1yhOAeUgYHEolNADdwPS3L/India-to-auction-100GW-of-green-energy-contracts-by-March-20.html *** http://www.mahadiscom.in/TCIL_W_22122017.shtm
We anticipate FY19 as the beginning of a phase of robust growth for the wind industry backed by a trajectory of significant volume of auctions of 6GW-10GW on a sustainable basis.

6
INOX WIND – THE PATH AHEAD
• Auction regime is expected to increase the WTG market to 6GW-10GW annually on a sustainable basis. This is driven by cost of wind power now being even lower than conventional sources of power.
• Indian wind power market expected to be as follows-:
• 4GW-6GW from SECI auctions,
• 2GW-3GW from state auctions,
• 1GW+ from PSU/captives.
Indian WTG market expected to be 6GW-10GW per annum
on a sustainable basis vs. average historic levels of
3GW+ p.a.
• We have captured 30% market share in SECI-1 and 30% in SECI-2 auctions vs. our historic market share of 15-20%.
• Our cost competitiveness gives us an edge in winning market share from incumbents. In the auction regime, we are gaining market share and maintaining healthy profitability at the same time.
• SECI 1 – Inox wind won an order book of 300MW from SECI 1 auctions showing ~30% market share.
• SECI 2 – Inox wind won an order book of 300MW from SECI 2 auctions showing 30% market share.
Inox Wind market share increasing with sustainable
profits
• With the nature of business changing in the auction regime vs. FIT regime, we are looking at lower levels of investments in working capital and inventory since the wind business would not be a “4th quarter” phenomenon.
• Smoother trajectory of production & execution cycle leading to improved working capital management
• No risk of stuck assets due to non signing of PPAs.
Working capital & inventory levels to come down under the
auction regime
Our cost focus and competiveness leads us to focus on growth while maintaining healthy profitability levels.

The sector is coming back much stronger on back of the clear & visible roadmap on auctions provided by
the government for wind power auctions in the future to reach India’s target of achieving wind power
installations of 60GW by 2022. The government has guided for 10GW auctions in FY19 & FY20 each.
Update on SECI-2 win. Having tied up SECI-1, we have tied up major capacities of our SECI-2 win with two
large IPPs.
Order book. Won order of 50MW from Adani Green from their SECI-2 win. This takes our total auction
based order book to 600MW.
Karnataka issue resolved for Inox Wind. We have started execution in full swing of our stuck Karnataka
orders since the regulator has started ratifying earlier signed PPAs post the invocation of Section 108 by the
Karnataka government.
Net receivables reduced by Rs298cr to Rs1,360cr (vs. Rs 1,658cr in Sept17) in Q3FY18 and by Rs1,022cr
YTDFY18 (Rs 2,382cr in March, 17).
Q3 HIGHLIGHTS
7
•https://economictimes.indiatimes.com/industry/energy/power/kerc-okays-wind-ppa-at-old-tariff-to-assess-other-projects/articleshow/61826953.cms

Q3 RESULT ANALYSIS
8
In Rs. Cr. REVENUES EBITDA & EBITDA MARGIN (%)
PAT & PAT MARGIN (%)
1,161
91
Q3 FY17 Q3 FY18
REVENUES
108
(46)
9.3%
-50.7%
Q3FY17 Q3FY18
PAT PAT %
184
(18)
15.9%
-19.8% Q3 FY17 Q3 FY18
EBIDTA EBIDTA %
Consolidated Financials as per IND AS Q3 results reflect the ongoing transition to the auction regime in the Indian Wind Power sector

9
SALES & COMMISSIONING
266
142
180
40
10 10 12 4
Nacelles & Hubs Blades Towers Commissioning
Q3 FY17 (MW) Q3 FY18 (MW)
The sales & commissioning data reflects the ongoing transition to the auction regime in the Indian Wind Power sector during FY18
428
508 466
234
10 30 14
90
Nacelles & Hubs Blades Towers Commissioning
9M FY17 (MW) 9M FY18 (MW)

WORKING CAPITAL ANALYSIS
10
• Net receivables reduced by Rs298cr to Rs1,360cr (vs. Rs 1,658cr in Sept17) in Q3FY18 and by Rs1,022cr YTDFY18 (Rs 2,382cr in March, 17).
• Net Working capital reduced by Rs217cr to Rs1,709cr (vs. Rs1,927cr in Sept, 17) in Q3FY18.
Particulars (Rs Cr) Dec-16 Mar-17 Jun-17 Sep-17 Dec-17
Inventory 745.6 690.4 866.5 955.4 940.6
Receivables 2,488.6 2,382.4 1,984.3 1,658.3 1,360.3
Payables 1,152.3 968.7 628.8 506.1 451.7
Others 118.7 300.2 142.3 180.8 139.7
Net Working Capital 1,963.2 1,804.0 2,079.8 1,926.9 1,709.5

11
CASH FLOW AND DEBT ANALYSIS
Net D/E ratio of 0.44x
(In Rs cr) Q3FY17 FY17 Q3FY18
Opening Net debt (1,027) (641) (1,037)
Cash Profit 119 347 (32)
Net working capital 63 (163) 217
Capex (53) (303) (16)
Other (48) (19) (34)
Closing Net debt (946) (779) (901)
(In Rs cr) Q3FY17 FY17 Q3FY18
Net Debt 946 779 901
Equity 2,080 2,190 2,059
Net Debt: Equity (x) 0.45 0.36 0.44

ORDER BOOK
12
Current order book stands at 600MW based on SECI-1 & SECI-2 auctions. During the quarter, we won an
order of 50MW from Adani Green from their SECI-2 win.
Expected auction pipeline as follows :
Jan- March, 18 *
SECI-3 – 2000MW
SECI -4 – 2000MW
Maharashtra state auction – 500MW
FY19 & FY20 - 10GW each **
We anticipate FY19 as the beginning of a phase of robust growth for the wind industry. We believe that Inox
Wind, on the back of its cost-competitive advantage of being amongst the lowest cost producer of wind
turbines globally, would be a major beneficiary in the auctioning regime.
* http://www.livemint.com/Industry/1yhOAeUgYHEolNADdwPS3L/India-to-auction-100GW-of-green-energy-contracts-by-March-20.html ** http://www.livemint.com/Industry/z29lEYul5Gl995os5zSqHK/India-readies-green-energy-auction-rounds.html

13
CURRENT CAPACITY (MW)
Plant Location Una,
Himachal Pradesh
Rohika, Gujarat
Barwani, Madhya Pradesh
Total
Nacelles & Hubs 1,100 - - 1,100
Blades - 800 800 1,600
Towers - 300 300 600
MANUFACTURING CAPACITY
Well positioned to take advantage of the growing market.
Potential to debottleneck our nacelle and tower capacity with minor capex.
Tower capacity can also be outsourced depending on project location.

14
PROJECT SITES
Amongst the largest project site allottees in
Gujarat, Rajasthan and Madhya Pradesh
Expanded presence in Andhra Pradesh and
Karnataka and Kerala
Sufficient project site inventory for installation
of an aggregate capacity of more than 5,000
MW
Rajasthan
Gujarat
Maharashtra
Madhya Pradesh
Andhra Pradesh
Tamil Nadu
Karnataka
LEADERSHIP ACROSS WIND RICH STATES Kerala

TECHNOLOGY
15
Higher Energy Yield
Lower Energy Cost
Higher Returns
18%
20%
WT 93/80 WT 100/92 WT 113/120
Moving towards bigger turbines on the same platform
Inox Wind is working towards creating the
next generation of Wind turbines.
Launched “Power Booster” technology
upgrade leading to enhancing output across
the operating fleet.
One of the few players to have 120m hybrid
towers in India.

O&M – ANNUITY BUSINESS
16
Inox Wind has an installed wind turbine base of approx 2.2GW in India with multi year O&M agreements
In FY17, O&M revenues are ~3% of our revenues but we expect this revenue stream to pick up strongly in
the coming years as the fleet size increases
O&M revenues are noncyclical in nature, have steady cash flow generation and higher margins

SHAREHOLDING STRUCTURE
17
% Shareholding – As of 31st Dec 2017
Source - BSE
Source – Company
Promoter & Promoter Group, 86
FII, 1 DII, 5
Public, 8
Source - BSE
Source - Company
Key Institutional Investors as of 31st Dec2017 % Holding
Aadi Financial Advisors 2.0%
Indiaman Fund (Mauritius) 0.2%
MV SCIF Mauritius 0.2%
HSBC Mutual Funds 0.2%
Aditya Birla Sun Life Funds 0.1%
Market Data As on 01.02.18 (BSE)
Market capitalization (Rs. Cr) 2845
Price (Rs.) 128
No. of shares outstanding (Cr) 22
Face Value (Rs.) 10.0 100
120
140
160
180
200
220
Jan
-17
Feb
-17
Mar
-17
Ap
r-1
7
May
-17
Jun
-17
Jul-
17
Jul-
17
Au
g-1
7
Sep
-17
Oct
-17
No
v-1
7
Dec
-17
Jan
-18
Inox Wind Share Price (Rs)

DETAILED FINANCIALS CONSOLIDATED P&L STATEMENT
18
(In Rs Lakhs) Q3FY18 Q3FY17 YoY Q2FY18 QoQ 9MFY18 9MFY17 YoY
Income
(a) Revenue from operations (net of taxes) 9,093 116,062 7,951 27,643 239,578
(b) Other income 380 1,444 764 2,213 5,099
Total Income (a+b) 9,473 117,506 -92% 8,715 9% 29,856 244,677 -88%
Expenses
a) Cost of materials consumed 1,367 78,901 -98% 444 208% 3,227 155,290 -98%
b) Changes in inventories of finished goods and work-in-progress 1,925 -2,762 -170% 1,996 -4% 2,117 -5,357 -140%
c) Employee benefits expense 2,408 2,813 -14% 2,598 -7% 7,692 8,841 -13%
d)Finance costs 4,063 4,070 0% 4,449 -9% 12,753 11,095 15%
e) EPC, O&M, and Common Infrastructure Facility expenses 3,010 8,970 -66% 2,900 4% 13,067 22,075 -41%
f) Net (gain)/loss on foreign exchange fluctuation and derivatives -225 -313 -28% 239 -194% -548 -835 -34%
g) Depreciation and amortization expense 1,340 1,179 14% 1,352 -1% 4,002 3,240 24%
h) Other expenses 2,411 10,045 -76% 1,797 34% 7,246 26,481 -73%
Total Expenses (a to h) 16,299 102,903 -84% 15,775 3% 49,556 220,830 -78%
Net Expenses 16,299 102,903 -84% 15,775 3% 49,556 220,830 -78%
Profit/(Loss) before tax -6,826 14,603 -147% -7,060 -3% -19,700 23,847 -183%
Total Tax Expense -2,214 3,852 -157% -2,379 -7% -6,505 6,272 -204%
Profit/(Loss) for the period -4,612 10,751 -143% -4,681 -1% -13,195 17,575 -175%
Other Comprehensive Income 72 -6 71 182 -3
Total Comprehensive Income/(Expense) for the period
comprising Net Profit/(Loss) for the period & Other
Comprehensive Income (7+8) -4,540 10,745 -142% -4,610 -2% -13,013 17,572 -174%
Earnings Before Interest, Tax, Depreciation & Amortization (EBITDA) -1,423 19,852 -107% -1,259 13% -2,945 38,182 -108%
Paid-up Equity Share Capital (Face value of Rs. 10 each) 22,192 22,192 22,192 22,192 22,192
Basic & Diluted Earnings per share (Rs) (Face value of Rs 10
each) –Not annualized -2.08 4.84 -143% -2.11 -1% -5.95 7.92 -175%

FINANCIAL SUMMARY
19
ROE: PAT/Avg. Equity, ROCE: EBIT/Avg. Capital Employed [(Capital Employed = Equity + Total Debt)
In Rs. Cr
150 132
296
461
303
14.2% 8.4% 10.9% 10.3% 8.7%
FY13 FY14 FY15 FY16 FY17
PAT (cr) PAT Margin %
201 185
472
783 626
19.0% 11.8%
17.4% 17.6% 18.3%
FY13 FY14 FY15 FY16 FY17
EBITDA (cr) EBITDA Margin %
1,059 1,567
2,709
4,451
3,415
FY13 FY14 FY15 FY16 FY17
Revenue from Operations EBIDTA (Inc OI) & EBIDTA Margin % PAT & PAT Margin %
Return Ratios
CAGR – 34% CAGR – 33% CAGR – 21%
41%
21% 28% 27%
16%
70%
37% 33% 28%
15%
FY13 FY14 FY15 FY16 FY17
ROCE % ROE % Consolidated financials, FY13-15 as per IGAAP, FY16-17 as per Ind AS
Net Debt/Equity
296 428
1,392
1,844
2,190
273 448
5
641 779
0.92 1.05
0.00 0.35 0.36
FY13 FY14 FY15 FY16 FY17 Equity Net Debt Net D/E

20
THANK YOU
Mr. Atul Soni Head - Investor Relations- Inox Wind Contact No: 0120 6149881 Email : [email protected]
FOR FURTHER QUERIES :