Embed Size (px)
Citation preview
INPEX CORPORATION
Financial Results for the Six Months ended September 30, 2012
November 7, 2012
1
Agenda
1. Corporate Overview Representative Director, President & CEO
Toshiaki Kitamura
2. Financial Results for the six months ended September 30, 2012
Director, Managing Executive Officer
Head of Finance & Accounting Division
Masahiro Murayama
2
Cautionary Statement
This presentation includes forward-looking information that reflects the plan and expectations of the Company. Such forward-looking information is based on the current assumptions and judgments of the Company in light of the information currently available to it, and involves known and unknown risk, uncertainties, and other factors. Such risks, uncertainties and other factors may cause the Company’s performance, achievements or financial position to be materially different from any future results, performance, achievements or financial position expressed or implied by such forward-looking information. Such risks, uncertainties and other factors include, without limitation:
Price volatility and change in demand in crude oil and natural gas
Foreign exchange rate volatility
Change in costs and other expenses pertaining to the exploration, development and production
The Company undertakes no obligation to publicly update or revise the disclosure of information in this presentation (including forward-looking information) after the date of this presentation.
Corporate Overview
Toshiaki Kitamura
Representative Director, President & CEO
4
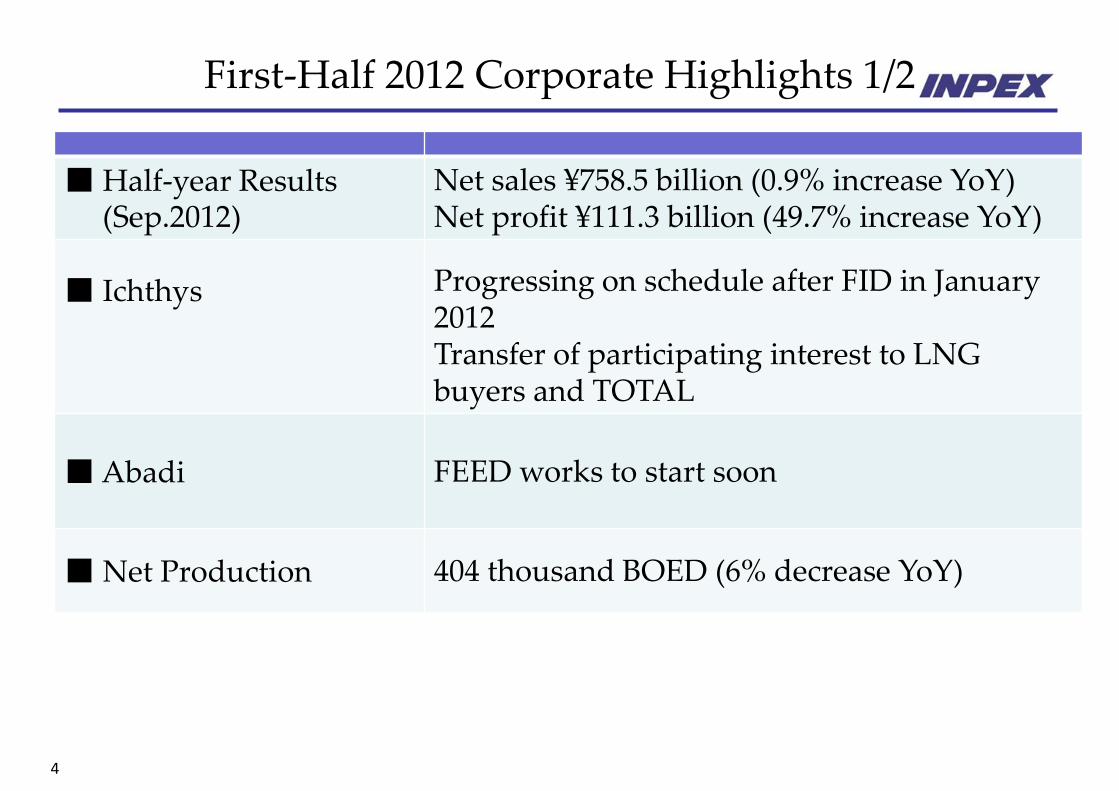
First-Half 2012 Corporate Highlights 1/2
■ Half-year Results (Sep.2012)
Net sales ¥758.5 billion (0.9% increase YoY) Net profit ¥111.3 billion (49.7% increase YoY)
■ Ichthys
Progressing on schedule after FID in January 2012 Transfer of participating interest to LNG buyers and TOTAL
■ Abadi FEED works to start soon
■ Net Production 404 thousand BOED (6% decrease YoY)
5
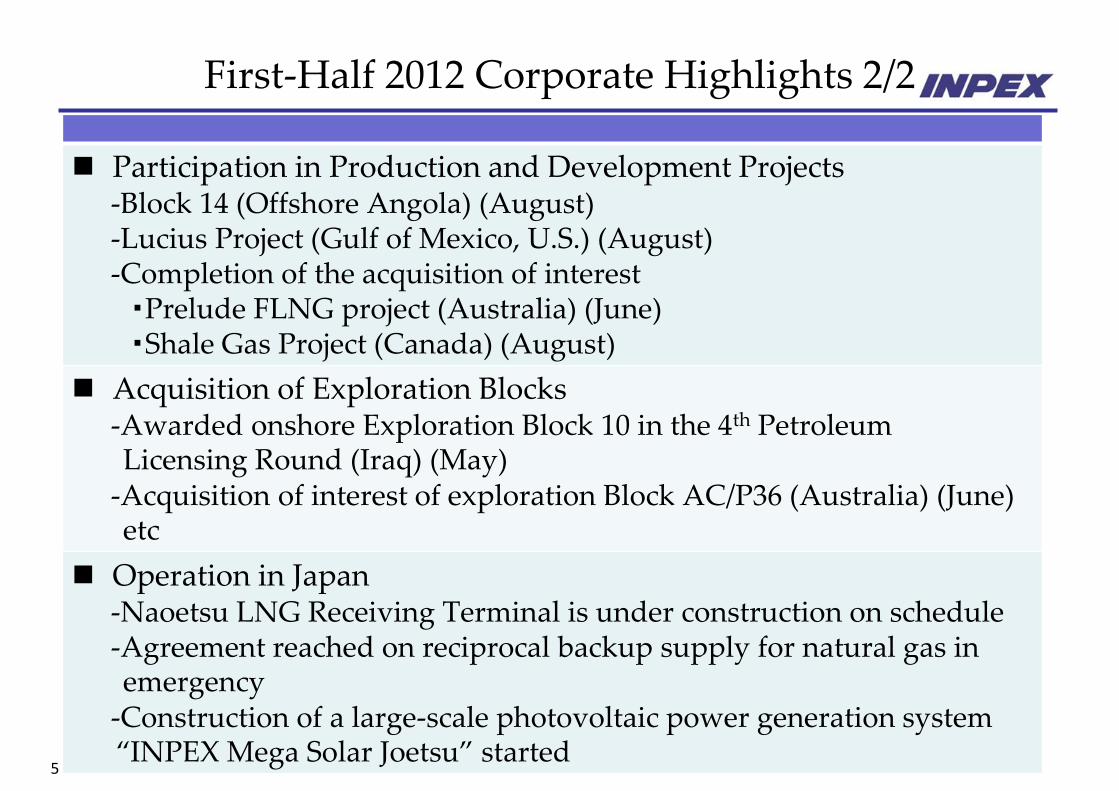
Participation in Production and Development Projects -Block 14 (Offshore Angola) (August) -Lucius Project (Gulf of Mexico, U.S.) (August) -Completion of the acquisition of interest ・Prelude FLNG project (Australia) (June) ・Shale Gas Project (Canada) (August)
Acquisition of Exploration Blocks -Awarded onshore Exploration Block 10 in the 4th Petroleum Licensing Round (Iraq) (May) -Acquisition of interest of exploration Block AC/P36 (Australia) (June) etc
Operation in Japan -Naoetsu LNG Receiving Terminal is under construction on schedule -Agreement reached on reciprocal backup supply for natural gas in emergency -Construction of a large-scale photovoltaic power generation system ‚INPEX Mega Solar Joetsu‛ started
First-Half 2012 Corporate Highlights 2/2
6
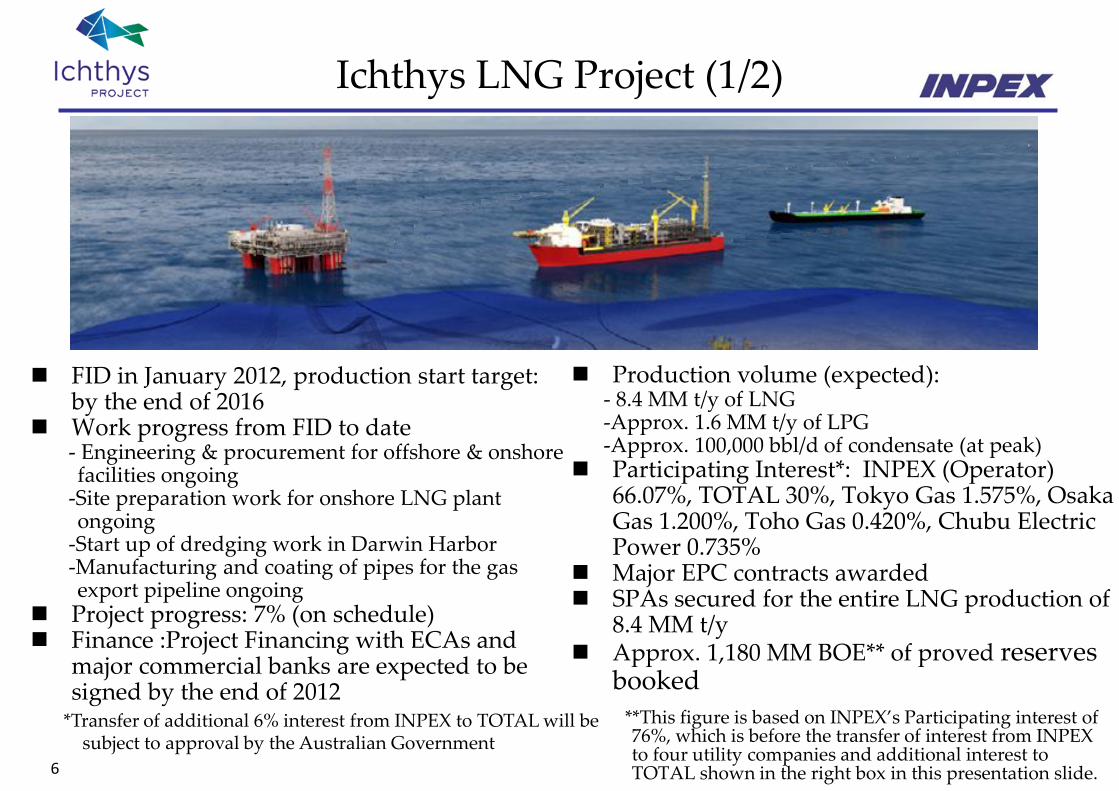
Ichthys LNG Project (1/2)
FID in January 2012, production start target: by the end of 2016
Work progress from FID to date - Engineering & procurement for offshore & onshore facilities ongoing
-Site preparation work for onshore LNG plant ongoing
-Start up of dredging work in Darwin Harbor -Manufacturing and coating of pipes for the gas export pipeline ongoing
Project progress: 7% (on schedule) Finance :Project Financing with ECAs and
major commercial banks are expected to be signed by the end of 2012
**This figure is based on INPEX’s Participating interest of 76%, which is before the transfer of interest from INPEX to four utility companies and additional interest to TOTAL shown in the right box in this presentation slide.
Production volume (expected): - 8.4 MM t/y of LNG -Approx. 1.6 MM t/y of LPG -Approx. 100,000 bbl/d of condensate (at peak) Participating Interest*: INPEX (Operator)
66.07%, TOTAL 30%, Tokyo Gas 1.575%, Osaka Gas 1.200%, Toho Gas 0.420%, Chubu Electric Power 0.735%
Major EPC contracts awarded SPAs secured for the entire LNG production of
8.4 MM t/y Approx. 1,180 MM BOE** of proved reserves
booked
*Transfer of additional 6% interest from INPEX to TOTAL will be subject to approval by the Australian Government
7
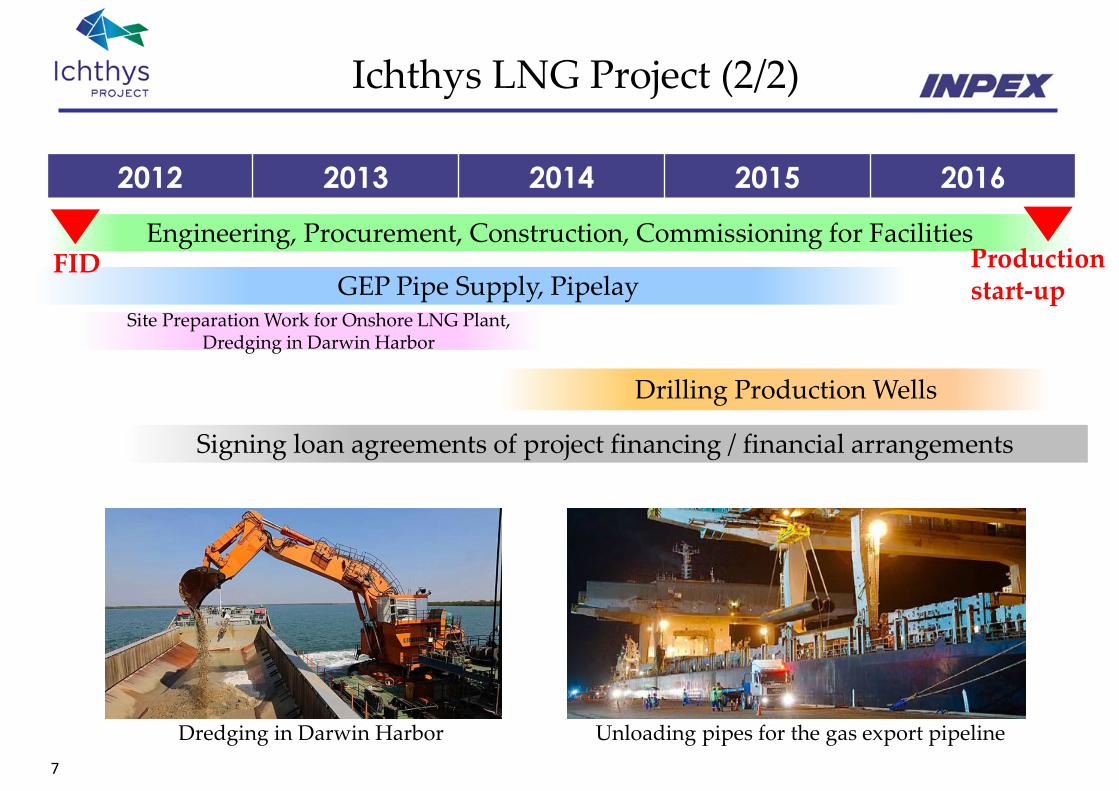
Ichthys LNG Project (2/2)
Site Preparation Work for Onshore LNG Plant, Dredging in Darwin Harbor
Drilling Production Wells
Engineering, Procurement, Construction, Commissioning for Facilities
Unloading pipes for the gas export pipeline
2012 2013 2014 2015 2016
GEP Pipe Supply, Pipelay
Signing loan agreements of project financing / financial arrangements
FID Production start-up
Dredging in Darwin Harbor
8
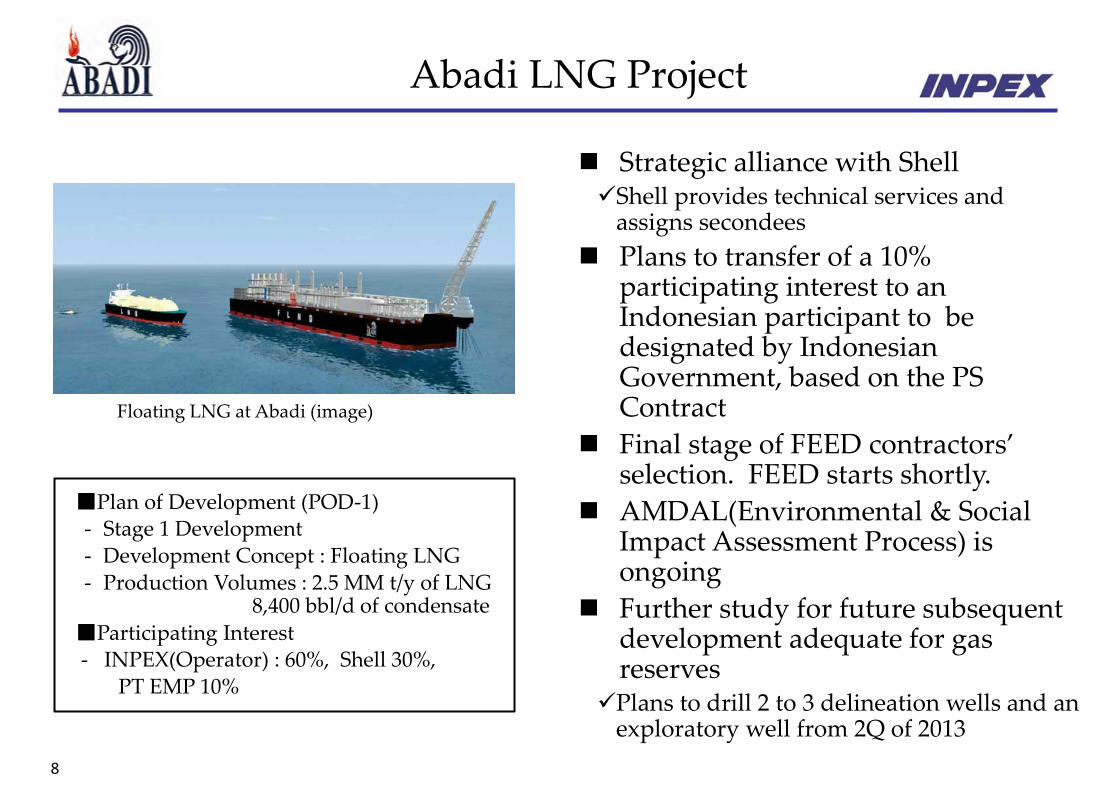
Abadi LNG Project
Strategic alliance with Shell Shell provides technical services and
assigns secondees
Plans to transfer of a 10% participating interest to an Indonesian participant to be designated by Indonesian Government, based on the PS Contract
Final stage of FEED contractors’ selection. FEED starts shortly.
AMDAL(Environmental & Social Impact Assessment Process) is ongoing
Further study for future subsequent development adequate for gas reserves
Plans to drill 2 to 3 delineation wells and an exploratory well from 2Q of 2013
■Plan of Development (POD-1) - Stage 1 Development - Development Concept : Floating LNG
- Production Volumes : 2.5 MM t/y of LNG 8,400 bbl/d of condensate
■Participating Interest - INPEX(Operator) : 60%, Shell 30%,
PT EMP 10%
Floating LNG at Abadi (image)
9
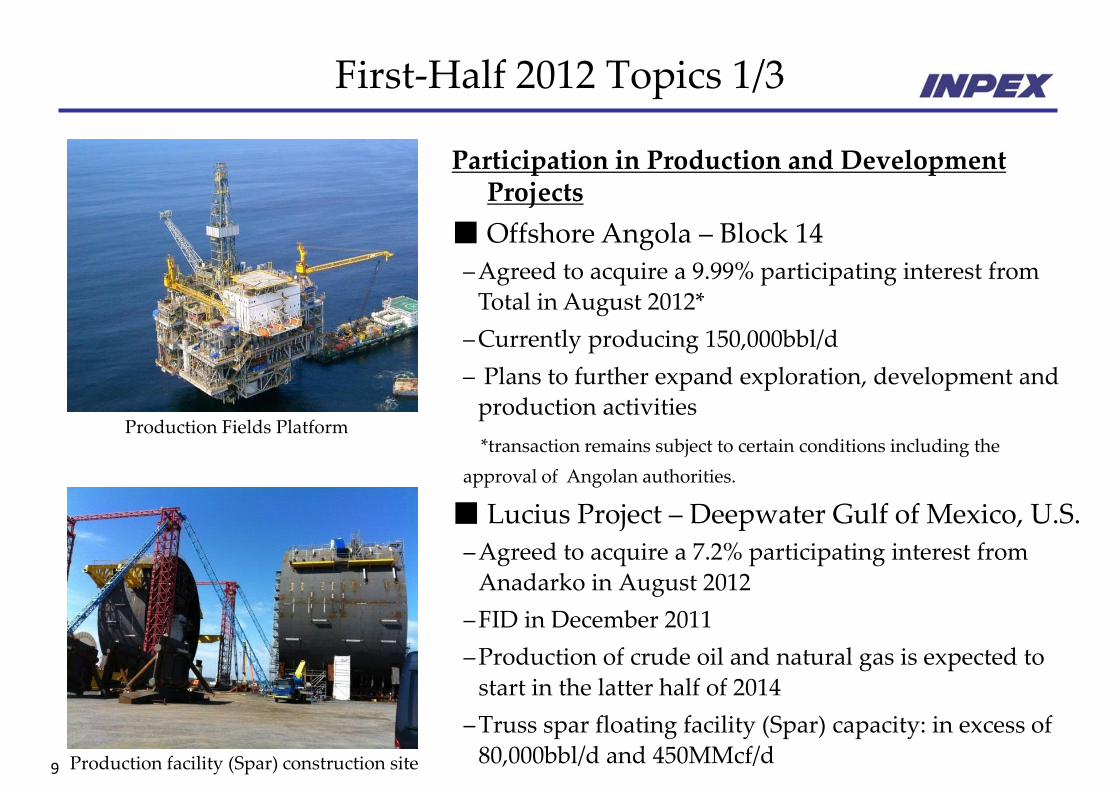
First-Half 2012 Topics 1/3
Participation in Production and Development Projects
■ Offshore Angola – Block 14
– Agreed to acquire a 9.99% participating interest from
Total in August 2012*
– Currently producing 150,000bbl/d
– Plans to further expand exploration, development and
production activities
*transaction remains subject to certain conditions including the
approval of Angolan authorities.
■ Lucius Project – Deepwater Gulf of Mexico, U.S.
– Agreed to acquire a 7.2% participating interest from
Anadarko in August 2012
– FID in December 2011
– Production of crude oil and natural gas is expected to
start in the latter half of 2014
– Truss spar floating facility (Spar) capacity: in excess of
80,000bbl/d and 450MMcf/d
Production Fields Platform
Production facility (Spar) construction site
10
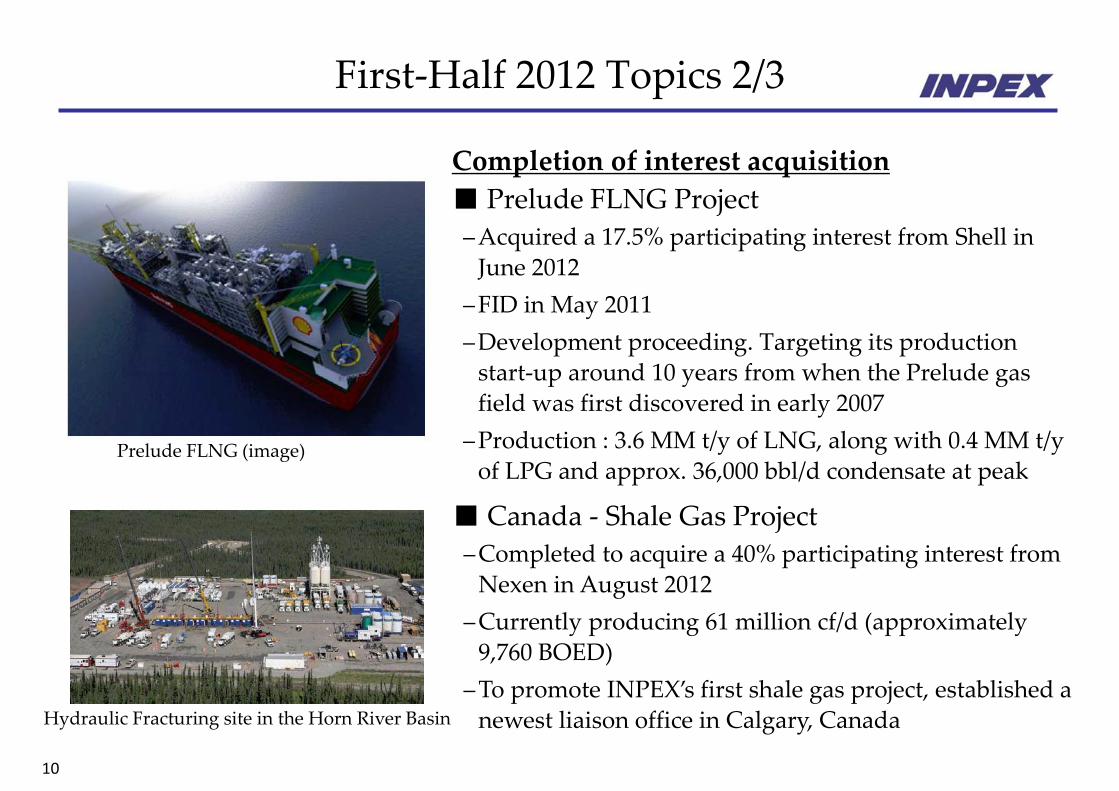
First-Half 2012 Topics 2/3
Completion of interest acquisition
■ Prelude FLNG Project
– Acquired a 17.5% participating interest from Shell in
June 2012
– FID in May 2011
– Development proceeding. Targeting its production
start-up around 10 years from when the Prelude gas
field was first discovered in early 2007
– Production : 3.6 MM t/y of LNG, along with 0.4 MM t/y
of LPG and approx. 36,000 bbl/d condensate at peak ■ Canada - Shale Gas Project
– Completed to acquire a 40% participating interest from
Nexen in August 2012
– Currently producing 61 million cf/d (approximately
9,760 BOED)
– To promote INPEX’s first shale gas project, established a
newest liaison office in Calgary, Canada
Prelude FLNG (image)
Hydraulic Fracturing site in the Horn River Basin
11
First-Half 2012 Topics 3/3
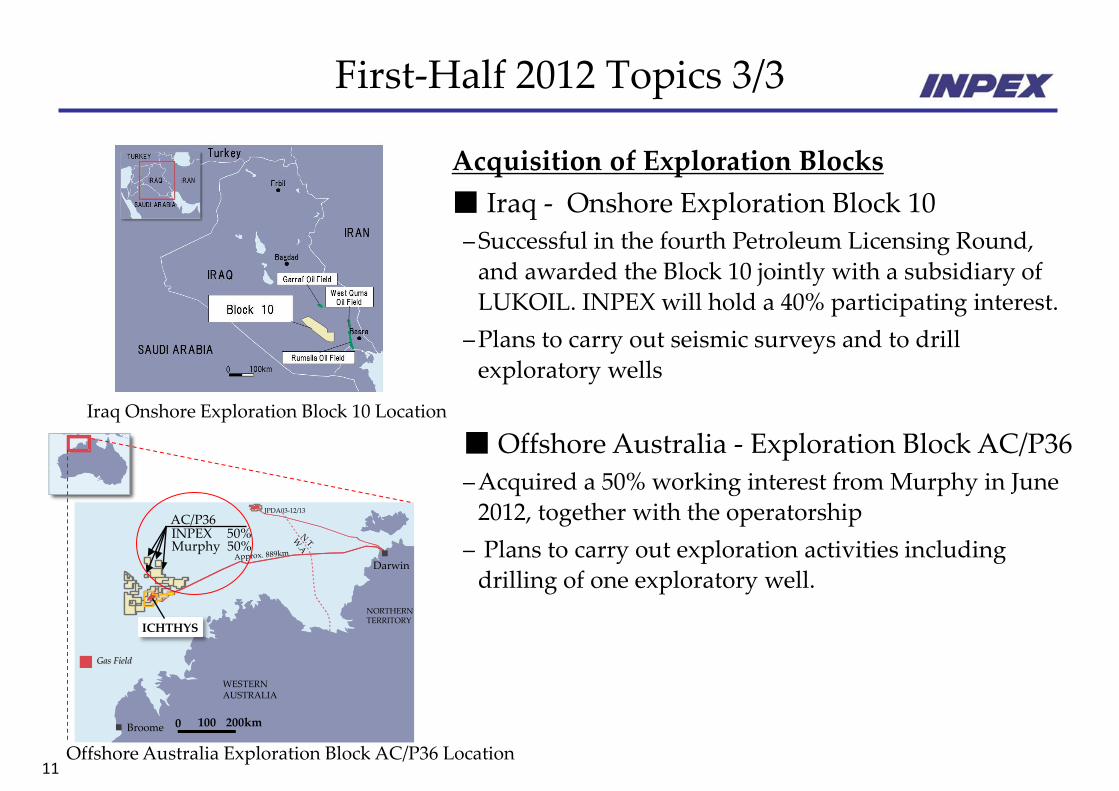
Acquisition of Exploration Blocks
■ Iraq - Onshore Exploration Block 10
– Successful in the fourth Petroleum Licensing Round,
and awarded the Block 10 jointly with a subsidiary of
LUKOIL. INPEX will hold a 40% participating interest.
– Plans to carry out seismic surveys and to drill
exploratory wells
■ Offshore Australia - Exploration Block AC/P36
– Acquired a 50% working interest from Murphy in June
2012, together with the operatorship
– Plans to carry out exploration activities including
drilling of one exploratory well.
Iraq Onshore Exploration Block 10 Location
Offshore Australia Exploration Block AC/P36 Location
北部準州
西オーストラリア州
200km 100
NORTHERN TERRITORY
JPDA03-12/13
ICHTHYS
200km 100
AC/P36 INPEX 50% Murphy 50%
WESTERN AUSTRALIA
0
Gas Field
Darwin
Broome
12
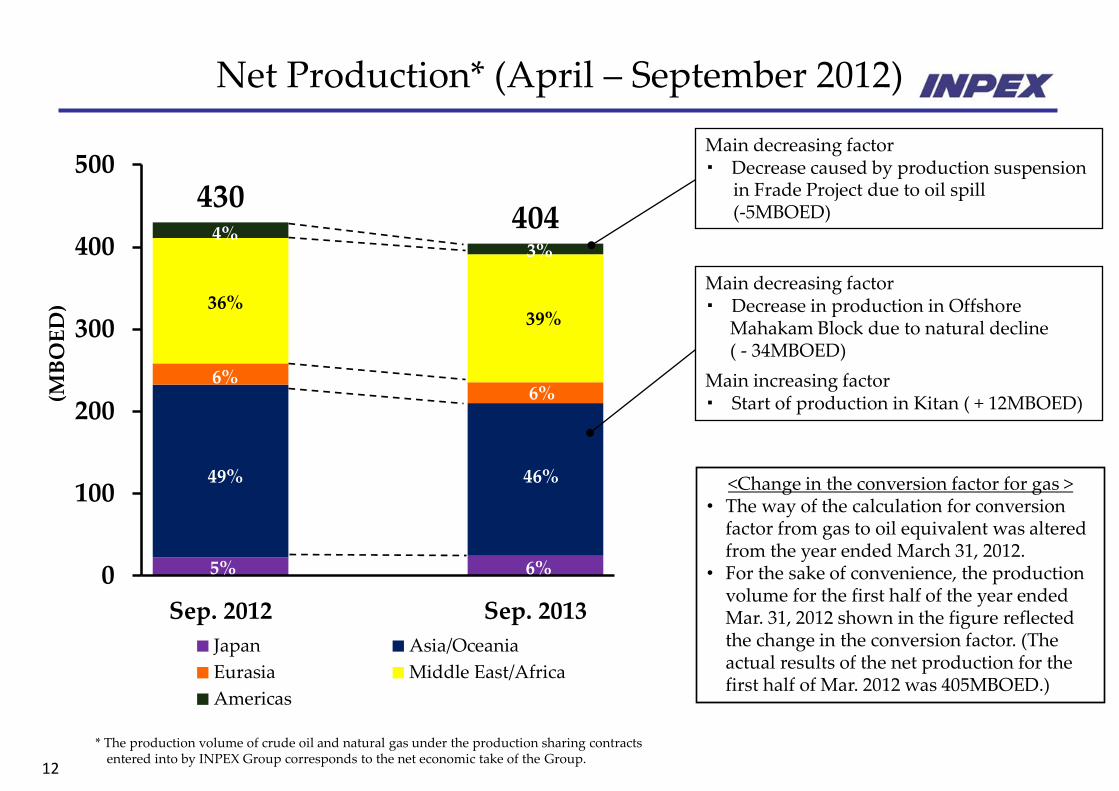
Net Production* (April – September 2012)
430 404
0
100
200
300
400
500
Sep. 2012 Sep. 2013
(MB
OE
D)
Japan Asia/Oceania
Eurasia Middle East/Africa
Americas
6%
39%
3%
6%
46%
6%
36%
4%
5%
49%
Main decreasing factor ・ Decrease caused by production suspension in Frade Project due to oil spill (-5MBOED)
Main decreasing factor ・ Decrease in production in Offshore Mahakam Block due to natural decline ( - 34MBOED)
Main increasing factor ・ Start of production in Kitan ( + 12MBOED)
* The production volume of crude oil and natural gas under the production sharing contracts entered into by INPEX Group corresponds to the net economic take of the Group.
<Change in the conversion factor for gas > • The way of the calculation for conversion
factor from gas to oil equivalent was altered from the year ended March 31, 2012.
• For the sake of convenience, the production volume for the first half of the year ended Mar. 31, 2012 shown in the figure reflected the change in the conversion factor. (The actual results of the net production for the first half of Mar. 2012 was 405MBOED.)
Financial Results for the six months ended September 30, 2012
Masahiro Murayama
Director, Managing Executive Officer
Head of Finance & Accounting Division
14
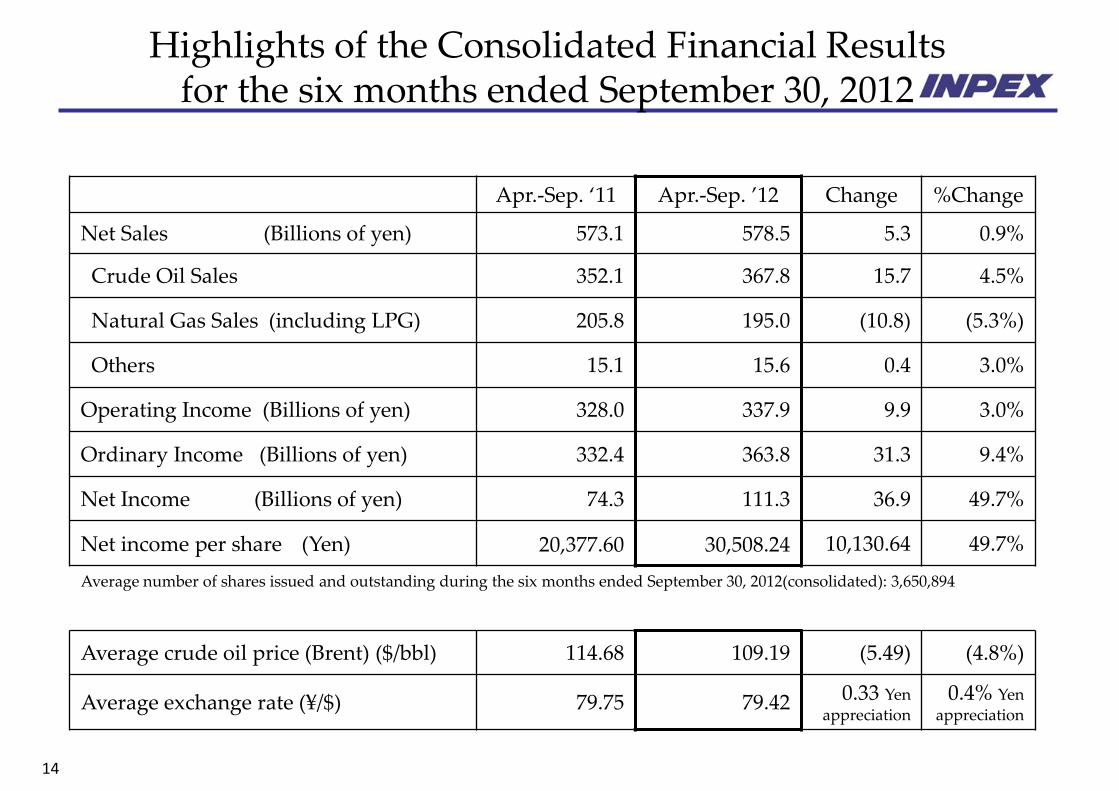
Highlights of the Consolidated Financial Results for the six months ended September 30, 2012
Apr.-Sep. ‘11 Apr.-Sep. ’12 Change %Change
Net Sales (Billions of yen) 573.1 578.5 5.3 0.9%
Crude Oil Sales 352.1 367.8 15.7 4.5%
Natural Gas Sales (including LPG) 205.8 195.0 (10.8) (5.3%)
Others 15.1 15.6 0.4 3.0%
Operating Income (Billions of yen) 328.0 337.9 9.9 3.0%
Ordinary Income (Billions of yen) 332.4 363.8 31.3 9.4%
Net Income (Billions of yen) 74.3 111.3 36.9 49.7%
Net income per share (Yen) 20,377.60 30,508.24 10,130.64 49.7%
Average number of shares issued and outstanding during the six months ended September 30, 2012(consolidated): 3,650,894
Average crude oil price (Brent) ($/bbl) 114.68 109.19 (5.49) (4.8%)
Average exchange rate (¥/$) 79.75 79.42 0.33 Yen appreciation
0.4% Yen
appreciation
15
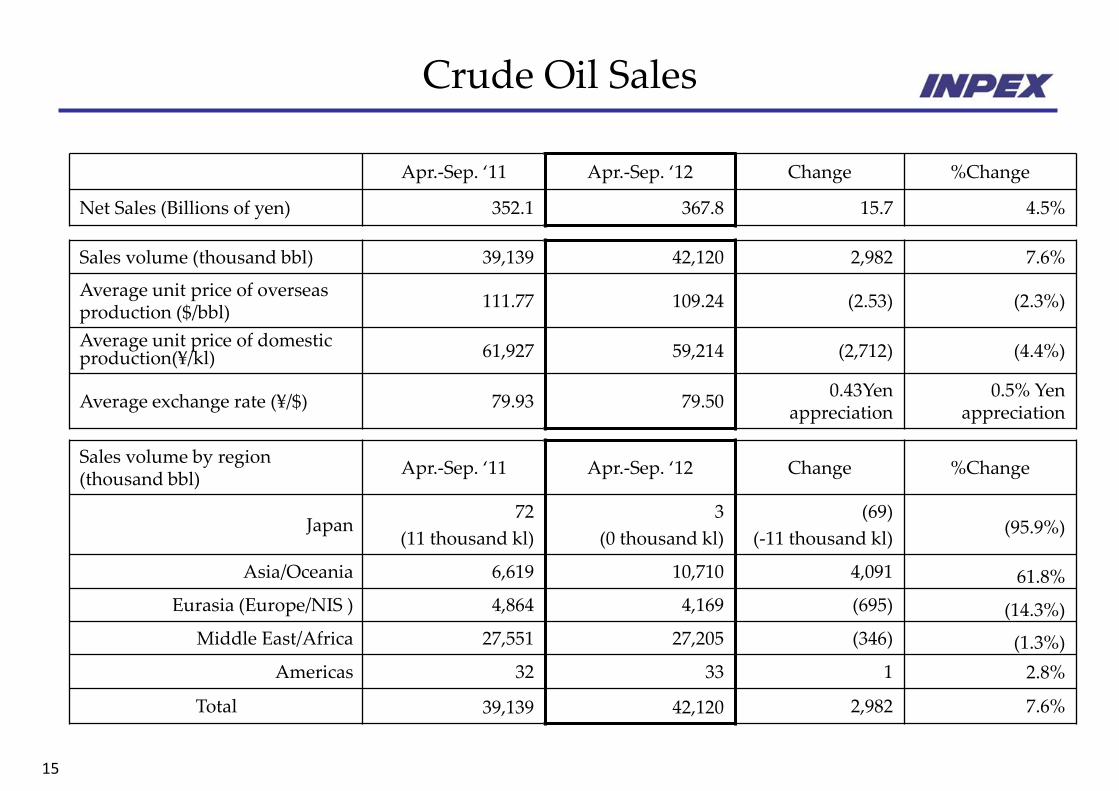
Crude Oil Sales
Sales volume (thousand bbl) 39,139 42,120 2,982 7.6%
Average unit price of overseas production ($/bbl)
111.77 109.24 (2.53) (2.3%)
Average unit price of domestic production(¥/kl) 61,927 59,214 (2,712) (4.4%)
Average exchange rate (¥/$) 79.93 79.50 0.43Yen
appreciation 0.5% Yen
appreciation
Apr.-Sep. ‘11 Apr.-Sep. ‘12 Change %Change
Net Sales (Billions of yen) 352.1 367.8 15.7 4.5%
Sales volume by region (thousand bbl)
Apr.-Sep. ‘11 Apr.-Sep. ‘12 Change %Change
Japan 72
(11 thousand kl)
3
(0 thousand kl)
(69)
(-11 thousand kl) (95.9%)
Asia/Oceania 6,619 10,710 4,091 61.8%
Eurasia (Europe/NIS ) 4,864 4,169 (695) (14.3%)
Middle East/Africa 27,551 27,205 (346) (1.3%)
Americas 32 33 1 2.8%
Total 39,139 42,120 2,982 7.6%
16
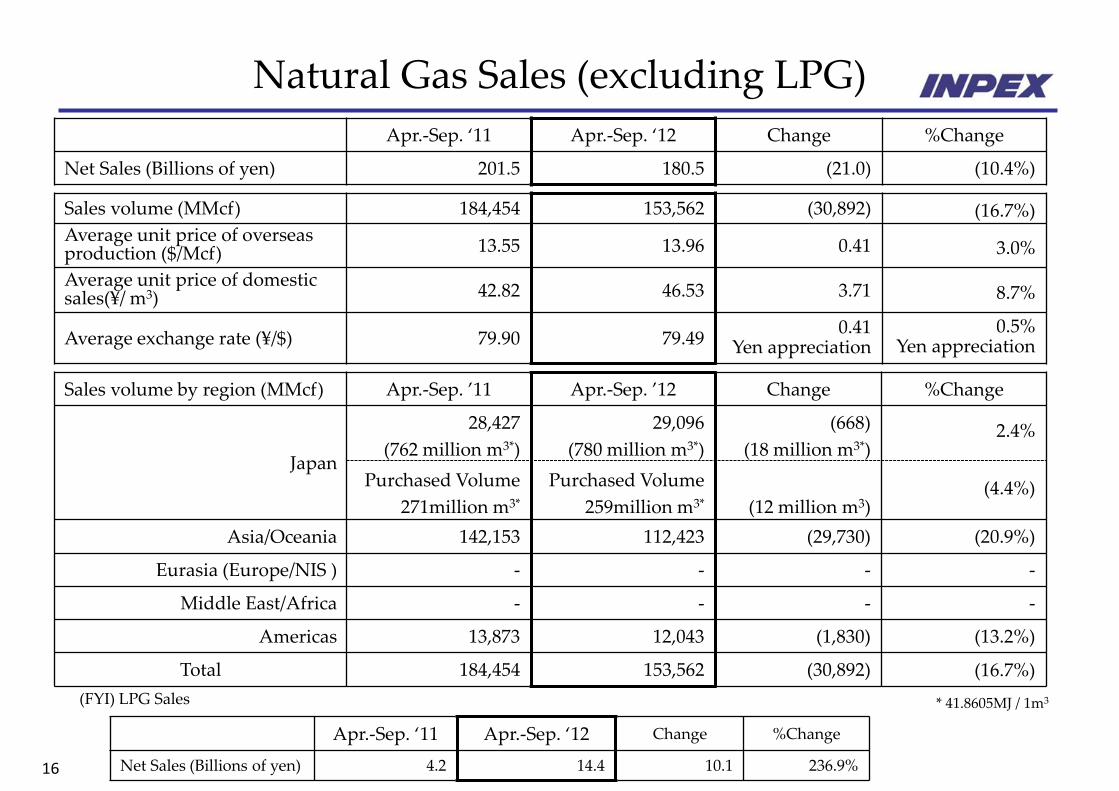
Natural Gas Sales (excluding LPG)
Sales volume (MMcf) 184,454 153,562 (30,892) (16.7%)
Average unit price of overseas production ($/Mcf) 13.55 13.96 0.41 3.0%
Average unit price of domestic sales(¥/ m3) 42.82 46.53 3.71 8.7%
Average exchange rate (¥/$) 79.90 79.49 0.41
Yen appreciation 0.5%
Yen appreciation
Apr.-Sep. ‘11 Apr.-Sep. ‘12 Change %Change
Net Sales (Billions of yen) 201.5 180.5 (21.0) (10.4%)
Sales volume by region (MMcf) Apr.-Sep. ’11 Apr.-Sep. ’12 Change %Change
Japan
28,427
(762 million m3*)
Purchased Volume
271million m3*
29,096
(780 million m3*)
Purchased Volume
259million m3*
(668)
(18 million m3*)
(12 million m3)
2.4%
(4.4%)
Asia/Oceania 142,153 112,423 (29,730) (20.9%)
Eurasia (Europe/NIS ) - - - -
Middle East/Africa - - - -
Americas 13,873 12,043 (1,830) (13.2%)
Total 184,454 153,562 (30,892) (16.7%)
(FYI) LPG Sales
Apr.-Sep. ‘11 Apr.-Sep. ‘12 Change %Change
Net Sales (Billions of yen) 4.2 14.4 10.1 236.9%
* 41.8605MJ / 1m3
17
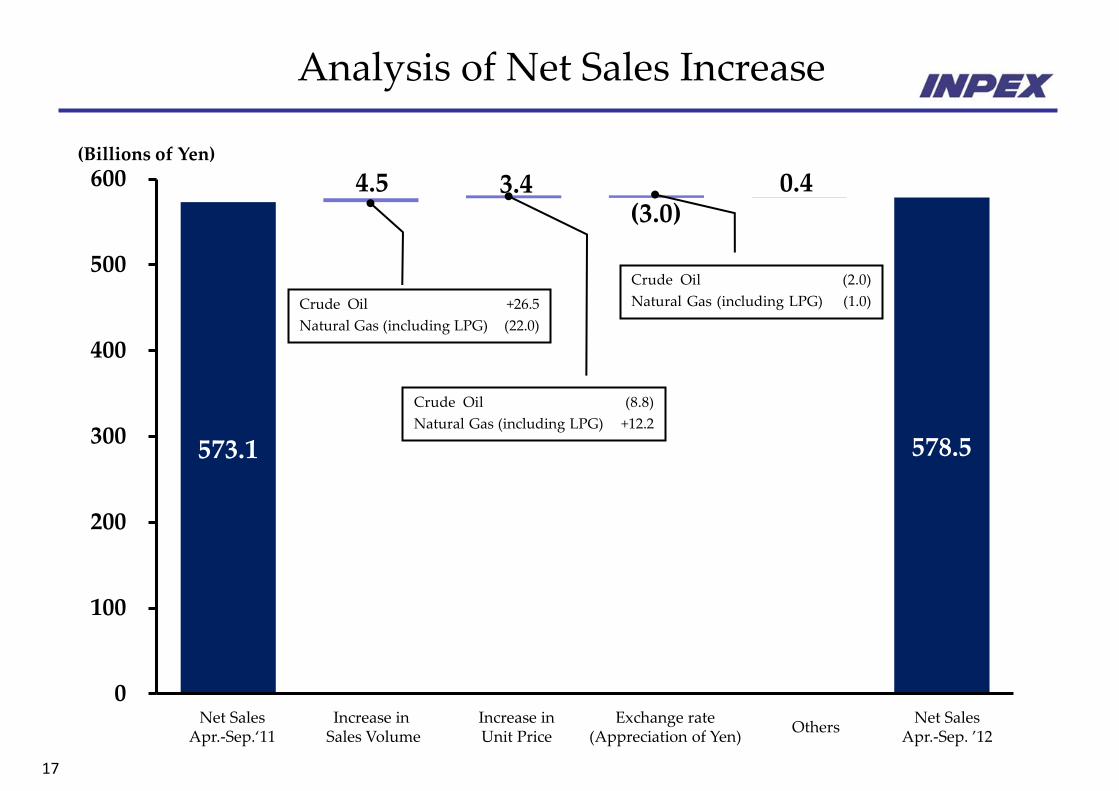
Analysis of Net Sales Increase
Net Sales Apr.-Sep.‘11
Increase in Sales Volume
Increase in Unit Price
Exchange rate (Appreciation of Yen)
Net Sales Apr.-Sep. ’12
Others
(Billions of Yen)
3.4
573.1
4.5 (3.0)
0.4
578.5
0
100
200
300
400
500
600
Crude Oil (2.0)
Natural Gas (including LPG) (1.0) Crude Oil +26.5
Natural Gas (including LPG) (22.0)
Crude Oil (8.8)
Natural Gas (including LPG) +12.2

18
Statements of Income
(Billions of Yen) Apr.-Sep. ’11 Apr.-Sep. ’12 Change %Change
Net Sales 573.1 578.5 5.3 0.9%
Cost of Sales 199.4 201.9 2.5 1.3%
Exploration expenses 10.5 4.0 (6.4) (61.2%)
Selling, general and administrative expenses
35.1 34.4 (0.7) (2.0%)
Operating Income 328.0 337.9 9.9 3.0%
Other income 19.8 39.2 19.4 98.1%
Other expenses 15.4 13.4 (1.9) (12.7%)
Ordinary Income 332.4 363.8 31.3 9.4%
Income taxes-current 245.3 236.2 (9.1) (3.7%)
Income taxes-deferred 4.0 12.0 7.9 194.7%
Minority interests 8.6 4.1 (4.4) (51.9%)
Net Income 74.3 111.3 36.9 49.7%
*Including LPG
Cost of sales for Crude Oil : 117.4
(Change) +5.1
Cost of sales for Natural Gas* : 73.7
(Change) (1.6)
Crude Oil sales : 367.8
(Change) +15.7
Natural Gas sales* : 195.0
(Change) (10.8)
19
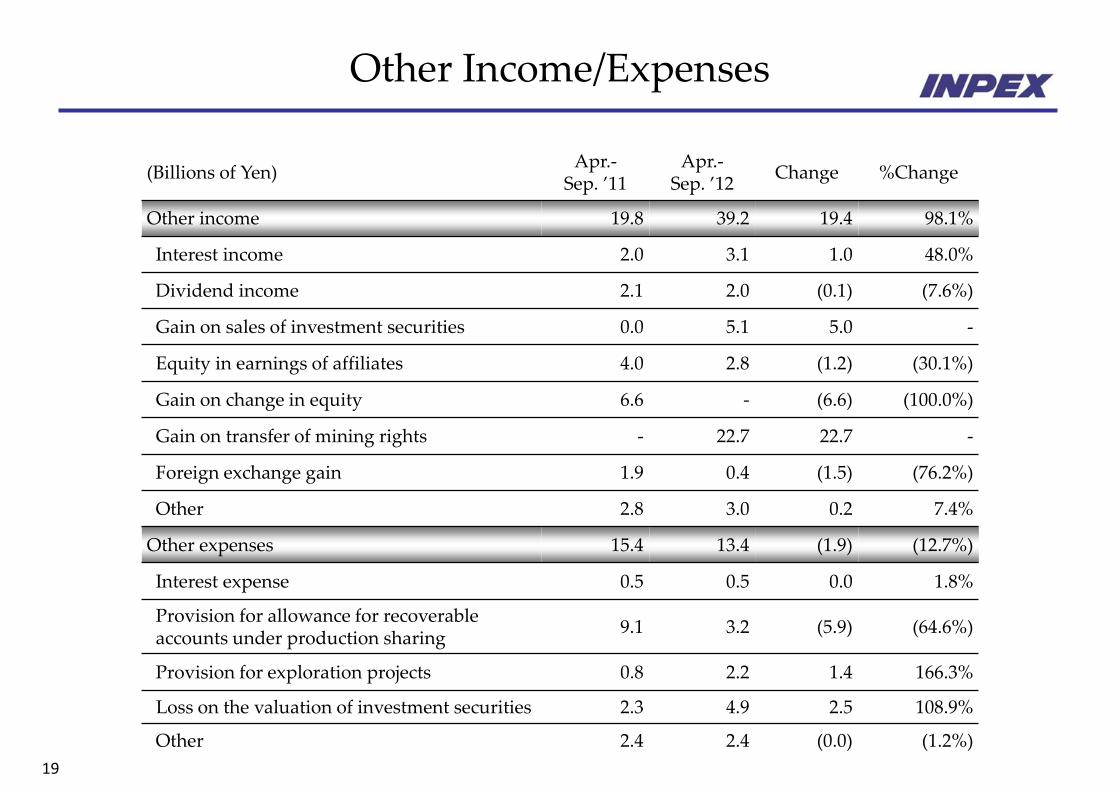
Other Income/Expenses
(Billions of Yen) Apr.-
Sep. ’11 Apr.-
Sep. ’12 Change %Change
Other income 19.8 39.2 19.4 98.1%
Interest income 2.0 3.1 1.0 48.0%
Dividend income 2.1 2.0 (0.1) (7.6%)
Gain on sales of investment securities 0.0 5.1 5.0 -
Equity in earnings of affiliates 4.0 2.8 (1.2) (30.1%)
Gain on change in equity 6.6 - (6.6) (100.0%)
Gain on transfer of mining rights - 22.7 22.7 -
Foreign exchange gain 1.9 0.4 (1.5) (76.2%)
Other 2.8 3.0 0.2 7.4%
Other expenses 15.4 13.4 (1.9) (12.7%)
Interest expense 0.5 0.5 0.0 1.8%
Provision for allowance for recoverable accounts under production sharing
9.1 3.2 (5.9) (64.6%)
Provision for exploration projects 0.8 2.2 1.4 166.3%
Loss on the valuation of investment securities 2.3 4.9 2.5 108.9%
Other 2.4 2.4 (0.0) (1.2%)
20
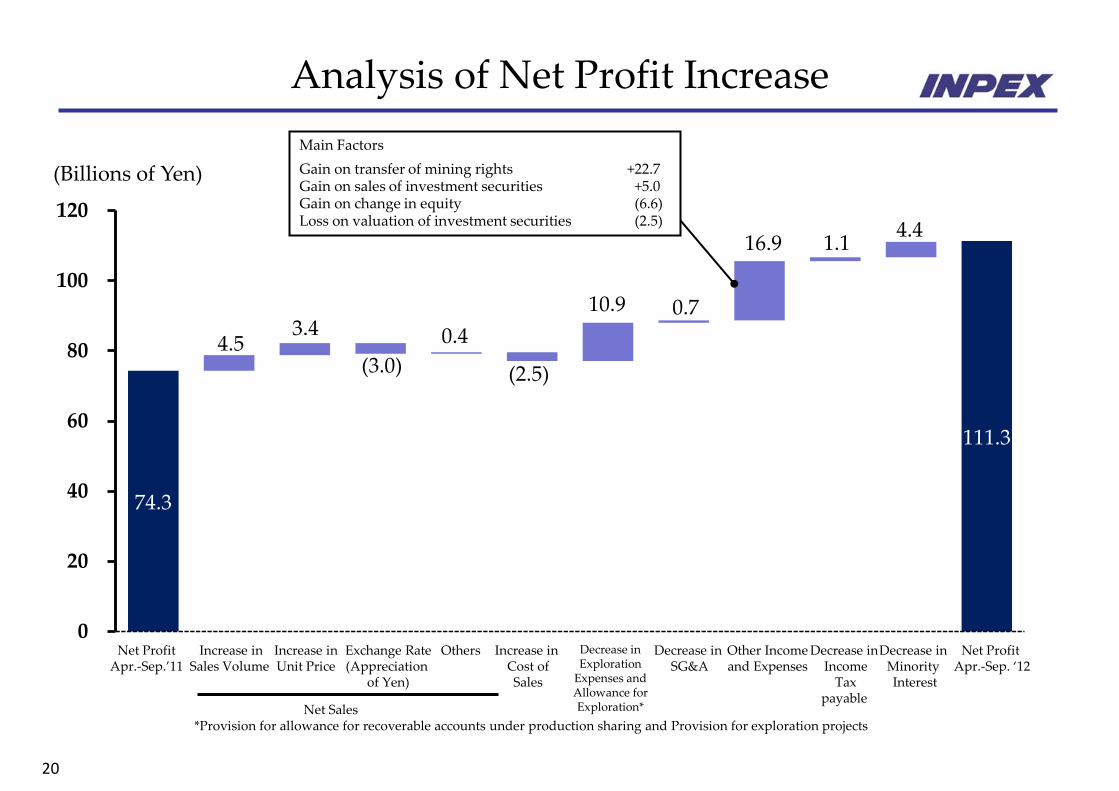
Analysis of Net Profit Increase
74.3
4.5 3.4
(3.0)
0.4
(2.5)
10.9 0.7
16.9 1.1 4.4
111.3
0
20
40
60
80
100
120
Net Profit Apr.-Sep.’11
Increase in Cost of Sales
Decrease in Exploration
Expenses and Allowance for Exploration*
Decrease in SG&A
Other Income and Expenses
Decrease in Minority Interest
Net Profit Apr.-Sep. ‘12
Decrease in Income
Tax payable
*Provision for allowance for recoverable accounts under production sharing and Provision for exploration projects
Increase in Sales Volume
Increase in Unit Price
Exchange Rate (Appreciation
of Yen)
Net Sales
Others
(Billions of Yen)
Main Factors Gain on transfer of mining rights +22.7 Gain on sales of investment securities +5.0 Gain on change in equity (6.6) Loss on valuation of investment securities (2.5)
21
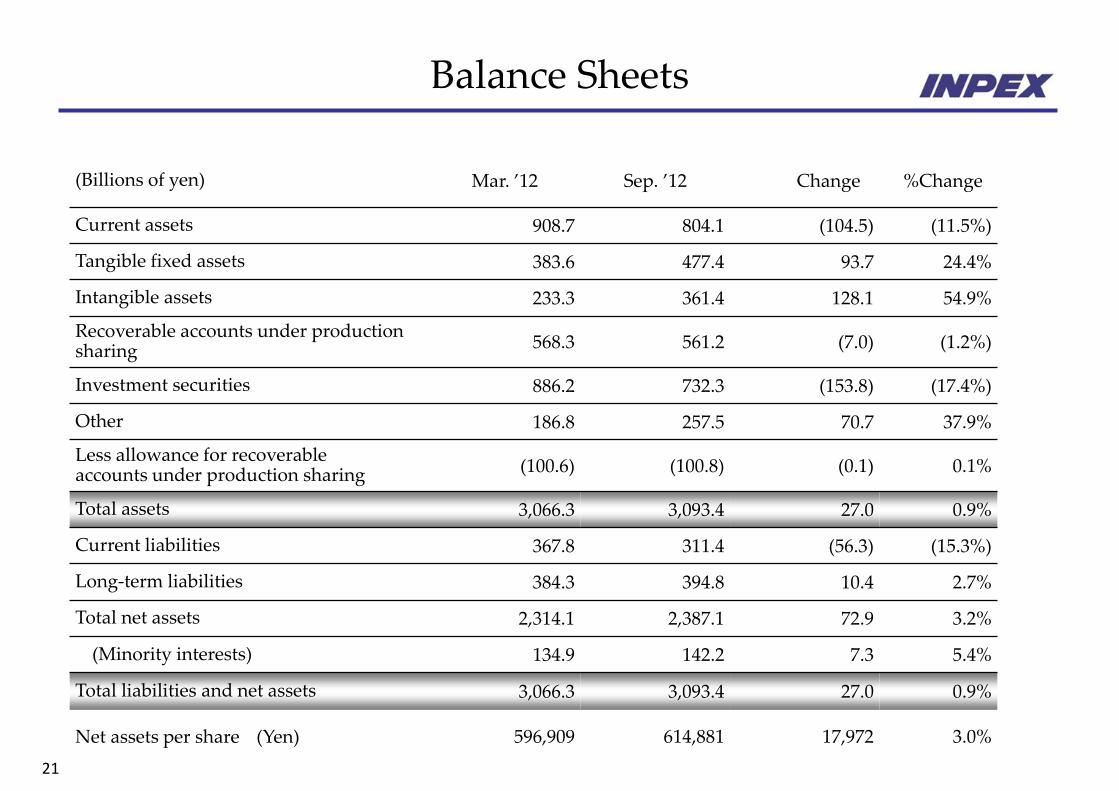
Balance Sheets
(Billions of yen) Mar. ’12 Sep. ’12 Change %Change
Current assets 908.7 804.1 (104.5) (11.5%)
Tangible fixed assets 383.6 477.4 93.7 24.4%
Intangible assets 233.3 361.4 128.1 54.9%
Recoverable accounts under production sharing 568.3 561.2 (7.0) (1.2%)
Investment securities 886.2 732.3 (153.8) (17.4%)
Other 186.8 257.5 70.7 37.9%
Less allowance for recoverable accounts under production sharing (100.6) (100.8) (0.1) 0.1%
Total assets 3,066.3 3,093.4 27.0 0.9%
Current liabilities 367.8 311.4 (56.3) (15.3%)
Long-term liabilities 384.3 394.8 10.4 2.7%
Total net assets 2,314.1 2,387.1 72.9 3.2%
(Minority interests) 134.9 142.2 7.3 5.4%
Total liabilities and net assets 3,066.3 3,093.4 27.0 0.9%
Net assets per share (Yen) 596,909 614,881 17,972 3.0%
22
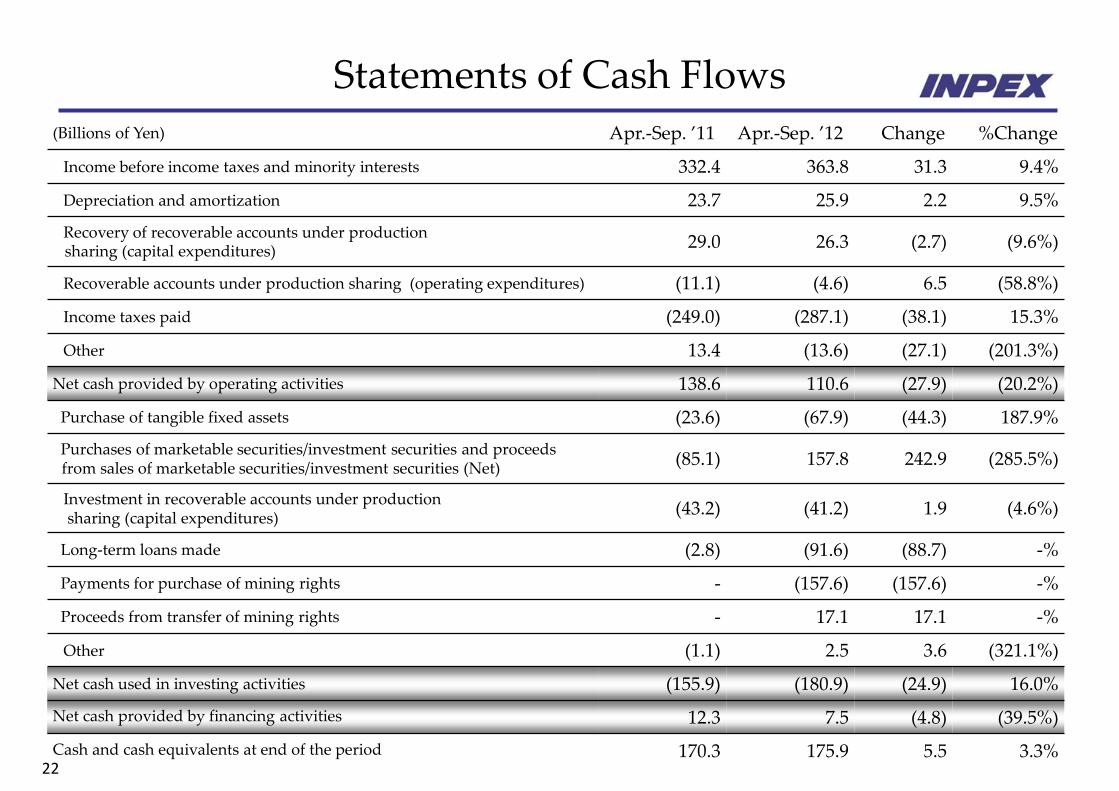
Statements of Cash Flows (Billions of Yen) Apr.-Sep. ’11 Apr.-Sep. ’12 Change %Change
Income before income taxes and minority interests 332.4 363.8 31.3 9.4%
Depreciation and amortization 23.7 25.9 2.2 9.5%
Recovery of recoverable accounts under production sharing (capital expenditures)
29.0 26.3 (2.7) (9.6%)
Recoverable accounts under production sharing (operating expenditures) (11.1) (4.6) 6.5 (58.8%)
Income taxes paid (249.0) (287.1) (38.1) 15.3%
Other 13.4 (13.6) (27.1) (201.3%)
Net cash provided by operating activities 138.6 110.6 (27.9) (20.2%)
Purchase of tangible fixed assets (23.6) (67.9) (44.3) 187.9%
Purchases of marketable securities/investment securities and proceeds from sales of marketable securities/investment securities (Net)
(85.1) 157.8 242.9 (285.5%)
Investment in recoverable accounts under production sharing (capital expenditures)
(43.2) (41.2) 1.9 (4.6%)
Long-term loans made (2.8) (91.6) (88.7) -%
Payments for purchase of mining rights - (157.6) (157.6) -%
Proceeds from transfer of mining rights - 17.1 17.1 -%
Other (1.1) 2.5 3.6 (321.1%)
Net cash used in investing activities (155.9) (180.9) (24.9) 16.0%
Net cash provided by financing activities 12.3 7.5 (4.8) (39.5%)
Cash and cash equivalents at end of the period 170.3 175.9 5.5 3.3%
23
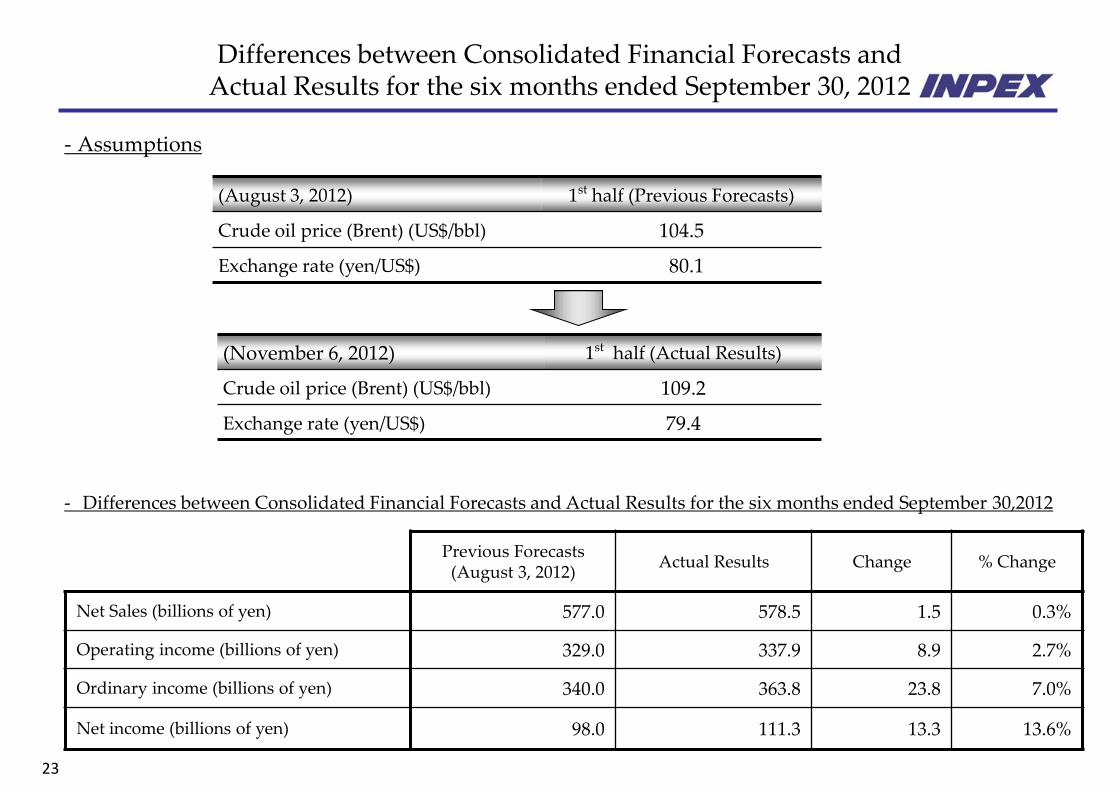
Differences between Consolidated Financial Forecasts and Actual Results for the six months ended September 30, 2012
Previous Forecasts (August 3, 2012)
Actual Results Change % Change
Net Sales (billions of yen) 577.0 578.5 1.5 0.3%
Operating income (billions of yen) 329.0 337.9 8.9 2.7%
Ordinary income (billions of yen) 340.0 363.8 23.8 7.0%
Net income (billions of yen) 98.0 111.3 13.3 13.6%
- Differences between Consolidated Financial Forecasts and Actual Results for the six months ended September 30,2012
- Assumptions
(November 6, 2012) 1st half (Actual Results)
Crude oil price (Brent) (US$/bbl) 109.2
Exchange rate (yen/US$) 79.4
(August 3, 2012) 1st half (Previous Forecasts)
Crude oil price (Brent) (US$/bbl) 104.5
Exchange rate (yen/US$) 80.1
24
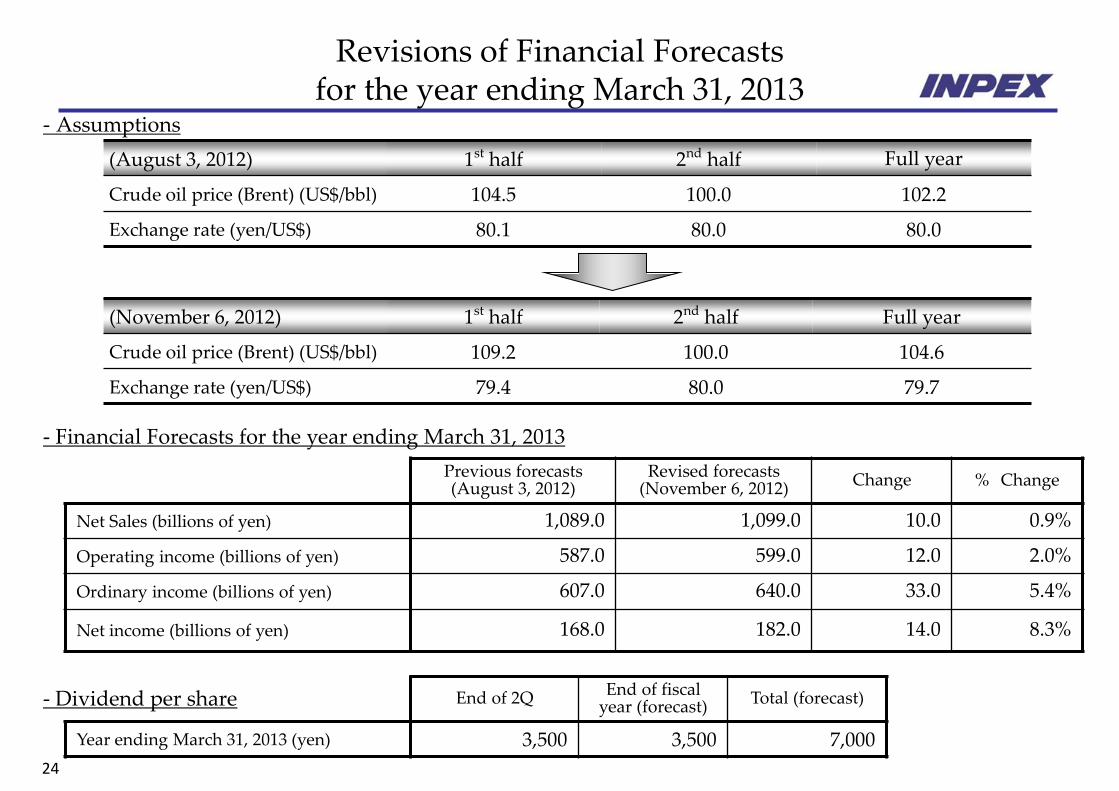
Revisions of Financial Forecasts for the year ending March 31, 2013
Previous forecasts (August 3, 2012)
Revised forecasts (November 6, 2012) Change % Change
Net Sales (billions of yen) 1,089.0 1,099.0 10.0 0.9%
Operating income (billions of yen) 587.0 599.0 12.0 2.0%
Ordinary income (billions of yen) 607.0 640.0 33.0 5.4%
Net income (billions of yen) 168.0 182.0 14.0 8.3%
- Financial Forecasts for the year ending March 31, 2013
- Assumptions
(November 6, 2012) 1st half 2nd half Full year
Crude oil price (Brent) (US$/bbl) 109.2 100.0 104.6
Exchange rate (yen/US$) 79.4 80.0 79.7
- Dividend per share End of 2Q End of fiscal year (forecast) Total (forecast)
Year ending March 31, 2013 (yen) 3,500 3,500 7,000
(August 3, 2012) 1st half 2nd half Full year
Crude oil price (Brent) (US$/bbl) 104.5 100.0 102.2
Exchange rate (yen/US$) 80.1 80.0 80.0


![CSR Report 2011 - 国際石油開発帝石株式会社[INPEX]ACG Oil Fields ADMA Block West Bakr Block 128,699 Company Name: INPEX CORPORATION Established: April 3, 2006 Capital: ¥290,809,835,000](https://img.pdfslide.net/doc/110x75/5f08fad37e708231d424a712/csr-report-2011-ececccinpex-acg-oil-fields-adma.jpg)