Embed Size (px)
DESCRIPTION
Inquiry 1 written and oral reports are due in lab the week of 9/29. Today: More Statistics outliers and R 2. Outliers… 2, 2, 2, 2, 2, 3, 3, 3, 4, 4, 5, 5, 5, 6, 7, 121, 130 Median = 4 Mean = 18. Is there a numerical way to determine the accuracy of our analysis? - PowerPoint PPT Presentation
Citation preview
Inquiry 1 written and oral reports are due in lab the week of 9/29.
Today: More Statisticsoutliers and R2

Outliers…
2, 2, 2, 2, 2, 3, 3, 3, 4, 4, 5, 5, 5, 6, 7, 121, 130
Median = 4
Mean = 18
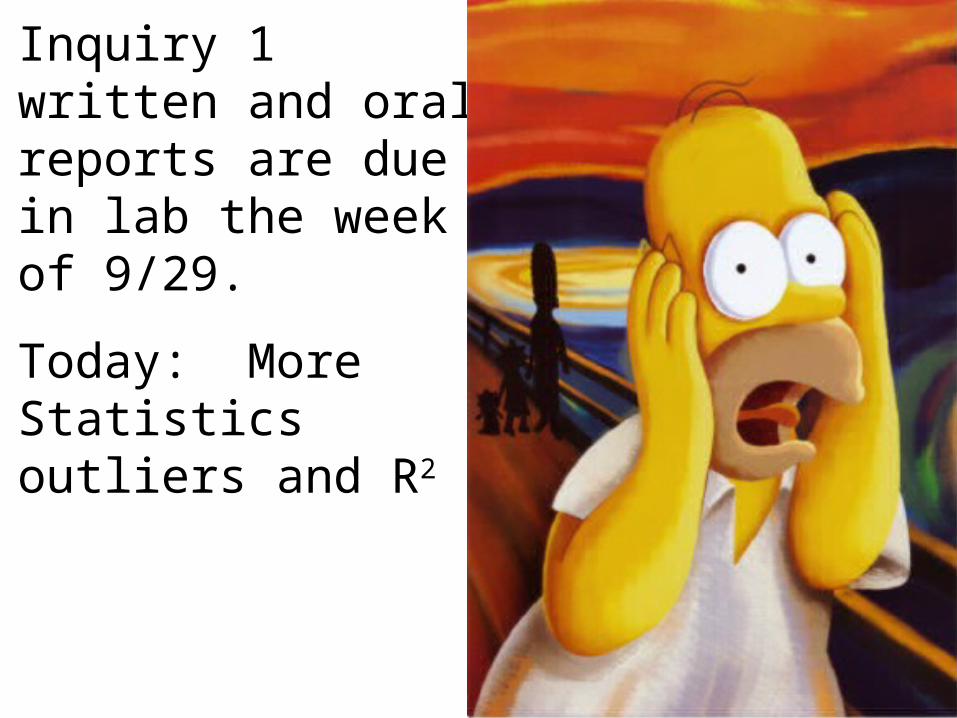
Is there a numerical way to determine the accuracy of our analysis?
2, 2, 2, 2, 2, 3, 3, 3, 4, 4, 5, 5, 5, 6, 7, 121, 130
Mean = 18
Standard deviation = 40.5
Standard deviation is a measure of variability.
Outliers: When is data invalid?
Outliers: When is data invalid?
Not simply when you want it to be.

Outliers: When is data invalid?
Not simply when you want it to be.
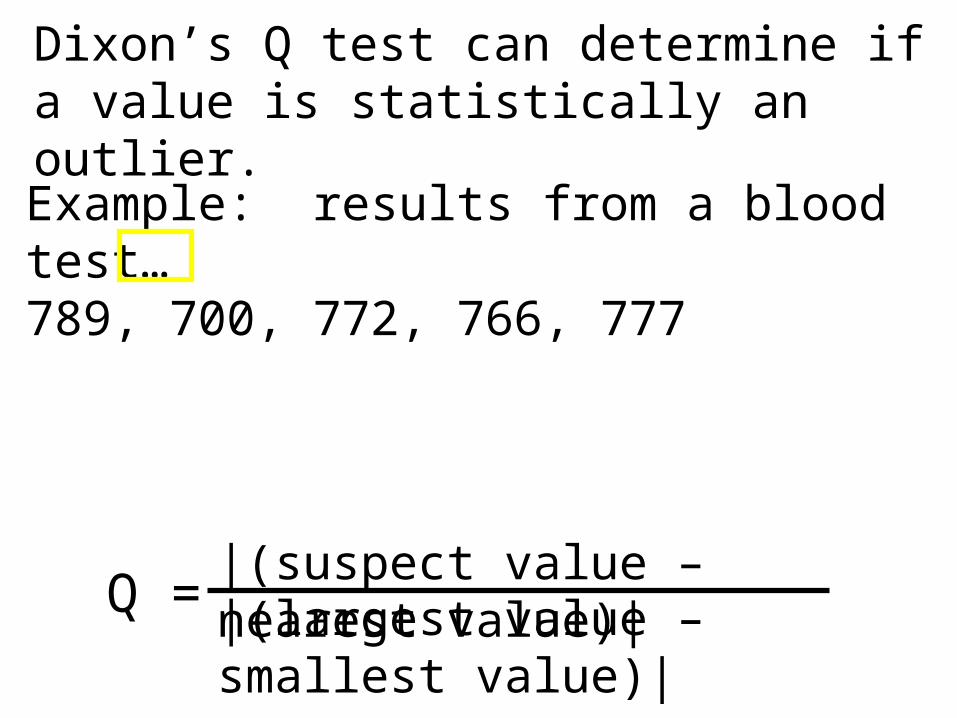
Dixon’s Q test can determine if a value is statistically an outlier.

Dixon’s Q test can determine if a value is statistically an outlier.
|(suspect value – nearest value)|Q = |(largest value – smallest value)|

Dixon’s Q test can determine if a value is statistically an outlier.
|(suspect value – nearest value)|Q = |(largest value – smallest value)|
Example: results from a blood test…789, 700, 772, 766, 777
Dixon’s Q test can determine if a value is statistically an outlier.
|(suspect value – nearest value)|Q = |(largest value – smallest value)|
Example: results from a blood test…789, 700, 772, 766, 777
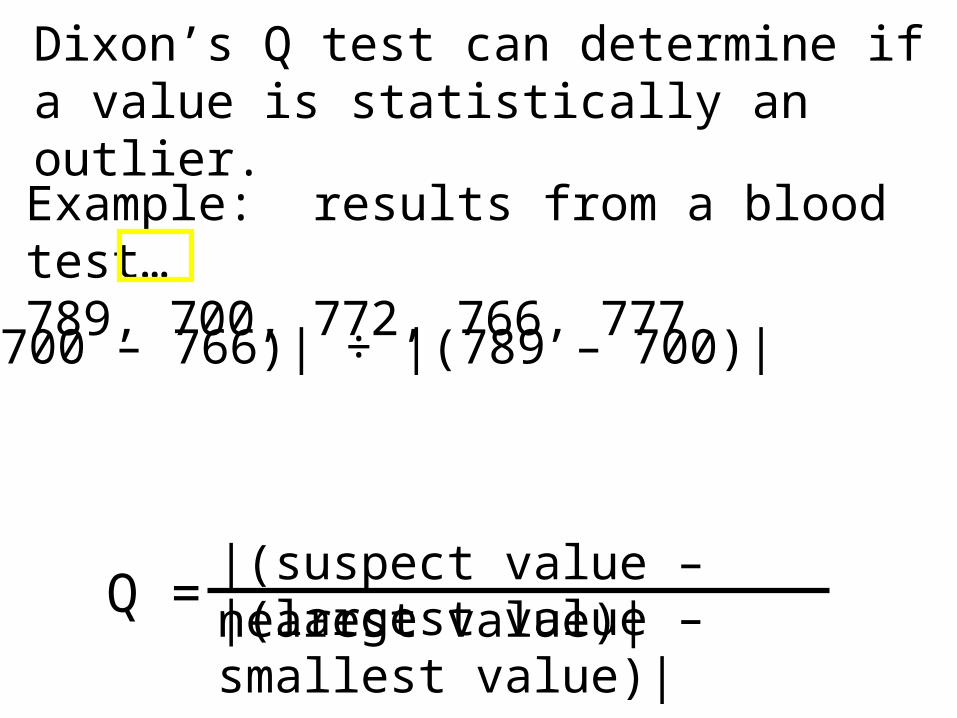
Dixon’s Q test can determine if a value is statistically an outlier.
|(suspect value – nearest value)|Q = |(largest value – smallest value)|
Example: results from a blood test…789, 700, 772, 766, 777
Q=|(700 – 766)| ÷ |(789 – 700)|
Dixon’s Q test can determine if a value is statistically an outlier.
|(suspect value – nearest value)|Q = |(largest value – smallest value)|
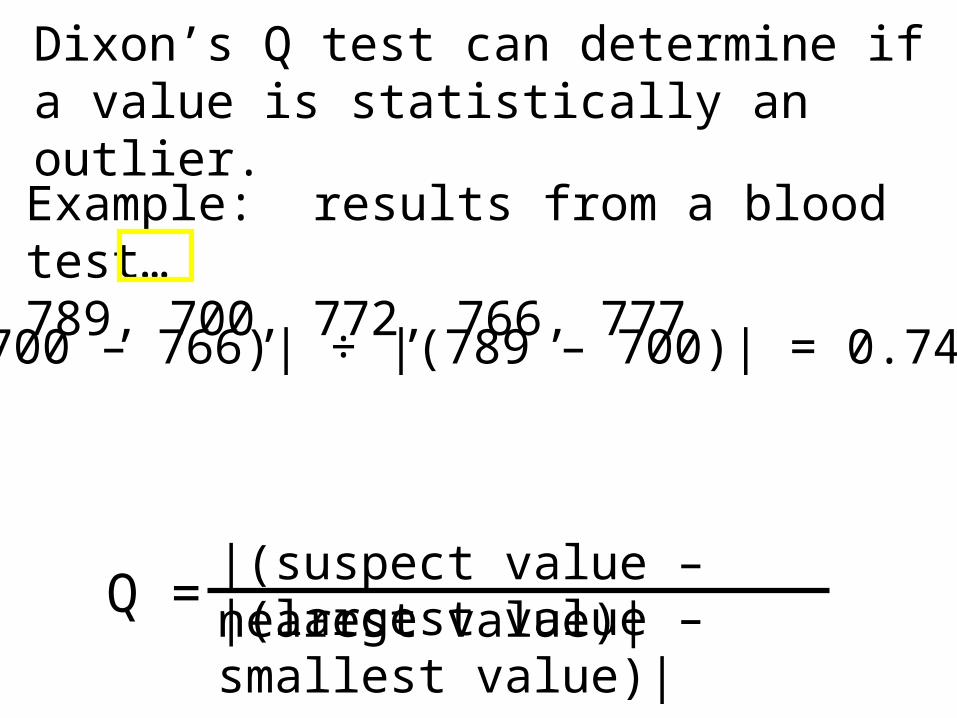
Example: results from a blood test…789, 700, 772, 766, 777
Q =|(700 – 766)| ÷ |(789 – 700)| = 0.742

Dixon’s Q test can determine if a value is statistically an outlier.
|(suspect value – nearest value)|Q = |(largest value – smallest value)|
Example: results from a blood test…789, 700, 772, 766, 777
Q =|(700 – 766)| ÷ |(789 – 700)| = 0.742 So?
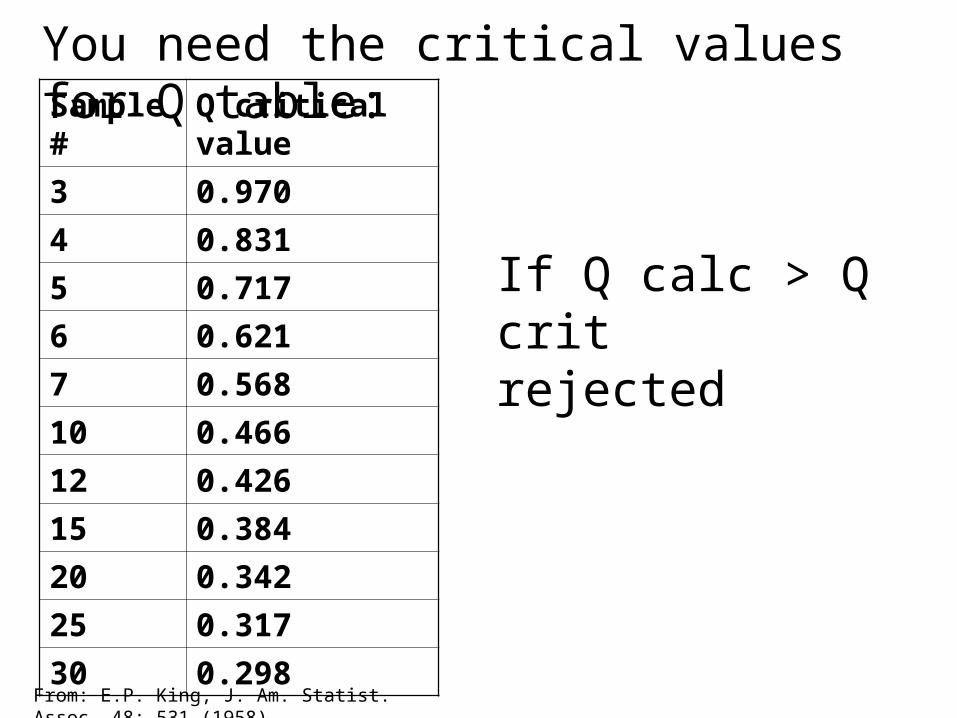
You need the critical values for Q table:Sample # Q critical value
3 0.970
4 0.831
5 0.717
6 0.621
7 0.568
10 0.466
12 0.426
15 0.384
20 0.342
25 0.317
30 0.298
If Q calc > Q critrejected
From: E.P. King, J. Am. Statist. Assoc. 48: 531 (1958)
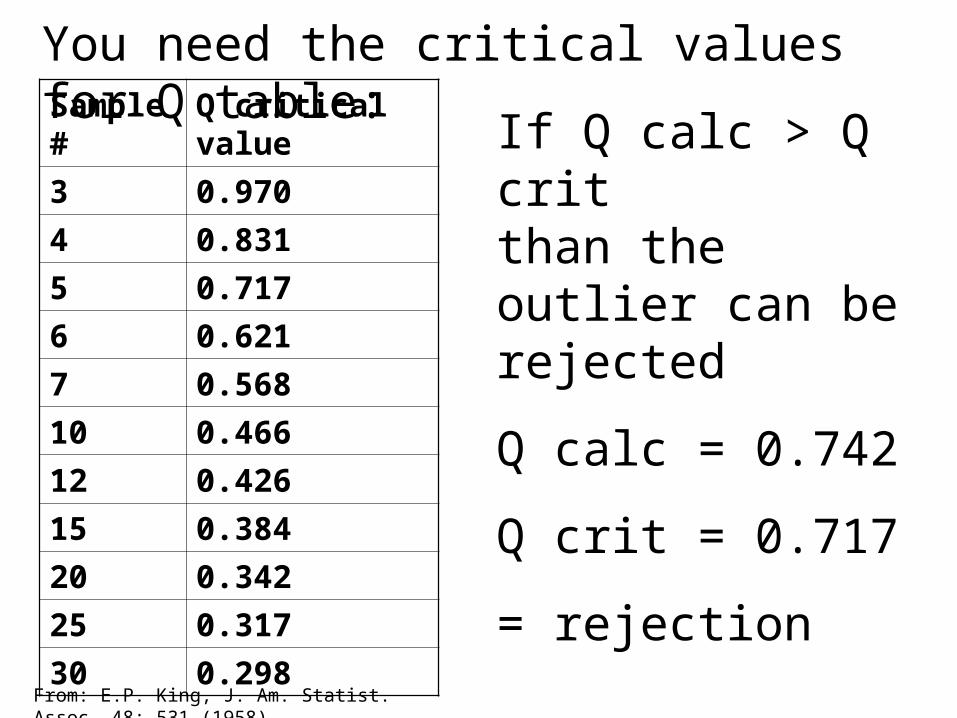
You need the critical values for Q table:Sample # Q critical value
3 0.970
4 0.831
5 0.717
6 0.621
7 0.568
10 0.466
12 0.426
15 0.384
20 0.342
25 0.317
30 0.298
If Q calc > Q critthan the outlier can be rejected
Q calc = 0.742
Q crit = 0.717
= rejection
From: E.P. King, J. Am. Statist. Assoc. 48: 531 (1958)

What can outliers tell us?
If you made a mistake, you should have already accounted for that.
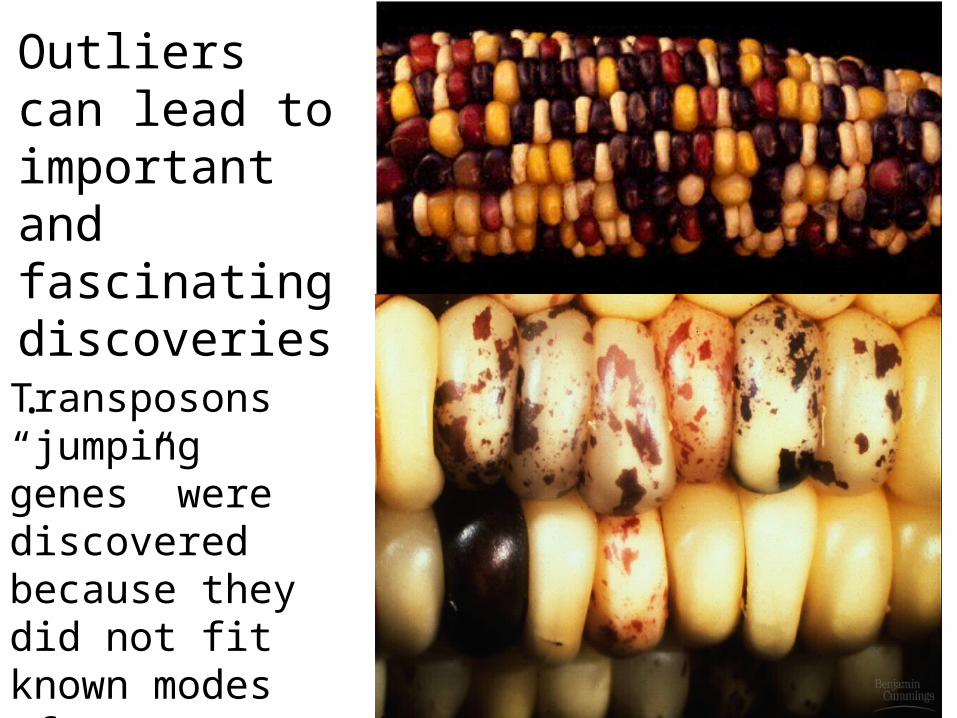
Outliers can lead to important and fascinating discoveries.
Transposons “jumping genes” were discovered because they did not fit known modes of inheritance.
What about relating 2 variables?

Is there a numerical way to determine the accuracy of our analysis?
2, 2, 2, 2, 2, 3, 3, 3, 4, 4, 5, 5, 5, 6, 7, 121, 130
Mean = 18
Standard deviation = 40.5
Standard deviation is a measure of variability.
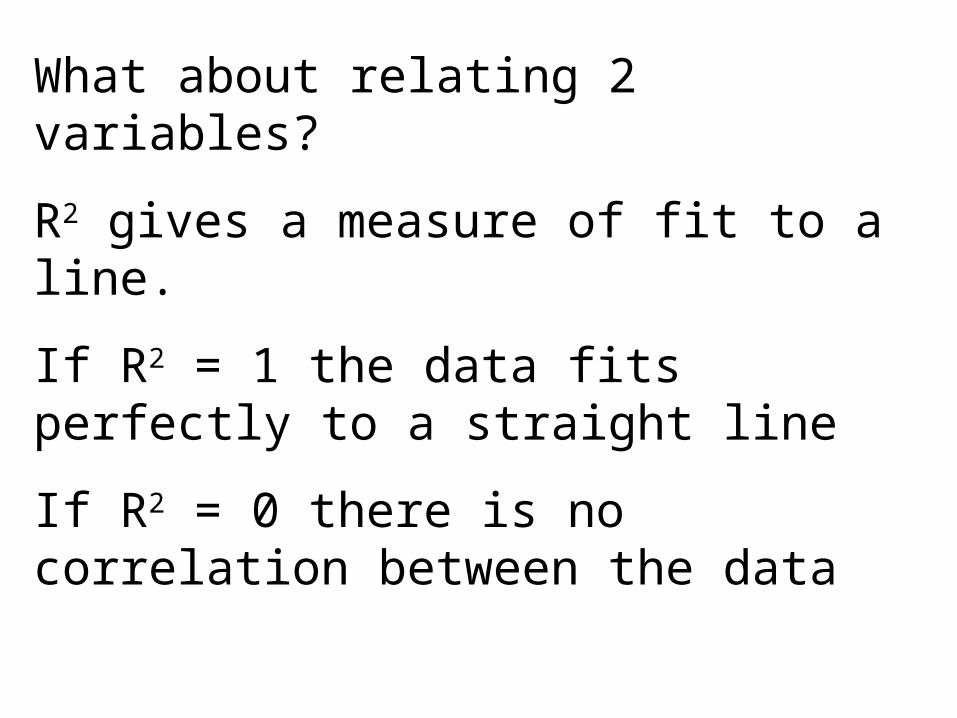
What about relating 2 variables?
R2 gives a measure of fit to a line.
If R2 = 1 the data fits perfectly to a straight line
If R2 = 0 there is no correlation between the data
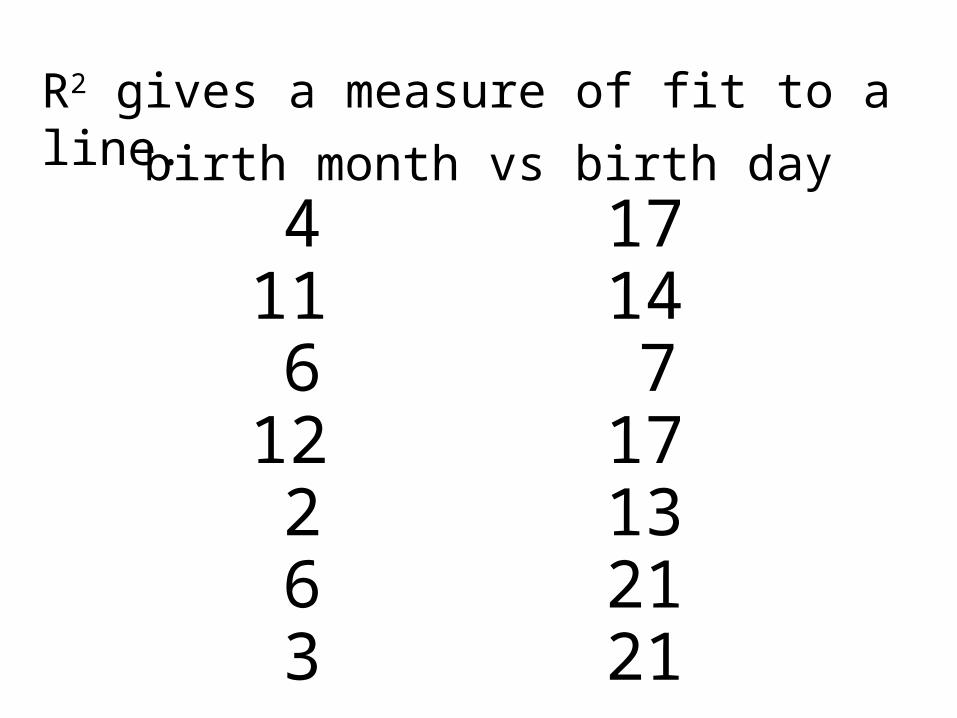
R2 gives a measure of fit to a line.
4 1711 146 7
12 172 136 213 21
birth month vs birth day

birth month
Birth day
birth month vs birth day
R2 = 0.0055
0
5
10
15
20
25
0 2 4 6 8 10 12 14

Bradford Assay 3-7-05
R2 = 0.9917
0.000
0.020
0.040
0.060
0.080
0.100
0.120
0.140
0.160
0 0.5 1 1.5 2 2.5
ug protein
OD595
Protein quantity vs absorbance

We will practice T-test, outliers, and R2 in lab.
Also, you will have time to begin forming groups for Inquiry 2.

Inquiry 1 written and oral reports are due in lab the week of 9/29.
Today: More Statisticsoutliers and R2