Embed Size (px)
Citation preview
THE DYNAMICS OF INSECT POPULATIONS
T.R.E. Southwood
STABILITY AND CHANGE
When entomologists first considered the dynamics of populations, two contrasting features were immediately apparent. On one hand there was surprising stability, on the other there were remarkable changes, numbers rising suddenly and falling dramatically.
A classic example of stability is provided by British butterflies; those species that were common over a hundred years ago remain common, those that were scarce are mostly still scarce. A more numerical example, but again based on comparisons between species, is provided by the Heteroptera collected in a light trap at Rothamsted; although 95 species were caught, in the nine seasons of trapping (spread over 23 years, 1933-1956), three were always amongst the six most abundant (Southwood 1960, 1968). Stability in absolute population size is well illustrated by Ehrlich and Gilbert's (1973) study of the tropical rain-forest butterfly Eelioonius ethilta in northern Trinidad. They estimated the size of a colony over 27 generations; the number of adults varied from 98 to 199 with a mean of 156, but none of the 20-day-interval, successive population estimates was significantly different from the next.
In contrast, other entomologists, particularly those concerned with economic entomology, have been impressed by the changes in numbers. Outbreaks of pests occur in some years, but not in others. Locusts provide an outstanding example of spectacular periodic epidemics (Waloff 1966); there are a number of references to pest outbreaks in records of the ancient world (Southwood 1968).
In the early development of ecological theory some workers concentrated on the phenomenon of stability that is determined by density-dependent processes (i.e., processes acting on a higher proportion of the population as density increases). A.J. Nicholson was a powerful proponent of this view, and he was supported by C. Elton, D. Lack, M. Solomon, and many others.
151

T.R.E. SOUTHWOOD
A most forceful expression of the contrary view was by H.G. Andrewartha and L.C. Birch in their classic The Distribution and Abundance of Animals (1954). They emphasized that there was no need to attach special importance to density-dependent factors. Essentially, they viewed populations as chaotic, simply limited by the shortage of time in which conditions were favorable and the rate of increase was positive and, less frequently, by an absolute or relative shortage of resources.
The dispute probably reached its apogee in June 1957 at the Cold Spring Harbor Symposium on "Population Studies: Animal Ecology and Demography." Here A. Milne elaborated his theory, blending the two approaches and stressing that only intraspecific competition was "perfectly density dependent." Populations could, he supposed, fluctuate for long periods at a lower density because of the combined action of density-independent factors and natural enemies (imperfect density-dependent factors). In the early 1960s Chitty and Pimentel both put forward independent theories that highlighted the importance of changes in quality, genetic composition, and birth rate.
After about 1960 ecologists increasingly realized that the two viewpoints were not mutually exclusive (Richards 1961; Bakker 1964; Huffaker and Messenger 1964; Richards and Southwood 1968). It was recognized that each of these theories had added a new dimension to our picture of population dynamics. Additional data have become available over the last twenty years and, as more sophisticated techniques of theoretical and specific analysis are now adopted, one must hope that the study of population dynamics has now moved from a "single factor" to a "synoptic" stage of development (Southwood 1968). As will be shown in this review, stability and change can be fitted within one conceptual framework, and furthermore change, although normally a response to environmental fluctuations, may be produced in a system governed by density dependence.
The term stability poses problems of interpretation. Lewontin (1969), in a prescient paper, considered that ecologists would require the general abstract framework provided by the concept of the vector field in n-dimensional space; he defined a variety of dynamical-space concepts, including neighborhood and global stability and relative and structural stability. The biologists
1 problems in the
measurement of stability were emphasized by Watt (1969). There are a number of possible criteria: fluctuations about a mean, changes in the mean with time, the degree of
152

INSECTS, SCIENCE. AND SOCIETY
synchrony throughout the range, or the extent of gradients in these measures from one part of the range to another. Extending the essentially biological viewpoint, Orians (1974) considers there are six meanings of the term stability: constancy (lack of change), inertia (resistance to perturbations) , elasticity (speed of return after disturbance), amplitude (the zone from which this return will occur), cyclic stability (oscillations), and trajectory stability (e.g., succession).
Such classifications are useful; they essentially highlight the components and forms of stability. But I would agree with May (1973) who, in an opening chapter that calls on both theoretical and field insights, concludes, "It intuitively seems sensible to refer to those systems . . . with relatively small fluctuations as 'stable*."
In studying population change biologists have long recognized three pathways of change: mortality, natality, and migration. (The role of the former has been assessed with much greater frequency [and accuracy] than the other pathways; there are still many difficulties for the quantitative determination of the role of migration.)
The action of factors, using these pathways, may be either—
1. regulating, acting in a positively density-dependent manner (killing a higher proportion with a rise in density) and so tending towards the stabilization of numbers ; or
2. disturbing, acting in a manner to cause fluctuations in the population, to move it away from its stable level.
These two effects can be compounded, as for example in a regulating factor whose action is very imprecise (Southwood 1967).
Regulating factors may be classified in a variety of ways: the causal agents (predators, intraspecific competition) or time scale (delayed, direct). Walker (1967) has suggested an interesting approach, recognizing pathological factors (those that involve mortality) and behavioral factors (those that involve changes in behavior, avoiding the death of individuals).
From this general background we can now turn to recent theoretical and field studies to determine how a more synoptic, multidimensional view of insect population dynamics is emerging.
153

T.R.É. SOUTHWOOD
THEORETICAL STABILITY ANALYSIS
Our understanding of the possible mechanisms that will contribute to stability in populations has recently been enlarged by a number of analytical studies. There are two principal types of interactions that may be stabilizing; that is, they have the potential of acting in a density-dependent manner :
1. Competition between members of the same species in relation to some resource. In its best-known form this is expressed as the logistic or Verhulst-Pearl equation:
dt riy
Κ
where Ν = population density, τ = intrinsic rate of natural increase, and Κ = carrying capacity.
2. The interaction between a prey and its natural enemy. Although pioneered by Howard and Fiske and by H. Smith, the formulation of a quantitative theory basic to recent studies depended on the work of Nicholson, especially Nicholson and Bailey (1935), who expressed the numbers of the host (H) in generation n+1 as:
H = FH exp(-oP ) n+l η η
where F = host's power of increase, a = searching efficiency of the parasite and Pn = parasite population in generation n.
In addition, there are other interactions—for example, interspecific competition and mutualism—which, although related to density, are not normally directly stabilizing. The general development of theories in these areas has been reviewed by Varley, Gradwell, and Hassell (1973) and Williamson (1972). As they point out, observations in the real world have shown that neither competition nor prédation always acts in a stabilizing manner, and recent work has illuminated more precisely why these interactions are not always stabilizing.
Single-Species Dynamics
The simple logistic equation is applicable to overlapping generations and represents a smooth approach to the equilibrium population {N* = K) . However, in many, if not
154
INSECTS, SCIENCE, AND SOCIETY
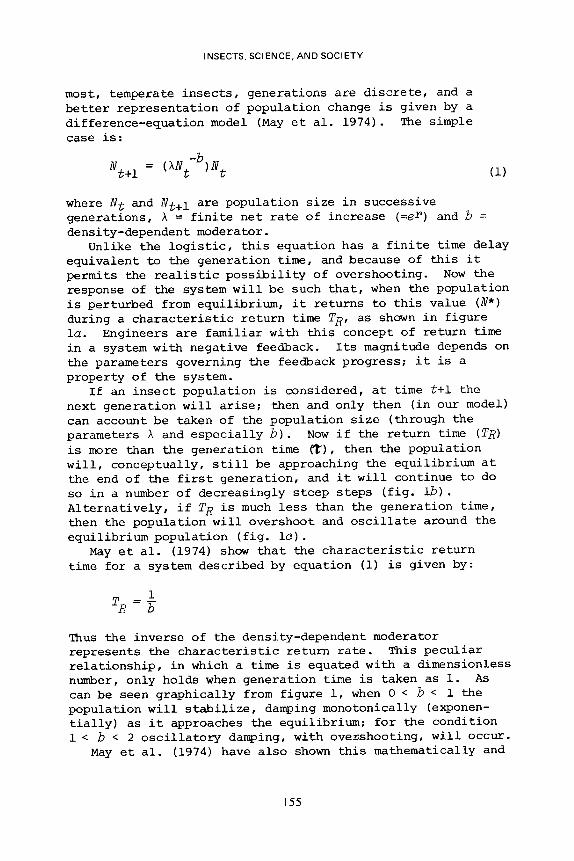
most, temperate insects, generations are discrete, and a better representation of population change is given by a difference-equation model (May et al. 1974). The simple case is:
Nt+i -
{XNt~b)Nt (1)
where and are population size in successive generations, λ = finite net rate of increase (=e
r) and b =
density-dependent moderator. Unlike the logistic, this equation has a finite time delay
equivalent to the generation time, and because of this it permits the realistic possibility of overshooting. Now the response of the system will be such that, when the population is perturbed from equilibrium, it returns to this value (il/*) during a characteristic return time Τβ, as shown in figure la. Engineers are familiar with this concept of return time in a system with negative feedback. Its magnitude depends on the parameters governing the feedback progress; it is a property of the system.
If an insect population is considered, at time t+1 the next generation will arise; then and only then (in our model) can account be taken of the population size (through the parameters λ and especially b). Now if the return time (Tfl) is more than the generation time (T)/ then the population will, conceptually, still be approaching the equilibrium at the end of the first generation, and it will continue to do so in a number of decreasingly steep steps (fig. lb) . Alternatively, if TR is much less than the generation time, then the population will overshoot and oscillate around the equilibrium population (fig. 1c).
May et al. (1974) show that the characteristic return time for a system described by equation (1) is given by:
Thus the inverse of the density-dependent moderator represents the characteristic return rate. This peculiar relationship, in which a time is equated with a dimensionless number, only holds when generation time is taken as 1. As can be seen graphically from figure 1, when 0 < b < 1 the population will stabilize, damping monotonically (exponentially) as it approaches the equilibrium; for the condition 1 < b < 2 oscillatory damping, with overshooting, will occur.
May et al. (1974) have also shown this mathematically and
155

T.R.E. SOUTHWOOD
Ρ ι InN
InN
InN*
lnNt
InN*
lnNt TR
?< τ — » t l i « — τ —»tl2 T i m e
Fig. I. The relationship between time delays (generation time^) and the characteristic return time of the system (TR)S after perturbation (v). (a) b = 1, return to equilibrium in one generation; (h) b = 0.7 > monotonie return to equilibrium; (c) b = 1.4Λ stable limit cycles (oscillations) around equilibrium.
demonstrated that the same stability criteria apply to the general case with overlapping generations, with a time delay (T) that may depend on the recovery time of a resource as well as generation time, as in the simple example with discrete generations where generation time is taken as unity. This work therefore confirms as a general property what has long been recognized (Haldane 1953; Varley 1963; Southwood 1966; Varley, Gradwell, and Hassell 1973); namely, that values of b in excess of 1 are overcompensating and would lead, at least initially, to oscillations.
156

INSECTS, SCIENCE, AND SOCIETY
Thus one sees that even with a simple model the very parameters that may lead to stability can initially cause change, in the form of oscillations. But real populations are not so simple; insect adults and larvae are often exposed to different ecological factors. May et al. (1974) also investigated the stability properties of such a population; that is, one with two age classes, larvae and adults. Four different b
ls may be recognized:
bjjA—effect on larval recruitment at time £+1 of adult density at time t,
bjjl,—effect on larval recruitment at time £+1 of larval density at time t,
^AL—effect on adult recruitment at time t+1 of larval density at time t,
b/iA—effect on adult recruitment at time t+1 of adult density at time t.
bjjA and bj^jj will act through fecundity, and bj^jj and bj^ through larval survival to adulthood. All of these coefficients interact. For example, if bj[j[ and 2?£L
a re z e r of then,
provided one of the remaining coefficients is around 1, considerable variation is permitted in the other; but if &AA
= 1-5, very restricted values of bfri, and bjj[ are
necessary for stability. Therefore natural complexity would enhance the probability
of oscillations, unless during natural selection density-dependent moderators of very limited dimensions have been selected. These conclusions are based on the consideration of 6's in the range of 0 < b < 2. What will be the effect of b%s of even greater overcompensation, that is, in excess of
2? These higher values can easily be shown theoretically to
lead to diverging oscillations (Haldane 1953; Maynard Smith 1974; May et al. 1974). Their practical significance was doubted by Klomp (1966α), but Southwood (1967) suggested that a combination of more sensitive (highly overcompensating) density-dépendenee mechanisms could be associated with high rates of reproduction and might "show two or four generation cycles."
Most recently. May (in press) has thoroughly investigated the dynamical structure of the nonlinear difference equation:
Nt+i
= Nt e x
P[ p (1
" ( 2)
and.related formulations (a type of equation relatively neglected by mathematicians). He has considered the effects of the parameter r, which is itself the resultant of two
157

T.R.E. SOUTHWOOD
biologically meaningful rates: the gain rate less the loss rate.
The following conclusions could be drawn for the difference equation above:
Dynamical Behavior stable equilibrium stable 2-point cycle stable 4-point cycle giving way in turn to 8, 16, 32, etc., as r increases
cycles of arbitrary period or a periodic behavior depending on the initial condition—"chaos"
May (in press) writes that "for temperate-zone insects in particular the implication is that even if the natural world was 100 percent predictable, the dynamics of populations with 'density dependent' regulation could nonetheless in some circumstances be indistinguishable from chaos if the intrinsic growth rate r, is large enough!"
Rates of increase of this magnitude may not be impossibly high. (It should be noted that the density-dependent moderation in this formulation [eq. 2] is provided by the exponent of the term [1 - N-fr/K].) An approximate value of r, termed vQ (Laughlin 1965), is given by:
In R ο
Value of r 2 > r > 0 2.526 > ν > 2 2.692 > r > 2.526
r > 2.692
where RQ - net reproductive rate and Tc - mean generation time. For insects, where the variance in the mean age of reproduction is small, this approximation will not introduce significant errors. In May's analysis the time interval can be taken as the time from one generation to the next; hence r ^ In R0. The mean fecundities necessary for the critical p's of May may be calculated, if a 50:50 sex ratio is assumed and an arbitrary value is assigned to the density-independent mortality. Klomp (1966a) assumed 60%. Although some life tables would appear to support this, higher values may be more realistic. (The deterministic nature of this assumption is a further artificial element.) The values arrived at, using three levels of density-independent mortality, are:
158

INSECTS. SCIENCE, AND SOCIETY
ft (=er) Mean Fecundity £ _o at 60% at 80% at 90% 2 7.39 37 74 148 2.526 12.55 63 126 251 2.692 14.74 74 148 295
A graphical representation of this stability analysis is shown in figure 2; note the decreasing narrowness of the
°/o Total mortality density dependent Fig. 2. Stability boundaries for mean fecundity and various levels of density-dependent mortalityy based on May's (in press) analysis of r in the equation Ν = N exp[r(l - N/K) ].
stable limit cycle bands. We can conclude from these stability analyses that with
insects with discrete generations, where the time delay in the density-dependent feedback may be greater than the natural return time or period of the system (T^), large oscillations will result, and, where the species can maintain a high fecundity rate at all densities, 2- or more-point stable limit cycles may give way to irregular behavior that will depend on the initial conditions. The interactions of density-dependent coefficients for different stages in a multiple age-class system also theoretically increase the
159

T.R.E. SOUTHWOOD
probability of oscillations and fluctuations if the coefficients are randomly selected. Thus it is no longer valid to consider all interactions of a certain type as density dependent, nor to regard all density-dependent relationships as leading to stable populations. The application of these theoretical conclusions to real populations will be considered later.
Predator-Prey Dynamics
Insect parasitoids are, in many respects, ecologically similar to predators and will be included here. However, this topic will only be briefly discussed because it receives separate treatment by Messenger elsewhere in this volume.
Quantitative models start with the work of Thompson and of Nicholson and Bailey; both of those models predicted unstable systems (Huffaker et al. 1968; Royama 1971; Hassell and Rogers 1972) and, although they may be stabilized by the introduction of density dependence into either population, their assumption of a random constant search was biologically unsound (Hassell 1971&; Rogers 1972).
Important concepts were introduced by Holling (1959, 1961, 1964, 1966) and Watt (1959), who separated many of the components of the system. In particular they followed Solomon (1949) in distinguishing between two types of response to increases in prey density, the functional response (change in the number of attacks per predator) and the numerical response (change in the number of predators); the latter is now confined to intergenerational effects due to predator reproduction (Hassell 1966). Holling particularly studied the functional-response curve of predators and noted that, although of various forms (the biological universality of these forms has been doubted by Fransz [1974]),the proportion of prey killed would normally fall with increased prey density (fig. 3a), and thus this could not provide stability.
Studies have revealed a number of components in a predator-prey system that may contribute to stability. The more important of these are:
1. An individual behavioral response when the predator alters its behavior in the general proximity of the prey (Hassell 1966; Rogers 1972; Murdie and Hassell 1973; Rogers and Hassell 1974; Murdoch and Oaten, in press). This may involve attraction, a response to the changed behavior of another predator that has perceived a prey (as in vultures), or increased turning. These lead to
160

INSECTS. SCIENCE, AND SOCIETY
1 Log prey density
(b)
1 log N c Log population density
Fig. δ. Population effects expressed as k-values (log Nt/NsJ in relation to density, (a) Functional response of a predator; (h) intraspecific competition effects according to Hassell's (in press) model (nc = critical density).
161

T.R .E. SOUTHWOOD
an aggregative response by the predator, by increasing its numbers in the area of greatest prey density (Hassell 1966; Hassell and May 1974).
2. Interference between predators or adult parasitoids (Hassell and Varley 1969; Hassell 1971a, fe; Hassell and May 1973; Rogers and Hassell 1974). However, the comparable interference resulting from encounters with parasitized hosts does not increase stability (Rogers and Hassell 1974).
3. Dispersal of predators and prey and the existence of refuges for the prey (Huffaker 1958; Hassell and May 1973; Maynard Smith 1974).
4. Prey switching, where the predator switches its feeding activity to the more abundant prey (Murdoch 1969; Murdoch and Marks 1973). Steele (1974) has shown that under certain conditions prey switching may not be stabilizing.
5. Development response, where the predator is able to increase its prey consumption by virtue of its enhanced feeding capacity with increased age (Murdoch 1971).
It must be emphasized that these mechanisms may provide stability; but, at least in the models at present available, not all values of the appropriate parameters are stabilizing. Hassell and May (1973, 1974) have studied the stability properties for a number of models, involving behavioral responses, interference, aggregation, the time spent traveling between different areas (TQ) , and the proportion of hosts accessible to predators. One of their simplest analyses (fig. 4a) shows that values of the mutual-interference constant (m) of about 0.3 will lead, unless prey reproduction (F) is especially high, to a stable equilibrium, though initially there may be oscillations of decreasing amplitude. In six laboratory studies and four field studies of different parasitoids, m has been measured and found to vary between 0.28 and 0.96 (Hassell and May 1973) .
As a result of their studies, Hassell and May (1973, 1974) conclude that stability is enhanced b y —
1. a small handling time relative to total searching time; 2. a measure of interference between predators (see fig.
4a); 3. a low prey-reproduction rate; 4. a high level of predator aggregation, its components
being: a. The transition region (termed J by Hassell and May),
when the predator rapidly increases the time spent in a unit area, coincides with the average prey density (fig. 4&).
162

1-0
0)
Ο
I
05h
INSECTS, SCIENCE, AND SOCIETY
Unstable (exponential)
Stable (exponential)
Stable (oscillatory)
Unstable (oscillatory)
Host rate of increase (F) Fig. 4a. Stability boundaries for the mutual-interference
constant of predators (m) and prey reproduction (from Hassell and May 1973).
b. The amount of time spent in areas of high prey density is greatly in excess of that spent in areas of low prey density.
c. The time spent in travel between areas {T0) is large; hence, as dispersal is most common when prey densities are low (from b) , this further lowers the efficiency of search at low prey densities.
d. The less clumped the prey, the greater the need (for stability) for marked predator aggregation.
These analyses confirm the general conclusion from single-species studies; namely, that, although certain interactions may have the property of moving the system towards equilibrium stability, whether they do so or not will depend on their having numerical values within a particular range. We must think of the evolution and selection of the magnitude of these parameters as paralleling the almost infinite, but equally nonrandom, variety of form and structure.
How far the system, the population, will actually move
163

T.R.E. SOUTHWOOD
Prey density per unit area
Fig. 4b. The relationship between the time spent in a unit area and prey density, showing the transition region J (from Hassell and May 1974).
towards stability will depend on the extent of random changes and density-independent mortalities in the environment. Thus it is now necessary to consider actual populations.
ANALYSIS OF NATURAL POPULATIONS
In any field of scientific endeavor progress demands the testing of theories against data from the real world. Experimental populations have contributed a great deal to our understanding of limited interactions; in particular, one may think of Crombie's (1945, 1946), Park's (1948, 1954), and Birch's (1948) now classic studies on stored-products beetles or of Nicholson's (1954) now almost overanalyzed observations on blowflies! More complex predator-prey studies have, similarly, been handled experimentally (e.g., Burnett 1967; Huffaker 1958; Huffaker et al. 1968; Utida 1950, 1955). Such experimental studies, whether in the laboratory or the field, will always provide especially elegant methods of investigating particular interactions; for example, the bioclimatic
164

INSECTS, SCIENCE, AND SOCIETY
studies of Messenger (1964) and those of Way (1968) on intraspecific effects in aphids.
Many other ecologists have studied populations in their natural habitats where the full gamut of dynamical complexity might be hoped to reveal itself. The view may be taken that the complexity is indeed so great that an attempt to unravel it is premature; others (e.g.. Way 1973) have warned against a mere Baconian gathering of data. The main problem with quantitative field studies is, to use cybernetic terms, that the level of "noise" is high. The noise arises from two sources: (a) real variation, a product of climatic variability, the stochastic nature of natural events, and the spacial heterogeneity of most environments; and (b) sampling errors. There have also been technical difficulties in calculating the number of individuals in a stage (see Richards and Waloff 1954, 1961; Southwood 1966) and in analyzing the data. Progress is continually being made, improving our techniques for sampling field populations and preparing life budgets of the type pioneered by Richards (1940, 1961). It is my belief that good field studies are essential complements to theoretical analysis, for without them one would lose both the biological insights, which can provide a most profitable starting point for theoretical analysis, and the ability to test or even substantiate one's findings in the real world (see Lawton 1974).
Analysis and Interpretation of Life Budgets
A number of different methods have been developed. Basically, there are two approaches, each of which reveals different information and makes different demands on the data.
Key-Factor Analysis. The term key factor was originally introduced by R.F. Morris, but the most practical method for its detection is that of Varley and Gradwell (1960), now described in several textbooks (Southwood 1966; Williamson 1972; Varley, Gradwell, and Hassell 1973). The key factor is that factor whose variation makes the greatest contribution to the changes in total mortality. Mortalities are expressed as fc-values, the ratios of successive populations. A series of fc's (ko, k\, k<ii · · · , kn) is calculated for a population, and its total is the generation "mortality" (including variations in natality) |(.
1 Originally, Varley and Gradwell
•̂ K should not be confused with K, the carrying capacity; as the latter is undoubtedly the longer established and more widely used term, a new notation should perhaps be adopted for total generation mortality.
165

T.R.E. SOUTHWOOD
(1960) detected the key mortality by visual correlation with K , but Podoler and Rogers (in press) have shown that this is more precisely done by calculating the regression coefficient of each k on K? th
e largest regression coefficient is
associated with the key factor. As the key factor accounts for most of the change from
generation to generation, this would be thought to be a disturbing factor, rather than a stabilizing, regulating one. Indeed, this is normally true, but a stabilizing factor with density-dependent action may also be the key factor if it is overcompensatory (as shown in the stability analysis above) or because of a lack of precision (a high variance) in its action (Southwood 1967) or, conversely, because it represents a very precise density-dependent factor (with b = 1) that "corrects" a number of disturbing factors. In this case the population of the next stage would remain almost constant. Satisfactory key-factor analysis demands a series of fairly complete life budgets.
One weakness of key-factor analysis arises from the role of errors in the estimates, and further problems arise when there is no stable equilibrium (Maelzer 1970; St. Amant 1970; Ito 1972). The error problem is particularly serious with insects of unstable habitats, including arable crops, where there is considerable dispersal at certain stages and thus, even if the crop is grown in the same field each year, the degree of relationship between successive generations is unknown.
The convention (see Podoler and Rogers's [in press] analysis for Osoinelta frit) is to multiply the last generation of a season by a factor, the maximum observed increase, giving an estimate of the maximum potential natality (see table 18 of Southwood 1966). The difference between the logarithms of this estimate and of the first "real" population estimate (egg numbers) gives a value, normally designated k$, that covers variations in adult survival, migration, and fecundity. One then determines whether this k or another contributes most to the variation in the size of Κ (
t ne total generation "mortality").
It is clear that if /Cq contains a random error, arising from the assumptions about the relationship of successive populations, and if this error is sufficiently large then it will dominate the variation in Κ and be, perhaps spuriously, designated the key factor. Indeed, the recipe for key-factor analysis by Varley and Gradwell's method should include the general warning that confidence cannot be placed in the identification of a key factor if there is reason to believe
166

INSECTS, SCIENCE, AND SOCIETY
that significantly more errors are included in the estimates contributing to this term than to other values in the life budget.
For insects living in crops this generally has the implication that the identification of key factors other than fco can be accepted, but not &Q itself. This is unfortunate, as there are theoretical reasons for supposing that / C Q will often in fact be the key factor in unstable habitats. Kuno (1971) and Ito (1972) have shown how the value of b may be biased by sampling errors. Ito has cautioned against the uncritical application of key-factor analysis to multivoltine species, arguing that the key factor for, say, the first generation of a season may be different from that in the second; this point may easily be checked.
The key factors hitherto identified in insect life-budget studies are set out in table 1. A much more detailed analysis of the majority of these cases, together with work on vertebrates, is given by Podoler and Rogers (in press), whose paper will also allow the very appropriate investigation of the comparative nature and distribution of regulating factors. The examination of the key factors, as identified in table 1, suggests that—
1. For most woodland natural-habitat and stored-product herbivores, larval mortality (often parasitism or prédation) is the key factor. Some sap-sucking species (Leptopterna, Aleurotracheitis) are much influenced by food quality acting on fecundity.
2. For most plant feeders of agroecosysterns, variations in the numbers of adults, especially through emigration and immigration, and also possibly variations in fecundity seem to be the key factors (but, as indicated above, full reliance cannot be placed on this conclusion because of error effects).
3. For the only detritus feeder, in a temporary habitat, what appeared to be essentially scramble competition between early larvae was the factor that caused the greatest variation in population size between egg and pupa.
4. For parasites the key factor is host infection. This is clearly the dominant and critical factor in the population dynamics of many parasites.
A new approach to the analysis of life budgets is provided by Birley (unpublished), who has applied the techniques of systems analysis appropriate for time-series data. Essentially an autoregressâve, moving-average method has been used that enables some recognition of sampling errors and
167
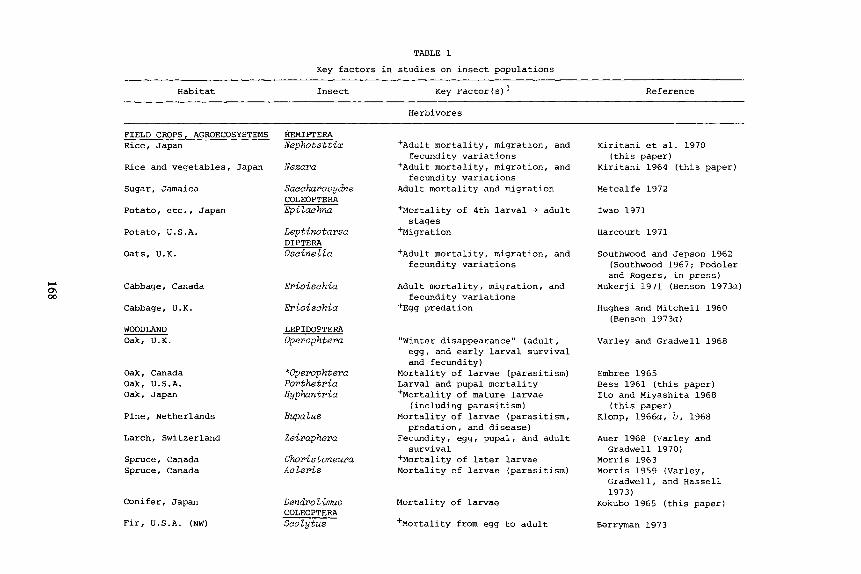
TABLE 1 Key factors in studies on insect populations
Habitat Insect Key Factor(s)1
Reference
Herbivores
FIELD CROPS, AGROECOSYSTEMS HEMIPTERA Rice, Japan Nephotettix
+Adult mortality, migration, and Kiritani et al. 1970 fecundity variations (this paper)
Rice and vegetables, Japan Nezara
+Adult mortality, migration, and Kiritani 1964 (this paper) fecundity variations
Sugar, Jamaica Saooharosydne Adult mortality and migration Metcalfe 1972 COLEOPTERA
Potato, etc., Japan Epilaohna "•"Mortality of 4th larval -»· adult Iwao 1971 stages
Potato, U.S.A. Leptinotarsa ^Migration Harcourt 1971 DIPTERA
Oats, U.K. Osoinelta "•"Adult mortality, migration, and Southwood and Jepson 1962 fecundity variations (Southwood 1967; Podoler
and Rogers, in press) Cabbage, Canada Erioisahia Adult mortality, migration, and Mukerji 1971 (Benson 1973a)
fecundity variations Cabbage, U.K. Erioisehia
+Egg prédation Hughes and Mitchell 1960
(Benson 1973a) WOODLAND LEPIDOPTERA Oak, U.K. Operophtera "Winter disappearance" (adult. Varley and Gradwell 1968
egg, and early larval survival and fecundity)
Oak, Canada *Operophtera Mortality of larvae (parasitism) Embree 1965 Oak, U.S.A. Porthetria Larval and pupal mortality Bess 1961 (this paper) Oak, Japan Hyphantria
+Mortality of mature larvae Ito and Miyashita 1968
(including parasitism) (this paper) Pine, Netherlands Bupalus Mortality of larvae (parasitism. Klomp, 1966a, b, 1968
prédation, and disease) Larch, Switzerland Zeirapheva Fecundity, egg, pupal, and adult Auer 1968 (Varley and
survival Gradwell 1970) Spruce, Canada Choristoneura "•"Mortality of later larvae Morris 1963 Spruce, Canada Aoleris Mortality of larvae (parasitism) Morris 1959 (Varley,
Gradwell, and Hassell 1973)
Conifer, Japan Dendrolimus Mortality of larvae Kokubo 1965 (this paper) COLEOPTERA
Kokubo 1965 (this paper)
Fir, U.S.A. (NW) Soolytus "•"Mortality from egg to adult Berryman 1973
168

H a b i t a t I n s e c t K e y F a c t o r ( s ) R e f e r e n c e
O l i v e , C a l i f o r n i a E u c a l y p t u s , A u s t r a l i a
A l g a e o n l a r c h , U . K .
S C R U B L A N D S A N D G R A S S L A N D S B r o o m , U . K .
R u m e x , U . K . S e n i c o , U . K .
H o l c u s , U . K .
V i b u r n u m , U . K .
S T O R E D P L A N T P R O D U C T S F l o u r F l o u r W h e a t t i p p i n g s
H E M I P T E R A Parlatorva Ccœdiaspina
( e n d e m i c ) P S C O P T E R A Mesopsoous
( 2 s p p . ) C O L E O P T E R A Phytodecta L E P I D O P T E R A *Lyoaena Tyria
H E M I P T E R A Leptoptema
*Aleurotraohelus
L E P I D O P T E R A Anagasta Plodia Ephestia
P a r a s i t i s m o f l a r v a e b y Aphytis V a r i a t i o n s i n a d u l t s u r v i v a l a n d
f e c u n d i t y +P r e d a t i o n o f l a r v a e
L a r v a l m o r t a l i t y
M o r t a l i t y o f e g g a n d f i r s t i n s t a r L a r v a l m o r t a l i t y , e s p e c i a l l y
s t a r v a t i o n
(1 ) V a r i a t i o n s i n f e c u n d i t y , (2 ) m o r t a l i t y , p r é d a t i o n , a n d a c c i d e n t , l a t e l a r v a e
V a r i a t i o n s i n f e c u n d i t y
P a r a s i t i s m o f l a r v a e P a r a s i t i s m o f l a r v a e V a r i a t i o n s i n f e c u n d i t y , e g g , a n d
e a r l y l a r v a l m o r t a l i t y
H u f f a k e r a n d K e n n e t t 1 9 6 6 C l a r k 1 9 6 4 ( t h i s p a p e r )
B r o a d h e a d a n d W a p s h e r e 1 9 6 6
R i c h a r d s a n d W a l o f f 1 9 6 1
D u f f e y 1 9 6 8 D e m p s t e r 1 9 7 1 (an d
p e r s . c o m m . )
M c N e i l l 1 9 7 3
S o u t h w o o d a n d R e a d e r ( p e r s . c o m m . )
H a s s e l l a n d H u f f a k e r 1 9 6 9 P o d o l e r 1 9 7 4 B e n s o n 1 9 7 4
D e t r i t u s F e e d e r s
A r t i f i c i a l w a t e r c o n t a i n e r s , T h a i l a n d
D I P T E R A Aedes "•"Mortalit y o f e a r l y l a r v a l s t a g e s S o u t h w o o d e t a l . 1 9 7 2
P a r a s i t e s
O a k ( h o s t : L e p . l a r v a e )
S t o r e d p r o d u c t s ( h o s t : L e p . l a r v a e )
D I P T E R A Cyzenis
H Y M E N O P T E R A Braoon
E g g m o r t a l i t y ( f a i l u r e t o b e i n g e s t e d b y h o s t )
V a r i a t i o n s i n f e c u n d i t y
H a s s e l l 1 9 6 8
B e n s o n 19732 ?
N O T E : * m e a n s i n t r o d u c e d ; ^ h e r e s e v e r a l f a c t o r s a r e
+ m e a n s s o m e a s s u m p t i o n s i n a n a l y s i s . g i v e n , t h e s e , u n l e s s n u m b e r e d , a r e c o n g l o m e r a t e s .
169

T.R.E. SOUTHWOOD
their effects, as well as direct and delayed density dependence and the delayed effect of disturbances.
Predictive Analysis. The predictive factor is the one that is most closely correlated with the ensuing population. This was the initial concept of key factor as used by Morris, but, as Podoler and Rogers (in press) point out, it is not necessarily the same as the factor accounting for change in "mortality." A method to assess the relative importance of natality and mortality in determining subsequent population size was described by Southwood (1967). The changes in the population are based on the equation:
log PR = log P£ - M
where P# = egg population and PR = resulting (adult, pupal, or late larval) population. The method is particularly appropriate for highly mobile species (pests of crops) where, as discussed above, a series of meaningful life budgets is difficult to obtain.
The results of predictive analyses, using this method, of a large number of the available sets of data from field populations of insects are given in table 2. High values of the coefficient of determination (r
2 is the square of the
correlation coefficient) imply that the given proportion of the variation in the resulting population is determined by the size of the egg population, itself normally a product of two pathways of population change: migration and natality. By analogy, very low values of r
2 may be taken as indicating
the important role of mortality between the egg and the "resulting population" (normally adult, but sometimes late larvae or pupae).
It will be seen that in many of the arable crops natality provides an excellent prediction of future population size; in other words, variations in mortality from generation to generation are not significant; nor, as natality varies (when Pfi covers a range), does mortality regulate (act as a major density-dependent factor). The same applies to the introduced insects on nonnative plants and to the red locust, Nomadacris.
In other habitats natality is not a good predictor; that is, mortality is a more significant pathway and may include density-dependent action. Little reliance can be placed on the exact magnitude of the nonsignificant values of r
2.
Certain variations are, however, noteworthy: mortality is more important in vegetable crops than in cereal crops. In the corn borer (Ostrinia) it becomes more important in the
170

INSECTS. SCIENCE, AND SOCIETY
second generation, whereas in the moth Dendrolimus the role of natality appears to increase in the endemic situation. The analysis for Cardiaçpina confirms Clark's conclusion that in the endemic situation adult mortality is critical and subsequent mortalities less variable.
Specific Models of Natural Populations
Models are of two types, general and specific (Conway and Murdie 1972). The general models explore the dynamic properties of the system, and models of this type have been discussed in the section on theoretical stability analysis. It has been shown that they reveal features about the behavior of the systems, features that were by no means intuitively obvious.
Specific models are concerned with particular populations, and they may serve three functions: instructive, predictive, and analytical.
Instructive. The actual process of constructing the model can highlight gaps in the research program. The development of the flow chart and other initial stages of model construction should ideally be an integral part of research planning.
Predictive. The models are normally designed to predict the effects of changes in the variables. This is especially valuable for pest populations, where these models are frequently used (Watt 1963a and b; Conway and Murdie 1972; Conway 1973). Such models often work "back" from the observed events towards the identification of the form and magnitude of the major parameters. Then these may be varied so that the effect of various control strategies can be assessed.
As Conway et al. (in press) have stressed in their study of the sugar cane froghopper, it is essential that economic considerations be introduced if the model is to provide insights of practical relevance. On this criterion—that is, the improvement of pest-management techniques—models have not so far been very successful (Conway 1973), but progress is likely with the better definition of objective functions, which will incorporate economic considerations and the use of the appropriate optimization techniques such as dynamic programming (Shoemaker 1973a, b, C; Conway et al., in press).
Existing models have been more concerned with the prediction of population change within a year, with answering the question "under what climatic (and other) conditions is a pest outbreak likely?" The first extensive work of this type was for the spruce budworm (Morris 1963), and Campbell (1967)
171

TABLE 2 Predictive analyses of population data for various insects
Habitat Insect d%a Source ARABLE CROPS Oats Maize
Maize
Rice Potato Vegetables, rice Cabbage, Canada Cabbage, U.K. Cabbage, Holland Cabbage, U.S.A. Sugar INTRODUCED INSECTS ON NONNATIVE PLANTS
Olive, U.S.A.
Viburnum, U.K.
ARID LANDS Various MARSHLAND AND GRASSLAND Rumex Grass Grass
HERBIVORES Osoinelta frit 97* Ostrinia nubilalis 96*
(1st gen.) 0. nubilalis 49*
(2nd gen.) Nephotettix ceneticeps 66 Leptinotarsa decemlineata 99 Nezara viridula 46 Erioischia brassicae 42 E. brassicae 21 E. brassicae 11 Trichoplusia ni 3 Diatraca 16
χ XXX
X
Parlatoria oleae 95 (before biological control)
Aleurotrachelus jelinekii 92
XXX
Nomadacris sep tern fasdata 79
Lycaena dispar * 20 Chorthippus parallelus 26 C. brunneus 1
xx
Southwood and Jepson 1962 Chiang and Hodson 1959
Chiang and Hodson 1959
Kiritani et al. 1970 Harcourt 1971 Kiritani 1964 Mukerji 1971 Hughes and Mitchell 1960 Abu Yamen 1960 Elsey and Rabb 1970 Pickles 1936
Huffaker, Kennett, and Finney 1962
Southwood and Reader (unpublished)
Stortenbecker 1967
Duffey 1968 Richards and Waloff 1954 Richards and Waloff 1954

Grass SCRUBLAND Sarothamnus Sarothamnus Senioo WOODLANDS Oak, U.S.A. Plane, Japan Pine, Japan
Pine, Japan Pine, Netherlands Fir, U.S.A. Eucalyptus, Australia
Oak, U.K.
Larch, U.K.
Larch, U.K. ARTIFICIAL WATER
CONTAINERS Detritus, etc. Thailand STORED PRODUCTS Wheat toppings
Leptoptema dolabrata
Arytaina sarothamni Phytodeta olivaoea Tyria jaoobaeae
Porthetria dispar Hyphantria ounea Dendrolimus speotabilis
(endemic) D. speotabilis (epidemic) Bupalus piniarius Soolytus ventralis Cardiaspina albitextura
(endemic 1st gen.) (endemic 2nd gen.) (endemic 3rd gen.) (epidemic all gen.)
PARASITE OF DEFOLIATORS Cyzenis albicans ALGAL EPIPHYTE FEEDERS
Mesopsoous immunis
M. unipunotatus DETRITUS FEEDERS Aedes aegypti HERBIVORE Ephestia oautella
35
6 0.1 2
23 45 8 χ
40 4 0.1 xx 60
59* 92* 74*
29
r „x 64
50
0.3
11
McNeill 1973
Watmough 1968 Richards and Waloff 1961 Dempster, in press
Bess 1961 Ito and Miyashita 1968 Kokubo 1965
Kokubo 1965 Klomp 1966& Berryman 1973 Clark 1964
Hassell 1968
Broadhead and Wapshere 1966
Southwood et al. 1972
Benson 1974 NOTE: r is significant at the
x0.1 level,
x x0.5 level, a
For resulting population with egg numbers. and xxxo.OOl level.
T.R.E. SOUTHWOOD
has developed a model for the gypsy moth. An apparently successful model for the cabbage aphid and its parasites in Australia permitted the correct prediction not only of the level of pest population in relation to early-season parasitism, but also of the mean fecundity of the parasite in another part of its range (Europe)(Hughes and Gilbert 1968; Gilbert and Hughes 1971).
Analytical. One cannot be completely confident that a model that provides a reasonable fit is actually a realistic representation of the interaction of all the parameters and not merely an effective mimic; obviously, the greater the range of independent data against which it is tested, the greater confidence that can be placed in it. A detailed model can provide considerable insight into the role of different components in the dynamics of the population in a given season. Gilbert and Gutierrez (1973) make a powerful plea for the reasonably complete analysis by modeling of numerous sets of field data, for they believe that by such means "generalisations (should they exist)" will be revealed.
These analytical models do, of course, grade into the type of models that arise from key-factor analysis; indeed, the spruce-budworm work is the starting point of both approaches. However, the key-factor analyses described above are based largely on the comparison of successive population figures (i.e., life budgets) and the determination of year-to-year changes. The analytical aphid models are based on a combination of field and laboratory knowledge, together with climatic and phenological inputs, and essentially reveal the development of the population within a season; that is, the causal mechanisms underlying the predictions (Hughes and Gilbert 1968; Gilbert and Hughes 19'71; Gilbert and Gutierrez 1973; Gutierrez et al. 1974).
Undoubtedly, such specific simulation models will, in due course, reveal further insights into basic population dynamics (particularly the evolutionary pressures), but, by comparison with key-factor and predictive analyses discussed above, so few have hitherto been undertaken that even a preliminary synthesis would be premature.
THE THREE-DIMENSIONAL FRAMEWORK OF POPULATION DYNAMICS
The Population-Growth and Population-Density Axes
The simplest representation of population growth in a limited environment is provided by the classic logistic curve
174

INSECTS. SCIENCE. AND SOCIETY
in which, after an effectively exponential increase, the growth rate is successively dampened with increasing density and, eventually, asymptotically approaches the equilibrium level. Few real populations, particularly those of insects, seem to behave in this way, and as pointed out in the first section these observations caused many ecologists to reject the concept of stability and doubt the significance of density dependence.
Others, notably Milne (1957), have recognized that there appeared to be levels from which the population rose from time to time, to outbreaks. Clark (1964) crystalized these ideas, in relation to his study of the psyllid Cardiaspina, referring to endemic and epidemic levels. A series of the theoretical ideas will now be compiled, and I hope to show how, combined, they produce a general model that conforms with the experience of the field ecologist and yet embodies both stability and change.
The models described in the section on theoretical stability analysis are all deterministic, but in the real world random environmental variation occurs. Diamond (in press) has considered the effect of introducing random variation in two parameters, host-reproduction rate and parasite-interference constant; he found that the conditions for stochastic stability were not very different from those predicted by the deterministic model. One might summarize that the stochastic nature of the real world generally results in no more than a measure of "fuzziness" around the stability points.
In nature, populations also suffer from perturbations, major disturbances. Holling (1973) has focused attention on the concept of resilience in ecological systems. Resilience is the extent to which the system can recover from a change in its state variables arising from perturbations. Some population systems return, quickly or slowly, after perturbation to the same equilibrium value; these are resilient, compared with other systems that after perturbation move to a new set of dynamic properties and a new equilibrium. When a natural grassland is plowed and cultivated (a perturbation), some insects (e.g., soil dwellers) eventually regain their former population levels; others that are less resilient to such perturbation either become extinct or establish new, and often much higher, equilibrium levels. One can visualize domains of stability, areas in phase space, that represent the resilience of a population system (or ecosystem), but their quantification is not easily conceived (May 1974).
These theoretical concepts and those explored in the
175

T.R.E. SOUTHWOOD
section on theoretical stability analysis suggest that— 1. a population showing stability and acting under
density-dependent regulation may not be constant; it may oscillate with stable limit cycles or show less regular fluctuations;
2. systems may have domains of stability and, when they are perturbed beyond one domain, they will pass to another; i.e., the population establishes itself at a new level.
The two main types of regulatory mechanisms are natural enemies and intraspecific competition. Although the studies of Hassell, May, Murdoch, and others (cited above) have shown categorically how natural-enemy action may, through certain features, stabilize prey populations (and hence Milne [1957] erred in regarding them as inherently imperfectly density dependent), it is intuitively obvious that certain rapid rates of prey density (perhaps by immigration) could saturate natural-enemy control. Indeed, Holling (1966) showed that the functional response typical of invertebrate predators would be of an inversely density-dependent (destabilizing) type (fig. 3a). However, switching, aggregation (numerical response), and possibly the learning of a prey type (Samson-Boshuizen, Lenteren, and Bakker 1974) may lead to a humped response curve. A total response of this type has been utilized by Fransz (1974) in his study of an acarine predator system and is represented graphically in figure 5.
Competition models have often been linear in form, yet biologically it seems sound to consider that there is a critical population level {Nc) at which scramble competition starts to operate. Below this level there may be some measure of contest competition; indeed, as Hassell (in press) points out, these two may be regarded as the extreme ends of a range. He has developed a new model for intraspecific competition in discrete generations of the form:
Nt+1 = X { l +a N t ) - \ (3)
where λ is the net rate of increase, b is the density-dependent moderator, and α = 1/NC. This model will describe a curve of the type shown in figure 3b for the relationship of mortality (expressed as a fc-value, i.e., log N-fr/Ns) to density. Its apparent realism, by introducing a critical density, is confirmed by the wide range of natural data to which it can be fitted (Hassell, in press).
176

INSECTS. SCIENCE. AND SOCIETY
Fig. 5. Percentage-mortality curves in relation to density for the total response of a predator (after Fransz 1974) to a prey and for intraspecific competition (in the prey) based on the model of Hassell (in press) (eq. 3 in text) where N c = 330 and h = 2.
These two regulatory factors may be combined graphically to produce a composite mortality curve (fig. 6). The total response of a predator, of the form described by Fransz (1974), operates over low densities (peak percent of prédation at nine per unit area); at higher densities Hassell's competition model becomes dominant (Na = 330, b = 2)(fig. 5). To complete the parameters of this hypothetical population (which is, however, based on field-tested relationships), a natality curve has to be inserted. The natality-density
177

T.R.E. SOUTHWOOD
Log population density Fig. 6. The total mortality-density relationship from a combination of prédation and intraspecific effects, as shown in figure 5Λ together with a natality-density curve (based on the form found in cabbage aphid by Way [1968]).
curve is based on that for the cabbage aphid {Brevicoryne brassicae), as described by Way (1968). Mortality and natality values may be read off and a composite graphical model of the basic "reproduction curve" type used by Takahashi (1964) and Holling (1973) constructed (fig- 7).
Several important points may be recognized in figure 7: 1. The extinction point X. Once the population is
perturbed to this level or below it, extinction is inevitable, due to the presence of an "Allée effect" in the natality curve; i.e., natality falls with
178

INSECTS, SCIENCE, AND SOCIETY
Log Nt Fig. 7. A general representation of the population-growth and population-density relationship based on the natality and mortality curves shown in figure 6 (x = extinction point, s = stable equilibrium point, R = release point, ο = oscillations equilibrium point around which populations move in stable limit cycles, C = crash point beyond which population returns to lower equilibrium level).
decreasing density below a certain optimum level. 2. A stable equilibrium point S, determined by the
interaction of the predator and natality. Population below it will rise to it; those just above it will fall back to it.
3. A release point R, at which the predator can no longer contain population growth. Once beyond this point, population continues to rise, intraspecific mortality and natality effects increasingly operating to dampen
179

T.R.E. SOUTHWOO D
g r o w t h . Thi s releas e p o i n t correspond s wi t h V o û t e1s
(1946 ) con c e p t o f "es c a p e . " 4 . A n osci l l a t i o n s equ i l i b r i u m p o i n t 0, aroun d wh i c h th e
po p u l a t i o n wi l l mo v e i n stabl e lim i t cy c l e s . Thi s arise s be c a u s e b i n th e Has s e l l mod e l w a s give n th e valu e o f 2 ; hen c e thi s morta l i t y i s ove r c o m p e n s a t i n g an d a two-p o i n t stabl e limi t cycl e wi l l b e pr o d u c e d .
5 . Th e cras h p o i n t C, beyo n d w h i c h , i f th e po p u l a t i o n i s per t u r b e d (b y exces s i v e l y favorabl e cond i t i o n s fo r rep r o d u c t i o n , su r v i v a l , o r i m m i g r a t i o n ) , th e po p u l a t i o n crashe s t o a leve l bel o w wh i c h pr e d a t o r contro l aga i n op e r a t e s .
Th e regi o n X-S-R ma y b e consid e r e d a s th e endemi c p o p u l a tio n leve l an d tha t o f R-O-C, a s th e epi d e m i c leve l o f Clar k (1 9 6 4 ) . Th e smal l rang e o f pop u l a t i o n densi t i e s i n th e reg i o n S-R arise s solel y fro m th e for m o f th e unde r l y i n g natal i t y an d mort a l i t y cu r v e s . On e mi g h t cons i d e r tha t i t give s th e equi l i b r i u m syst e m o f S a smal l doma i n o f stability . Whe t h e r a n equil i b r i u m po i n t i s S or 0 wi l l depen d entirel y o n th e valu e o f b i n it s regio n (se e sectio n o n theoretica l stabilit y a n a l y s i s ) . Rep r e s e n t a t i v e po p u l a t i o n trace s ar e show n i n figur e 8 , fro m wh i c h i t wi l l b e see n tha t ver y di f f e r e n t pa t t e r n s o f fluct u a t i o n ar i s e , depe n d i n g o n th e ext e n t o f "no i s e " (rando m var i a t i o n i n th e bir t h an d deat h r a t e s ) .
Thi s mod e l appe a r s t o rep r e s e n t adequatel y th e pat t e r n typica l o f man y fiel d po p u l a t i o n s . Cla r k ' s (1964 ) studie s o n th e euca l y p t u s ps y l l i d Cardiaspina albitextura (se e als o Clar k e t a l . 1967 ) showe d tha t durin g th e endemi c ph a s e numb e r s wer e regulate d pri n c i p a l l y throug h dens i t y - d e p e n d e n t pr é d a t i o n o f th e adult s b y a rang e o f gene r a l p r e d a t o r s , mostl y b i r d s . Mortalit y o f th e immatur e stage s w a s generall y inde p e n d e n t o f densit y (se e tabl e 2 ) : ho w e v e r , w h e n thes e mort a l i t y factor s (especiall y par a s i t e s ) we r e depresse d b y we a t h e r con d i t i o n s , th e abil i t y o f bi r d pr é d a t i o n t o respon d t o th e ris e i n densit y w a s soo n exceede d (i.e. , th e p o p u l a tio n pas s e d throug h a smal l S-R z o n e ) . Th e me a n numbe r o f adult s p e r shoo t ros e fro m aroun d tw o t o nearl y fifty , th e epidemi c le v e l . Ext r e m e scramb l e compe t i t i o n fo r foo d occ u r s a s th e foliag e bec o m e s damaged ; larva e pe r i s h fro m star v a t i o n an d femal e ovip o s i t i o n ma y b e limite d b y th e smal l amo u n t o f suitab l e fol i a g e . I n term s o f th e m o d e l , th e po i n t 0 i s clos e t o th e p o i n t C t o wh i c h th e popu l a t i o n usuall y r i s e s , the n returnin g t o th e lo w ende m i c le v e l .
A simila r ex a m p l e , als o fro m Au s t r a l i a , i s pro v i d e d b y th e euca l y p t u s ph a s m a t i d , Didymuria violeseens (Readsha w 1 9 6 5 ) .
180

INSECTS, SCIENCE, AND SOCIETY
Endemic population densities of about 10-20 per 100 ft2 are
regulated by natural enemies (again principally birds); climatic perturbations are followed by rises in populations to 45-55 per 100 ft
2, which seems to constitute the release-
point density; thereafter densities of up to 125 per 100 ft2
are attained when intraspecific competition (through damage to the host plant) becomes severe.
The history of the European spruce sawfly (Diprion herayriae) in Canada effectively represents movement down through the model. Achieving epidemic proportions after its introduction from Europe, its numbers were eventually reduced, primarily by a virus disease, to very low endemic levels where introduced parasites now seem to be effective regulating factors (Neilson and Morris 1964). Successful biological control can generally be regarded as moving the population from the epidemic to the endemic phase.
In cereal fields in Britain it seems that, if there are significant numbers of predators present early in the spring, subsequent aphid outbreaks are less likely (Potts 1970; Potts and Vickerman 1974); presumably the aphid populations are kept in the zone X-R. Densities during outbreaks are some hundredfold greater.
The perturbations that cause populations to pass beyond the release point are frequently climatic; Ito (1961) provides a number of examples. Another potent cause is the use of insecticides: natural enemies are adversely affected and new population levels are achieved; new pests appear (Massee 1952; Ripper 1956; Entwistle, Johnson, and Dunn 1959; Smith 1970; Conway 1971).
The situation represented by the region R-C in the model is characteristic of many species of unstable habitats, e.g., locusts and blowflies. Density dependence is probably overcompensatory; the highest value of b recorded from the field is for scramble competition in Aedes aegypti larvae in artificial water containers (Southwood et al. 1972). One of the most important pathways of population change at levels close to or above the carrying capacity is migration; Kennedy (this volume) has reviewed our knowledge"of this ecologically significant behavior.
The remaining situation shown by the model is the one in which the density of the stability point 0 is not sufficiently above the carrying capacity of the environment to cause its permanent destruction, but the population oscillates around that level. The larch moth, Zeivaphera diniana, in the Engadine, Switzerland (Baltensweiler 1968, 1971), and the tent caterpillar, Hyphantria aunea, in Canada and Japan
181

T.R.E. SOUTHWOOD
I / (b)
f ̂ ^ ^ ^ ^
Generation
Fig. 8. See legend on next page.
182

INSECTS. SCIENCE, AND SOCIETY
(Morris 1964; Ito, Shibazaki, and Iwahashi 1969) appear to provide excellent examples of oscillations at high density.
The data are not available to determine with certainty if any natural populations could exhibit chaotic behavior solely through the action of density-dependent regulation (May 1975) (see the section on theoretical stability analysis and fig. 2). A putative example is provided by the social wasps, especially Paravespula. Records of the number of nests (which represent one reproducing female) show apparently chaotic fluctuations (Southwood 1967); the levels of fecundity are now known to be very high (a mean queen production of over 4,000 for P. germanica [Spradbery 1971]); and young queens compete fiercely and fatally for nesting sites. As Spradbery (1973) points out, where both perish, severe overcompensation (a high value of b) will result.
Thus this model for population growth emphasizes that the action of stabilizing mechanisms can account for outbreaks and extinctions, fluctuations and oscillations; that is, population change in all its forms. On this "bedrock" further environmental perturbations are imposed and produce the rich variety of changes we observe (fig. 8).
The Habitat Axis
Habitats may be classified according to their stability (i.e., the degree of their permanence and predictability). The spectrum ranges from temporary pools, carrion, dung, and ruderal plants to large rivers and permanent forests (Southwood 1962a, b). It is claimed that "habitat is the template against which evolutionary pressures fashion the ecological strategy of a species; the instability-stability habitat spectrum gives rise to the r-K selection continuum" (Southwood et al. 1974). Habitat stability may be defined for any animal as f/H (
/^f= generation time, and H = the
length of time the habitat remains suitable for food harvesting). The habitat itself is the area accessible to the trivial movements of the food-harvesting stages. Clearly, the larger the scale, either in space or time, in which habitat is viewed, the greater its predictability; thus
Fig. 8. Population change based on the model represented in figure 7; E, S^ O^ and C as in figure 7. (a.) Deterministic simulation, with perturbations upwards at points marked P; (b) stochastic simulation with random variation: 1- to 1.5-fold increase or decrease of deterministic outcome; (c) stochastic simulation as b, but range 1-5.
183

T.R.E. SOUTHWOOD
habitats of larger animals, which can control the direction of their movements over longer distances and which live longer, will be more stable than those of smaller species (Southwood et al. 1974).
It has been shown above how the population dynamics of a species is determined by a number of often interrelated parameters: the density-dependent moderator (b) which in discrete generations determines the return time, the net rate of increase (λ), and the equilibrium level (or levels) (N*
l,...,n ^e highest of which will normally equal K,
the carrying capacity). As animals evolve against their habitats, at different points of the instability-stability spectrum, different ecological strategies will develop from the selection of particular values for these parameters.
The fundamental requirement at the most stable end of the habitat spectrum, the Z-strategist of MacArthur (1960), is that the population return rapidly to the equilibrium level after a perturbation. On the other hand, overshooting the carrying capacity will have an evolutionary penalty: the habitat will have been degraded for future generations. Thus in terms of the difference model (eq. 1) of population growth:
* t+i " (XN
t'b)Nt
b will approximate unity, but not exceed it. Southwood et al. (1974) show how this is likely to arise by maximizing the proportion surviving, lengthening the life span, and developing subtle mechanisms whereby fecundity, although normally low, may be rapidly increased if population density is lowered. This is seen in many large, long-lived vertebrates which have delayed maturity and exclude potential breeders through territorial behavior. The tropical rain-forest Morpho butterflies are large, territorial, and long-lived and probably represent initially Z-selected insects (Young and Muyshondt 1972).
The P-strategist is an exploiter. Whittaker (1974) has recently suggested that, in addition to ν (exploitation) selection, one must recognize "adversity selection." I would agree that the evolutionary answer to habitat change, where it is reversible (due to climate), may involve either a "sit-tight tactic" (i.e., diapause in insects) or one of "seeking pastures new" (i.e., migration)(see Southwood 1962a, especially fig. 1; Dingle 1974). However, once adversity is past, either in the old or a new habitat, the population
184

INSECTS, SCIENCE, AND SOCIETY
needs to be an exploiter. To use the terminology of Whittaker, Levin, and Root (1973), a large proportion of the niche hypervolume is empty. The P-strategist will therefore strive to maximize λ, the net rate of increase. Southwood et al. (1974) show that the effective b, in the region of the equilibrium, is likely to be precipitously overcompensating. This will lead to overshooting, but, as P-strategists
1
habitats are unstable (X/H approaching unity), there is no evolutionary penalty for overexploitation.
Migration is a pathway of population change of particular significance to the P-strategist. It is found principally in those insects that are denizens of temporary habitats, providing the mechanisms for both the invasion of the ever-occurring new^ sites and for the evacuation of possibly over-exploited, doomed ones (Southwood 1962a and b; Sweet 1963; Johnson 1969; Dingle 1968, 1972, 1974). Kennedy (this volume) has, however, pointed out that the individual that is actually migrating is deferring its reproduction, and in this it is behaving like a Z-strategist. Thus the worst penalties of overexploiting the habitat, which follow from the P-strategists
1 basic features, are mitigated by individuals
temporarily adopting Z-type behavior (postponing reproduction) . This highlights the multifaceted nature of the r-K continuum.
The broad differences in population strategies proposed for P- and Z-selected species may be tested against the life-budget- ana lys is data in tables 1 and 2. It will be seen that both key-factor and predictive analyses indicate the great significance of the number of eggs laid, itself a reflection of the changes in adult numbers through migration, in most pests of arable crops. (The corroboration by predictive analysis of the key-factor findings suggests that the latter are not artifacts of large error terms.) The work on Aedes aegypti, which colonizes artificial water containers, showed a highly overcompensating competitive interaction between young larvae; every adult, of course, migrates from the habitat.
In the natural habitats, mortalities due to predators and parasites are more in evidence. These habitats differ in their permanence, and some insects (e.g., Dendrotimus, Cardiaspina) reach epidemic levels occasionally. The sample is not perhaps random; entomologists tend to study species that have outbreaks, rather than those that maintain a steady level.
An intermediate habitat is the scrub, broom (Sarothammus sooparius) , which lives for about ten to fifteen years and
185

T.R.E. SOUTHWOOD
thus for most univoltine species "f/H is in the region 0.ΙΟ. 07. Studies of a large number of species living on broom (Waloff 1968a and b) have revealed the rich variety of population strategies one might expect for a dynamic, moderately unstable habitat. Migration, often related to population density (but also leading to rapid colonization of new seedlings), is a frequent feature, and mortality due to natural enemies fluctuates greatly. Many species tend to become epidemic in about the sixth year of a broom scrubland, within one or two more seasons the bushes themselves start to decline.
There is good evidence of considerable interspecific competition (Waloff 1968a and b) ,· this indicates that "K evolutionary pressures" to suppress exploitative population growth until the bush is full sized will be balanced against the more extreme r-strategy of quick population growth as a method of seizing resources from competing species. Thus it is not surprising that the herbivorous insects tend to reach high densities somewhat before the bushes are full sized, but the mixture of endemic-epidemic levels seems particularly well suited to a species-habitat relation with intermediate values of Ύ/Η.
Another approach to the investigation of the role of habitat in the evolution of population parameters is to compare closely allied species. Landrahl and Root (1969) did this with two species of Oncopeltus; they found that population build-up was more rapid in a temperate than a tropical species. It must be emphasized that temperate habitats are not necessarily more unstable than tropical ones (e.g., a temperate oak woodland is more stable than a semiarid grassland of Africa); each habitat should be considered for each animal species against the Ύ/Η ratio criterion.
The Framework
The accumulating evidence from natural populations therefore supports the conclusion that a general representation of population dynamics may be obtained by arranging the variations of types of population growth-density relationships along a third axis, that of habitat stability. The extreme r- and Z-strategies (as shown by Southwood et al. 1974) represent the front and near boundaries of the landscape (fig. 9). The "natural enemies ravine" represents stable equilibrium points and their immediate domains of stability. It runs diagonally, but is absent at both boundaries to habitat stability.
186

INSECTS, SCIENCE, AND SOCIETY
D e m o g r a p h i c
Fig. 9. A synoptic view of the landscape of population dynamics with axes: population growth (^t+l/^t^ population density (Nth and habitat stability (X/n).
In unstable habitats (e.g., aphids in crops) natural enemies can stabilize growth only if they act early in population growth; otherwise their action is often inversely density-independent and involves essentially mopping up, as the now massive population moves across the "crash valley." In more stable habitats the endemic level will be relatively higher and the proportional increases, lower; compare a cereal pest, fruit fly, which increases 50-fold in one generation, with the eucalyptus stick insect, Didymuria, which increases 10-fold during outbreaks. The release face, on the "far side" of the ravine, will be steep if predator action is density dependent with b = 1; its "height" will depend on the distance (in terms of population density) between the stable equilibrium (which lies in the bottom of the ravine) and the release point (i.e., S and R of fig. 7). Beddington and Free (in press) have shown, by theoretical analysis, how stable coexistence in a predator-prey system is possible well below the prey carrying capacity.
For the species of unstable habitats, the "crash valley" is broad and widens beyond the limits of the carrying capacity; the population "runs off the board" here and goes back to the start; i.e., migrants colonize new habitats. Higher up, the valley becomes bounded as density-dependent moderation is less extremely overcompensating, and this may
187

T.R.E. SOUTHWOOD
be considered to represent the region where populations (e.g., Zeiraphera) oscillate. As we move, on this face, towards the stable end of the habitat axis, the edge of the landscape approximates the contour 1 of the population growth axis; that is, the dynamics of a .^-strategist near equilibrium (Southwood et al. 1974). The "extinction valley" becomes deeper with habitat stability; that is, X occurs at progressively higher population densities. It is "the end of the game" for populations that fall into it.
This relief map of the landscape, across which populations and species play the existential game of population dynamics, is somewhat allegorical in places and certainly oversimplified. Undoubtedly, some species have several stability points; that is, other ravines or valleys will be present. Perhaps another dimension will need to be added for the scale of the habitat—a problem considered by Boer (1968) , Brussard and Ehrlich (1970), and others. However, it would seem that stochastic events would be more dominant in smaller-scale habitats, effectively moving the dynamical behavior of the population from, for example, that represented in figure Sb to that in figure 8a. In the final analysis, figure 9 may appear simplistic, as ancient maps of the world do now, but in the meantime I hope it will assist us in our thinking. Clearly, stability and change are not alternative explanations, but interrelated phenomena in the game of existence.
ACKNOWLEDGMENTS
I am deeply indebted to M.P. Hassell for critically reading the manuscript and for much assistance in its development; other colleagues have discussed particular points and helped in various ways, notably G.R. Conway, P. Diamond, J.S. Kennedy, K. Majer, R.M. May, P* Reader, and N. Waloff. I am most grateful to them and others who have generously made "in press" papers and unpublished data available to me.
REFERENCES
Abu Yamen, I.K. 1960. Natural control in cabbage root fly populations and influence of chemicals. Meded. Landbouwhogesch. Wageningen 60:1-57.
188

INSECTS, SCIENCE, AND SOCIETY
189
Andrewartha, H.G., and L.C. Birch. 1 9 5 4 . The distribution and abundance of animals. University of Chicago Press, Chicago.
Auer, C. 1 9 6 8 . Erste Ergebnisse einfacher stochastischer Modelluntersuchungen uber die Ursachen der Populations-bewegung des grauen Larchenwicklers Zeiraphera diniana Gn. (= Z. griseana Hb.) im Oberengadin, 1 9 4 9 / 6 6 . z . Angew. Entomol. 6 2 : 2 0 2 - 3 5 .
Bakker, K. 1 9 6 4 . Backgrounds of controversies about population theories and their terminologies. Z. Angew. Entomol. 5 3 : 1 8 7 - 2 0 8 .
Baltensweiler, W. 1 9 6 8 . The cyclic population dynamics of the grey larch tortrix Zeiraphera griseana Hubner (= Semasia diniana Guenée)(Lepidoptera: Tortricidae), p. 8 8 - 9 7 . In T.R.E. Southwood [ed.]. Insect abundance. Roy. Entomol. Soc. London Symp. 4 . Blackwell Scientific Publ., Oxford.
. 1 9 7 1 . The relevance of changes in the composition of larch bud moth populations for the dynamics of its number, p. 2 0 8 - 1 9 . In P.J. den Boer and G.R. Gradwell [eds.], Dynamics of populations. Proc. Advan. Study Inst. Dyn. Numbers Pop., Oosterbeek, Netherlands, 1 9 7 0 . Pudoc, Wageningen.
Beddington, J., and C.A. Free. Age structure, density dependence and limit cycles in predator-prey interactions. J. Theor. Pop. Biol., in press.
Benson, J.F. 1 9 7 3 a . Population dynamics of cabbage root fly in Canada and England. J. Appl. Ecol. 1 0 : 4 3 7 - 4 6 .
. 1973b. Intraspecific competition in the population dynamics of Bracon hebetor Say (Hymenoptera: Braconidae). J. Anim. Ecol. 4 2 : 1 0 5 - 2 4 .
. 1 9 7 4 . Population dynamics of Bracon hebetor Say (Hymenoptera: Braconidae) and Ephestia cantella (Walker) (Lepidoptera: Phycitidae) in a laboratory ecosystem. J. Anim. Ecol. 4 3 : 7 1 - 8 6 .
Berryman, A.A. 1 9 7 3 . Population dynamics of the fir engraver, Scotytus ventralis (Coleoptera: Scolytidae). 1 . Analysis of population behaviour and survival from 1 9 6 4 - 1 9 7 1 . Can. Entomol. 1 0 5 : 1 4 6 5 - 8 8 .
Bess, H.A. 1 9 6 1 . Population ecology of the gypsy moth Porthetria dispar L. (Lepidoptera: Lymantridae). Conn. Exp. Sta. Bull. 6 4 6 .
Birch, L.C. 1 9 4 8 . The intrinsic rate of natural increase of an insect population. J. Anim. Ecol. 1 7 : 1 5 - 2 6 .
Birley, M.H. The assessment of density dependence from time series of animal populations. Unpublished ms.
Boer, P.J. den. 1 9 6 8 . Spreading of risk and stabilization of animal numbers. Acta Biotheor. 1 8 : 1 6 5 - 9 4 .

T.R.E. SOUTHWOOD
190
Broadhead, Ε., and A.J. Wapshere. 1966. Mesopsocus populations on larch in England—the distribution and dynamics of two closely-related coexisting species of Psoeoptera sharing the same food resource. Ecol. Monogr. 36:327-88.
Brussard, P.F., and P.R. Ehrlich. 1970. Contrasting population biology of two species of butterfly. Nature, London 227:91-92.
Burnett, T. 1967. Aspects of the interaction between a chalcid parasite and its aleurodid host. Can. J. Zool. 45: 539-78.
Campbell, R.W. 1967. The analysis of numerical change in gypsy moth populations. Forest Sci. Monogr. 15:1-33.
Chiang, H.C., and A.C. Hodson. 1959. Population fluctuations of the European corn borer Pyrausta nubilalis at Waseca, Minnesota, 1948 to 1957. Ann. Entomol. Soc. Amer. 52:710-24.
Clark, L.R. 1964. The population dynamics of Cavdiaspina albitextura (Psyllidae). Aust. J. Zool. 12:362-80.
Clark, L.R., P.W. Geier, R.D. Hughes, and R.F. Morris. 1967. The ecology of insect populations in theory and practice. Me thuen, London.
Conway, G.R. 1971. Pests of cocoa in Sabah and their control. Dep. Agr., Malaysia, Kuala Lumpur.
. 1973. Experience in insect pest modelling: a review of models, uses and future directions, p. 103-30. In P.W. Geier, L.R. Clark, D.J. Anderson, and H.A. Nix [eds.]. Insects : studies in population management. Ecol. Soc. Aust. Mem. 1, Canberra.
Conway, G.R., and G. Murdie. 1972. Population models as a basis for pest control, p. 195-213. In J.N.R. Jeffers [ed.]. Mathematical models in ecology, 12th Symp. Brit. Ecol. Soc. Blackwells, Oxford.
Conway, G.R., G.A. Norton, A.B.S. King, and N.J. Small. A systems approach to the control of the sugar cane froghop-per. In G.E. Dalton [ed.]. Agricultural systems. Applied Science, Barking, Essex. In press.
Crombie, A.C. 1945. On competition between different species of graminivorous insects. Proc. Roy. Soc. (B) 132:362-95.
. 1946. Further experiments on insect competition. Proc. Roy. Soc. (B) 133:76-109.
Dempster, J.P. 1971. A population study of the cinnabar moth, Tyria (Callimorpha) jaoobaeae L., p. 380-89. In P.J. den Boer and G.R. Gradwell [eds.]. Dynamics of populations. Proc. Advan. Study Inst. Dyn. Numbers Pop. Oosterbeek, Netherlands, 1970. Pudoc, Wageningen.
. Animal population ecology. Academic Press, London. In press.

INSECTS, SCIENCE, AND SOCIETY
Diamond, P. Stochastic stability of a host-parasite model. Maths. Biosci., in press.
Dingle, H. 1968. Life history and population consequences of density, photoperiod, and temperature in a migrant insect, the milkweed bug, Onaopeltus. Amer. Natur. 102:149-63.
. 1972. Migration and strategies of insects. Science 175:1327-35.
. 1974. The experimental analysis of migration and life history strategies in insects, p. 329-42. In L. Barton Browne [ed.]. Experimental analysis of insect behaviour. Springer, New York.
Duffey, E. 1968. Ecological studies on the large copper butterfly Lyoaena dispar Haw. batavus Obth. at Woodwalton Fen National Nature Reserve, Huntingdonshire. J. Appl. Ecol. 5:69-96.
Ehrlich, P.R., and L.E. Gilbert. 1973. Population structure and dynamics of the tropical butterfly Eeliconius ethilla. Biotropica 5:69-82.
Elsey, K.D., and R.L. Rabb. 1970. Analysis of the seasonal mortality of the cabbage looper in North Carolina. Ann. Entomol. Soc. Amer. 63:1597-1604.
Embree, D.G. 1965. The population dynamics of the winter moth in Nova Scotia 1954-1962. Mem. Entomol. Soc. Can. 46:1-57.
Entwistle, P.F., C.G. Johnson, and E. Dunn. 1959. New pests of cocoa (Theobroma cacao L.) in Ghana following applications of insecticides. Nature, London 184:2040.
Fransz, H.G. 1974. The functional response to prey density in an acarine system. Pudoc, Wageningen.
Gilbert, Ν., and A.P. Gutierrez. 1973. A plant-aphid-parasite relationship. J. Anim. Ecol. 42:323-40.
Gilbert, N., and R.D. Hughes. 1971. A model of an aphid population—three adventures. J. Anim. Ecol. 40:525-34.
Gutierrez, A.P., P.E. Havenstein, H.A. Nix, and P.A. Moore. 1974. The ecology of Aphis craccivora Koch, and subterranean clover stunt virus in South-East Australia. II. A model of cowpea aphid populations in temperate pastures. J. Appl. Ecol. 11:1-20.
Haldane, J.B.S. 1953. Animal populations and their regulation. New Biol. 15:9-24.
Harcourt, D.G. 1971. Population dynamics of Leptinotarsa decemlineata (Say) in Eastern Ontario. III. Major population processes. Can. Entomol. 103:1049-61.
Hassell, M.P. 1966. Evaluation of parasite or predator response. J. Anim. Ecol. 35:65-75.
. 1968. The behavioural response of a tachinid fly (Cyzenis albicans (Fall.)) to its host the winter moth
191

T.R.E. SOUTHWOOD
(Operophtera hrwnata (L.)). J. Anim. Ecol. 37:627-39. . 1971a. Mutual interference between searching insect
parasites. J. Anim. Ecol. 40:473-86. . 1971&. Parasite behaviour as a factor contributing
to the stability of insect host-parasite interactions, p. 366-79. In P.J. den Boer and G.R. Gradwell [eds.]. Dynamics of populations. Proc. Advan. Study Inst. Dyn. Numbers Pop., Oosterbeek, Netherlands, 1970. Pudoc, Wageningen.
. Density dependence in single-species populations. J. Anim. Ecol. 44, in press.
Hassell, M.P., and C.B. Huffaker. 1969. The appraisal of delayed and direct density dependence. Can. Entomol. 101: 353-61.
Hassell, M.P., and R.M. May. 1973. Stability in insect host-parasite models. J. Anim. Ecol. 42:693-719.
. 1974. Aggregation of predators and insect parasites and its effect on stability. J. Anim. Ecol. 43:567-87.
Hassell, M.P., and D.J. Rogers. 1972. Insect parasite responses in the development of population models. J. Anim. Ecol. 41:661-76.
Hassell, M.P., and G.C. Varley. 1969. New inductive population model for insect parasites and its bearing on biological control. Nature, London 223:1133-37.
Holling, C.S. 1959. The components of prédation as revealed by a study of small mammal prédation on the European pine sawfly. Can. Entomol. 91:293-320.
. 1961. Principles of insect prédation. Annu. Rev. Entomol. 6:163-82.
. 1964. The analysis of complex population processes. Can. Entomol. 96:335-47.
. 1966. The functional response of invertebrate predators to prey density. Mem. Entomol. Soc. Can. 48: 3-86.
. 1973. Resilience and stability of ecological systems. Annu. Rev. Ecol. Syst. 4:1-23.
Huffaker, C.B. 1958. Experimental studies on prédation: dispersion factors and predator-prey oscillations. Hilgardia 27:343-83.
Huffaker, C.B., C E . Kennett, and G.L. Finney. 1962. Biological control of olive scale Parlatoria oleae (Colvée), in California by imported Aphytis maoulioornis (Masi)(Hymenoptera: Aphelinidae). Hilgardia 32:541-636.
Huffaker, C.B., and C.E. Kennett. 1966. Studies of two parasites of olive scale Parlatoria oleae (Colvée). IV. Biological control of Parlatoria oleae (Colvée) through
192

INSECTS. SCIENCE, AND SOCIETY
the compensatory action of two introduced parasites. Hilgardia 37:283-335.
Huffaker, C.B., C E . Kennett, B. Matsumoto, and E.G. White. 1968. Some parameters in the role of enemies in the natural control of insect abundance, p. 59-75. In T.R.E. Southwood [ed.]. Insect abundance. Roy. Entomol. Soc. London Symp. 4. Blackwell Scientific Publ., Oxford.
Huffaker, C.B., and P.S. Messenger. 1964. The concept of significance of natural control, p. 74-117. In P. DeBach [ed.]. Biological control of insect pests and weeds. Chapman & Hall, London.
Hughes, R.D., and N. Gilbert. 1968. A model of an aphid population—a general statement. J. Anim. Ecol. 37:553-63.
Hughes, R.D., and B. Mitchell. 1960. The natural mortality of Eroischia brassicae (Bouché)(Dipt. Anthomyiidae): life tables and their interpretations. J. Anim. Ecol. 29: 359-74.
Ito, Y. 1961. Factors that affect the fluctuations of animal numbers, with special reference to insect outbreaks. Bull. Nat. Inst. Agr. Sci. Ser. C 13:57-89.
. 1972. On the methods for determining density-dependence by means of regression. Oecologia (Berlin) 10:347-72.
Ito, Y., and K. Miyashita. 1968. Biology of Hyphantria cunea Drury (Lepidoptera: Arctiidae) in Japan. V. Preliminary life tables and mortality data in urban areas. Res. Pop. Ecol. 10:177-209.
Ito, Y., A. Shibazaki, and 0. Iwahashi. 1969. Biology of Hyphantria cunea Drury (Lepidoptera: Arctiidae) in Japan. IX. Population dynamics. Res. Pop. Ecol. 11:211-28.
Iwao, S. 1971. Dynamics of numbers of a phytophagous lady-beetle, Epilachna vigintioctomacubata, living in patchily distributed habitats, p. 129-47. In P.J. den Boer and G.R. Gradwell [eds.]. Dynamics of populations. Proc. Advan. Study Inst. Dyn. Numbers Pop., Oosterbeek, Netherlands, 1970. Pudoc, Wageningen.
Johnson, C.G. 1969. Migration and dispersal of insects by flight. Methuen, London.
Kiritani, K. 1964. Natural control of populations of the southern green stink bug, Nezara viridula. Res. Pop. Ecol. 6:88-98.
Kiritani, K., N. Hokyo, T. Sasaba, and F. Nakasuji. 1970. Studies on population dynamics of the green rice leafhopper, Nephotettix cincticeps Uhler: regulatory mechanism of the population density. Res. Pop. Ecol. 12:137-53.
Klomp, Η. 1966a. The interrelations of some approaches to the
193
T.R.E. SOUTHWOOD
194
concept of density dependence in animal populations. Meded. Landbouwhogesch. Wageningen 66(3):1-11.
. 1966&. The dynamics of a field population of the pine looper, Bupalus piniarius L. (Lep. Geun.). Advan. Ecol. Res. 3:207-305.
. 1968. A seventeen year study of the abundance of the pine looper, Bupalus piniarius L. (Lepidoptera: Geometridae), p. 98-108. In T.R.E. Southwood [ed.]. Insect abundance. Roy. Entomol. Soc. London Symp. 4. Blackwell Scientific Publ., Oxford.
Kokubo, A. 1965. Population fluctuations and natural mortalities of the pine-moth, Dendrolimus speotabilis. Res. Pop. Ecol. 7:23-34.
Kuno, E. 1971. Sampling error as a misleading artifact in "key factor" analysis. Res. Pop. Ecol. 13:28-45.
Landrahl, J.T., and R.B. Root. 1969. Differences in the life tables of tropical and temperate milkweed bugs, genus Onoopeltus (Hemiptera: Lygaeidae). Ecology 50:734-37.
Laughlin, R. 1965. Capacity for increase: a useful population statistic. J. Anim. Ecol. 34:77-91.
Lawton, J.H. 1974. Book review: animal interactions. Nature, London 248:537.
Lewontin, R.C. 1969. The meaning of stability. Brookhaven Symp. Biol. 22:13-24.
MacArthur, R.H. 1960. On the relative abundance of species. Amer. Natur. 94:25-36.
Maelzer, D.A. 1970. The regression of log Nn+i on log Nn as a test of density dependence: an exercise with computer-constructed density-independent populations. Ecology 51: 810-22.
Massee, A.M. 1952. Fluctuations in orchard fauna. Rep. Int. Hort. Congr. 13:1-5.
May, R.M. 1973. Stability and complexity in model ecosystems. Princeton University Press, Princeton.
. 1974. Stability in ecosystems: some comments, p. 67. In Structure, functioning and management of ecosystems. Proc. 1st. Int. Congr. Ecol.
. Biological populations obeying difference equations: stable points, stable cycles, and chaos. J. Theor. Biol., in press.
May, R.M., G.R. Conway, M.P. Hassell, and T.R.E. Southwood. 1974. Time delays, density-dependence and single-species oscillations. J. Anim. Ecol. 43:747-70.
Maynard Smith, J. 1974. Models in ecology. University Press, Cambridge.
McNeill, S. 1973. The dynamics of a population of Leptoptema

INSECTS, SCIENCE, AND SOCIETY
195
dolabrata (Heteroptera: Miridae) in relation to its food resources. J. Anim. Ecol. 42:495-507.
Messenger, P.S. 1964. Use of life tables in a bioclimatic study of an experimental aphid-braconid wasp host-parasite system. Ecology 45:119-31.
Metcalfe, J.R. 1972. An analysis of the population dynamics of the Jamaican sugar-cane pest Saoaharosydne sacoharivore (Westw.)(Horn., Delphacidae). Bull. Entomol. Res. 62:73-85.
Milne, A. 1957. Theories of natural control of insect populations. Cold Spring Harbor Symp. Quant. Biol. 22: 253-71.
Morris, R.F. 1959. Single-factor analysis in population dynamics. Ecology 40:580-88.
. 1963. The dynamics of epidemic spruce budworm populations. Mem. Entomol. Soc. Can. 31:1-332.
. 1964. The value of historical data in population research, with particular reference to Hyphantria cunaa Drury. Can. Entomol. 96:356-68.
Mukerji, M.K. 1971. Major factors in survival of the immature stages of Hylemya bvassieae (Diptera: Anthomyiidae) on cabbage. Can. Entomol. 103:717-28.
Murdie, G., and M.P. Hassell. 1973. Food distribution, searching success and predator-prey models, p. 87-101. In M.S. Bartlett [ed.]. Mathematical theory of the dynamics of biological populations. Academic Press, London.
Murdoch, W.W. 1969. Switching in general predators: experiments on predator specificity and stability of prey populations. Ecol. Monogr. 39:335-54.
. 1971. The developmental response of predators to changes in prey density. Ecology 52:132-37.
Murdoch, W.W., and J.R. Marks. 1973. Prédation by coccinellid beetles: experiments on switching. Ecology 54:160-67.
Murdoch, W.W., and A. Oaten. Prédation and population stability. Advan. Ecol. Res., in press.
Neilson, M.M., and R.F. Morris. 1964. The regulation of European spruce sawfly numbers in the Maritime Provinces of Canada from 1937-1963. Can. Entomol. 96:773-84.
Nicholson, A.J. 1954. An outline of the dynamics of animal populations. Aust. J. Zool. 2:9-65.
Nicholson, A.J., and V.A. Bailey. 1935. The balance of animal populations. Part 1. Proc. Zool. Soc. London 1935:551-98.
Orians, G.H. 1974. Diversity, stability and maturity in natural ecosystems, p. 64-65. In Structure, functioning and management of ecosystems. Proc. 1st. Int. Congr. Ecol.
Park, T. 1948. Experimental studies on interspecies competition 1. Competition between populations of the flour

T.R.E. SOUTHWOOD
beetles Tribolivm eonfusvm Duval and Tribolivm castaneum Herbst. Ecol. Monogr. 18:265-308.
. 1954. Experimental studies on interspecific competition II. Temperature, humidity and competition in two species of Tribolivm. Physiol. Zool. 27:177-238.
Pickles, A. 1936. Observations on the early larval mortality of certain species of Diatraea (Lepid., Pyralidae) under cane field conditions in Trinidad. Trop. Agr. 13:155-60.
Podoler, H. 1974. Analysis of the life tables for a host and parasite (Plodia-N emeriti s ) ecosystem. J. Anim. Ecol. 43: 653-70.
Podoler, H.G., and D. Rogers. A new method for the identification of key factors from life table data. J. Anim. Ecol. 44, in press.
Potts, G.R. 1970. The effects of the use of herbicides in cereals on the feeding ecology of partridges. Proc. 10th Brit. Weed Contr. Conf. 1:299-302.
Potts, G.R., and G.P. Vickerman. 1974. Studies on the cereal ecosystem. Advan. Ecol. Res. 8:107-97.
Readshaw, J.L. 1965. A theory of phasmatid outbreak release. Aust. J. Zool. 13:475-90.
Richards, O.W. 1940. The biology of the small white butterfly (Pieris rapae) , with special reference to the factor controlling abundance. J. Anim. Ecol. 9:243-88.
. 1961. The theoretical and practical study of natural insect populations. Annu. Rev. Entomol. 6:147-62.
Richards, O.W., and T.R.E. Southwood. 1968. The abundance of insects: introduction, p. 1-7. In T.R.E. Southwood [ed.]. Insect abundance. Roy. Entomol. Soc. London Symp. 4. Blackwell Scientific Publ., Oxford.
Richards, O.W., and Ν. Waloff. 1954. Studies on the biology and population dynamics of British grasshoppers. Anti-Locust Bull. 17:1-184.
. 1961. A study of a natural population of Phytodeeta olivaeea (Forster)(Coleoptera, Chrysomeloidea). Phil. Trans. Roy. Soc. London 244:205-51.
Ripper, W.E. 1956. Effect of pesticides on balance of arthropod populations. Annu. Rev. Entomol. 1:403-48.
Rogers, D. 1972. Random search and insect population models. J. Anim. Ecol. 41:369-83.
Rogers, D.J., and M.P. Hassell. 1974. General models for insect parasite and predator searching behaviour: interference. J. Anim. Ecol. 43:239-53.
Royama, T. 1971. A comparative study of models for prédation and parasitism. Res. Pop. Ecol. Suppl. 1:1-90.
St. Amant, J.L.S. 1970. The detection of regulation in
196

INSECTS, SCIENCE, AND SOCIETY
197
animal populations. Ecology 51:823-28. Samson-Boshuizen, M., J.C. van Lenteren, and K. Bakker. 1974.
Success of parasitization of Pseudeuaoila bodhei Weld (Hym., Cynip.): a matter of experience. Neth. J. Zool. 24:67-85.
Shoemaker, C. 1973a. Optimization of agricultural pest management I : biological and mathematical background. Math. Biosci. 16:143-75.
. 1973&. Optimization of agricultural pest management II: formulation of a control model. Math. Biosci. 17: 357-65.
. 1973c. Optimization of agricultural pest management III: results and extensions of a model. Math. Biosci. 18: 1-22.
Smith, R.F. 1970. Pesticides: their use and limitations in pest management, p. 103-18. In R.L. Rabb and F.E. Guthrie [eds.]. Concepts of pest management. N.C. State University, Raleigh. ^
Solomon, M.E. 1949. The natural control of animal populations. J. Anim. Ecol. 18:1-35.
Southwood, T.R.E. 1960. The flight activity of Heteroptera. Trans. Roy. Entomol. Soc. London 112:173-220.
. 1962a. Migration of terrestrial arthropods in relation to habitat. Biol. Rev. 37:171-214.
. 1962&. Migration—an evolutionary necessity for denizens of temporary habitats. 11th Int. Kong. Entomol. 3:55-58.
. 1966. Ecological methods. Methuen & Co., London.
. 1967. The interpretation of population change. J. Anim. Ecol. 36:519-29.
. 1968. The abundance of animals. Inaug. Lect. Imp. Coll. Sci. Technol. 8:1-16.
Southwood, T.R.E., and W.F. Jepson. 1962. Studies on the populations of Osoinetla frit L. (Dipt. Chloropidae) in the oat crop. J. Anim. Ecol. 31:481-95.
Southwood, T.R.E., R.M. May, M.P. Hassell, and G.R. Conway. 1974. Ecological strategies and population parameters. Amer. Natur. 108:791-804.
Southwood, T.R.E., G. Murdie, M. Yasuno, R.J. Tonn, and P.M. Reader. 1972. Studies on the life budget of Aedes aegypti in Wat Samphaya, Bangkok, Thailand. Bull. World Health Organ. 46:211-26.
Spradbery, J.P. 1971. Seasonal changes in the population structure of wasp colonies (Hymenoptera: Vespidae). J. Anim. Ecol. 40:501-23.
. 1973. Wasps. Sidgwick & Jackson, London.

T.R.E. SOUTHWOO D
198
S t e e l e , J.H . 19 7 4 . Th e structur e o f mar i n e eco s y s t e m s . Black w e l l Scien t i f i c P u b l . , Oxf o r d .
Sto r t e n b e c k e r , C.W . 1 9 6 7 . Obs e r v a t i o n s o n th e popu l a t i o n dyna m i c s o f th e re d lo c u s t , Nomadacris sept em fas data ( S e r v i l l e ) , i n it s outbrea k ar e a s . Me d e d . In s t . To e g e p . B i o l . O n d e r z . Na t u r . 84 : 1 - 1 1 8 .
S w e e t , M . H . 19 6 3 . Th e biol o g y an d ecolog y o f th e Rhypa r o c h r o m i n a e o f Ne w Englan d (Heteroptera : L y g a e i d a e ) . Par t 1 . En t o m o l . A m e r . 43 : 1 - 1 2 4 .
Ta k a h a s h i , F . 1 9 6 4 . Repr o d u c t i o n curv e wi t h tw o equilib r i u m poi n t s : a consid e r a t i o n o n th e fluctuatio n o f insec t pop u l a t i o n . R e s . P o p . E c o l . 6:28-36 .
U t i d a , S . 19 5 0 . O n th e equil i b r i u m stat e o f th e interactin g popu l a t i o n o f a n insec t an d it s pa r a s i t e . Ecolo g y 31 : 1 6 5 -7 5 .
. 19 5 5 . Flu c t u a t i o n s i n th e interactin g pop u l a t i o n s o f hos t an d par a s i t e i n relat i o n t o th e bioti c pot e n t i a l o f th e ho s t . Ecol o g y 36 : 2 0 2 - 6 .
V a r l e y , G.C . 19 6 3 . Th e interpretatio n o f chang e an d stabilit y i n insec t po p u l a t i o n s . Pr o c . Roy . En t o m o l . S o c . Londo n (C ) 27 : 5 2 - 5 7 .
V a r l e y , G . C , an d G.R . Gr a d w e l l . 19 6 0 . Ke y factor s i n po p u l a tio n st u d i e s . J . Ani m . E c o l . 29 : 3 9 9 - 4 0 1 .
. 19 6 8 . Pop u l a t i o n mo d e l s fo r th e win t e r m o t h , p . 1 3 2 -4 2 . In T.R. E . Sout h w o o d [ e d . ] . Insec t ab u n d a n c e . Roy . En t o m o l . S o c . Lond o n Sy m p . 4 . Blac k w e l l Scient i f i c P u b l . , Oxf o r d .
. 19 7 0 . Rec e n t adva n c e s i n insec t pop u l a t i o n dy n a m i c s . An n u . Re v . En t o m o l . 1 5 : 1 - 2 4 .
V a r l e y , G . C , G.R . Gr a d w e l l , an d M . P . Ha s s e l l . 19 7 3 . Insec t pop u l a t i o n ecol o g y : a n anal y t i c a l app r o a c h . Bla c k w e l l Scientifi c P u b l . , Ox f o r d .
V o û t e , A . D . 19 4 6 . Regul a t i o n o f th e densit y o f th e ins e c t -p o p u l a t i o n s i n virg i n - f o r e s t s an d cultivate d w o o d s . A r c h . Né e r . Zo o l . 7:435-70 .
W a l k e r , I . 19 6 7 . Eff e c t o f popu l a t i o n densit y o n th e vi a b i l it y an d fecundit y i n Nasonia vitripennis . Ecolog y 4 8 : 294 - 3 0 1 .
Wa l o f f , Ν. 1968a. Studies on the insect fauna on Scotch Broom Sarothamnus sooparius (L.) Wimmer. Advan. Ecol. Res. 5:87-208.
. 19682?. A comparison of factors affecting different insect species on the same host plant, p. 76-87. In T.R.E. Southwood [ed.]. Insect abundance. Roy. Entomol. Soc. London Symp. 4.
Waloff, Z. 1966. The upsurges and recessions of the Desert

INSECTS, SCIENCE, AND SOCIETY
Locust plague: an historical survey. Anti-Locust Mem. 8.
Watmough, R.H. 1968. Population studies on two species of Psyllidae (Homoptera, Sternorhyncha) on broom (Sarothamnus sooparius (L.) Wimmer). J. Anim. Ecol. 32:283-314.
Watt, K.E.F. 1959. A mathematical model for the effect of densities of attacked and attacking species and the number attacked. Can. Entomol. 91:129-44.
. 1963a. Mathematical population models for five agricultural crops. Mem. Entomol. Soc. Canada 32:84-91.
. 196 32?. Dynamic programming, "look ahead programming", and the strategy of insect pest control. Can. Entomol. 95: 525-36.
. 1969. A comparative study on the meaning of stability in five biological systems : insect and fur beaver populations, influenza. Thai haemorrhagic fever and plague. Brookhaven Symp. Biol. 22:142-50.
Way, M.J. 1968. Intra-specific mechanisms with special reference to aphid populations, p. 18-36. In T.R.E. Southwood [ed.]. Insect abundance. Roy. Entomol. Soc. London Symp. 4.
. 1973. Objectives, methods and scope of integrated control, p. 138-152. In P.W. Geier, L.R. Clark, D.J. Anderson, and H.A. Nix [eds.]. Insects: studies in population management. Ecol. Soc. Aust. (Mem. 1) Canberra.
Whittaker, R.H. 1974. "Stability" in plant communities, p. 68. In Structure, functioning and management of ecosystems. Proc. 1st Int. Congr. Ecol.
Whittaker, R.H., S.A. Levin, and R.B. Root. 1973. Niche, habitat and ecotope. Amer. Natur. 107:321-38.
Williamson, M. 1972. The analysis of biological populations. Edward Arnold, London.
Young, A.M., and A. Muyshondt. 1972. Biology of Morpho polyphemus (Lepidoptera: Morphidae) in El Salvador. J. N.Y. Entomol. Soc. 80:18-42.
199