Embed Size (px)
Citation preview
Inside Brazil: The Leading Auto
Manufacturers and Suppliers
Augusto Amorim
© 2012 R. L. Polk & Co. All rights reserved. 2
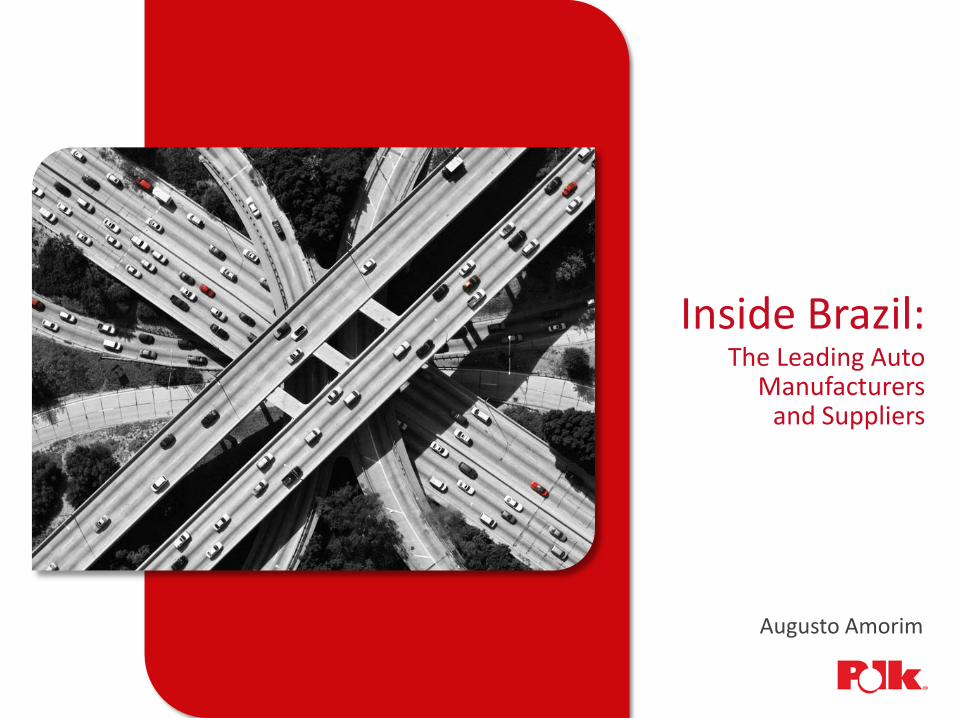
Brazil Beyond Soccer and Carnival
World Soccer Cup winner five times
World’s 6th largest light vehicle producer
World’s most popular Carnival
World’s 4th largest light vehicle market
© 2012 R. L. Polk & Co. All rights reserved. 3
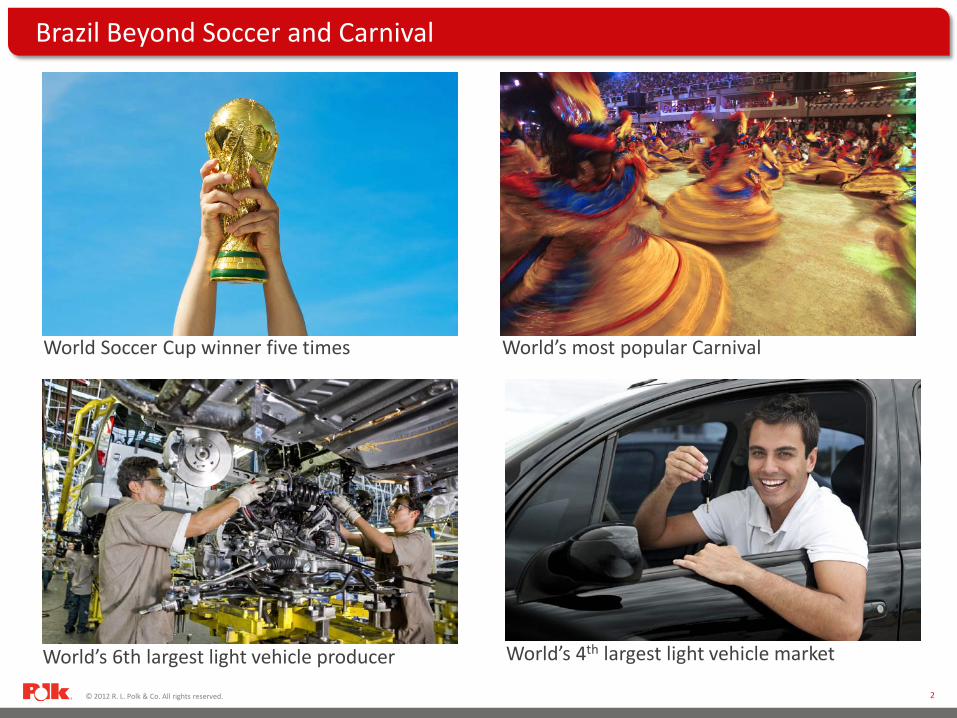
Brazil to Remain Larger than Europe
0
1,000,000
2,000,000
3,000,000
4,000,000
5,000,000
6,000,000
Brazil France Germany United Kingdom Italy Spain Source: Polk
© 2012 R. L. Polk & Co. All rights reserved. 4
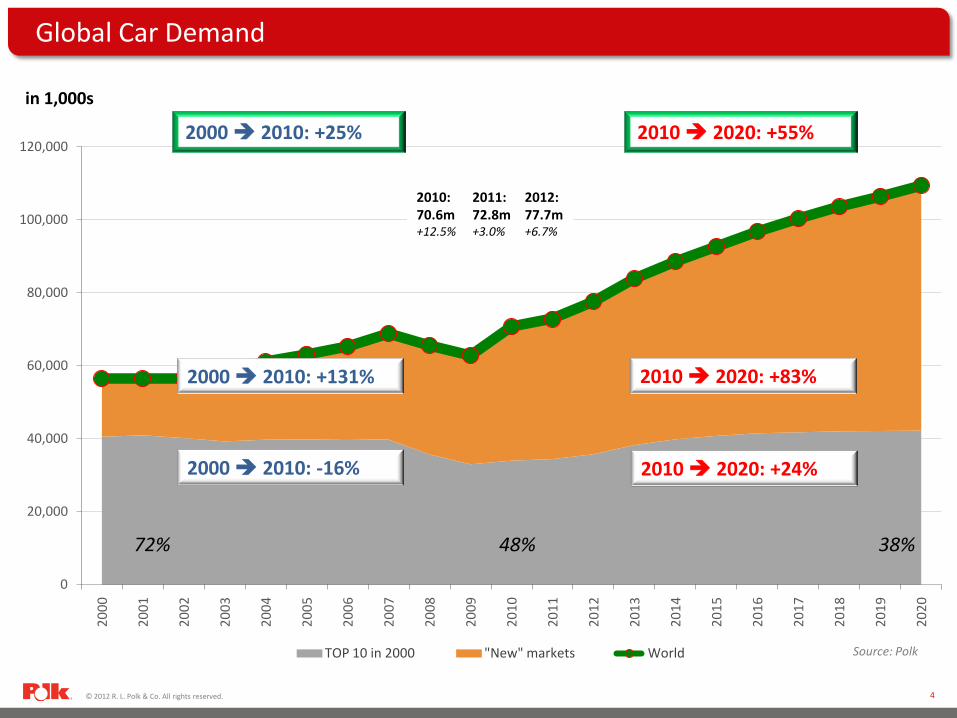
Global Car Demand
0
20,000
40,000
60,000
80,000
100,000
120,000
2000
2001
2002
2003
2004
2005
2006
2007
2008
2009
2010
2011
2012
2013
2014
2015
2016
2017
2018
2019
2020
TOP 10 in 2000 "New" markets World
2000 2010: +25% 2010 2020: +55%
in 1,000s
72% 48% 38%
2000 2010: +131% 2010 2020: +83%
2000 2010: -16% 2010 2020: +24%
2010: 70.6m +12.5%
2011: 72.8m +3.0%
2012: 77.7m +6.7%
Source: Polk
© 2012 R. L. Polk & Co. All rights reserved. 5
0
10
20
30
40
50
60
70
0 5,000 10,000 15,000 20,000 25,000 30,000 35,000 40,000 45,000 50,000
BRAZIL
CHINA
FRANCE
GERMANY
INDIA
ITALY
JAPAN
RUSSIA
UK
USA
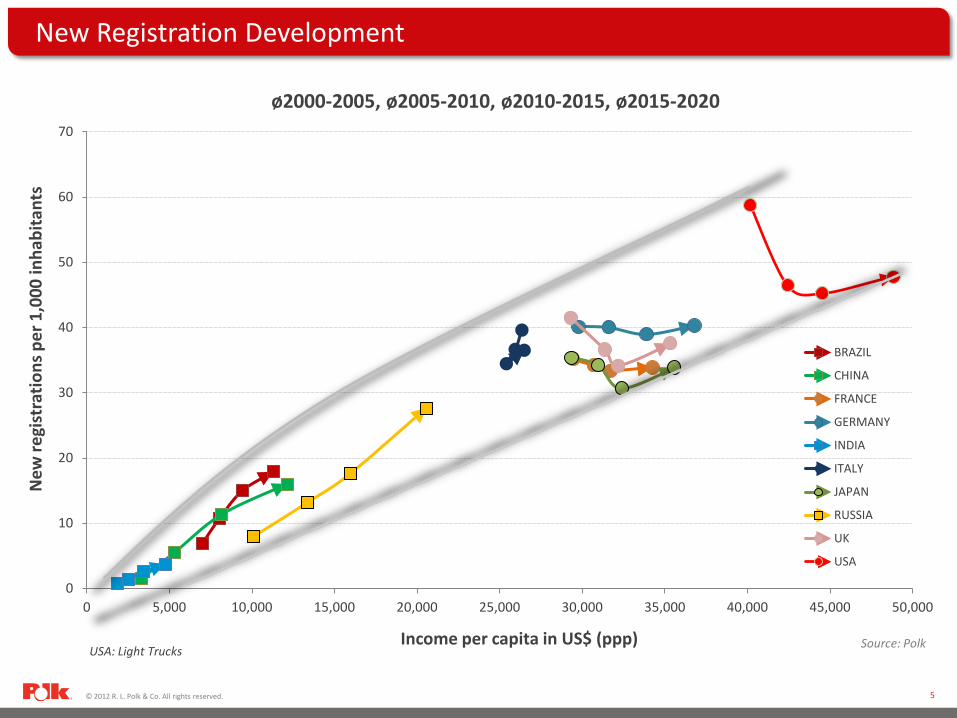
ø2000-2005, ø2005-2010, ø2010-2015, ø2015-2020
New Registration Development
USA: Light Trucks
New
regi
stra
tions
per
1,0
00 in
habi
tant
s
Income per capita in US$ (ppp) Source: Polk
© 2012 R. L. Polk & Co. All rights reserved. 6
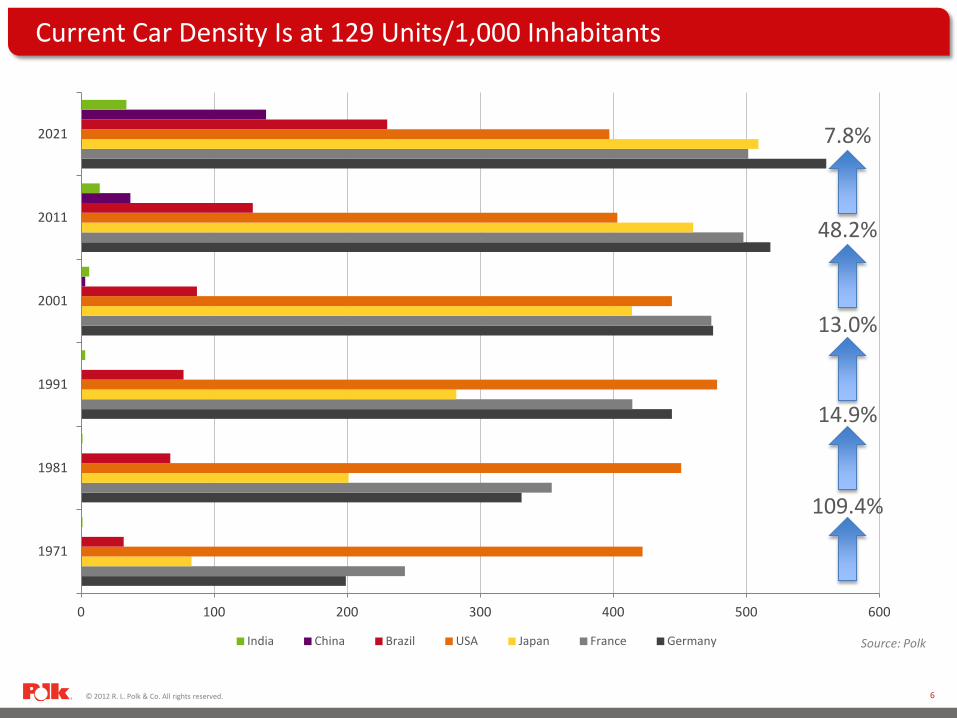
Current Car Density Is at 129 Units/1,000 Inhabitants
0 100 200 300 400 500 600
1971
1981
1991
2001
2011
2021
India China Brazil USA Japan France Germany
109.4%
13.0%
48.2%
14.9%
7.8%
Source: Polk
© 2012 R. L. Polk & Co. All rights reserved. 7
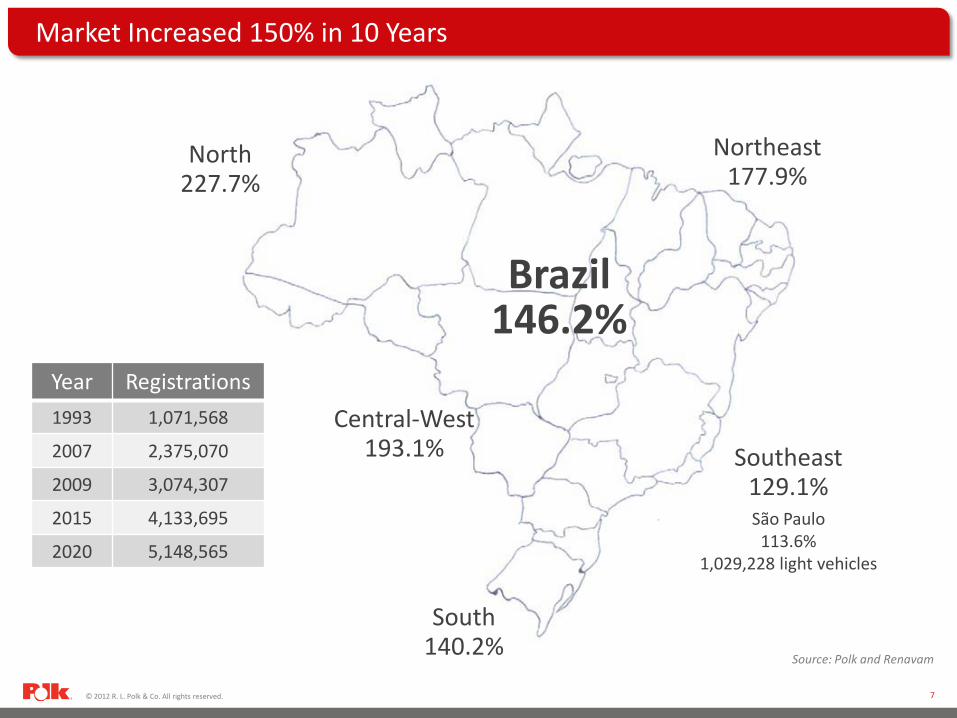
Market Increased 150% in 10 Years
Brazil 146.2%
Northeast 177.9%
South 140.2%
Central-West 193.1%
North 227.7%
Southeast 129.1% São Paulo
113.6% 1,029,228 light vehicles
Year Registrations 1993 1,071,568
2007 2,375,070
2009 3,074,307
2015 4,133,695
2020 5,148,565
Source: Polk and Renavam
© 2012 R. L. Polk & Co. All rights reserved. 8
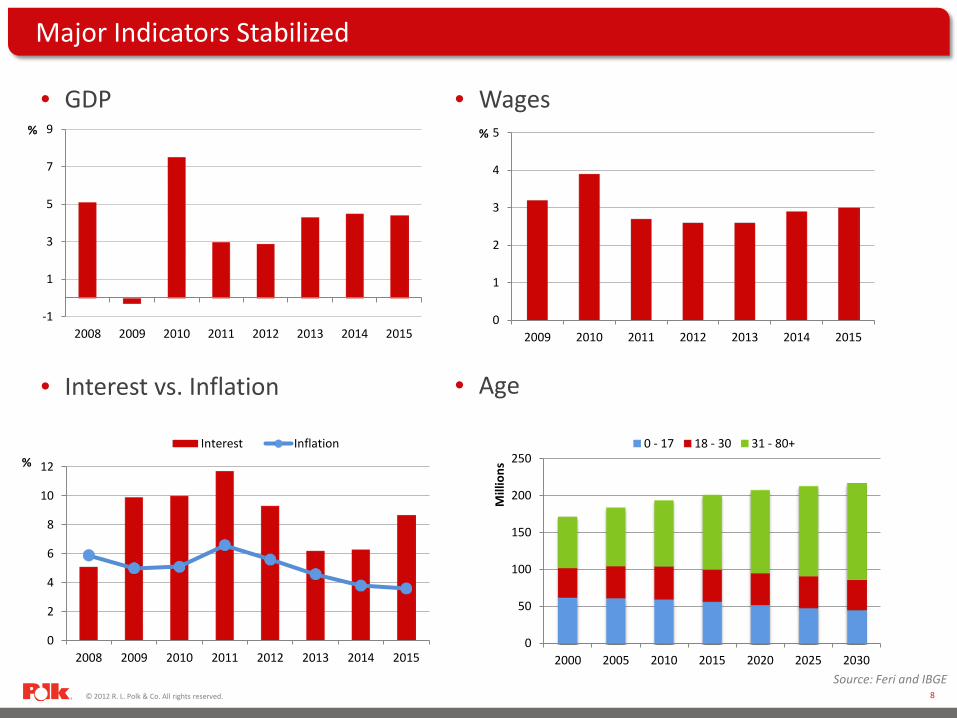
Major Indicators Stabilized
• GDP
• Interest vs. Inflation
• Wages
• Age
-1
1
3
5
7
9
2008 2009 2010 2011 2012 2013 2014 2015
0
2
4
6
8
10
12
2008 2009 2010 2011 2012 2013 2014 2015
Interest Inflation
0
1
2
3
4
5
2009 2010 2011 2012 2013 2014 2015
0
50
100
150
200
250
2000 2005 2010 2015 2020 2025 2030
Mill
ions
0 - 17 18 - 30 31 - 80+
%
%
%
Source: Feri and IBGE
© 2012 R. L. Polk & Co. All rights reserved. 9
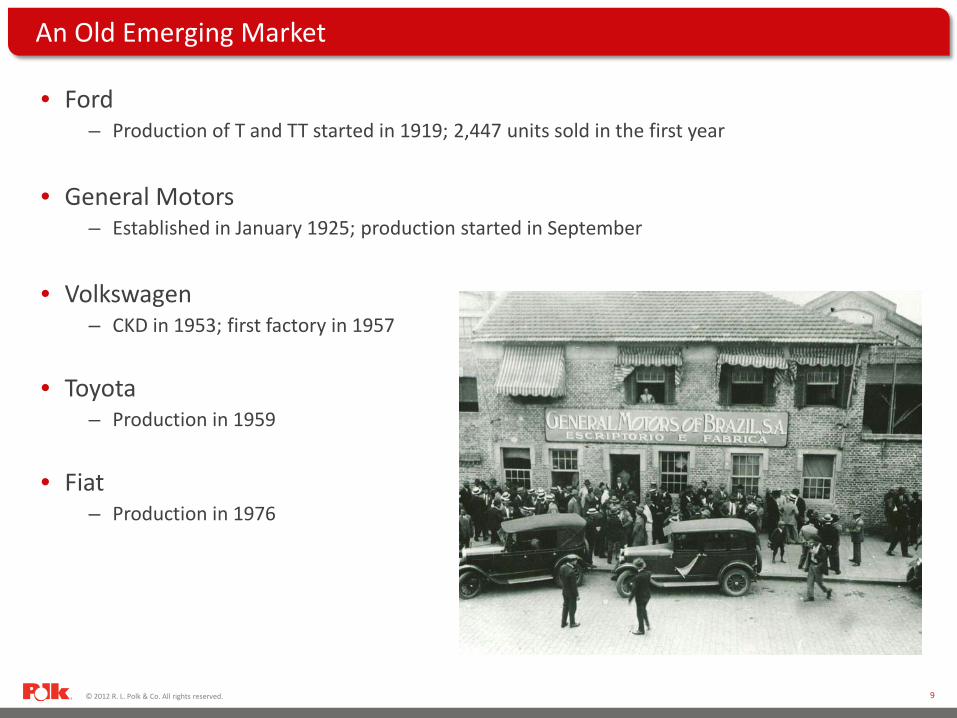
An Old Emerging Market
• Ford – Production of T and TT started in 1919; 2,447 units sold in the first year
• General Motors
– Established in January 1925; production started in September
• Volkswagen – CKD in 1953; first factory in 1957
• Toyota – Production in 1959
• Fiat
– Production in 1976
© 2012 R. L. Polk & Co. All rights reserved. 10
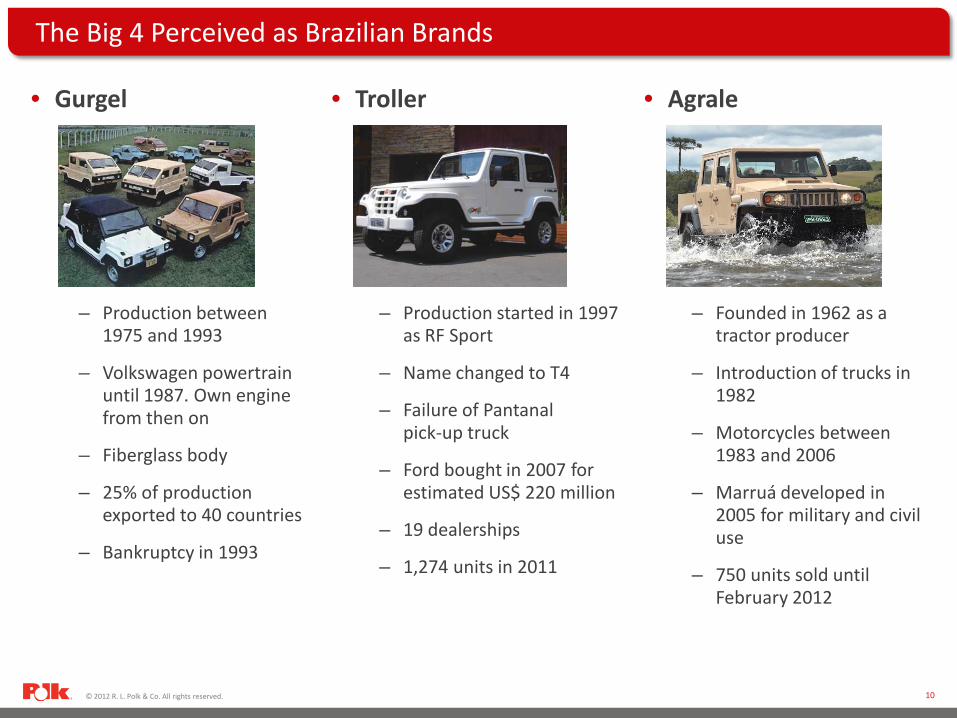
The Big 4 Perceived as Brazilian Brands
• Gurgel
– Production between 1975 and 1993
– Volkswagen powertrain until 1987. Own engine from then on
– Fiberglass body
– 25% of production exported to 40 countries
– Bankruptcy in 1993
• Troller
– Production started in 1997 as RF Sport
– Name changed to T4
– Failure of Pantanal pick-up truck
– Ford bought in 2007 for estimated US$ 220 million
– 19 dealerships
– 1,274 units in 2011
• Agrale
– Founded in 1962 as a tractor producer
– Introduction of trucks in 1982
– Motorcycles between 1983 and 2006
– Marruá developed in 2005 for military and civil use
– 750 units sold until February 2012
© 2012 R. L. Polk & Co. All rights reserved. 11
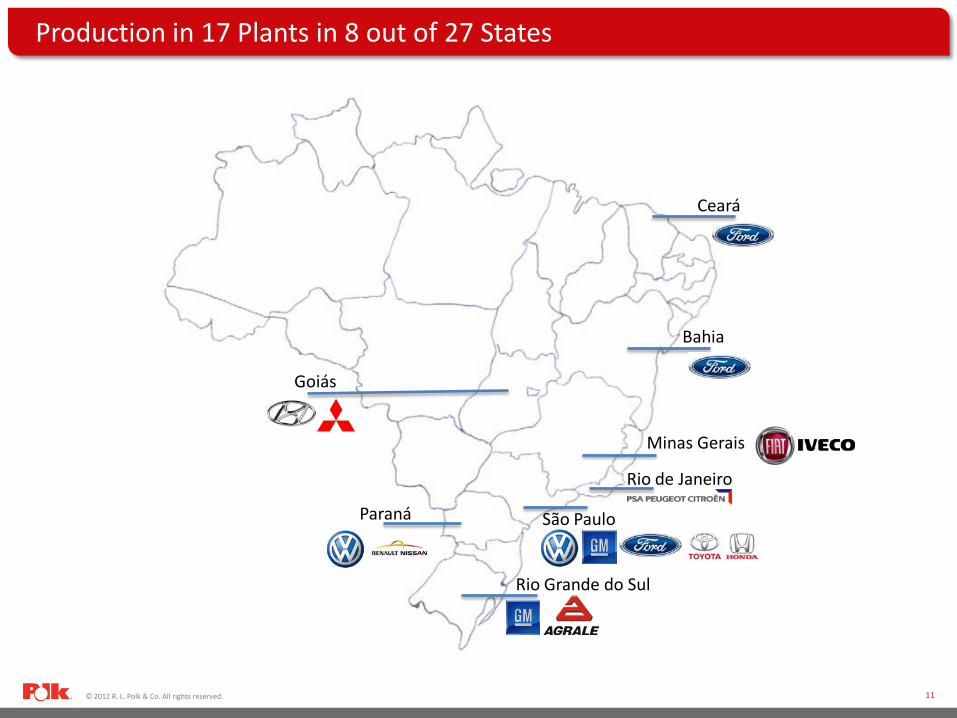
São Paulo
Production in 17 Plants in 8 out of 27 States
Bahia
Rio Grande do Sul
Paraná
Goiás
Minas Gerais
Rio de Janeiro
Ceará
© 2012 R. L. Polk & Co. All rights reserved. 12
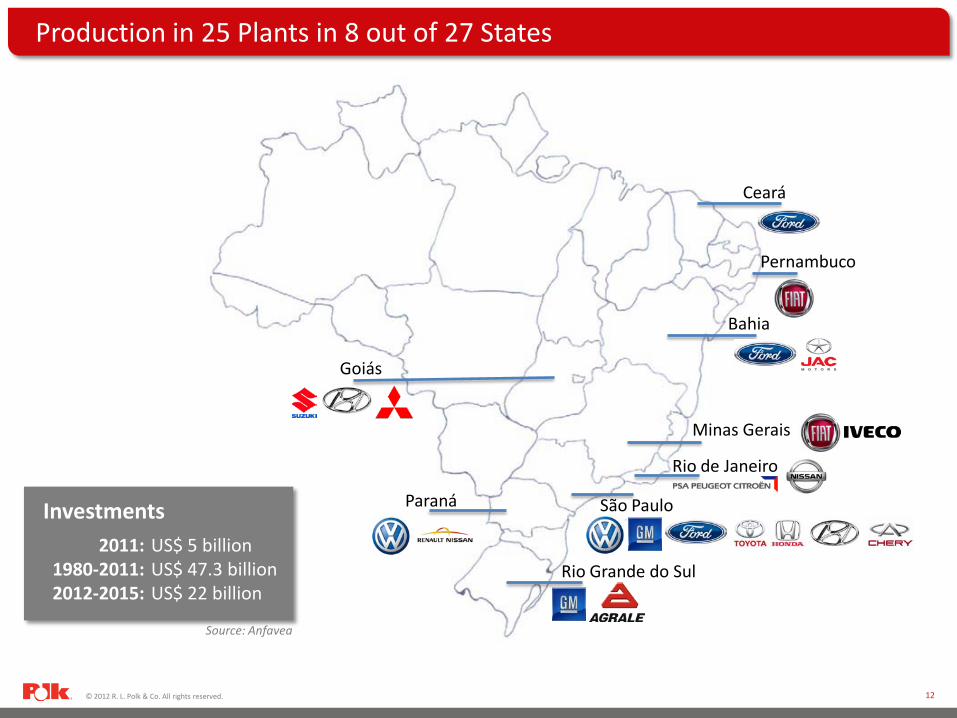
Production in 25 Plants in 8 out of 27 States
Bahia
Rio Grande do Sul
Paraná
Goiás
Minas Gerais
Rio de Janeiro
São Paulo
Pernambuco
Source: Anfavea
Ceará
Investments 2011: US$ 5 billion 1980-2011: US$ 47.3 billion 2012-2015: US$ 22 billion
© 2012 R. L. Polk & Co. All rights reserved. 13
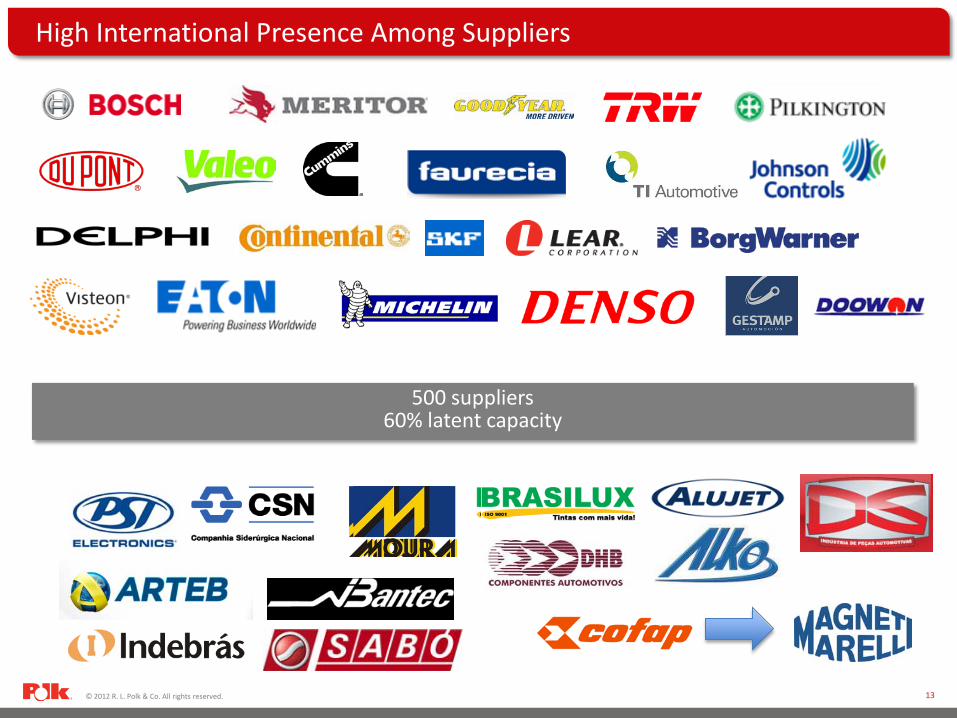
High International Presence Among Suppliers
500 suppliers 60% latent capacity
© 2012 R. L. Polk & Co. All rights reserved. 14
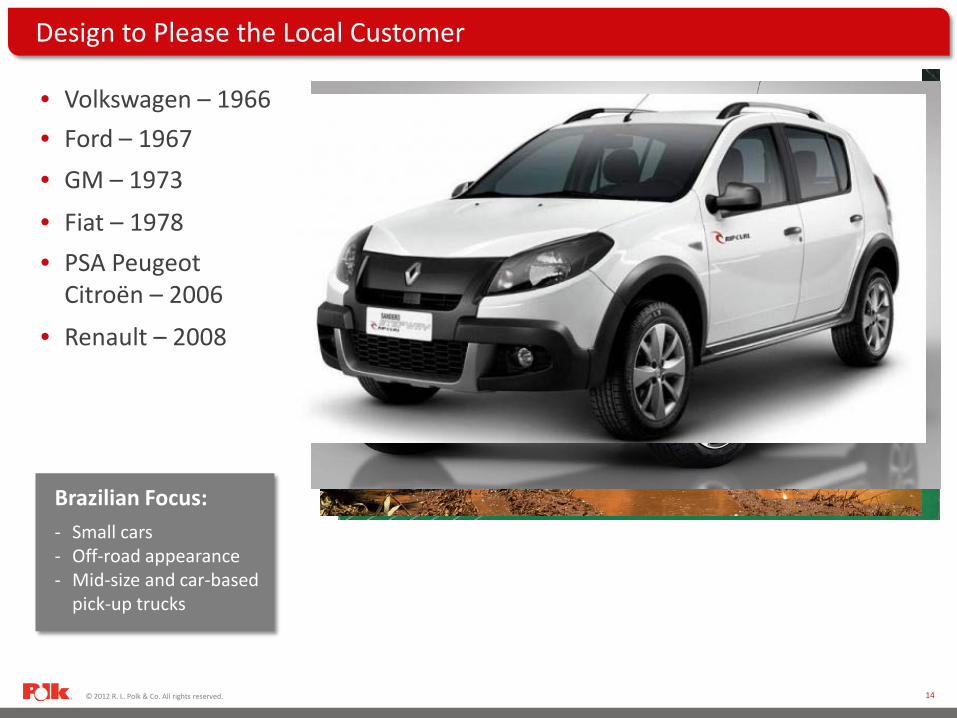
Design to Please the Local Customer
• Volkswagen – 1966 • Ford – 1967 • GM – 1973
• Fiat – 1978
• Renault – 2008
• PSA Peugeot Citroën – 2006
Brazilian Focus: - Small cars - Off-road appearance - Mid-size and car-based
pick-up trucks
© 2012 R. L. Polk & Co. All rights reserved. 15
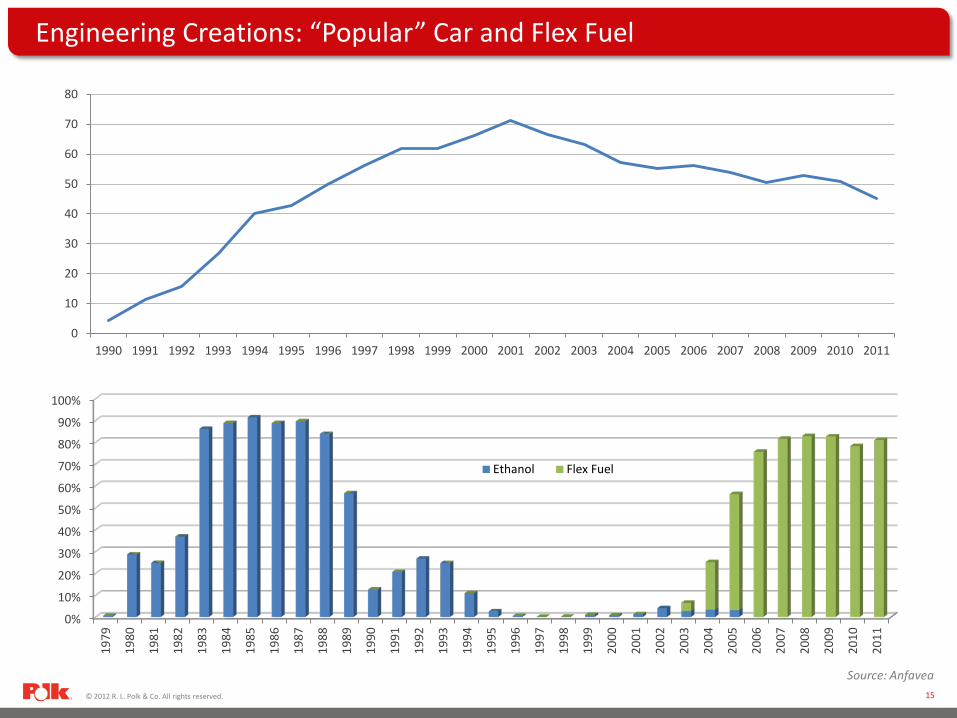
Engineering Creations: “Popular” Car and Flex Fuel
0%
10%
20%
30%
40%
50%
60%
70%
80%
90%
100%
1979
1980
1981
1982
1983
1984
1985
1986
1987
1988
1989
1990
1991
1992
1993
1994
1995
1996
1997
1998
1999
2000
2001
2002
2003
2004
2005
2006
2007
2008
2009
2010
2011
Ethanol Flex Fuel
0
10
20
30
40
50
60
70
80
1990 1991 1992 1993 1994 1995 1996 1997 1998 1999 2000 2001 2002 2003 2004 2005 2006 2007 2008 2009 2010 2011
Source: Anfavea
© 2012 R. L. Polk & Co. All rights reserved. 16
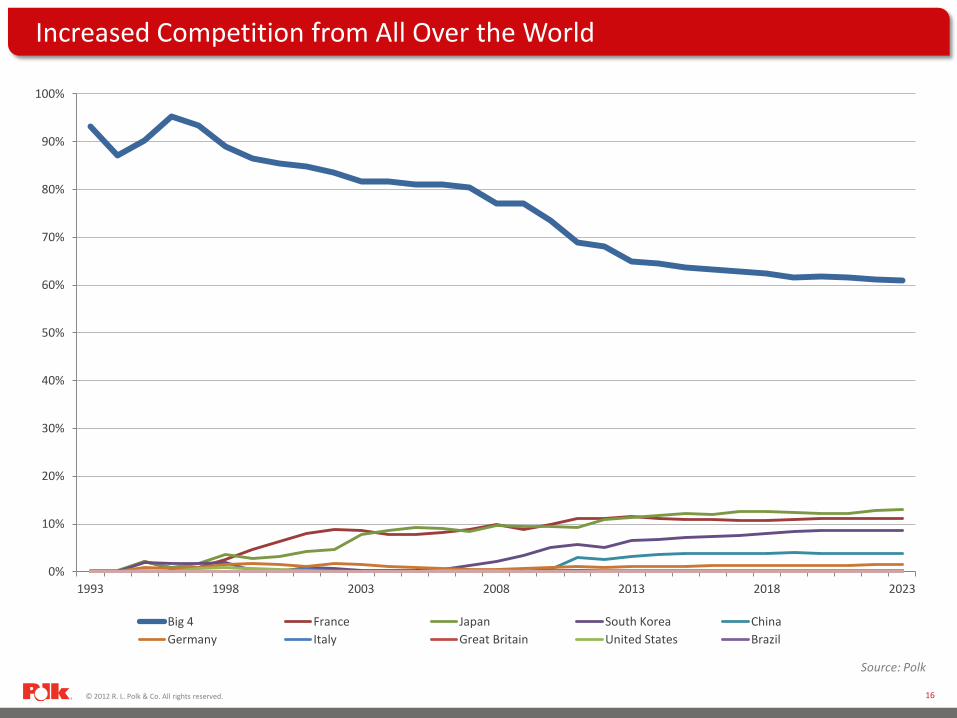
Increased Competition from All Over the World
0%
10%
20%
30%
40%
50%
60%
70%
80%
90%
100%
1993 1998 2003 2008 2013 2018 2023
Big 4 France Japan South Korea China Germany Italy Great Britain United States Brazil
Source: Polk

© 2012 R. L. Polk & Co. All rights reserved. 17
0
5
10
15
20
25
Fiat VW Chevrolet Ford Renault
2011 2012 2013
LV: Top 5 Makes Have 75% of the Market
Source: Polk
22.5% 20.2% 16.8% 8.5% 6.2%
© 2012 R. L. Polk & Co. All rights reserved. 18
-
5
10
15
20
25
30
35
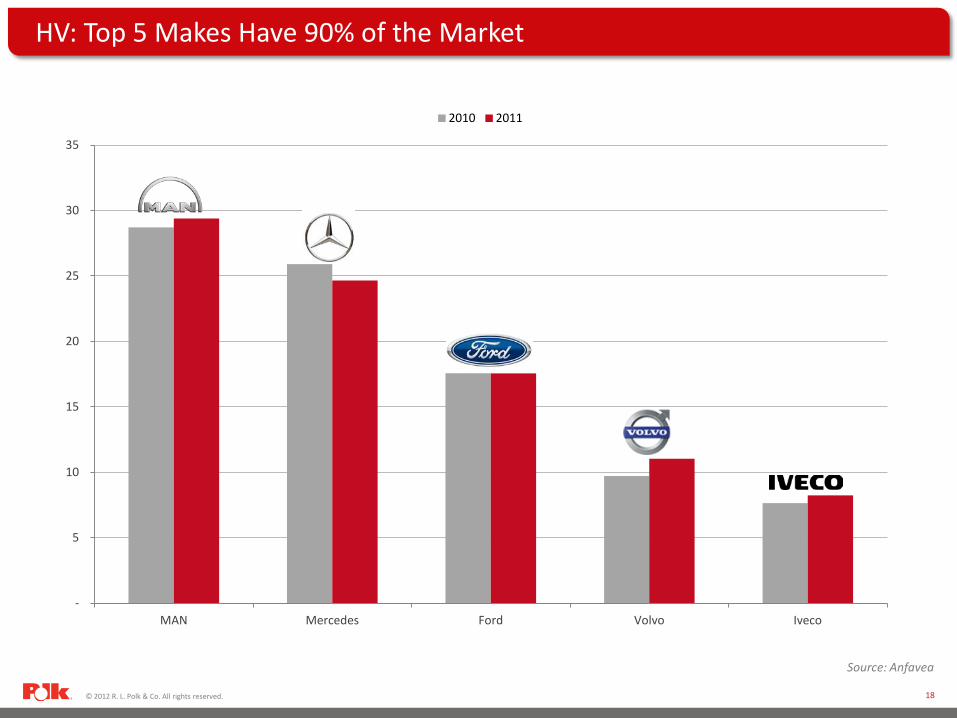
MAN Mercedes Ford Volvo Iveco
2010 2011
HV: Top 5 Makes Have 90% of the Market
Source: Anfavea
© 2012 R. L. Polk & Co. All rights reserved. 19
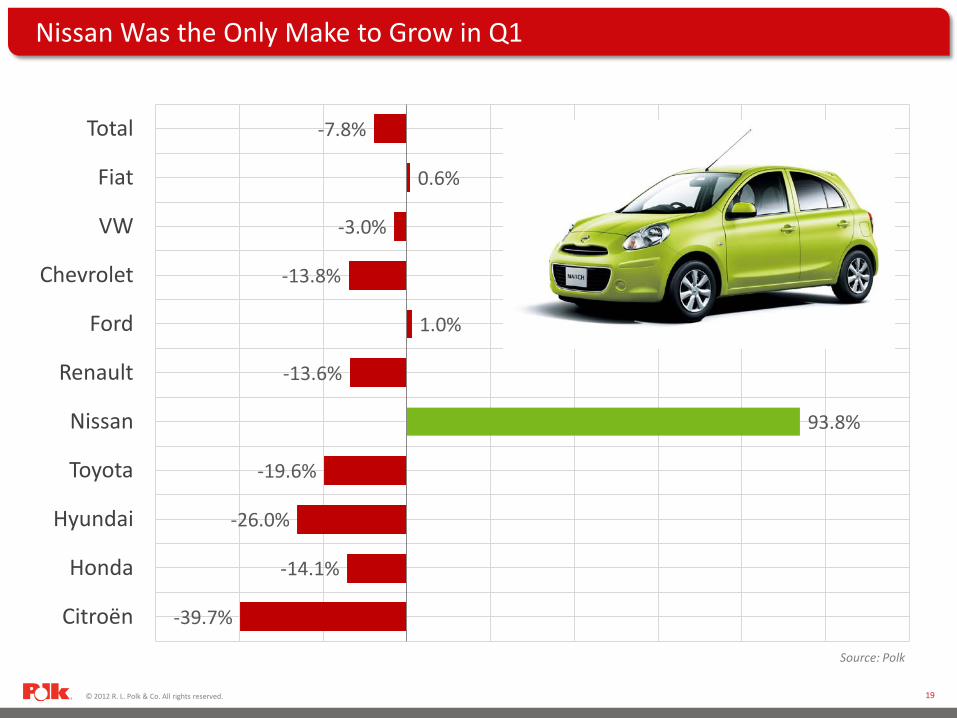
Nissan Was the Only Make to Grow in Q1
-7.8%
0.6%
-3.0%
-13.8%
1.0%
-13.6%
93.8%
-19.6%
-26.0%
-14.1%
-39.7%
Total
Fiat
VW
Chevrolet
Ford
Renault
Nissan
Toyota
Hyundai
Honda
Citroën
Source: Polk
© 2012 R. L. Polk & Co. All rights reserved. 20
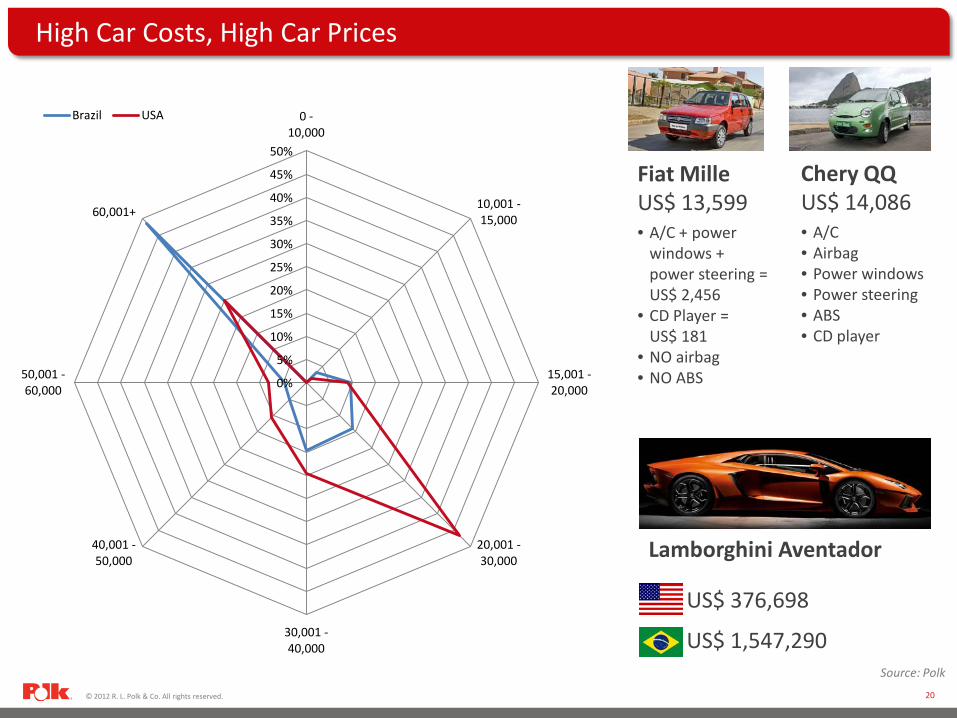
High Car Costs, High Car Prices
Fiat Mille US$ 13,599 • A/C + power
windows + power steering = US$ 2,456
• CD Player = US$ 181
• NO airbag • NO ABS
Chery QQ US$ 14,086 • A/C • Airbag • Power windows • Power steering • ABS • CD player
US$ 376,698
US$ 1,547,290
Lamborghini Aventador
0%
5%
10%
15%
20%
25%
30%
35%
40%
45%
50%
0 - 10,000
10,001 - 15,000
15,001 - 20,000
20,001 - 30,000
30,001 - 40,000
40,001 - 50,000
50,001 - 60,000
60,001+
Brazil USA
Source: Polk
© 2012 R. L. Polk & Co. All rights reserved. 21
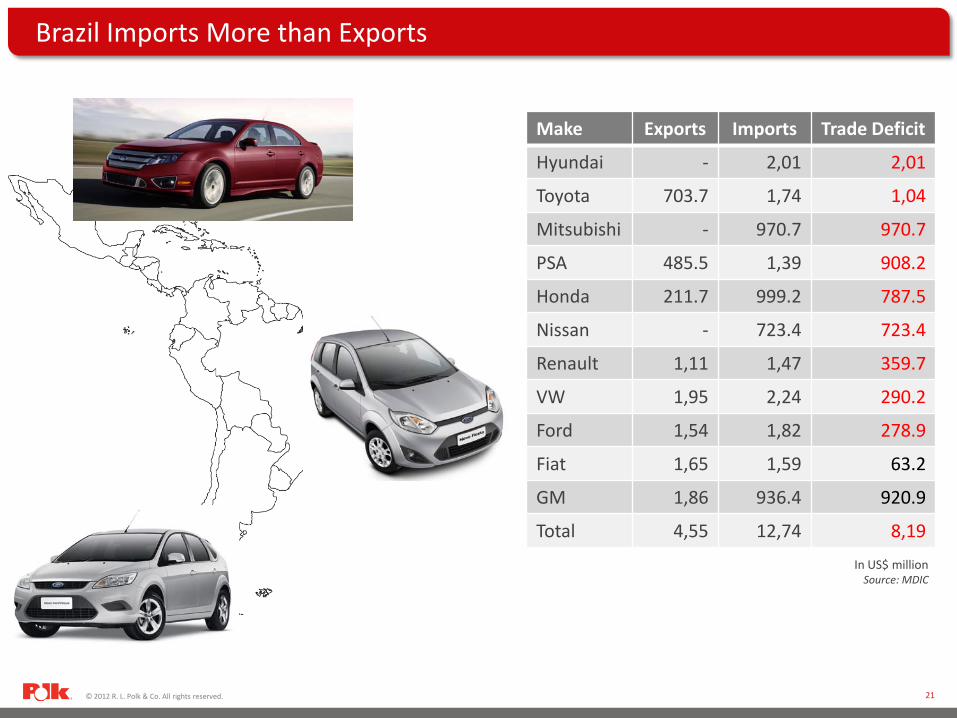
Brazil Imports More than Exports
Make Exports Imports Trade Deficit
Hyundai - 2,01 2,01
Toyota 703.7 1,74 1,04
Mitsubishi - 970.7 970.7
PSA 485.5 1,39 908.2
Honda 211.7 999.2 787.5
Nissan - 723.4 723.4
Renault 1,11 1,47 359.7
VW 1,95 2,24 290.2
Ford 1,54 1,82 278.9
Fiat 1,65 1,59 63.2
GM 1,86 936.4 920.9
Total 4,55 12,74 8,19
In US$ million Source: MDIC
© 2012 R. L. Polk & Co. All rights reserved. 22
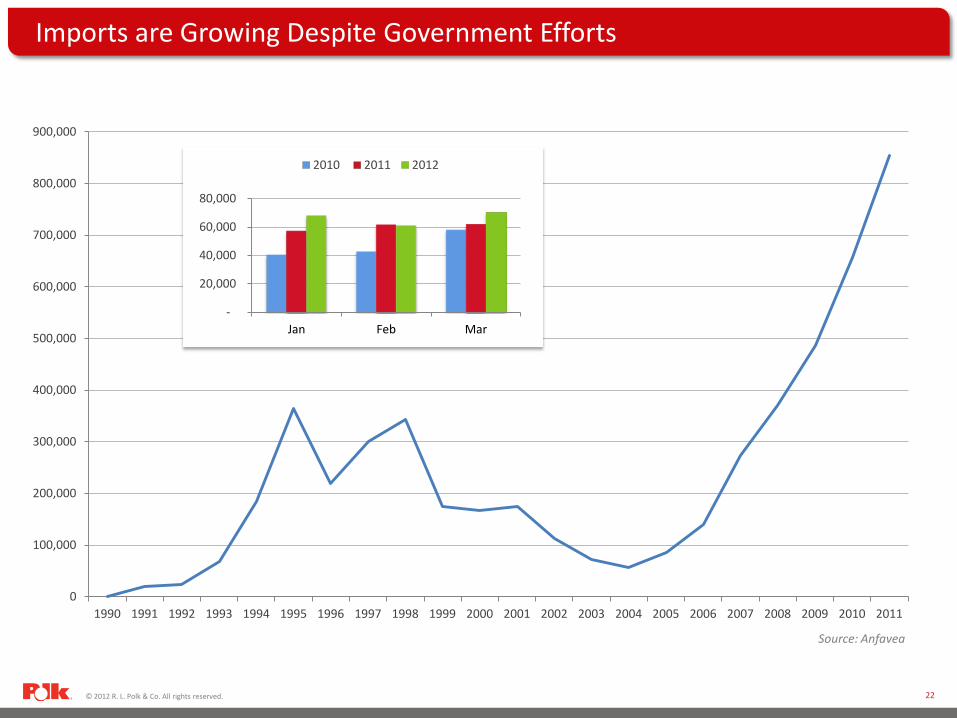
Imports are Growing Despite Government Efforts
0
100,000
200,000
300,000
400,000
500,000
600,000
700,000
800,000
900,000
1990 1991 1992 1993 1994 1995 1996 1997 1998 1999 2000 2001 2002 2003 2004 2005 2006 2007 2008 2009 2010 2011
-
20,000
40,000
60,000
80,000
Jan Feb Mar
2010 2011 2012
Source: Anfavea
© 2012 R. L. Polk & Co. All rights reserved. 23
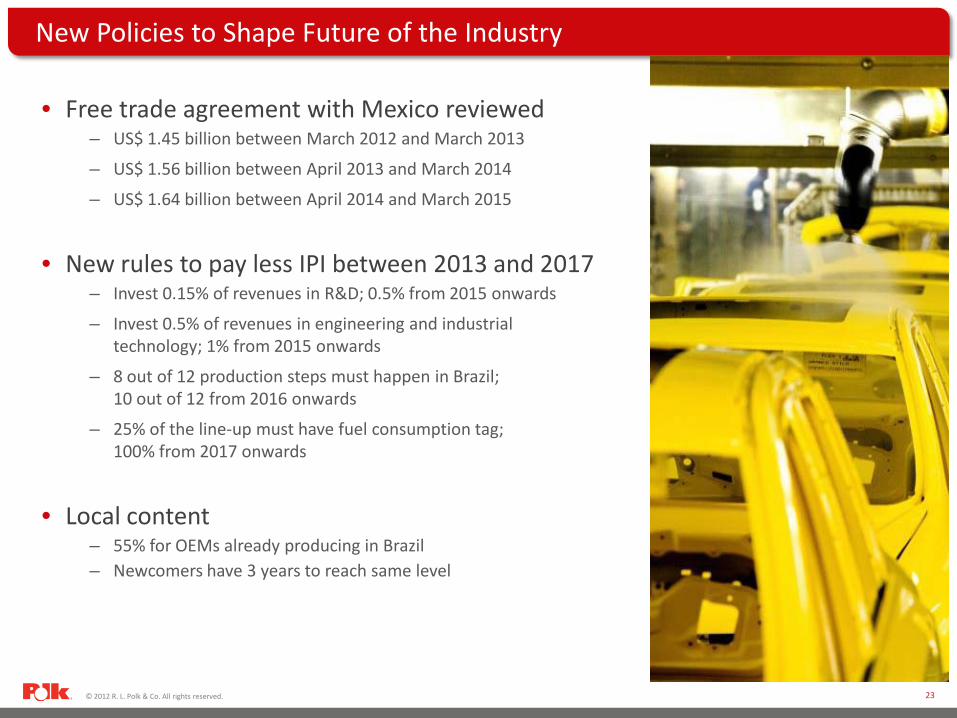
New Policies to Shape Future of the Industry
• Free trade agreement with Mexico reviewed – US$ 1.45 billion between March 2012 and March 2013
– US$ 1.56 billion between April 2013 and March 2014
– US$ 1.64 billion between April 2014 and March 2015
• New rules to pay less IPI between 2013 and 2017
– Invest 0.15% of revenues in R&D; 0.5% from 2015 onwards
– Invest 0.5% of revenues in engineering and industrial technology; 1% from 2015 onwards
– 8 out of 12 production steps must happen in Brazil; 10 out of 12 from 2016 onwards
– 25% of the line-up must have fuel consumption tag; 100% from 2017 onwards
• Local content
– 55% for OEMs already producing in Brazil – Newcomers have 3 years to reach same level
© 2012 R. L. Polk & Co. All rights reserved. 24
Thank you!
Augusto Amorim Lead Analyst – South America Forecasting
248.728.7436 [email protected]
For more information please visit:
www.polk.com/forecast
Any use of this material including reproduction, modification, distribution or republication without the prior written consent of R. L. Polk & Co. is strictly prohibited.