Embed Size (px)
Citation preview
Inside Dropbox:Understanding Personal Cloud Storage Services
Idilio DragoUniversity of Twente
Marco MelliaPolitecnico di Torino
Maurizio M. MunafòPolitecnico di Torino
Anna SperottoUniversity of Twente
Ramin SadreUniversity of Twente
Aiko PrasUniversity of Twente
ABSTRACT
Personal cloud storage services are gaining popularity. Witha rush of providers to enter the market and an increasing of-fer of cheap storage space, it is to be expected that cloudstorage will soon generate a high amount of Internet traffic.Very little is known about the architecture and the perfor-mance of such systems, and the workload they have to face.This understanding is essential for designing efficient cloudstorage systems and predicting their impact on the network.This paper presents a characterization of Dropbox, the
leading solution in personal cloud storage in our datasets.By means of passive measurements, we analyze data fromfour vantage points in Europe, collected during 42 consecu-tive days. Our contributions are threefold: Firstly, we arethe first to study Dropbox, which we show to be the mostwidely-used cloud storage system, already accounting for avolume equivalent to around one third of the YouTube trafficat campus networks on some days. Secondly, we character-ize the workload users in different environments generate tothe system, highlighting how this reflects on network traf-fic. Lastly, our results show possible performance bottle-necks caused by both the current system architecture andthe storage protocol. This is exacerbated for users connectedfar from storage data-centers.All measurements used in our analyses are publicly avail-
able in anonymized form at the SimpleWeb trace repository:http://traces.simpleweb.org/dropbox/
Categories and Subject Descriptors
C.2 [Computer-Communication Networks]: Miscella-neous; C.4 [Performance of Systems]: MeasurementTechniques
General Terms
Measurement, Performance
Permission to make digital or hard copies of all or part of this work forpersonal or classroom use is granted without fee provided that copies arenot made or distributed for profit or commercial advantage and that copiesbear this notice and the full citation on the first page. To copy otherwise, torepublish, to post on servers or to redistribute to lists, requires prior specificpermission and/or a fee.IMC’12, November 14–16, 2012, Boston, Massachusetts, USA.Copyright 2012 ACM 978-1-4503-XXXX-X/12/11 ...$15.00.
Keywords
Dropbox, Cloud Storage, Internet Measurement.
1. INTRODUCTIONRecent years have seen the introduction of cloud-based
services [18], offering people and enterprises computing andstorage capacity on remote data-centers and abstractingaway the complexity of hardware management. We witnessa gold rush to offer on-line storage capabilities, with playerslike Microsoft, Google and Amazon entering the market atthe end of April 2012. They face a crowded scenario againstpopular solutions like Box.com, UbuntuOne, and Dropbox.The latter, active since 2007, currently counts over 50 mil-lion users, uploading more than 500 million files daily.1
It is thus not surprising that cloud storage has gainedincreasing momentum within research community. Someworks explicitly consider system architecture design [12],while others focus on security and privacy issues concern-ing the storage of user data [19]. Considering commer-cial offers, little is known, with most players providingproprietary solutions and not willing to share information.Some studies present a comparison among different storageproviders [13, 17]: by running benchmarks, they focus onthe user achieved performance, but miss the characteriza-tion of the typical usage of a cloud service, and the impact ofuser and system behavior on personal storage applications.
In this paper, we provide a characterization of cloud-based storage systems. We analyze traffic collected fromtwo university campuses and two Points of Presence (POP)in a large Internet Service Provider (ISP) for 42 consecutivedays. We first devise a methodology for monitoring cloudstorage traffic, which, being based on TLS encryption, isnot straightforward to be understood. We then focus onDropbox, which we show to be the most widely-used cloudstorage system in our datasets. Dropbox already accountsfor about 100GB of daily traffic in one of the monitored net-works – i.e., 4% of the total traffic or around one third of theYouTube traffic at the same network. We focus first on theservice performance characterization, highlighting possiblebottlenecks and suggesting countermeasures. Then, we de-tail user habits, thus providing an extensive characterizationof the workload the system has to face.
To be best of our knowledge, we are the first to providean analysis of Dropbox usage on the Internet. The authors
1http://www.dropbox.com/news
of [11] compare Dropbox, Mozy, Carbonite and CrashPlan,but only a simplistic active experiment is provided to assessthem. In [16], the possibility of unauthorized data accessand the security implications of storing data in Dropbox areanalyzed. We follow a similar methodology to dissect theDropbox protocol, but focus on a completely different topic.Considering storage systems in general, [8, 9] study securityand privacy implications of the deployment of data dedu-plication – the mechanism in place in Dropbox for avoidingthe storage of duplicate data. Similarly, [1] presents a per-formance analysis of the Amazon Web Services (AWS) ingeneral, but does not provide insights into personal storage.Finally, several works characterize popular services, such associal networks [7, 15] or YouTube [3, 6]. Our work goes ina similar direction, shedding light on Dropbox and possiblyother related systems. Our main findings are:• We already see a significant amount of traffic relatedto personal cloud storage, especially on campus networks,where people with more technical knowledge are found. Weexpect these systems to become popular also at home, wherepenetration is already above 6%.• We highlight that Dropbox performance is mainly drivenby the distance between clients and storage data-centers.In addition, short data transfer sizes coupled with a per-chunk acknowledgment mechanism impair transfer through-put, which is as little as 530kbits/s on average. A bundlingscheme, delayed acknowledgments, or a finer placement ofstorage servers could be adopted to improve performance.• Considering home users’ behavior, four groups are clear:7% of people only upload data; around 26% only download,and up to 37% of people do both. The remaining 30% aban-don their clients running, seldom exchanging files.• Interestingly, one of the most appreciated features ofDropbox is the simplified ability to share content: 30% ofhome users have more than one linked device, and 70% shareat least one folder. At campuses, the number of shared fold-ers increases, with 40% of users sharing more than 5 folders.Our findings show that personal cloud storage applica-
tions are data hungry, and user behavior deeply affects theirnetwork requirements. We believe that our results are use-ful for both the research community and ISPs to understandand to anticipate the impact of massive adoption of such so-lutions. Similarly, our analysis of the Dropbox performanceis a reference for those designing protocols and provisioningdata-centers for similar services, with valuable lessons aboutpossible bottlenecks introduced by some design decisions.The remainder of this paper is organized as follows: Sec. 2
provides insight into the Dropbox architecture. Sec. 3 de-scribes our data collection and compares the popularity ofwell-known cloud-based storage systems. Sec. 4 presents acharacterization of Dropbox performance. User habits andthe generated workload are presented in Sec. 5. While thosesections mostly focus on the usage of the Dropbox clientsoftware, Sec. 6 discusses the less popular Web interface. Fi-nally, Sec. 7 concludes this paper, and Appendix A providessome additional characteristics of Dropbox storage traffic.
2. DROPBOX OVERVIEW
2.1 The Dropbox ClientThe Dropbox native client is implemented mostly in
Python, using third-party libraries such as librsync. Theapplication is available for Microsoft Windows, Apple OS X
Table 1: Domain names used by different Dropbox
services. Numeric suffixes are replaced by a X letter.
sub-domain Data-center Descriptionclient-lb/clientX Dropbox Meta-datanotifyX Dropbox Notificationsapi Dropbox API controlwww Dropbox Web serversd Dropbox Event logsdl Amazon Direct linksdl-clientX Amazon Client storagedl-debugX Amazon Back-tracesdl-web Amazon Web storageapi-content Amazon API Storage
and Linux.2 The basic object in the system is a chunk ofdata with size of up to 4MB. Files larger than that are splitinto several chunks, each treated as an independent object.Each chunk is identified by a SHA256 hash value, which ispart of meta-data descriptions of files. Dropbox reduces theamount of exchanged data by using delta encoding whentransmitting chunks. It also keeps locally in each device adatabase of meta-data information (updated via incremen-tal updates) and compresses chunks before submitting them.In addition, the client offers the user the ability to controlthe maximum download and upload speed.
Two major components can be identified in the Dropboxarchitecture: the control and the data storage servers. Theformer are under direct control of Dropbox Inc., while Ama-zon Elastic Compute Cloud (EC2) and Simple Storage Ser-vice (S3) are used as storage servers. In both cases, sub-domains of dropbox.com are used for identifying the differ-ent parts of the service offering a specific functionality, asdetailed in Tab. 1. HTTPS is used to access all services,except the notification service which runs over HTTP.
2.2 Understanding Dropbox InternalsTo characterize the usage of the service from passive mea-
surements, we first gained an understanding of the Dropboxclient protocol. We performed several active experimentsto observe what information is exchanged after a particu-lar operation. For instance, among others, we documentedthe traffic generated when adding or removing files on localfolders, when downloading new files and when creating newfolders. During our data collection, Dropbox client version1.2.52 was being distributed as the stable version.3
Since most client communications are encrypted withTLS, and no description about the protocol is provided byDropbox, we set up a local testbed, in which a Linux PCrunning the Dropbox client was instructed to use a Squid
proxy server under our control. On the latter, the mod-ule SSL-bump4 was used to terminate SSL connections andsave decrypted traffic flows. The memory area where theDropbox application stores trusted certificate authoritieswas modified at run-time to replace the original DropboxInc. certificate by the self-signed one signing the proxyserver. By means of this setup, we were able to observeand to understand the Dropbox client communication.
2Mobile device applications access Dropbox on demand us-ing APIs; those are not considered in this work.3http://www.dropbox.com/release_notes4http://wiki.squid-cache.org/Features/SslBump
register_
host
list
com
mit_
batch
[hash
es]
store
store
close_
chan
geset
list
nee
d_blo
cks
[]
ok
ok
ok
nee
d_blo
cks
[has
hes
]
com
mit_
batch
[hash
es]
[...]
ok
client/client-lbDropbox
client/client-lbDropbox
dl-clientAmazon
Figure 1: An example of the Dropbox protocol.
For instance, Fig. 1 illustrates the messages we observedwhile committing a batch of chunks. After registering withthe Dropbox control center via a clientX.dropbox.com
server, the list command retrieves meta-data updates. Assoon as new files are locally added, a commit batch com-mand (on client-lb.dropbox.com) submits meta-data in-formation. This can trigger store operations, performed di-rectly with Amazon servers (on dl-clientX.dropbox.com).Each chunk store operation is acknowledged by one OK
message. As we will see in Sec. 4, this acknowledgmentmechanism might originate performance bottlenecks. Fi-nally, as chunks are successfully submitted, the client ex-changes messages with the central Dropbox servers (againon client-lb.dropbox.com) to conclude the transactions.Note that these messages committing transactions might oc-cur in parallel with newer store operations.A complete description of the Dropbox protocols is outside
the scope of this paper. We, however, exploit this knowledgeto tag the passively observed TCP flows with the likely com-mands executed by the client, even if we have no access tothe content of the (encrypted) connections. In the follow-ing, we describe the protocols used to exchange data withthe Dropbox control servers and with the storage servers atAmazon.
2.3 Client Control FlowsThe Dropbox client exchanges control information mostly
with servers managed directly by Dropbox Inc. We iden-tified three sub-groups of control servers: (i) Notification,(ii) meta-data administration, and (iii) system-log servers.System-log servers collect run-time information about theclients, including exception back-traces (via Amazon, ondl-debug.dropbox.com), and other event logs possibly use-ful for system optimization (on d.dropbox.com). Since flowsto those servers are not directly related to the usage of thesystem and do not carry much data, they have not been con-sidered further. In the following we describe the key TCPflows to the meta-data and notification servers.
2.3.1 Notification Protocol
The Dropbox client keeps continuously opened a TCPconnection to a notification server (notifyX.dropbox.com),used for receiving information about changes performed else-where. In contrast to other traffic, notification connectionsare not encrypted. Delayed HTTP responses are used to im-plement a push mechanism: a notification request is sentby the local client asking for eventual changes; the serverresponse is received periodically about 60 seconds later incase of no change; after receiving it, the client immediatelysends a new request. Changes on the central storage areinstead advertised as soon as they are performed.
Each device linked to Dropbox has a unique identifier(host int). Unique identifiers (called namespaces) are alsoused for each shared folder. The client identifier is sentin notification requests, together with the current list ofnamespaces. Devices and number of shared folders can,therefore, be identified in network traces by passively watch-ing notification flows. Finally, different devices belong-ing to a single user can be inferred as well, by comparingnamespace lists.
2.3.2 Meta-data Information Protocol
Authentication and file meta-data administration mes-sages are exchanged with a separate set of servers,(client-lb.dropbox.com and/or clientX.dropbox.com).Typically, synchronization transactions start with messagesto meta-data servers, followed by a batch of either store
or retrieve operations through Amazon servers. As datachunks are successfully exchanged, the client sends mes-sages to meta-data servers to conclude the transactions (seeFig. 1). Due to an aggressive TCP connection timeout han-dling, several short TLS connections to meta-data serverscan be observed during this procedure.
Server responses to client messages can include generalcontrol parameters. For instance, our experiments in thetestbed reveal that the current version of the protocol limitsthe number of chunks to be transferred to at most 100 pertransaction. That is, if more than 100 chunks need to beexchanged, the operation is split into several batches, eachof at most 100 chunks. Such parameters shape the trafficproduced by the client, as analysed in Sec. 4.
2.4 Data Storage FlowsAs illustrated in Fig. 1, all store and retrieve operations
are handled by virtual machines in Amazon EC2. Morethan 500 distinct domain names (dl-clientX.dropbox.com)point to Amazon servers. A subset of those aliases are sentto clients regularly. Clients rotate in the received lists whenexecuting storage operations, distributing the workload.
Typically, storage flows carry either store commands orretrieve commands. This permits storage flows to be dividedinto two groups by checking the amount of data downloadedand uploaded in each flow. By means of the data collected inour test environment, we documented the overhead of storeand retrieve commands and derived a method for labelingthe flows. Furthermore, we identified a direct relationshipbetween the number of TCP segments with the PSH flagset in storage flows and the number of transported chunks.Appendix A presents more details about our methodology aswell as some results validating that the models built in ourtest environment represent the traffic generated by real userssatisfactorily. We use this knowledge in the next sections forcharacterizing the system performance and the workload.
2.5 Web Interface and Other ProtocolsContent stored in Dropbox can also be accessed through
Web interfaces. A separate set of domain names are usedto identify the different services and can thus be exploitedto distinguish the performed operations. For example,URLs containing dl-web.dropbox.com are used when down-loading private content from user accounts. The domaindl.dropbox.com provides public direct links to shared files.As shown in Sec. 6, the latter is the preferred Dropbox Webinterface.
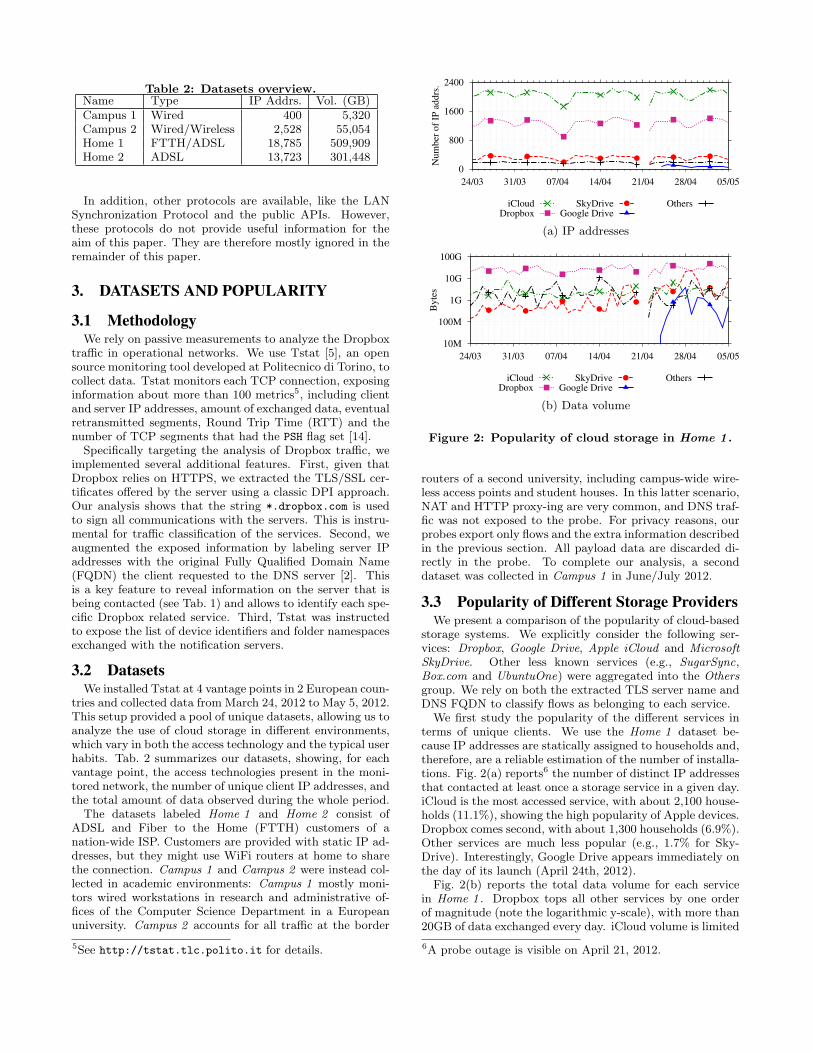
Table 2: Datasets overview.Name Type IP Addrs. Vol. (GB)Campus 1 Wired 400 5,320Campus 2 Wired/Wireless 2,528 55,054Home 1 FTTH/ADSL 18,785 509,909Home 2 ADSL 13,723 301,448
In addition, other protocols are available, like the LANSynchronization Protocol and the public APIs. However,these protocols do not provide useful information for theaim of this paper. They are therefore mostly ignored in theremainder of this paper.
3. DATASETS AND POPULARITY
3.1 MethodologyWe rely on passive measurements to analyze the Dropbox
traffic in operational networks. We use Tstat [5], an opensource monitoring tool developed at Politecnico di Torino, tocollect data. Tstat monitors each TCP connection, exposinginformation about more than 100 metrics5, including clientand server IP addresses, amount of exchanged data, eventualretransmitted segments, Round Trip Time (RTT) and thenumber of TCP segments that had the PSH flag set [14].Specifically targeting the analysis of Dropbox traffic, we
implemented several additional features. First, given thatDropbox relies on HTTPS, we extracted the TLS/SSL cer-tificates offered by the server using a classic DPI approach.Our analysis shows that the string *.dropbox.com is usedto sign all communications with the servers. This is instru-mental for traffic classification of the services. Second, weaugmented the exposed information by labeling server IPaddresses with the original Fully Qualified Domain Name(FQDN) the client requested to the DNS server [2]. Thisis a key feature to reveal information on the server that isbeing contacted (see Tab. 1) and allows to identify each spe-cific Dropbox related service. Third, Tstat was instructedto expose the list of device identifiers and folder namespacesexchanged with the notification servers.
3.2 DatasetsWe installed Tstat at 4 vantage points in 2 European coun-
tries and collected data from March 24, 2012 to May 5, 2012.This setup provided a pool of unique datasets, allowing us toanalyze the use of cloud storage in different environments,which vary in both the access technology and the typical userhabits. Tab. 2 summarizes our datasets, showing, for eachvantage point, the access technologies present in the moni-tored network, the number of unique client IP addresses, andthe total amount of data observed during the whole period.The datasets labeled Home 1 and Home 2 consist of
ADSL and Fiber to the Home (FTTH) customers of anation-wide ISP. Customers are provided with static IP ad-dresses, but they might use WiFi routers at home to sharethe connection. Campus 1 and Campus 2 were instead col-lected in academic environments: Campus 1 mostly moni-tors wired workstations in research and administrative of-fices of the Computer Science Department in a Europeanuniversity. Campus 2 accounts for all traffic at the border
5See http://tstat.tlc.polito.it for details.
0
800
1600
2400
24/03 31/03 07/04 14/04 21/04 28/04 05/05
Num
ber
of
IP a
ddrs
.
iCloudDropbox
SkyDriveGoogle Drive
Others
(a) IP addresses
10M
100M
1G
10G
100G
24/03 31/03 07/04 14/04 21/04 28/04 05/05
Byte
s
iCloudDropbox
SkyDriveGoogle Drive
Others
(b) Data volume
Figure 2: Popularity of cloud storage in Home 1 .
routers of a second university, including campus-wide wire-less access points and student houses. In this latter scenario,NAT and HTTP proxy-ing are very common, and DNS traf-fic was not exposed to the probe. For privacy reasons, ourprobes export only flows and the extra information describedin the previous section. All payload data are discarded di-rectly in the probe. To complete our analysis, a seconddataset was collected in Campus 1 in June/July 2012.
3.3 Popularity of Different Storage ProvidersWe present a comparison of the popularity of cloud-based
storage systems. We explicitly consider the following ser-vices: Dropbox, Google Drive, Apple iCloud and Microsoft
SkyDrive. Other less known services (e.g., SugarSync,Box.com and UbuntuOne) were aggregated into the Others
group. We rely on both the extracted TLS server name andDNS FQDN to classify flows as belonging to each service.
We first study the popularity of the different services interms of unique clients. We use the Home 1 dataset be-cause IP addresses are statically assigned to households and,therefore, are a reliable estimation of the number of installa-tions. Fig. 2(a) reports6 the number of distinct IP addressesthat contacted at least once a storage service in a given day.iCloud is the most accessed service, with about 2,100 house-holds (11.1%), showing the high popularity of Apple devices.Dropbox comes second, with about 1,300 households (6.9%).Other services are much less popular (e.g., 1.7% for Sky-Drive). Interestingly, Google Drive appears immediately onthe day of its launch (April 24th, 2012).
Fig. 2(b) reports the total data volume for each servicein Home 1 . Dropbox tops all other services by one orderof magnitude (note the logarithmic y-scale), with more than20GB of data exchanged every day. iCloud volume is limited
6A probe outage is visible on April 21, 2012.
0
0.05
0.1
0.15
0.2
24/03 31/03 07/04 14/04 21/04 28/04 05/05
Shar
e
Date
YouTubeDropbox
Figure 3: YouTube and Dropbox in Campus 2 .
Table 3: Total Dropbox traffic in the datasets.
Name Flows Vol. (GB) DevicesCampus 1 167,189 146 283Campus 2 1,902,824 1,814 6,609Home 1 1,438,369 1,153 3,350Home 2 693,086 506 1,313Total 4,204,666 3,624 11,561
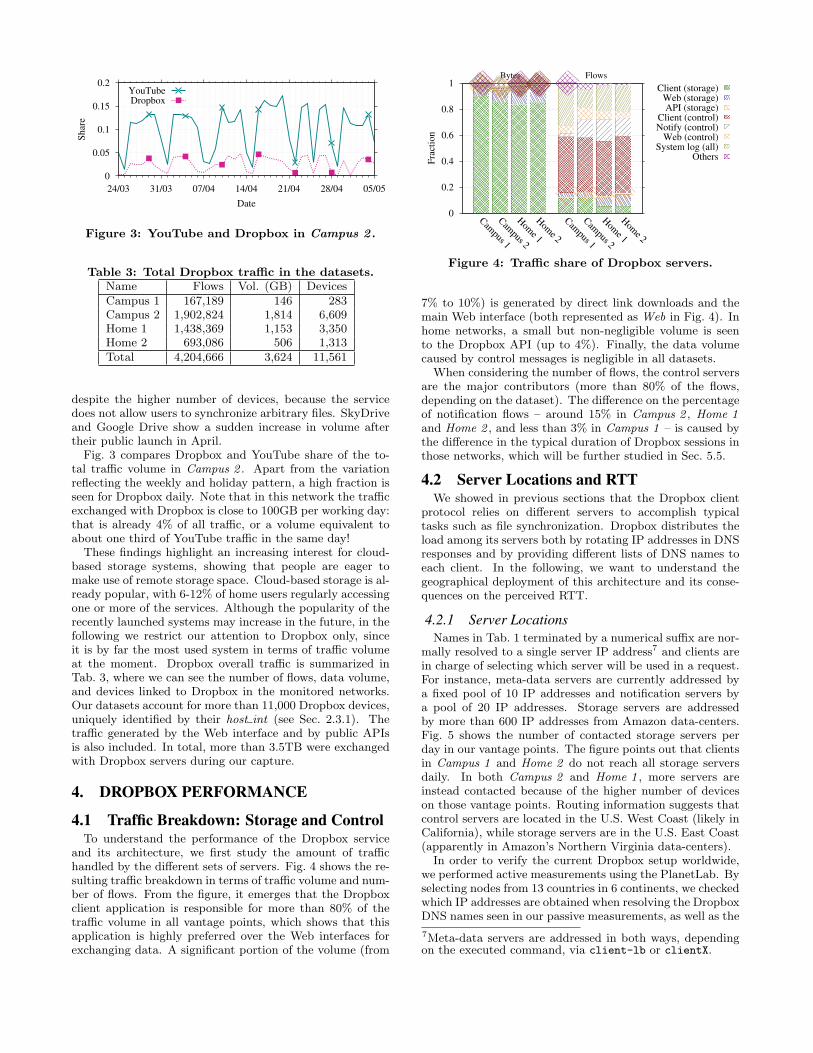
despite the higher number of devices, because the servicedoes not allow users to synchronize arbitrary files. SkyDriveand Google Drive show a sudden increase in volume aftertheir public launch in April.Fig. 3 compares Dropbox and YouTube share of the to-
tal traffic volume in Campus 2 . Apart from the variationreflecting the weekly and holiday pattern, a high fraction isseen for Dropbox daily. Note that in this network the trafficexchanged with Dropbox is close to 100GB per working day:that is already 4% of all traffic, or a volume equivalent toabout one third of YouTube traffic in the same day!These findings highlight an increasing interest for cloud-
based storage systems, showing that people are eager tomake use of remote storage space. Cloud-based storage is al-ready popular, with 6-12% of home users regularly accessingone or more of the services. Although the popularity of therecently launched systems may increase in the future, in thefollowing we restrict our attention to Dropbox only, sinceit is by far the most used system in terms of traffic volumeat the moment. Dropbox overall traffic is summarized inTab. 3, where we can see the number of flows, data volume,and devices linked to Dropbox in the monitored networks.Our datasets account for more than 11,000 Dropbox devices,uniquely identified by their host int (see Sec. 2.3.1). Thetraffic generated by the Web interface and by public APIsis also included. In total, more than 3.5TB were exchangedwith Dropbox servers during our capture.
4. DROPBOX PERFORMANCE
4.1 Traffic Breakdown: Storage and ControlTo understand the performance of the Dropbox service
and its architecture, we first study the amount of traffichandled by the different sets of servers. Fig. 4 shows the re-sulting traffic breakdown in terms of traffic volume and num-ber of flows. From the figure, it emerges that the Dropboxclient application is responsible for more than 80% of thetraffic volume in all vantage points, which shows that thisapplication is highly preferred over the Web interfaces forexchanging data. A significant portion of the volume (from
0
0.2
0.4
0.6
0.8
1
Campus 1
Campus 2
Hom
e 1
Hom
e 2
Campus 1
Campus 2
Hom
e 1
Hom
e 2
Fra
ctio
n
Bytes Flows
Client (storage)Web (storage)API (storage)
Client (control)Notify (control)
Web (control)System log (all)
Others
Figure 4: Traffic share of Dropbox servers.
7% to 10%) is generated by direct link downloads and themain Web interface (both represented as Web in Fig. 4). Inhome networks, a small but non-negligible volume is seento the Dropbox API (up to 4%). Finally, the data volumecaused by control messages is negligible in all datasets.
When considering the number of flows, the control serversare the major contributors (more than 80% of the flows,depending on the dataset). The difference on the percentageof notification flows – around 15% in Campus 2 , Home 1
and Home 2 , and less than 3% in Campus 1 – is caused bythe difference in the typical duration of Dropbox sessions inthose networks, which will be further studied in Sec. 5.5.
4.2 Server Locations and RTTWe showed in previous sections that the Dropbox client
protocol relies on different servers to accomplish typicaltasks such as file synchronization. Dropbox distributes theload among its servers both by rotating IP addresses in DNSresponses and by providing different lists of DNS names toeach client. In the following, we want to understand thegeographical deployment of this architecture and its conse-quences on the perceived RTT.
4.2.1 Server Locations
Names in Tab. 1 terminated by a numerical suffix are nor-mally resolved to a single server IP address7 and clients arein charge of selecting which server will be used in a request.For instance, meta-data servers are currently addressed bya fixed pool of 10 IP addresses and notification servers bya pool of 20 IP addresses. Storage servers are addressedby more than 600 IP addresses from Amazon data-centers.Fig. 5 shows the number of contacted storage servers perday in our vantage points. The figure points out that clientsin Campus 1 and Home 2 do not reach all storage serversdaily. In both Campus 2 and Home 1 , more servers areinstead contacted because of the higher number of deviceson those vantage points. Routing information suggests thatcontrol servers are located in the U.S. West Coast (likely inCalifornia), while storage servers are in the U.S. East Coast(apparently in Amazon’s Northern Virginia data-centers).
In order to verify the current Dropbox setup worldwide,we performed active measurements using the PlanetLab. Byselecting nodes from 13 countries in 6 continents, we checkedwhich IP addresses are obtained when resolving the DropboxDNS names seen in our passive measurements, as well as the
7Meta-data servers are addressed in both ways, dependingon the executed command, via client-lb or clientX.
0
200
400
600
800
1000
24/03 31/03 07/04 14/04 21/04 28/04 05/05
Ser
ver
IP
addrs
.
Date
Campus 1Campus 2
Home 1Home 2
Figure 5: Number of contacted storage servers.
0
0.2
0.4
0.6
0.8
1
80 90 100 110 120
CD
F
Time (ms)
Storage
0
0.2
0.4
0.6
0.8
1
140 160 180 200 220
Time (ms)
Control
Campus 1Campus 2
Home 1Home 2
Figure 6: Distribution of minimum RTT of storage
and control flows. Note the different x-axes.
routes and RTT when contacting the servers. The experi-ment shows that the same set of IP addresses is always sentto clients regardless of their geographical locations. This isvalid for both control and storage domain names. Route in-formation and RTT suggest that the same U.S. data-centersobserved in our passive measurements are the only onesused worldwide. That is, Dropbox is, as for now, a ser-vice centralized in the U.S. Considering that more than halfof the Dropbox clients are outside the U.S.8, and the highamount of traffic observed in our vantage points, the trafficexchanged between the clients and the data-centers is likelyto be already very relevant in the core network.
4.2.2 Storage and Control RTT
A deeper analysis of the RTT at our four vantage pointsreveals more details of the physical implementation of theDropbox architecture. Sec. 4.4 will show that the RTT hasa major impact on the service performance. Fig. 6 shows,separately for storage (left) and control flows (right), theCDF of the minimum RTT in flows where at least 10 RTTsamples could be obtained (see [14]). The figure accountsonly for the RTT between our probes and the servers, tofilter out the impact of the access technologies (e.g., ADSL).The RTTs to storage servers at Amazon remained sta-
ble during our measurements, meaning that no significantchanges in the network topology happened. The differencesin RTTs among the vantage points are related to the coun-tries where the probes are located. This constant RTT dur-ing our 42 days of measurements is another strong indicationthat a single data-center was used by all users in our vantagepoints. The RTTs to the control servers are less constant.In both Campus 1 and Home 2 , the curve presents small
8http://www.dropbox.com/news
0
0.2
0.4
0.6
0.8
1
1k 10k 100k 1M 10M100M 1G
CD
F
Flow size (bytes)
Store
0
0.2
0.4
0.6
0.8
1
1k 10k 100k 1M 10M100M 1G
Flow size (bytes)
Retrieve
Campus 1Campus 2
Home 1Home 2
Figure 7: Distribution of TCP flow sizes of file stor-
age for the Dropbox client.
steps (less than 10ms). We assume that they are caused bychanges in the IP route, since the same behavior is not no-ticeable in all probes. Also in this case, the measurementshint to a central control server farm. Finally, it is interest-ing to note the high difference in the RTT between controland storage data-centers. This is probably caused by thephysical distance between them inside the U.S.
4.3 Retrieve and Store Flows
4.3.1 Flow Size
As shown in Fig. 4, most traffic is generated by storageoperations. Fig. 7 depicts the CDF of the flow size for stor-age operations. Since SSL is used, we observe a minimumflow size of approximately 4kB. The flows have a maximumsize of approximately 400MB because of current run-timeparameters of Dropbox: batches are limited to a maximumof 100 chunks, each smaller than 4MB, as described in Sec. 2.
From Fig. 7 it emerges that a significant percentage offlows (up to 40% in some cases) exchange less than 10kB,meaning that they are composed mostly by SSL handshakemessages and a small amount of user data. A very highpercentage of flows (varying from 40% to 80%) consist ofless than 100kB. We conjecture that two factors are causingthis behavior: (i) the synchronization protocol sending andreceiving file deltas as soon as they are detected; (ii) theprimary use of Dropbox for synchronization of small filesconstantly changed, instead of periodic (large) backups.
Comparing the CDFs for the retrieve and storage opera-tions, we can see that retrieve flows are normally larger thanthe store ones. This is particularly visible in Campus 1 ,Campus 2 and Home 1 datasets. For instance, while 60%of store flows in Home 1 have no more than 100kB, the per-centage is about 40% for retrieve flows in the same network.This can be partially explained by the first batch synchro-nization happening when sessions are started. Besides that,we observed a high number of devices using Dropbox onlyfor downloading content. This usage will be analyzed furtherin the coming sections.
We also highlight a remarkably discrepancy in the CDFfor store flows in Home 2. A single device was submittingsingle chunks in consecutive TCP connections during severaldays in our capture. This caused the CDF to be stronglybiased toward the maximum chunk size used by Dropbox(4MB). We could not determine whether this behavior isdue to problems in the Dropbox client manifested in thissingle device, or another legitimate use of the service.
0
0.2
0.4
0.6
0.8
1
1 10 100
CD
F
Number of Chunks
Store
0
0.2
0.4
0.6
0.8
1
1 10 100
Number of Chunks
Retrieve
Campus 1Campus 2
Home 1Home 2
Figure 8: Distribution of the estimated number of
file chunks per TCP flow.
4.3.2 Chunks per Batch
Fig. 8 depicts the CDF of the estimated number of chunksper flow. The curves show that most batches are composedby a small number of chunks. Storage flows have no morethan 10 chunks in more than 80% of the cases in all datasets.Home 2 distribution diverges because of the single client be-having abnormally described in the previous section. Thesedistributions reinforce our conjecture about the dominanceof deltas and small files in Dropbox usage habits: most flowsare very small and composed by few chunks. Most of the re-maining flows have the maximum allowed number of chunksper batch and, therefore, are strongly shaped by the protocoldesign of Dropbox.
4.4 Storage ThroughputOur measurements in Sec. 4.2 indicate that Dropbox relies
on centralized data-centers for control and storage. Thisraises the question on the service performance for users notlocated near those data-centers.The throughput of the storage operations is certainly one
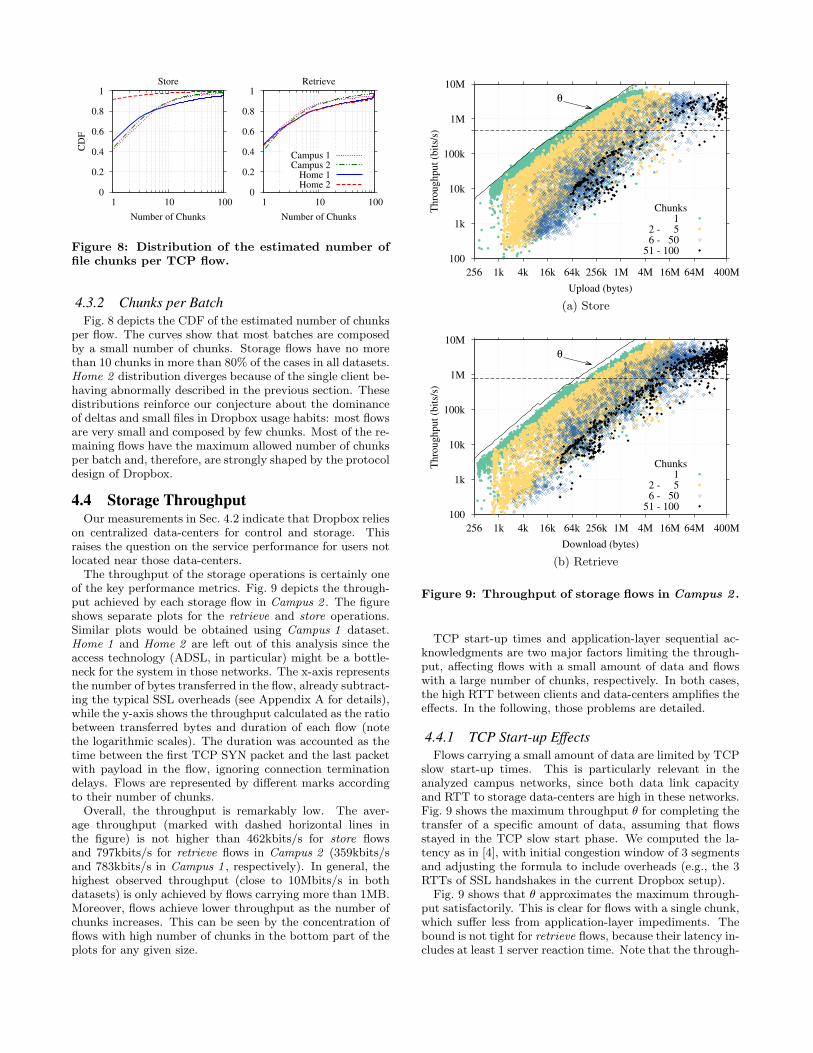
of the key performance metrics. Fig. 9 depicts the through-put achieved by each storage flow in Campus 2 . The figureshows separate plots for the retrieve and store operations.Similar plots would be obtained using Campus 1 dataset.Home 1 and Home 2 are left out of this analysis since theaccess technology (ADSL, in particular) might be a bottle-neck for the system in those networks. The x-axis representsthe number of bytes transferred in the flow, already subtract-ing the typical SSL overheads (see Appendix A for details),while the y-axis shows the throughput calculated as the ratiobetween transferred bytes and duration of each flow (notethe logarithmic scales). The duration was accounted as thetime between the first TCP SYN packet and the last packetwith payload in the flow, ignoring connection terminationdelays. Flows are represented by different marks accordingto their number of chunks.Overall, the throughput is remarkably low. The aver-
age throughput (marked with dashed horizontal lines inthe figure) is not higher than 462kbits/s for store flowsand 797kbits/s for retrieve flows in Campus 2 (359kbits/sand 783kbits/s in Campus 1 , respectively). In general, thehighest observed throughput (close to 10Mbits/s in bothdatasets) is only achieved by flows carrying more than 1MB.Moreover, flows achieve lower throughput as the number ofchunks increases. This can be seen by the concentration offlows with high number of chunks in the bottom part of theplots for any given size.
100
1k
10k
100k
1M
10M
256 1k 4k 16k 64k 256k 1M 4M 16M 64M 400M
Thro
ughput
(bit
s/s)
Upload (bytes)
θ
Chunks 1
2 - 56 - 50
51 - 100
(a) Store
100
1k
10k
100k
1M
10M
256 1k 4k 16k 64k 256k 1M 4M 16M 64M 400M
Thro
ughput
(bit
s/s)
Download (bytes)
θ
Chunks 1
2 - 56 - 50
51 - 100
(b) Retrieve
Figure 9: Throughput of storage flows in Campus 2 .
TCP start-up times and application-layer sequential ac-knowledgments are two major factors limiting the through-put, affecting flows with a small amount of data and flowswith a large number of chunks, respectively. In both cases,the high RTT between clients and data-centers amplifies theeffects. In the following, those problems are detailed.
4.4.1 TCP Start-up Effects
Flows carrying a small amount of data are limited by TCPslow start-up times. This is particularly relevant in theanalyzed campus networks, since both data link capacityand RTT to storage data-centers are high in these networks.Fig. 9 shows the maximum throughput θ for completing thetransfer of a specific amount of data, assuming that flowsstayed in the TCP slow start phase. We computed the la-tency as in [4], with initial congestion window of 3 segmentsand adjusting the formula to include overheads (e.g., the 3RTTs of SSL handshakes in the current Dropbox setup).
Fig. 9 shows that θ approximates the maximum through-put satisfactorily. This is clear for flows with a single chunk,which suffer less from application-layer impediments. Thebound is not tight for retrieve flows, because their latency in-cludes at least 1 server reaction time. Note that the through-
0.1s
1s
5s
30s
2m
10m
1k 4k 16k 64k 256k 1M 4M 16M 64M 400M
Dura
tion
Upload (bytes)
Store
Chunks 1
2 - 56 - 50
51 - 100
0.1s
1s
5s
30s
2m
10m
1k 4k 16k 64k 256k 1M 4M 16M 64M 400M
Dura
tion
Download (bytes)
Retrieve
Chunks 1
2 - 56 - 50
51 - 100
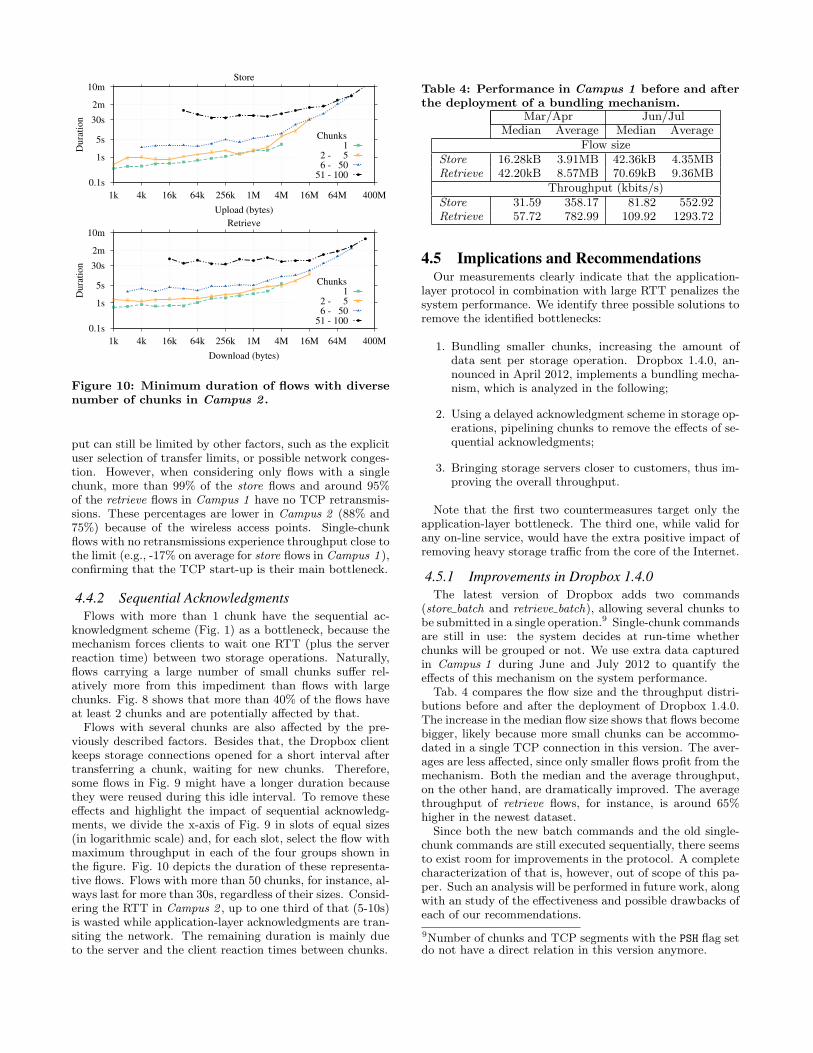
Figure 10: Minimum duration of flows with diverse
number of chunks in Campus 2 .
put can still be limited by other factors, such as the explicituser selection of transfer limits, or possible network conges-tion. However, when considering only flows with a singlechunk, more than 99% of the store flows and around 95%of the retrieve flows in Campus 1 have no TCP retransmis-sions. These percentages are lower in Campus 2 (88% and75%) because of the wireless access points. Single-chunkflows with no retransmissions experience throughput close tothe limit (e.g., -17% on average for store flows in Campus 1 ),confirming that the TCP start-up is their main bottleneck.
4.4.2 Sequential Acknowledgments
Flows with more than 1 chunk have the sequential ac-knowledgment scheme (Fig. 1) as a bottleneck, because themechanism forces clients to wait one RTT (plus the serverreaction time) between two storage operations. Naturally,flows carrying a large number of small chunks suffer rel-atively more from this impediment than flows with largechunks. Fig. 8 shows that more than 40% of the flows haveat least 2 chunks and are potentially affected by that.Flows with several chunks are also affected by the pre-
viously described factors. Besides that, the Dropbox clientkeeps storage connections opened for a short interval aftertransferring a chunk, waiting for new chunks. Therefore,some flows in Fig. 9 might have a longer duration becausethey were reused during this idle interval. To remove theseeffects and highlight the impact of sequential acknowledg-ments, we divide the x-axis of Fig. 9 in slots of equal sizes(in logarithmic scale) and, for each slot, select the flow withmaximum throughput in each of the four groups shown inthe figure. Fig. 10 depicts the duration of these representa-tive flows. Flows with more than 50 chunks, for instance, al-ways last for more than 30s, regardless of their sizes. Consid-ering the RTT in Campus 2 , up to one third of that (5-10s)is wasted while application-layer acknowledgments are tran-siting the network. The remaining duration is mainly dueto the server and the client reaction times between chunks.
Table 4: Performance in Campus 1 before and after
the deployment of a bundling mechanism.Mar/Apr Jun/Jul
Median Average Median AverageFlow size
Store 16.28kB 3.91MB 42.36kB 4.35MBRetrieve 42.20kB 8.57MB 70.69kB 9.36MB
Throughput (kbits/s)Store 31.59 358.17 81.82 552.92Retrieve 57.72 782.99 109.92 1293.72
4.5 Implications and RecommendationsOur measurements clearly indicate that the application-
layer protocol in combination with large RTT penalizes thesystem performance. We identify three possible solutions toremove the identified bottlenecks:
1. Bundling smaller chunks, increasing the amount ofdata sent per storage operation. Dropbox 1.4.0, an-nounced in April 2012, implements a bundling mecha-nism, which is analyzed in the following;
2. Using a delayed acknowledgment scheme in storage op-erations, pipelining chunks to remove the effects of se-quential acknowledgments;
3. Bringing storage servers closer to customers, thus im-proving the overall throughput.
Note that the first two countermeasures target only theapplication-layer bottleneck. The third one, while valid forany on-line service, would have the extra positive impact ofremoving heavy storage traffic from the core of the Internet.
4.5.1 Improvements in Dropbox 1.4.0
The latest version of Dropbox adds two commands(store batch and retrieve batch), allowing several chunks tobe submitted in a single operation.9 Single-chunk commandsare still in use: the system decides at run-time whetherchunks will be grouped or not. We use extra data capturedin Campus 1 during June and July 2012 to quantify theeffects of this mechanism on the system performance.
Tab. 4 compares the flow size and the throughput distri-butions before and after the deployment of Dropbox 1.4.0.The increase in the median flow size shows that flows becomebigger, likely because more small chunks can be accommo-dated in a single TCP connection in this version. The aver-ages are less affected, since only smaller flows profit from themechanism. Both the median and the average throughput,on the other hand, are dramatically improved. The averagethroughput of retrieve flows, for instance, is around 65%higher in the newest dataset.
Since both the new batch commands and the old single-chunk commands are still executed sequentially, there seemsto exist room for improvements in the protocol. A completecharacterization of that is, however, out of scope of this pa-per. Such an analysis will be performed in future work, alongwith an study of the effectiveness and possible drawbacks ofeach of our recommendations.
9Number of chunks and TCP segments with the PSH flag setdo not have a direct relation in this version anymore.
1k
10k
100k
1M
10M
100M
1G
10G
100G
1k 10k 100k 1M 10M 100M 1G 10G 100G
Sto
re (
byte
s)
Retrieve (bytes)
Devices1
2-3> 3
(a) Home 1
1k
10k
100k
1M
10M
100M
1G
10G
100G
1k 10k 100k 1M 10M 100M 1G 10G 100G
Sto
re (
byte
s)
Retrieve (bytes)
Devices1
2-3> 3
(b) Home 2
Figure 11: Data volume stored and retrieved from
Dropbox in each household.
5. SERVICE WORKLOAD
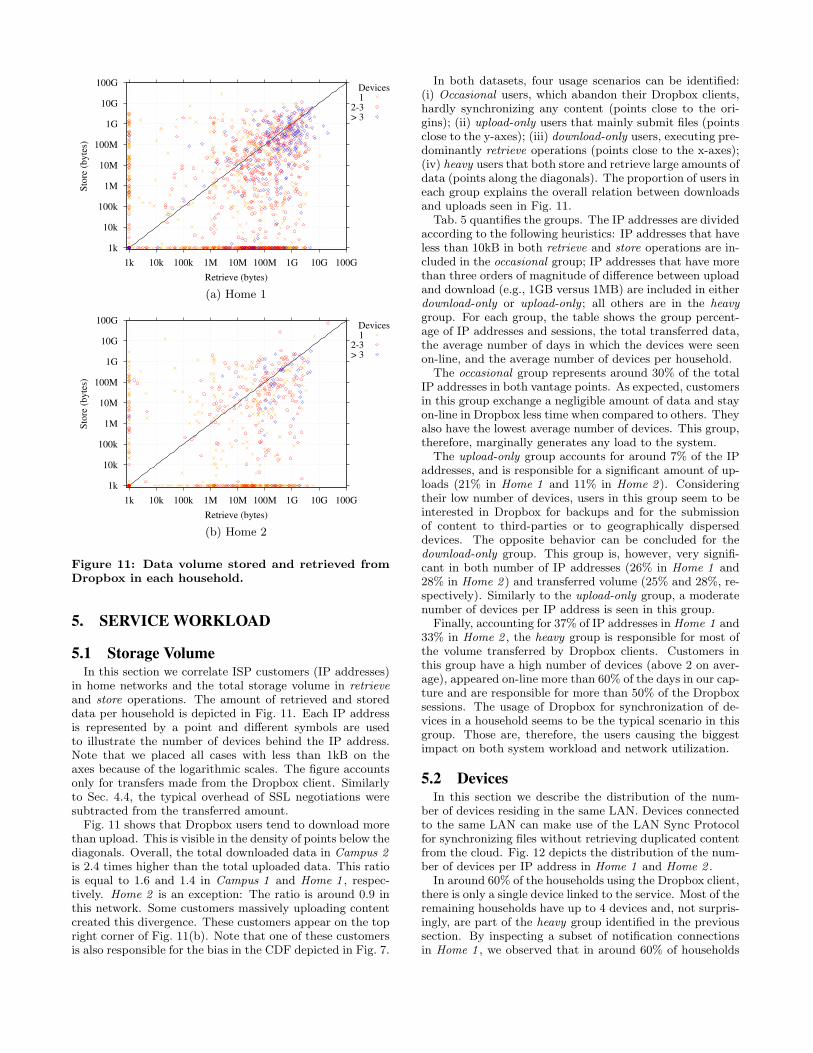
5.1 Storage VolumeIn this section we correlate ISP customers (IP addresses)
in home networks and the total storage volume in retrieve
and store operations. The amount of retrieved and storeddata per household is depicted in Fig. 11. Each IP addressis represented by a point and different symbols are usedto illustrate the number of devices behind the IP address.Note that we placed all cases with less than 1kB on theaxes because of the logarithmic scales. The figure accountsonly for transfers made from the Dropbox client. Similarlyto Sec. 4.4, the typical overhead of SSL negotiations weresubtracted from the transferred amount.Fig. 11 shows that Dropbox users tend to download more
than upload. This is visible in the density of points below thediagonals. Overall, the total downloaded data in Campus 2
is 2.4 times higher than the total uploaded data. This ratiois equal to 1.6 and 1.4 in Campus 1 and Home 1 , respec-tively. Home 2 is an exception: The ratio is around 0.9 inthis network. Some customers massively uploading contentcreated this divergence. These customers appear on the topright corner of Fig. 11(b). Note that one of these customersis also responsible for the bias in the CDF depicted in Fig. 7.
In both datasets, four usage scenarios can be identified:(i) Occasional users, which abandon their Dropbox clients,hardly synchronizing any content (points close to the ori-gins); (ii) upload-only users that mainly submit files (pointsclose to the y-axes); (iii) download-only users, executing pre-dominantly retrieve operations (points close to the x-axes);(iv) heavy users that both store and retrieve large amounts ofdata (points along the diagonals). The proportion of users ineach group explains the overall relation between downloadsand uploads seen in Fig. 11.
Tab. 5 quantifies the groups. The IP addresses are dividedaccording to the following heuristics: IP addresses that haveless than 10kB in both retrieve and store operations are in-cluded in the occasional group; IP addresses that have morethan three orders of magnitude of difference between uploadand download (e.g., 1GB versus 1MB) are included in eitherdownload-only or upload-only ; all others are in the heavy
group. For each group, the table shows the group percent-age of IP addresses and sessions, the total transferred data,the average number of days in which the devices were seenon-line, and the average number of devices per household.
The occasional group represents around 30% of the totalIP addresses in both vantage points. As expected, customersin this group exchange a negligible amount of data and stayon-line in Dropbox less time when compared to others. Theyalso have the lowest average number of devices. This group,therefore, marginally generates any load to the system.
The upload-only group accounts for around 7% of the IPaddresses, and is responsible for a significant amount of up-loads (21% in Home 1 and 11% in Home 2 ). Consideringtheir low number of devices, users in this group seem to beinterested in Dropbox for backups and for the submissionof content to third-parties or to geographically disperseddevices. The opposite behavior can be concluded for thedownload-only group. This group is, however, very signifi-cant in both number of IP addresses (26% in Home 1 and28% in Home 2 ) and transferred volume (25% and 28%, re-spectively). Similarly to the upload-only group, a moderatenumber of devices per IP address is seen in this group.
Finally, accounting for 37% of IP addresses in Home 1 and33% in Home 2 , the heavy group is responsible for most ofthe volume transferred by Dropbox clients. Customers inthis group have a high number of devices (above 2 on aver-age), appeared on-line more than 60% of the days in our cap-ture and are responsible for more than 50% of the Dropboxsessions. The usage of Dropbox for synchronization of de-vices in a household seems to be the typical scenario in thisgroup. Those are, therefore, the users causing the biggestimpact on both system workload and network utilization.
5.2 DevicesIn this section we describe the distribution of the num-
ber of devices residing in the same LAN. Devices connectedto the same LAN can make use of the LAN Sync Protocolfor synchronizing files without retrieving duplicated contentfrom the cloud. Fig. 12 depicts the distribution of the num-ber of devices per IP address in Home 1 and Home 2 .
In around 60% of the households using the Dropbox client,there is only a single device linked to the service. Most of theremaining households have up to 4 devices and, not surpris-ingly, are part of the heavy group identified in the previoussection. By inspecting a subset of notification connectionsin Home 1 , we observed that in around 60% of households
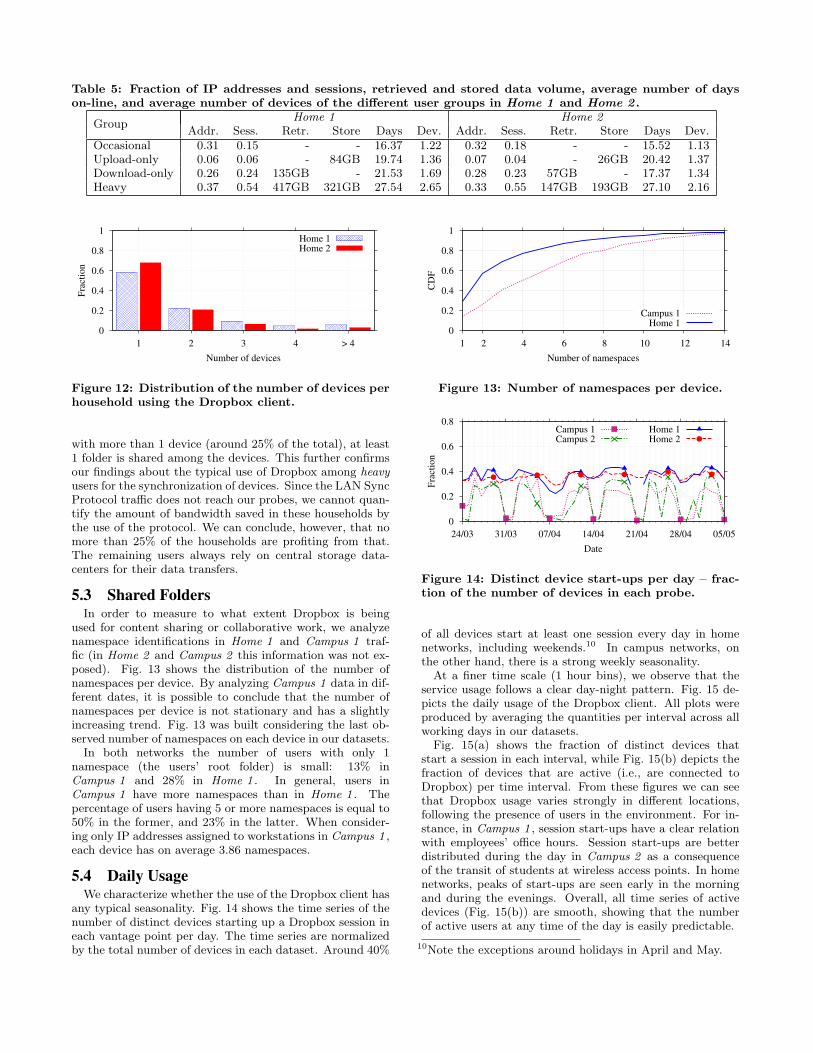
Table 5: Fraction of IP addresses and sessions, retrieved and stored data volume, average number of days
on-line, and average number of devices of the different user groups in Home 1 and Home 2 .
GroupHome 1 Home 2
Addr. Sess. Retr. Store Days Dev. Addr. Sess. Retr. Store Days Dev.Occasional 0.31 0.15 - - 16.37 1.22 0.32 0.18 - - 15.52 1.13Upload-only 0.06 0.06 - 84GB 19.74 1.36 0.07 0.04 - 26GB 20.42 1.37Download-only 0.26 0.24 135GB - 21.53 1.69 0.28 0.23 57GB - 17.37 1.34Heavy 0.37 0.54 417GB 321GB 27.54 2.65 0.33 0.55 147GB 193GB 27.10 2.16
0
0.2
0.4
0.6
0.8
1
1 2 3 4 > 4
Fra
ctio
n
Number of devices
Home 1Home 2
Figure 12: Distribution of the number of devices per
household using the Dropbox client.
with more than 1 device (around 25% of the total), at least1 folder is shared among the devices. This further confirmsour findings about the typical use of Dropbox among heavy
users for the synchronization of devices. Since the LAN SyncProtocol traffic does not reach our probes, we cannot quan-tify the amount of bandwidth saved in these households bythe use of the protocol. We can conclude, however, that nomore than 25% of the households are profiting from that.The remaining users always rely on central storage data-centers for their data transfers.
5.3 Shared FoldersIn order to measure to what extent Dropbox is being
used for content sharing or collaborative work, we analyzenamespace identifications in Home 1 and Campus 1 traf-fic (in Home 2 and Campus 2 this information was not ex-posed). Fig. 13 shows the distribution of the number ofnamespaces per device. By analyzing Campus 1 data in dif-ferent dates, it is possible to conclude that the number ofnamespaces per device is not stationary and has a slightlyincreasing trend. Fig. 13 was built considering the last ob-served number of namespaces on each device in our datasets.In both networks the number of users with only 1
namespace (the users’ root folder) is small: 13% inCampus 1 and 28% in Home 1 . In general, users inCampus 1 have more namespaces than in Home 1 . Thepercentage of users having 5 or more namespaces is equal to50% in the former, and 23% in the latter. When consider-ing only IP addresses assigned to workstations in Campus 1 ,each device has on average 3.86 namespaces.
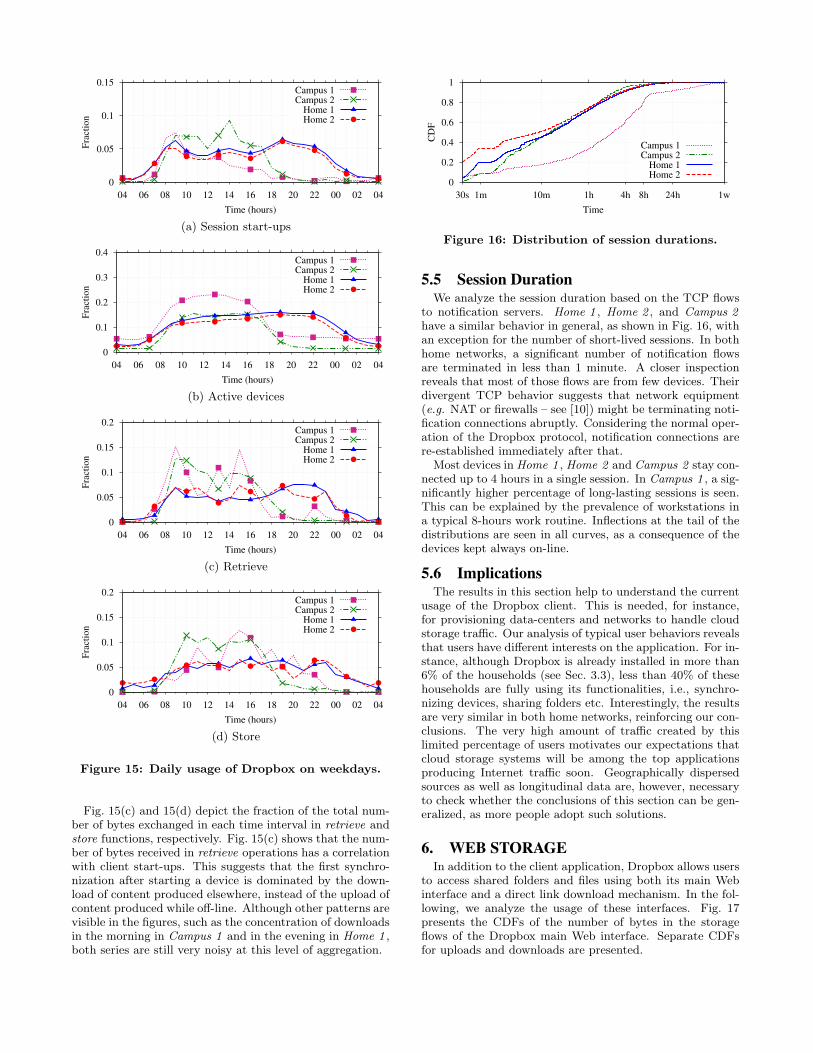
5.4 Daily UsageWe characterize whether the use of the Dropbox client has
any typical seasonality. Fig. 14 shows the time series of thenumber of distinct devices starting up a Dropbox session ineach vantage point per day. The time series are normalizedby the total number of devices in each dataset. Around 40%
0
0.2
0.4
0.6
0.8
1
1 2 4 6 8 10 12 14
CD
F
Number of namespaces
Campus 1Home 1
Figure 13: Number of namespaces per device.
0
0.2
0.4
0.6
0.8
24/03 31/03 07/04 14/04 21/04 28/04 05/05
Fra
ctio
n
Date
Campus 1Campus 2
Home 1Home 2
Figure 14: Distinct device start-ups per day – frac-
tion of the number of devices in each probe.
of all devices start at least one session every day in homenetworks, including weekends.10 In campus networks, onthe other hand, there is a strong weekly seasonality.
At a finer time scale (1 hour bins), we observe that theservice usage follows a clear day-night pattern. Fig. 15 de-picts the daily usage of the Dropbox client. All plots wereproduced by averaging the quantities per interval across allworking days in our datasets.
Fig. 15(a) shows the fraction of distinct devices thatstart a session in each interval, while Fig. 15(b) depicts thefraction of devices that are active (i.e., are connected toDropbox) per time interval. From these figures we can seethat Dropbox usage varies strongly in different locations,following the presence of users in the environment. For in-stance, in Campus 1 , session start-ups have a clear relationwith employees’ office hours. Session start-ups are betterdistributed during the day in Campus 2 as a consequenceof the transit of students at wireless access points. In homenetworks, peaks of start-ups are seen early in the morningand during the evenings. Overall, all time series of activedevices (Fig. 15(b)) are smooth, showing that the numberof active users at any time of the day is easily predictable.
10Note the exceptions around holidays in April and May.
0
0.05
0.1
0.15
04 06 08 10 12 14 16 18 20 22 00 02 04
Fra
ctio
n
Time (hours)
Campus 1Campus 2
Home 1Home 2
(a) Session start-ups
0
0.1
0.2
0.3
0.4
04 06 08 10 12 14 16 18 20 22 00 02 04
Fra
ctio
n
Time (hours)
Campus 1Campus 2
Home 1Home 2
(b) Active devices
0
0.05
0.1
0.15
0.2
04 06 08 10 12 14 16 18 20 22 00 02 04
Fra
ctio
n
Time (hours)
Campus 1Campus 2
Home 1Home 2
(c) Retrieve
0
0.05
0.1
0.15
0.2
04 06 08 10 12 14 16 18 20 22 00 02 04
Fra
ctio
n
Time (hours)
Campus 1Campus 2
Home 1Home 2
(d) Store
Figure 15: Daily usage of Dropbox on weekdays.
Fig. 15(c) and 15(d) depict the fraction of the total num-ber of bytes exchanged in each time interval in retrieve andstore functions, respectively. Fig. 15(c) shows that the num-ber of bytes received in retrieve operations has a correlationwith client start-ups. This suggests that the first synchro-nization after starting a device is dominated by the down-load of content produced elsewhere, instead of the upload ofcontent produced while off-line. Although other patterns arevisible in the figures, such as the concentration of downloadsin the morning in Campus 1 and in the evening in Home 1 ,both series are still very noisy at this level of aggregation.
0
0.2
0.4
0.6
0.8
1
30s 1m 10m 1h 4h 8h 24h 1w
CD
F
Time
Campus 1Campus 2
Home 1Home 2
Figure 16: Distribution of session durations.
5.5 Session DurationWe analyze the session duration based on the TCP flows
to notification servers. Home 1 , Home 2 , and Campus 2
have a similar behavior in general, as shown in Fig. 16, withan exception for the number of short-lived sessions. In bothhome networks, a significant number of notification flowsare terminated in less than 1 minute. A closer inspectionreveals that most of those flows are from few devices. Theirdivergent TCP behavior suggests that network equipment(e.g. NAT or firewalls – see [10]) might be terminating noti-fication connections abruptly. Considering the normal oper-ation of the Dropbox protocol, notification connections arere-established immediately after that.
Most devices in Home 1 , Home 2 and Campus 2 stay con-nected up to 4 hours in a single session. In Campus 1 , a sig-nificantly higher percentage of long-lasting sessions is seen.This can be explained by the prevalence of workstations ina typical 8-hours work routine. Inflections at the tail of thedistributions are seen in all curves, as a consequence of thedevices kept always on-line.
5.6 ImplicationsThe results in this section help to understand the current
usage of the Dropbox client. This is needed, for instance,for provisioning data-centers and networks to handle cloudstorage traffic. Our analysis of typical user behaviors revealsthat users have different interests on the application. For in-stance, although Dropbox is already installed in more than6% of the households (see Sec. 3.3), less than 40% of thesehouseholds are fully using its functionalities, i.e., synchro-nizing devices, sharing folders etc. Interestingly, the resultsare very similar in both home networks, reinforcing our con-clusions. The very high amount of traffic created by thislimited percentage of users motivates our expectations thatcloud storage systems will be among the top applicationsproducing Internet traffic soon. Geographically dispersedsources as well as longitudinal data are, however, necessaryto check whether the conclusions of this section can be gen-eralized, as more people adopt such solutions.
6. WEB STORAGEIn addition to the client application, Dropbox allows users
to access shared folders and files using both its main Webinterface and a direct link download mechanism. In the fol-lowing, we analyze the usage of these interfaces. Fig. 17presents the CDFs of the number of bytes in the storageflows of the Dropbox main Web interface. Separate CDFsfor uploads and downloads are presented.
0
0.2
0.4
0.6
0.8
1
100 1k 10k 100k
CD
F
Size (bytes)
Upload
0
0.2
0.4
0.6
0.8
1
1k 10k 100k 1M 10M
Size (bytes)
Download
Campus 1Campus 2
Home 1Home 2
Figure 17: Storage via the main Web interface.
0
0.2
0.4
0.6
0.8
1
100 1k 10k 100k 1M 10M 100M
CD
F
Download (bytes)
Campus 1Home 1Home 2
Figure 18: Size of direct link downloads.
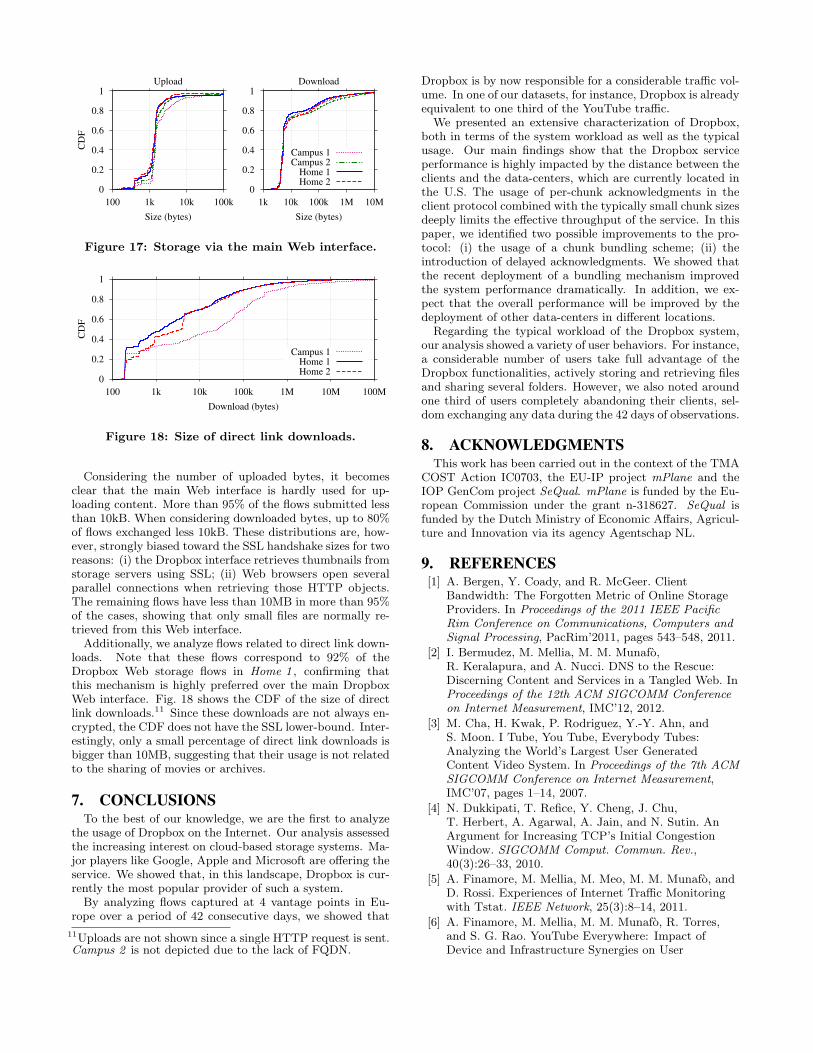
Considering the number of uploaded bytes, it becomesclear that the main Web interface is hardly used for up-loading content. More than 95% of the flows submitted lessthan 10kB. When considering downloaded bytes, up to 80%of flows exchanged less 10kB. These distributions are, how-ever, strongly biased toward the SSL handshake sizes for tworeasons: (i) the Dropbox interface retrieves thumbnails fromstorage servers using SSL; (ii) Web browsers open severalparallel connections when retrieving those HTTP objects.The remaining flows have less than 10MB in more than 95%of the cases, showing that only small files are normally re-trieved from this Web interface.Additionally, we analyze flows related to direct link down-
loads. Note that these flows correspond to 92% of theDropbox Web storage flows in Home 1 , confirming thatthis mechanism is highly preferred over the main DropboxWeb interface. Fig. 18 shows the CDF of the size of directlink downloads.11 Since these downloads are not always en-crypted, the CDF does not have the SSL lower-bound. Inter-estingly, only a small percentage of direct link downloads isbigger than 10MB, suggesting that their usage is not relatedto the sharing of movies or archives.
7. CONCLUSIONSTo the best of our knowledge, we are the first to analyze
the usage of Dropbox on the Internet. Our analysis assessedthe increasing interest on cloud-based storage systems. Ma-jor players like Google, Apple and Microsoft are offering theservice. We showed that, in this landscape, Dropbox is cur-rently the most popular provider of such a system.By analyzing flows captured at 4 vantage points in Eu-
rope over a period of 42 consecutive days, we showed that
11Uploads are not shown since a single HTTP request is sent.Campus 2 is not depicted due to the lack of FQDN.
Dropbox is by now responsible for a considerable traffic vol-ume. In one of our datasets, for instance, Dropbox is alreadyequivalent to one third of the YouTube traffic.
We presented an extensive characterization of Dropbox,both in terms of the system workload as well as the typicalusage. Our main findings show that the Dropbox serviceperformance is highly impacted by the distance between theclients and the data-centers, which are currently located inthe U.S. The usage of per-chunk acknowledgments in theclient protocol combined with the typically small chunk sizesdeeply limits the effective throughput of the service. In thispaper, we identified two possible improvements to the pro-tocol: (i) the usage of a chunk bundling scheme; (ii) theintroduction of delayed acknowledgments. We showed thatthe recent deployment of a bundling mechanism improvedthe system performance dramatically. In addition, we ex-pect that the overall performance will be improved by thedeployment of other data-centers in different locations.
Regarding the typical workload of the Dropbox system,our analysis showed a variety of user behaviors. For instance,a considerable number of users take full advantage of theDropbox functionalities, actively storing and retrieving filesand sharing several folders. However, we also noted aroundone third of users completely abandoning their clients, sel-dom exchanging any data during the 42 days of observations.
8. ACKNOWLEDGMENTSThis work has been carried out in the context of the TMA
COST Action IC0703, the EU-IP project mPlane and theIOP GenCom project SeQual. mPlane is funded by the Eu-ropean Commission under the grant n-318627. SeQual isfunded by the Dutch Ministry of Economic Affairs, Agricul-ture and Innovation via its agency Agentschap NL.
9. REFERENCES[1] A. Bergen, Y. Coady, and R. McGeer. Client
Bandwidth: The Forgotten Metric of Online StorageProviders. In Proceedings of the 2011 IEEE Pacific
Rim Conference on Communications, Computers and
Signal Processing, PacRim’2011, pages 543–548, 2011.
[2] I. Bermudez, M. Mellia, M. M. Munafo,R. Keralapura, and A. Nucci. DNS to the Rescue:Discerning Content and Services in a Tangled Web. InProceedings of the 12th ACM SIGCOMM Conference
on Internet Measurement, IMC’12, 2012.
[3] M. Cha, H. Kwak, P. Rodriguez, Y.-Y. Ahn, andS. Moon. I Tube, You Tube, Everybody Tubes:Analyzing the World’s Largest User GeneratedContent Video System. In Proceedings of the 7th ACM
SIGCOMM Conference on Internet Measurement,IMC’07, pages 1–14, 2007.
[4] N. Dukkipati, T. Refice, Y. Cheng, J. Chu,T. Herbert, A. Agarwal, A. Jain, and N. Sutin. AnArgument for Increasing TCP’s Initial CongestionWindow. SIGCOMM Comput. Commun. Rev.,40(3):26–33, 2010.
[5] A. Finamore, M. Mellia, M. Meo, M. M. Munafo, andD. Rossi. Experiences of Internet Traffic Monitoringwith Tstat. IEEE Network, 25(3):8–14, 2011.
[6] A. Finamore, M. Mellia, M. M. Munafo, R. Torres,and S. G. Rao. YouTube Everywhere: Impact ofDevice and Infrastructure Synergies on User
Experience. In Proceedings of the 11th ACM
SIGCOMM Conference on Internet Measurement,IMC’11, pages 345–360, 2011.
[7] M. Gjoka, M. Sirivianos, A. Markopoulou, andX. Yang. Poking Facebook: Characterization of OSNApplications. In Proceedings of the First Workshop on
Online Social Networks, WOSN’08, pages 31–36, 2008.
[8] S. Halevi, D. Harnik, B. Pinkas, andA. Shulman-Peleg. Proofs of Ownership in RemoteStorage Systems. In Proceedings of the 18th ACM
Conference on Computer and Communications
Security, CCS’11, pages 491–500, 2011.
[9] D. Harnik, B. Pinkas, and A. Shulman-Peleg. SideChannels in Cloud Services: Deduplication in CloudStorage. IEEE Security and Privacy, 8(6):40–47, 2010.
[10] S. Hatonen, A. Nyrhinen, L. Eggert, S. Strowes,P. Sarolahti, and M. Kojo. An Experimental Study ofHome Gateway Characteristics. In Proceedings of the
10th ACM SIGCOMM Conference on Internet
Measurement, IMC’10, pages 260–266, 2010.
[11] W. Hu, T. Yang, and J. N. Matthews. The Good, theBad and the Ugly of Consumer Cloud Storage. ACMSIGOPS Operating Systems Review, 44(3):110–115,2010.
[12] A. Lenk, M. Klems, J. Nimis, S. Tai, andT. Sandholm. What’s Inside the Cloud? AnArchitectural Map of the Cloud Landscape. InProceedings of the 2009 ICSE Workshop on Software
Engineering Challenges of Cloud Computing,CLOUD’09, pages 23–31, 2009.
[13] A. Li, X. Yang, S. Kandula, and M. Zhang.CloudCmp: Comparing Public Cloud Providers. InProceedings of the 10th ACM SIGCOMM Conference
on Internet Measurement, IMC’10, pages 1–14, 2010.
[14] M. Mellia, M. Meo, L. Muscariello, and D. Rossi.Passive Analysis of TCP Anomalies. Computer
Networks, 52(14):2663–2676, 2008.
[15] A. Mislove, M. Marcon, K. P. Gummadi, P. Druschel,and B. Bhattacharjee. Measurement and Analysis ofOnline Social Networks. In Proceedings of the 7th
ACM SIGCOMM Conference on Internet
Measurement, IMC’07, pages 29–42, 2007.
[16] M. Mulazzani, S. Schrittwieser, M. Leithner,M. Huber, and E. Weippl. Dark Clouds on theHorizon: Using Cloud Storage as Attack Vector andOnline Slack Space. In Proceedings of the 20th
USENIX Conference on Security, SEC’11, 2011.
[17] G. Wang and T. E. Ng. The Impact of Virtualizationon Network Performance of Amazon EC2 DataCenter. In Proceedings of the 29th IEEE INFOCOM,pages 1–9, 2010.
[18] Q. Zhang, L. Cheng, and R. Boutaba. CloudComputing: State-of-the-Art and ResearchChallenges. Journal of Internet Services and
Applications, 1:7–18, 2010.
[19] M. Zhou, R. Zhang, W. Xie, W. Qian, and A. Zhou.Security and Privacy in Cloud Computing: A Survey.In Sixth International Conference on Semantics
Knowledge and Grid, SKG’10, pages 105–112, 2010.
≈≈
ACK + SSL_server_hello
SYN
SYN/ACK
ACK + SSL_client_hello
SSL_server_hello (PSH)
ACKs
ACK + SSL_cipher_spec
ACK +
SSL_cipher_spec (PSH)
Data
Data
RST
HTTP_OK (PSH)
HTTP_OK (PSH)
SSL_alert (PSH) +
FIN/ACK
ACKs
∆t
TstatClient Amazon
60
s
ACK
(a) Store
≈≈
ACK + SSL_server_hello
SYN
SYN/ACK
ACK +
SSL_client_hello (PSH)
SSL_server_hello
ACKs
ACK +
SSL_cipher_spec (PSH)
ACK + SSL_cipher_spec
HTTP_retrieve (2 x PSH)
HTTP_retrieve (2 x PSH)
RST
Data
Data
SSL_alert + FIN/ACK
ACKs
∆t
TstatClient Amazon
60
s
ACK
(b) Retrieve
Figure 19: Typical flows in storage operations.
APPENDIX
A. STORAGE TRAFFIC IN DETAILS
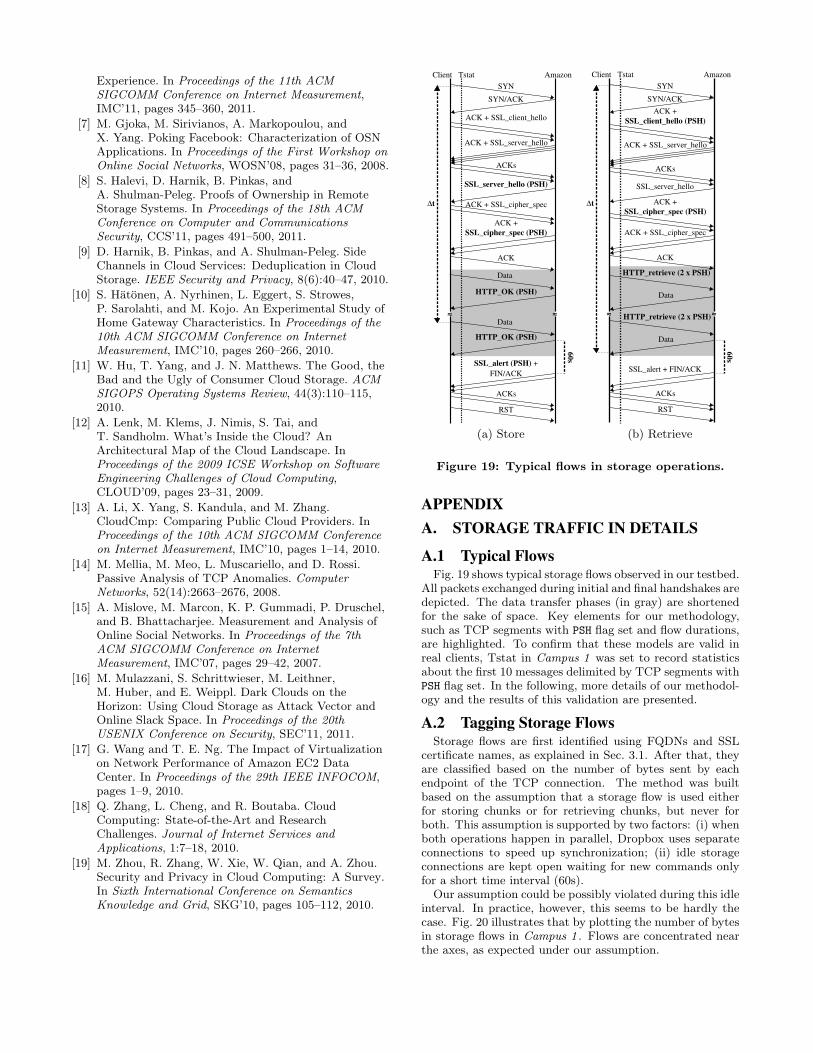
A.1 Typical FlowsFig. 19 shows typical storage flows observed in our testbed.
All packets exchanged during initial and final handshakes aredepicted. The data transfer phases (in gray) are shortenedfor the sake of space. Key elements for our methodology,such as TCP segments with PSH flag set and flow durations,are highlighted. To confirm that these models are valid inreal clients, Tstat in Campus 1 was set to record statisticsabout the first 10 messages delimited by TCP segments withPSH flag set. In the following, more details of our methodol-ogy and the results of this validation are presented.
A.2 Tagging Storage FlowsStorage flows are first identified using FQDNs and SSL
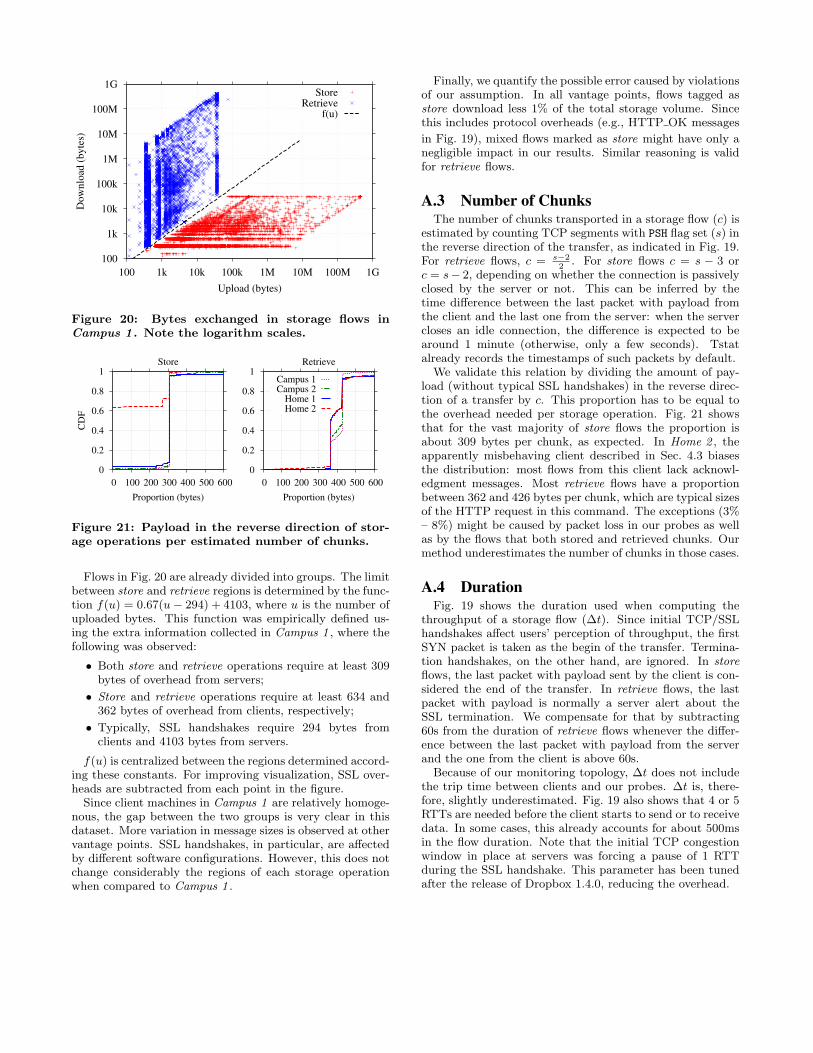
certificate names, as explained in Sec. 3.1. After that, theyare classified based on the number of bytes sent by eachendpoint of the TCP connection. The method was builtbased on the assumption that a storage flow is used eitherfor storing chunks or for retrieving chunks, but never forboth. This assumption is supported by two factors: (i) whenboth operations happen in parallel, Dropbox uses separateconnections to speed up synchronization; (ii) idle storageconnections are kept open waiting for new commands onlyfor a short time interval (60s).
Our assumption could be possibly violated during this idleinterval. In practice, however, this seems to be hardly thecase. Fig. 20 illustrates that by plotting the number of bytesin storage flows in Campus 1 . Flows are concentrated nearthe axes, as expected under our assumption.
100
1k
10k
100k
1M
10M
100M
1G
100 1k 10k 100k 1M 10M 100M 1G
Dow
nlo
ad (
byte
s)
Upload (bytes)
StoreRetrieve
f(u)
Figure 20: Bytes exchanged in storage flows in
Campus 1 . Note the logarithm scales.
0
0.2
0.4
0.6
0.8
1
0 100 200 300 400 500 600
CD
F
Proportion (bytes)
Store
0
0.2
0.4
0.6
0.8
1
0 100 200 300 400 500 600
Proportion (bytes)
Retrieve
Campus 1Campus 2
Home 1Home 2
Figure 21: Payload in the reverse direction of stor-
age operations per estimated number of chunks.
Flows in Fig. 20 are already divided into groups. The limitbetween store and retrieve regions is determined by the func-tion f(u) = 0.67(u− 294) + 4103, where u is the number ofuploaded bytes. This function was empirically defined us-ing the extra information collected in Campus 1 , where thefollowing was observed:
• Both store and retrieve operations require at least 309bytes of overhead from servers;
• Store and retrieve operations require at least 634 and362 bytes of overhead from clients, respectively;
• Typically, SSL handshakes require 294 bytes fromclients and 4103 bytes from servers.
f(u) is centralized between the regions determined accord-ing these constants. For improving visualization, SSL over-heads are subtracted from each point in the figure.Since client machines in Campus 1 are relatively homoge-
nous, the gap between the two groups is very clear in thisdataset. More variation in message sizes is observed at othervantage points. SSL handshakes, in particular, are affectedby different software configurations. However, this does notchange considerably the regions of each storage operationwhen compared to Campus 1 .
Finally, we quantify the possible error caused by violationsof our assumption. In all vantage points, flows tagged asstore download less 1% of the total storage volume. Sincethis includes protocol overheads (e.g., HTTP OK messages
in Fig. 19), mixed flows marked as store might have only anegligible impact in our results. Similar reasoning is validfor retrieve flows.
A.3 Number of ChunksThe number of chunks transported in a storage flow (c) is
estimated by counting TCP segments with PSH flag set (s) inthe reverse direction of the transfer, as indicated in Fig. 19.For retrieve flows, c = s−2
2. For store flows c = s − 3 or
c = s− 2, depending on whether the connection is passivelyclosed by the server or not. This can be inferred by thetime difference between the last packet with payload fromthe client and the last one from the server: when the servercloses an idle connection, the difference is expected to bearound 1 minute (otherwise, only a few seconds). Tstatalready records the timestamps of such packets by default.
We validate this relation by dividing the amount of pay-load (without typical SSL handshakes) in the reverse direc-tion of a transfer by c. This proportion has to be equal tothe overhead needed per storage operation. Fig. 21 showsthat for the vast majority of store flows the proportion isabout 309 bytes per chunk, as expected. In Home 2 , theapparently misbehaving client described in Sec. 4.3 biasesthe distribution: most flows from this client lack acknowl-edgment messages. Most retrieve flows have a proportionbetween 362 and 426 bytes per chunk, which are typical sizesof the HTTP request in this command. The exceptions (3%– 8%) might be caused by packet loss in our probes as wellas by the flows that both stored and retrieved chunks. Ourmethod underestimates the number of chunks in those cases.
A.4 DurationFig. 19 shows the duration used when computing the
throughput of a storage flow (∆t). Since initial TCP/SSLhandshakes affect users’ perception of throughput, the firstSYN packet is taken as the begin of the transfer. Termina-tion handshakes, on the other hand, are ignored. In store
flows, the last packet with payload sent by the client is con-sidered the end of the transfer. In retrieve flows, the lastpacket with payload is normally a server alert about theSSL termination. We compensate for that by subtracting60s from the duration of retrieve flows whenever the differ-ence between the last packet with payload from the serverand the one from the client is above 60s.
Because of our monitoring topology, ∆t does not includethe trip time between clients and our probes. ∆t is, there-fore, slightly underestimated. Fig. 19 also shows that 4 or 5RTTs are needed before the client starts to send or to receivedata. In some cases, this already accounts for about 500msin the flow duration. Note that the initial TCP congestionwindow in place at servers was forcing a pause of 1 RTTduring the SSL handshake. This parameter has been tunedafter the release of Dropbox 1.4.0, reducing the overhead.


![An Empirical Analysis of a Large-scale Mobile Cloud ...IMC'16] Mobile Cloud Storage… · mobile users. For instance, Dropbox redesigned its mobile app, adding new functionality,](https://img.pdfslide.net/doc/110x75/5fa118be364e240ffe704245/an-empirical-analysis-of-a-large-scale-mobile-cloud-imc16-mobile-cloud-storage.jpg)