Embed Size (px)
Citation preview
Insightful Visualizations ofNational Researcher Networking Data
Katy Börner Cyberinfrastructure for Network Science Center, DirectorInformation Visualization Laboratory, DirectorSchool of Library and Information ScienceIndiana University, Bloomington, [email protected]
With special thanks to the members at the Cyberinfrastructure for Network Science Center, the Sci2 team, and the VIVO Collaboration
VIVO Conference, Washington, D.C.
August 26, 2011
Börner: Insightful Visualizations of National Researcher Networking Data 2
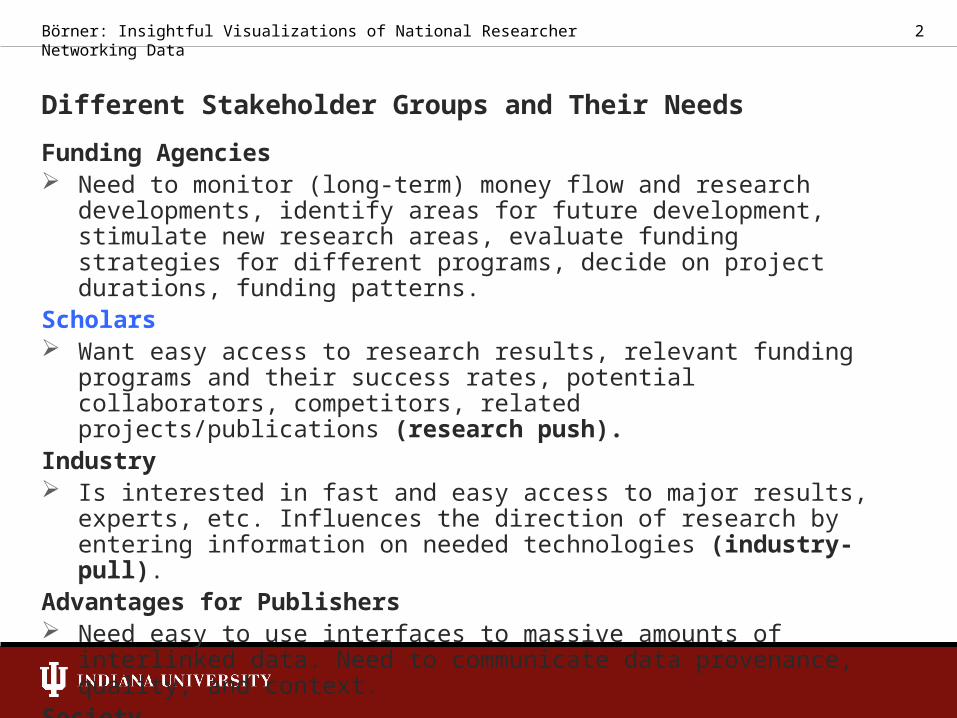
Different Stakeholder Groups and Their Needs
Funding Agencies Need to monitor (long-term) money flow and research
developments, identify areas for future development, stimulate new research areas, evaluate funding strategies for different programs, decide on project durations, funding patterns.
Scholars Want easy access to research results, relevant funding programs
and their success rates, potential collaborators, competitors, related projects/publications (research push).
Industry Is interested in fast and easy access to major results, experts, etc.
Influences the direction of research by entering information on needed technologies (industry-pull).
Advantages for Publishers Need easy to use interfaces to massive amounts of interlinked
data. Need to communicate data provenance, quality, and context.
Society Needs easy access to scientific knowledge and expertise.
3
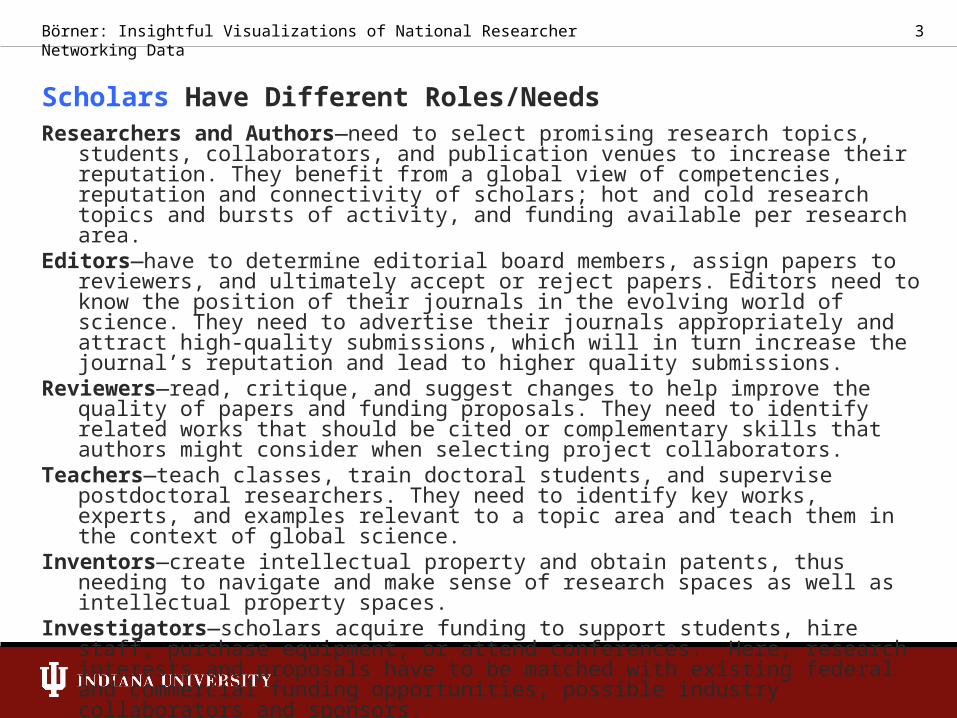
Scholars Have Different Roles/NeedsResearchers and Authors—need to select promising research topics, students,
collaborators, and publication venues to increase their reputation. They benefit from a global view of competencies, reputation and connectivity of scholars; hot and cold research topics and bursts of activity, and funding available per research area.
Editors—have to determine editorial board members, assign papers to reviewers, and ultimately accept or reject papers. Editors need to know the position of their journals in the evolving world of science. They need to advertise their journals appropriately and attract high-quality submissions, which will in turn increase the journal’s reputation and lead to higher quality submissions.
Reviewers—read, critique, and suggest changes to help improve the quality of papers and funding proposals. They need to identify related works that should be cited or complementary skills that authors might consider when selecting project collaborators.
Teachers—teach classes, train doctoral students, and supervise postdoctoral researchers. They need to identify key works, experts, and examples relevant to a topic area and teach them in the context of global science.
Inventors—create intellectual property and obtain patents, thus needing to navigate and make sense of research spaces as well as intellectual property spaces.
Investigators—scholars acquire funding to support students, hire staff, purchase equipment, or attend conferences. Here, research interests and proposals have to be matched with existing federal and commercial funding opportunities, possible industry collaborators and sponsors.
Team Leads and Science Administrators—many scholars direct multiple research projects simultaneously. Some have full-time staff, research scientists, and technicians in their laboratories and centers. Leaders need to evaluate performance and provide references for current or previous members; report the progress of different projects to funding agencies.
Börner: Insightful Visualizations of National Researcher Networking Data
4
Why Use National Researcher Networking Data?
Structured data – Easy to process by computers. Comprehensive – Not only publication but also funding,
teaching, patenting activity is captured. High quality – faculty record, funding, course data has
“touched” money. Linked to other data silos via Linked Open Data. (Inter)National – Science is a global enterprise and needs to
be studied/understood globally. Open – Anybody can access detailed data, re-run analysis.
Many NRN instances hold and expose Thomson Reuters, Elsevier, MEDLINE, NSF, NIH and other data.
Börner: Insightful Visualizations of National Researcher Networking Data
5
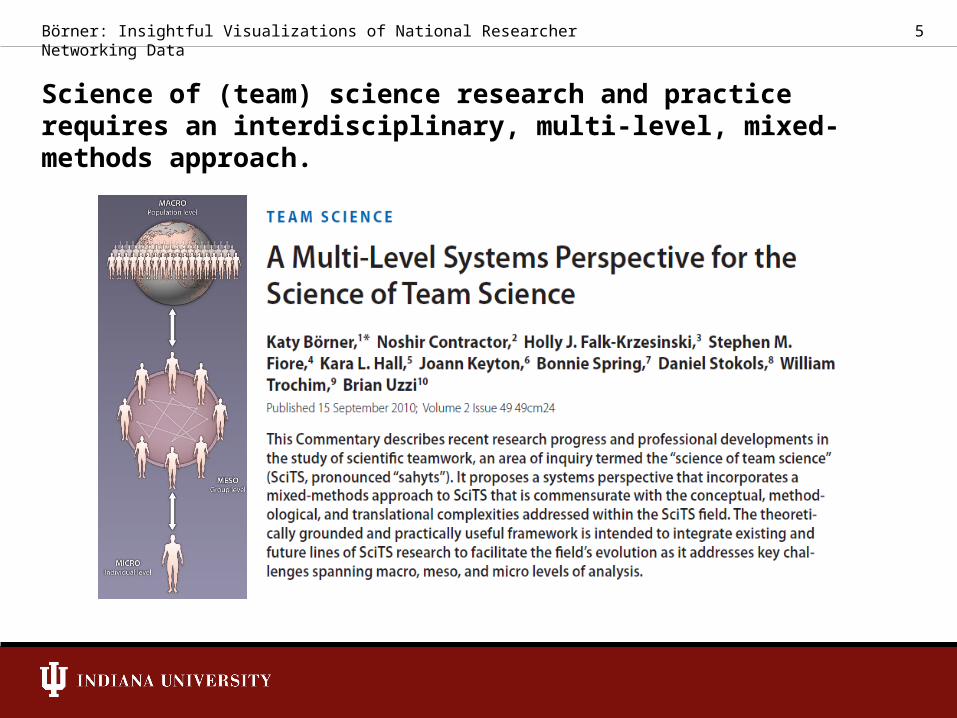
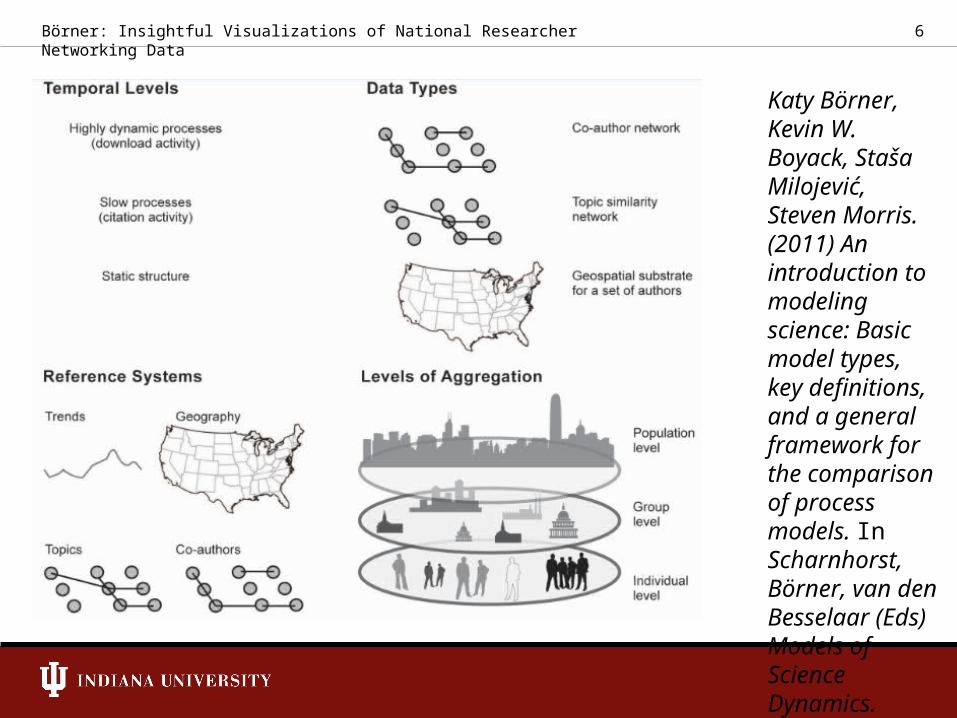
Science of (team) science research and practice requires an interdisciplinary, multi-level, mixed-methods approach.
Börner: Insightful Visualizations of National Researcher Networking Data
6
Katy Börner, Kevin W. Boyack, Staša Milojević, Steven Morris. (2011) An introduction to modeling science: Basic model types, key definitions, and a general framework for the comparison of process models. In Scharnhorst, Börner, van den Besselaar (Eds) Models of Science Dynamics. Springer Verlag.
Börner: Insightful Visualizations of National Researcher Networking Data
7
Standard VIVO Visualizations
Börner: Insightful Visualizations of National Researcher Networking Data 8
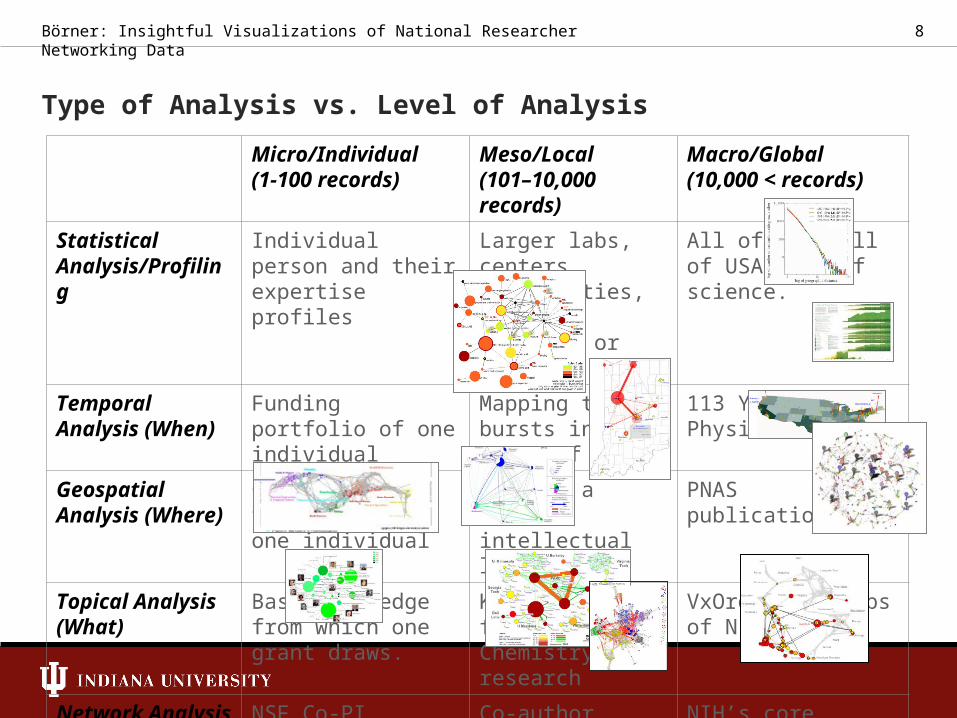
Type of Analysis vs. Level of Analysis
Micro/Individual(1-100 records)
Meso/Local(101–10,000 records)
Macro/Global(10,000 < records)
Statistical Analysis/Profiling
Individual person and their expertise profiles
Larger labs, centers, universities, research domains, or states
All of NSF, all of USA, all of science.
Temporal Analysis (When)
Funding portfolio of one individual
Mapping topic bursts in 20-years of PNAS
113 Years of Physics Research
Geospatial Analysis (Where)
Career trajectory of one individual
Mapping a states intellectual landscape
PNAS publications
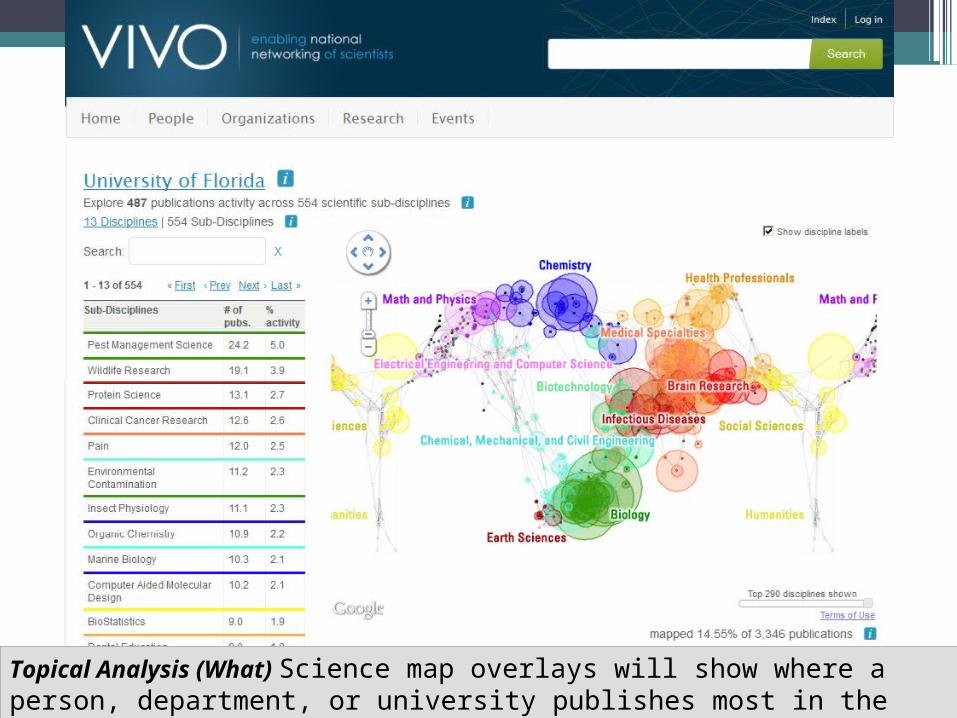
Topical Analysis (What)
Base knowledge from which one grant draws.
Knowledge flows in Chemistry research
VxOrd/Topic maps of NIH funding
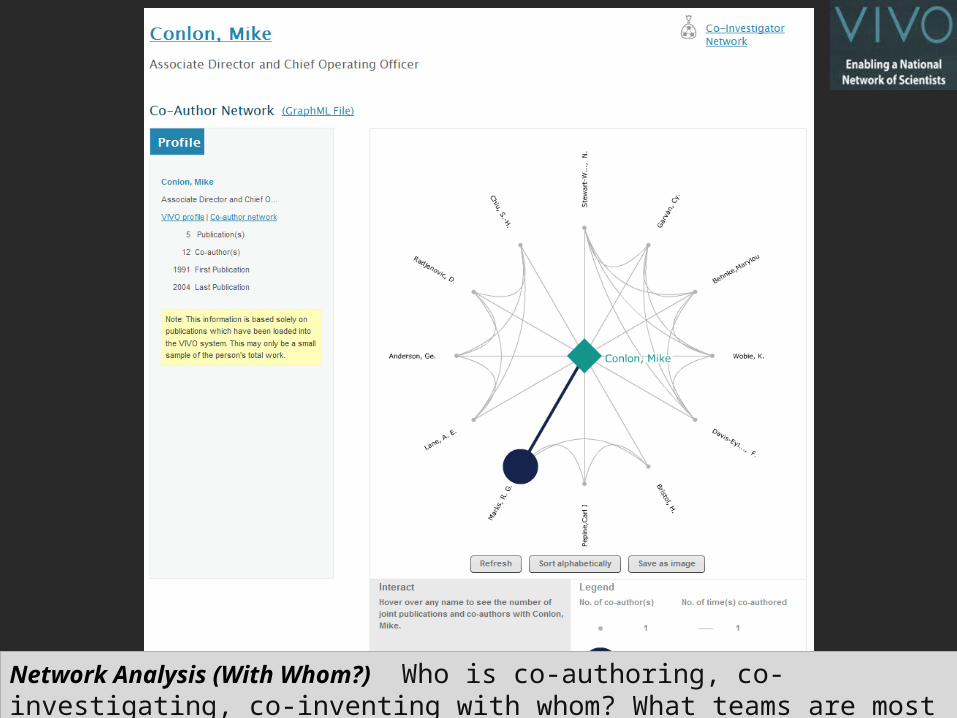
Network Analysis (With Whom?)
NSF Co-PI network of one individual
Co-author network NIH’s core competency
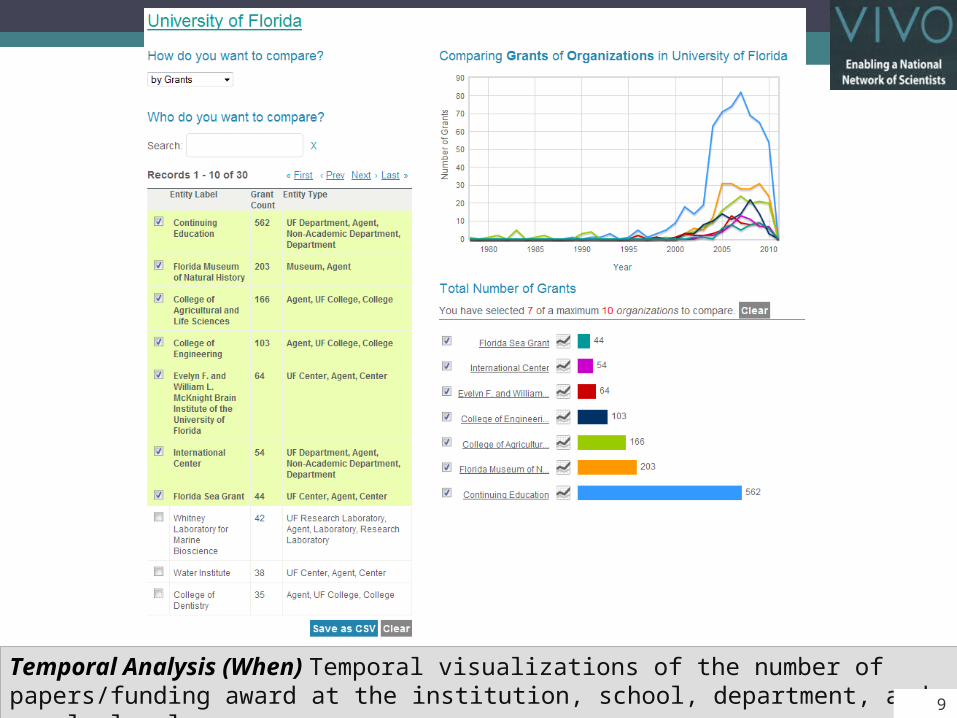
Temporal Analysis (When) Temporal visualizations of the number of papers/funding award at the institution, school, department, and people level9
10
Topical Analysis (What) Science map overlays will show where a person, department, or university publishes most in the world of science. (in work)
11
Network Analysis (With Whom?) Who is co-authoring, co-investigating, co-inventing with whom? What teams are most productive in what projects?
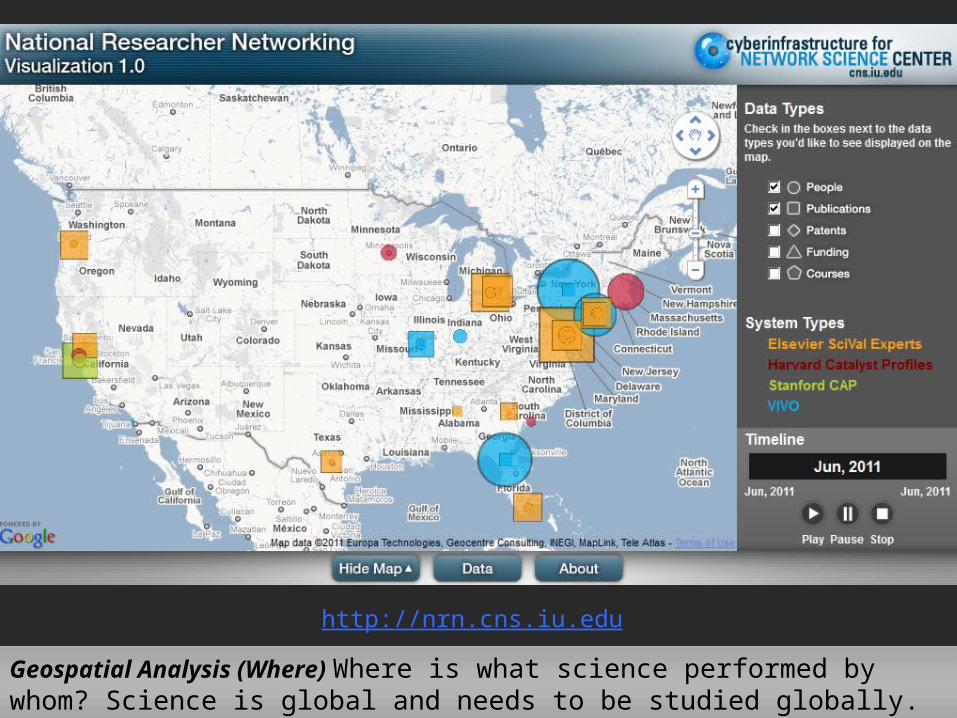
http://nrn.cns.iu.edu
Geospatial Analysis (Where) Where is what science performed by whom? Science is global and needs to be studied globally.
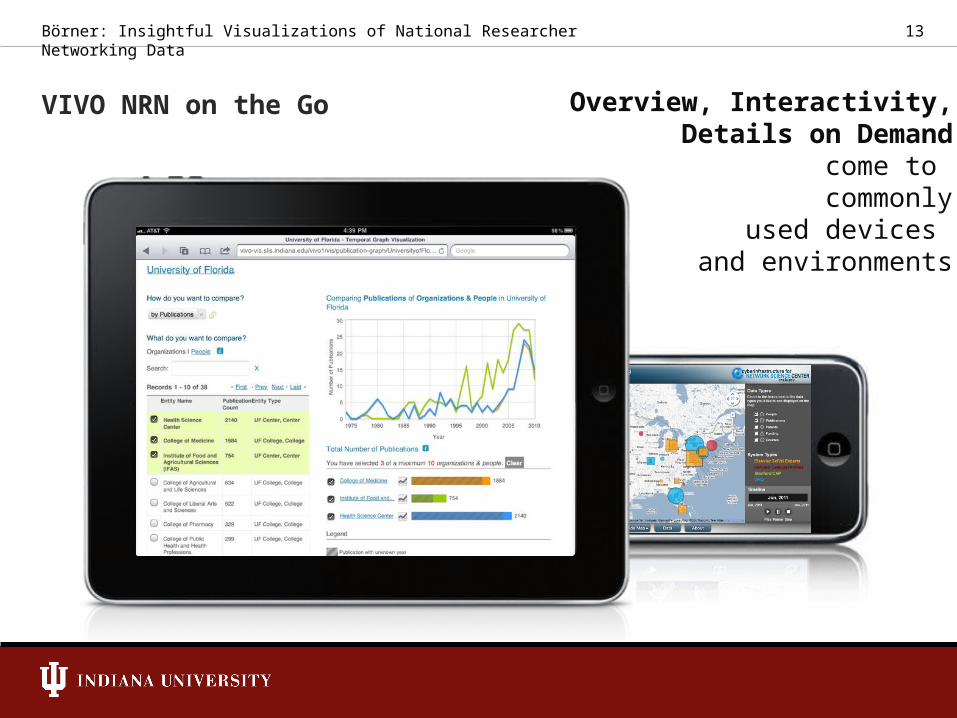
Overview, Interactivity,Details on Demand
come to commonly
used devices and environments
VIVO NRN on the Go
13Börner: Insightful Visualizations of National Researcher Networking Data
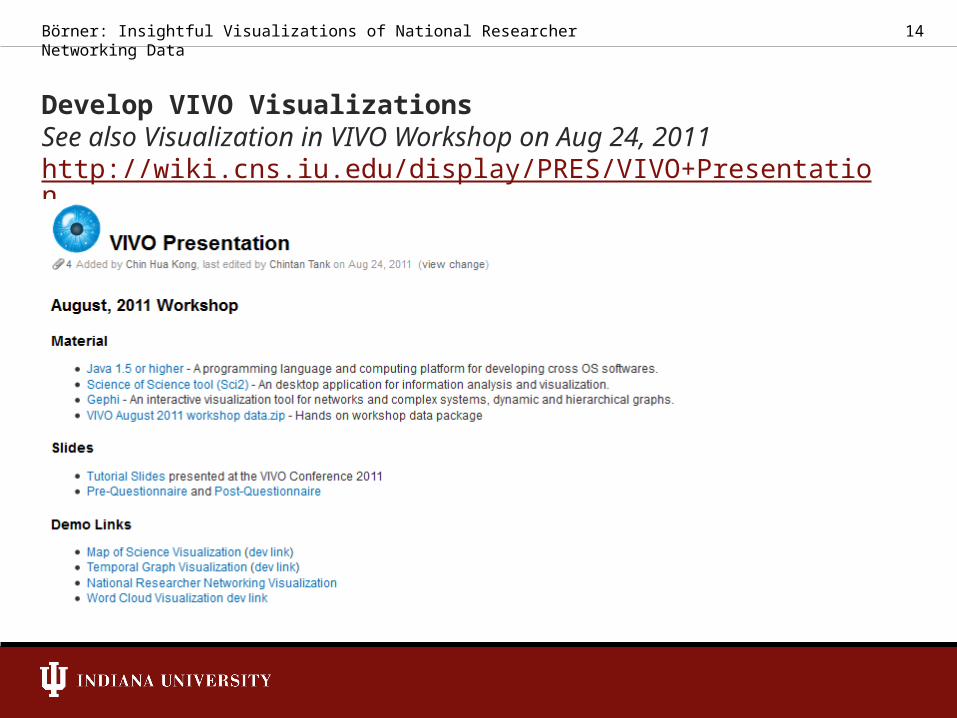
Develop VIVO VisualizationsSee also Visualization in VIVO Workshop on Aug 24, 2011http://wiki.cns.iu.edu/display/PRES/VIVO+Presentation
14Börner: Insightful Visualizations of National Researcher Networking Data
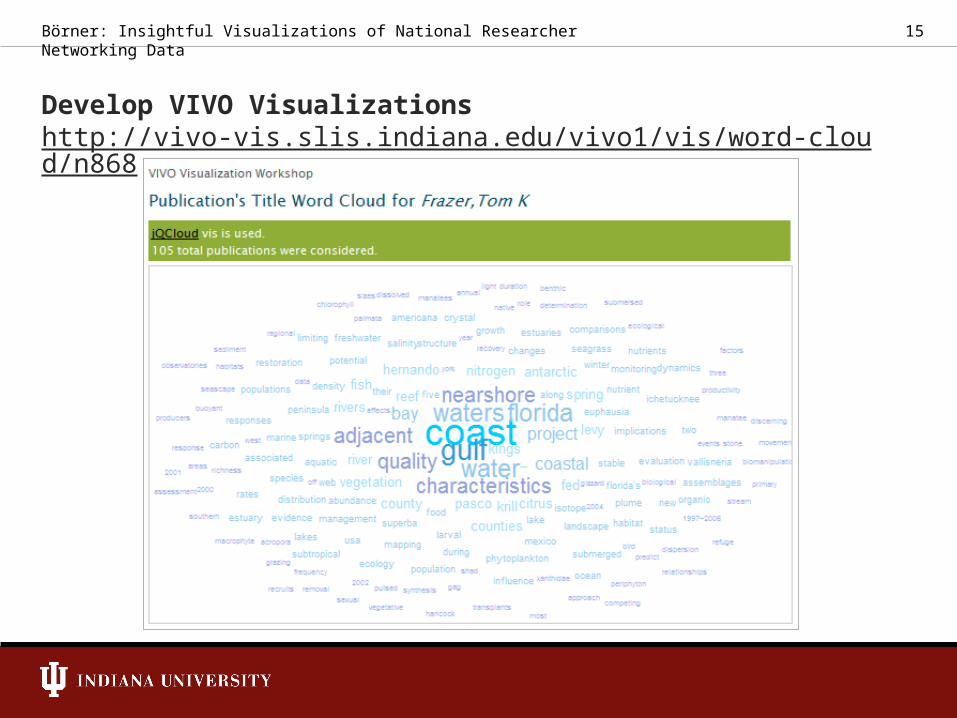
Develop VIVO Visualizationshttp://vivo-vis.slis.indiana.edu/vivo1/vis/word-cloud/n868
15Börner: Insightful Visualizations of National Researcher Networking Data
16
Custom VIVO Visualizations
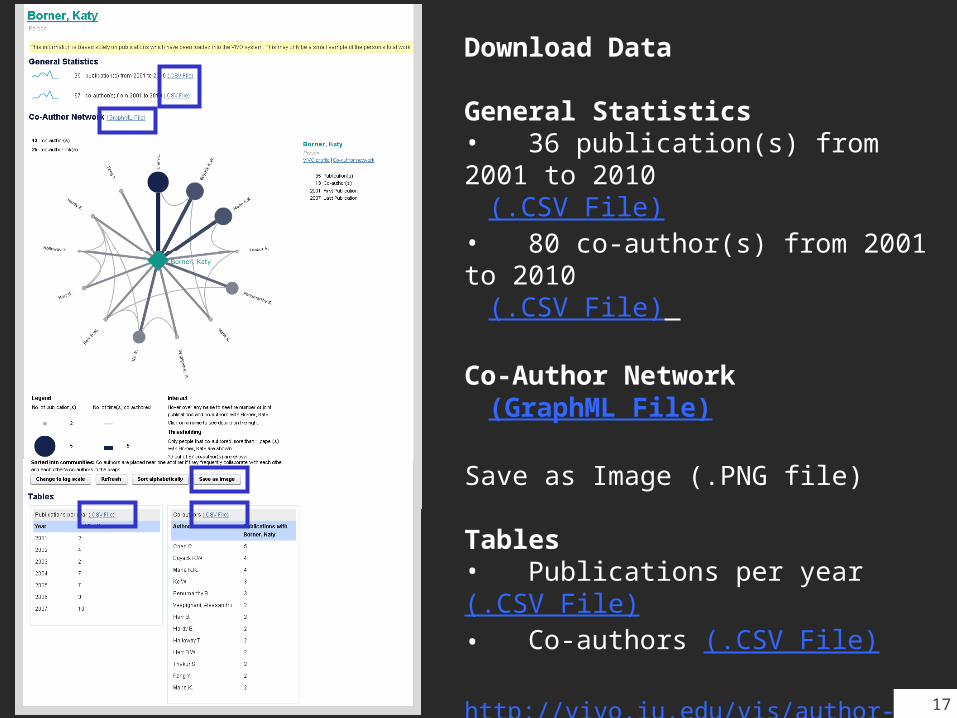
Download Data
General Statistics• 36 publication(s) from 2001 to 2010
(.CSV File) • 80 co-author(s) from 2001 to 2010
(.CSV File)
Co-Author Network(GraphML File)
Save as Image (.PNG file)
Tables• Publications per year (.CSV File)• Co-authors (.CSV File)
http://vivo.iu.edu/vis/author-network/person25557
17
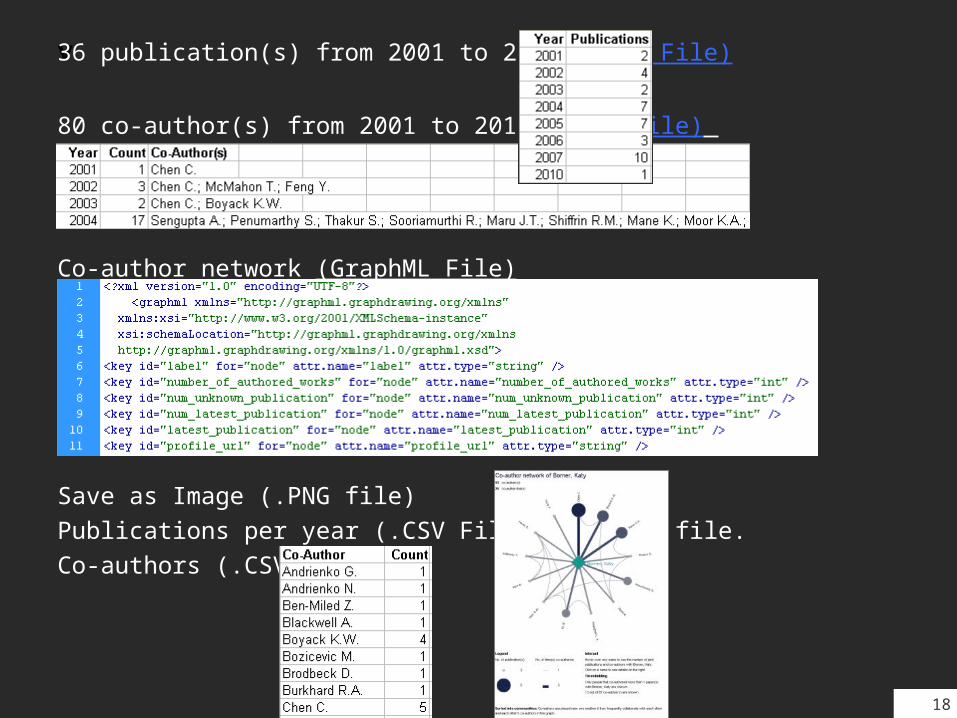
v36 publication(s) from 2001 to 2010 (.CSV File)
80 co-author(s) from 2001 to 2010 (.CSV File)
Co-author network (GraphML File)
Save as Image (.PNG file)Publications per year (.CSV File), see top file.Co-authors (.CSV File)
18
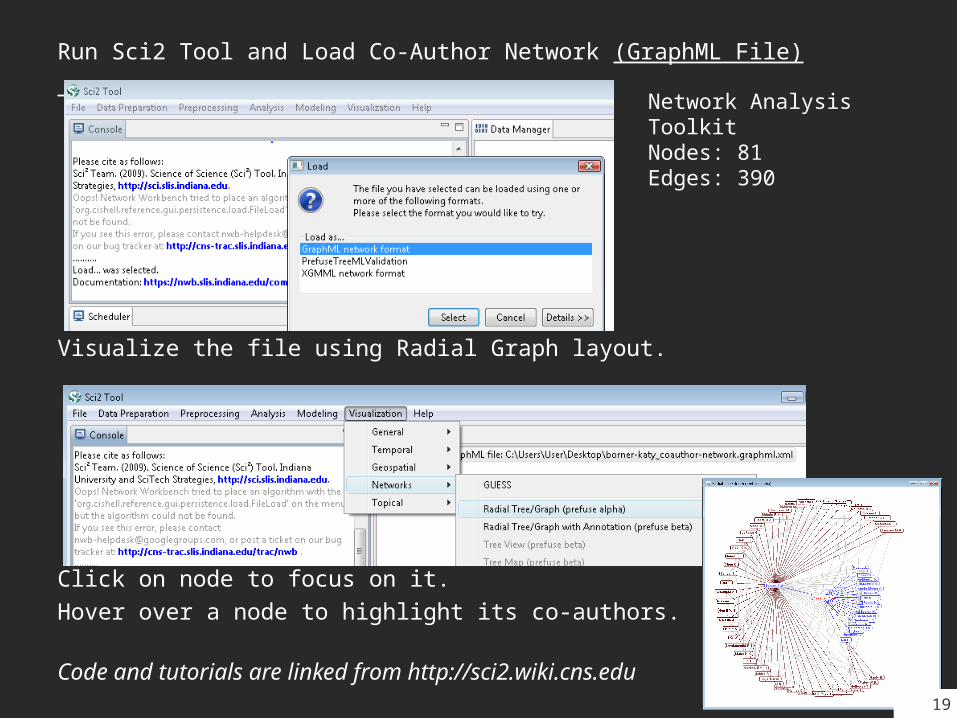
Run Sci2 Tool and Load Co-Author Network (GraphML File)
Visualize the file using Radial Graph layout.
Click on node to focus on it.Hover over a node to highlight its co-authors.
Code and tutorials are linked from http://sci2.wiki.cns.edu
Network Analysis ToolkitNodes: 81Edges: 390
19
20
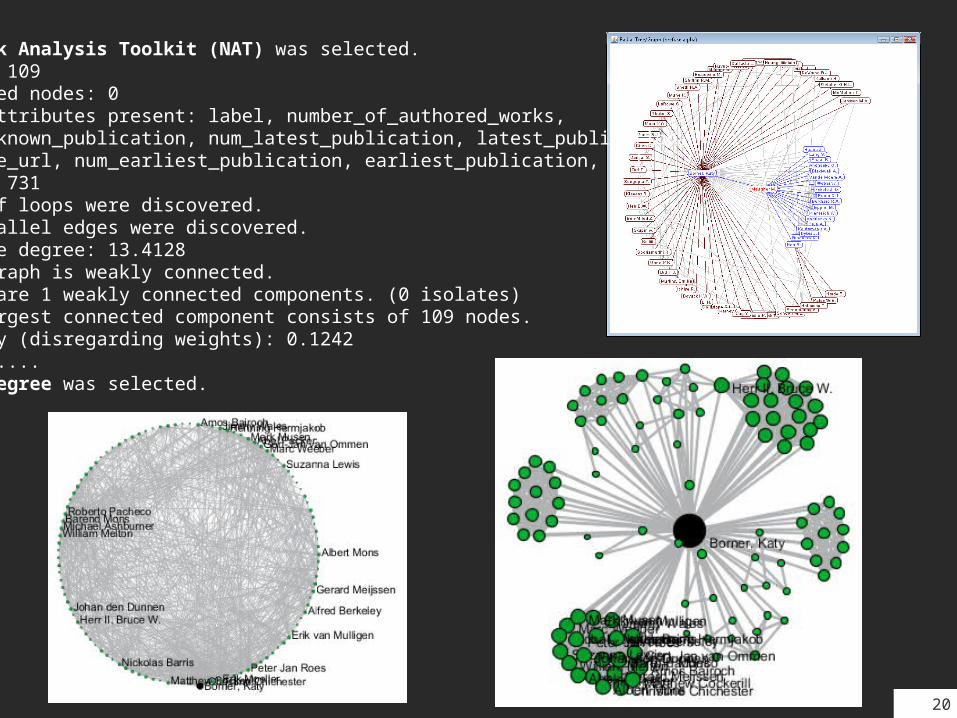
Network Analysis Toolkit (NAT) was selected.Nodes: 109Isolated nodes: 0Node attributes present: label, number_of_authored_works, num_unknown_publication, num_latest_publication, latest_publication, profile_url, num_earliest_publication, earliest_publication, urlEdges: 731No self loops were discovered.No parallel edges were discovered.Average degree: 13.4128This graph is weakly connected.There are 1 weakly connected components. (0 isolates)The largest connected component consists of 109 nodes.Density (disregarding weights): 0.1242 ..........Node Degree was selected.
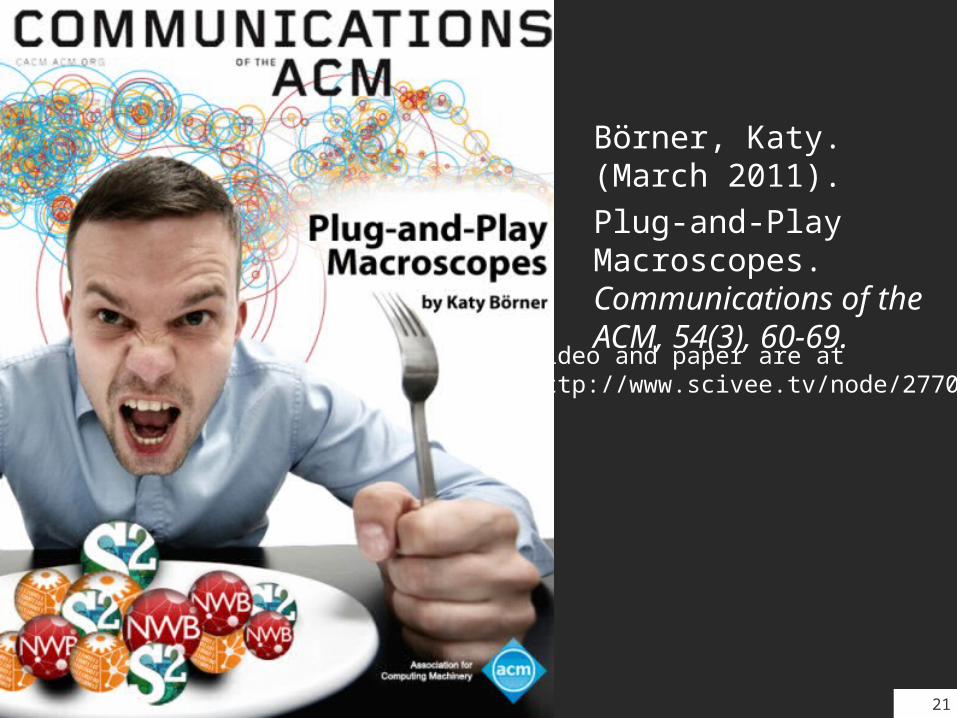
Börner, Katy. (March 2011). Plug-and-Play Macroscopes. Communications of the ACM, 54(3), 60-69.
Video and paper are athttp://www.scivee.tv/node/27704
21
Plug-and-Play Macroscopes
While microscopes and telescopes are physical instruments, macroscopes resemble continuously changing bundles of software plug-ins.
Sharing algorithm components, tools, or novel interfaces becomes as easy as sharing images on Flickr or videos on YouTube. Assembling custom tools is as quick as compiling your custom music collection.
They provide a common standard for - the design of modular, compatible algorithm and tool plug-ins - that can be easily combined into scientific workflows, and - packaged as custom tools.
Anyone can map. Anyone can replicate or advance workflows.
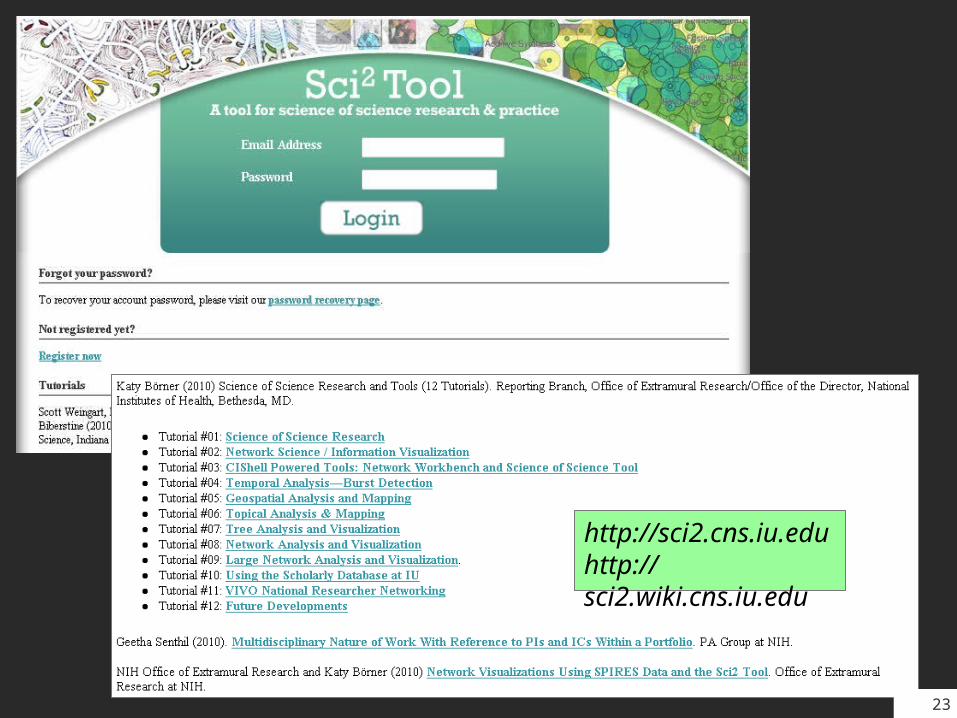
http://sci2.cns.iu.edu http://sci2.wiki.cns.iu.edu
23
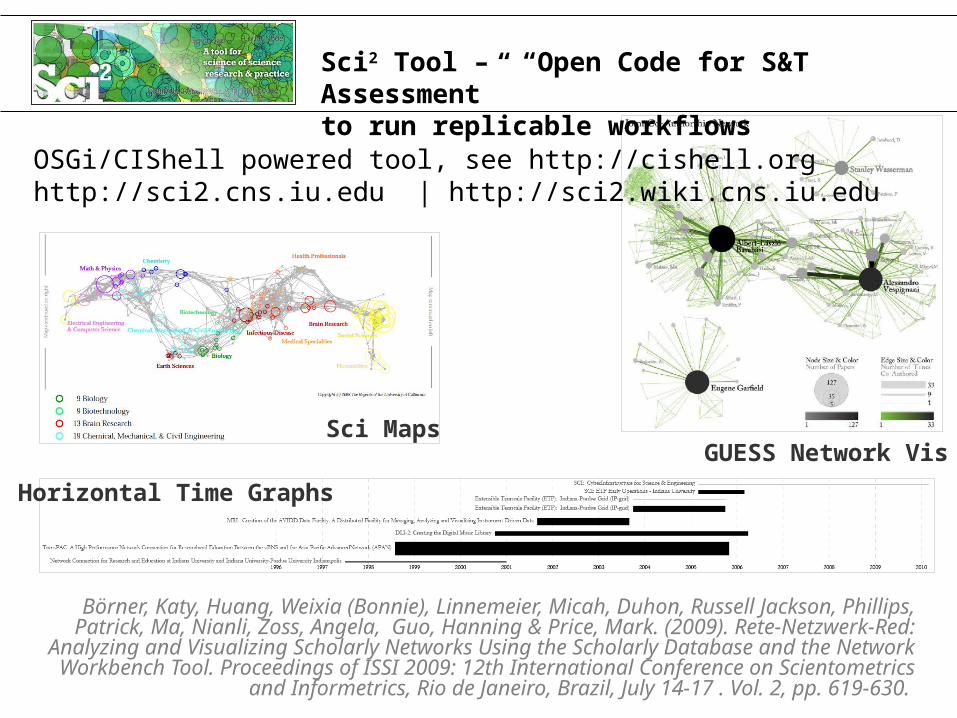
Sci2 Tool – “Open Code for S&T Assessment”to run replicable workflows
OSGi/CIShell powered tool, see http://cishell.org http://sci2.cns.iu.edu | http://sci2.wiki.cns.iu.edu
Börner, Katy, Huang, Weixia (Bonnie), Linnemeier, Micah, Duhon, Russell Jackson, Phillips, Patrick, Ma, Nianli, Zoss, Angela, Guo, Hanning & Price, Mark. (2009). Rete-Netzwerk-Red: Analyzing and Visualizing Scholarly Networks Using
the Scholarly Database and the Network Workbench Tool. Proceedings of ISSI 2009: 12th International Conference on Scientometrics and Informetrics, Rio de
Janeiro, Brazil, July 14-17 . Vol. 2, pp. 619-630.
Horizontal Time Graphs
Sci MapsGUESS Network Vis
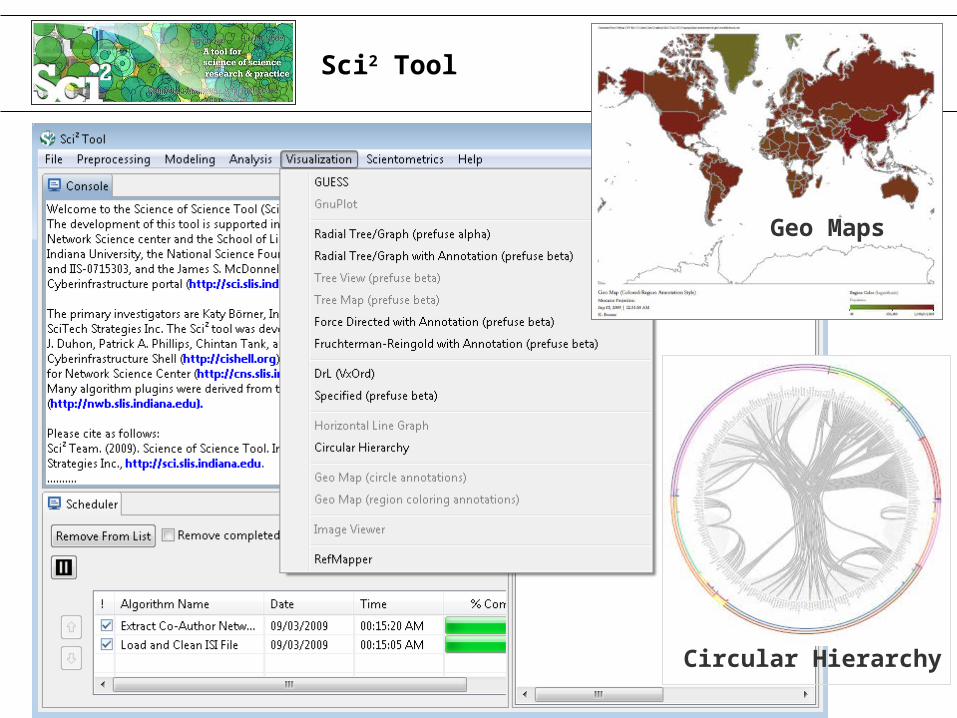
Sci2 Tool
Geo Maps
Circular Hierarchy
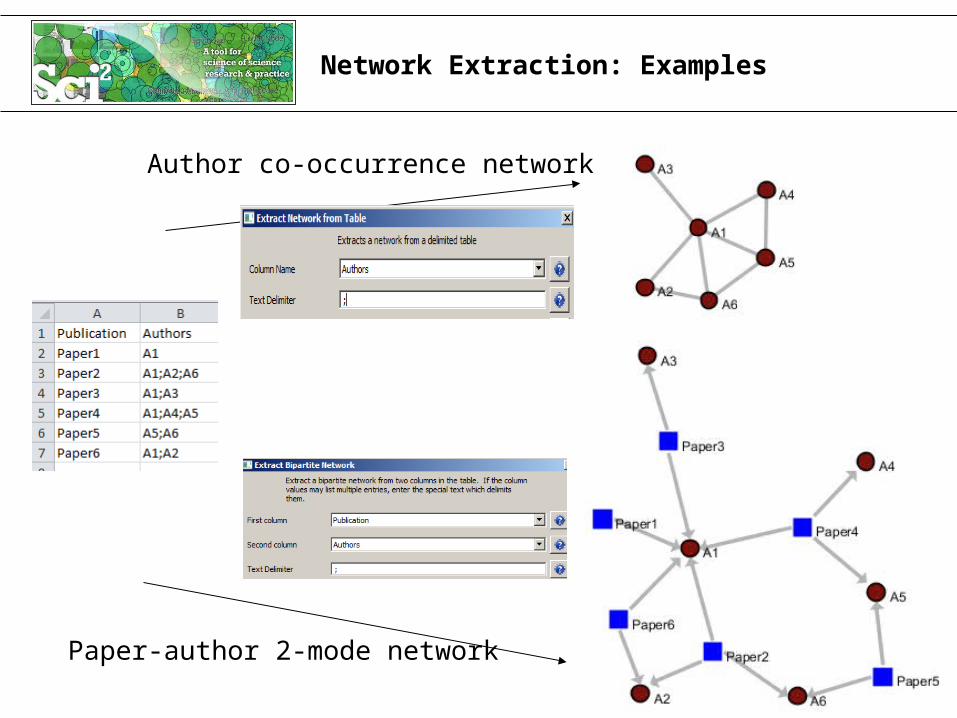
Network Extraction: Examples
Paper-author 2-mode network
Author co-occurrence network
27
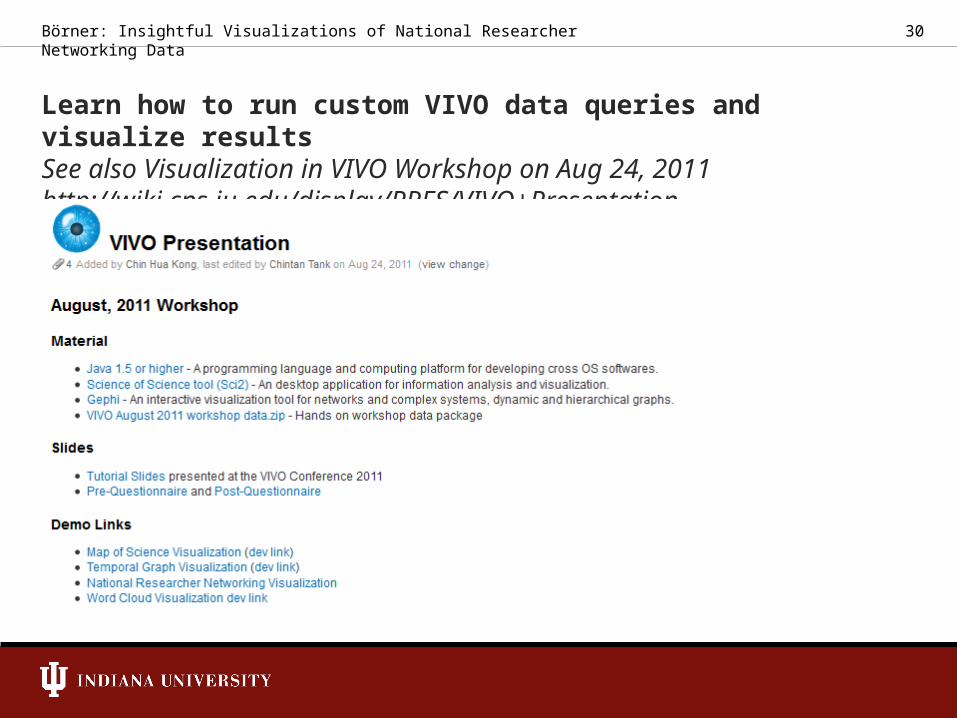
Learn how to run custom VIVO data queries and visualize resultsSee also Visualization in VIVO Workshop on Aug 24, 2011http://wiki.cns.iu.edu/display/PRES/VIVO+Presentation
30Börner: Insightful Visualizations of National Researcher Networking Data
31
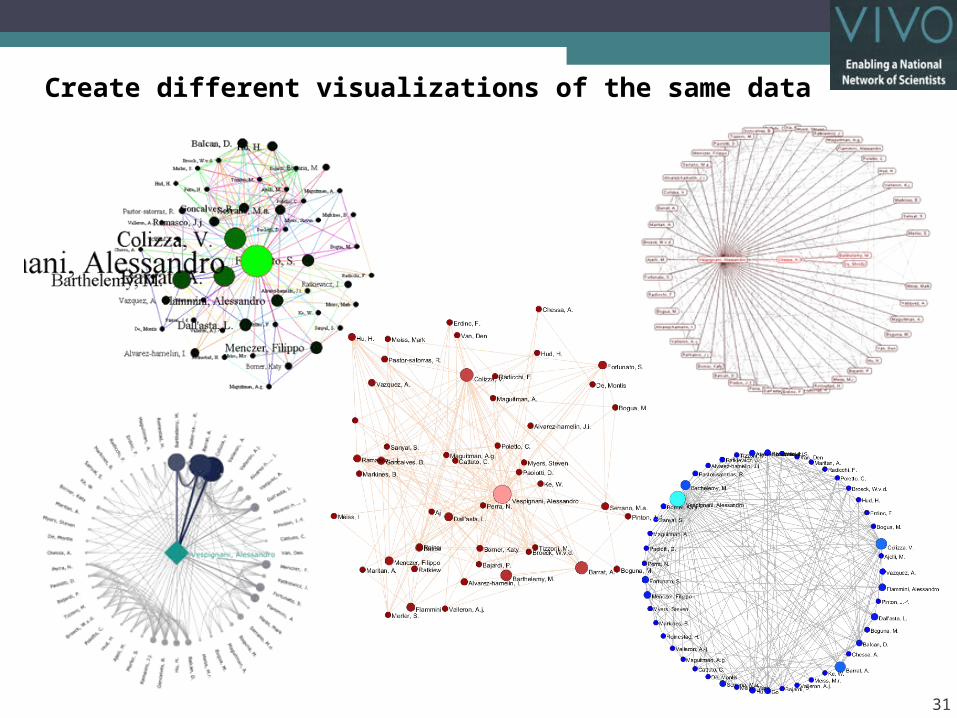
Create different visualizations of the same data
32
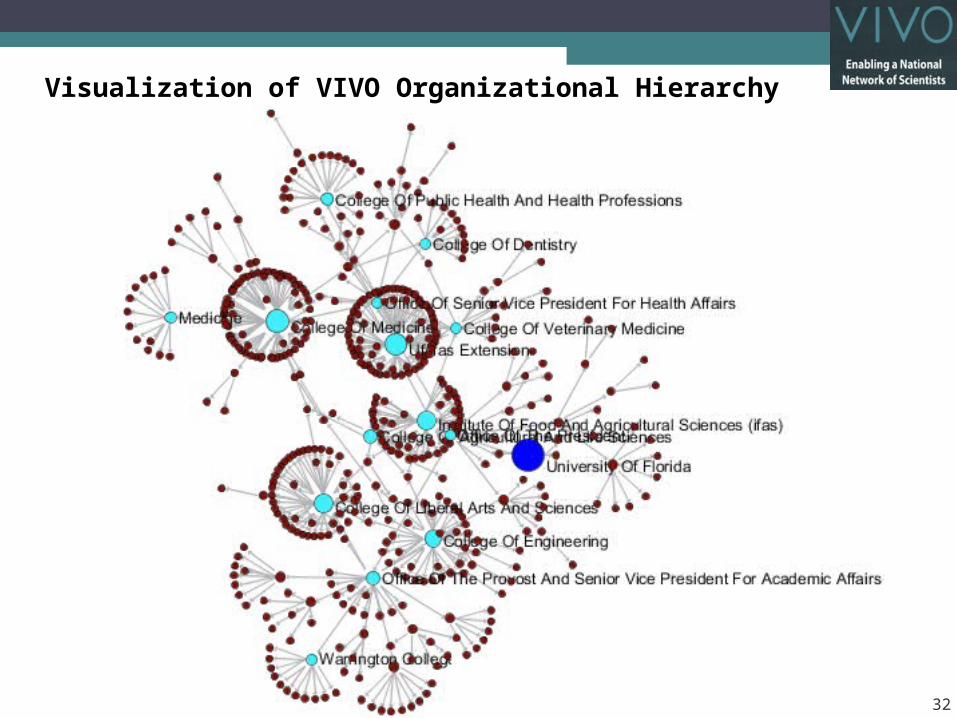
Visualization of VIVO Organizational Hierarchy
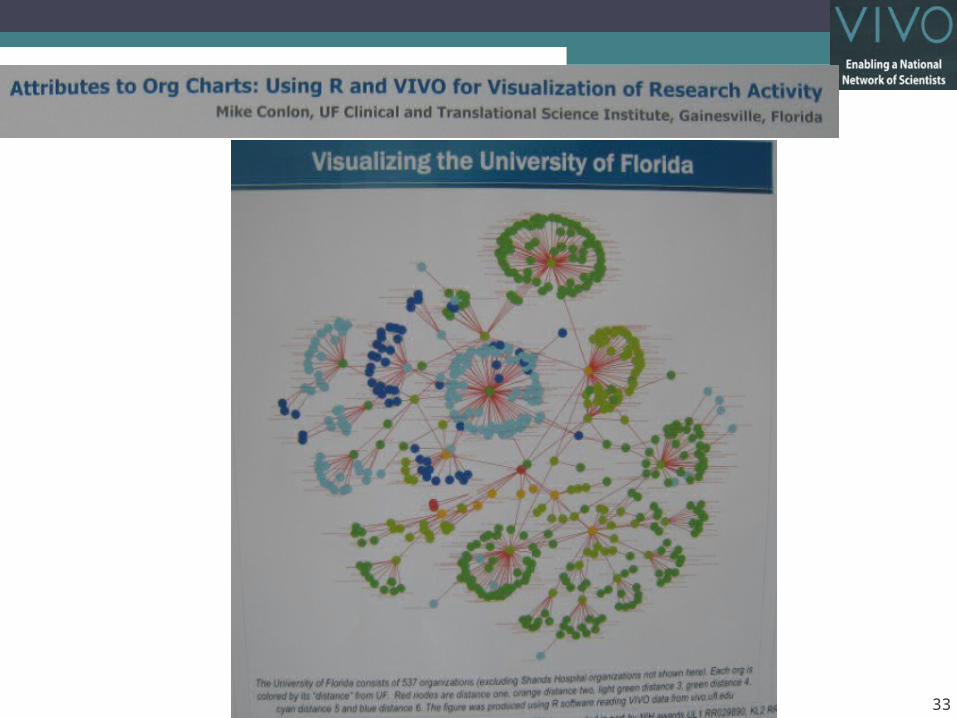
33
34
Custom NRN Visualizations
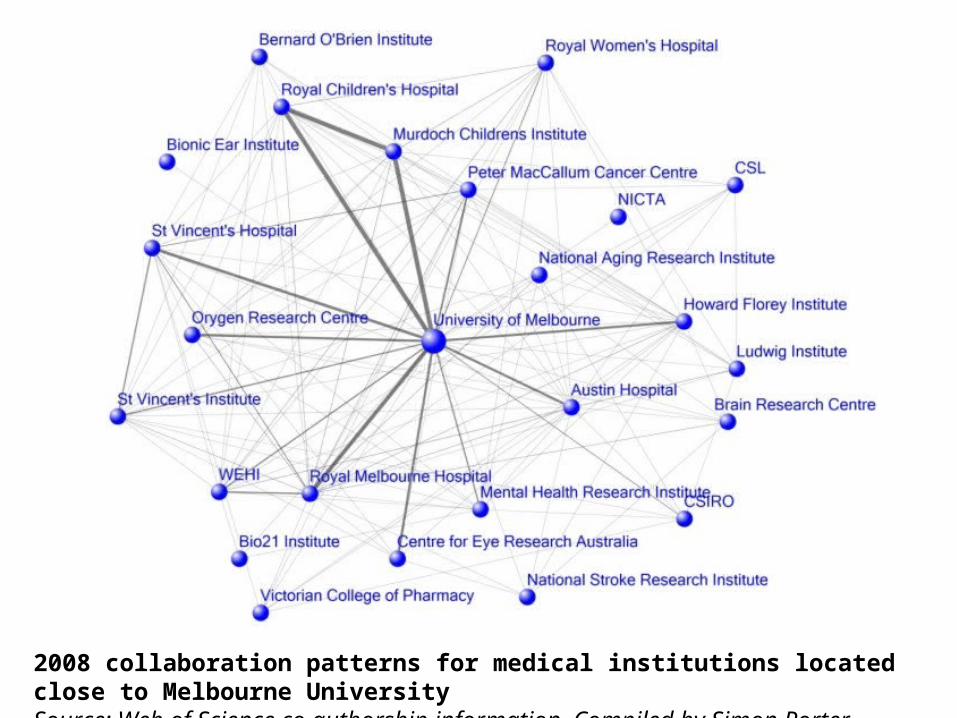
2008 collaboration patterns for medical institutions located close to Melbourne UniversitySource: Web of Science co authorship information. Compiled by Simon Porter
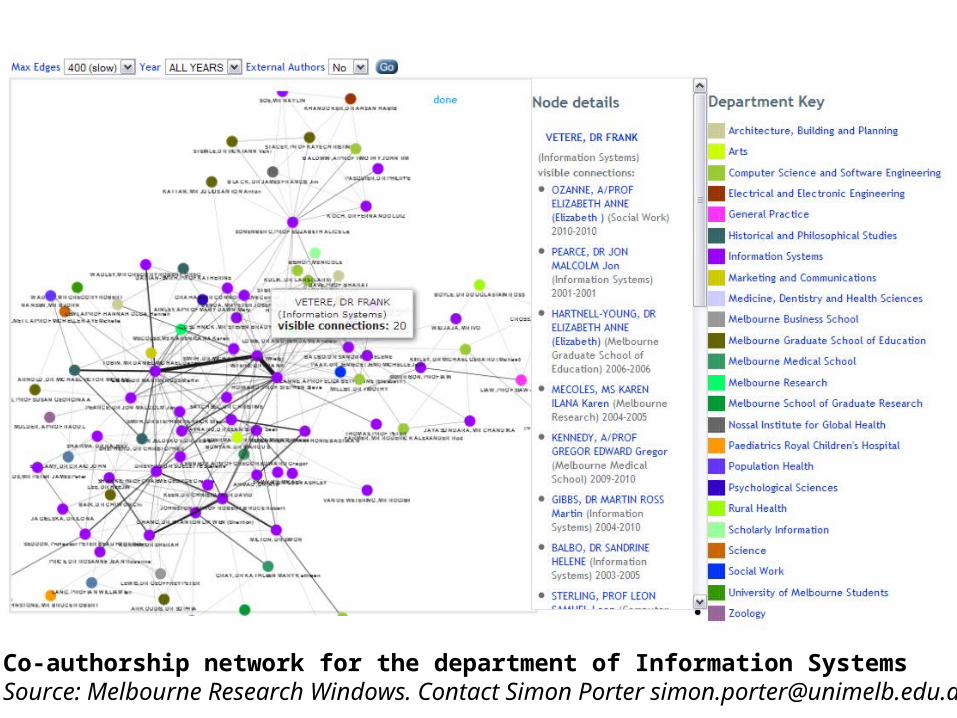
Co-authorship network for the department of Information SystemsSource: Melbourne Research Windows. Contact Simon Porter [email protected]
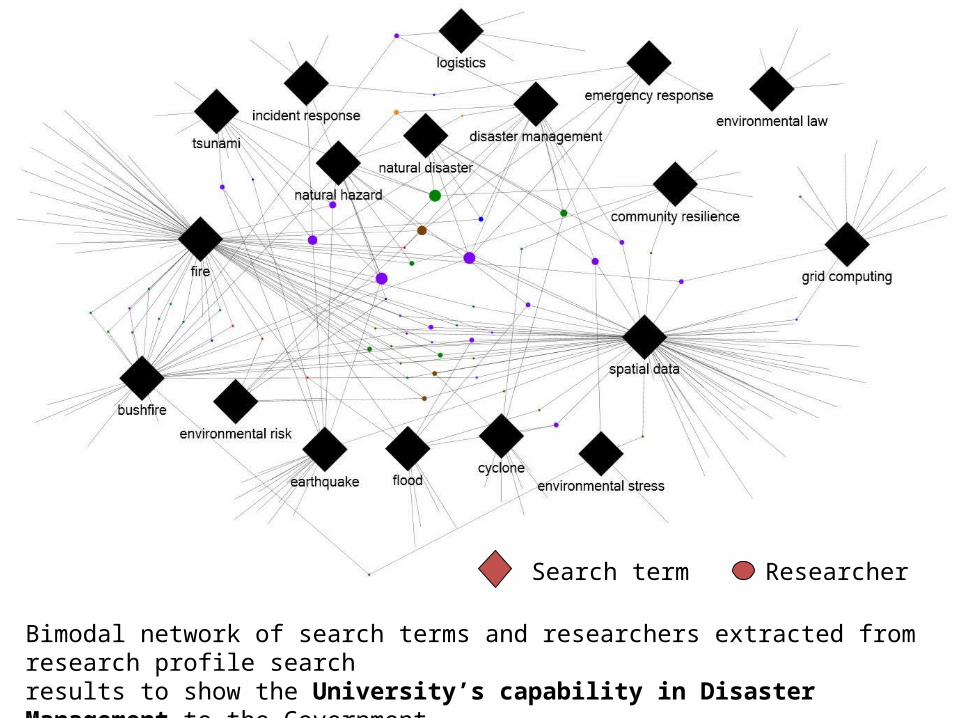
Search term Researcher
Bimodal network of search terms and researchers extracted from research profile search results to show the University’s capability in Disaster Management to the GovernmentContact: [email protected]
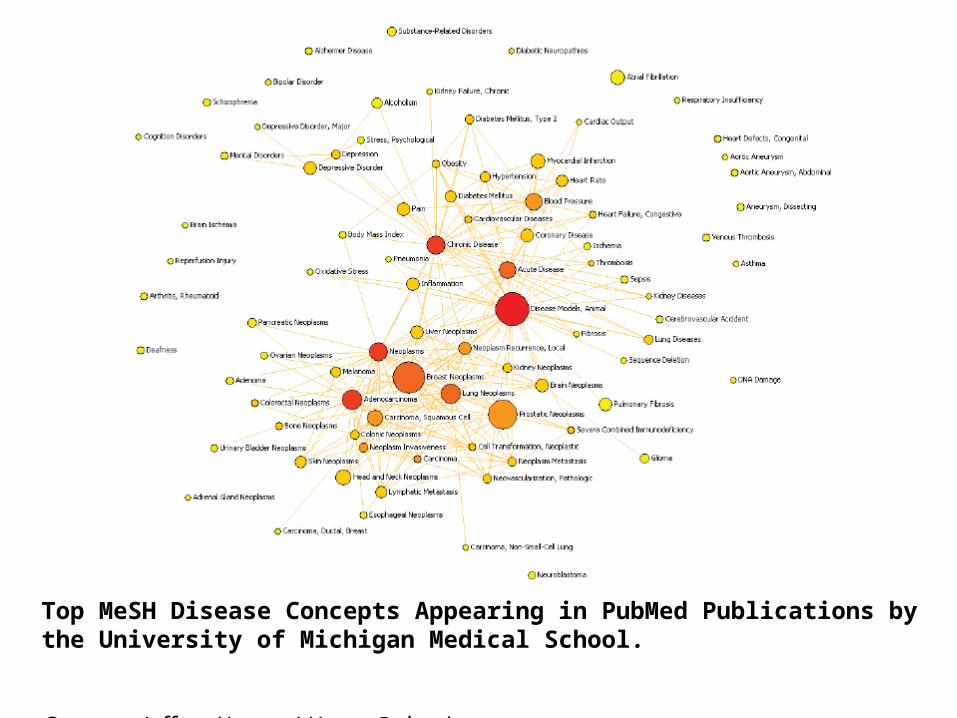
Top MeSH Disease Concepts Appearing in PubMed Publications by the University of Michigan Medical School. Links connect concepts where 100+ authors published about both concepts within the span of their careers. Contact: Jeffrey Horon, [email protected]
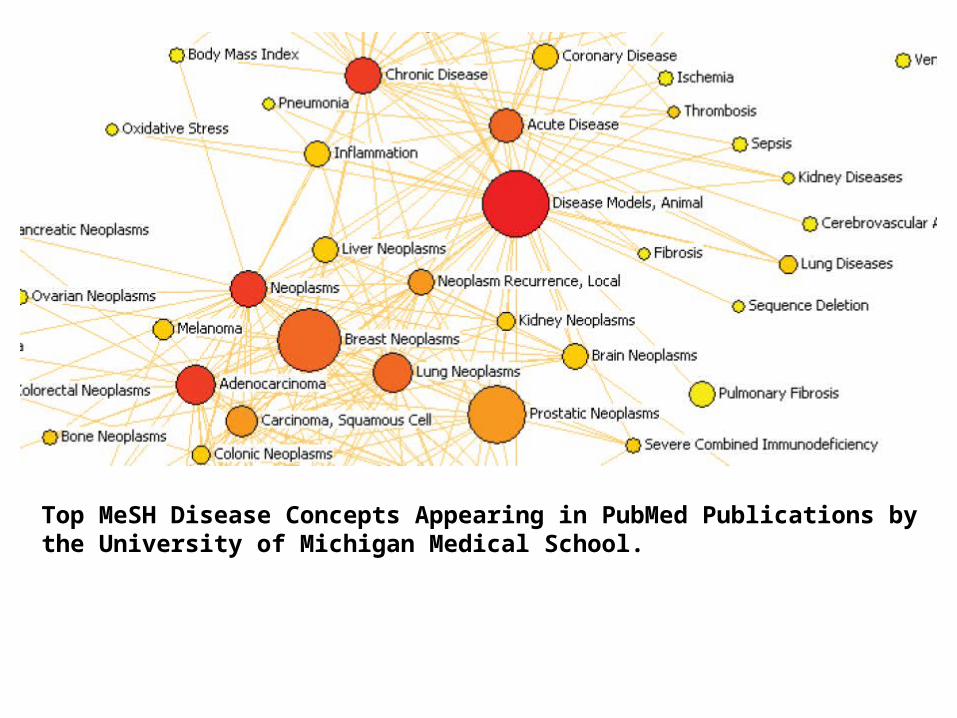
Top MeSH Disease Concepts Appearing in PubMed Publications by the University of Michigan Medical School. Links connect concepts where 100+ authors published about both concepts within the span of their careers. This visualization revealed that animal disease models were central to disease research at U-M whiich encouraged additional thought and attention to animal husbandry, animal expenses, and core/shared services overall.Contact: Jeffrey Horon, [email protected]
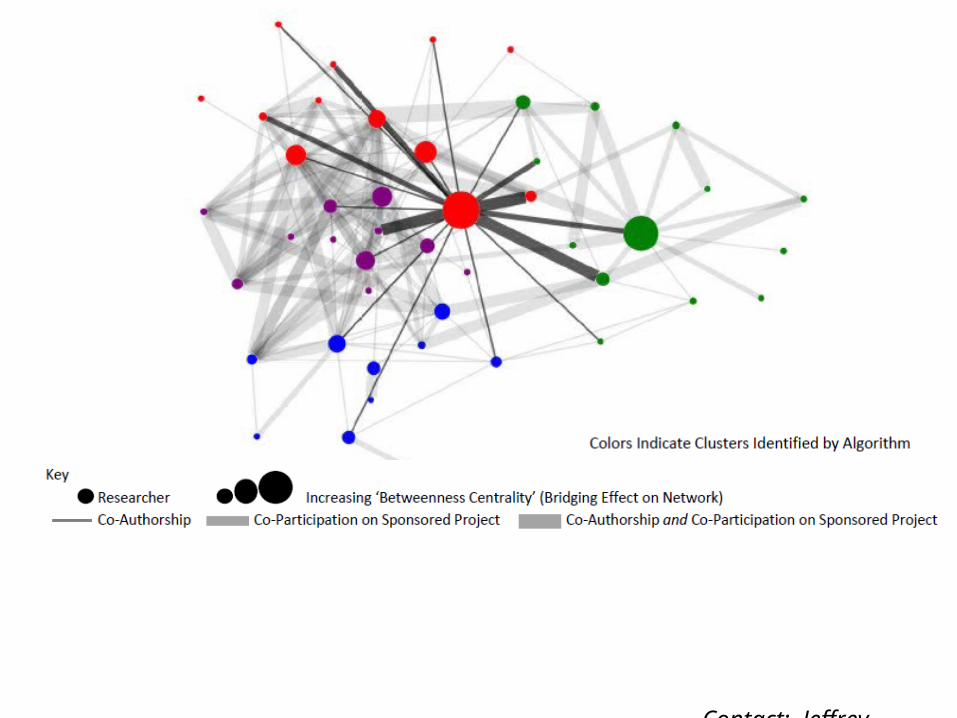
P30 Member Collaborations – Sponsored Project Co Participation and Co Authorship ‐ ‐Network. Used in successful! P30 funding application. Shows the PI’s relationships with various P30 members, conveying that the PI was not only the formal center of the group but also the informal center and the person who exhibited the highest betweenness centrality. Contact: Jeffrey Horon, [email protected]
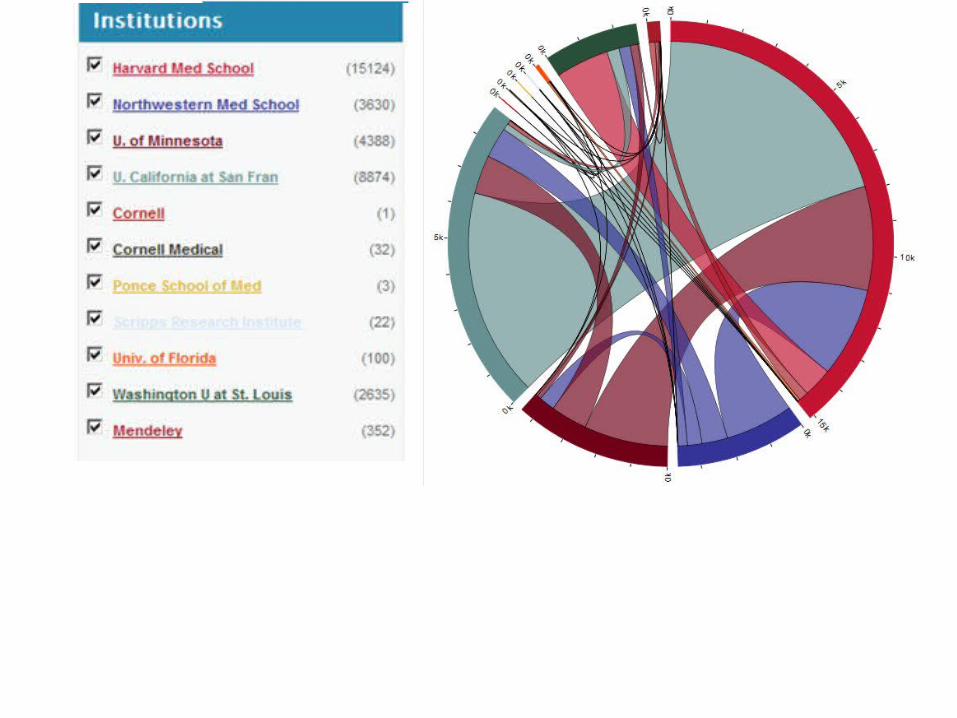
Inter-Institutional Collaboration ExplorerThis visualization shows information about “collaborative publications” found at 2 or more Researcher Networking websites. The idea that institutions don't work together and that biomedical research is conducted in silos is not true. Researchers, even when separated by great distances, are in fact willing to work together, and this visualization demonstrates that they often do. Contact: Nick Benik ([email protected]), Harvard Medical School, Boston, MA. URL: http://xcite.hackerceo.org/VIVOviz
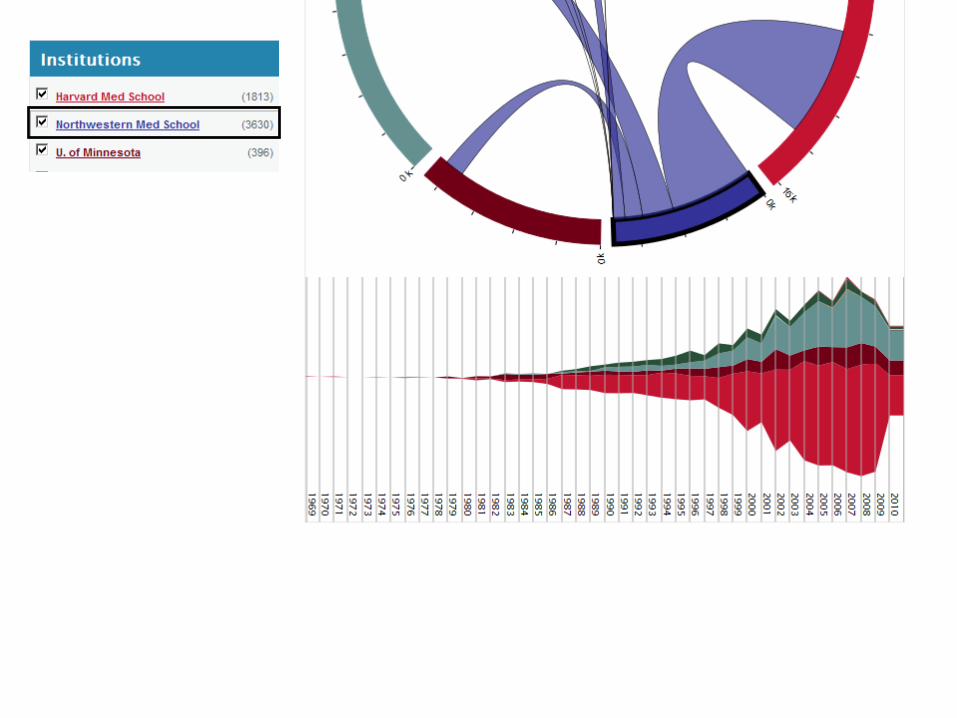
Inter-Institutional Collaboration ExplorerThe outer solid colored arcs represent the 11 institutions. The size of the arc is proportional to the number of collaborative publications found on the site. The inner colored bands represent the number of collaborative publications found between the two institutions that each band connects. Clicking an institution's arc will hide any bands not connected to that institution and will display a timeline of when that institution's collaborative publications were written.
References
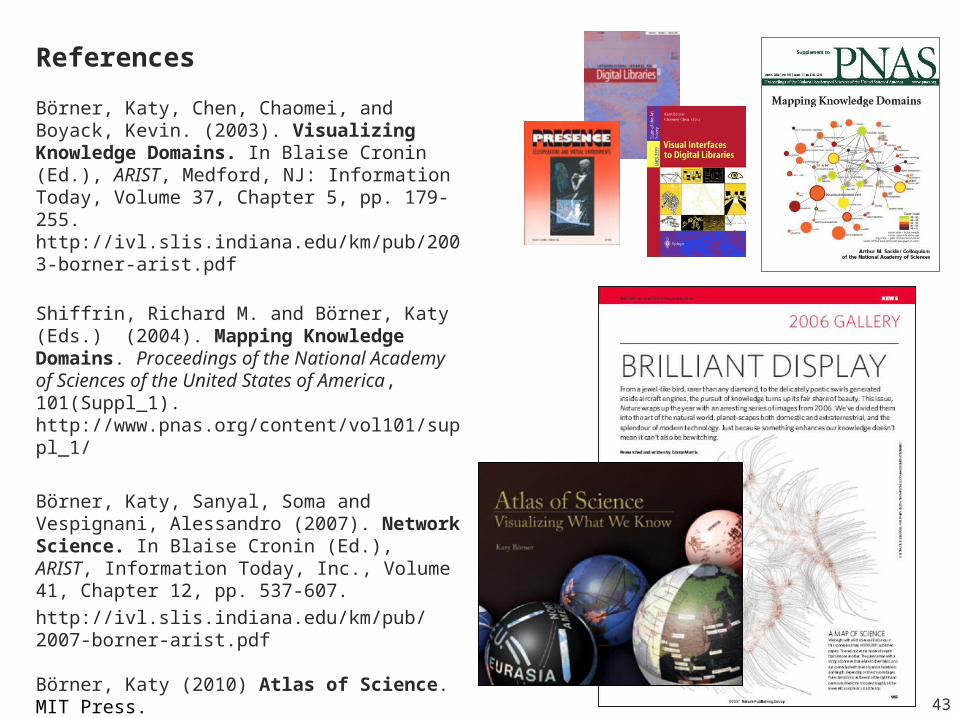
Börner, Katy, Chen, Chaomei, and Boyack, Kevin. (2003). Visualizing Knowledge Domains. In Blaise Cronin (Ed.), ARIST, Medford, NJ: Information Today, Volume 37, Chapter 5, pp. 179-255. http://ivl.slis.indiana.edu/km/pub/2003-borner-arist.pdf
Shiffrin, Richard M. and Börner, Katy (Eds.) (2004). Mapping Knowledge Domains. Proceedings of the National Academy of Sciences of the United States of America, 101(Suppl_1). http://www.pnas.org/content/vol101/suppl_1/
Börner, Katy, Sanyal, Soma and Vespignani, Alessandro (2007). Network Science. In Blaise Cronin (Ed.), ARIST, Information Today, Inc., Volume 41, Chapter 12, pp. 537-607. http://ivl.slis.indiana.edu/km/pub/2007-borner-arist.pdf
Börner, Katy (2010) Atlas of Science. MIT Press.http://scimaps.org/atlas
Scharnhorst, Andrea, Börner, Katy, van den Besselaar, Peter (2011) Models of Science Dynamics. Springer Verlag.
43
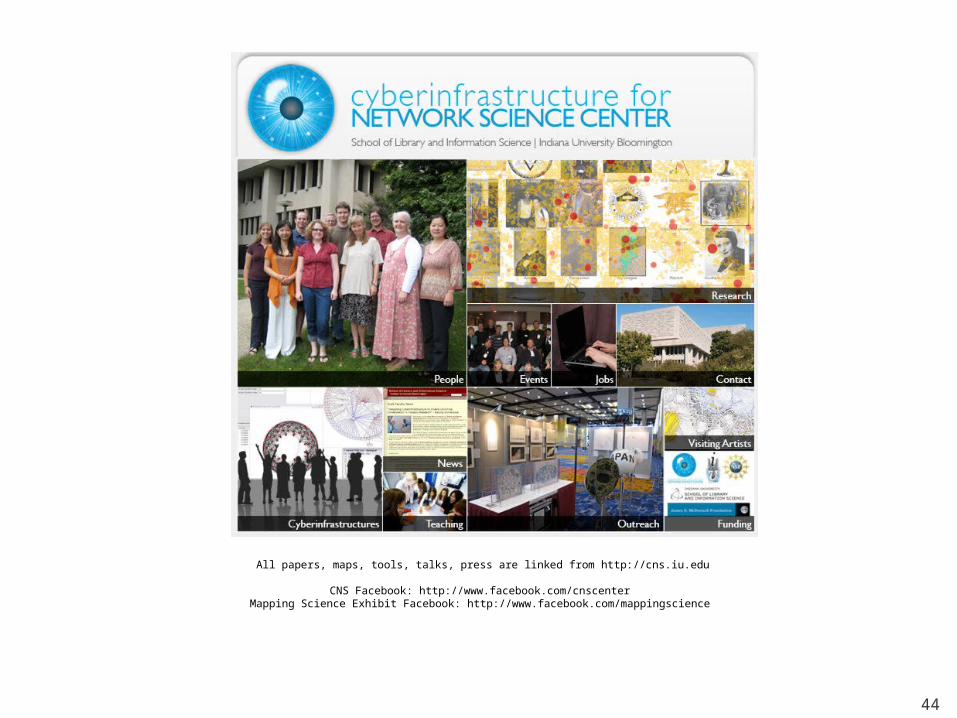
All papers, maps, tools, talks, press are linked from http://cns.iu.edu
CNS Facebook: http://www.facebook.com/cnscenter Mapping Science Exhibit Facebook: http://www.facebook.com/mappingscience
44