Embed Size (px)
Citation preview

Insights from Behavioral Finance
Investor Decisions and Relevance to Our
Marketplace

Ulrike MalmendierEdward J. and Mollie Arnold Professor of Finance,
Haas School of Business, and Professor of Economics, Department of Economics
University of California, BerkeleyPh.D. in Business Economics from Harvard University (2002) Ph.D. in Law from the University of Bonn (2000)
2013 Fischer Black Prize, awarded biennially by the American Finance Association to the leading finance scholar under 40
Research: behavioral finance, corporate finance, behavioral economics, including M&A, corporate governance and the effects of financial crises on individual and managerial behavior.

Finance as you know it
Terms you have grown to know and love:
Efficient Markets Hypothesis
Rational Choice Paradigm
CAPM
No Arbitrage Principle
All lie at the foundation of modern investment theory.
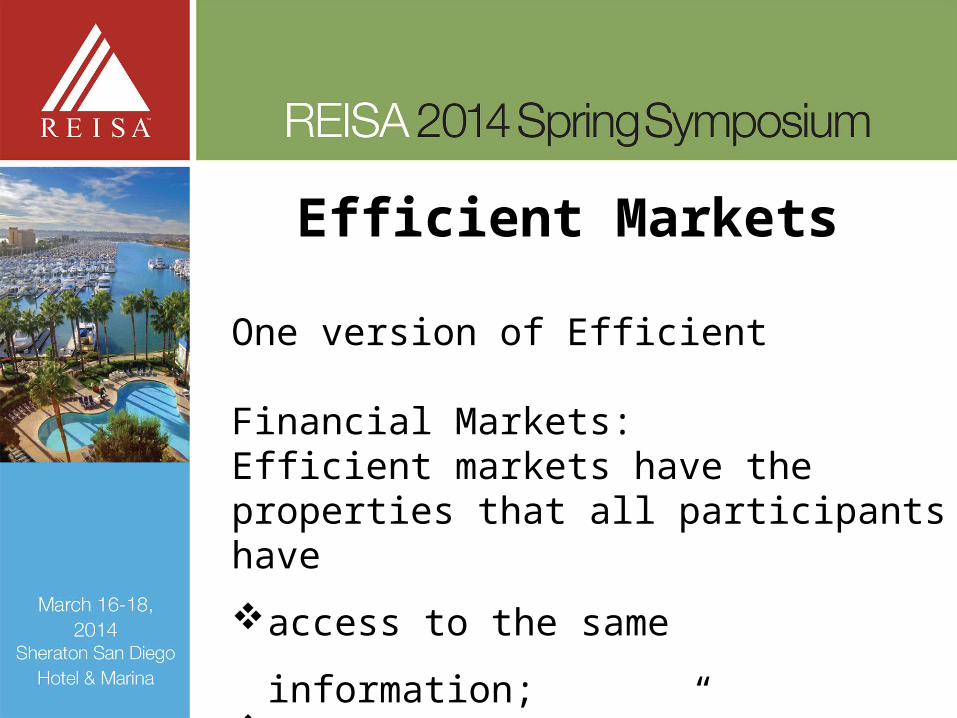
Efficient Markets
One version of Efficient Financial Markets:Efficient markets have the properties that all participants have
access to the same information;the same “opinions” about how to value
securities using that information;
access to unlimited liquidity.
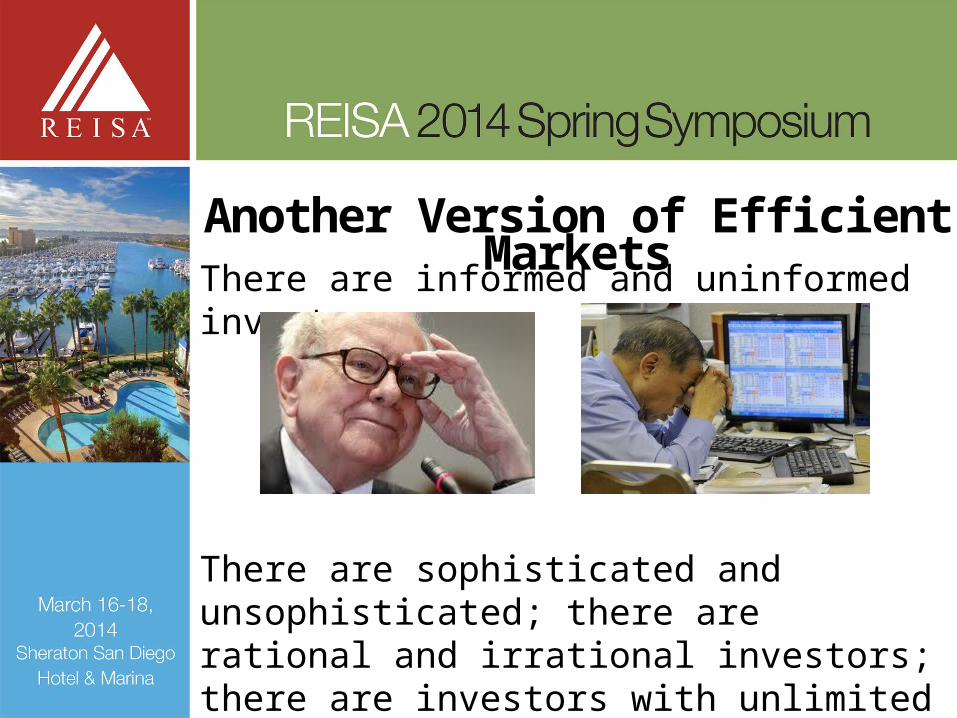
Another Version of Efficient MarketsThere are informed and uninformed investors
There are sophisticated and unsophisticated; there are rational and irrational investors;there are investors with unlimited liquidity and those without unlimited liquidity.Same outcome!
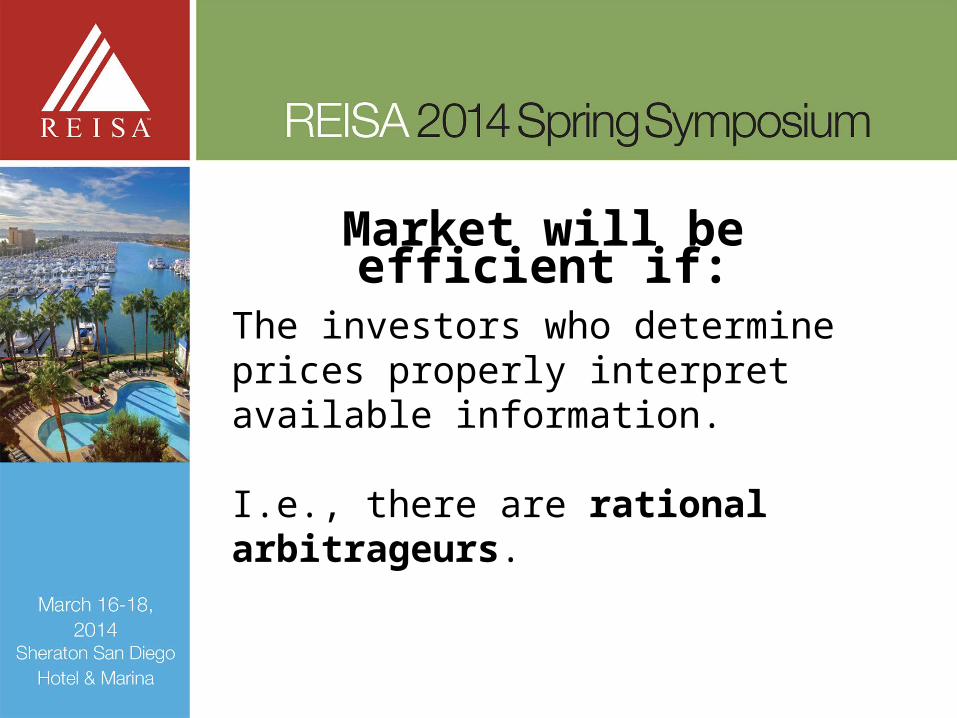
Market will be efficient if:
The investors who determine prices properly interpret available information.
I.e., there are rational arbitrageurs.
What it means (meant?) for you
Every investor should hold market portfolio for best risk/return trade-off. Including direct investment, non-traded
assets! Excellent (and correct) argument when
convincing a sophisticated investor to look beyond traditional investments.
Alternatively: Huh???
Market Efficiency
“A market in which prices always ‘fully reflect’ available information is called ‘efficient.’ ”
Eugene Fama, Journal of Finance, 1970
“I'd be a bum in the street with a tin cup if the markets were efficient.”
Warren Buffet, Fortune, 1995
The Behavioral Finance Revolution
1. More human modeling of investor behavior: biases (personal experiences leave an imprint, recency effects, overconfidence, procrastination, hindsight bias, confirmation bias, …)
2. More human modeling of financial advisors’ / agents’ / traders’ behavior: similar set of biases!
3. Rigorous quantitative analysis
Focus today:“Experience Effects”
Investors personal experiences affect their willingness to take financial risk.
May seem like a no-brainer today … Financial Crisis still in short-term memory!
Also seemed like a no-brainer about 100 years ago: Great Depression!
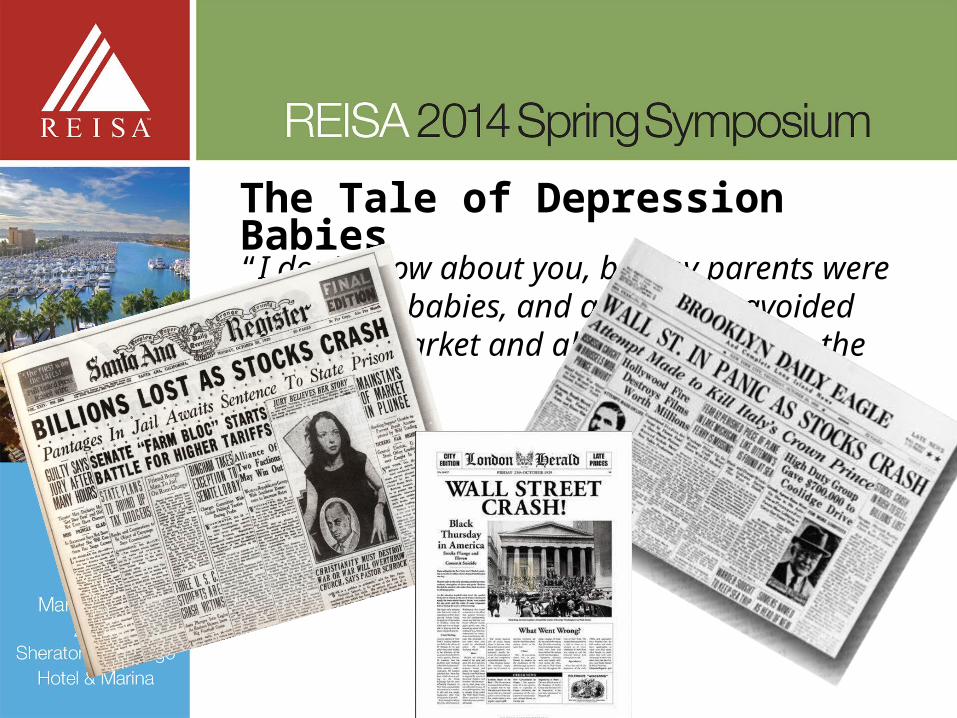
The Tale of Depression Babies
“I don’t know about you, but my parents were depression babies, and as a result, avoided the stock market and all things risky like the plague.”
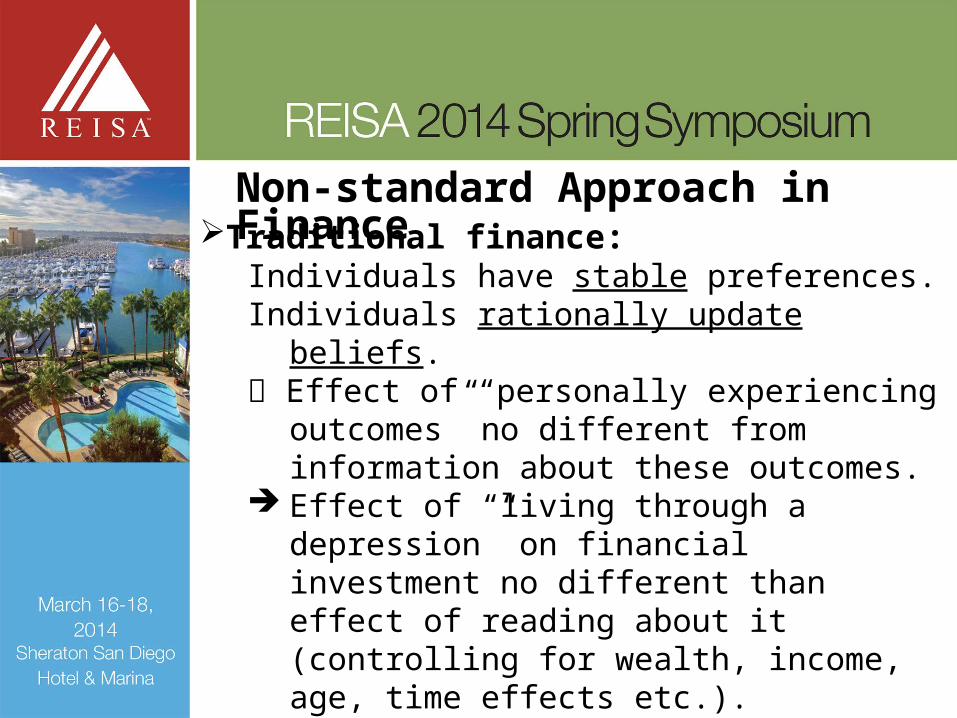
Non-standard Approach in FinanceTraditional finance:
Individuals have stable preferences.Individuals rationally update beliefs. Effect of “personally experiencing outcomes” no
different from information about these outcomes. Effect of “living through a depression” on financial
investment no different than effect of reading about it (controlling for wealth, income, age, time effects etc.).
Effect of your own home selling below purchase price during the crisis on REIT investment: none.
Non-traditional models: Personal experience affects behavior more strongly than information about outcomes

Psychology Literature Availability: similarity-based hypothesis
generation based on memory of prior cases (cf. physician mistakes).
Learning from personal interaction (with other players) stronger than from observing.
KEY QUESTION: What has your client experienced? Past experiences will strongly shape his or her preferences and beliefs!
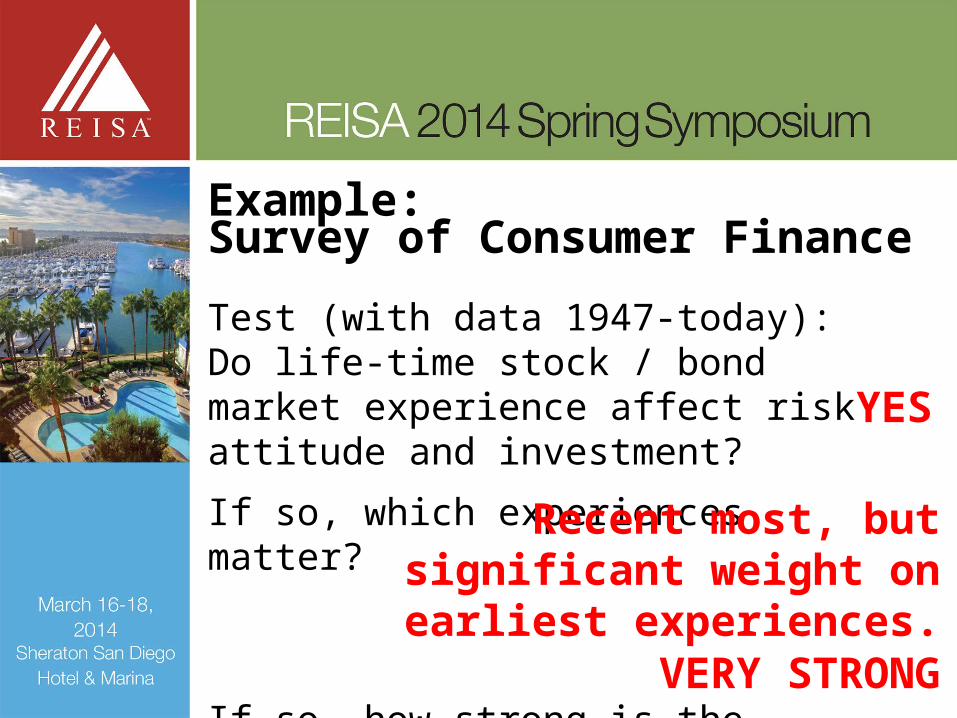
Example: Survey of Consumer Finance
Test (with data 1947-today): Do life-time stock / bond market experience affect risk attitude and investment?
If so, which experiences matter?
If so, how strong is the effect?
YES
Recent most, but significant weight on earliest experiences.
VERY STRONG
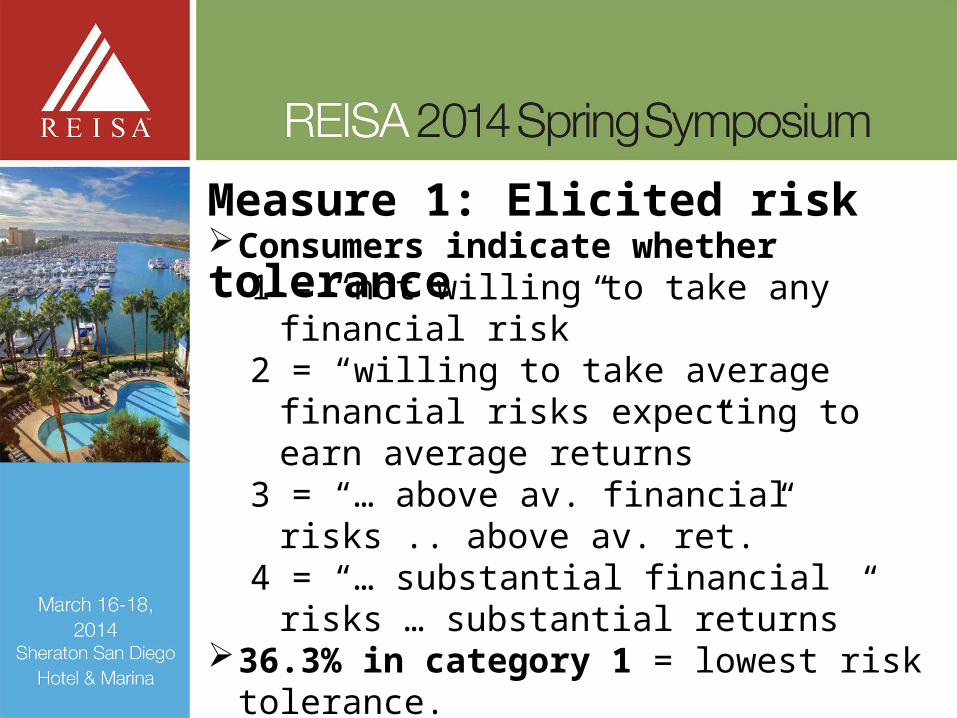
Measure 1: Elicited risk toleranceConsumers indicate whether
1 = “not willing to take any financial risk”2 = “willing to take average financial risks
expecting to earn average returns”3 = “… above av. financial risks .. above av. ret.”4 = “… substantial financial risks … substantial
returns”36.3% in category 1 = lowest risk tolerance. If you change their life-time stock-market
experience from “pretty bad” (10th percentile) to “pretty good” (90th percentile) a third of those start taking risks.
Measure 2: Stock-Market Participation
Do you invest anything at all in the stock market? (At least $1, including retirement savings.)
About a third of the US population does (35%). If you change their life-time stock-market
experience from “pretty bad” (10th percentile) to “pretty good” (90th percentile) the number increases by almost 50% (14.6 ppt).
Measure 3: Bond-Market Participation
Do you invest anything at all in the bond market? (At least $1, including retirement savings.)
About a third of the US population does (33%). If you change their life-time stock-market
experience from “pretty bad” (10th percentile) to “pretty good” (90th percentile) the number increases by almost 50% (15.3 ppt).
Measure 4: Risky Asset ShareFor people who do invest in the stock market:
How much (of your liquid assets)?On average 42% (conditional mean). If you change their life-time stock-market
experience from “pretty bad” (10th percentile) to “pretty good” (90th percentile) the number increases by 7.7ppt.
Noteworthy since hard to find any household characteristics among stock-market participants that predict the risky asset share (“how much invested in what”).
Age vs. ExperienceCommon confusion … Clarifying Example
Early 1980s: young households had lower stock-market participation, lower allocation to stocks, and reported higher risk aversion than older households.
Young households experienced the low 1970s stock returns.Older households experienced the low 1970s stock returns, but
also the high 1950s and 1960s returns. 1990s: pattern flipped: (then) young households had
higher rates of stock-market participation, higher allocation to stocks, and lower reported risk aversion than older households.
Young households experienced the 1990s boom years and, hence, had higher life-time average returns than old households.
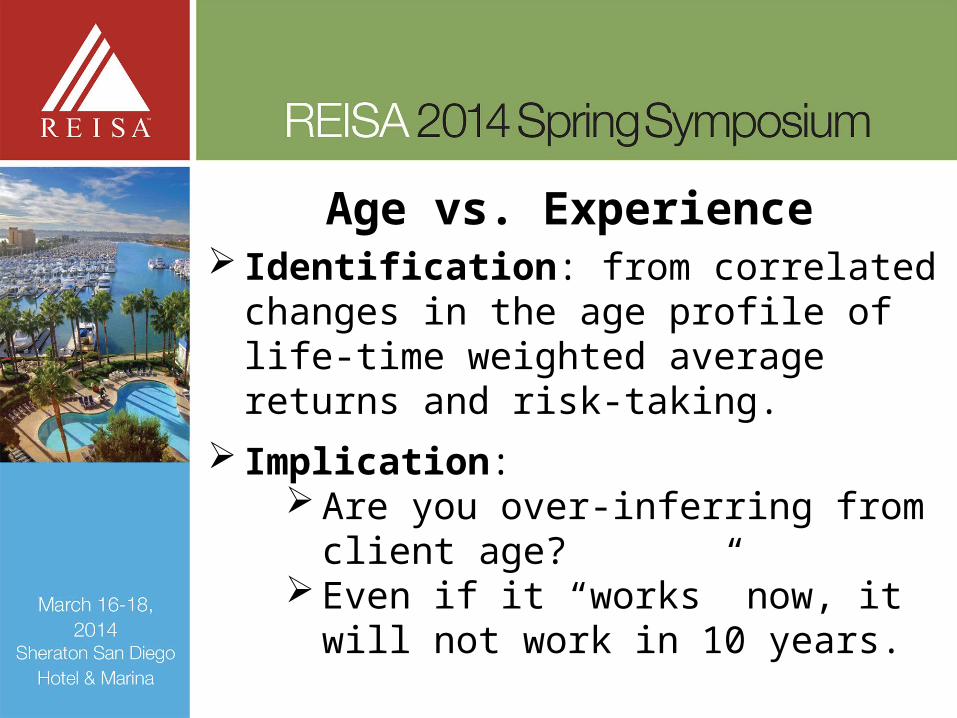
Age vs. Experience Identification: from correlated changes in the
age profile of life-time weighted average returns and risk-taking.
Implication: Are you over-inferring from client age? Even if it “works” now, it will not work in
10 years.
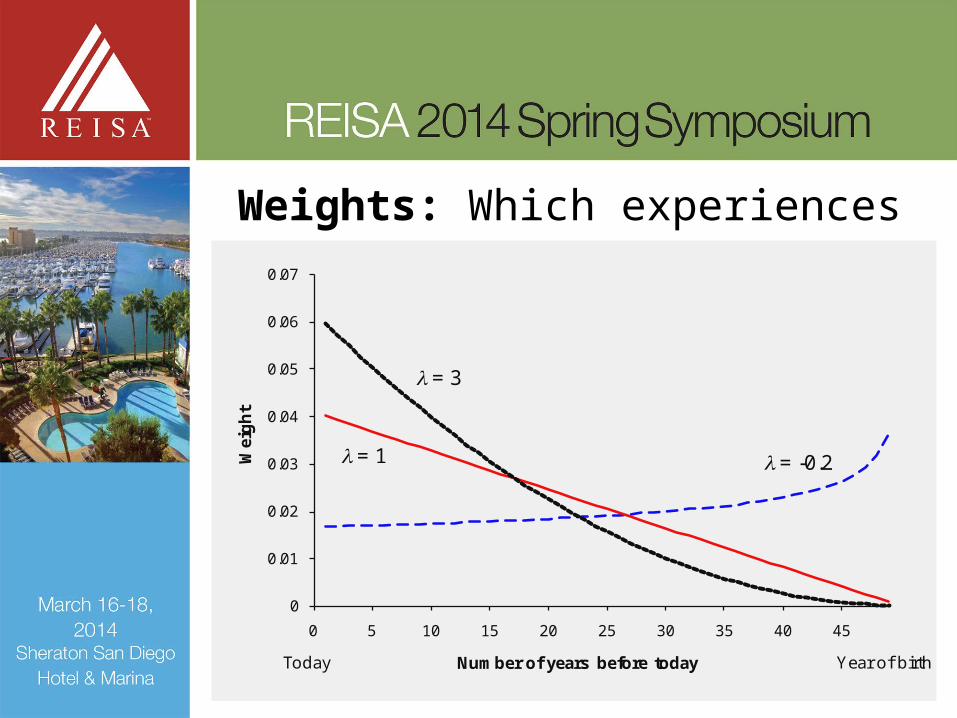
Weights: Which experiences matter?
0
0.01
0.02
0.03
0.04
0.05
0.06
0.07
0 5 10 15 20 25 30 35 40 45
Wei
gh
t
Number of years before today
l = -0.2
l = 3
l = 1
Year of birthToday
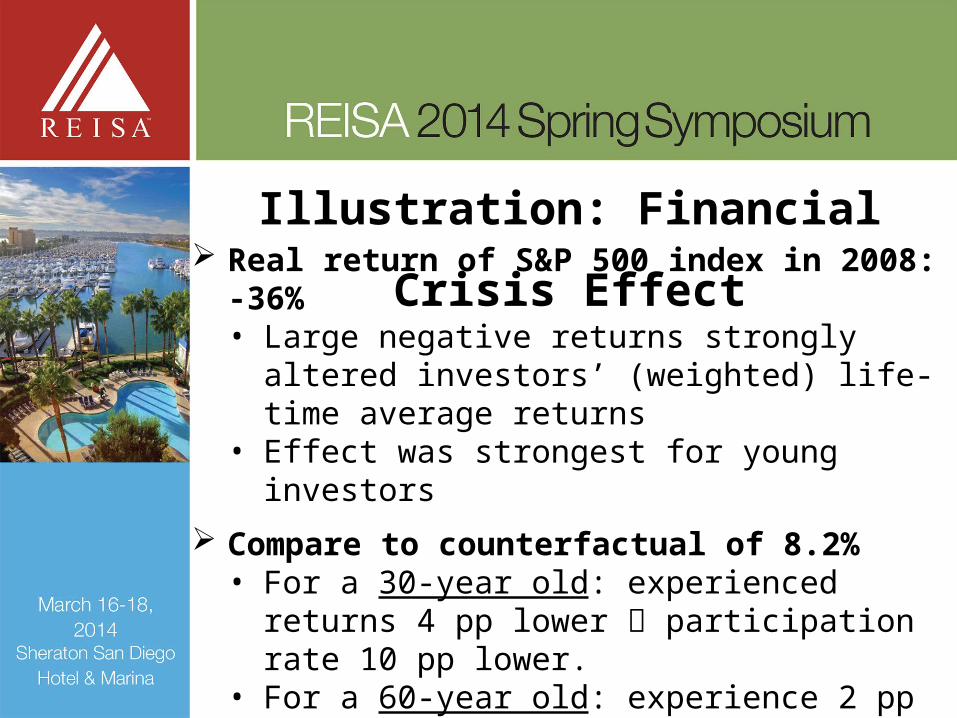
Illustration: Financial Crisis Effect Real return of S&P 500 index in 2008: -36%
• Large negative returns strongly altered investors’ (weighted) life-time average returns
• Effect was strongest for young investors
Compare to counterfactual of 8.2%• For a 30-year old: experienced returns 4 pp
lower participation rate 10 pp lower.• For a 60-year old: experience 2 pp lower
participation rate 5 pp lower.
How long-lasting is the effect?• Faded away after about 30 years.
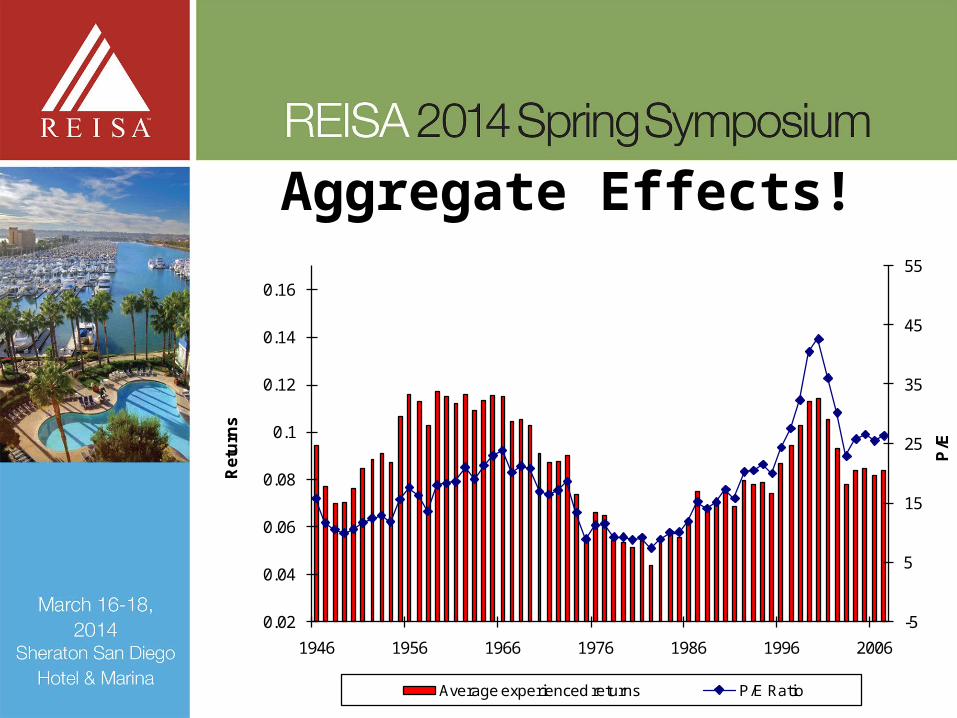
Aggregate Effects!
-5
5
15
25
35
45
55
0.02
0.04
0.06
0.08
0.1
0.12
0.14
0.16
1946 1956 1966 1976 1986 1996 2006
P/E
Ret
urn
s
Average experienced returns P/E Ratio
Real Estate Investment and Inflation Experiences• Is there a similar effect of
experiences on inflation expectations?
• If so, does it translate into mortgage choices?

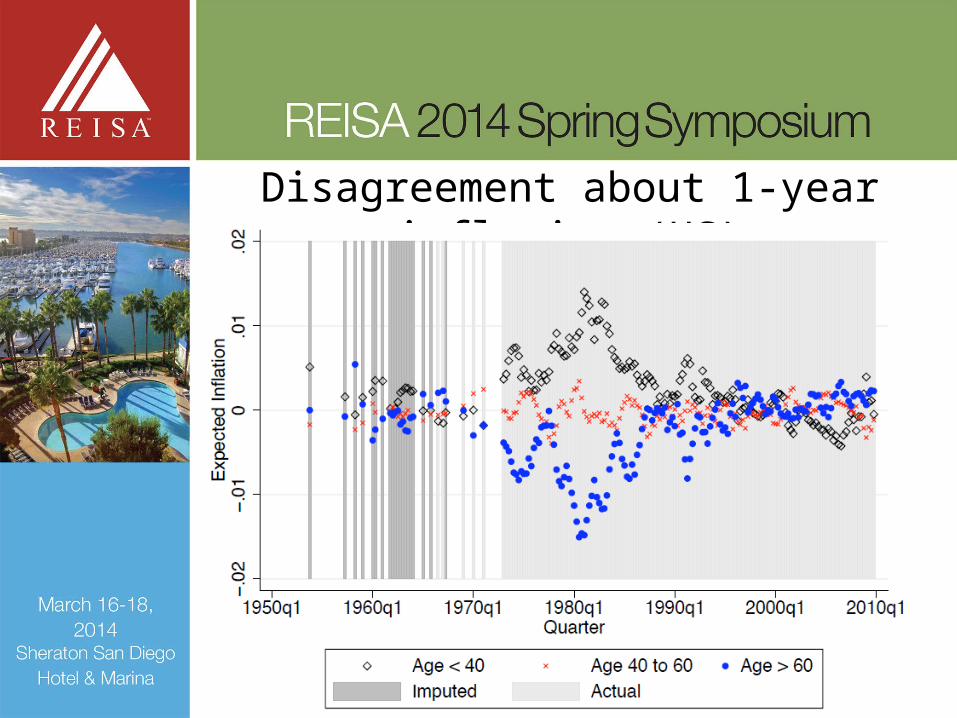
Disagreement about 1-year inflation (US)
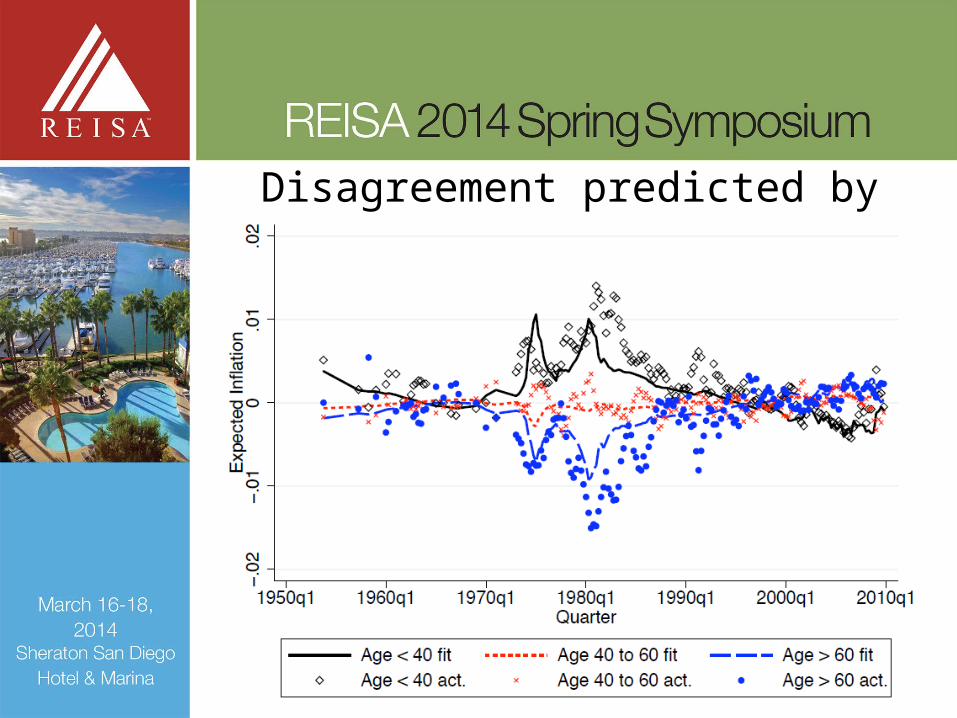
Disagreement predicted by experiences
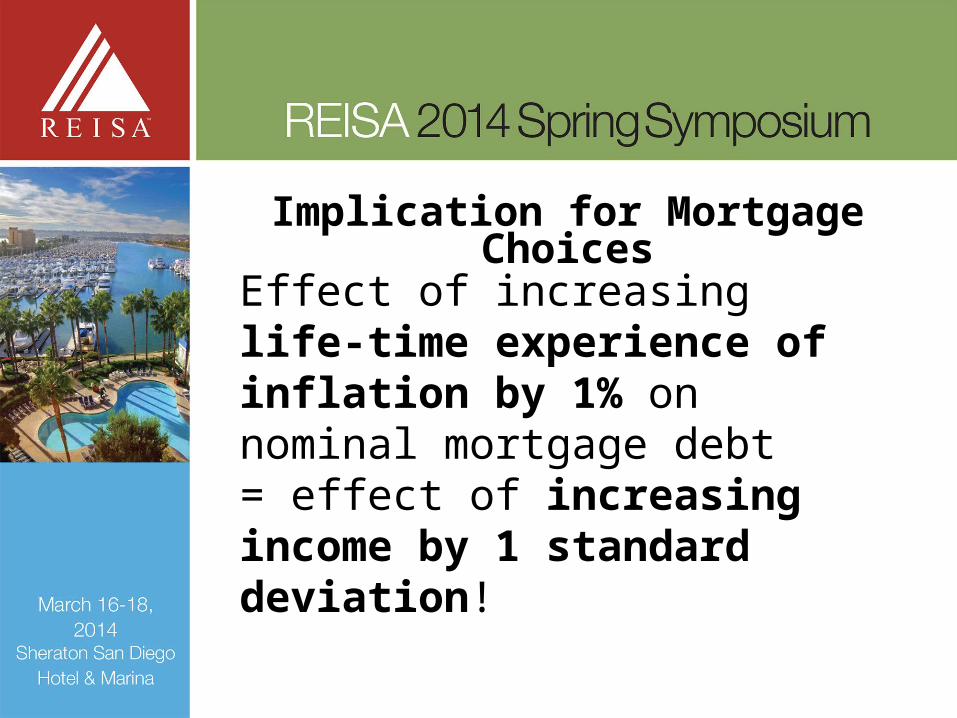
Implication for Mortgage Choices
Effect of increasing life-time experience of inflation by 1% on nominal mortgage debt= effect of increasing income by 1 standard deviation!

Other applications
• Corporate decisions (capital structure, especially leverage choices of “Depression Babies)
• Insurance choices (weather insurance for farmers, earthquake insurance in CA)
• Business expectations• Unemployment expectations• …
Take-Home Message
• Effect of past experiences on choice of investment appears to strong and very robust across many settings/assets.
• Reaction 1: Client ≠ NumbersHow did (s)he get there? What worked,
what did not work in the past?Accept preferences, fine-tune
product/package Catering Approach
Reaction 2• Client can have wrong beliefs. (“What
happened in the real estate market is bound to happen again every five years.”)Can we affect beliefs?Rather than rough “ex ante assessment”
of risk tolerance, simulate scenarios. Give a “feeling” for risk involved by simulating worst case and best case scenarios of investment (and alternative!) Debiasing Approach

Your organization’s
lawyer.
That’s why research so far works with
… farmers in rural China (weather
insurance).
… stock brokers in Brazil.
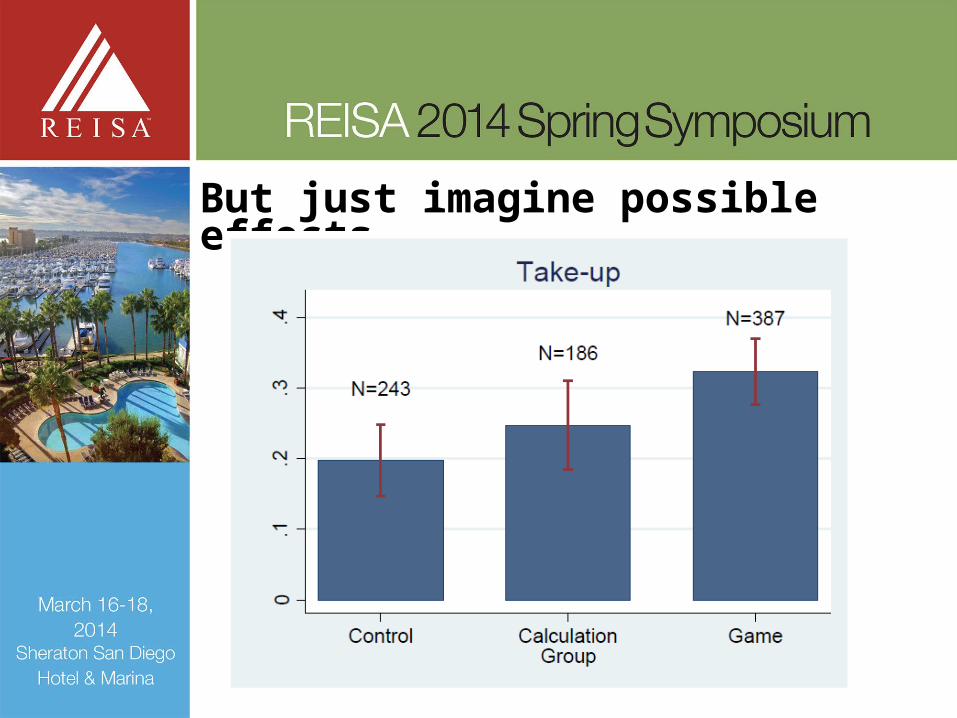
But just imagine possible effects …
The Big PicturePsychological concepts of risk and risk
perception important Here: AvailabilityOverconfidence, Illusion of control, Familiarity, …
Individual-level implications (investment, mortgage borrowing, corporate decisions)
Aggregate implications (stock market valuation, inflation affect market-wide valuation of assets)
Still doubts?
Come to Break-Out Session on “The Impact of Behavior Economics
on Investor Decision-Making”right after this!
THANK YOU!