Embed Size (px)
Citation preview

Insights into Protein Compressibility from Molecular Dynamics Simulations
Voichita M. Dadarlat and Carol Beth Post*Department of Medicinal Chemistry and Molecular Pharmacology, 1333 RHPH Bldg., Purdue UniVersity,West Lafayette, Indiana 47907-1333
ReceiVed: July 6, 2000; In Final Form: October 9, 2000
Isothermal compressibility based on molecular dynamics simulations in a normal temperature and pressure(NTP)-Gibbs ensemble is estimated for five solvated globular proteins (bovine pancreatic trypsin inhibitor,trypsin, ribonuclease A, HEW lysozyme, andR-lactalbumin), as well as bulk water, using the TIP3P model.Protein intrinsic isothermal compressibilities were calculated from molecular total volume fluctuations andaverages using the statistical definition of compressibility. A new and efficient method was developed forcalculating protein total molecular volume based on an atomic van der Waals radius extension algorithm.The calculated isothermal compressibilities are in good agreement with experimental data (the correlationcoefficient is 0.94). The main source of volume fluctuation is the free volume inside the protein, whereasvariations in overlap of atomic van der Waals volume are less of a factor. Proteins with low packing densitytend to have high compressibility, but packing density alone cannot explain the differences in the compressibilityamong globular proteins. A simple approach to assess the contribution to solution compressibility from hydrationwaters suggests small differences between hydration and bulk water compressibility. Estimated bulk watercompressibility is in excellent agreement with experimental data. Two criteria for overcoming finite-sizeeffects in bulk water molecular dynamics simulation are a simulation time longer than 300 ps and a systemsize larger than 260 water molecules.
1. Introduction
Protein molecular volume in solution is a fluctuating quantitydue to the internal, thermal motion of secondary structureelements, loops, and side chain orientations, and the interactionof the surface side chains with the solvent. The magnitude ofthe volume fluctuations as well as the equilibrium value of themolecular volume determine the isothermal compressibility andthe effect of pressure on protein structural stability.1,2 Suchdynamical properties of a protein system contain direct informa-tion3 on the nature of forces that govern the structure anddynamics of the protein molecule, whereas knowledge of themean properties of the systemsGibbs free energy, enthalpy,and entropysis useful for comparing two states of the molecule(e.g., native and denatured).
Isothermal compressibility,âT, is defined as the relativechange in volume with respect to a change in pressure, whenthe system is kept at constant temperature. Experimental datashow an empirical relationship betweenâT in the native stateof globular proteins and the change in protein entropy onunfolding,∆Sunf: the higher the compressibility, the smaller theentropy change between native and unfolded states.4 Further-more, as a reflection of atomic fluctuations, experimentalcompressibilities are of interest in regard to understandinghydrogen exchange,5 protein denaturation,6 and changes inenzyme activity and modified protein stability by single aminoacid mutations.7 An increase in the thermal stability of a viruson binding antiviral compounds has also been associated witha calculated change in the compressibility of the complexedvirus and entropic stabilization.4,8 Recent experiments confirmedthe entropic basis for viral stabilization.9
Thermodynamic quantities such as free energy, enthalpy, andentropy change, as well as compressibility, can be evaluatedexperimentally, but specific contributions to these quantities aredifficult to separate. The experimental determination of theprotein compressibility accounts for protein intrinsic compress-ibility, as well as a hydration contribution due to protein-waterinteraction. Both the hydrational contribution to the compress-ibility and the intrinsic compressibility are thought to be lessthan the compressibility of bulk water.10 The main difficulty indetermining the intrinsic isothermal compressibility from theexperimentally determined apparent molar adiabatic compress-ibility is the need to evaluate specific contributions to thisquantity, such as the hydrational compressibility due to theinteraction of surface atomic groups with the solvent. Thepossibility that the hydrational contribution to the compressibilityis proportional to the specific solvent accessible surface area(SAS) has been explored by Kharakoz and Sarvazyan.11 Theyconcluded that, for globular proteins, the larger the specific SAS,the larger the hydrational contribution and the smaller theintrinsic compressibility.
Crystallography, fluorescence spectroscopy, nuclear magneticresonance spectroscopy (NMR), hole burning, and ultrasoundvelocity measurement are the experimental techniques used todetermine protein compressibility. Isothermal compressibilitiescalculated from the measured partial adiabatic compressibilitiesof a number of globular proteins6,10,11range from 5× 10⁻⁶ to15 × 10-6 atm-1. By comparison, bulk water has a compress-ibility of 45 × 10-6 atm-1, organic liquids have compressibilitiesbetween 45 and 174× 10-6 atm-1, and organic crystalcompressibilities range from 14 to 35× 10-6 atm-1. Globularproteins have higher apparent compressibilities than nonglobularbiological molecules perhaps because of the larger intrinsiccompressibility and smaller specific solvent accessible surface.
* Corresponding author (telephone: 765-494-5980; Fax: 765-496-1189;e-mail: [email protected], [email protected]).
715J. Phys. Chem. B2001,105,715-724
10.1021/jp0024118 CCC: $20.00 © 2001 American Chemical SocietyPublished on Web 12/30/2000

The protein intrinsic compressibility,âTint, can be calculated
from molecular dynamics (MD) simulation by using thestatistical definition of compressibility and the evolution in timeof the protein total volume. Earlier evaluations of the compress-ibility from MD simulations took a finite difference approachthat involved estimating the protein volume change on compres-sion at high pressure.12,13In this report, we describe a numericalapproach to estimate the isothermal compressibility for globularproteins from protein molecular volume fluctuations and aver-ages obtained from a single trajectory. We introduce an efficientmethod to calculate the protein total volume so that evaluationof each coordinate snapshot in the simulation trajectory ispractical.
The empirical correlation between compressibility and thechange in entropy on unfolding suggests that the variation inâT
int is useful in understanding relative stability of globularproteins. To this end, calculation of compressibility using MDsimulations is valuable by allowing simultaneous evaluation offactors such as packing density. In addition, simulations provideinsight into the nature of volume fluctuations arising fromalterations in van der Waals volume or free volume within theprotein molecular volume.14
2. Computational and Simulation Methods
Isothermal compressibility is a measure of the relative volumechange with the change in the pressure of the system kept atconstant temperature:
Statistically, the isothermal compressibility of a system ofNparticles in equilibrium at constant temperature and pressure,in a normal temperature and pressure (NTP)-Gibbs ensembleis directly related to the volume fluctuation around its averagevalue:1
wherekB is Boltzmann’s constant,T is the temperature of thesystem,⟨∆V2⟩NTP is the average volume fluctuation and⟨V⟩NTP
is the average volume. In a system at constantV and T,isothermal compressibility is calculated from particle numberaverages and fluctuations:
An equivalent formula is obtained when the fluctuation andaverage of the particle number density,F ) N/V, are used.
Molecular Dynamics Simulations in an NTP Ensemble.MD simulations of proteins in aqueous solution were calculatedat constantP andT. The crystallographic protein structures weresubjected to in vacuo energy minimization and solvated byrepeated overlays of an equilibrated cubic volume of watermolecules to fill a truncated octahedron box (Figure 1). Thetotal system volume provided a minimum of four watermolecules between the protein surface and the octahedron edge.A 10 ps trajectory allowed for the rearrangement of the watermolecules around the fixed protein atoms. The systems werethen equilibrated with no constraints for another 100 ps beforestarting the production run. The number of TIP3P15 watermolecules (4000 to 6000) and the size of the simulation boxes
(box axes between 55 and 65 Å) varied with the protein size(58-223 residues) and shape. Periodic boundary conditions wereimposed using the CRYSTAL facility in CHARMM.16 Constanttemperature (T ) 300 K) and pressure (P ) 1 atm) conditionswere applied using the Nose-Hoover method of coupling to aheat bath17,18 and extended system algorithms for controllingthe pressure of the system19,20 implemented in CHARMM.21,22
In the constant pressure method, the volume of the system is adynamic variable whose magnitude is controlled by a general-ized force that is proportional to the difference between theinternal pressure of the system and the external, fixed pressureof 1 atm. The effect of this constant pressure control is adynamic change in the volume of the system and a spacialscaling of the position of each atom in the system. Covalentbonds involving hydrogen atoms were constrained with theSHAKE algorithm23 to allow for a time step of 2 fs. Anonbonded cutoff of 12 Å and shifted forces16 were used in thecalculation of Lennard-Jones potentials. The nonbond pair listswere updated every 10 steps. The electrostatic forces andenergies were computed using the particle mesh Ewald (PME)method24,25with a charge grid spacing of 0.7 Å and direct sumtolerance of 4× 10⁻⁶ for interpolation. Structures for analysiswere saved every 0.1 ps. The simulations were carried out ona 8-node parallel machine IBM/SP2 and required 4.5-6 h ofCPU time for each 10 picosecond of MD run.
Protein Molecular Volume Calculation. We describe a newand efficient method for protein total volume calculation basedon a grid point analysis. A regular grid large enough to includethe full protein is generated in a cubic lattice with a spacing of0.2 Å. The total molecular volume of the protein comprises thesum of volumes within van der Waals radii of the atomic centers,VvdW, plus the interstitial volume,Vfree. Thus,VvdW is a sum ofall the grid points within the atomic van der Waals radiimultiplied by the volume of a cubic pixel. The atomic van derWaals radii used in this study are those in the CHARMM22parameter set. Figure 2A is a schematic representation of a slabthrough a protein, where the gray disks represent the van derWaals volume. The total protein molecular volume,Vprot, is asum of the van der Waals and unoccupied interstitial volumewithin the molecular boundary,Vprot ) VvdW + Vfree. Vfree
includes internal cavities and packing defects. Figure 2C shows
âT ) -1V(∂V
∂P)T(1)
âT ) 1kBT
⟨∆V2⟩NTP
⟨V⟩NTP
(2)
âT ) VkBT
⟨∆N2⟩VT
⟨N⟩2VT
(3)
Figure 1. SolvatedR-lactalbumin in a truncated octahedron simulationbox filled with TIP3P model water molecules.
716 J. Phys. Chem. B, Vol. 105, No. 3, 2001 Dadarlat and Post
the free (light gray) and van der Waals (dark gray) volumes ofthe protein, the sum of which is the total, extended volume(Figure 2D). The protein molecular packing density is the ratioof the van der Waals and total volumes,Pd ) VvdW/Vprot.
To obtain the value ofVprot from a grid-based calculation,the interstitial volume must be recognized as part of the spaceoccupied by the protein. This recognition is accomplished byartificially extending the atomic van der Waals radii (Figure2B). We introduce an “extension parameter”,γ, which is definedas the ratio of the expanded atomic radius,r i, and the van derWaals radius,rvdW
i , of each atomi in the protein molecule.Protein volumes, calculated as a function ofγ, are shown inFigure 3. The volume increases rapidly withγ up to a value of1.2 to 1.22 and then more slowly for larger values ofγ. Weinterpret the behavior in the first part of the graph, forγ rangingfrom 1 to 1.2-1.22, to be “filling” of cavities and packingdefects inside the protein. In the second part of the graph,γ >1.22, the volume increases more slowly withγ because all theinterstitial spaces between protein atoms have been filled andthe increase in volume is due only to external layers added atthe protein molecular surface. The value ofγ at the intersectionof the upper and lower regression lines is the “filling” parametercharacteristic to the protein and related to protein packingdensity. Thus, to calculate the total or extended volume of theprotein, the radius of each atom is multiplied by a valueγ nearthis intersection. A constant value ofγ, based on the behaviorof the volume calculated for the crystallographic averagestructures in Figure 3, was used for analyzing the MDtrajectories. To allow for volume fluctuations during thesimulation at 300 K, a value ofγ equal to 1.3, slightly largerthan 1.22, was used. The average width of the external layer ofvolume introduced by atomic extension at the protein molecularsurface is 0.54 Å (based on an average atomic radius of 1.8 Å).Therefore, according to the algorithm used in this study for theprotein total volume calculation, the protein surface lies between
its molecular surface and the solvent accessible surface obtainedusing a 1.4 Å radius probe. The total protein volume calculatedhere is smaller than the volume enclosed within the solvent-accessible surface. This technique for protein total volumecalculation has some similarities to that used for estimatingpartial molar volume of small, approximately spherical solutesin infinitely dilute hard-sphere binary mixture models.26 Forthese molecules, fitting of the model with experimental datayields a width of the “extra layer” at the molecular surfaceranging from 0.3 to 0.6 Å. With the atomic expansion ofγ )1.3, the protein interior is essentially filled, so that the packingdefects and small cavity volume are shared by the adjacentatoms; in a 10 Å cubic box centered at the protein center ofmass, there is<0.1% free volume. Thus, no large cavities inthe protein interior remain in the protein volume calculation.
Compressibility Calculation. Method 1: âT Calculated fromProtein Molecular Volume Fluctuations and AVerages.Globularprotein compressibilities were calculated from the proteinmolecular volume average and fluctuations from MD simula-tions using the NTP statistical relationship of eq 2. Proteinmolecular volumes were calculated using the method describedin the previous section withγ ) 1.3 from coordinate sets at0.4 ps intervals, yielding a total number of 2000 values for thelength of the simulation run. Figure 4 shows the protein volumehistogram for R-lactalbumin, the time average of the totalvolume, ⟨Vprot⟩, and the standard deviation in the volumedistribution, σV. The parameterσV
2 , is the total volume fluc-tuation: σV ) ⟨∆Vprot
2⟩1/2. The volume histograms are welldefined, and the compressibilities converged in∼600 ps.
Method 2: âT Calculated from Particle Number Fluctuationsand AVerages.Isothermal compressibility can be calculated fromparticle density fluctuations in a box of fixed volume (eq 3).This method4 involves immersing the region of interest in afixed-volume grid of specified size and is applicable to ahomogeneous system. It is used here to estimateâT for purewater. The time average of the number and fluctuations of theoccupied grid points are used to determine the compressibility.
Method 3: âT Calculated from Whole Simulation SystemVolume Fluctuations and AVerages.The thermodynamic system
Figure 2. A schematic of a slice through a space-filling representationof a protein to illustrate the molecular volume calculation: (A) vander Waals volume shown in dark gray is the space within atomic vander Waals radius; (B) to obtain the protein total volume, the atomicradii are expanded until the free volume inside the protein is filled;(C) van der Waals volume (light gray) plus free volume (light gray);(D) molecular protein volume as defined in this paper.
Figure 3. Protein volume as a function ofγ ) r i/rvdWi . Key: (b and
solid lines)R-lactalbumin; (4 and gray dashed lines) HEW lysozyme;(] and gray dot-dashed lines) RNase A. The total volume of eachprotein,Vtot, is the value at the intersection of the regression lines forthe upper and lower regimes of volume behavior. Atγ ) 1.0, r i )rvdW
i and the calculated volume is the van der Waals volume,VvdW, ofeach protein (they-intercept of the graph). The value ofγ ) γfill at theregression lines intercept is characteristic to each protein and is relatedto the protein packing density. The characteristicVtot, VvdW, andγfill
for R-lactalbumin are shown in the graph.
Molecular Dynamics Simulations of Protein Compressibility J. Phys. Chem. B, Vol. 105, No. 3, 2001717

that is represented by the solvated proteins in bulk water willhave a solution compressibility,âT
sol, that can be estimateddirectly from MD simulations at constantP andT. The volumeof the full truncated octahedron systems, including water andprotein, is calculated to maintain constant pressure by couplingthe size of the simulation box to the trace of the pressure tensor.The solution compressibility is estimated from these values forthe octahedron volume by calculating the whole system volumeaverage and fluctuations and using eq 2. This method is alsoused to estimate bulk water compressibility.
Error Estimates. Errors in Volume Calculation.The primarysource of error in the protein total volume calculation is theexternal layer of volume introduced by atomic expansion,γ )1.3, at the protein molecular surface. The average width of thislayer is 0.54 Å, based on an average atomic radius of 1.8 Å.The proteins are assumed to be spherical, with radius equal tothe time-average radius of gyration from the MD simulation,⟨Rgyr⟩, listed in Table 1. The relative error in the volumecalculation,δV/V, is estimated as:
The estimated error in the total volume calculation is 10% fortrypsin and 12% forR-lactalbumin, HEW lysozyme, and RNaseA. For trypsin inhibitor, the estimated error in the volumecalculation is 15%. However, not all the volume of the externallayer will constitute an error. As Lee pointed out in 1983,4 a“border” of empty space exists between a solute molecule anda solvent. This border will have a variable width, dependingon the type of protein-water interaction.
Errors in Volume Fluctuation Calculation.Errors in thevolume fluctuations are calculated assuming that the proteinvolume fluctuates between twoRgyr values: ⟨Rgyr⟩ and (⟨Rgyr⟩+ ∆Rgyr). The term∆Rgyr is the fluctuation or standard deviation
in the protein radius of gyration from MD simulations. The realfluctuation in volume is
and the calculated fluctuation that includes the external 0.54 Åwide layer is
The error in the fluctuation due the volume calculation techniqueused is:
Therefore:
The error (overestimate) introduced in total volume fluctuationvalues is 7% for trypsin, 8% forR-lactalbumin, HEW lysozyme,and RNase A, and 9% for trypsin inhibitor. Therefore, ourmethod for protein volume calculation is more accurate for largerproteins than for the smaller ones.
Errors in Compressibility Calculation.The error in thecompressibility calculation is estimated using the error propaga-tion formalism with eq 2 and the already estimated errors inthe volume and volume fluctuation calculation:
According to the relationship in eq 9 and the estimated errorsin the volume and volume fluctuations for each protein inparticular,âT is underestimated by 3% forR-lactalbumin, HEWlysozyme, RNase A, and trypsin, and by 6% for trypsin inhibitor.The very reasonable approximation of the protein compress-ibility (3-6% error) indicates that even if the total volumedistribution (histogram) is shifted toward larger than real values,the compressibility calculated from total volume fluctuations
Figure 4. Volume histogram forR-lactalbumin. The compressibility,âT
calc, is calculated using⟨V⟩ ) ⟨Vprot⟩ andσV2 ) ⟨∆V2⟩ ) ⟨∆Vprot
2 ⟩ in eq2.
δVV
)(⟨Rgyr⟩ + 0.54)3 - ⟨Rgyr⟩
3
⟨Rgyr⟩3
(4)
TABLE 1: Total Molecular, VProt, van der Waals,VVdW, and
Partial Specific, υ0, Volumes and Radii of Gyration, RGyr, forthe Protein X-ray Crystallographic Structuresa
parameter BPTIb trypsin RNase A HEW lyso R-lacta
Nresb 58 223 124 129 123c
Rgyr 11.33 16.14 14.39 14.01 14.14
V0 (mL/g)d 0.718 0.719 0.704 0.712 0.736
Mw (amu)e 6518 23 200 13 700 14 320 13 635SAS/res 70.69 42.75 57.55 53.34 58.35VvdW 6974 25 704 14 716 15 379 15 420Vexp
f 7815 27 617 16 100 17 003 17 576Vprot
calc g 9515 32 094 18 298 19 296 19 383Vprot
corr h 7992 28 884 16 138 17 018 17 095Pd
i 0.89 0.93 0.91 0.90 0.88
a Rgyr is reported in Å, SAS/res in Å2, and the volumes in Å3.b Number of residues in each protein structure.c The last six residuesin the R-lactalbumin X-ray structure are not defined.d From Gekkoand Hasegawa.10 e Protein molecular weight.f Calculated from experi-
mentalV0 andMw. g Protein molecular volume as defined in the text.h Obtained from theVprot
calc by correcting for the error introduced by theexternal layer volume (see text).i Pd ) VvdW/Vexp.
∆Vreal ) (⟨Rgyr⟩ + ∆Rgyr)3 - ⟨Rgyr⟩
3 (5)
∆Vcalc ) (⟨Rgyr⟩ + ∆Rgyr + 0.54)3 - (⟨Rgyr⟩ + 0.54)3 (6)
δ(∆V)∆V
)∆Vcalc - ∆Vreal
∆Vreal(7)
δ(∆V)∆V
)(⟨Rgyr⟩ + ∆Rgyr + 0.54)3 - (⟨Rgyr⟩ + 0.54)3
(⟨Rgyr⟩ + ∆Rgyr)3 - ⟨Rgyr⟩
3(8)
δâT
âT) 2
δ(∆V)∆V
- δVV
(9)
718 J. Phys. Chem. B, Vol. 105, No. 3, 2001 Dadarlat and Post

and protein average volume using this technique is close to itscorrect value.
3. Results and Discussion
This study reports results for five globular proteins: bovinepancreatic trypsin inhibitor (BPTI; 1bpi),27 trypsin (2ptn),28
ribonuclease A (5rsa),29 HEW lysozyme (1lzt),30 andR-lactal-bumin (1hfz).31 The coordinates for bovineR-lactalbumin, 1hfzat 2.3 Å resolution, were kindly provided for us by K. R.Acharya prior to their publication. Lysozyme (129 residues),R-lactalbumin (123 residues), and RNase A (124 residues) areglobular proteins close in molecular weight and have ap-proximately equal SAS area (Table 1). Thus, these three proteinsshould have approximately the same contribution from hydrationto their partial compressibility. Trypsin (223 residues) is a largerglobular protein and BPTI is smaller one with only 58 residues.For comparison, the isothermal compressibility of bulk water(TIP3P model) is also calculated from particle density fluctua-tions in a box of fixed volume (eq 3) and whole simulationsystem volume fluctuations (eq 2) from MD simulation of 5944water molecules, using the same simulation conditions as thefive solvated proteins.
Simulation Characteristics. Average root-mean-square dif-ferences (rms diff) in atomic coordinates for the main chainatoms, N, CR, and C, from the starting, energy minimizedcrystallographic structures range from∼1 Å for BPTI, trypsin,and HEW lysozyme to 1.4 Å forR-lactalbumin and RNase A(Figure 5). The radii of gyration of the proteins are almostconstant during the simulation, but an increase of 0.83 to 1.5%
with respect to the corresponding radius of the starting crystal-lographic structure is observed (Figure 5 and Tables 1 and 2).
Molecular Volume Calculation. Table 1 summarizes themain characteristics of the protein crystallographic structuresconsidered in this study: the number of residues,Nres, radiusof gyration,Rgyr, molecular weight,Mw, and the experimental
Figure 5. Stability of the five simulations. Time evolution of root mean square differences, rms diff, between main chain atoms of 10 ps averagestructures in the MD simulation and the crystallographic coordinates is in the left column. Time evolution of the radius of gyration,Rgyr, is in theright column.
TABLE 2: Time-Average Volumes, Radius of Gyration,Volume Fluctuations, and Compressibilities Calculated fromMD Trajectoriesa
parameter BPTIb trypsin RNase A HEW lyso R-lacta
⟨Rgyr⟩ 11.45 16.47 14.62 14.24 14.45⟨VvdW⟩ 7200 25 757 14 928 15 681 15 666⟨∆VvdW
2 ⟩1/2 11.9 25.7 20.9 21.2 21.2⟨Vprot⟩ 9960 32 620 20 400 21 191 21 439⟨∆Vprot
2 ⟩1/2 45.0 91.8 76.3 93.3 101.0⟨Vprot⟩corr 8366 29 358 17 952 18 648 18 867Pd
c 0.86 0.88 0.83 0.84 0.83âT
calc d 6.2 6.4 7.5 9.9 11.5∆âT/âT (%)e -6 -3 -3 -3 -3âT
corr f 6.6 6.5 7.8 10.2 11.8âT
exp g 5.152 5.16 5.48 7.73 12.4
a The radius of gyration is in Å, the volume and volume fluctuationsare in Å3, and the compressibility unit is 10-6 atm-1; ⟨ ⟩ designates atime average.b BPTI compressibility estimated from independentsimulation data.13,33 c Ratio between the average van der Waals,⟨VvdW⟩,and the corrected average total protein volumes,⟨Vprot⟩corr. d Isothermalcompressibility calculated using eq 2 and Method 1.e Estimated relativeerror in compressibility calculation, eq 9.f Corrected compressibilitycalculated fromâT
calc and∆âT/âT (%). g Experimental compressibilityestimated from ultrasound velocity measurements.10
Molecular Dynamics Simulations of Protein Compressibility J. Phys. Chem. B, Vol. 105, No. 3, 2001719
partial specific volumes,10 υ0. The SAS of the proteins wascalculated using Richards’ method32 with a 1.4 Å probe radius.The experimental total molecular volume,Vexp, was calculatedfrom υ0 andMw. The protein total molecular volume,Vprot
calc, andvan der Waals volume,VvdW, were estimated using the techniquejust described. The corrected total molecular volume,Vprot
corr, isobtained from theVprot
calc by correcting for the error introducedby the external layer volume (seeError Estimatesin Methods).TheVprot
corr values for the five proteins are very close to theVexp
values (Table 1). The termVexp includes any hydration contribu-tion to the partial specific protein volume, yet these contributionsappear to be negligible because the volume change on proteindenaturation is small.6,26 Thus, the similarity betweenVexp andVprot
corr values is reasonable. ThatVprotcorr for R-lactalbumin is
smaller than its experimental molecular volume reflects the factthat the crystal structure has six undefined residues. Adding anaverage volume per residue of 139 Å3 calculated from theR-lactalbumin total volume for 123 residues, the corrected totalvolume becomes 17 929 Å3, which is in good agreement withthe experimental total molecular volume of 17 576 Å3. Thecalculated average volume per residue of 139 Å3 is also closeto literature values for average residue volumes.33
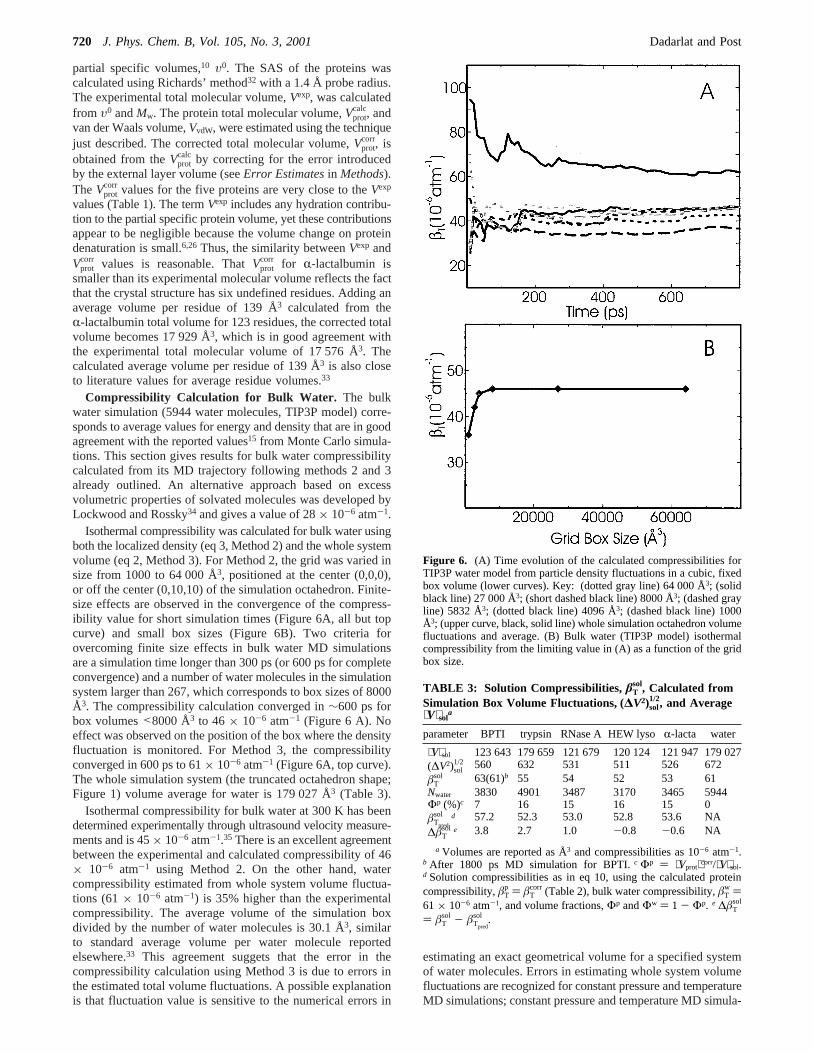
Compressibility Calculation for Bulk Water. The bulkwater simulation (5944 water molecules, TIP3P model) corre-sponds to average values for energy and density that are in goodagreement with the reported values15 from Monte Carlo simula-tions. This section gives results for bulk water compressibilitycalculated from its MD trajectory following methods 2 and 3already outlined. An alternative approach based on excessvolumetric properties of solvated molecules was developed byLockwood and Rossky34 and gives a value of 28× 10-6 atm-1.
Isothermal compressibility was calculated for bulk water usingboth the localized density (eq 3, Method 2) and the whole systemvolume (eq 2, Method 3). For Method 2, the grid was varied insize from 1000 to 64 000 Å3, positioned at the center (0,0,0),or off the center (0,10,10) of the simulation octahedron. Finite-size effects are observed in the convergence of the compress-ibility value for short simulation times (Figure 6A, all but topcurve) and small box sizes (Figure 6B). Two criteria forovercoming finite size effects in bulk water MD simulationsare a simulation time longer than 300 ps (or 600 ps for completeconvergence) and a number of water molecules in the simulationsystem larger than 267, which corresponds to box sizes of 8000Å3. The compressibility calculation converged in∼600 ps forbox volumes<8000 Å3 to 46× 10-6 atm-1 (Figure 6 A). Noeffect was observed on the position of the box where the densityfluctuation is monitored. For Method 3, the compressibilityconverged in 600 ps to 61× 10-6 atm-1 (Figure 6A, top curve).The whole simulation system (the truncated octahedron shape;Figure 1) volume average for water is 179 027 Å3 (Table 3).
Isothermal compressibility for bulk water at 300 K has beendetermined experimentally through ultrasound velocity measure-ments and is 45× 10-6 atm-1.35 There is an excellent agreementbetween the experimental and calculated compressibility of 46× 10-6 atm-1 using Method 2. On the other hand, watercompressibility estimated from whole system volume fluctua-tions (61× 10-6 atm-1) is 35% higher than the experimentalcompressibility. The average volume of the simulation boxdivided by the number of water molecules is 30.1 Å3, similarto standard average volume per water molecule reportedelsewhere.33 This agreement suggets that the error in thecompressibility calculation using Method 3 is due to errors inthe estimated total volume fluctuations. A possible explanationis that fluctuation value is sensitive to the numerical errors in
estimating an exact geometrical volume for a specified systemof water molecules. Errors in estimating whole system volumefluctuations are recognized for constant pressure and temperatureMD simulations; constant pressure and temperature MD simula-
Figure 6. (A) Time evolution of the calculated compressibilities forTIP3P water model from particle density fluctuations in a cubic, fixedbox volume (lower curves). Key: (dotted gray line) 64 000 Å3; (solidblack line) 27 000 Å3; (short dashed black line) 8000 Å3; (dashed grayline) 5832 Å3; (dotted black line) 4096 Å3; (dashed black line) 1000Å3; (upper curve, black, solid line) whole simulation octahedron volumefluctuations and average. (B) Bulk water (TIP3P model) isothermalcompressibility from the limiting value in (A) as a function of the gridbox size.
TABLE 3: Solution Compressibilities, âTsol, Calculated from
Simulation Box Volume Fluctuations, (∆V2)sol1/2, and Average
⟨V⟩sola
parameter BPTI trypsin RNase A HEW lysoR-lacta water
⟨V⟩sol 123 643 179 659 121 679 120 124 121 947 179 027(∆V2)sol
1/2 560 632 531 511 526 672âT
sol 63(61)b 55 54 52 53 61Nwater 3830 4901 3487 3170 3465 5944Φp (%)c 7 16 15 16 15 0âTpred
sol d 57.2 52.3 53.0 52.8 53.6 NAƉT
sol e 3.8 2.7 1.0 -0.8 -0.6 NA
a Volumes are reported as Å3 and compressibilities as 10-6 atm-1.b After 1800 ps MD simulation for BPTI.c Φp ) ⟨Vprot⟩corr/⟨V⟩sol.d Solution compressibilities as in eq 10, using the calculated proteincompressibility,âT
p ) âTcorr (Table 2), bulk water compressibility,âT
w )61 × 10-6 atm-1, and volume fractions,Φp andΦw ) 1 - Φp. e ∆âT
sol
) âTsol - âTpred
sol .
720 J. Phys. Chem. B, Vol. 105, No. 3, 2001 Dadarlat and Post

tions of water in a cubic shaped unit cell12 reported statisticalerrors in the volume fluctuations of 30%.
The results reported here for TIP3P water compressibilitydiffer from those reported by Jorgensen and co-workers.15 Theseauthors calculated isothermal compressibility from 1 500 000steps (configurations) generated through Monte Carlo simula-tions in an NTP ensemble at 25°C and 1 atm for systems of125 monomers, but the volume fluctuations were reported notto have converged. The reported estimate for isothermalcompressibility for the TIP3P model was 18× 10-6 atm-1. Thelow estimate in the compressibility calculation for TIP3P fromMonte Carlo simulations is likely due to number of configura-tions and the system size, based on the finite size effectsdemonstrated here in Figure 6.
Protein Compressibility Calculation and Correlation withExperimental Data. TheâT of the five proteins was calculatedaccording to Method 1 (eq 2) from protein molecular volumeaverages and fluctuations. The evolution of the molecularvolumes in time for BPTI, trypsin, HEW lysozyme, andR-lactalbumin displayed approximately unimodal volume dis-tributions (Figure 7). For ribonuclease A, the evolution of themolecular volume in time reveals a bimodal distribution withcorresponding compressibilities of 7.75× 10⁻⁶ atm-1 (from 1to 300 ps) and 7.41× 10⁻⁶ atm-1 for the second part of thetrajectory (300-800 ps). The calculated compressibility forRNase A is a weighted average of these two values. Figure 7shows a comparison between the molecular volume in time andvolume histogram for HEW lysozyme (a unimodal distribution)and RNase A (bimodal distribution).
Table 2 shows the calculated,âTcalc, and experimental,âT
exp,compressibilities of the five proteins. There is a good correlationbetween the calculated and experimental compressibilities, asshown in Figure 8 (the correlation coefficient is 0.94 and theregression coefficient is 0.697) for the four globular proteinsfor which experimental values of compressibility have been
Figure 7. Total volume in time and volume histograms for HEW lysozyme and RNase A. The volume distribution is unimodal for HEW lysozyme(bottom, left column) and bimodal for RNase A (bottom, right column).
Figure 8. Calculated versus experimental compressibility for globularproteins. Experimental compressibilities are estimated from soundvelocity measurements.10 Calculated compressibilities are from Method1, molecular volume fluctuation and average.
Molecular Dynamics Simulations of Protein Compressibility J. Phys. Chem. B, Vol. 105, No. 3, 2001721

determined from ultrasound velocity measurements.10 Accordingto eq 6, the value ofâT
calc is underestimated by 6% for BPTIand 3% for the other four proteins. The corrected compress-ibilities, âT
corr, do not improve the correlation with the experi-mental data. The correlation betweenâT
corr and other experi-mental values for compressibility14 is less satisfactory. Theexperimentalists have no explanation for the discrepanciesbetween measured values. Comparison for BPTI is made withearlier simulation studies that reported volume fluctuations33
and a finite volume difference from two MD simulations atdifferent pressures.13 Compressibility values obtained with theirresults are 5.86 and 4.43× 10⁻⁶ atm-1, respectively. ThecalculatedâT value reported here is 6.22× 10⁻⁶ atm-1. Paciand Marchi12 estimated the compressibility of HEW lysozymefrom finite difference calculations to be 9.1× 10⁻⁶ atm-1, whichis close to value calculated here from protein molecular volumefluctuations of 9.92× 10⁻⁶ atm-1.
As a general trend, the calculated compressibilities,âTcalc, are
larger than the experimental values,âTexp. The experimental
estimate of compressibility measures the intrinsic proteincomponent (contributed by the volume occupied by the proteinmolecule) and the component from the hydration layer of watermolecules. The hydration contribution is generally consideredto depend on the protein SAS.11,26 Nonetheless, the variationin experimental values ofâT cannot be accounted for by solventaccessible surface alone, as was pointed out early on.5 Thespecific SAS, SAS/res, are seen from Table 1 to differ by almost30 Å2 between BPTI (70.69 Å2) and trypsin (42.75 Å2), whereastheir compressibilities are estimated to be almost the same.Ribonuclease A, lysozyme andR-lactalbumin have very closeSAS/res values (57.55, 53.34, and 58.35 Å2, respectively), yettheir compressibility varies from 5 to 12× 10-6 atm-1. Becauseof their similar SAS as well as similar distribution of polar andnonpolar surface area,36 differences in the compressibility amongthe three proteins are likely due to intrinsic properties of theprotein rather than hydration. Together, these results suggestthat the intrinsic protein compressibility is a significant factorin the observed variation inâT among proteins.
The protein total volume fluctuations for the five proteinsstudied range from 45 to 112 Å3, representing between 0.3 and0.47% of the total protein volume. The fluctuations are due tolocal, small, and rapid (picosecond time scale) changes in bondlengths and angles and torsion angles of the protein. If thesevolume fluctuations were concentrated in one region of theprotein structure, the “cavity” created could accommodate 1.5to 4 solvent (water) molecules. The volume change would alsobe large enough to allow channel formation for the exchangebetween buried water molecules and solvent molecules.5,34Thesevolume fluctuations of globular proteins are in line with otherestimates from experimental data.3,5,10
Compressibilities calculated from density fluctuations in afixed-volume grid, Method 2, are consistent with the macro-scopic compressibility of homogeneous systems (e.g., bulkwater). This is not the case for inhomogeneous systems (e.g.,proteins) where compressibilities calculated from fixed-volumedensity fluctuations are related to the specific, local structureof the part of the protein included in the grid. For the fiveproteins studied here, compressibilities calculated from fixed-volume density fluctuations varied with the grid size andposition. We calculated compressibilities in cubic boxes withsides of 10, 14, and 20 Å centered at the protein mass center.The calculated values of the compressibility increased with thebox size, ranging from 4.5 to 9 for trypsin, from 7 to 11 forRNase A, from 9 to 13 for HEW lysozyme, and from 10 to
13(×10-6 atm-1) for R-lactalbumin. Thus, Method 2 is notreliable for estimating absolute protein molecular compressibilityas the values are not uniquely determined.
Compressibility calculation in regions of the protein moleculecontaining particular types of secondary structure elements (R-helix, â sheath, or loops) show that they have differentcontributions to the total compressibility of the protein. Com-pressibility in mostlyR regions of the proteins is lower thancompressibility in mostlyâ regions, and this is lower thancompressibility in the protein loops. The calculation has beenperformed for the HEW lysozyme MD-generated configurationsand included any solvent molecules that fall in the grid region.The calculated compressibilities are 6.6× 10⁻⁶ atm-1 for themostly R region, 7.7× 10⁻⁶ atm-1 for the mostlyâ region,and 12.3× 10⁻⁶ atm-1 for the loop-containing region. Thisresult is in qualitative agreement with the experimental resultson pressure-induced amide15N chemical shifts in BPTI, whichshow the same trend in the magnitude of the local compress-ibilitie38 and changes in the local configuration of HEWlysozyme protein crystals when high pressure is applied.39
Source of Protein Compressibility. The source of totalmolecular volume change can be assessed from the detailedinformation contained in an MD trajectory. van der Waalsvolume fluctuations,⟨∆V2
vdW⟩1/2, account for∼25% of the totalvolume fluctuations,⟨∆V2
prot⟩1/2; thus, changes in the freevolume inside the protein are the major source of volumevariation (Table 2). A compressibility value calculated from vander Waals volume fluctuations is∼1 order of magnitude smallerthan that resulting from the total molecular volume fluctuation.For example, the HEW lysozyme average van der Waals volumeis 15 681 Å3 and the van der Waals volume fluctuation is 21Å3 (Table 2). The corresponding isothermal compressibility (eq2 and Method 1) is 0.69× 10⁻⁶ atm-1. For the same protein,the total volume average is 21 191 Å3 and the volume fluctuationis 93.3 Å3, leading to a calculated isothermal compressibilityof 9.92× 10⁻⁶ atm-1. Thus, the compressibility calculated fromtotal volume average and fluctuations is 14 times higher thanthe compressibility calculated from corresponding van der Waalsvalues. The protein compressibility is due to fluctuations in theunoccupied free volume of the interstitial space in the proteininterior defined by the protein tertiary structure. The largedecrease in compressibility on protein unfolding36 can be thusrelated to the loss of protein secondary and tertiary structure.
Compressibility of the Protein-Water Solution and Hy-dration Effects. The compressibilities of the protein-watersolutions and bulk water systems were estimated from the wholetruncated octahedron average volume,⟨V⟩sol, and fluctuations,(∆V2)1/2
sol, (Table 3), as described in Method 3. This approachallows a direct assessment of the hydration water contributionto solution compressibility because fluctuations in the totalsimulation box volume are due to fluctuations in the volumeoccupied by water as well as fluctuations in the proteinmolecular volume. The protein-water solution compressibilities,âT
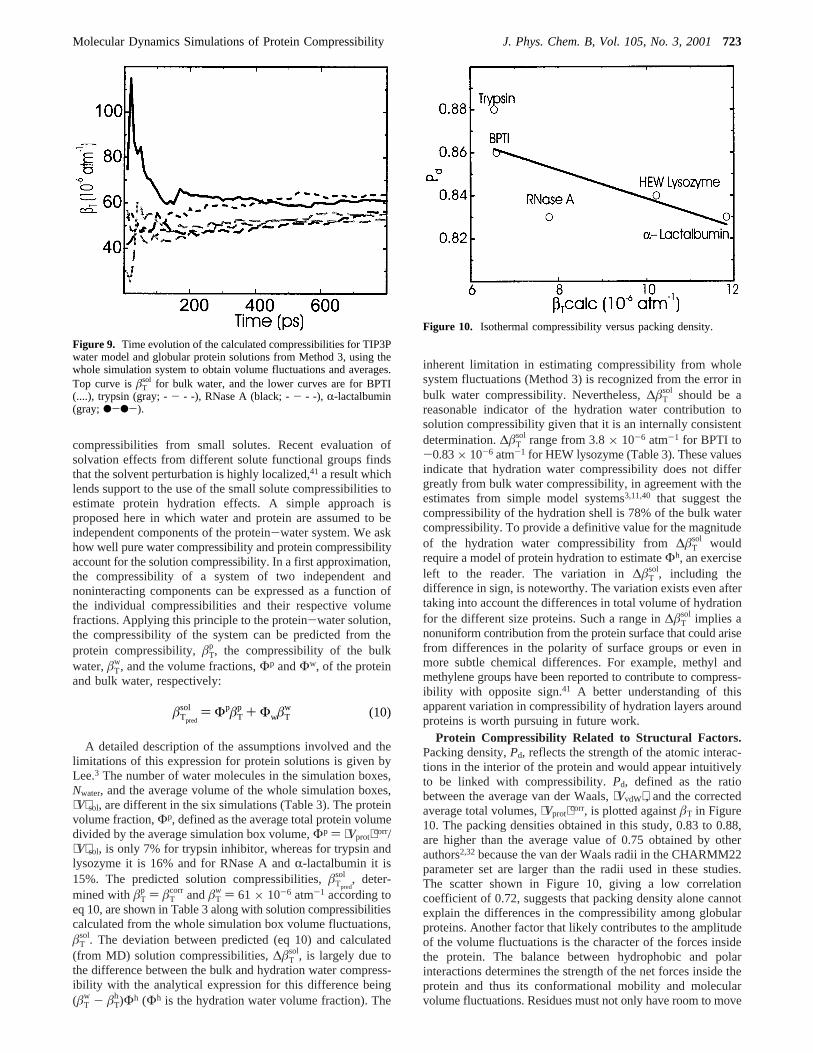
sol (Table 3), are between 53 and 63× 10-6 atm-1, comparedwith the compressibility of bulk water calculated from wholesystem volume fluctuations of 61× 10-6 atm-1. Figure 9 showsthe evolution in time of the calculated solution compressibilitiesfor the five proteins (lower curves) and bulk water (top curve).
The detailed information provided by MD simulations isexploited to investigate the extent to which the compressibilityof hydration water differs from that of bulk water. The hydrationwater compressibility has been estimated in the literature to bebetween 18 and 39× 10-6 atm-1.5,11,40 These estimates arebased on a hydration shell model for proteins and experimental
722 J. Phys. Chem. B, Vol. 105, No. 3, 2001 Dadarlat and Post
compressibilities from small solutes. Recent evaluation ofsolvation effects from different solute functional groups findsthat the solvent perturbation is highly localized,41 a result whichlends support to the use of the small solute compressibilities toestimate protein hydration effects. A simple approach isproposed here in which water and protein are assumed to beindependent components of the protein-water system. We askhow well pure water compressibility and protein compressibilityaccount for the solution compressibility. In a first approximation,the compressibility of a system of two independent andnoninteracting components can be expressed as a function ofthe individual compressibilities and their respective volumefractions. Applying this principle to the protein-water solution,the compressibility of the system can be predicted from theprotein compressibility,âT
p, the compressibility of the bulkwater,âT
w, and the volume fractions,Φp andΦw, of the proteinand bulk water, respectively:
A detailed description of the assumptions involved and thelimitations of this expression for protein solutions is given byLee.3 The number of water molecules in the simulation boxes,Nwater, and the average volume of the whole simulation boxes,⟨V⟩sol, are different in the six simulations (Table 3). The proteinvolume fraction,Φp, defined as the average total protein volumedivided by the average simulation box volume,Φp ) ⟨Vprot⟩corr/⟨V⟩sol, is only 7% for trypsin inhibitor, whereas for trypsin andlysozyme it is 16% and for RNase A andR-lactalbumin it is15%. The predicted solution compressibilities,âTpred
sol , deter-mined withâT
p ) âTcorr andâT
w ) 61 × 10-6 atm-1 according toeq 10, are shown in Table 3 along with solution compressibilitiescalculated from the whole simulation box volume fluctuations,âT
sol. The deviation between predicted (eq 10) and calculated(from MD) solution compressibilities,ƉT
sol, is largely due tothe difference between the bulk and hydration water compress-ibility with the analytical expression for this difference being(âT
w - âTh)Φh (Φh is the hydration water volume fraction). The
inherent limitation in estimating compressibility from wholesystem fluctuations (Method 3) is recognized from the error inbulk water compressibility. Nevertheless,ƉT
sol should be areasonable indicator of the hydration water contribution tosolution compressibility given that it is an internally consistentdetermination.ƉT
sol range from 3.8× 10⁻⁶ atm-1 for BPTI to-0.83× 10⁻⁶ atm-1 for HEW lysozyme (Table 3). These valuesindicate that hydration water compressibility does not differgreatly from bulk water compressibility, in agreement with theestimates from simple model systems3,11,40 that suggest thecompressibility of the hydration shell is 78% of the bulk watercompressibility. To provide a definitive value for the magnitudeof the hydration water compressibility from∆âT
sol wouldrequire a model of protein hydration to estimateΦh, an exerciseleft to the reader. The variation in∆âT
sol, including thedifference in sign, is noteworthy. The variation exists even aftertaking into account the differences in total volume of hydrationfor the different size proteins. Such a range inƉT
sol implies anonuniform contribution from the protein surface that could arisefrom differences in the polarity of surface groups or even inmore subtle chemical differences. For example, methyl andmethylene groups have been reported to contribute to compress-ibility with opposite sign.41 A better understanding of thisapparent variation in compressibility of hydration layers aroundproteins is worth pursuing in future work.
Protein Compressibility Related to Structural Factors.Packing density,Pd, reflects the strength of the atomic interac-tions in the interior of the protein and would appear intuitivelyto be linked with compressibility.Pd, defined as the ratiobetween the average van der Waals,⟨VvdW⟩, and the correctedaverage total volumes,⟨Vprot⟩corr, is plotted againstâT in Figure10. The packing densities obtained in this study, 0.83 to 0.88,are higher than the average value of 0.75 obtained by otherauthors2,32because the van der Waals radii in the CHARMM22parameter set are larger than the radii used in these studies.The scatter shown in Figure 10, giving a low correlationcoefficient of 0.72, suggests that packing density alone cannotexplain the differences in the compressibility among globularproteins. Another factor that likely contributes to the amplitudeof the volume fluctuations is the character of the forces insidethe protein. The balance between hydrophobic and polarinteractions determines the strength of the net forces inside theprotein and thus its conformational mobility and molecularvolume fluctuations. Residues must not only have room to move
Figure 9. Time evolution of the calculated compressibilities for TIP3Pwater model and globular protein solutions from Method 3, using thewhole simulation system to obtain volume fluctuations and averages.Top curve isâT
sol for bulk water, and the lower curves are for BPTI(....), trypsin (gray; -- - -), RNase A (black; -- - -), R-lactalbumin(gray; b-b-).
âTpred
sol ) ΦpâTp + ΦwâT
w (10)
Figure 10. Isothermal compressibility versus packing density.
Molecular Dynamics Simulations of Protein Compressibility J. Phys. Chem. B, Vol. 105, No. 3, 2001723
(i.e., low packing density), but also the freedom to do so (i.e.,not engaged in strong, directional interactions). Other factorsthat could influence the magnitude of the compressibility arethe hydration effect and the number of disulfide bonds. Valuesfor the SAS/res are given in Table 1. The number of disulfidebonds per total number of amino acids for BPTI,R-lactalbumin,lysozyme, ribonuclease A, and trypsin are 3/58, 4/123, 4/129,4/124, and 6/223, respectively.
The isothermal compressibility of globular proteins does notappear to be explained by the correlation with a single variable.Rather, the compressibility is a complex function that may resultfrom a combination of factors, such as protein packing density,hydrophobicity, polarity, specific solvent accessible area, numberof disulfide bonds per amino acid, and the type of secondarystructure elements.
4. Conclusions
In this paper, we describe an algorithm to estimate theintrinsic compressibility for globular proteins from MD simula-tions in an NTP ensemble using the statistical definition ofcompressibility and an efficient method to calculate proteinmolecular volumes.
A high correlation between experimental compressibilities andcalculated isothermal compressibilities for globular proteins isfound. Compressibility of globular proteins results largely fromimperfect packing, which allows for large fluctuations in theinterstitial space in the protein interior. van der Waals volumefluctuations account for only 10% of the protein compressibility.Variations in protein compressibility appear to be related todifferences in packing densities, although other factors, suchas the specific solvent accessible areas and the strength andcharacter of the average interatomic forces, are likely tocontribute. A simple approach to assess the contribution tosolution compressibility from hydration waters suggests a smalldifference between hydration and bulk water compressibility.
Calculated isothermal compressibility for bulk water, TIP3Pmodel, is in excellent agreement with the experimental data.Two criteria to overcome finite-size effects in bulk watersimulation emerged: convergence required a simulation timelonger than 300 ps (600 ps for complete convergence ofcompressibility calculation) and a simulation size of∼260 ormore water molecules.
Acknowledgment. This work was supported in part by aDOE/Sloan Fundation Postdoctoral Fellowship to V. M. D., NIHgrant AI39639 to C. B. P., and a Research Career DevelopmentAward GM 00661 to C. B. P. The Structural Biology group atPurdue University received support from the Lucille P. MarkeyFoundation and the Purdue Academic Reinvestment Program.The authors thank Drs. B. K. Lee, T. Ichiye, and B. Lucier forhelpful suggestions and discussions.
References and Notes
(1) Hill T. L. An Introduction to Statistical Thermodynamics; Addison-Wesley: Reading, MA, 1960; pp 37-38.
(2) Richards, F. M.; Lim, W. A.Quart. ReV. Biophys.1994, 26, 423.(3) Lee, B.Proc. Natl. Acad. Sci. U.S.A.1983, 80, 622.(4) Phelps, D.; Post, C. B.J. Mol. Biol. 1995, 254, 544.(5) Eden, D.; Matthew, J. B.; Rosa, J. J.; Richards, F. M.Proc. Natl.
Acad. Sci. U.S.A.1982, 79, 815.(6) Chalikian, T. V.; Gindikin, V. S.; Breslauer, K. J.J. Mol. Biol.
1995, 250, 291.(7) Gekko, K.; Tamura, Y.; Ohmae, E.; Hayashi, H.; Kagamiyama,
H.; Ueno, H.Protein Sci.1996, 5(3), 542.(8) Phelps, D.; Rossky, P.; Post, C. B.J. Mol. Biol. 1998, 276, 331.(9) Tsang, S. K.; Danthi, P.; Chow, M.; Hogle, J. M.J. Mol. Biol.
2000, 296, 335.(10) Gekko, K.; Hasegawa, Y.Biochemistry1986, 25, 6563.(11) Kharakoz, D. P.; Sarvazyan, A. P.Biopolymers1993, 33, 11.(12) Paci, E.; Marchi, M.Proc. Natl. Acad. Sci. U.S.A.1996, 93, 11609.(13) Kitchen, D. B.; Reed, L. H.; Levy, R. M.Biochemistry1992, 31,
10083.(14) Chalikian, T. V.; Totrov, M.; Abagyan, R.; Breslauer, K. J.J. Mol.
Biol. 1996, 260, 588.(15) Jorgensen, W. L.; Chandarsekhar, J.; Medura, J. D.; Impey, R. W.;
Klein, M. L. J. Chem. Phys.1983, 79, 926.(16) Brooks, B. R.; Bruccoleri, R. E.; Olafson, B. D.; States, D. J.;
Swaminatha, S.; Karplus, M. itJ. Comput. Chem. 1983, 4, 187.(17) Nose, S. J. Chem. Phys.1984, 81(1), 511.(18) Hoover, W. G.Phys. ReV. A 1985, 31(3), 1695.(19) Andersen, H. C.J. Chem. Phys.1980, 72, 2384.(20) Nose, S.; Klein, M. L. Mol. Phys.1983, 50, 1055.(21) Feller, S. E.; Zhang, Y. H.; Pastor, R. W.; Brooks, B. R.J. Chem.
Phys.1995, 103(11), 4613.(22) Zhang, Y. H.; Feller, S. E.; Brooks, B. R.; Pastor, R. W.J. Chem.
Phys.1995, 103(23), 10252.(23) Ryckaert, J. P.; Cicotti, G.; Berendsen, H. J. C.J. Comput. Phys.
1977, 23, 327.(24) Essmann, E.; Perrera, L.; Berkovitz, M. L.; Darden, T.; Lee, H.;
Pedersen, L. G.J. Chem. Phys.1995, 103, 8577.(25) Darden, T.; York, D.; Pedersen, L.J. Chem. Phys.1993, 98, 10089.(26) Lee, B.J. Phys. Chem.1983, 87, 112.(27) Parkin, S.; Rupp, B.; Hope, H., unpublished results.(28) Walter, J.; Steigemann, W.; Singh, T. P.; Bartunik, H.; Bode, W.;
Huber, R.Acta Crystallogr. B1982, 38, 1982.(29) Wlodawer, A.; Borkakoti, N.; Moss, D. S.; Howlin, B.Acta
Crystallogr. B1986, 42, 379.(30) Hodsgon, J. M.; Brown, G. M.; Sieker, L. C.; Jensen, L. H.Acta
Crystallogr. B1990, 46(5), 54.(31) Pike, A. C.; Brew, K.; Acharya, K. R.Structure1996, 4, 691.(32) Richards, F. M.Annu. ReV. Biophys. Bioeng.1977, 6, 151.(33) Gerstein, M.; Tsai, J.; Levitt, M.J. Mol. Biol. 1995, 249, 955.(34) Lockwood, D. M.; Rossky P. J.J. Phys. Chem. B1999, 103, 1982.(35) Dorsey, N. E.Properties of Ordinary Water Substances; Rhein-
hold: New York, 1940.(36) Chalikian, T. V.; Breslauer, K. J.Proc. Natl. Acad. Sci. U.S.A.1996,
93, 1012.(37) Cooper, A.Proc. Natl. Acad. Sci. U.S.A.1976, 92, 2740.(38) Akasaka, K.; Li, H.; Yamada, H.; Li, R.; Thorensen, T.; Woodward,
C. K. Protein Sci.1999, 8, 1946.(39) Kundrot, C. E.; Richards, F. M.J. Mol. Biol. 1987, 193, 157.(40) Chalikian, T. V.; Sarvazyan, A. P.; Breslauer, K. J.Biophys. Chem.
1994, 51, 89.(41) Lockwood, D. M.; Rossky P. J.; Levy, R. M.J. Phys. Chem. B
2000, 104, 4210.
724 J. Phys. Chem. B, Vol. 105, No. 3, 2001 Dadarlat and Post