Embed Size (px)
Citation preview
METROPOLITAN CONDO OUTLOOK WINTER 2015
Insights Into the Apartment Condominium Market in Eight Large Canadian Metropolitan Areas.

About Genworth CanadaGenworth MI Canada Inc. (TSX: MIC) through its subsidi-ary, Genworth Financial Mortgage Insurance Company Canada (Genworth Canada), is the largest private residen-tial mortgage insurer in Canada. The Company provides mortgage default insurance to Canadian residential mort-gage lenders, making homeownership more accessible to first-time homebuyers. Genworth Canada differentiates itself through customer service excellence, innovative processing technology, and a robust risk management framework. For almost two decades, Genworth Canada has supported the housing market by providing thought leader-ship and a focus on the safety and soundness of the mort-gage finance system. As at December 31, 2014, Genworth Canada had $5.8 billion total assets and $3.3 billion total shareholders’ equity.
Find out more at www.genworth.ca.
PrefaceThis report from The Conference Board of Canada and Genworth Canada offers an in-depth analysis of the con-dominium market for eight large Canadian census metro-politan areas (CMAs). The report covers a wide range of condominium market statistics, such as starts, completions, absorptions, and prices. The main goal of this publication is to analyze the recent trends in the condo market in each of the eight CMAs, as well as where each of the eight markets is heading over the next five years.
The eight census metropolitan areas covered are Québec City, Montréal, Ottawa, Toronto, Calgary, Edmonton, Vancouver, and Victoria.
This report is published twice a year, in summer and winter.
Metropolitan Condo Outlook: Insights Into the Apartment Condominium Market in Eight Large Canadian Metropolitan Areasby Jane McIntyre and Robin Wiebe
About The Conference Board of CanadaWe are:
� The foremost independent, not-for-profit, applied
research organization in Canada.
� Objective and non-partisan. We do not lobby
for specific interests.
� Funded exclusively through the fees we charge
for services to the private and public sectors.
� Experts in running conferences but also at con-
ducting, publishing, and disseminating research;
helping people network; developing individual
leadership skills; and building organizational
capacity.
� Specialists in economic trends, as well
as organizational performance and public
policy issues.
� Not a government department or agency,
although we are often hired to provide
services for all levels of government.
� Independent from, but affiliated with, The
Conference Board, Inc. of New York, which
serves nearly 2,000 companies in 60 nations
and has offices in Brussels and Hong Kong.
©2015 The Conference Board of Canada*Published in Canada • All rights reservedAgreement No. 40063028*Incorporated as AERIC Inc.
®The Conference Board of Canada and the torch logo are registered trademarks of The Conference Board, Inc.
Forecasts and research often involve numerous assumptions and data sources, and are subject to inherent risks and uncertainties. This information is not intended as specific investment, accounting, legal, or tax advice.
Contents
Overview . . . . . . . . . . . . . . . . . . . . . . . . . . . . . . . . . . . . . . . . . . . . . . . . . . . . . . . . . . . . . . . . . . . . . . . . . 1
Metropolitan Insights . . . . . . . . . . . . . . . . . . . . . . . . . . . . . . . . . . . . . . . . . . . . . . . . . . . . . . . . . . . . . . . 3Québec City . . . . . . . . . . . . . . . . . . . . . . . . . . . . . . . . . . . . . . . . . . . . . . . . . . . . . . . . . . . . . . . . . . . . . . . . . . . . . . . . 3
Montréal. . . . . . . . . . . . . . . . . . . . . . . . . . . . . . . . . . . . . . . . . . . . . . . . . . . . . . . . . . . . . . . . . . . . . . . . . . . . . . . . . . . 6
Ottawa . . . . . . . . . . . . . . . . . . . . . . . . . . . . . . . . . . . . . . . . . . . . . . . . . . . . . . . . . . . . . . . . . . . . . . . . . . . . . . . . . . . . 9
Toronto . . . . . . . . . . . . . . . . . . . . . . . . . . . . . . . . . . . . . . . . . . . . . . . . . . . . . . . . . . . . . . . . . . . . . . . . . . . . . . . . . . . 12
Calgary. . . . . . . . . . . . . . . . . . . . . . . . . . . . . . . . . . . . . . . . . . . . . . . . . . . . . . . . . . . . . . . . . . . . . . . . . . . . . . . . . . . 15
Edmonton. . . . . . . . . . . . . . . . . . . . . . . . . . . . . . . . . . . . . . . . . . . . . . . . . . . . . . . . . . . . . . . . . . . . . . . . . . . . . . . . . 18
Vancouver . . . . . . . . . . . . . . . . . . . . . . . . . . . . . . . . . . . . . . . . . . . . . . . . . . . . . . . . . . . . . . . . . . . . . . . . . . . . . . . . 21
Victoria. . . . . . . . . . . . . . . . . . . . . . . . . . . . . . . . . . . . . . . . . . . . . . . . . . . . . . . . . . . . . . . . . . . . . . . . . . . . . . . . . . . 24
Definitions and Concepts . . . . . . . . . . . . . . . . . . . . . . . . . . . . . . . . . . . . . . . . . . . . . . . . . . . . . . . . . . 27
Standard Geographical Classification (SGC) 2006 . . . . . . . . . . . . . . . . . . . . . . . . . . . . . . . . . . . . . . 28Metropolitan Areas With Their Component Census Subdivisions . . . . . . . . . . . . . . . . . . . . . . . . . . . . . . . . . . . . . 28

The Conference Board of Canada/Genworth Canada
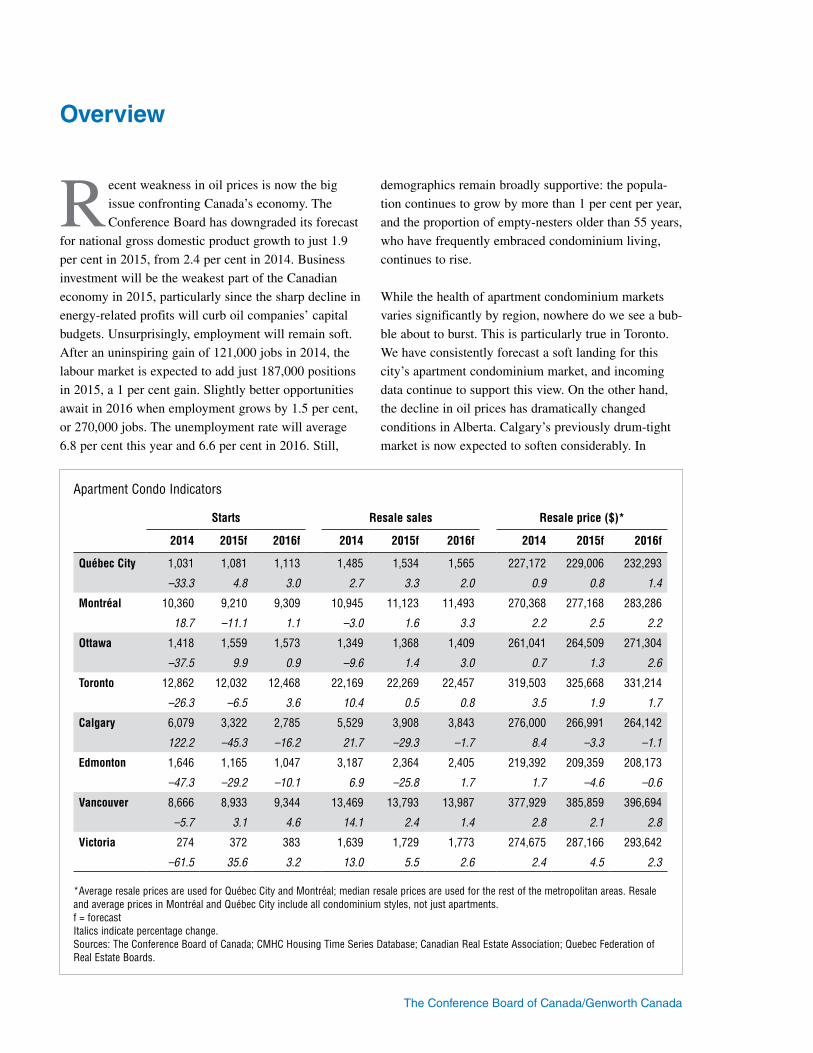
Recent weakness in oil prices is now the big
issue confronting Canada’s economy. The
Conference Board has downgraded its forecast
for national gross domestic product growth to just 1.9
per cent in 2015, from 2.4 per cent in 2014. Business
investment will be the weakest part of the Canadian
economy in 2015, particularly since the sharp decline in
energy-related profits will curb oil companies’ capital
budgets. Unsurprisingly, employment will remain soft.
After an uninspiring gain of 121,000 jobs in 2014, the
labour market is expected to add just 187,000 positions
in 2015, a 1 per cent gain. Slightly better opportunities
await in 2016 when employment grows by 1.5 per cent,
or 270,000 jobs. The unemployment rate will average
6.8 per cent this year and 6.6 per cent in 2016. Still,
demographics remain broadly supportive: the popula-
tion continues to grow by more than 1 per cent per year,
and the proportion of empty-nesters older than 55 years,
who have frequently embraced condominium living,
continues to rise.
While the health of apartment condominium markets
varies significantly by region, nowhere do we see a bub-
ble about to burst. This is particularly true in Toronto.
We have consistently forecast a soft landing for this
city’s apartment condominium market, and incoming
data continue to support this view. On the other hand,
the decline in oil prices has dramatically changed
conditions in Alberta. Calgary’s previously drum-tight
market is now expected to soften considerably. In
Overview
Apartment Condo Indicators
Starts Resale sales Resale price ($)*
2014 2015f 2016f 2014 2015f 2016f 2014 2015f 2016f
Québec City 1,031 1,081 1,113 1,485 1,534 1,565 227,172 229,006 232,293
–33.3 4.8 3.0 2.7 3.3 2.0 0.9 0.8 1.4
Montréal 10,360 9,210 9,309 10,945 11,123 11,493 270,368 277,168 283,286
18.7 –11.1 1.1 –3.0 1.6 3.3 2.2 2.5 2.2
Ottawa 1,418 1,559 1,573 1,349 1,368 1,409 261,041 264,509 271,304
–37.5 9.9 0.9 –9.6 1.4 3.0 0.7 1.3 2.6
Toronto 12,862 12,032 12,468 22,169 22,269 22,457 319,503 325,668 331,214
–26.3 –6.5 3.6 10.4 0.5 0.8 3.5 1.9 1.7
Calgary 6,079 3,322 2,785 5,529 3,908 3,843 276,000 266,991 264,142
122.2 –45.3 –16.2 21.7 –29.3 –1.7 8.4 –3.3 –1.1
Edmonton 1,646 1,165 1,047 3,187 2,364 2,405 219,392 209,359 208,173
–47.3 –29.2 –10.1 6.9 –25.8 1.7 1.7 –4.6 –0.6
Vancouver 8,666 8,933 9,344 13,469 13,793 13,987 377,929 385,859 396,694
–5.7 3.1 4.6 14.1 2.4 1.4 2.8 2.1 2.8
Victoria 274 372 383 1,639 1,729 1,773 274,675 287,166 293,642
–61.5 35.6 3.2 13.0 5.5 2.6 2.4 4.5 2.3
*Average resale prices are used for Québec City and Montréal; median resale prices are used for the rest of the metropolitan areas. Resale and average prices in Montréal and Québec City include all condominium styles, not just apartments.f = forecastItalics indicate percentage change.Sources: The Conference Board of Canada; CMHC Housing Time Series Database; Canadian Real Estate Association; Quebec Federation of Real Estate Boards.
2 | Metropolitan Condo Outlook—Winter 2015
The Conference Board of Canada/Genworth Canada
Edmonton, the market was not as strained, but slow-
ing is also expected. Vancouver’s apartment market is
improving, but remains burdened by high inventories
of unsold units and subject to the vagaries of offshore
demand. An improving job market in Victoria will sup-
port healthier demand for all forms of housing. Soft
economies are limiting residential demand in Ottawa,
Montréal, and Québec City. Apartment markets in the
latter two areas look overbuilt. Since many condomin-
iums are sold to first-time buyers, the tightening of
mortgage rules over the past few years has probably
crimped demand for these units.
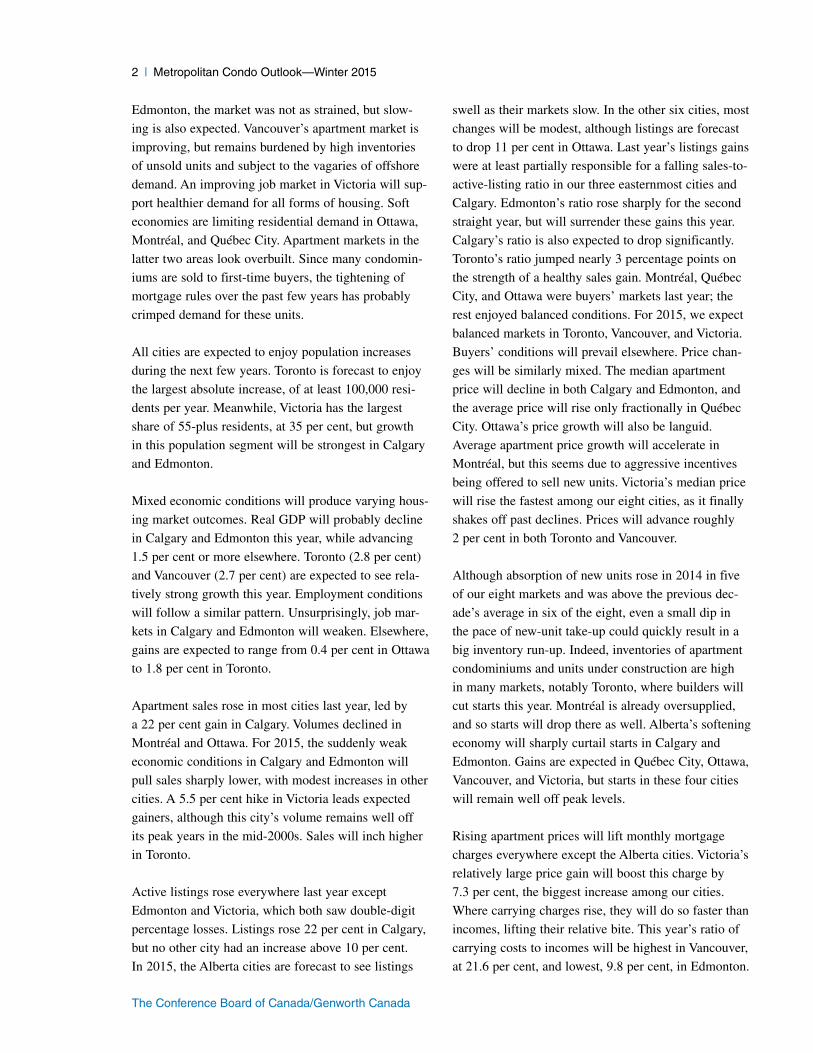
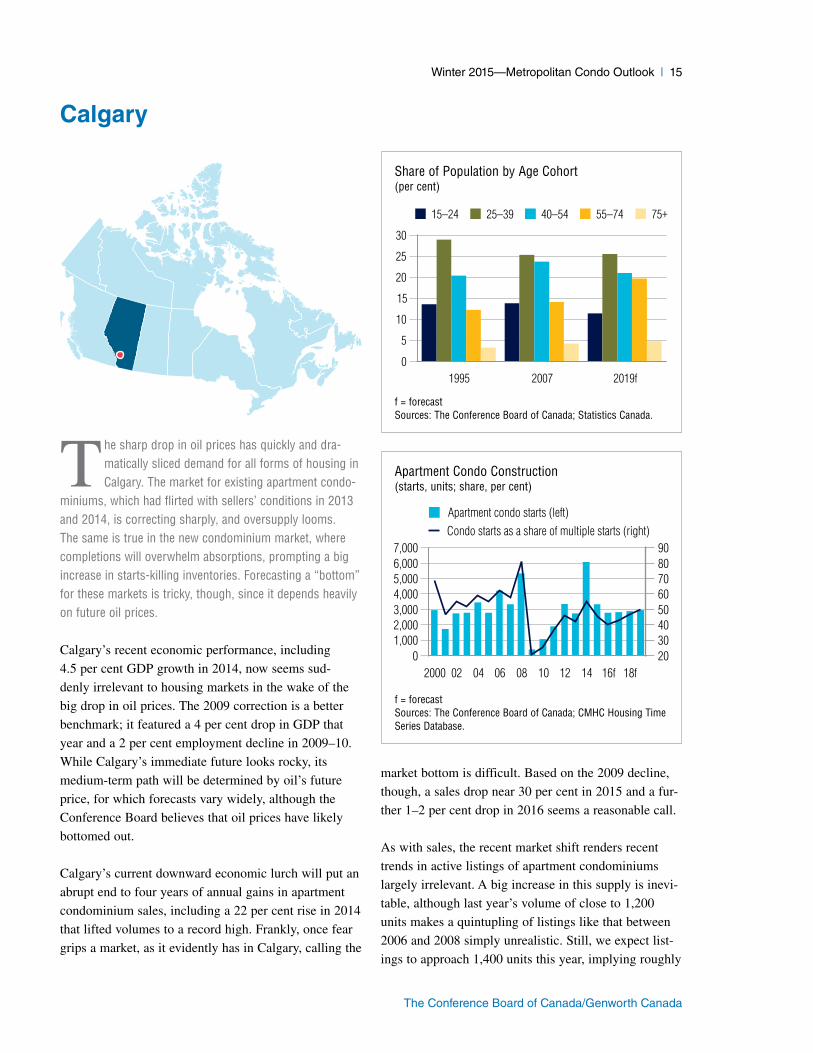
All cities are expected to enjoy population increases
during the next few years. Toronto is forecast to enjoy
the largest absolute increase, of at least 100,000 resi-
dents per year. Meanwhile, Victoria has the largest
share of 55-plus residents, at 35 per cent, but growth
in this population segment will be strongest in Calgary
and Edmonton.
Mixed economic conditions will produce varying hous-
ing market outcomes. Real GDP will probably decline
in Calgary and Edmonton this year, while advancing
1.5 per cent or more elsewhere. Toronto (2.8 per cent)
and Vancouver (2.7 per cent) are expected to see rela-
tively strong growth this year. Employment conditions
will follow a similar pattern. Unsurprisingly, job mar-
kets in Calgary and Edmonton will weaken. Elsewhere,
gains are expected to range from 0.4 per cent in Ottawa
to 1.8 per cent in Toronto.
Apartment sales rose in most cities last year, led by
a 22 per cent gain in Calgary. Volumes declined in
Montréal and Ottawa. For 2015, the suddenly weak
economic conditions in Calgary and Edmonton will
pull sales sharply lower, with modest increases in other
cities. A 5.5 per cent hike in Victoria leads expected
gainers, although this city’s volume remains well off
its peak years in the mid-2000s. Sales will inch higher
in Toronto.
Active listings rose everywhere last year except
Edmonton and Victoria, which both saw double-digit
percentage losses. Listings rose 22 per cent in Calgary,
but no other city had an increase above 10 per cent.
In 2015, the Alberta cities are forecast to see listings
swell as their markets slow. In the other six cities, most
changes will be modest, although listings are forecast
to drop 11 per cent in Ottawa. Last year’s listings gains
were at least partially responsible for a falling sales-to-
active-listing ratio in our three easternmost cities and
Calgary. Edmonton’s ratio rose sharply for the second
straight year, but will surrender these gains this year.
Calgary’s ratio is also expected to drop significantly.
Toronto’s ratio jumped nearly 3 percentage points on
the strength of a healthy sales gain. Montréal, Québec
City, and Ottawa were buyers’ markets last year; the
rest enjoyed balanced conditions. For 2015, we expect
balanced markets in Toronto, Vancouver, and Victoria.
Buyers’ conditions will prevail elsewhere. Price chan-
ges will be similarly mixed. The median apartment
price will decline in both Calgary and Edmonton, and
the average price will rise only fractionally in Québec
City. Ottawa’s price growth will also be languid.
Average apartment price growth will accelerate in
Montréal, but this seems due to aggressive incentives
being offered to sell new units. Victoria’s median price
will rise the fastest among our eight cities, as it finally
shakes off past declines. Prices will advance roughly
2 per cent in both Toronto and Vancouver.
Although absorption of new units rose in 2014 in five
of our eight markets and was above the previous dec-
ade’s average in six of the eight, even a small dip in
the pace of new-unit take-up could quickly result in a
big inventory run-up. Indeed, inventories of apartment
condominiums and units under construction are high
in many markets, notably Toronto, where builders will
cut starts this year. Montréal is already oversupplied,
and so starts will drop there as well. Alberta’s softening
economy will sharply curtail starts in Calgary and
Edmonton. Gains are expected in Québec City, Ottawa,
Vancouver, and Victoria, but starts in these four cities
will remain well off peak levels.
Rising apartment prices will lift monthly mortgage
charges everywhere except the Alberta cities. Victoria’s
relatively large price gain will boost this charge by
7.3 per cent, the biggest increase among our cities.
Where carrying charges rise, they will do so faster than
incomes, lifting their relative bite. This year’s ratio of
carrying costs to incomes will be highest in Vancouver,
at 21.6 per cent, and lowest, 9.8 per cent, in Edmonton.
Winter 2015—Metropolitan Condo Outlook | 3
The Conference Board of Canada/Genworth Canada
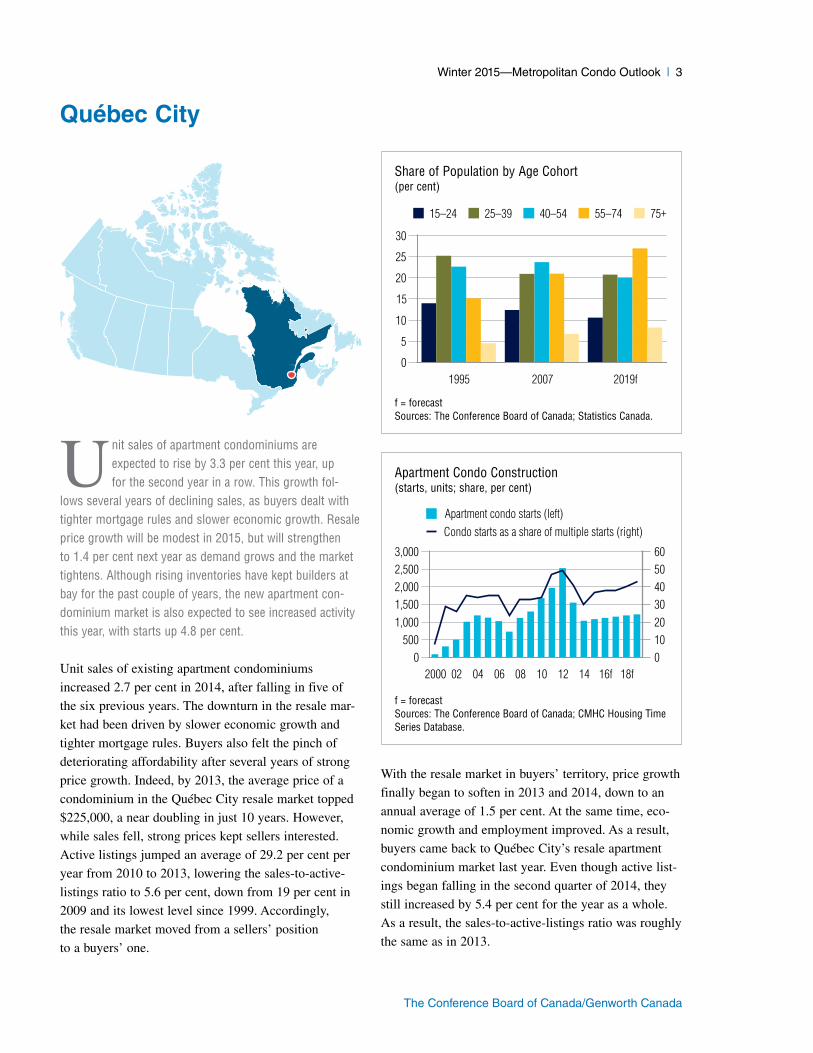
U nit sales of apartment condominiums are expected to rise by 3.3 per cent this year, up for the second year in a row. This growth fol-
lows several years of declining sales, as buyers dealt with tighter mortgage rules and slower economic growth. Resale price growth will be modest in 2015, but will strengthen to 1.4 per cent next year as demand grows and the market tightens. Although rising inventories have kept builders at bay for the past couple of years, the new apartment con-dominium market is also expected to see increased activity this year, with starts up 4.8 per cent.
Unit sales of existing apartment condominiums
increased 2.7 per cent in 2014, after falling in five of
the six previous years. The downturn in the resale mar-
ket had been driven by slower economic growth and
tighter mortgage rules. Buyers also felt the pinch of
deteriorating affordability after several years of strong
price growth. Indeed, by 2013, the average price of a
condominium in the Québec City resale market topped
$225,000, a near doubling in just 10 years. However,
while sales fell, strong prices kept sellers interested.
Active listings jumped an average of 29.2 per cent per
year from 2010 to 2013, lowering the sales-to-active-
listings ratio to 5.6 per cent, down from 19 per cent in
2009 and its lowest level since 1999. Accordingly,
the resale market moved from a sellers’ position
to a buyers’ one.
With the resale market in buyers’ territory, price growth
finally began to soften in 2013 and 2014, down to an
annual average of 1.5 per cent. At the same time, eco-
nomic growth and employment improved. As a result,
buyers came back to Québec City’s resale apartment
condominium market last year. Even though active list-
ings began falling in the second quarter of 2014, they
still increased by 5.4 per cent for the year as a whole.
As a result, the sales-to-active-listings ratio was roughly
the same as in 2013.
Metropolitan Insights
Québec City
Share of Population by Age Cohort(per cent)
f = forecastSources: The Conference Board of Canada; Statistics Canada.
1995 2007 2019f0
5
10
15
20
25
30
15–24 25–39 40–54 55–74 75+
Apartment Condo Construction(starts, units; share, per cent)
f = forecastSources: The Conference Board of Canada; CMHC Housing Time Series Database.
2000 02 04 06 08 10 12 14 16f 18f0
5001,0001,5002,0002,5003,000
0102030405060
Apartment condo starts (left)Condo starts as a share of multiple starts (right)
4 | Metropolitan Condo Outlook—Winter 2015
The Conference Board of Canada/Genworth Canada
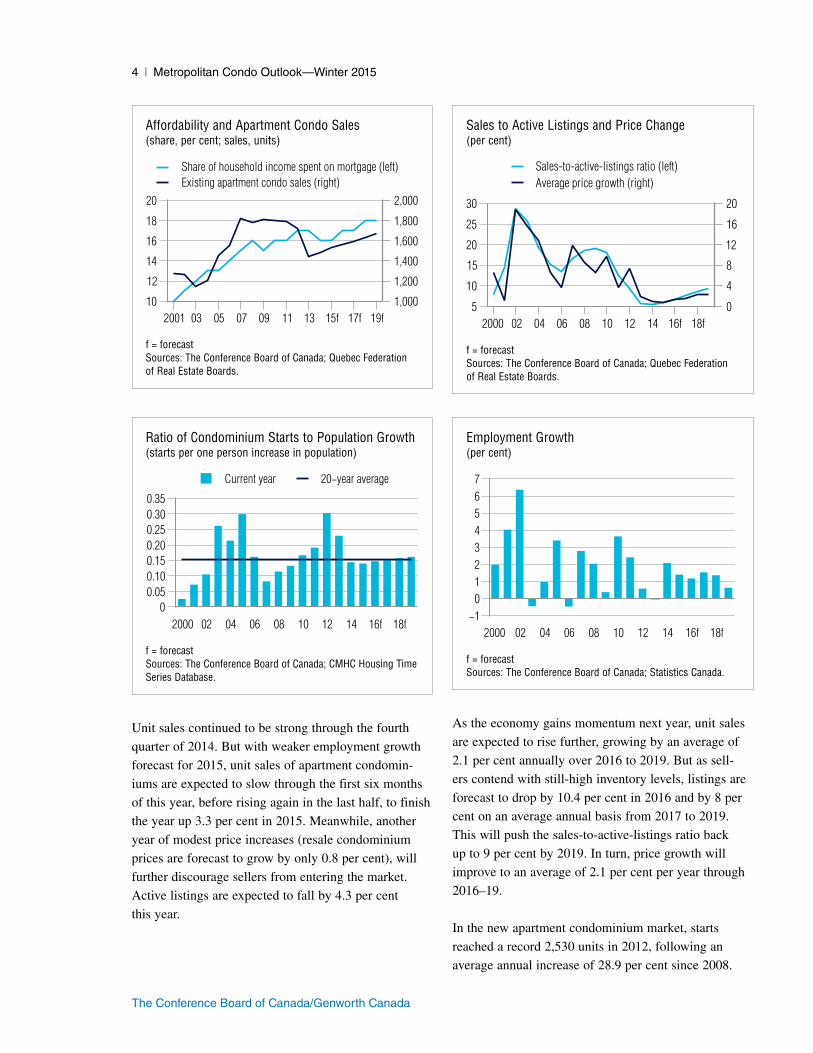
Unit sales continued to be strong through the fourth
quarter of 2014. But with weaker employment growth
forecast for 2015, unit sales of apartment condomin-
iums are expected to slow through the first six months
of this year, before rising again in the last half, to finish
the year up 3.3 per cent in 2015. Meanwhile, another
year of modest price increases (resale condominium
prices are forecast to grow by only 0.8 per cent), will
further discourage sellers from entering the market.
Active listings are expected to fall by 4.3 per cent
this year.
As the economy gains momentum next year, unit sales
are expected to rise further, growing by an average of
2.1 per cent annually over 2016 to 2019. But as sell-
ers contend with still-high inventory levels, listings are
forecast to drop by 10.4 per cent in 2016 and by 8 per
cent on an average annual basis from 2017 to 2019.
This will push the sales-to-active-listings ratio back
up to 9 per cent by 2019. In turn, price growth will
improve to an average of 2.1 per cent per year through
2016–19.
In the new apartment condominium market, starts
reached a record 2,530 units in 2012, following an
average annual increase of 28.9 per cent since 2008.
Affordability and Apartment Condo Sales(share, per cent; sales, units)
f = forecastSources: The Conference Board of Canada; Quebec Federation of Real Estate Boards.
2001 03 05 07 09 11 13 15f 17f 19f10
12
14
16
18
20
1,000
1,200
1,400
1,600
1,800
2,000
Share of household income spent on mortgage (left)Existing apartment condo sales (right)
Sales to Active Listings and Price Change(per cent)
f = forecastSources: The Conference Board of Canada; Quebec Federation of Real Estate Boards.
2000 02 04 06 08 10 12 14 16f 18f5
10
15
20
25
30
0
4
8
12
16
20
Sales-to-active-listings ratio (left)Average price growth (right)
Ratio of Condominium Starts to Population Growth(starts per one person increase in population)
f = forecastSources: The Conference Board of Canada; CMHC Housing Time Series Database.
2000 02 04 06 08 10 12 14 16f 18f0
0.050.100.150.200.250.300.35
Current year 20−year average
Employment Growth(per cent)
f = forecastSources: The Conference Board of Canada; Statistics Canada.
2000 02 04 06 08 10 12 14 16f 18f−1
01234567
Winter 2015—Metropolitan Condo Outlook | 5
The Conference Board of Canada/Genworth Canada
Even though absorptions rose at the same time, supply
still outstripped demand. As a result, inventories began
to rise rapidly. In response, builders reduced starts of
apartment condominiums by 38.9 per cent in 2013 and
a further 33.3 per cent last year, bringing them back
down to just over 1,000 units last year, closer to their
long-term average. Inventories subsequently began to
fall in 2014, even as absorptions slipped as well.
Builders finished off 2014 by increasing starts of apart-
ment condominiums in the last quarter of the year.
With inventories still on a downward trend and demand
picking up in the resale market, starts are expected to
rise modestly through the rest of this year as well. In
total, starts are forecast to increase by 4.8 per cent in
2014 and by 3 per cent in 2016. Although absorptions
are expected to fall this year and next, they will still
outnumber completions. Accordingly, inventories will
continue to edge down. Stable economic conditions will
help keep builders in the new apartment condominium
market through the following few years. Starts are
expected to rise by an average of 3 per cent annually
from 2017 to 2019, modest enough to keep inventories
in check.
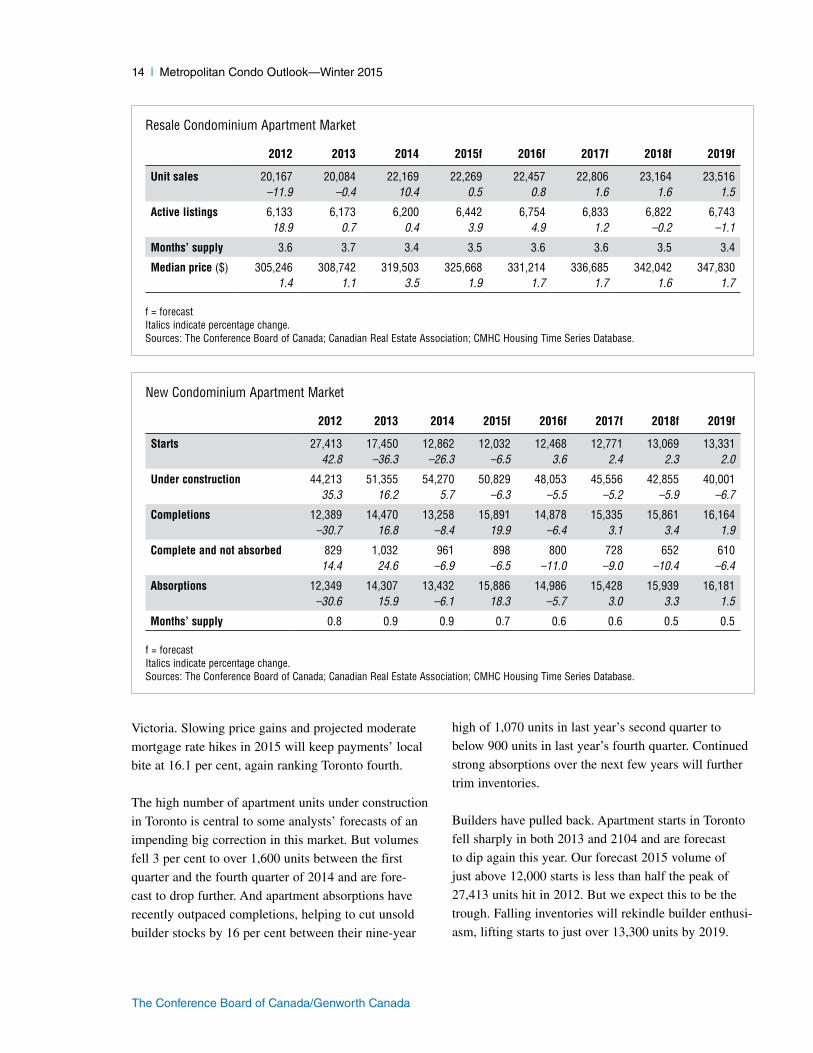
Resale Condominium Apartment Market
2012 2013 2014 2015f 2016f 2017f 2018f 2019f
Unit sales 1,725 1,446 1,485 1,534 1,565 1,597 1,630 1,669–3.8 –16.2 2.7 3.3 2.0 2.0 2.1 2.4
Active listings 1,533 2,145 2,261 2,164 1,939 1,740 1,592 1,51228.0 40.0 5.4 –4.3 –10.4 –10.3 –8.5 –5.0
Months’ supply 10.7 17.8 18.3 16.9 14.9 13.1 11.7 10.9
Average price ($) 220,860 225,195 227,172 229,006 232,293 235,812 241,507 247,0927.4 2.0 0.9 0.8 1.4 1.5 2.4 2.3
f = forecastItalics indicate percentage change.Sources: The Conference Board of Canada; Quebec Federation of Real Estate Boards; CMHC Housing Time Series Database.
New Condominium Apartment Market
2012 2013 2014 2015f 2016f 2017f 2018f 2019f
Starts 2,530 1,546 1,031 1,081 1,113 1,150 1,183 1,21828.6 –38.9 –33.3 4.8 3.0 3.3 2.9 2.9
Under construction 1,664 1,558 928 1,043 1,020 1,018 1,018 1,02414.5 –6.4 –40.4 12.4 –2.2 –0.2 0.0 0.6
Completions 2,620 1,756 1,722 1,078 1,122 1,150 1,183 1,20772.8 –33.0 –1.9 –37.4 4.1 2.5 2.8 2.0
Complete and not absorbed 640 692 595 290 205 193 193 19891.3 8.1 –14.0 –51.3 –29.4 –5.6 0.0 2.3
Absorptions 2,044 2,127 1,778 1,320 1,181 1,159 1,180 1,20243.3 4.0 –16.4 –25.8 –10.5 –1.9 1.9 1.9
Months’ supply 3.8 3.9 4.0 2.6 2.1 2.0 2.0 2.0
f = forecastItalics indicate percentage change.Sources: The Conference Board of Canada; Quebec Federation of Real Estate Boards; CMHC Housing Time Series Database.
6 | Metropolitan Condo Outlook—Winter 2015
The Conference Board of Canada/Genworth Canada
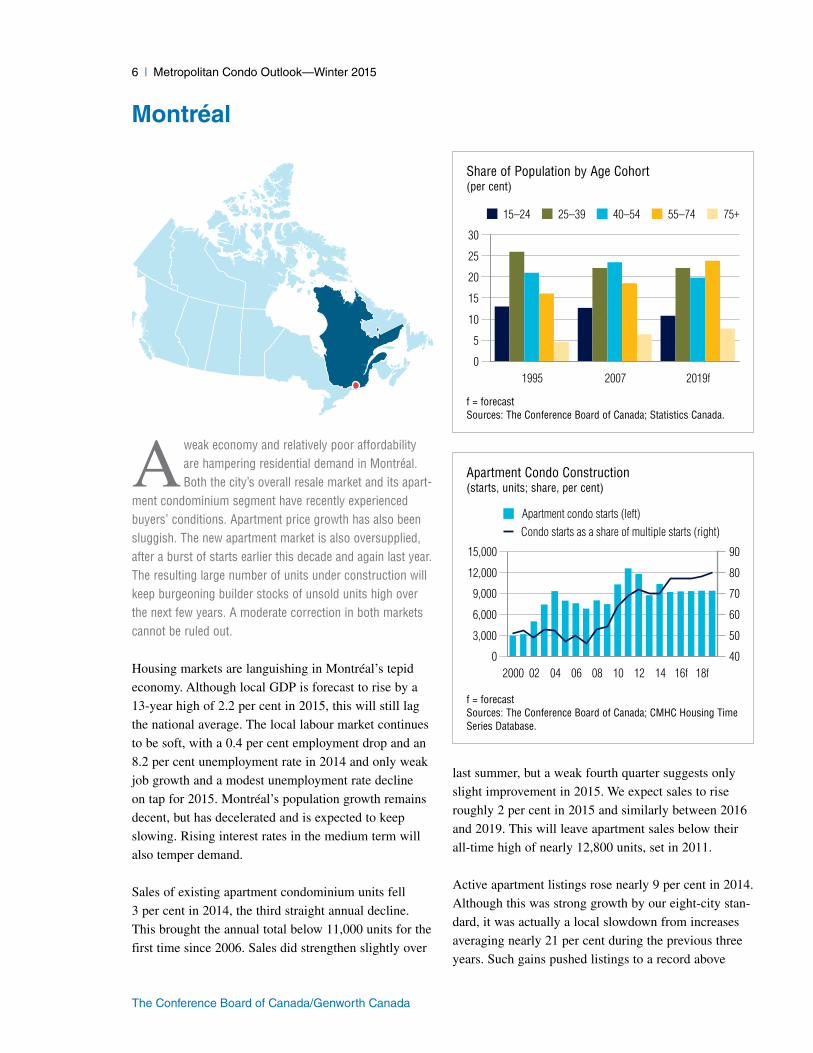
A weak economy and relatively poor affordability are hampering residential demand in Montréal. Both the city’s overall resale market and its apart-
ment condominium segment have recently experienced buyers’ conditions. Apartment price growth has also been sluggish. The new apartment market is also oversupplied, after a burst of starts earlier this decade and again last year. The resulting large number of units under construction will keep burgeoning builder stocks of unsold units high over the next few years. A moderate correction in both markets cannot be ruled out.
Housing markets are languishing in Montréal’s tepid
economy. Although local GDP is forecast to rise by a
13-year high of 2.2 per cent in 2015, this will still lag
the national average. The local labour market continues
to be soft, with a 0.4 per cent employment drop and an
8.2 per cent unemployment rate in 2014 and only weak
job growth and a modest unemployment rate decline
on tap for 2015. Montréal’s population growth remains
decent, but has decelerated and is expected to keep
slowing. Rising interest rates in the medium term will
also temper demand.
Sales of existing apartment condominium units fell
3 per cent in 2014, the third straight annual decline.
This brought the annual total below 11,000 units for the
first time since 2006. Sales did strengthen slightly over
last summer, but a weak fourth quarter suggests only
slight improvement in 2015. We expect sales to rise
roughly 2 per cent in 2015 and similarly between 2016
and 2019. This will leave apartment sales below their
all-time high of nearly 12,800 units, set in 2011.
Active apartment listings rose nearly 9 per cent in 2014.
Although this was strong growth by our eight-city stan-
dard, it was actually a local slowdown from increases
averaging nearly 21 per cent during the previous three
years. Such gains pushed listings to a record above
Montréal
Share of Population by Age Cohort(per cent)
f = forecastSources: The Conference Board of Canada; Statistics Canada.
1995 2007 2019f0
5
10
15
20
25
30
15–24 25–39 40–54 55–74 75+
Apartment Condo Construction(starts, units; share, per cent)
f = forecastSources: The Conference Board of Canada; CMHC Housing Time Series Database.
2000 02 04 06 08 10 12 14 16f 18f0
3,000
6,000
9,000
12,000
15,000
40
50
60
70
80
90
Apartment condo starts (left)Condo starts as a share of multiple starts (right)
Winter 2015—Metropolitan Condo Outlook | 7
The Conference Board of Canada/Genworth Canada
13,000 units. For 2015, a fractional increase will bump
listings to a fresh high of nearly 13,100 units. Listings
are forecast to hover near this level during the subse-
quent few years.
Easing sales and soaring listings in recent years cut the
sales-to-active-listings ratio to only 7 per cent in 2014,
less than half this decade’s peak of nearly 16 per cent
hit in 2010 and signalling a buyers’ market. Since sales
are forecast to rise only slightly faster than listings, the
ratio will change little in 2015. Only slight increases are
forecast in the medium term as listings hover and sales
rise slowly.
Despite the buyers’ conditions facing Montréal con-
dominiums, their average price advanced 2.2 per cent
last year. This was historically soft, since condominium
prices rose by an average of nearly 5 per cent annually
during the prior decade, but still improved upon a 1 per
cent dip in 2013. We expect similarly modest price
gains over the next few years, starting with a 2.5 per
cent rise in 2015.
Although principle and interest payments on the average
apartment last year trailed Toronto, Calgary, Vancouver,
and Victoria among the eight cities covered in this
report, typically low household incomes in Montréal
made this payment consume 17.4 per cent of average
Affordability and Apartment Condo Sales(share, per cent; sales, units)
f = forecastSources: The Conference Board of Canada; Quebec Federation of Real Estate Boards.
2001 03 05 07 09 11 13 15f 17f 19f12
14
16
18
20
22
6,000
8,000
10,000
12,000
14,000
16,000
Share of household income spent on mortgage (left)Existing apartment condo sales (right)
Sales to Active Listings and Price Change(per cent)
f = forecastSources: The Conference Board of Canada; Quebec Federation of Real Estate Boards.
2000 02 04 06 08 10 12 14 16f 18f5
101520253035
−50510152025
Sales-to-active-listings ratio (left)Average price growth (right)
Ratio of Condominium Starts to Population Growth(starts per one person increase in population)
f = forecastSources: The Conference Board of Canada; CMHC Housing Time Series Database.
2000 02 04 06 08 10 12 14 16f 18f0
0.050.100.150.200.250.300.35
Current year 20−year average
Employment Growth(per cent)
f = forecastSources: The Conference Board of Canada; Statistics Canada.
2000 02 04 06 08 10 12 14 16f 18f−1
0
1
2
3
4
8 | Metropolitan Condo Outlook—Winter 2015
The Conference Board of Canada/Genworth Canada
income, below only Vancouver. Continued price growth
and interest rate increases will lift this proportion to
17.9 per cent in 2015, again trailing only Vancouver.
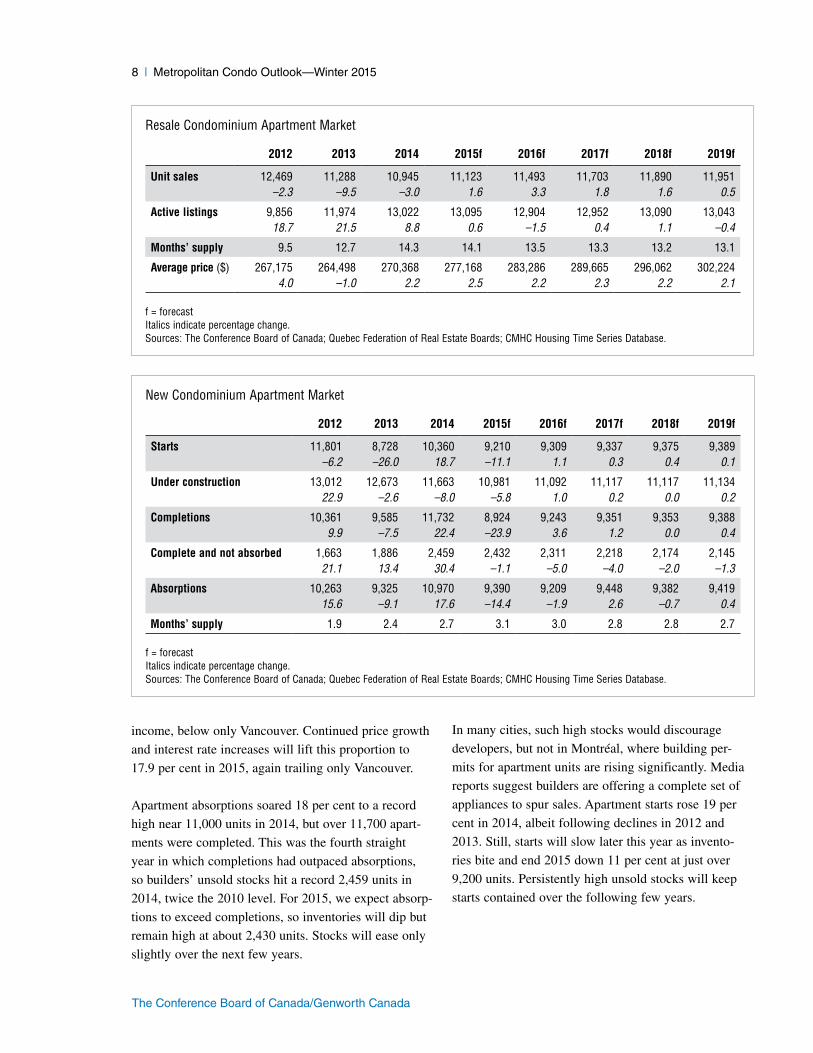
Apartment absorptions soared 18 per cent to a record
high near 11,000 units in 2014, but over 11,700 apart-
ments were completed. This was the fourth straight
year in which completions had outpaced absorptions,
so builders’ unsold stocks hit a record 2,459 units in
2014, twice the 2010 level. For 2015, we expect absorp-
tions to exceed completions, so inventories will dip but
remain high at about 2,430 units. Stocks will ease only
slightly over the next few years.
In many cities, such high stocks would discourage
developers, but not in Montréal, where building per-
mits for apartment units are rising significantly. Media
reports suggest builders are offering a complete set of
appliances to spur sales. Apartment starts rose 19 per
cent in 2014, albeit following declines in 2012 and
2013. Still, starts will slow later this year as invento-
ries bite and end 2015 down 11 per cent at just over
9,200 units. Persistently high unsold stocks will keep
starts contained over the following few years.
Resale Condominium Apartment Market
2012 2013 2014 2015f 2016f 2017f 2018f 2019f
Unit sales 12,469 11,288 10,945 11,123 11,493 11,703 11,890 11,951–2.3 –9.5 –3.0 1.6 3.3 1.8 1.6 0.5
Active listings 9,856 11,974 13,022 13,095 12,904 12,952 13,090 13,04318.7 21.5 8.8 0.6 –1.5 0.4 1.1 –0.4
Months’ supply 9.5 12.7 14.3 14.1 13.5 13.3 13.2 13.1
Average price ($) 267,175 264,498 270,368 277,168 283,286 289,665 296,062 302,2244.0 –1.0 2.2 2.5 2.2 2.3 2.2 2.1
f = forecastItalics indicate percentage change.Sources: The Conference Board of Canada; Quebec Federation of Real Estate Boards; CMHC Housing Time Series Database.
New Condominium Apartment Market
2012 2013 2014 2015f 2016f 2017f 2018f 2019f
Starts 11,801 8,728 10,360 9,210 9,309 9,337 9,375 9,389–6.2 –26.0 18.7 –11.1 1.1 0.3 0.4 0.1
Under construction 13,012 12,673 11,663 10,981 11,092 11,117 11,117 11,13422.9 –2.6 –8.0 –5.8 1.0 0.2 0.0 0.2
Completions 10,361 9,585 11,732 8,924 9,243 9,351 9,353 9,3889.9 –7.5 22.4 –23.9 3.6 1.2 0.0 0.4
Complete and not absorbed 1,663 1,886 2,459 2,432 2,311 2,218 2,174 2,14521.1 13.4 30.4 –1.1 –5.0 –4.0 –2.0 –1.3
Absorptions 10,263 9,325 10,970 9,390 9,209 9,448 9,382 9,41915.6 –9.1 17.6 –14.4 –1.9 2.6 –0.7 0.4
Months’ supply 1.9 2.4 2.7 3.1 3.0 2.8 2.8 2.7
f = forecastItalics indicate percentage change.Sources: The Conference Board of Canada; Quebec Federation of Real Estate Boards; CMHC Housing Time Series Database.
Winter 2015—Metropolitan Condo Outlook | 9
The Conference Board of Canada/Genworth Canada
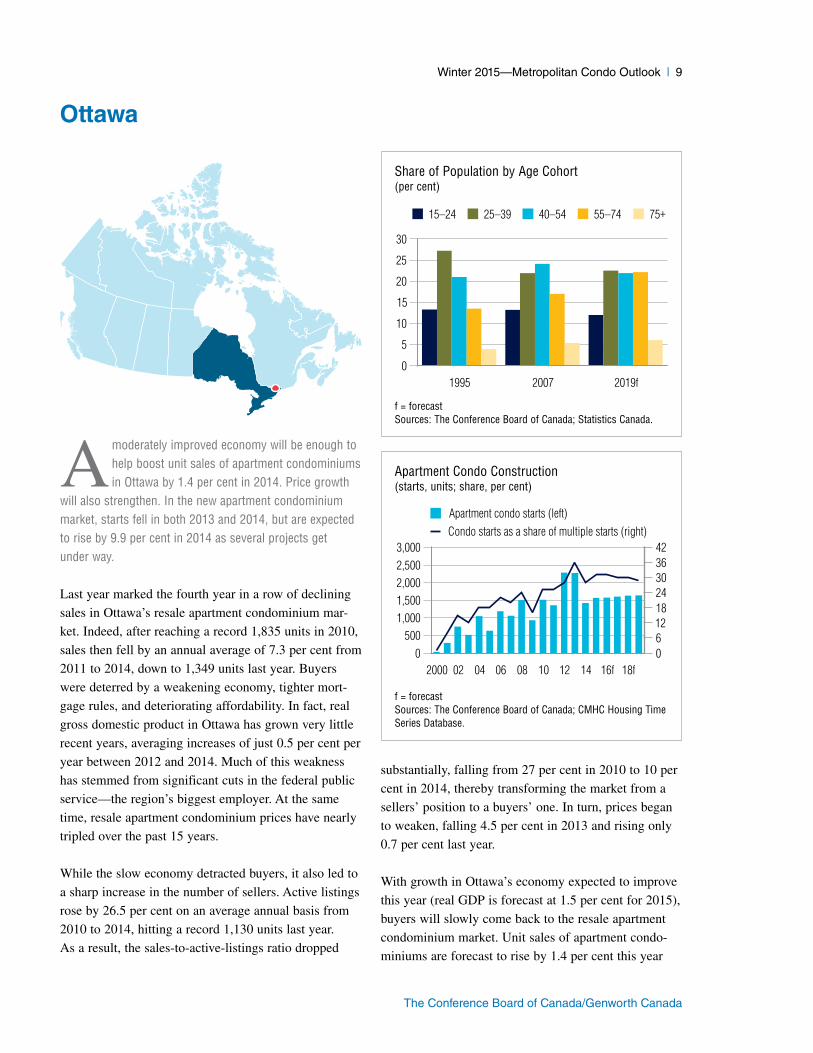
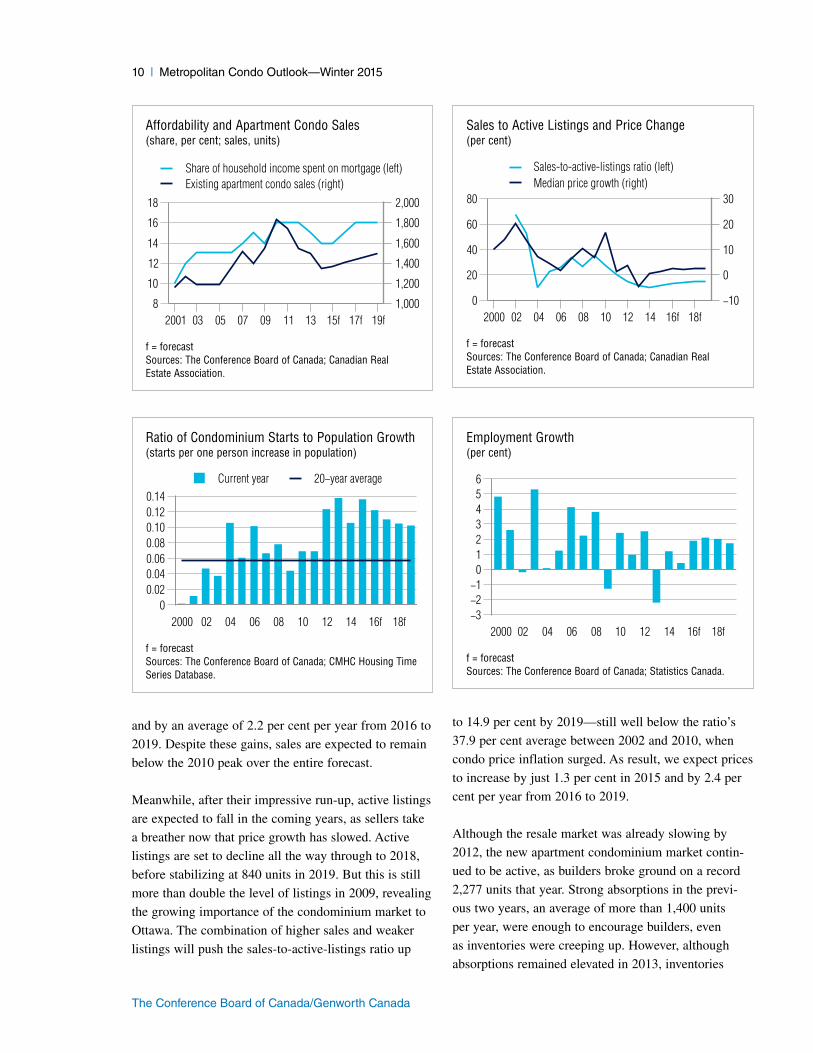
A moderately improved economy will be enough to help boost unit sales of apartment condominiums in Ottawa by 1.4 per cent in 2014. Price growth
will also strengthen. In the new apartment condominium market, starts fell in both 2013 and 2014, but are expected to rise by 9.9 per cent in 2014 as several projects get under way.
Last year marked the fourth year in a row of declining
sales in Ottawa’s resale apartment condominium mar-
ket. Indeed, after reaching a record 1,835 units in 2010,
sales then fell by an annual average of 7.3 per cent from
2011 to 2014, down to 1,349 units last year. Buyers
were deterred by a weakening economy, tighter mort-
gage rules, and deteriorating affordability. In fact, real
gross domestic product in Ottawa has grown very little
recent years, averaging increases of just 0.5 per cent per
year between 2012 and 2014. Much of this weakness
has stemmed from significant cuts in the federal public
service—the region’s biggest employer. At the same
time, resale apartment condominium prices have nearly
tripled over the past 15 years.
While the slow economy detracted buyers, it also led to
a sharp increase in the number of sellers. Active listings
rose by 26.5 per cent on an average annual basis from
2010 to 2014, hitting a record 1,130 units last year.
As a result, the sales-to-active-listings ratio dropped
substantially, falling from 27 per cent in 2010 to 10 per
cent in 2014, thereby transforming the market from a
sellers’ position to a buyers’ one. In turn, prices began
to weaken, falling 4.5 per cent in 2013 and rising only
0.7 per cent last year.
With growth in Ottawa’s economy expected to improve
this year (real GDP is forecast at 1.5 per cent for 2015),
buyers will slowly come back to the resale apartment
condominium market. Unit sales of apartment condo-
miniums are forecast to rise by 1.4 per cent this year
Ottawa
Share of Population by Age Cohort(per cent)
f = forecastSources: The Conference Board of Canada; Statistics Canada.
1995 2007 2019f0
5
10
15
20
25
30
15–24 25–39 40–54 55–74 75+
Apartment Condo Construction(starts, units; share, per cent)
f = forecastSources: The Conference Board of Canada; CMHC Housing Time Series Database.
2000 02 04 06 08 10 12 14 16f 18f0
5001,0001,5002,0002,5003,000
06121824303642
Apartment condo starts (left)Condo starts as a share of multiple starts (right)
10 | Metropolitan Condo Outlook—Winter 2015
The Conference Board of Canada/Genworth Canada
and by an average of 2.2 per cent per year from 2016 to
2019. Despite these gains, sales are expected to remain
below the 2010 peak over the entire forecast.
Meanwhile, after their impressive run-up, active listings
are expected to fall in the coming years, as sellers take
a breather now that price growth has slowed. Active
listings are set to decline all the way through to 2018,
before stabilizing at 840 units in 2019. But this is still
more than double the level of listings in 2009, revealing
the growing importance of the condominium market to
Ottawa. The combination of higher sales and weaker
listings will push the sales-to-active-listings ratio up
to 14.9 per cent by 2019—still well below the ratio’s
37.9 per cent average between 2002 and 2010, when
condo price inflation surged. As result, we expect prices
to increase by just 1.3 per cent in 2015 and by 2.4 per
cent per year from 2016 to 2019.
Although the resale market was already slowing by
2012, the new apartment condominium market contin-
ued to be active, as builders broke ground on a record
2,277 units that year. Strong absorptions in the previ-
ous two years, an average of more than 1,400 units
per year, were enough to encourage builders, even
as inventories were creeping up. However, although
absorptions remained elevated in 2013, inventories
Affordability and Apartment Condo Sales(share, per cent; sales, units)
f = forecastSources: The Conference Board of Canada; Canadian Real Estate Association.
2001 03 05 07 09 11 13 15f 17f 19f8
10
12
14
16
18
1,000
1,200
1,400
1,600
1,800
2,000
Share of household income spent on mortgage (left)Existing apartment condo sales (right)
Sales to Active Listings and Price Change(per cent)
f = forecastSources: The Conference Board of Canada; Canadian Real Estate Association.
2000 02 04 06 08 10 12 14 16f 18f0
20
40
60
80
−10
0
10
20
30
Sales-to-active-listings ratio (left)Median price growth (right)
Ratio of Condominium Starts to Population Growth(starts per one person increase in population)
f = forecastSources: The Conference Board of Canada; CMHC Housing Time Series Database.
2000 02 04 06 08 10 12 14 16f 18f0
0.020.040.060.080.100.120.14
Current year 20−year average
Employment Growth(per cent)
f = forecastSources: The Conference Board of Canada; Statistics Canada.
2000 02 04 06 08 10 12 14 16f 18f−3−2−1
0123456
Winter 2015—Metropolitan Condo Outlook | 11
The Conference Board of Canada/Genworth Canada
jumped by almost 60 per cent. This prompted builders
to reduce starts by 0.4 per cent that year and 37.5 per
cent in 2014.
Although inventories remained high in 2014, Ottawa
apartment building permits nearly doubled during
the six months to December 2014 compared with
their year-earlier levels. As a result, the new apart-
ment condominium market is set to pick up again in
2015, with starts forecast to increase by 9.9 per cent.
In fact, construction is already under way on a num-
ber of new buildings this year, including The Bowery
condominiums and Claridge’s Icon condominiums in
Little Italy. The Icon condominium building will be
Ottawa’s tallest. But this title may not last long. A new
development proposed by Richcraft Homes, also in the
Little Italy neighbourhood, would see the construc-
tion of three new towers, the biggest of which would
be 55 storeys tall. Starts are expected to keep rising
from 2016 to 2019, growing by a forecast average of
1.2 per cent per year. Absorptions are set to decline
this year and next, albeit from a 2014 record high, and
then begin to rise through the next few years, helping to
whittle down inventories.
Resale Condominium Apartment Market
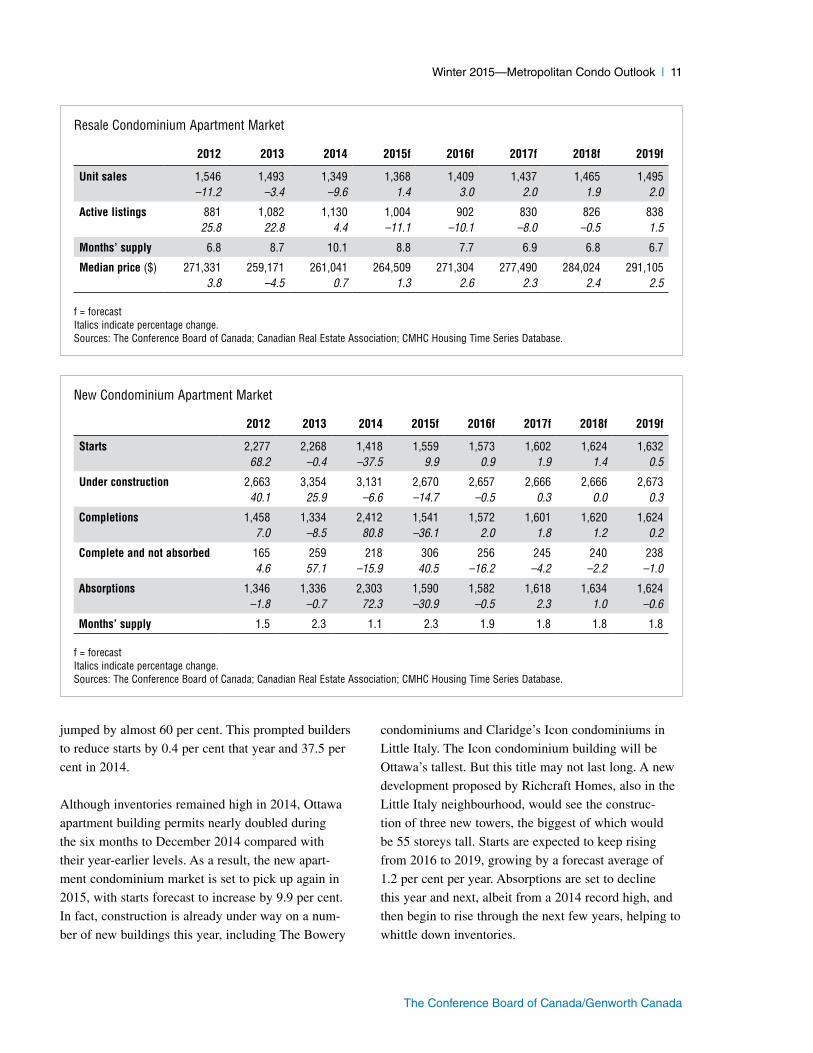
2012 2013 2014 2015f 2016f 2017f 2018f 2019f
Unit sales 1,546 1,493 1,349 1,368 1,409 1,437 1,465 1,495–11.2 –3.4 –9.6 1.4 3.0 2.0 1.9 2.0
Active listings 881 1,082 1,130 1,004 902 830 826 83825.8 22.8 4.4 –11.1 –10.1 –8.0 –0.5 1.5
Months’ supply 6.8 8.7 10.1 8.8 7.7 6.9 6.8 6.7
Median price ($) 271,331 259,171 261,041 264,509 271,304 277,490 284,024 291,1053.8 –4.5 0.7 1.3 2.6 2.3 2.4 2.5
f = forecastItalics indicate percentage change.Sources: The Conference Board of Canada; Canadian Real Estate Association; CMHC Housing Time Series Database.
New Condominium Apartment Market
2012 2013 2014 2015f 2016f 2017f 2018f 2019f
Starts 2,277 2,268 1,418 1,559 1,573 1,602 1,624 1,63268.2 –0.4 –37.5 9.9 0.9 1.9 1.4 0.5
Under construction 2,663 3,354 3,131 2,670 2,657 2,666 2,666 2,67340.1 25.9 –6.6 –14.7 –0.5 0.3 0.0 0.3
Completions 1,458 1,334 2,412 1,541 1,572 1,601 1,620 1,6247.0 –8.5 80.8 –36.1 2.0 1.8 1.2 0.2
Complete and not absorbed 165 259 218 306 256 245 240 2384.6 57.1 –15.9 40.5 –16.2 –4.2 –2.2 –1.0
Absorptions 1,346 1,336 2,303 1,590 1,582 1,618 1,634 1,624–1.8 –0.7 72.3 –30.9 –0.5 2.3 1.0 –0.6
Months’ supply 1.5 2.3 1.1 2.3 1.9 1.8 1.8 1.8
f = forecastItalics indicate percentage change.Sources: The Conference Board of Canada; Canadian Real Estate Association; CMHC Housing Time Series Database.
12 | Metropolitan Condo Outlook—Winter 2015
The Conference Board of Canada/Genworth Canada
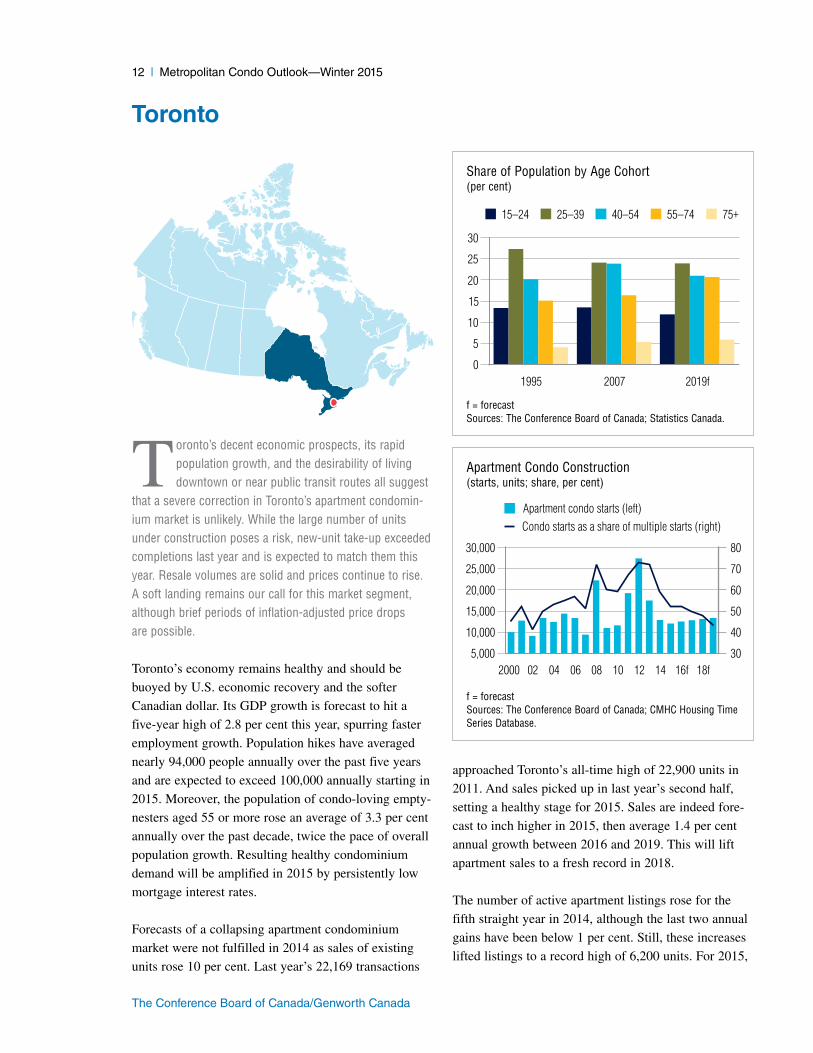
T oronto’s decent economic prospects, its rapid population growth, and the desirability of living downtown or near public transit routes all suggest
that a severe correction in Toronto’s apartment condomin-ium market is unlikely. While the large number of units under construction poses a risk, new-unit take-up exceeded completions last year and is expected to match them this year. Resale volumes are solid and prices continue to rise. A soft landing remains our call for this market segment, although brief periods of inflation-adjusted price drops are possible.
Toronto’s economy remains healthy and should be
buoyed by U.S. economic recovery and the softer
Canadian dollar. Its GDP growth is forecast to hit a
five-year high of 2.8 per cent this year, spurring faster
employment growth. Population hikes have averaged
nearly 94,000 people annually over the past five years
and are expected to exceed 100,000 annually starting in
2015. Moreover, the population of condo-loving empty-
nesters aged 55 or more rose an average of 3.3 per cent
annually over the past decade, twice the pace of overall
population growth. Resulting healthy condominium
demand will be amplified in 2015 by persistently low
mortgage interest rates.
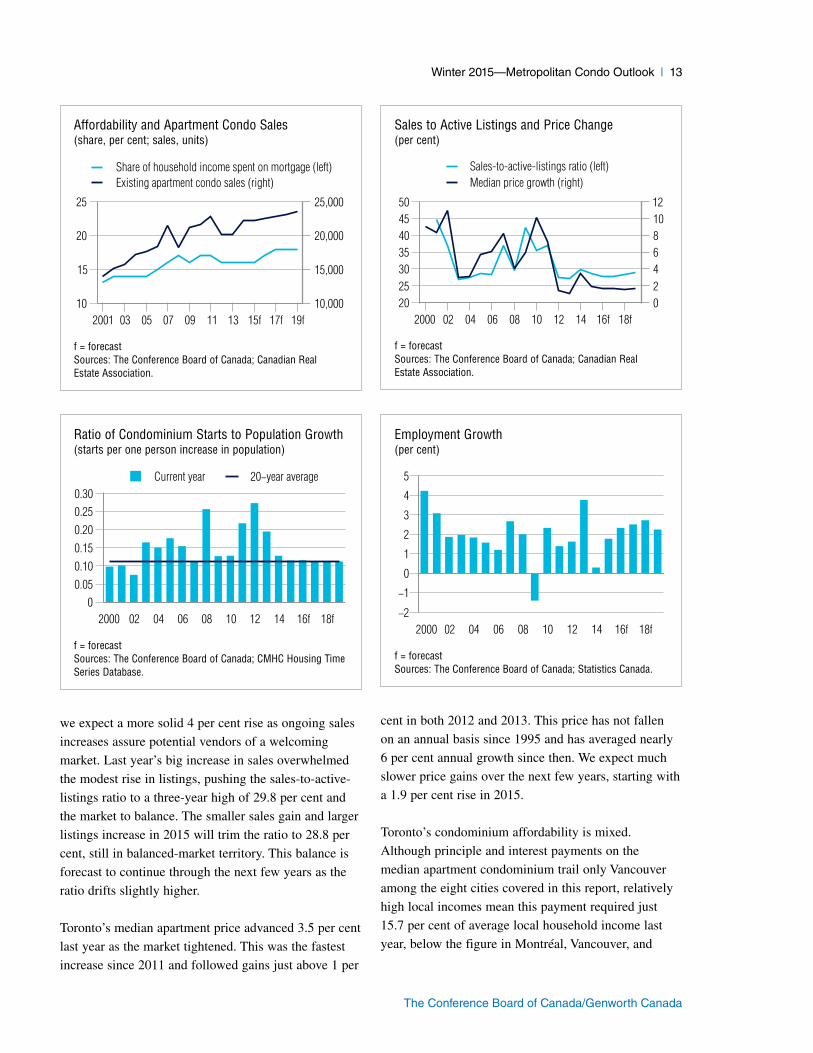
Forecasts of a collapsing apartment condominium
market were not fulfilled in 2014 as sales of existing
units rose 10 per cent. Last year’s 22,169 transactions
approached Toronto’s all-time high of 22,900 units in
2011. And sales picked up in last year’s second half,
setting a healthy stage for 2015. Sales are indeed fore-
cast to inch higher in 2015, then average 1.4 per cent
annual growth between 2016 and 2019. This will lift
apartment sales to a fresh record in 2018.
The number of active apartment listings rose for the
fifth straight year in 2014, although the last two annual
gains have been below 1 per cent. Still, these increases
lifted listings to a record high of 6,200 units. For 2015,
Toronto
Share of Population by Age Cohort(per cent)
f = forecastSources: The Conference Board of Canada; Statistics Canada.
1995 2007 2019f0
5
10
15
20
25
30
15–24 25–39 40–54 55–74 75+
Apartment Condo Construction(starts, units; share, per cent)
f = forecast Sources: The Conference Board of Canada; CMHC Housing Time Series Database.
2000 02 04 06 08 10 12 14 16f 18f5,000
10,000
15,000
20,000
25,000
30,000
30
40
50
60
70
80
Apartment condo starts (left)Condo starts as a share of multiple starts (right)
Winter 2015—Metropolitan Condo Outlook | 13
The Conference Board of Canada/Genworth Canada
we expect a more solid 4 per cent rise as ongoing sales
increases assure potential vendors of a welcoming
market. Last year’s big increase in sales overwhelmed
the modest rise in listings, pushing the sales-to-active-
listings ratio to a three-year high of 29.8 per cent and
the market to balance. The smaller sales gain and larger
listings increase in 2015 will trim the ratio to 28.8 per
cent, still in balanced-market territory. This balance is
forecast to continue through the next few years as the
ratio drifts slightly higher.
Toronto’s median apartment price advanced 3.5 per cent
last year as the market tightened. This was the fastest
increase since 2011 and followed gains just above 1 per
cent in both 2012 and 2013. This price has not fallen
on an annual basis since 1995 and has averaged nearly
6 per cent annual growth since then. We expect much
slower price gains over the next few years, starting with
a 1.9 per cent rise in 2015.
Toronto’s condominium affordability is mixed.
Although principle and interest payments on the
median apartment condominium trail only Vancouver
among the eight cities covered in this report, relatively
high local incomes mean this payment required just
15.7 per cent of average local household income last
year, below the figure in Montréal, Vancouver, and
Affordability and Apartment Condo Sales(share, per cent; sales, units)
f = forecastSources: The Conference Board of Canada; Canadian Real Estate Association.
2001 03 05 07 09 11 13 15f 17f 19f10
15
20
25
10,000
15,000
20,000
25,000
Share of household income spent on mortgage (left)Existing apartment condo sales (right)
Sales to Active Listings and Price Change(per cent)
f = forecastSources: The Conference Board of Canada; Canadian Real Estate Association.
2000 02 04 06 08 10 12 14 16f 18f20253035404550
024681012
Sales-to-active-listings ratio (left)Median price growth (right)
Ratio of Condominium Starts to Population Growth(starts per one person increase in population)
f = forecastSources: The Conference Board of Canada; CMHC Housing Time Series Database.
2000 02 04 06 08 10 12 14 16f 18f0
0.050.100.150.200.250.30
Current year 20−year average
Employment Growth(per cent)
f = forecastSources: The Conference Board of Canada; Statistics Canada.
2000 02 04 06 08 10 12 14 16f 18f−2
−1
0
1
2
3
4
5
14 | Metropolitan Condo Outlook—Winter 2015
The Conference Board of Canada/Genworth Canada
Victoria. Slowing price gains and projected moderate
mortgage rate hikes in 2015 will keep payments’ local
bite at 16.1 per cent, again ranking Toronto fourth.
The high number of apartment units under construction
in Toronto is central to some analysts’ forecasts of an
impending big correction in this market. But volumes
fell 3 per cent to over 1,600 units between the first
quarter and the fourth quarter of 2014 and are fore-
cast to drop further. And apartment absorptions have
recently outpaced completions, helping to cut unsold
builder stocks by 16 per cent between their nine-year
high of 1,070 units in last year’s second quarter to
below 900 units in last year’s fourth quarter. Continued
strong absorptions over the next few years will further
trim inventories.
Builders have pulled back. Apartment starts in Toronto
fell sharply in both 2013 and 2104 and are forecast
to dip again this year. Our forecast 2015 volume of
just above 12,000 starts is less than half the peak of
27,413 units hit in 2012. But we expect this to be the
trough. Falling inventories will rekindle builder enthusi-
asm, lifting starts to just over 13,300 units by 2019.
Resale Condominium Apartment Market
2012 2013 2014 2015f 2016f 2017f 2018f 2019f
Unit sales 20,167 20,084 22,169 22,269 22,457 22,806 23,164 23,516–11.9 –0.4 10.4 0.5 0.8 1.6 1.6 1.5
Active listings 6,133 6,173 6,200 6,442 6,754 6,833 6,822 6,74318.9 0.7 0.4 3.9 4.9 1.2 –0.2 –1.1
Months’ supply 3.6 3.7 3.4 3.5 3.6 3.6 3.5 3.4
Median price ($) 305,246 308,742 319,503 325,668 331,214 336,685 342,042 347,8301.4 1.1 3.5 1.9 1.7 1.7 1.6 1.7
f = forecastItalics indicate percentage change.Sources: The Conference Board of Canada; Canadian Real Estate Association; CMHC Housing Time Series Database.
New Condominium Apartment Market
2012 2013 2014 2015f 2016f 2017f 2018f 2019f
Starts 27,413 17,450 12,862 12,032 12,468 12,771 13,069 13,33142.8 –36.3 –26.3 –6.5 3.6 2.4 2.3 2.0
Under construction 44,213 51,355 54,270 50,829 48,053 45,556 42,855 40,00135.3 16.2 5.7 –6.3 –5.5 –5.2 –5.9 –6.7
Completions 12,389 14,470 13,258 15,891 14,878 15,335 15,861 16,164–30.7 16.8 –8.4 19.9 –6.4 3.1 3.4 1.9
Complete and not absorbed 829 1,032 961 898 800 728 652 61014.4 24.6 –6.9 –6.5 –11.0 –9.0 –10.4 –6.4
Absorptions 12,349 14,307 13,432 15,886 14,986 15,428 15,939 16,181–30.6 15.9 –6.1 18.3 –5.7 3.0 3.3 1.5
Months’ supply 0.8 0.9 0.9 0.7 0.6 0.6 0.5 0.5
f = forecastItalics indicate percentage change.Sources: The Conference Board of Canada; Canadian Real Estate Association; CMHC Housing Time Series Database.
Winter 2015—Metropolitan Condo Outlook | 15
The Conference Board of Canada/Genworth Canada
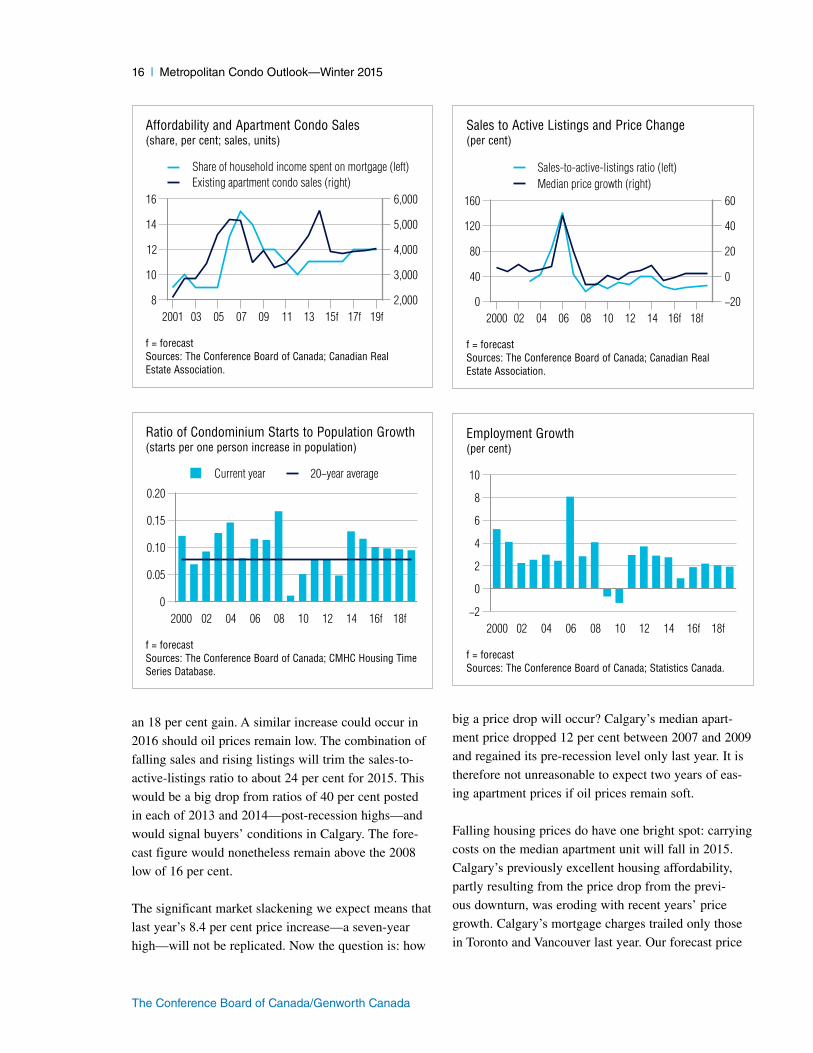
T he sharp drop in oil prices has quickly and dra-matically sliced demand for all forms of housing in Calgary. The market for existing apartment condo-
miniums, which had flirted with sellers’ conditions in 2013 and 2014, is correcting sharply, and oversupply looms. The same is true in the new condominium market, where completions will overwhelm absorptions, prompting a big increase in starts-killing inventories. Forecasting a “bottom” for these markets is tricky, though, since it depends heavily on future oil prices.
Calgary’s recent economic performance, including
4.5 per cent GDP growth in 2014, now seems sud-
denly irrelevant to housing markets in the wake of the
big drop in oil prices. The 2009 correction is a better
benchmark; it featured a 4 per cent drop in GDP that
year and a 2 per cent employment decline in 2009–10.
While Calgary’s immediate future looks rocky, its
medium-term path will be determined by oil’s future
price, for which forecasts vary widely, although the
Conference Board believes that oil prices have likely
bottomed out.
Calgary’s current downward economic lurch will put an
abrupt end to four years of annual gains in apartment
condominium sales, including a 22 per cent rise in 2014
that lifted volumes to a record high. Frankly, once fear
grips a market, as it evidently has in Calgary, calling the
market bottom is difficult. Based on the 2009 decline,
though, a sales drop near 30 per cent in 2015 and a fur-
ther 1–2 per cent drop in 2016 seems a reasonable call.
As with sales, the recent market shift renders recent
trends in active listings of apartment condominiums
largely irrelevant. A big increase in this supply is inevi-
table, although last year’s volume of close to 1,200
units makes a quintupling of listings like that between
2006 and 2008 simply unrealistic. Still, we expect list-
ings to approach 1,400 units this year, implying roughly
Calgary
Share of Population by Age Cohort(per cent)
f = forecastSources: The Conference Board of Canada; Statistics Canada.
1995 2007 2019f0
5
10
15
20
25
30
15–24 25–39 40–54 55–74 75+
Apartment Condo Construction(starts, units; share, per cent)
f = forecastSources: The Conference Board of Canada; CMHC Housing Time Series Database.
2000 02 04 06 08 10 12 14 16f 18f0
1,0002,0003,0004,0005,0006,0007,000
2030405060708090
Apartment condo starts (left)Condo starts as a share of multiple starts (right)
16 | Metropolitan Condo Outlook—Winter 2015
The Conference Board of Canada/Genworth Canada
an 18 per cent gain. A similar increase could occur in
2016 should oil prices remain low. The combination of
falling sales and rising listings will trim the sales-to-
active-listings ratio to about 24 per cent for 2015. This
would be a big drop from ratios of 40 per cent posted
in each of 2013 and 2014—post-recession highs—and
would signal buyers’ conditions in Calgary. The fore-
cast figure would nonetheless remain above the 2008
low of 16 per cent.
The significant market slackening we expect means that
last year’s 8.4 per cent price increase—a seven-year
high—will not be replicated. Now the question is: how
big a price drop will occur? Calgary’s median apart-
ment price dropped 12 per cent between 2007 and 2009
and regained its pre-recession level only last year. It is
therefore not unreasonable to expect two years of eas-
ing apartment prices if oil prices remain soft.
Falling housing prices do have one bright spot: carrying
costs on the median apartment unit will fall in 2015.
Calgary’s previously excellent housing affordability,
partly resulting from the price drop from the previ-
ous downturn, was eroding with recent years’ price
growth. Calgary’s mortgage charges trailed only those
in Toronto and Vancouver last year. Our forecast price
Affordability and Apartment Condo Sales(share, per cent; sales, units)
f = forecastSources: The Conference Board of Canada; Canadian Real Estate Association.
2001 03 05 07 09 11 13 15f 17f 19f8
10
12
14
16
2,000
3,000
4,000
5,000
6,000
Share of household income spent on mortgage (left)Existing apartment condo sales (right)
Sales to Active Listings and Price Change(per cent)
f = forecastSources: The Conference Board of Canada; Canadian Real Estate Association.
2000 02 04 06 08 10 12 14 16f 18f0
40
80
120
160
−20
0
20
40
60
Sales-to-active-listings ratio (left)Median price growth (right)
Ratio of Condominium Starts to Population Growth(starts per one person increase in population)
f = forecastSources: The Conference Board of Canada; CMHC Housing Time Series Database.
2000 02 04 06 08 10 12 14 16f 18f0
0.05
0.10
0.15
0.20
Current year 20−year average
Employment Growth(per cent)
f = forecastSources: The Conference Board of Canada; Statistics Canada.
2000 02 04 06 08 10 12 14 16f 18f−2
0
2
4
6
8
10
Winter 2015—Metropolitan Condo Outlook | 17
The Conference Board of Canada/Genworth Canada
drop implies that carrying charges are forecast to drop
1 per cent in 2015, placing Calgary fourth among the
eight cities covered in this report.
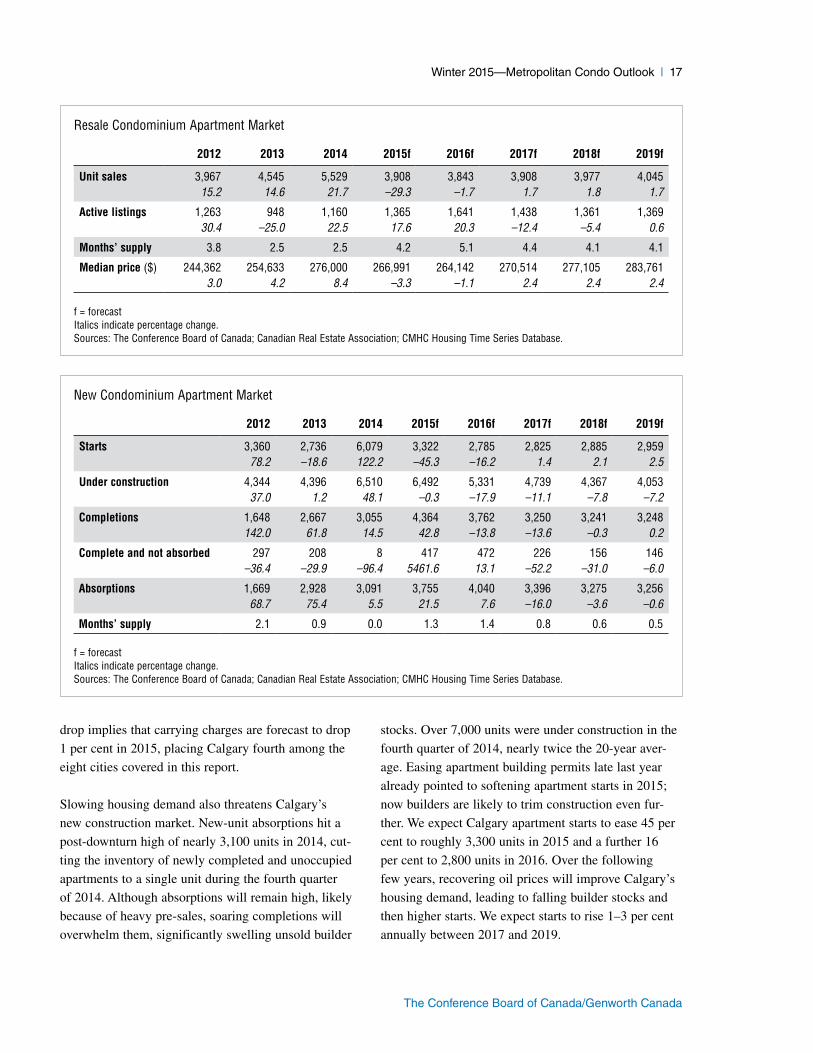
Slowing housing demand also threatens Calgary’s
new construction market. New-unit absorptions hit a
post-downturn high of nearly 3,100 units in 2014, cut-
ting the inventory of newly completed and unoccupied
apartments to a single unit during the fourth quarter
of 2014. Although absorptions will remain high, likely
because of heavy pre-sales, soaring completions will
overwhelm them, significantly swelling unsold builder
stocks. Over 7,000 units were under construction in the
fourth quarter of 2014, nearly twice the 20-year aver-
age. Easing apartment building permits late last year
already pointed to softening apartment starts in 2015;
now builders are likely to trim construction even fur-
ther. We expect Calgary apartment starts to ease 45 per
cent to roughly 3,300 units in 2015 and a further 16
per cent to 2,800 units in 2016. Over the following
few years, recovering oil prices will improve Calgary’s
housing demand, leading to falling builder stocks and
then higher starts. We expect starts to rise 1–3 per cent
annually between 2017 and 2019.
Resale Condominium Apartment Market
2012 2013 2014 2015f 2016f 2017f 2018f 2019f
Unit sales 3,967 4,545 5,529 3,908 3,843 3,908 3,977 4,04515.2 14.6 21.7 –29.3 –1.7 1.7 1.8 1.7
Active listings 1,263 948 1,160 1,365 1,641 1,438 1,361 1,36930.4 –25.0 22.5 17.6 20.3 –12.4 –5.4 0.6
Months’ supply 3.8 2.5 2.5 4.2 5.1 4.4 4.1 4.1
Median price ($) 244,362 254,633 276,000 266,991 264,142 270,514 277,105 283,7613.0 4.2 8.4 –3.3 –1.1 2.4 2.4 2.4
f = forecastItalics indicate percentage change.Sources: The Conference Board of Canada; Canadian Real Estate Association; CMHC Housing Time Series Database.
New Condominium Apartment Market
2012 2013 2014 2015f 2016f 2017f 2018f 2019f
Starts 3,360 2,736 6,079 3,322 2,785 2,825 2,885 2,95978.2 –18.6 122.2 –45.3 –16.2 1.4 2.1 2.5
Under construction 4,344 4,396 6,510 6,492 5,331 4,739 4,367 4,05337.0 1.2 48.1 –0.3 –17.9 –11.1 –7.8 –7.2
Completions 1,648 2,667 3,055 4,364 3,762 3,250 3,241 3,248142.0 61.8 14.5 42.8 –13.8 –13.6 –0.3 0.2
Complete and not absorbed 297 208 8 417 472 226 156 146–36.4 –29.9 –96.4 5461.6 13.1 –52.2 –31.0 –6.0
Absorptions 1,669 2,928 3,091 3,755 4,040 3,396 3,275 3,25668.7 75.4 5.5 21.5 7.6 –16.0 –3.6 –0.6
Months’ supply 2.1 0.9 0.0 1.3 1.4 0.8 0.6 0.5
f = forecastItalics indicate percentage change.Sources: The Conference Board of Canada; Canadian Real Estate Association; CMHC Housing Time Series Database.
18 | Metropolitan Condo Outlook—Winter 2015
The Conference Board of Canada/Genworth Canada
T he sharp drop in oil prices will slice residential demand in Edmonton. This includes the markets for both new and existing apartment condomin-
iums, which had been gradually improving. Last year’s return to balanced conditions in the apartment market could be short-lived, with a buyers’ state set to take hold this year. The new condominium market is also poised to slow. We expect falling absorptions to swell unsold inventories and trim starts. The depth and duration of housing market softness depends significantly on future oil prices, which are difficult to forecast.
The recent stretch of very strong economic growth will
halt abruptly in Edmonton this year because of the big
drop in oil prices. GDP will likely fall this year, after
five straight annual advances exceeding 5 per cent.
Recently strong job markets are also set to throttle
back. All this suggests a significant slowing in resi-
dential demand, so oversupply looms for both new and
existing housing markets.
Existing apartment sales rose 7 per cent to nearly
3,200 units in 2014, following a 14 per cent rise in
2013. However, the collapse in oil prices makes recent
history irrelevant to this year’s housing market. Sales
are retracting sharply and are forecast to end 2015
down 26 per cent at just below 2,400 units. This year’s
forecast decline can be compared to a 35 per cent drop
in 2008 in the midst of the previous downturn. We
believe oil prices have likely bottomed out and will rise
slowly over the rest of the year. This should help con-
dominium sales rise 2 per cent next year. However, this
year’s projected sales decline makes the peak volume
above 4,600 units in 2007 essentially unreachable over
the next few years.
Listings are rising sharply as sales ease and are poised
to end 2015 up 24 per cent. Still, listings drops of
12 per cent in 2013 and 16 per cent in 2014 trimmed
Edmonton
Share of Population by Age Cohort(per cent)
f = forecastSources: The Conference Board of Canada; Statistics Canada.
1995 2007 2019f0
5
10
15
20
25
30
15–24 25–39 40–54 55–74 75+
Apartment Condo Construction(starts, units; share, per cent)
f = forecastSources: The Conference Board of Canada; CMHC Housing Time Series Database.
2000 02 04 06 08 10 12 14 16f 18f0
1,000
2,000
3,000
4,000
10
25
40
55
70
Apartment condo starts (left)Condo starts as a share of multiple starts (right)
Winter 2015—Metropolitan Condo Outlook | 19
The Conference Board of Canada/Genworth Canada
the average 2014 volume below 1,000 units for the first
time since 2006, so our forecast upswing will leave
listings well below their 2008 peak above 1,900 units.
Falling sales and rising listings will cut the sales-to-
active-listings ratio to a buyers’ market reading of
17 per cent this year, following its rise to a balanced-
market level of 28 per cent in 2014. This ratio is fore-
cast to inch higher over the next few years, but remain
in buyers’ market territory. The market’s sudden soften-
ing will prompt a decline in Edmonton’s median apart-
ment price following two years of small gains including
a 1.7 per cent rise in 2014. We expect this price to
dip nearly 5 per cent in 2015 and a further 1 per cent
in 2016. Even before this drop, however, the median
apartment price was well below its 2007 peak of just
above $234,000. The relatively soft market we expect
over the next few years will cap annual price gains at
2–3 per cent.
Easing prices in 2015 will help maintain excellent
local housing affordability. Edmonton’s median apart-
ment condominium price remains the lowest among the
eight cities covered in this report. Meanwhile, average
household incomes here are relatively high, trailing
only Calgary among this report’s cities. This implies
that principle and interest payments on the median
apartment condo are the lowest among this report’s cit-
ies and also that these charges consume only 10.1 per
cent of household incomes on average, also the lowest
Affordability and Apartment Condo Sales(share, per cent; sales, units)
f = forecastSources: The Conference Board of Canada; Canadian Real Estate Association.
2001 03 05 07 09 11 13 15f 17f 19f4
8
12
16
20
1,000
2,000
3,000
4,000
5,000
Share of household income spent on mortgage (left)Existing apartment condo sales (right)
Sales to Active Listings and Price Change(per cent)
f = forecastSources: The Conference Board of Canada; Canadian Real Estate Association.
2000 02 04 06 08 10 12 14 16f 18f0
20406080
100120
−1001020304050
Sales-to-active-listings ratio (left)Median price growth (right)
Ratio of Condominium Starts to Population Growth(starts per one person increase in population)
f = forecastSources: The Conference Board of Canada; CMHC Housing Time Series Database.
2000 02 04 06 08 10 12 14 16f 18f0
0.05
0.10
0.15
0.20Current year 20−year average
Employment Growth(per cent)
f = forecastSources: The Conference Board of Canada; Statistics Canada.
2000 02 04 06 08 10 12 14 16f 18f−2
0
2
4
6
8
20 | Metropolitan Condo Outlook—Winter 2015
The Conference Board of Canada/Genworth Canada
among this report’s cities. Edmonton’s price drop will
help trim carrying charges by about 2 per cent this year
and decrease such costs’ bite of household incomes to
9.8 per cent. Affordability will deteriorate slightly over
the next few years as interest rates rise, particularly in
2016 and 2017.
Edmonton’s new condominium market will also be
sideswiped by the area’s weaker economy. A big jump
in completions this year, combined with small decreases
in absorptions, will push inventories to 340 units this
year and nearly 600 units in 2016. Such backlogs are
reminiscent of, yet below, inventories in 2010 and 2011,
following the 2009 recession. By 2018, falling comple-
tions and steady absorptions will trim builder stocks to
match their 2014 post-recession low.
Rising unsold inventories will curtail new projects.
Apartment condominium starts had already retreated
from their post-recession peak above 3,100 units in
2013, dropping nearly 50 per cent in 2014. This year,
they are poised to drop a further 29 per cent. By 2016,
starts will be only a third of the 2013 volume. Only
small hikes in new construction activity are expected
during the subsequent few years.
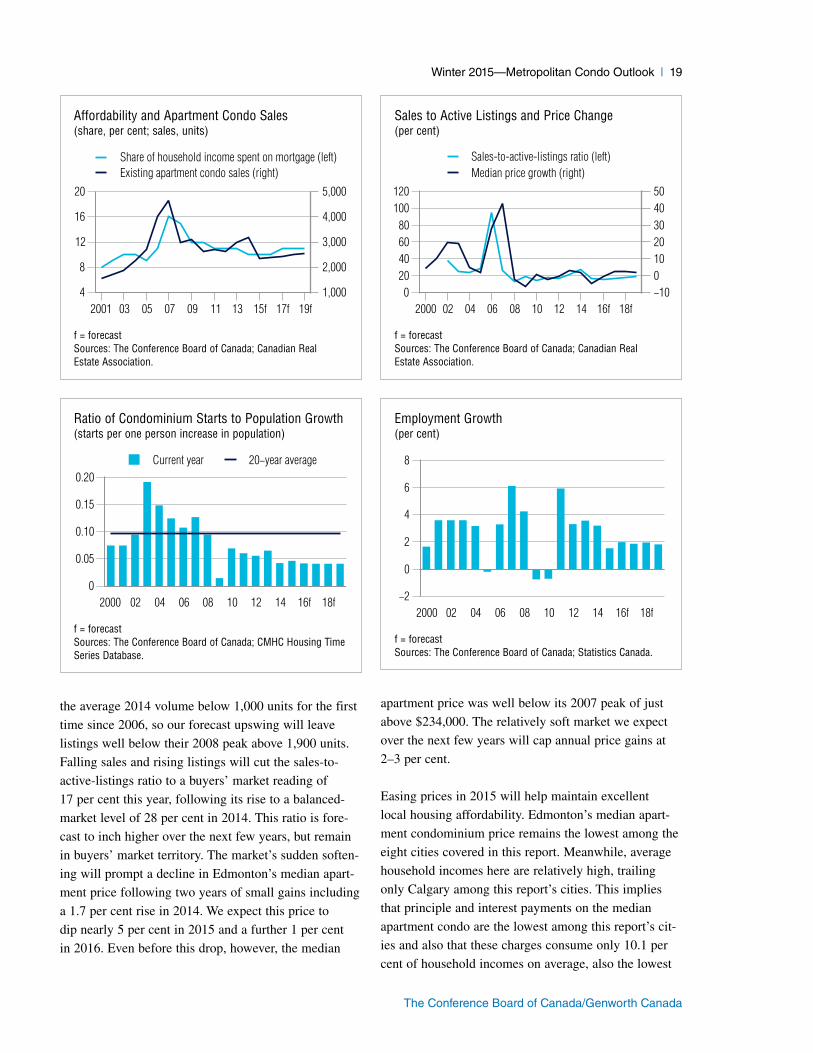
Resale Condominium Apartment Market
2012 2013 2014 2015f 2016f 2017f 2018f 2019f
Unit sales 2,625 2,981 3,187 2,364 2,405 2,443 2,497 2,563–3.6 13.6 6.9 –25.8 1.7 1.6 2.2 2.6
Active listings 1,301 1,140 958 1,192 1,272 1,194 1,148 1,1292.2 –12.4 –16.0 24.4 6.8 –6.2 –3.8 –1.7
Months’ supply 5.9 4.6 3.6 6.1 6.3 5.9 5.5 5.3
Median price ($) 209,688 215,825 219,392 209,359 208,173 213,871 219,507 224,229–0.6 2.9 1.7 –4.6 –0.6 2.7 2.6 2.2
f = forecastItalics indicate percentage change.Sources: The Conference Board of Canada; Canadian Real Estate Association; CMHC Housing Time Series Database.
New Condominium Apartment Market
2012 2013 2014 2015f 2016f 2017f 2018f 2019f
Starts 1,983 3,121 1,646 1,165 1,047 1,079 1,108 1,13242.5 57.4 –47.3 –29.2 –10.1 3.0 2.7 2.2
Under construction 2,964 4,714 4,249 3,754 3,241 2,971 2,741 2,5270.3 59.1 –9.9 –11.7 –13.7 –8.3 –7.7 –7.8
Completions 1,475 1,489 1,303 1,797 1,436 1,320 1,330 1,33612.9 0.9 –12.5 37.9 –20.1 –8.0 0.8 0.4
Complete and not absorbed 529 335 222 339 579 383 223 153–20.4 –36.6 –33.7 52.5 70.8 –33.8 –41.7 –31.5
Absorptions 1,594 1,672 1,445 1,435 1,431 1,528 1,467 1,37319.0 4.9 –13.5 –0.8 –0.3 6.8 –4.0 –6.4
Months’ supply 4.0 2.4 1.8 2.8 4.9 3.0 1.8 1.3
f = forecastItalics indicate percentage change.Sources: The Conference Board of Canada; Canadian Real Estate Association; CMHC Housing Time Series Database.
Winter 2015—Metropolitan Condo Outlook | 21
The Conference Board of Canada/Genworth Canada
B road-based recovery in Vancouver’s housing mar-ket continues to buoy the apartment condominium segment. Resale volumes moved higher last year
and should inch up again in 2015. This should underpin another year of modest price growth, as the market is roughly balanced. High inventories of unsold units have been slow to erode, so new construction will remain sub-dued this year, but easing stocks will ultimately pull starts higher. Offshore demand remains a wildcard here. If it fal-ters, the area’s poor affordability will be exposed, because many pricey condominiums are simply unaffordable at local wage levels.
Vancouver’s apartment condominium market is
strengthening, along with its overall housing market,
but remains softer than in the peak times during the
previous decade. Slowing offshore demand could pose
a threat. Much of this demand comes from China,
where several Vancouver realtors have opened offices.
Many forecasters expect China’s economic growth to
ease over the next few years, something that would
obviously dampen demand from its nationals. Even
so, apartments will remain a vital housing solution in
Vancouver, given their relative affordability.
Existing apartment condominium sales moved higher as
2014 progressed and ended the year up 14 per cent, at
their highest level since 2009. Last year’s gain followed
a 10.5 per cent hike in 2013. This growth is unsustain-
able, and we expect sales to rise 2.4 per cent this year.
Subsequent annual increases will put sales at nearly
14,800 units by 2019. Although this volume will be
above the 10-year average, it will not exceed the 2005
all-time peak.
Although active listings of apartment condominiums
remain relatively high, they fell in the fourth quarter
last year and are forecast to drop another 2 per cent in
2015. This will combine with rising sales to tighten
Vancouver
Share of Population by Age Cohort(per cent)
f = forecastSources: The Conference Board of Canada; Statistics Canada.
1995 2007 2019f0
5
10
15
20
25
30
15–24 25–39 40–54 55–74 75+
Apartment Condo Construction(starts, units; share, per cent)
f = forecastSources: The Conference Board of Canada; CMHC Housing Time Series Database.
2000 02 04 06 08 10 12 14 16f 18f0
3,000
6,000
9,000
12,000
15,000
30
40
50
60
70
80
Apartment condo starts (left)Condo starts as a share of multiple starts (right)
22 | Metropolitan Condo Outlook—Winter 2015
The Conference Board of Canada/Genworth Canada
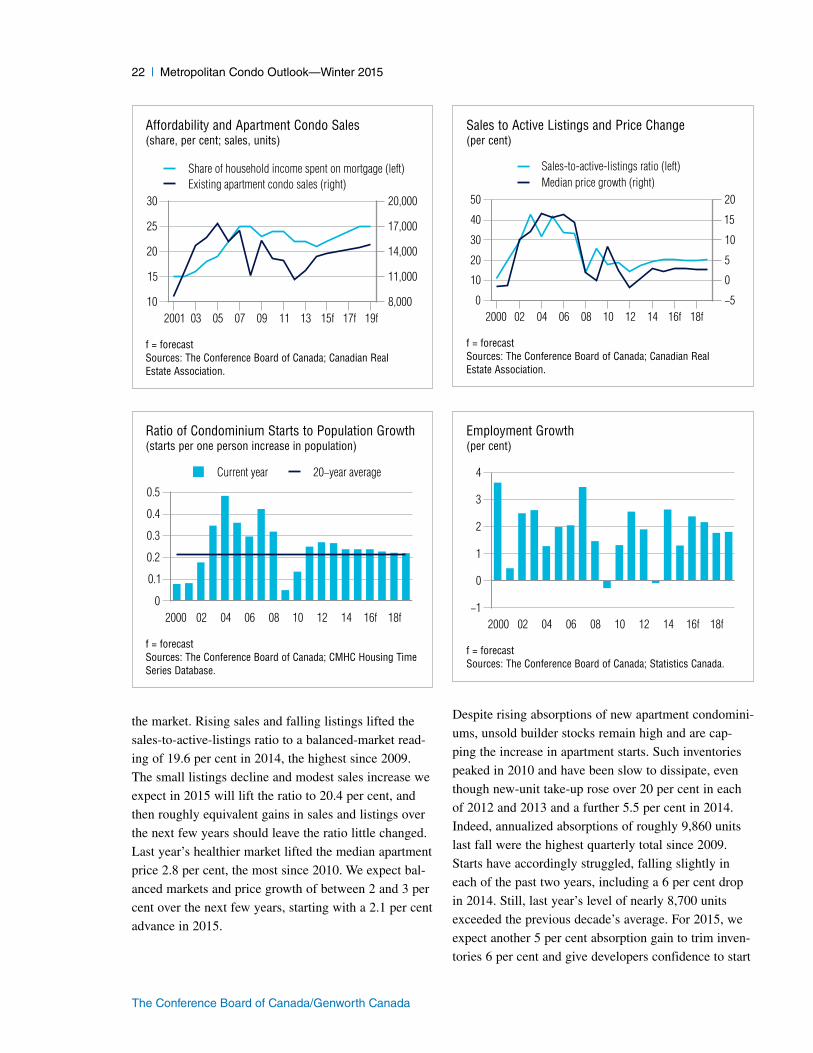
the market. Rising sales and falling listings lifted the
sales-to-active-listings ratio to a balanced-market read-
ing of 19.6 per cent in 2014, the highest since 2009.
The small listings decline and modest sales increase we
expect in 2015 will lift the ratio to 20.4 per cent, and
then roughly equivalent gains in sales and listings over
the next few years should leave the ratio little changed.
Last year’s healthier market lifted the median apartment
price 2.8 per cent, the most since 2010. We expect bal-
anced markets and price growth of between 2 and 3 per
cent over the next few years, starting with a 2.1 per cent
advance in 2015.
Despite rising absorptions of new apartment condomini-
ums, unsold builder stocks remain high and are cap-
ping the increase in apartment starts. Such inventories
peaked in 2010 and have been slow to dissipate, even
though new-unit take-up rose over 20 per cent in each
of 2012 and 2013 and a further 5.5 per cent in 2014.
Indeed, annualized absorptions of roughly 9,860 units
last fall were the highest quarterly total since 2009.
Starts have accordingly struggled, falling slightly in
each of the past two years, including a 6 per cent drop
in 2014. Still, last year’s level of nearly 8,700 units
exceeded the previous decade’s average. For 2015, we
expect another 5 per cent absorption gain to trim inven-
tories 6 per cent and give developers confidence to start
Affordability and Apartment Condo Sales(share, per cent; sales, units)
f = forecastSources: The Conference Board of Canada; Canadian Real Estate Association.
2001 03 05 07 09 11 13 15f 17f 19f10
15
20
25
30
8,000
11,000
14,000
17,000
20,000
Share of household income spent on mortgage (left)Existing apartment condo sales (right)
Sales to Active Listings and Price Change(per cent)
f = forecastSources: The Conference Board of Canada; Canadian Real Estate Association.
2000 02 04 06 08 10 12 14 16f 18f0
10
20
30
40
50
−5
0
5
10
15
20
Sales-to-active-listings ratio (left)Median price growth (right)
Ratio of Condominium Starts to Population Growth(starts per one person increase in population)
f = forecastSources: The Conference Board of Canada; CMHC Housing Time Series Database.
2000 02 04 06 08 10 12 14 16f 18f0
0.1
0.2
0.3
0.4
0.5
Current year 20−year average
Employment Growth(per cent)
f = forecastSources: The Conference Board of Canada; Statistics Canada.
2000 02 04 06 08 10 12 14 16f 18f−1
0
1
2
3
4
Winter 2015—Metropolitan Condo Outlook | 23
The Conference Board of Canada/Genworth Canada
just over 8,900 units, a 3 per cent gain. Similar moder-
ate absorption increases will continue to whittle builder
stocks over the next few years, underpinning annual
starts increases of between 2 and 5 per cent. But even
our forecast of nearly 10,200 starts in 2019 remains
below the peak output of 12,376 units hit in 2007.
Demographics are generally supportive; the average
ratio of housing starts to population growth during the
past five years was similar to its 25-year average, and
Vancouver’s proportion of empty-nest seniors continues
to grow.
Extremely poor affordability is a symptom of
Vancouver’s emergence as a world city. This implies
significant foreign investment and a de-coupling of
the local housing market from the area’s economy.
Vancouver’s $378,000 median condominium price last
year was almost 20 per cent higher than in second-place
Toronto. Principle and interest charges on this unit
required 21 per cent of household incomes last year,
almost 4 percentage points above runner-up Montréal
and will hit nearly 22 per cent in 2015 as the median
condominium price drifts higher. Vancouver mortgage
payments will thus remain tops among our report’s
eight cities, both absolutely and relative to incomes.
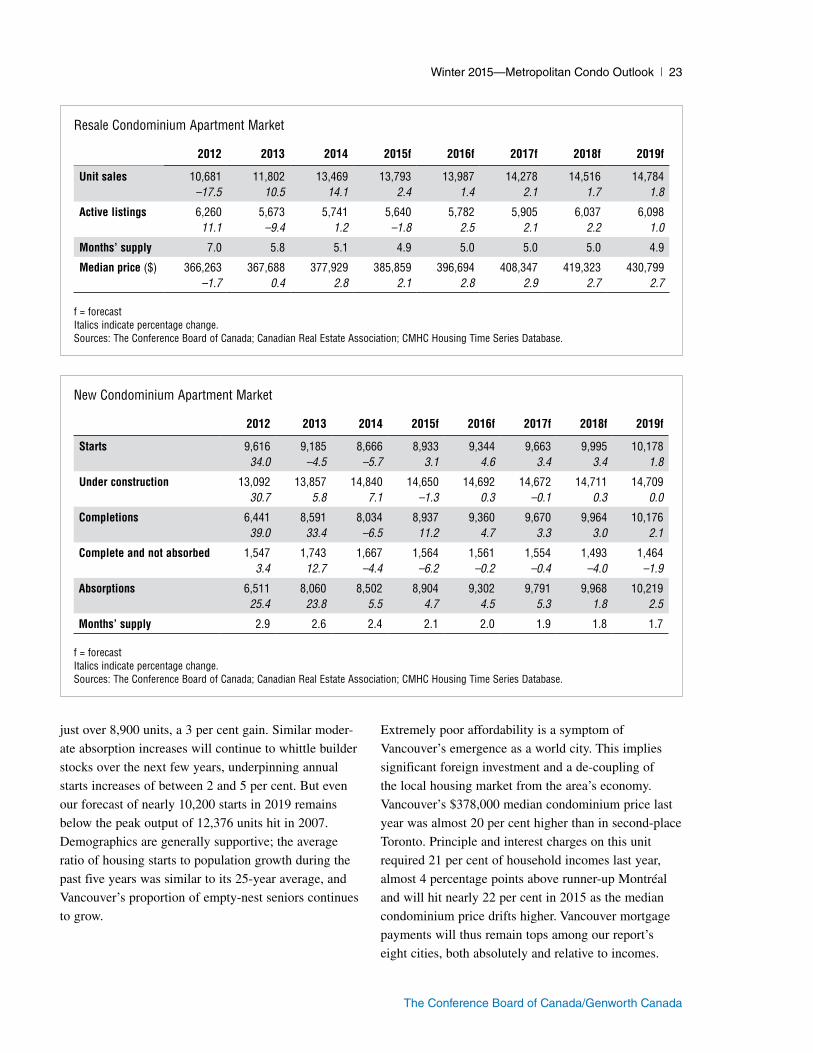
Resale Condominium Apartment Market
2012 2013 2014 2015f 2016f 2017f 2018f 2019f
Unit sales 10,681 11,802 13,469 13,793 13,987 14,278 14,516 14,784–17.5 10.5 14.1 2.4 1.4 2.1 1.7 1.8
Active listings 6,260 5,673 5,741 5,640 5,782 5,905 6,037 6,09811.1 –9.4 1.2 –1.8 2.5 2.1 2.2 1.0
Months’ supply 7.0 5.8 5.1 4.9 5.0 5.0 5.0 4.9
Median price ($) 366,263 367,688 377,929 385,859 396,694 408,347 419,323 430,799–1.7 0.4 2.8 2.1 2.8 2.9 2.7 2.7
f = forecastItalics indicate percentage change.Sources: The Conference Board of Canada; Canadian Real Estate Association; CMHC Housing Time Series Database.
New Condominium Apartment Market
2012 2013 2014 2015f 2016f 2017f 2018f 2019f
Starts 9,616 9,185 8,666 8,933 9,344 9,663 9,995 10,17834.0 –4.5 –5.7 3.1 4.6 3.4 3.4 1.8
Under construction 13,092 13,857 14,840 14,650 14,692 14,672 14,711 14,70930.7 5.8 7.1 –1.3 0.3 –0.1 0.3 0.0
Completions 6,441 8,591 8,034 8,937 9,360 9,670 9,964 10,17639.0 33.4 –6.5 11.2 4.7 3.3 3.0 2.1
Complete and not absorbed 1,547 1,743 1,667 1,564 1,561 1,554 1,493 1,4643.4 12.7 –4.4 –6.2 –0.2 –0.4 –4.0 –1.9
Absorptions 6,511 8,060 8,502 8,904 9,302 9,791 9,968 10,21925.4 23.8 5.5 4.7 4.5 5.3 1.8 2.5
Months’ supply 2.9 2.6 2.4 2.1 2.0 1.9 1.8 1.7
f = forecastItalics indicate percentage change.Sources: The Conference Board of Canada; Canadian Real Estate Association; CMHC Housing Time Series Database.
24 | Metropolitan Condo Outlook—Winter 2015
The Conference Board of Canada/Genworth Canada
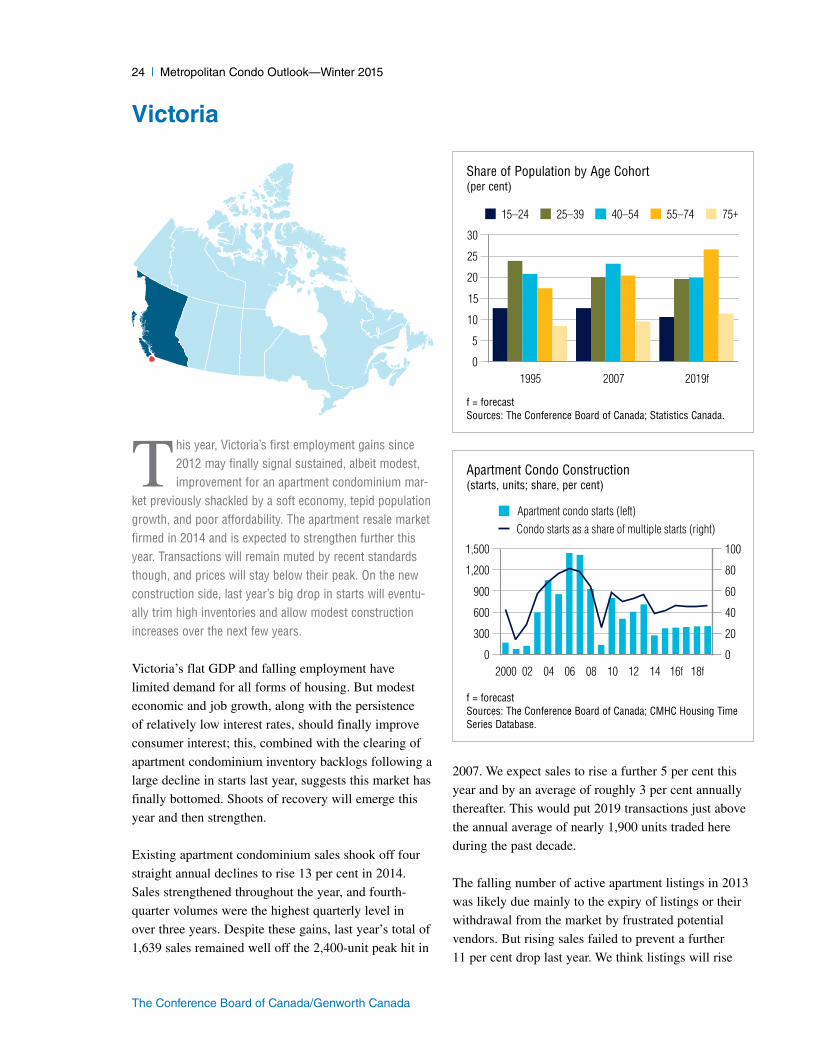
T his year, Victoria’s first employment gains since 2012 may finally signal sustained, albeit modest, improvement for an apartment condominium mar-
ket previously shackled by a soft economy, tepid population growth, and poor affordability. The apartment resale market firmed in 2014 and is expected to strengthen further this year. Transactions will remain muted by recent standards though, and prices will stay below their peak. On the new construction side, last year’s big drop in starts will eventu-ally trim high inventories and allow modest construction increases over the next few years.
Victoria’s flat GDP and falling employment have
limited demand for all forms of housing. But modest
economic and job growth, along with the persistence
of relatively low interest rates, should finally improve
consumer interest; this, combined with the clearing of
apartment condominium inventory backlogs following a
large decline in starts last year, suggests this market has
finally bottomed. Shoots of recovery will emerge this
year and then strengthen.
Existing apartment condominium sales shook off four
straight annual declines to rise 13 per cent in 2014.
Sales strengthened throughout the year, and fourth-
quarter volumes were the highest quarterly level in
over three years. Despite these gains, last year’s total of
1,639 sales remained well off the 2,400-unit peak hit in
2007. We expect sales to rise a further 5 per cent this
year and by an average of roughly 3 per cent annually
thereafter. This would put 2019 transactions just above
the annual average of nearly 1,900 units traded here
during the past decade.
The falling number of active apartment listings in 2013
was likely due mainly to the expiry of listings or their
withdrawal from the market by frustrated potential
vendors. But rising sales failed to prevent a further
11 per cent drop last year. We think listings will rise
Victoria
Share of Population by Age Cohort(per cent)
f = forecastSources: The Conference Board of Canada; Statistics Canada.
1995 2007 2019f0
5
10
15
20
25
30
15–24 25–39 40–54 55–74 75+
Apartment Condo Construction(starts, units; share, per cent)
f = forecastSources: The Conference Board of Canada; CMHC Housing Time Series Database.
2000 02 04 06 08 10 12 14 16f 18f0
300
600
900
1,200
1,500
0
20
40
60
80
100
Apartment condo starts (left)Condo starts as a share of multiple starts (right)
Winter 2015—Metropolitan Condo Outlook | 25
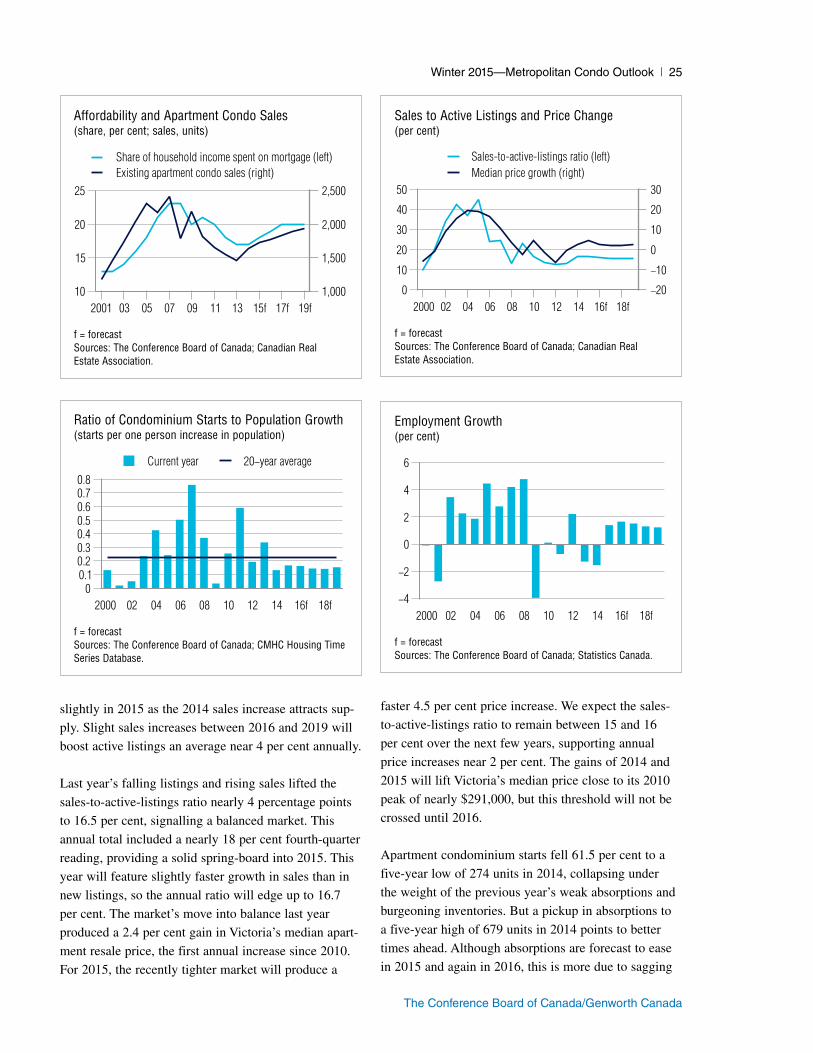
The Conference Board of Canada/Genworth Canada
slightly in 2015 as the 2014 sales increase attracts sup-
ply. Slight sales increases between 2016 and 2019 will
boost active listings an average near 4 per cent annually.
Last year’s falling listings and rising sales lifted the
sales-to-active-listings ratio nearly 4 percentage points
to 16.5 per cent, signalling a balanced market. This
annual total included a nearly 18 per cent fourth-quarter
reading, providing a solid spring-board into 2015. This
year will feature slightly faster growth in sales than in
new listings, so the annual ratio will edge up to 16.7
per cent. The market’s move into balance last year
produced a 2.4 per cent gain in Victoria’s median apart-
ment resale price, the first annual increase since 2010.
For 2015, the recently tighter market will produce a
faster 4.5 per cent price increase. We expect the sales-
to-active-listings ratio to remain between 15 and 16
per cent over the next few years, supporting annual
price increases near 2 per cent. The gains of 2014 and
2015 will lift Victoria’s median price close to its 2010
peak of nearly $291,000, but this threshold will not be
crossed until 2016.
Apartment condominium starts fell 61.5 per cent to a
five-year low of 274 units in 2014, collapsing under
the weight of the previous year’s weak absorptions and
burgeoning inventories. But a pickup in absorptions to
a five-year high of 679 units in 2014 points to better
times ahead. Although absorptions are forecast to ease
in 2015 and again in 2016, this is more due to sagging
Affordability and Apartment Condo Sales(share, per cent; sales, units)
f = forecastSources: The Conference Board of Canada; Canadian Real Estate Association.
2001 03 05 07 09 11 13 15f 17f 19f10
15
20
25
1,000
1,500
2,000
2,500
Share of household income spent on mortgage (left)Existing apartment condo sales (right)
Sales to Active Listings and Price Change(per cent)
f = forecastSources: The Conference Board of Canada; Canadian Real Estate Association.
2000 02 04 06 08 10 12 14 16f 18f0
10
20
30
40
50
−20
−10
0
10
20
30
Sales-to-active-listings ratio (left)Median price growth (right)
Ratio of Condominium Starts to Population Growth(starts per one person increase in population)
f = forecastSources: The Conference Board of Canada; CMHC Housing Time Series Database.
2000 02 04 06 08 10 12 14 16f 18f0
0.10.20.30.40.50.60.70.8
Current year 20−year average
Employment Growth(per cent)
f = forecastSources: The Conference Board of Canada; Statistics Canada.
2000 02 04 06 08 10 12 14 16f 18f−4
−2
0
2
4
6
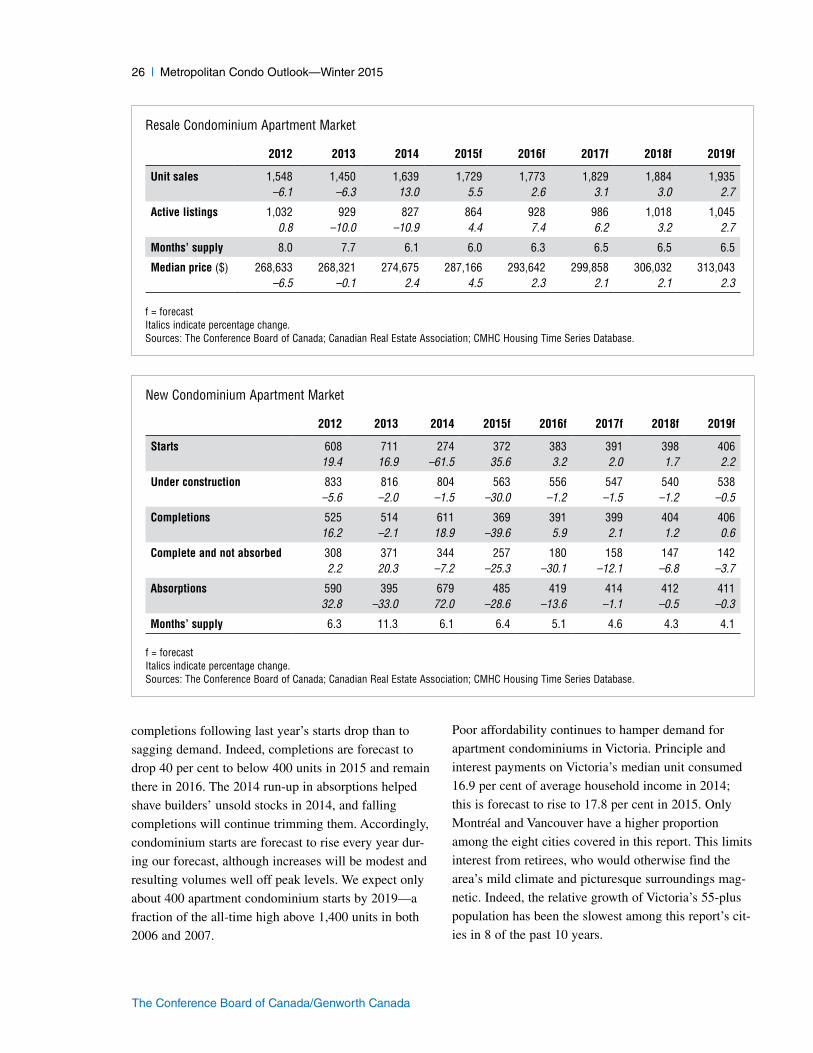
26 | Metropolitan Condo Outlook—Winter 2015
The Conference Board of Canada/Genworth Canada
completions following last year’s starts drop than to
sagging demand. Indeed, completions are forecast to
drop 40 per cent to below 400 units in 2015 and remain
there in 2016. The 2014 run-up in absorptions helped
shave builders’ unsold stocks in 2014, and falling
completions will continue trimming them. Accordingly,
condominium starts are forecast to rise every year dur-
ing our forecast, although increases will be modest and
resulting volumes well off peak levels. We expect only
about 400 apartment condominium starts by 2019—a
fraction of the all-time high above 1,400 units in both
2006 and 2007.
Poor affordability continues to hamper demand for
apartment condominiums in Victoria. Principle and
interest payments on Victoria’s median unit consumed
16.9 per cent of average household income in 2014;
this is forecast to rise to 17.8 per cent in 2015. Only
Montréal and Vancouver have a higher proportion
among the eight cities covered in this report. This limits
interest from retirees, who would otherwise find the
area’s mild climate and picturesque surroundings mag-
netic. Indeed, the relative growth of Victoria’s 55-plus
population has been the slowest among this report’s cit-
ies in 8 of the past 10 years.
Resale Condominium Apartment Market
2012 2013 2014 2015f 2016f 2017f 2018f 2019f
Unit sales 1,548 1,450 1,639 1,729 1,773 1,829 1,884 1,935–6.1 –6.3 13.0 5.5 2.6 3.1 3.0 2.7
Active listings 1,032 929 827 864 928 986 1,018 1,0450.8 –10.0 –10.9 4.4 7.4 6.2 3.2 2.7
Months’ supply 8.0 7.7 6.1 6.0 6.3 6.5 6.5 6.5
Median price ($) 268,633 268,321 274,675 287,166 293,642 299,858 306,032 313,043–6.5 –0.1 2.4 4.5 2.3 2.1 2.1 2.3
f = forecastItalics indicate percentage change.Sources: The Conference Board of Canada; Canadian Real Estate Association; CMHC Housing Time Series Database.
New Condominium Apartment Market
2012 2013 2014 2015f 2016f 2017f 2018f 2019f
Starts 608 711 274 372 383 391 398 40619.4 16.9 –61.5 35.6 3.2 2.0 1.7 2.2
Under construction 833 816 804 563 556 547 540 538–5.6 –2.0 –1.5 –30.0 –1.2 –1.5 –1.2 –0.5
Completions 525 514 611 369 391 399 404 40616.2 –2.1 18.9 –39.6 5.9 2.1 1.2 0.6
Complete and not absorbed 308 371 344 257 180 158 147 1422.2 20.3 –7.2 –25.3 –30.1 –12.1 –6.8 –3.7
Absorptions 590 395 679 485 419 414 412 41132.8 –33.0 72.0 –28.6 –13.6 –1.1 –0.5 –0.3
Months’ supply 6.3 11.3 6.1 6.4 5.1 4.6 4.3 4.1
f = forecastItalics indicate percentage change.Sources: The Conference Board of Canada; Canadian Real Estate Association; CMHC Housing Time Series Database.
The Conference Board of Canada/Genworth Canada
Housing starts—Refers to the beginning of construction
work on a building, usually when the concrete has been
poured for the entire footing around the structure, or at
an equivalent stage where a basement will not be part
of the structure.
Under construction—Units started but not completed.
Completions—Refers to units where all the proposed
construction work has been performed or, in some
cases, where 90 per cent of construction work has been
completed and the structure is fit for occupancy.
Complete and not absorbed—Refers to newly completed
units that remain unoccupied.
Absorptions—Newly completed units sold or rented.
Units pre-sold or pre-leased are not included until the
completion stage.
Short-term supply—The number of months needed
to absorb unoccupied units. It is defined as the ratio
between unoccupied units and absorbed units (average
for the last 12 months). Short-term supply is included
in the tables in this report as “months’ supply.”
Long-term supply—The number of months needed to
absorb units under construction and those complete
and unoccupied (total supply). It is defined as the ratio
between total supply and absorbed units (average for the
last 12 months).
Median resale price—The median price of all resale apart-
ment condominium units sold on the MLS. The average
price is used for Montréal and Québec City. Data do not
generally include figures for new construction sales.
Sources: Canadian Mortgage and Housing Corporation; Canadian Real Estate Association; The Conference Board of Canada.
Definitions and Concepts
28 | Metropolitan Condo Outlook—Winter 2015
The Conference Board of Canada/Genworth Canada
Standard Geographical Classification (SGC) 2006
METROPOLITAN AREAS WITH THEIR COMPONENT CENSUS SUBDIVISIONS
Québec City
Beaumont Municipality
Boischatel Municipality
Château-Richer City
Fossambault-sur-le-Lac City
Lac-Beauport Municipality
Lac-Delage City
Lac-Saint-Joseph City
L’Ancienne-Lorette City
L’Ange-Gardien Parish (Municipality of)
Lévis City
Notre-Dame-des-Anges Parish (Municipality of)
Québec City
Saint-Augustin-de-Desmaures City
Sainte-Brigitte-de-Laval Municipality
Sainte-Catherine-de-la-Jacques-Cartier City
Sainte-Famille Parish (Municipality of)
Sainte-Pétronille Village
Saint-François-de-l’Île-d’Orléans Municipality
Saint-Gabriel-de-Valcartier Municipality
Saint-Henri Municipality
Saint-Jean-de-l’Île-d’Orléans Municipality
Saint-Lambert-de-Lauzon Parish (Municipality of)
Saint-Laurent-de-l’Île-d’Orléans Municipality
Saint-Pierre-de-l’Île-d’Orléans Municipality
Shannon Municipality
Stoneham-et-Tewkesbury United Townships (Municipality of)
Wendake Indian reserve
Montréal
Baie-d’Urfé City
Beaconsfield City
Beauharnois City
Beloeil City
Blainville City
Boisbriand City
Bois-des-Filion City
Boucherville City
Brossard City
Candiac City
Carignan City
Chambly City
Charlemagne City
Châteauguay City
Coteau-du-Lac Municipality
Côte-Saint-Luc City
Delson City
Deux-Montagnes City
Dollard-des-Ormeaux City
Dorval Cité
Gore Township (Municipality of)
Hampstead City
Hudson City
Kahnawake Indian reserve
Kanesatake Indian settlement
Kirkland City
La Prairie City
L’Assomption City
Laval City
Lavaltrie City
L’Épiphanie Parish (Municipality of)
L’Épiphanie City
Léry City
Les Cèdres Municipality
Les Coteaux Municipality
L’Île-Cadieux City
L’Île-Dorval City
L’Île-Perrot City
Longueuil City
Lorraine City
Mascouche City
McMasterville Municipality
Mercier City
Mirabel City
Montréal City
Montréal-Est City
Montréal-Ouest City
Name Type Name Type
Winter 2015—Metropolitan Condo Outlook | 29
The Conference Board of Canada/Genworth Canada
Mont-Royal City
Mont-Saint-Hilaire City
Notre-Dame-de-l’Île-Perrot City
Oka Municipality
Otterburn Park City
Pincourt City
Pointe-Calumet Municipality
Pointe-Claire City
Pointe-des-Cascades Village
Repentigny City
Richelieu City
Rosemère City
Saint-Amable Municipality
Saint-Basile-le-Grand City
Saint-Bruno-de-MontarCity City
Saint-Colomban Parish (Municipality of)
Saint-Constant City
Sainte-Anne-de-Bellevue City
Sainte-Anne-des-Plaines City
Sainte-Catherine City
Sainte-Julie City
Sainte-Marthe-sur-le-Lac City
Sainte-Thérèse City
Saint-Eustache City
Saint-Isidore Parish (Municipality of)
Saint-Jérôme City
Saint-Joseph-du-Lac Municipality
Saint-Lambert City
Saint-Lazare City
Saint-Mathias-sur-Richelieu Municipality
Saint-Mathieu Municipality
Saint-Mathieu-de-Beloeil Municipality
Saint-Philippe Municipality
Saint-Placide Municipality
Saint-Sulpice Parish (Municipality of)
Saint-Zotique Village
Senneville Village
Terrasse-Vaudreuil Municipality
Terrebonne City
Varennes City
Vaudreuil-Dorion City
Vaudreuil-sur-le-Lac Village
Verchères Municipality
Westmount City
Ottawa
Clarence-Rockland City
Ottawa City
Russell Township
Toronto
Ajax Town
Aurora Town
Bradford West Gwillimbury Town
Brampton City
Caledon Town
Chippewas of Georgina Island First Nation
Indian reserve
East Gwillimbury Town
Georgina Town
Halton Hills Town
King Township
Markham Town
Milton Town
Mississauga City
Mono Town
New Tecumseth Town
Newmarket Town
Oakville Town
Orangeville Town
Pickering City
Richmond Hill Town
Toronto City
Uxbridge Township
Vaughan City
Whitchurch-Stouffville Town
Calgary
Airdrie City
Beiseker Village
Calgary City
Chestermere Town
Cochrane Town
Crossfield Town
Irricana Village
Rocky View No. 44 Municipal district
Tsuu T’ina Nation 145 (Sarcee 145) Indian reserve
Name Type Name Type
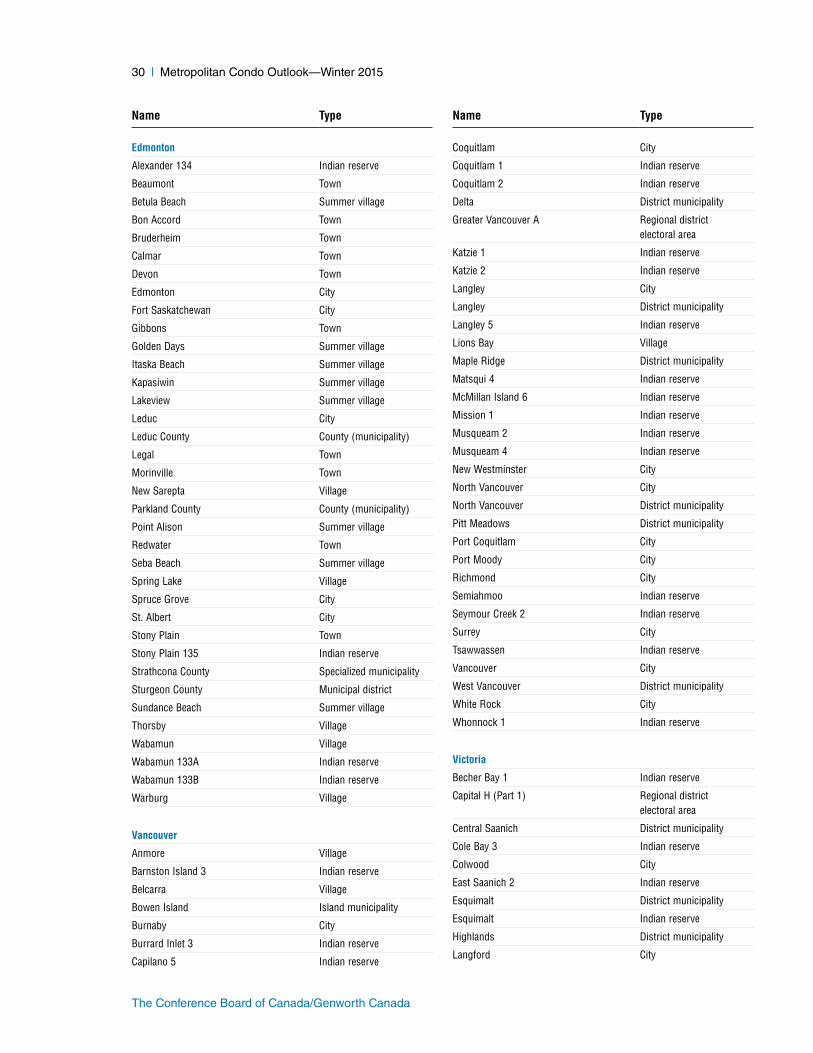
30 | Metropolitan Condo Outlook—Winter 2015
The Conference Board of Canada/Genworth Canada
Edmonton
Alexander 134 Indian reserve
Beaumont Town
Betula Beach Summer village
Bon Accord Town
Bruderheim Town
Calmar Town
Devon Town
Edmonton City
Fort Saskatchewan City
Gibbons Town
Golden Days Summer village
Itaska Beach Summer village
Kapasiwin Summer village
Lakeview Summer village
Leduc City
Leduc County County (municipality)
Legal Town
Morinville Town
New Sarepta Village
Parkland County County (municipality)
Point Alison Summer village
Redwater Town
Seba Beach Summer village
Spring Lake Village
Spruce Grove City
St. Albert City
Stony Plain Town
Stony Plain 135 Indian reserve
Strathcona County Specialized municipality
Sturgeon County Municipal district
Sundance Beach Summer village
Thorsby Village
Wabamun Village
Wabamun 133A Indian reserve
Wabamun 133B Indian reserve
Warburg Village
Vancouver
Anmore Village
Barnston Island 3 Indian reserve
Belcarra Village
Bowen Island Island municipality
Burnaby City
Burrard Inlet 3 Indian reserve
Capilano 5 Indian reserve
Coquitlam City
Coquitlam 1 Indian reserve
Coquitlam 2 Indian reserve
Delta District municipality
Greater Vancouver A Regional district electoral area
Katzie 1 Indian reserve
Katzie 2 Indian reserve
Langley City
Langley District municipality
Langley 5 Indian reserve
Lions Bay Village
Maple Ridge District municipality
Matsqui 4 Indian reserve
McMillan Island 6 Indian reserve
Mission 1 Indian reserve
Musqueam 2 Indian reserve
Musqueam 4 Indian reserve
New Westminster City
North Vancouver City
North Vancouver District municipality
Pitt Meadows District municipality
Port Coquitlam City
Port Moody City
Richmond City
Semiahmoo Indian reserve
Seymour Creek 2 Indian reserve
Surrey City
Tsawwassen Indian reserve
Vancouver City
West Vancouver District municipality
White Rock City
Whonnock 1 Indian reserve
Victoria
Becher Bay 1 Indian reserve
Capital H (Part 1) Regional district electoral area
Central Saanich District municipality
Cole Bay 3 Indian reserve
Colwood City
East Saanich 2 Indian reserve
Esquimalt District municipality
Esquimalt Indian reserve
Highlands District municipality
Langford City
Name Type Name Type
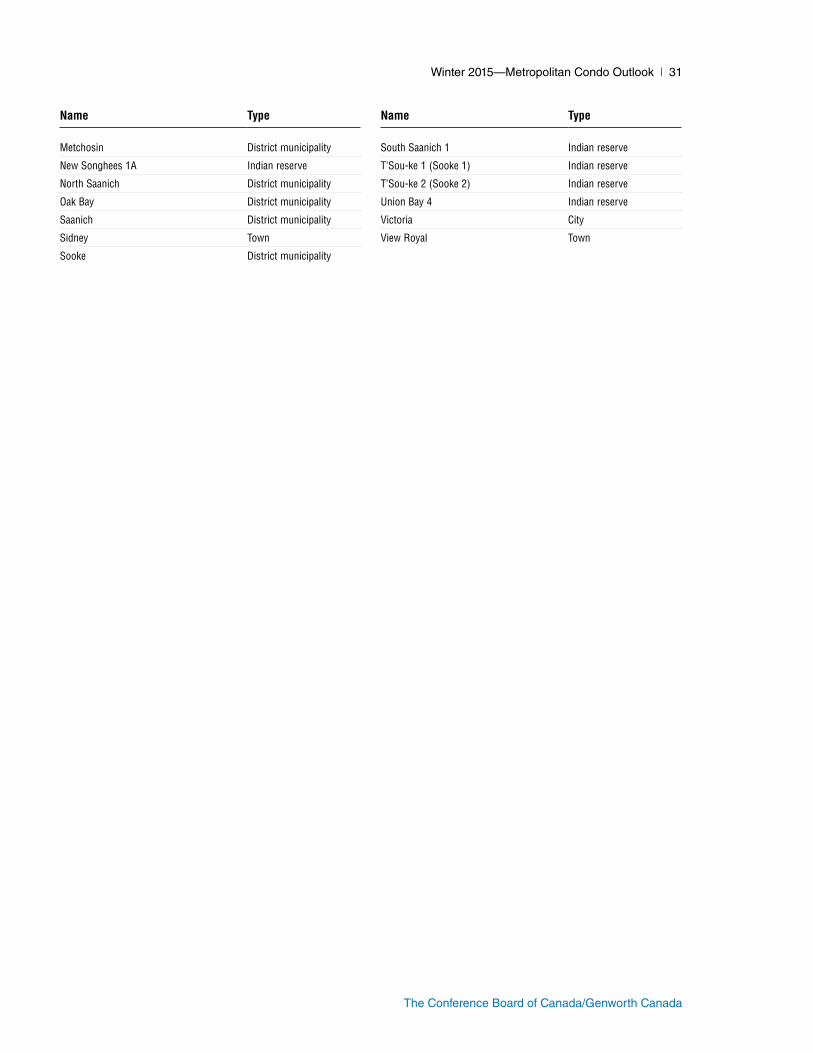
Winter 2015—Metropolitan Condo Outlook | 31
The Conference Board of Canada/Genworth Canada
South Saanich 1 Indian reserve
T’Sou-ke 1 (Sooke 1) Indian reserve
T’Sou-ke 2 (Sooke 2) Indian reserve
Union Bay 4 Indian reserve
Victoria City
View Royal Town
Metchosin District municipality
New Songhees 1A Indian reserve
North Saanich District municipality
Oak Bay District municipality
Saanich District municipality
Sidney Town
Sooke District municipality
Name Type Name Type

255 Smyth Road, Ottawa ON
K1H 8M7 Canada
Tel. 613-526-3280
Fax 613-526-4857
Inquiries 1-866-711-2262
conferenceboard .ca
Insights. Understanding. Impact.