Embed Size (px)
Citation preview
Insights IntoThe Kansas City Nonprofit Sector
Research Conducted by the Midwest Center for Nonprofit LeadershipHenry W. Bloch School of Management
University of Missouri – Kansas CityResearch Funded by the Ewing Marion Kauffman Foundation
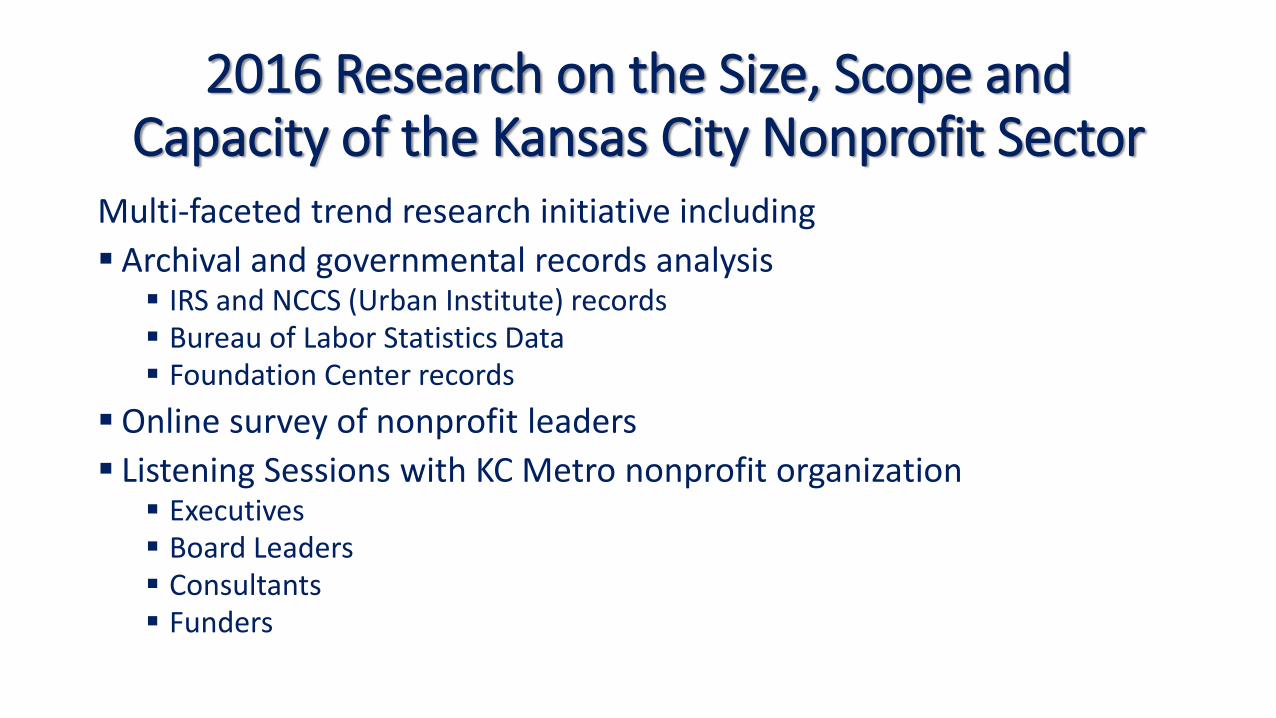
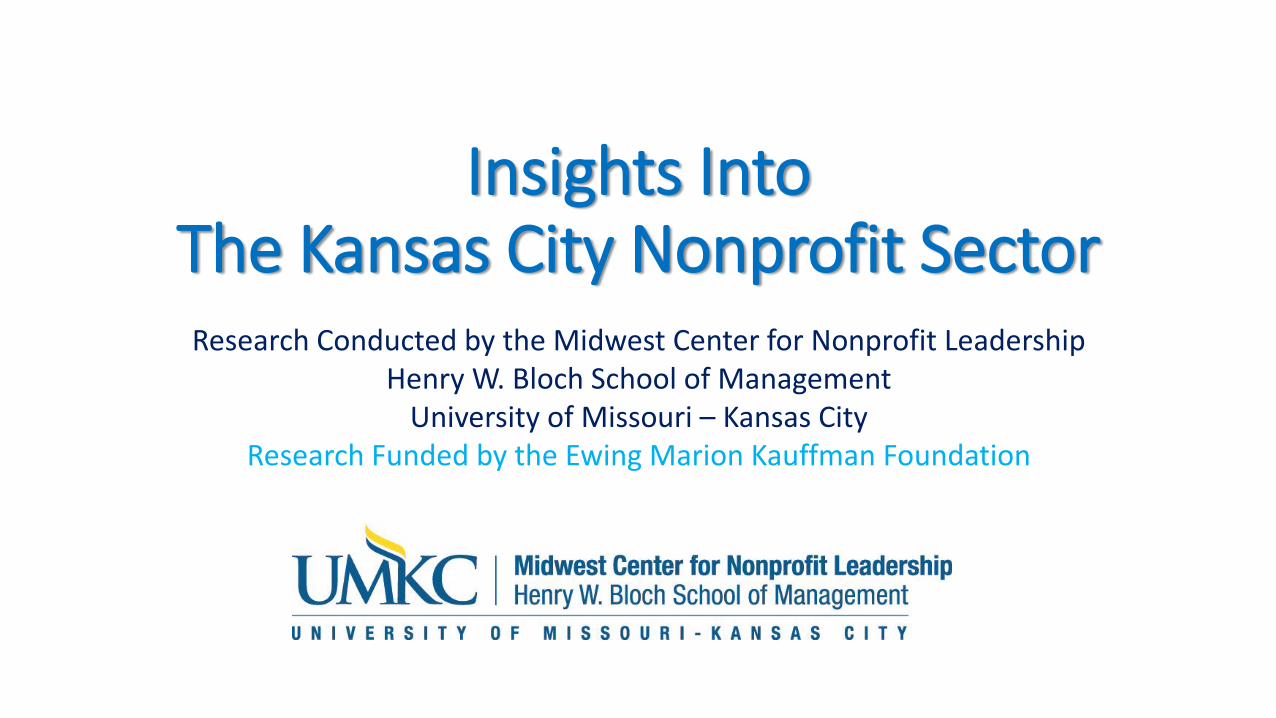
2016 Research on the Size, Scope and Capacity of the Kansas City Nonprofit Sector
Multi-faceted trend research initiative including
Archival and governmental records analysis IRS and NCCS (Urban Institute) records Bureau of Labor Statistics Data Foundation Center records
Online survey of nonprofit leaders
Listening Sessions with KC Metro nonprofit organization Executives Board Leaders Consultants Funders
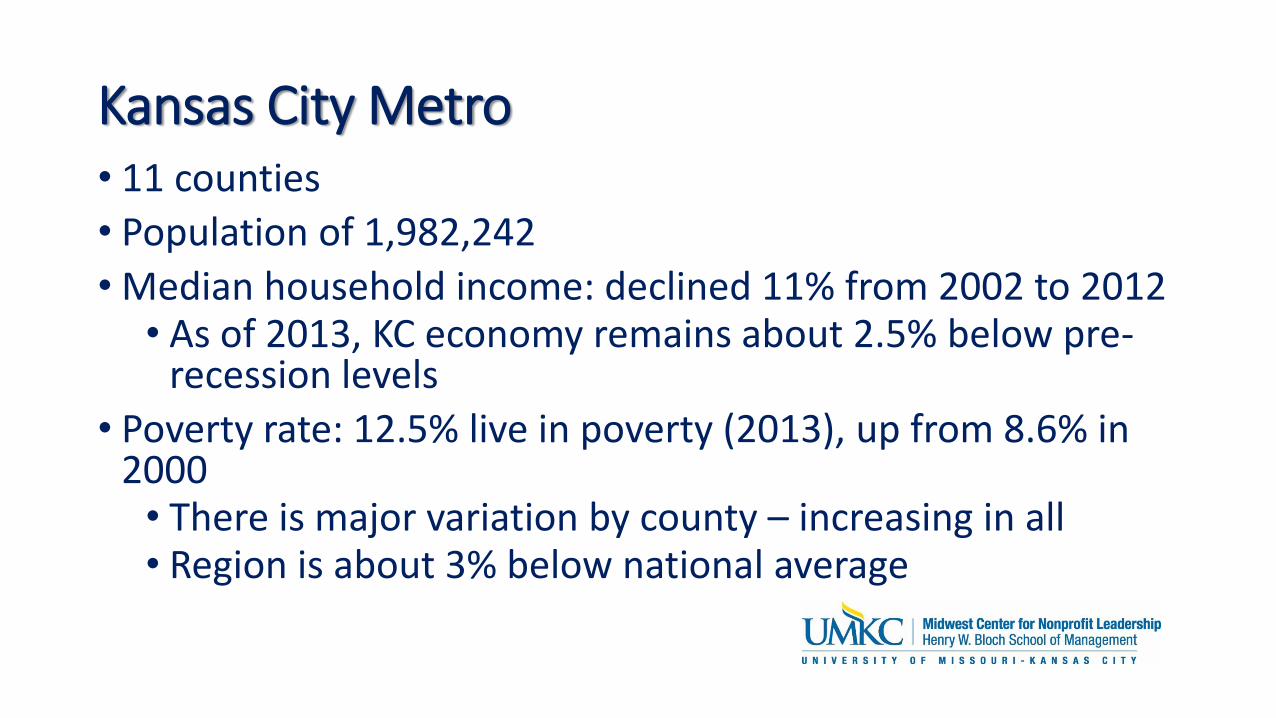
Kansas City Metro • 11 counties
• Population of 1,982,242
• Median household income: declined 11% from 2002 to 2012• As of 2013, KC economy remains about 2.5% below pre-
recession levels
• Poverty rate: 12.5% live in poverty (2013), up from 8.6% in 2000• There is major variation by county – increasing in all• Region is about 3% below national average
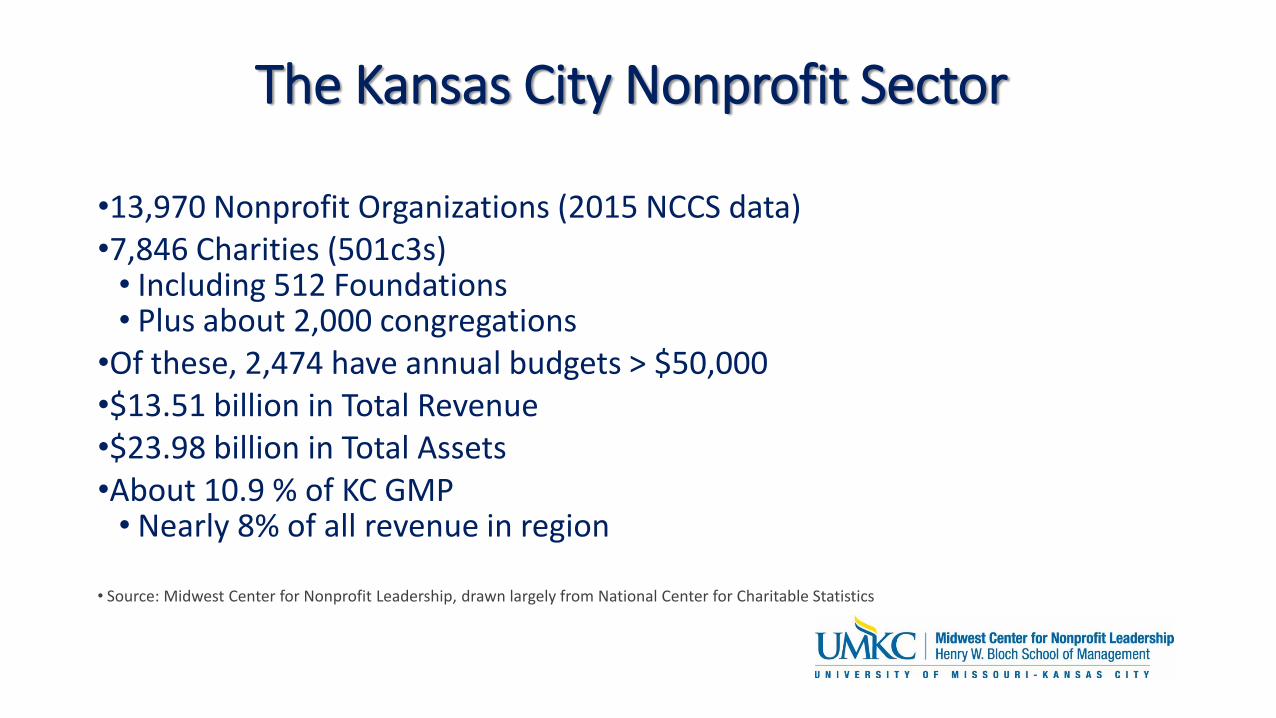
The Kansas City Nonprofit Sector
•13,970 Nonprofit Organizations (2015 NCCS data)•7,846 Charities (501c3s)• Including 512 Foundations• Plus about 2,000 congregations
•Of these, 2,474 have annual budgets > $50,000•$13.51 billion in Total Revenue•$23.98 billion in Total Assets•About 10.9 % of KC GMP• Nearly 8% of all revenue in region
• Source: Midwest Center for Nonprofit Leadership, drawn largely from National Center for Charitable Statistics
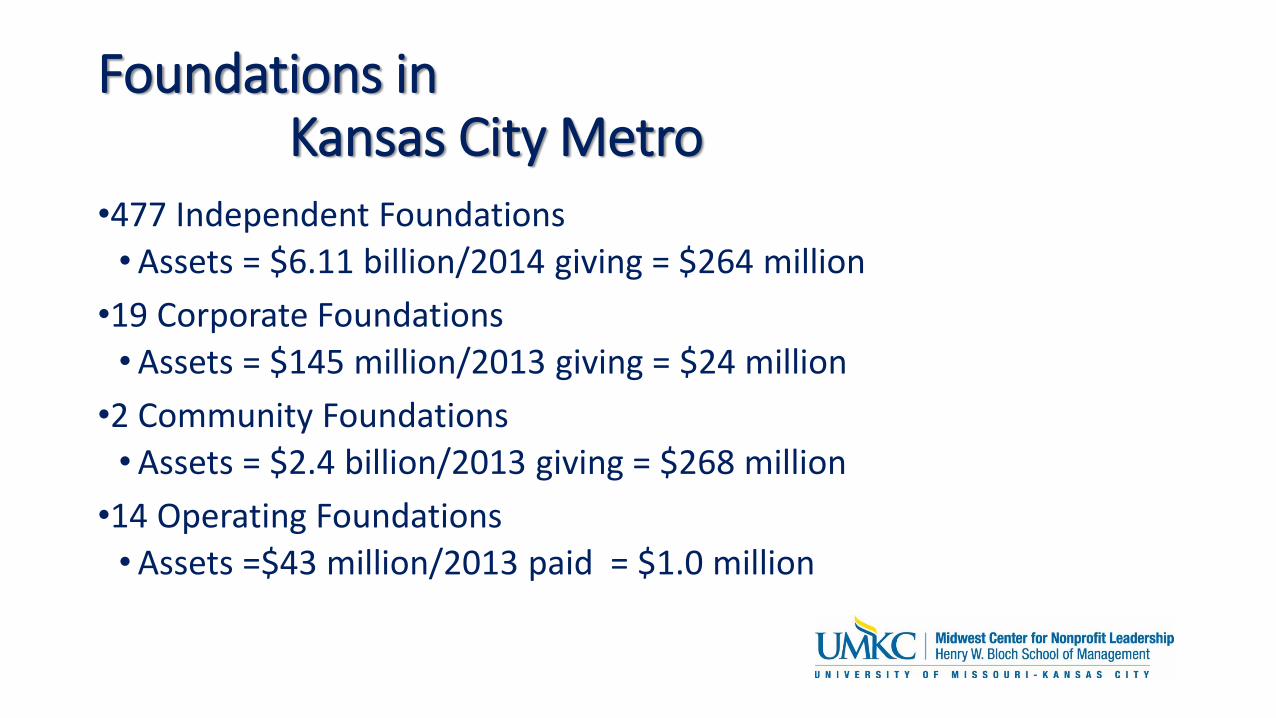
Foundations in Kansas City Metro
•477 Independent Foundations
•Assets = $6.11 billion/2014 giving = $264 million
•19 Corporate Foundations
•Assets = $145 million/2013 giving = $24 million
•2 Community Foundations
•Assets = $2.4 billion/2013 giving = $268 million
•14 Operating Foundations
•Assets =$43 million/2013 paid = $1.0 million
Kansas City Generosity
• Kansas City MO ranks• 16th in 2012 by Chronicle on Philanthropy• 35th in 2015 by WalletHub• 12th in 2016 by Charity Navigator
• Average of 3.1% of income donated• average per person giving is
$3,187• This is a decrease of about 1.6 %
since 2006 (Chronicle)
• Compared to• Milwaukee: 31st in nation at 2.7%
(down 4.9% from 2006)• Indianapolis: 12th in nation at 3.2%
(up 5.2% since 2006)
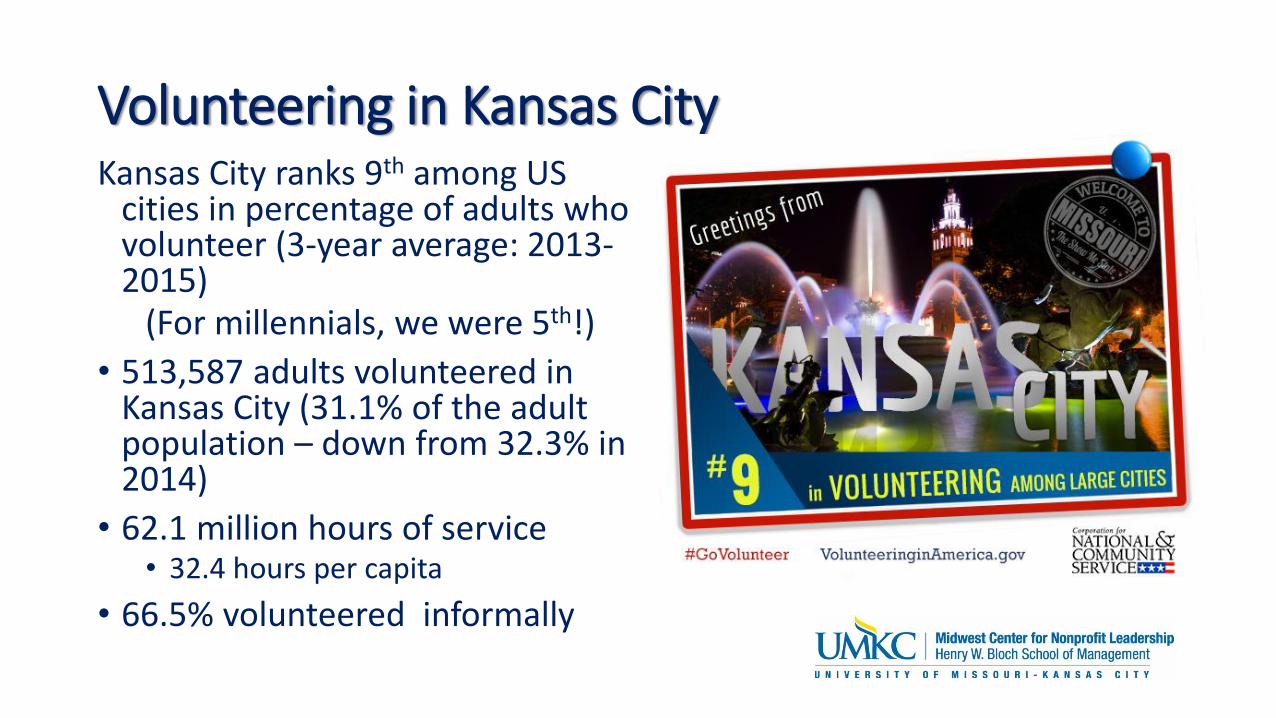
Volunteering in Kansas CityKansas City ranks 9th among US
cities in percentage of adults who volunteer (3-year average: 2013-2015)
(For millennials, we were 5th!)
• 513,587 adults volunteered in Kansas City (31.1% of the adult population – down from 32.3% in 2014)
• 62.1 million hours of service• 32.4 hours per capita
• 66.5% volunteered informally
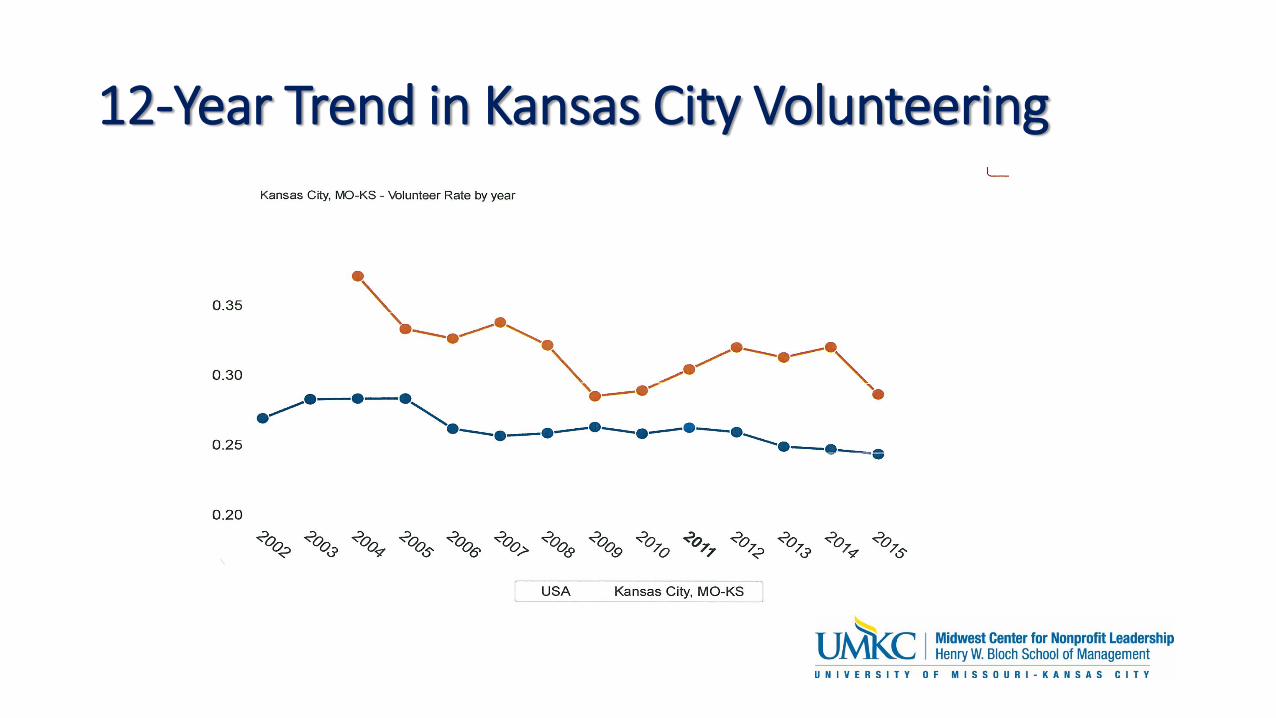
12-Year Trend in Kansas City Volunteering
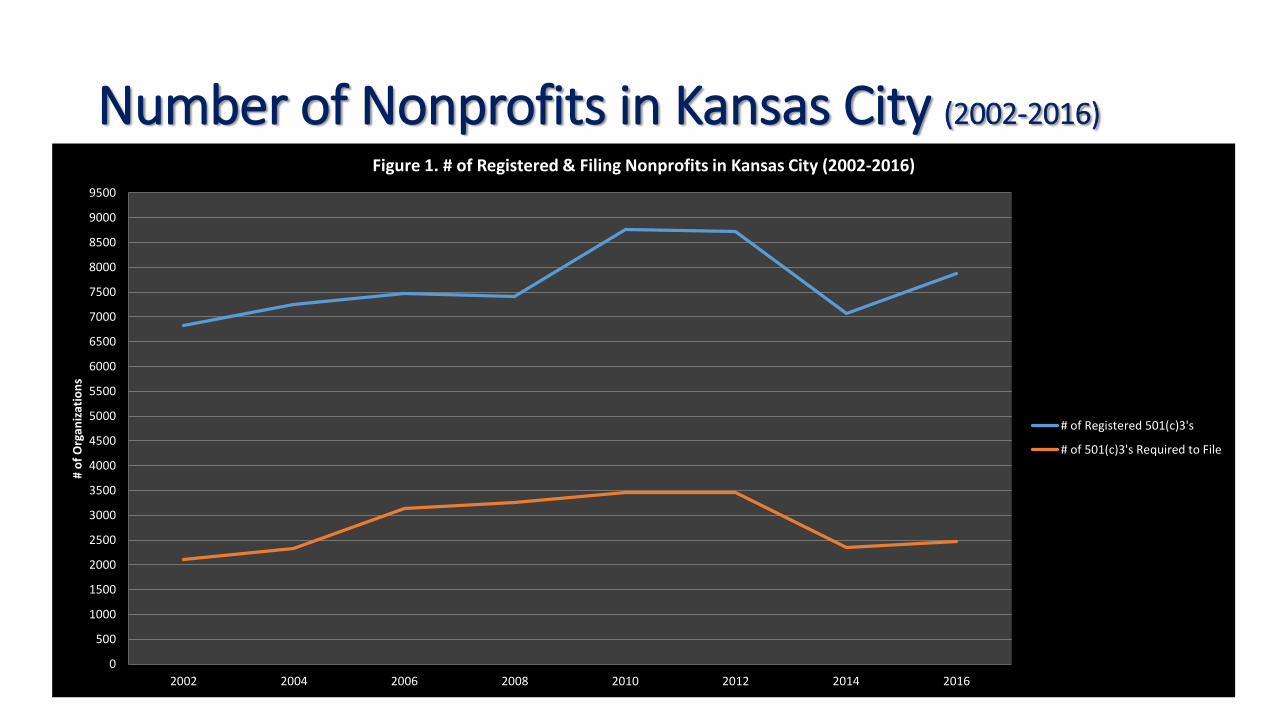
Number of Nonprofits in Kansas City (2002-2016)
0
500
1000
1500
2000
2500
3000
3500
4000
4500
5000
5500
6000
6500
7000
7500
8000
8500
9000
9500
2002 2004 2006 2008 2010 2012 2014 2016
# o
f O
rgan
izat
ion
s
Figure 1. # of Registered & Filing Nonprofits in Kansas City (2002-2016)
# of Registered 501(c)3's
# of 501(c)3's Required to File
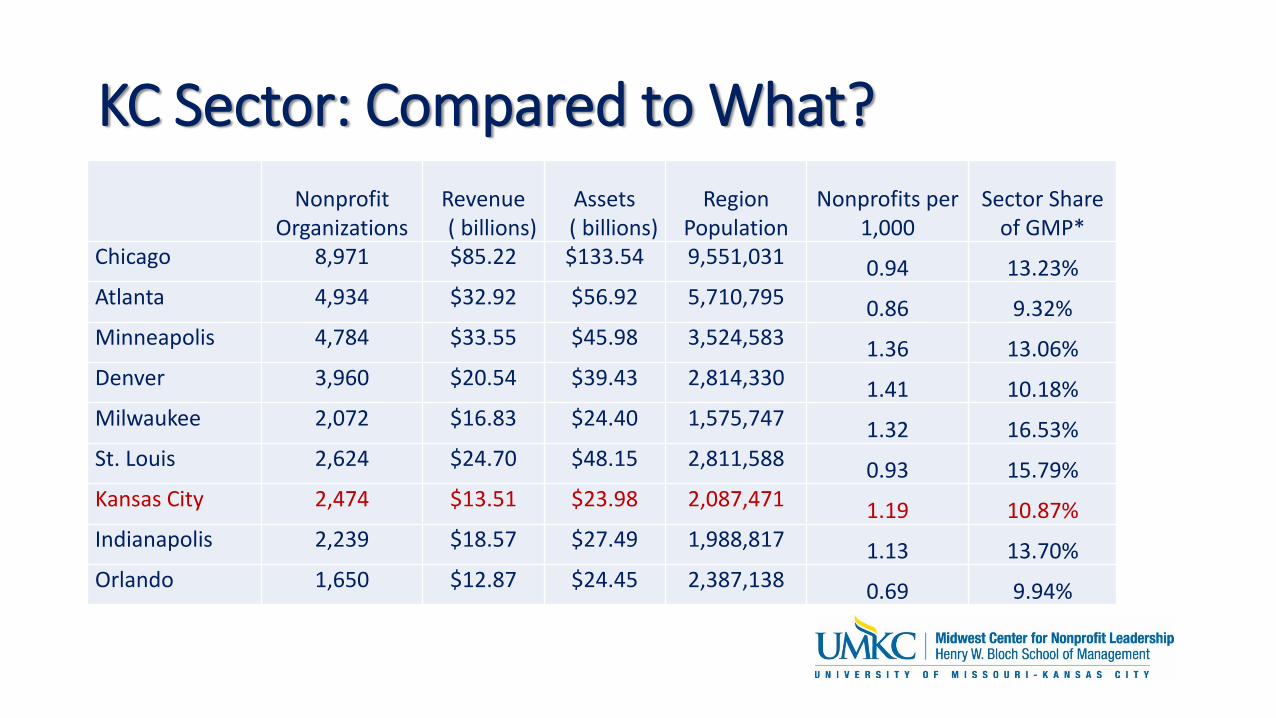
KC Sector: Compared to What?
Nonprofit Organizations
Revenue( billions)
Assets( billions)
Region Population
Nonprofits per 1,000
Sector Share of GMP*
Chicago 8,971 $85.22 $133.54 9,551,031 0.94 13.23%Atlanta 4,934 $32.92 $56.92 5,710,795 0.86 9.32%Minneapolis 4,784 $33.55 $45.98 3,524,583 1.36 13.06%Denver 3,960 $20.54 $39.43 2,814,330 1.41 10.18%Milwaukee 2,072 $16.83 $24.40 1,575,747 1.32 16.53%St. Louis 2,624 $24.70 $48.15 2,811,588 0.93 15.79%Kansas City 2,474 $13.51 $23.98 2,087,471 1.19 10.87%Indianapolis 2,239 $18.57 $27.49 1,988,817 1.13 13.70%Orlando 1,650 $12.87 $24.45 2,387,138 0.69 9.94%
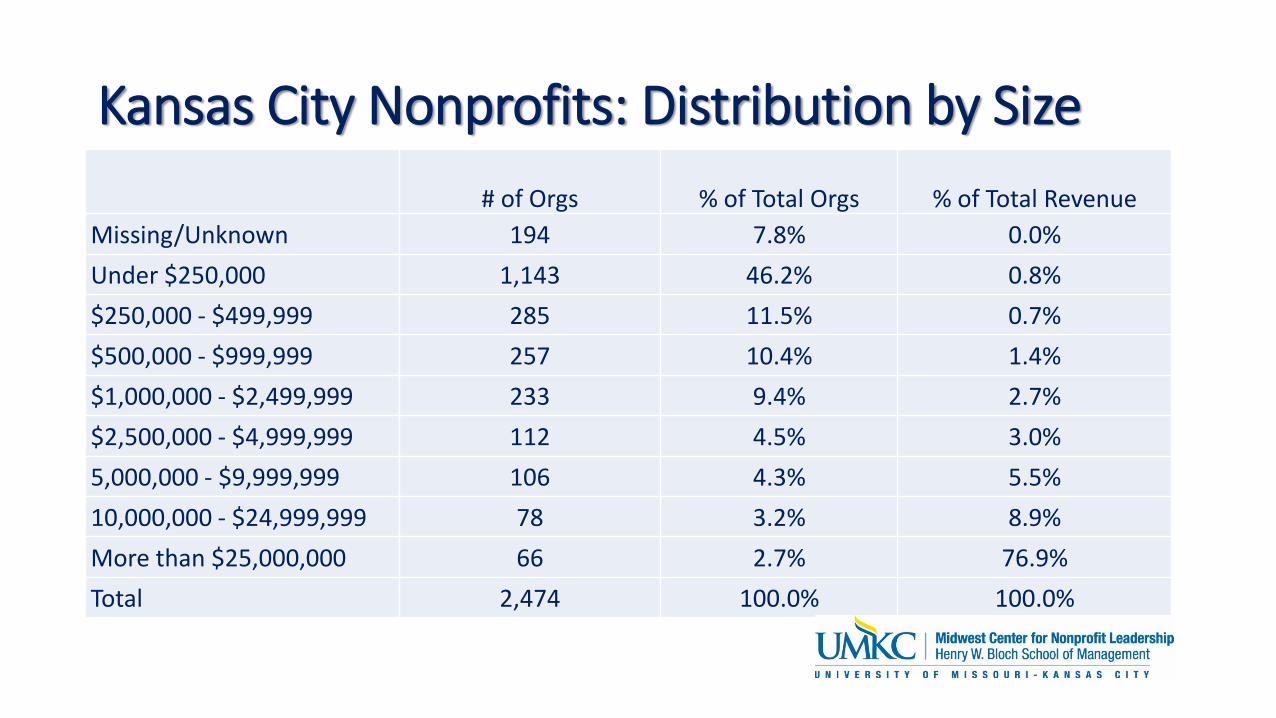
Kansas City Nonprofits: Distribution by Size
# of Orgs % of Total Orgs % of Total Revenue
Missing/Unknown 194 7.8% 0.0%
Under $250,000 1,143 46.2% 0.8%
$250,000 - $499,999 285 11.5% 0.7%
$500,000 - $999,999 257 10.4% 1.4%
$1,000,000 - $2,499,999 233 9.4% 2.7%
$2,500,000 - $4,999,999 112 4.5% 3.0%
5,000,000 - $9,999,999 106 4.3% 5.5%
10,000,000 - $24,999,999 78 3.2% 8.9%
More than $25,000,000 66 2.7% 76.9%
Total 2,474 100.0% 100.0%
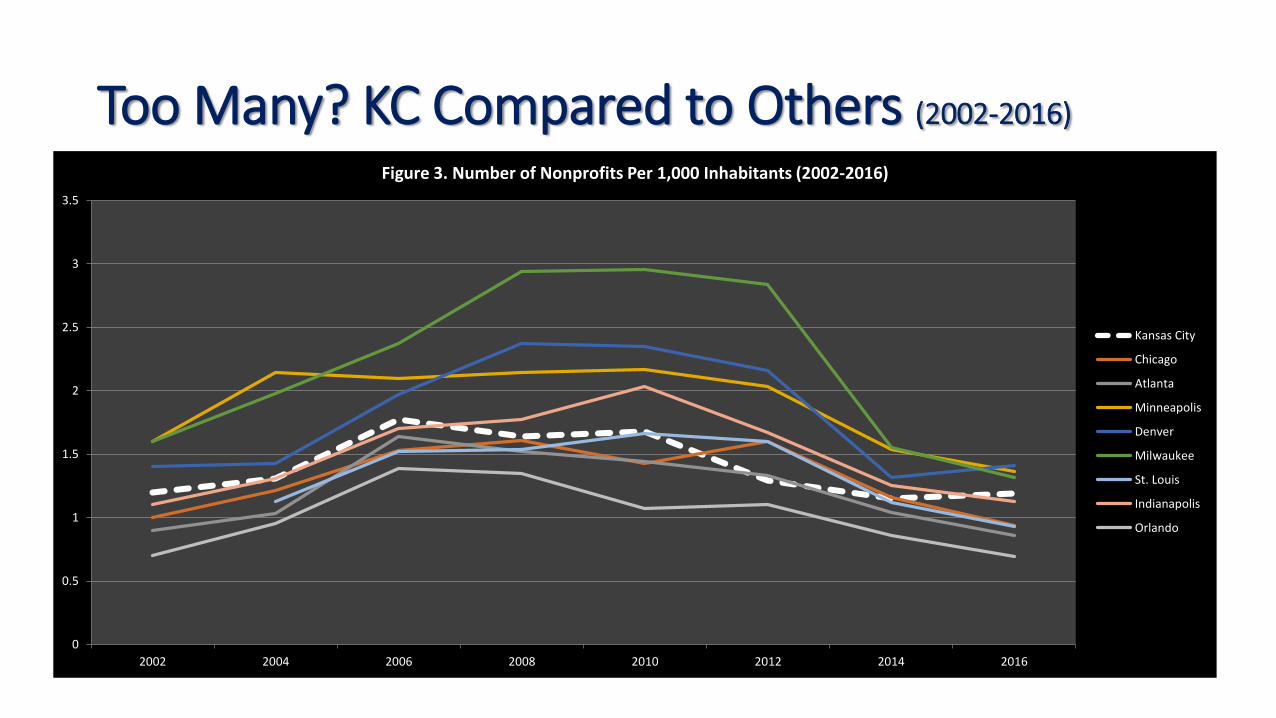
Too Many? KC Compared to Others (2002-2016)
0
0.5
1
1.5
2
2.5
3
3.5
2002 2004 2006 2008 2010 2012 2014 2016
Figure 3. Number of Nonprofits Per 1,000 Inhabitants (2002-2016)
Kansas City
Chicago
Atlanta
Minneapolis
Denver
Milwaukee
St. Louis
Indianapolis
Orlando
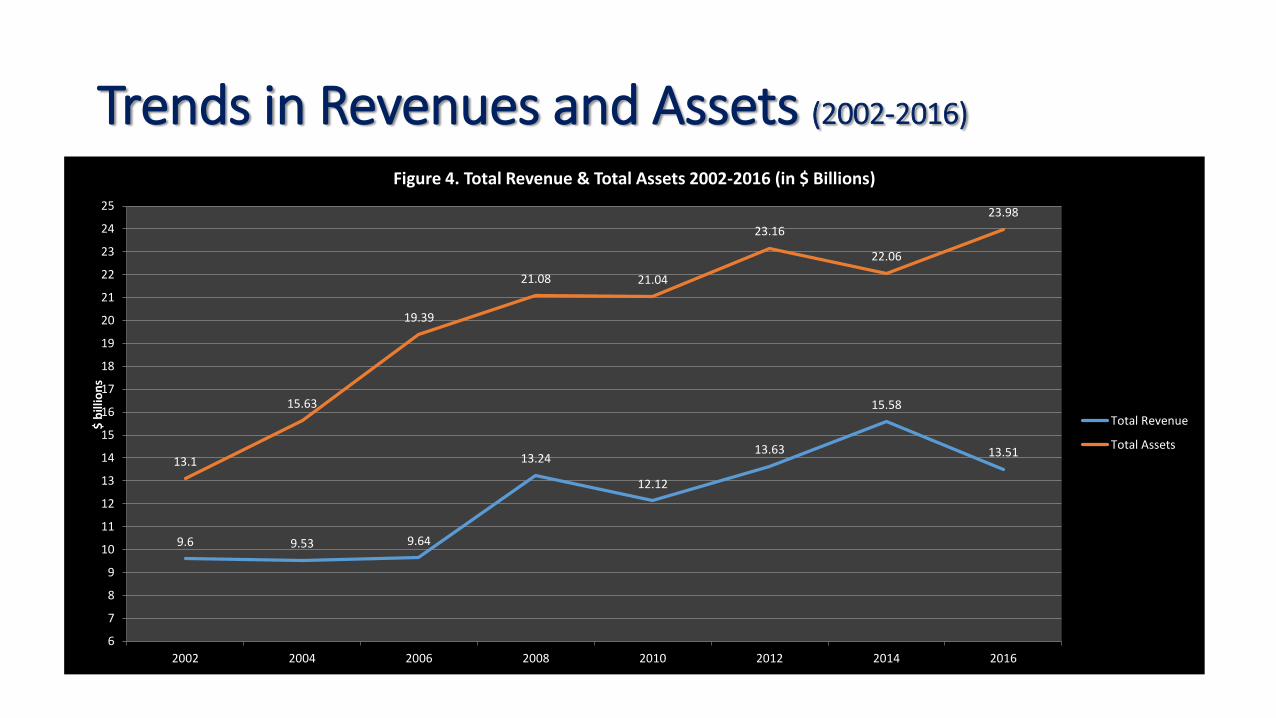
Trends in Revenues and Assets (2002-2016)
9.6 9.53 9.64
13.24
12.12
13.63
15.58
13.5113.1
15.63
19.39
21.08 21.04
23.16
22.06
23.98
6
7
8
9
10
11
12
13
14
15
16
17
18
19
20
21
22
23
24
25
2002 2004 2006 2008 2010 2012 2014 2016
$ b
illio
ns
Figure 4. Total Revenue & Total Assets 2002-2016 (in $ Billions)
Total Revenue
Total Assets
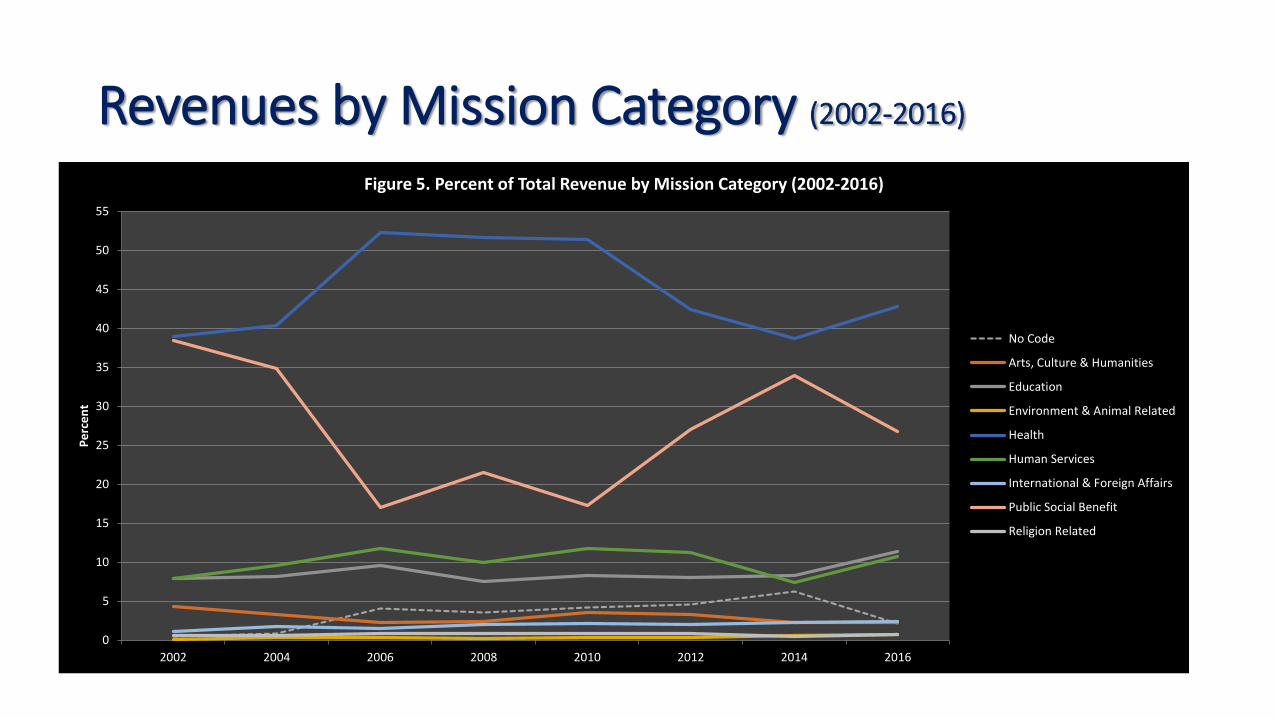
Revenues by Mission Category (2002-2016)
0
5
10
15
20
25
30
35
40
45
50
55
2002 2004 2006 2008 2010 2012 2014 2016
Pe
rce
nt
Figure 5. Percent of Total Revenue by Mission Category (2002-2016)
No Code
Arts, Culture & Humanities
Education
Environment & Animal Related
Health
Human Services
International & Foreign Affairs
Public Social Benefit
Religion Related
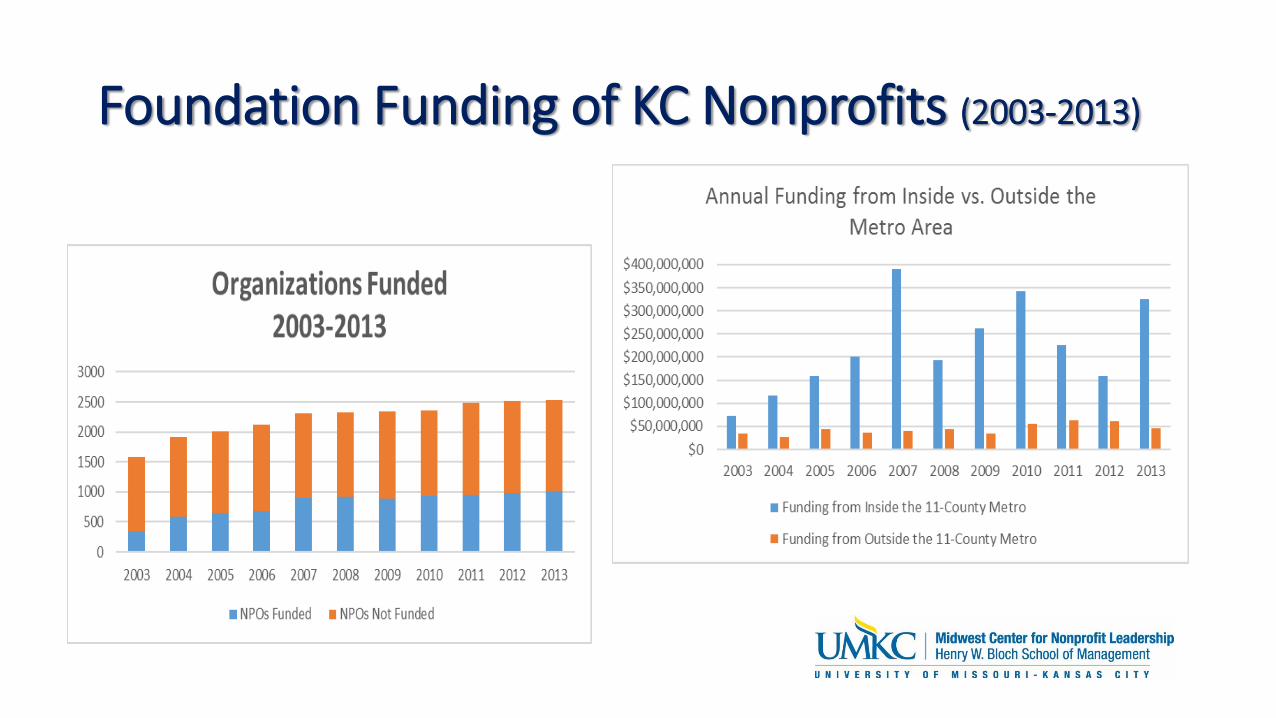
Foundation Funding of KC Nonprofits (2003-2013)
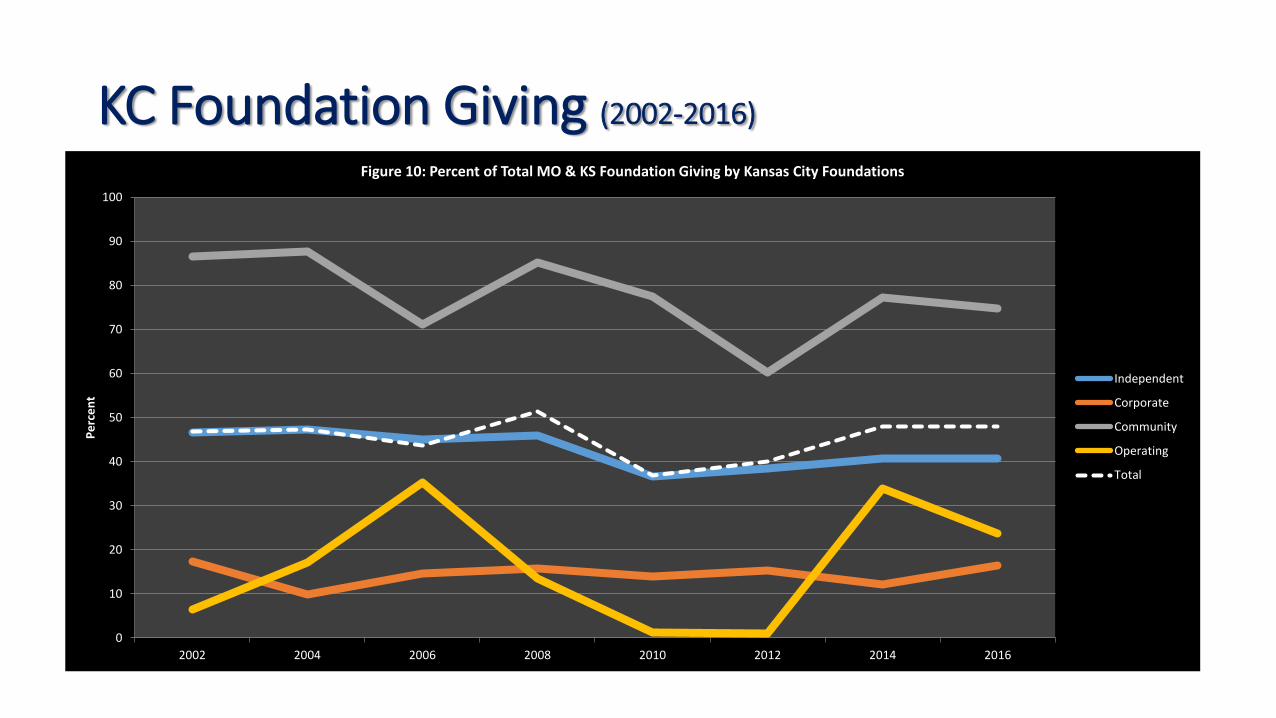
KC Foundation Giving (2002-2016)
0
10
20
30
40
50
60
70
80
90
100
2002 2004 2006 2008 2010 2012 2014 2016
Pe
rce
nt
Figure 10: Percent of Total MO & KS Foundation Giving by Kansas City Foundations
Independent
Corporate
Community
Operating
Total
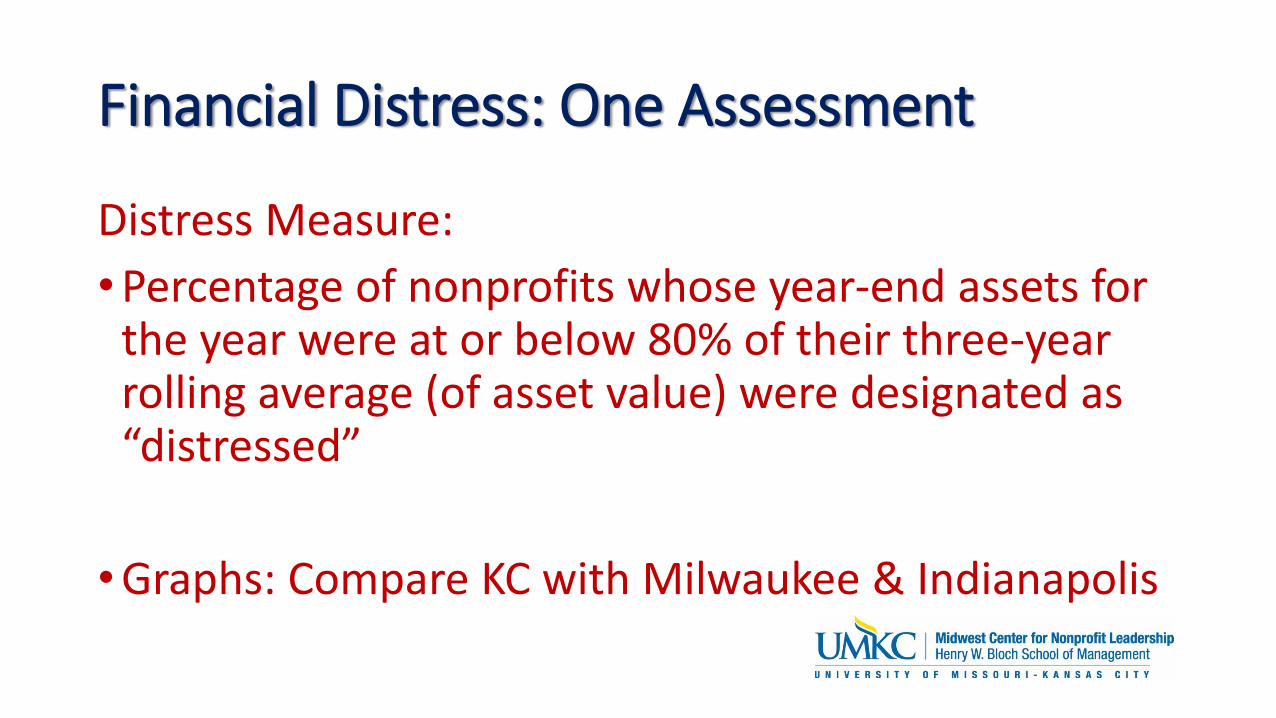
Financial Distress: One Assessment
Distress Measure:
•Percentage of nonprofits whose year-end assets for the year were at or below 80% of their three-year rolling average (of asset value) were designated as “distressed”
•Graphs: Compare KC with Milwaukee & Indianapolis
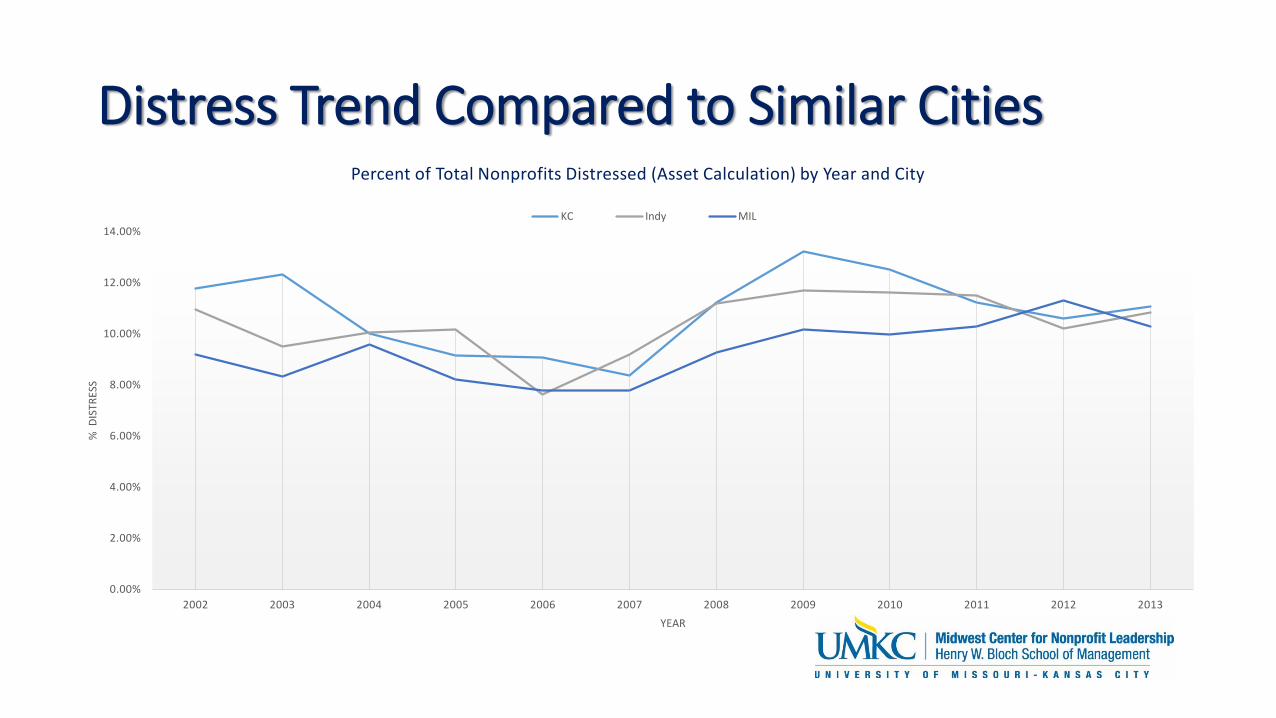
Distress Trend Compared to Similar Cities
0.00%
2.00%
4.00%
6.00%
8.00%
10.00%
12.00%
14.00%
2002 2003 2004 2005 2006 2007 2008 2009 2010 2011 2012 2013
% D
ISTR
ESS
YEAR
Percent of Total Nonprofits Distressed (Asset Calculation) by Year and City
KC Indy MIL
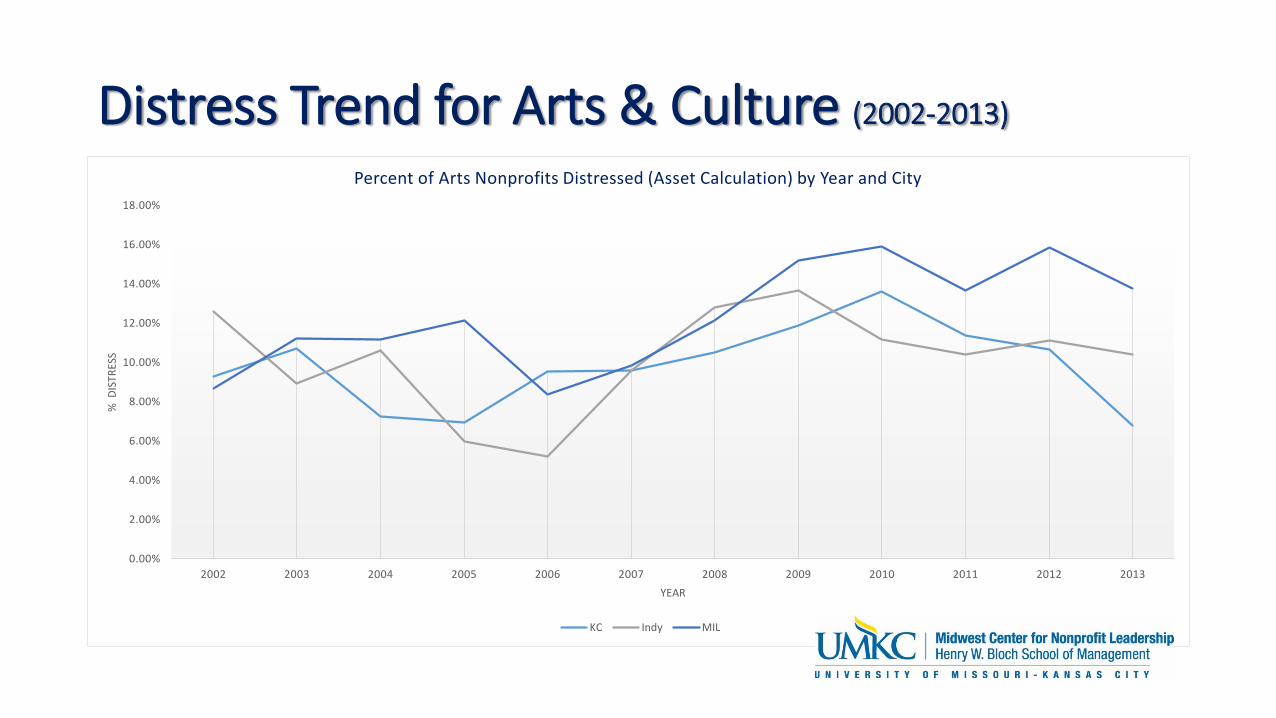
Distress Trend for Arts & Culture (2002-2013)
0.00%
2.00%
4.00%
6.00%
8.00%
10.00%
12.00%
14.00%
16.00%
18.00%
2002 2003 2004 2005 2006 2007 2008 2009 2010 2011 2012 2013
% D
ISTR
ESS
YEAR
Percent of Arts Nonprofits Distressed (Asset Calculation) by Year and City
KC Indy MIL
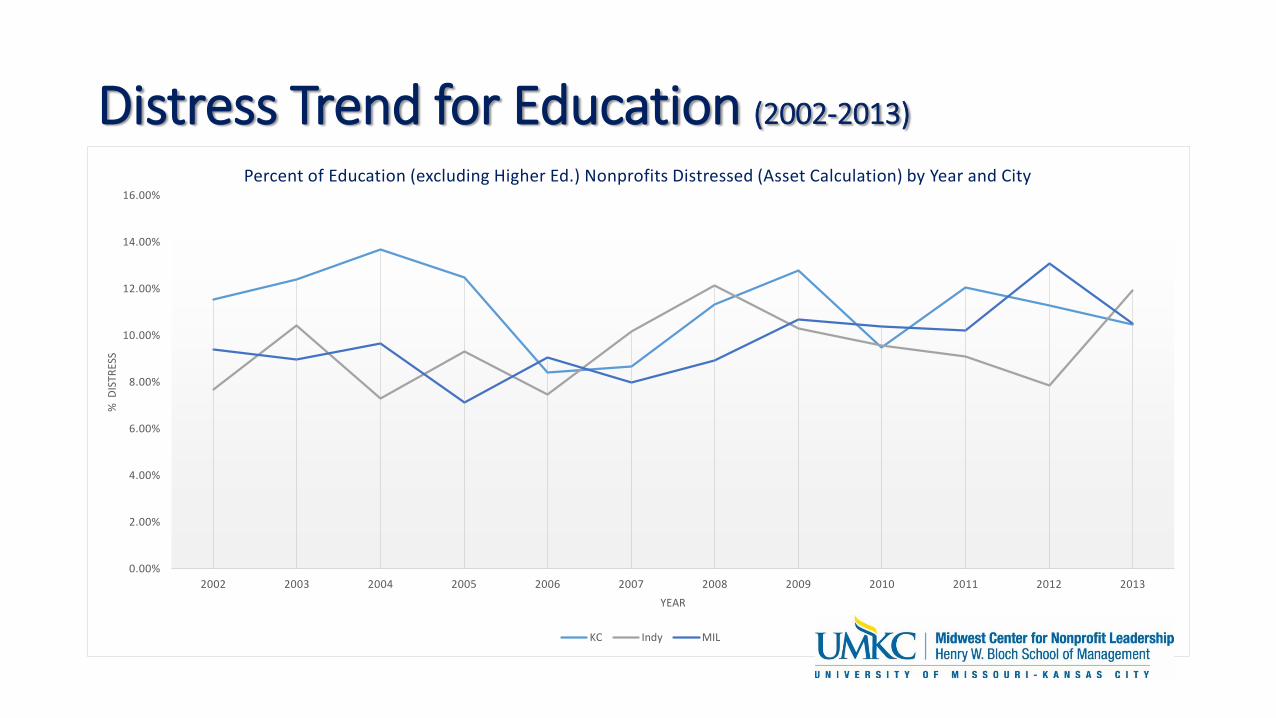
Distress Trend for Education (2002-2013)
0.00%
2.00%
4.00%
6.00%
8.00%
10.00%
12.00%
14.00%
16.00%
2002 2003 2004 2005 2006 2007 2008 2009 2010 2011 2012 2013
% D
ISTR
ESS
YEAR
Percent of Education (excluding Higher Ed.) Nonprofits Distressed (Asset Calculation) by Year and City
KC Indy MIL
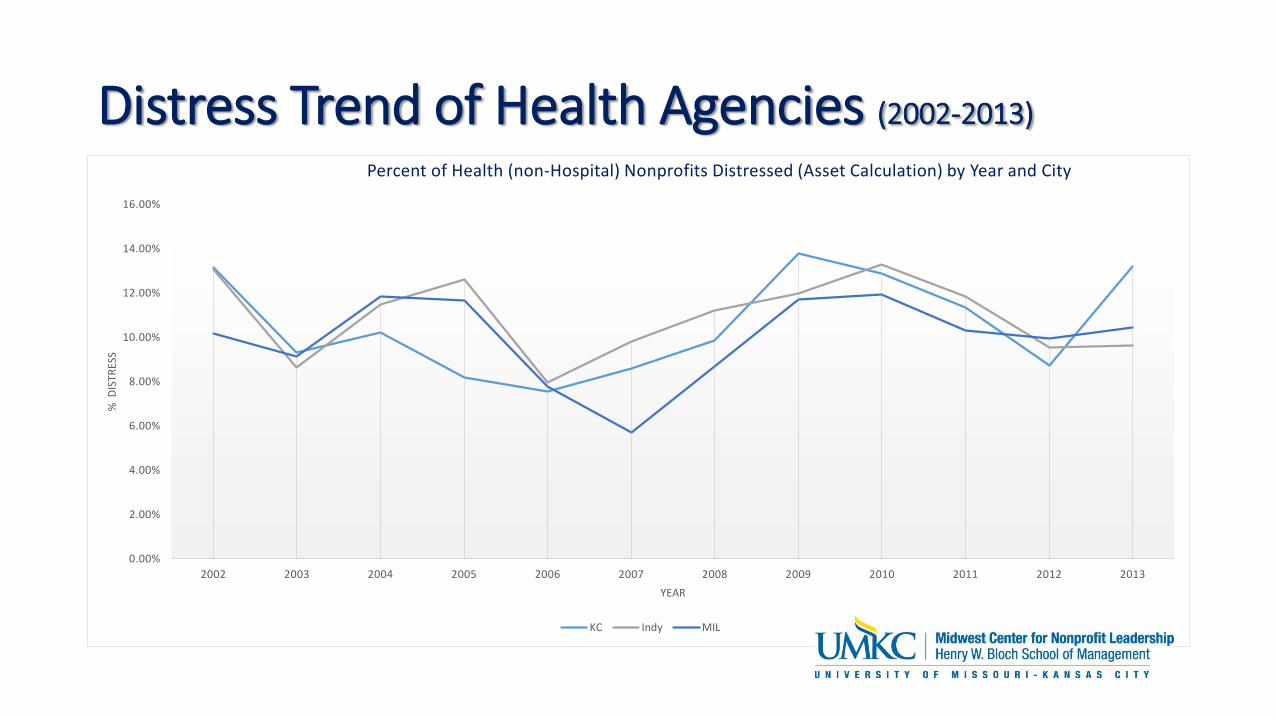
Distress Trend of Health Agencies (2002-2013)
0.00%
2.00%
4.00%
6.00%
8.00%
10.00%
12.00%
14.00%
16.00%
2002 2003 2004 2005 2006 2007 2008 2009 2010 2011 2012 2013
% D
ISTR
ESS
YEAR
Percent of Health (non-Hospital) Nonprofits Distressed (Asset Calculation) by Year and City
KC Indy MIL
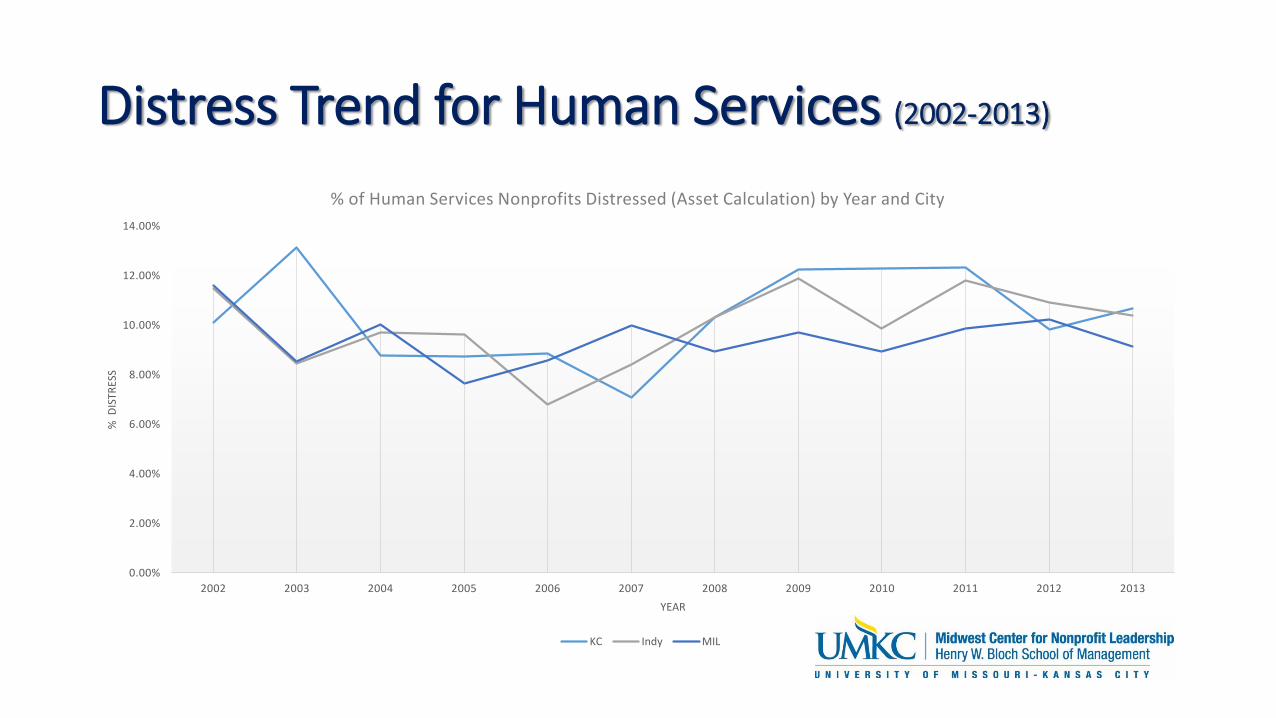
Distress Trend for Human Services (2002-2013)
0.00%
2.00%
4.00%
6.00%
8.00%
10.00%
12.00%
14.00%
2002 2003 2004 2005 2006 2007 2008 2009 2010 2011 2012 2013
% D
ISTR
ESS
YEAR
% of Human Services Nonprofits Distressed (Asset Calculation) by Year and City
KC Indy MIL
What Did We Learn From
Our Listening Sessions?
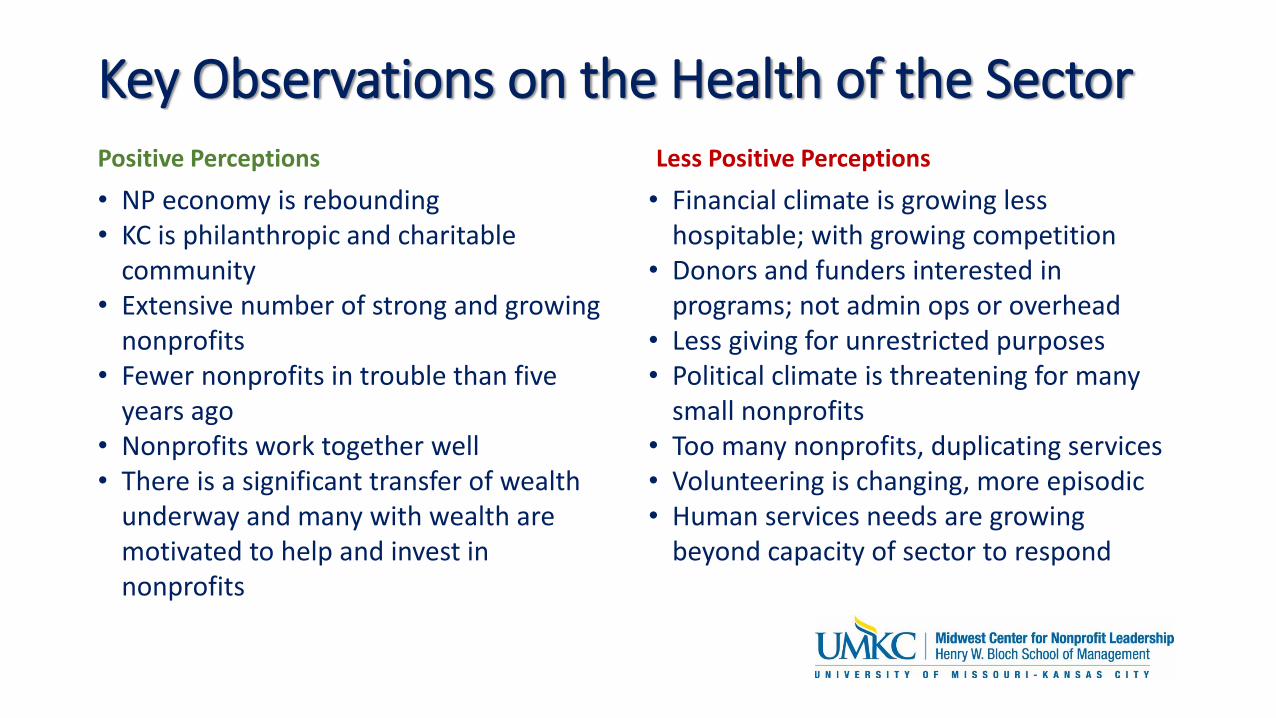
Key Observations on the Health of the SectorPositive Perceptions
• NP economy is rebounding• KC is philanthropic and charitable
community• Extensive number of strong and growing
nonprofits• Fewer nonprofits in trouble than five
years ago• Nonprofits work together well• There is a significant transfer of wealth
underway and many with wealth are motivated to help and invest in nonprofits
Less Positive Perceptions
• Financial climate is growing less hospitable; with growing competition
• Donors and funders interested in programs; not admin ops or overhead
• Less giving for unrestricted purposes• Political climate is threatening for many
small nonprofits• Too many nonprofits, duplicating services• Volunteering is changing, more episodic• Human services needs are growing
beyond capacity of sector to respond
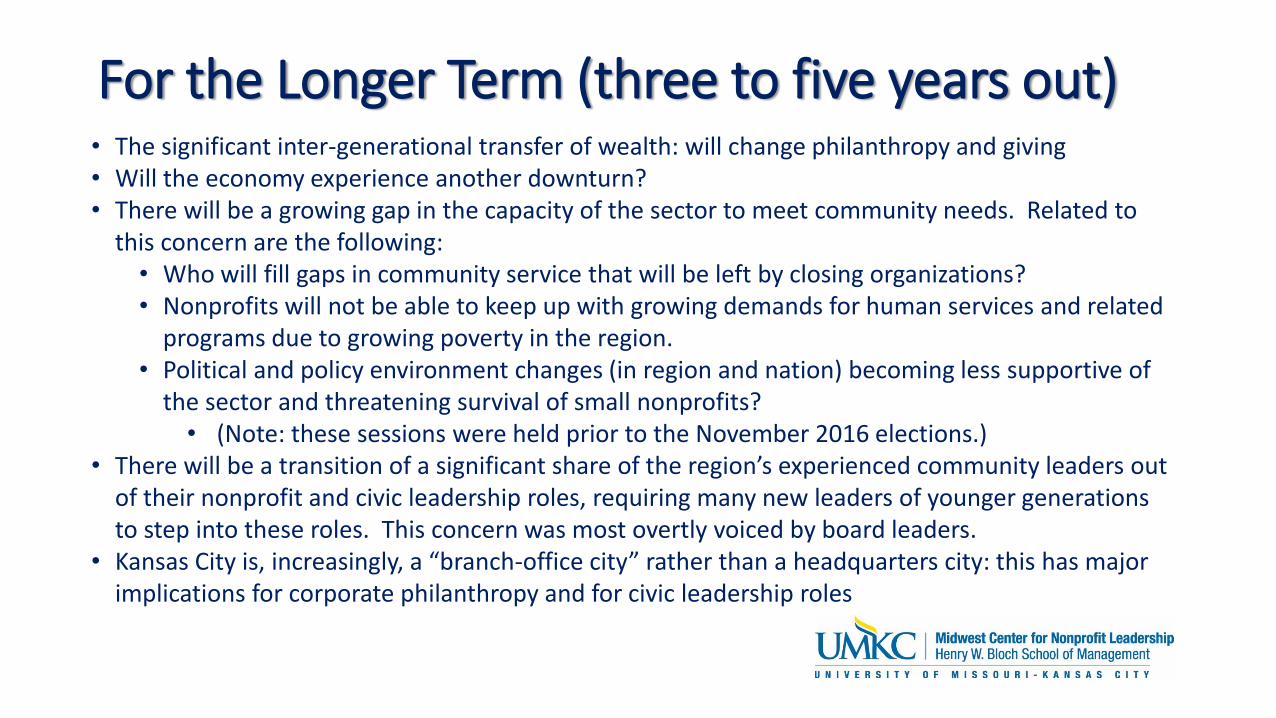
For the Longer Term (three to five years out)• The significant inter-generational transfer of wealth: will change philanthropy and giving• Will the economy experience another downturn? • There will be a growing gap in the capacity of the sector to meet community needs. Related to
this concern are the following:• Who will fill gaps in community service that will be left by closing organizations?• Nonprofits will not be able to keep up with growing demands for human services and related
programs due to growing poverty in the region.• Political and policy environment changes (in region and nation) becoming less supportive of
the sector and threatening survival of small nonprofits? • (Note: these sessions were held prior to the November 2016 elections.)
• There will be a transition of a significant share of the region’s experienced community leaders out of their nonprofit and civic leadership roles, requiring many new leaders of younger generations to step into these roles. This concern was most overtly voiced by board leaders.
• Kansas City is, increasingly, a “branch-office city” rather than a headquarters city: this has major implications for corporate philanthropy and for civic leadership roles
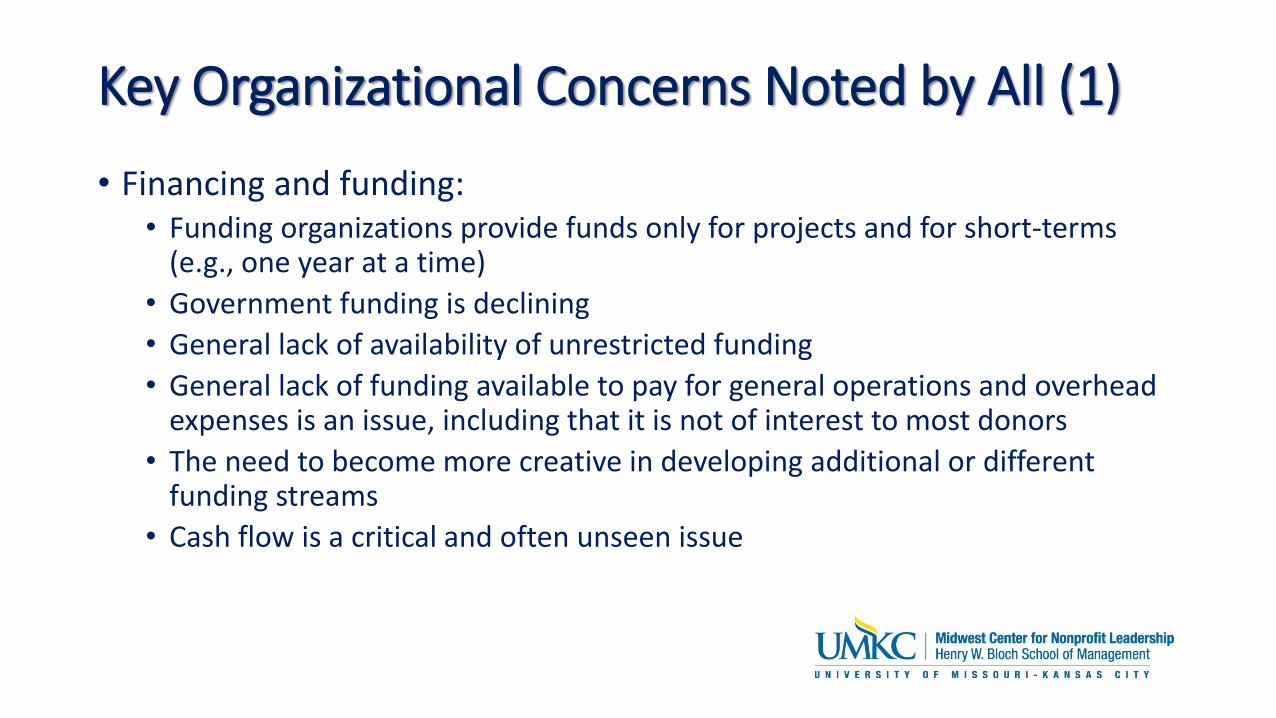
Key Organizational Concerns Noted by All (1)
• Financing and funding:• Funding organizations provide funds only for projects and for short-terms
(e.g., one year at a time)
• Government funding is declining
• General lack of availability of unrestricted funding
• General lack of funding available to pay for general operations and overhead expenses is an issue, including that it is not of interest to most donors
• The need to become more creative in developing additional or different funding streams
• Cash flow is a critical and often unseen issue
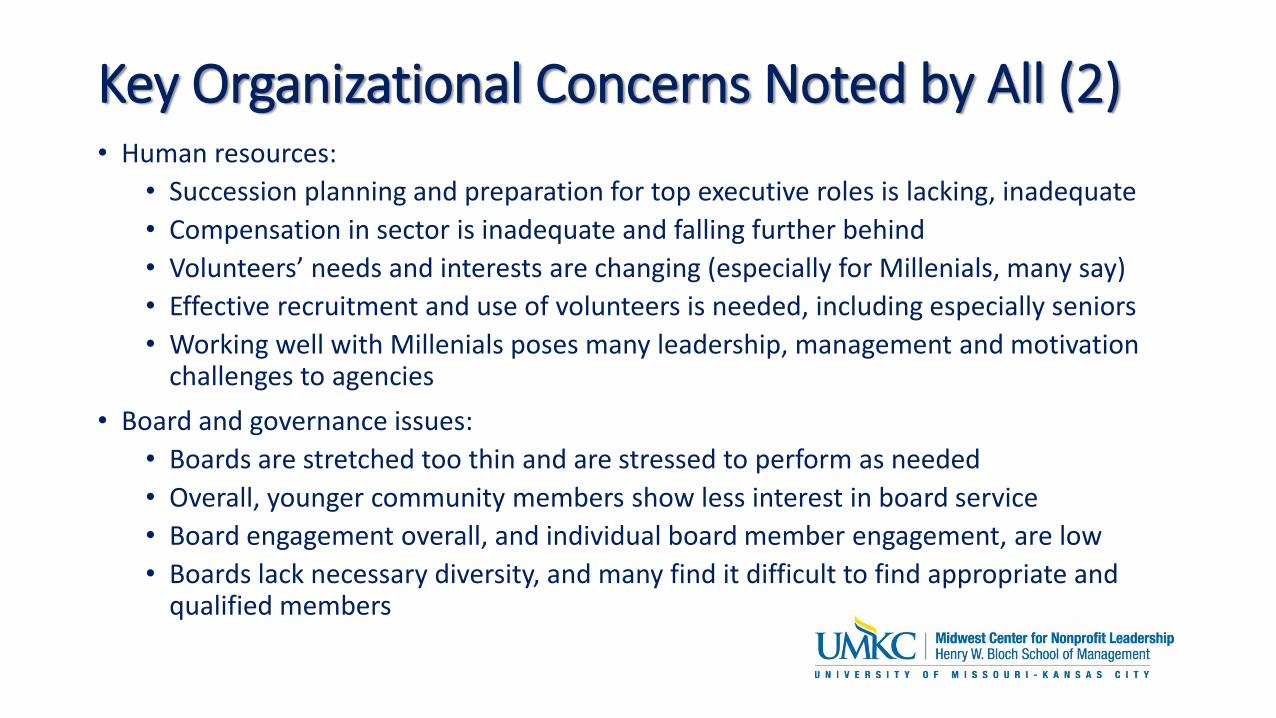
Key Organizational Concerns Noted by All (2)• Human resources:
• Succession planning and preparation for top executive roles is lacking, inadequate
• Compensation in sector is inadequate and falling further behind
• Volunteers’ needs and interests are changing (especially for Millenials, many say)
• Effective recruitment and use of volunteers is needed, including especially seniors
• Working well with Millenials poses many leadership, management and motivation challenges to agencies
• Board and governance issues:
• Boards are stretched too thin and are stressed to perform as needed
• Overall, younger community members show less interest in board service
• Board engagement overall, and individual board member engagement, are low
• Boards lack necessary diversity, and many find it difficult to find appropriate and qualified members
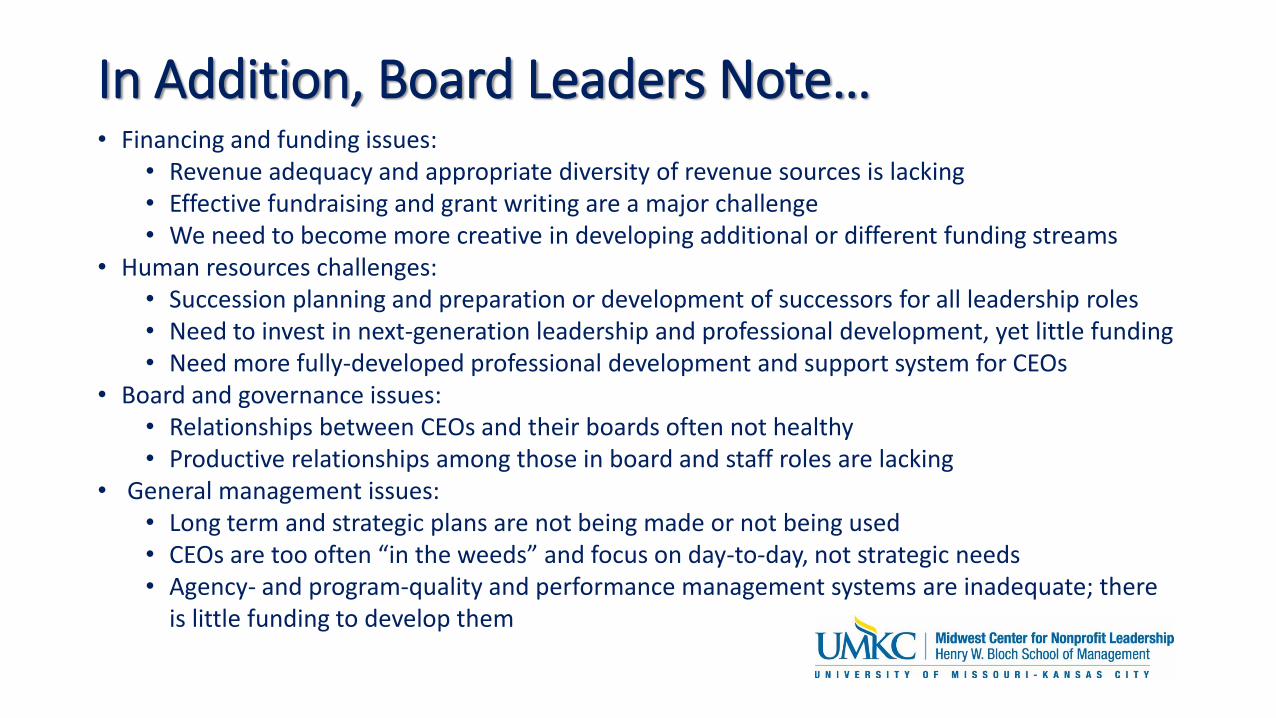
In Addition, Board Leaders Note…• Financing and funding issues:
• Revenue adequacy and appropriate diversity of revenue sources is lacking• Effective fundraising and grant writing are a major challenge• We need to become more creative in developing additional or different funding streams
• Human resources challenges:• Succession planning and preparation or development of successors for all leadership roles• Need to invest in next-generation leadership and professional development, yet little funding• Need more fully-developed professional development and support system for CEOs
• Board and governance issues:• Relationships between CEOs and their boards often not healthy• Productive relationships among those in board and staff roles are lacking
• General management issues:• Long term and strategic plans are not being made or not being used• CEOs are too often “in the weeds” and focus on day-to-day, not strategic needs • Agency- and program-quality and performance management systems are inadequate; there
is little funding to develop them
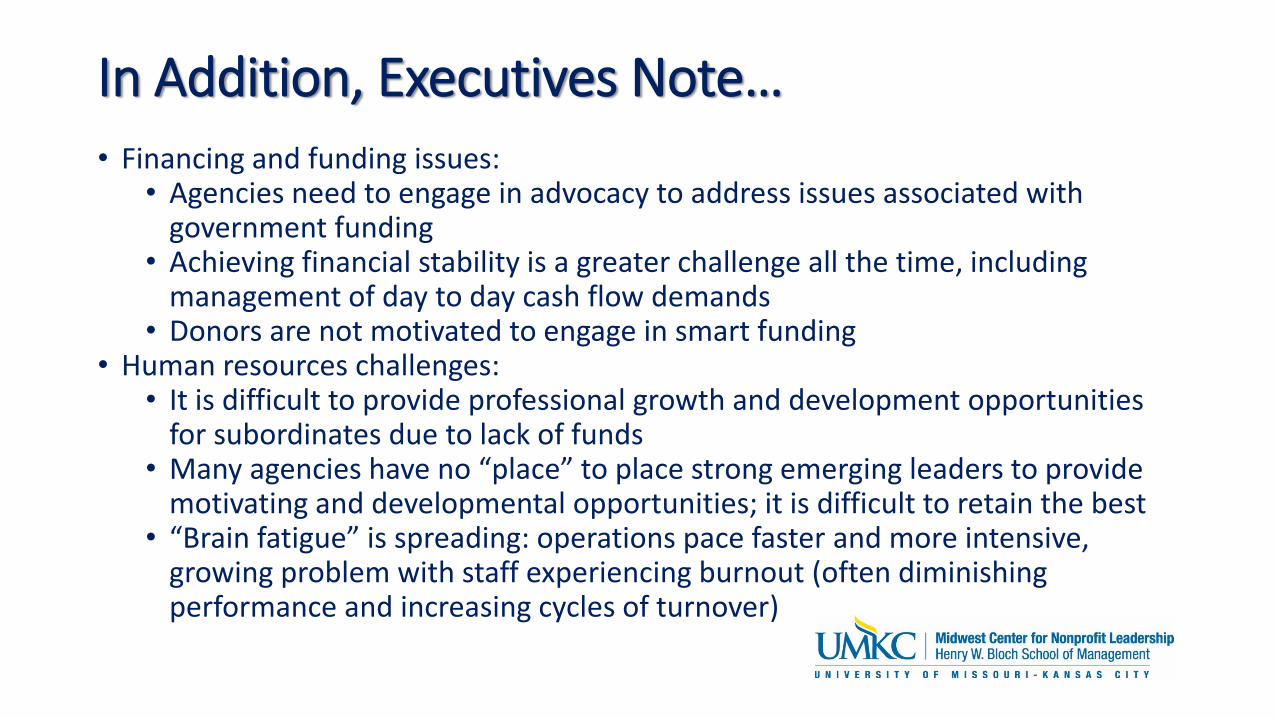
In Addition, Executives Note…• Financing and funding issues:
• Agencies need to engage in advocacy to address issues associated with government funding
• Achieving financial stability is a greater challenge all the time, including management of day to day cash flow demands
• Donors are not motivated to engage in smart funding• Human resources challenges:
• It is difficult to provide professional growth and development opportunities for subordinates due to lack of funds
• Many agencies have no “place” to place strong emerging leaders to provide motivating and developmental opportunities; it is difficult to retain the best
• “Brain fatigue” is spreading: operations pace faster and more intensive, growing problem with staff experiencing burnout (often diminishing performance and increasing cycles of turnover)
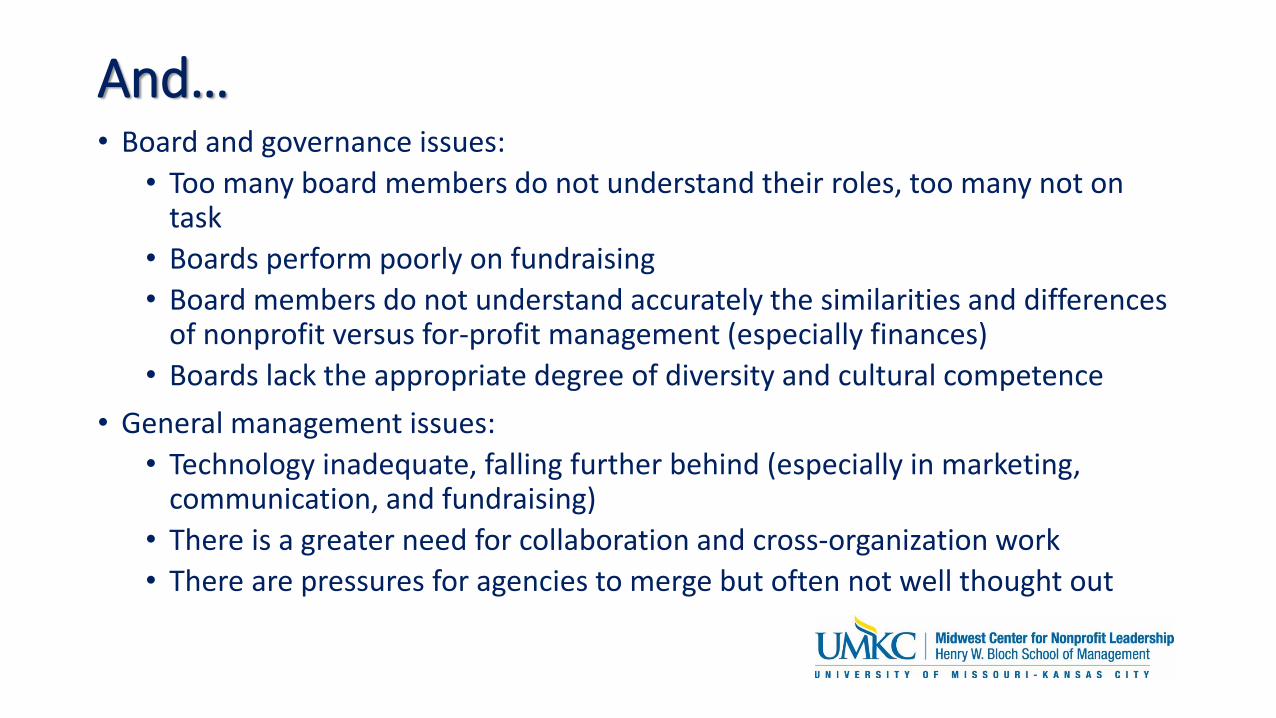
And…• Board and governance issues:
• Too many board members do not understand their roles, too many not on task
• Boards perform poorly on fundraising
• Board members do not understand accurately the similarities and differences of nonprofit versus for-profit management (especially finances)
• Boards lack the appropriate degree of diversity and cultural competence
• General management issues:
• Technology inadequate, falling further behind (especially in marketing, communication, and fundraising)
• There is a greater need for collaboration and cross-organization work
• There are pressures for agencies to merge but often not well thought out
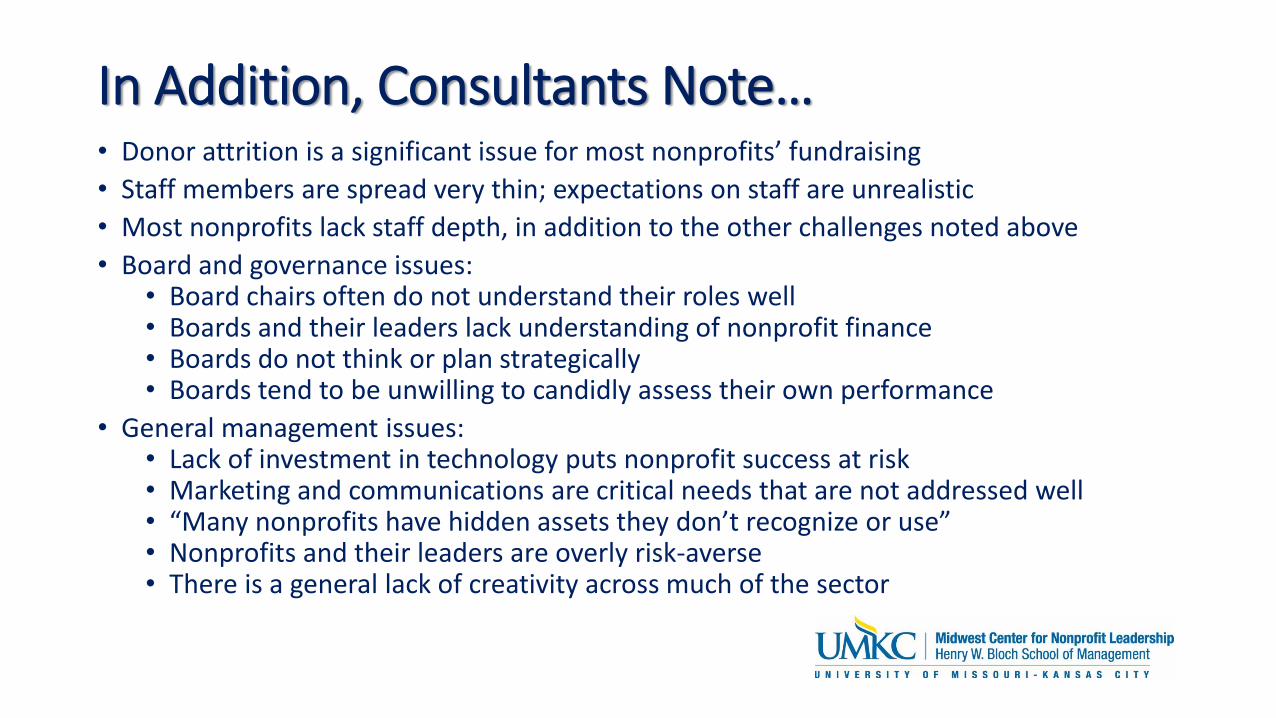
In Addition, Consultants Note…• Donor attrition is a significant issue for most nonprofits’ fundraising
• Staff members are spread very thin; expectations on staff are unrealistic
• Most nonprofits lack staff depth, in addition to the other challenges noted above
• Board and governance issues:• Board chairs often do not understand their roles well• Boards and their leaders lack understanding of nonprofit finance• Boards do not think or plan strategically• Boards tend to be unwilling to candidly assess their own performance
• General management issues:• Lack of investment in technology puts nonprofit success at risk• Marketing and communications are critical needs that are not addressed well• “Many nonprofits have hidden assets they don’t recognize or use”• Nonprofits and their leaders are overly risk-averse• There is a general lack of creativity across much of the sector
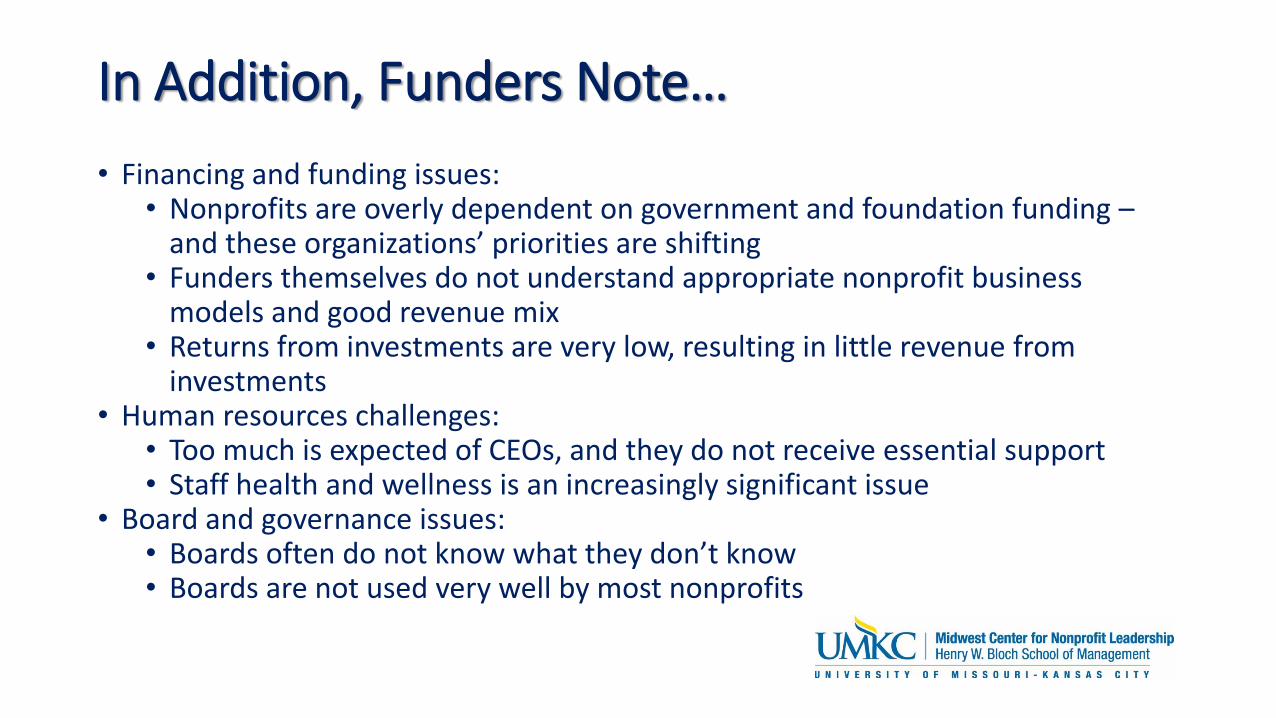
In Addition, Funders Note…
• Financing and funding issues:• Nonprofits are overly dependent on government and foundation funding –
and these organizations’ priorities are shifting• Funders themselves do not understand appropriate nonprofit business
models and good revenue mix• Returns from investments are very low, resulting in little revenue from
investments• Human resources challenges:
• Too much is expected of CEOs, and they do not receive essential support• Staff health and wellness is an increasingly significant issue
• Board and governance issues:• Boards often do not know what they don’t know• Boards are not used very well by most nonprofits
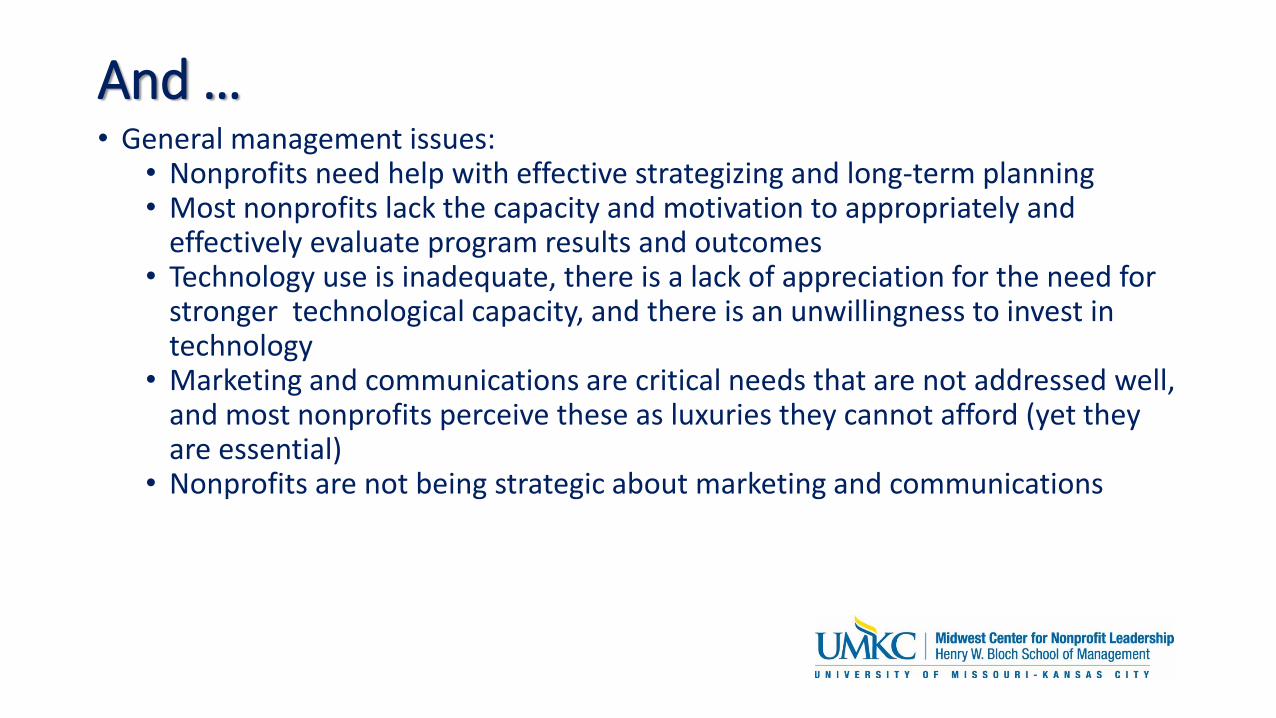
And … • General management issues:
• Nonprofits need help with effective strategizing and long-term planning• Most nonprofits lack the capacity and motivation to appropriately and
effectively evaluate program results and outcomes• Technology use is inadequate, there is a lack of appreciation for the need for
stronger technological capacity, and there is an unwillingness to invest in technology
• Marketing and communications are critical needs that are not addressed well, and most nonprofits perceive these as luxuries they cannot afford (yet they are essential)
• Nonprofits are not being strategic about marketing and communications
Contact Information
Midwest Center for Nonprofit LeadershipHenry W. Bloch School of Management
University of Missouri – Kansas CityKansas City, Missouri 64110
• Phone: 816-235-2305 (800-474-1170)• E-mail: [email protected]• E-mail: [email protected]• On the web: www.mcnl.org