Embed Size (px)
Citation preview
I N S I G H T S2 0 1 8 I S S U E T H R E E
The Internet of Things Connect the dots
Australian EquitiesOil sees strong support

Disclosure: Regulatory Disclosure: Ord Minnett is the trading brand of Ord Minnett Limited ABN 86 002 733 048, holder of AFS Licence Number 237121, and ASX Market Participants of ASX and Chi-X. Ord Minnett Limited and/or its associated entities, directors and/or its employees may have a material interest in, and may earn brokerage from, any securities referred to in this document. This document is not available for distribution outside Australia, New Zealand and Hong Kong and may not be passed on to any third party or person without the prior written consent of Ord Minnett Limited. Further, Ord Minnett and/or its affiliated companies may have acted as manager or co-manager of a public offering of any such securities in the past three years. Ord Minnett and/or its affiliated companies may provide or may have provided corporate finance to the companies referred to in the report. Ord Minnett and associated persons (including persons from whom information in this report is sourced) may do business or seek to do business with companies covered in its research reports. As a result, investors should be aware that the firm or other such persons may have a conflict of interest that could affect the objectivity of this report. Investors should consider this report as only a single factor in making their investment decision.
International investment products are susceptible to investment, market, liquidity, regulatory and operational risk in the same manner as domestic products. International products are also susceptible to country risk and currency risk. Country risk consists of the regulatory, economic, political and custodial risks particular to the country in which you are considering investing. Products traded on such a foreign market may be susceptible to high volatility and there are no assurances that there will be a liquid market for your investments. Foreign settlement procedures and trade regulations may also involve certain risks such as delay in payment or delivery of securities. Some of these risks are explained in more detail in documents available from your advisers.
This document is current as at the date of the issue but may be superseded by future publications. You can confirm the currency of this document by checking Ord Minnett’s internet site.
Disclaimer: Ord Minnett Limited believes that the information contained in this document has been obtained from sources that are accurate, but has not checked or verified this information. Except to the extent that liability cannot be excluded, Ord Minnett Limited and its associated entities accept no liability for any loss or damage caused by any error in, or omission from, this document. This document is intended to provide general securities advice only, and has been prepared without taking account of your objectives, financial situation or needs, and therefore before acting on advice contained in this document, you should consider its appropriateness having regard to your objectives, financial situation and needs. If any advice in this document relates to the acquisition or possible acquisition of a particular financial product, you should obtain a copy of and consider the Product Disclosure Statement for that product before making any decision. Investments can go up and down. Past performance is not necessarily indicative of future performance.
Analyst Certification: The analyst certifies that: (1) all of the views expressed in this research accurately reflect their personal views about any and all of the subject securities or issuers; (2) no part of their compensation was, is, or will be directly or indirectly related to the specific recommendations or views expressed herein.
Ord Minnett Hong Kong: This document is issued in Hong Kong by Ord Minnett Hong Kong Limited, CR Number 1792608, which is licensed by the Securities and Futures Commission (CE number BAI183) for Dealing in Securities (Type 1 Regulated Activity) and Advising on Securities (Type 4 Regulated Activity) in Hong Kong. Ord Minnett Hong Kong Limited believes that the information contained in this document has been obtained from sources that are accurate, but has not checked or verified this information. Except to the extent that liability cannot be excluded, Ord Minnett Hong Kong Limited and its associated entities accept no liability for any loss or damage caused by any error in, or omission from, this document. This document is directed at Professional Investors (as defined under the Securities and Futures Ordinance of Hong Kong) and is not intended for, and should not be used by, persons who are not Professional Investors. This document is provided for information purposes only and does not constitute an offer to sell (or solicitation of an offer to purchase) the securities mentioned or to participate in any particular trading strategy. The investments described have not been, and will not be, authorized by the Hong Kong Securities and Futures Commission.
For summary information about the qualifications and experience of the Ord Minnett Limited research service, please visit http://www.ords.com.au/our-team-2/
For information regarding Ord Minnett Research’s coverage criteria, methodology and spread of ratings, please visit http://www.ords.com.au/methodology/
For information regarding any potential conflicts of interest and analyst holdings, please visit http://www.ords.com.au/methodology/
This report has been authorised for distribution by Simon Kent-Jones, Head of Private Client Research at Ord Minnett Limited.
Unless otherwise stated, all share prices, information and research as at Friday, 21 September 2018.
Profits and earnings per share are on a normalized basis, except where indicated.
Publisher: Ord Minnett Limited Editor: Simon Kent-Jones Contributors: Athena Kospetas, Sze Chuah Senior Designers: Felicity Everest, Sarah-Jane Edis

ords.com.au 1
2 The Internet of Things Connect the dots
6 Asset Allocation
8 Australian Equities Strategy Oil sees strong support
10 Leading Lights – Preferred Stocks
12 Investment Fundamentals
14 Interest-rate Securities
16 International Stocks
18 Currency
20 Primary Forecasts
1612
CO
NT
EN
TS

2 Ords Insights | 2018 ISSUE THREE
THE INTERNETOF THINGSConnect the dots
Imagine a slightly overweight, middle-aged man, suffering from chronic heart failure, compounded by high blood pressure and type 2 diabetes. As a result, he’s prescribed a trio of drugs: diuretic, ACE inhibitor and beta blocker. He also strives to follow his doctor’s diet and exercise recommendations, while his family tries to support his efforts.

Over the holidays, he relaxes his regime during family meals and social gatherings. He feels a little more bloated but thinks little of it. A month before his next scheduled check-up, he collapses with acute heart failure. He is hospitalised for a week at a significant cost to the health care system, and then requires a short rehabilitation stay. This also takes a great toll on his and his family’s mental state.
Now imagine in the future, the patient has four devices, at a total cost of around $250: a connected weight scale, a blood pressure cuff, a smart pillbox, and a wristband tracking his heart rate and blood oxygen level.
These devices quickly detect a change in his condition: he becomes fatigued more quickly during his daily walks, and he has been skipping some of his medication over the holiday season.
The scale also picks up that he has gained two kilograms in just a few days – a sign of increased fluid retention that should prompt an immediate call to his physician and perhaps an increased dosage of his diuretic. His doctor receives an alert with all this information and schedules an immediate appointment with the patient. He reminds the patient how important it is to maintain the diuretic.
In a visit the following week, the doctor sees that the patient’s weight has dropped and he breathes more easily during normal activities. The doctor reminds the patient that he needs to follow a careful diet and take his medications faithfully, even during holidays.
This story, adapted from a study by McKinsey & Co, a management consultancy, is an everyday example of the benefits that will come from the development of the Internet of Things.
The phrase was coined by British technology pioneer Kevin Ashton. This concept can be defined as a network of physical objects – appliances, machines, vehicles and other items – that are embedded with electronics, sensors and software, which connect and exchange data over the internet.
Any physical object can be transformed into an Internet of Things device, if it can be connected to the internet and controlled that way. Networking giant Cisco predicts that the opportunity represented by the Internet of Things will exceed US$14 trillion for companies and industries globally in the next decade. Put another way, this represents an opportunity to increase global corporate profits by about 21%.
INV
ES
TM
EN
T S
TR
AT
EG
Y
ords.com.au 3

4 Ords Insights | 2018 ISSUE THREE
OutsideLogistics and navigation
HumanHealth and
fitness
WorksitesOperations optimisation/
health and safety
Retail environmentsAutomated checkout
FactoriesOperations and
equipment optimisation
HomeChore automation
and securityVehiclesAutonomous vehicles and
condition-based maintenance
OfficesSecurity and
energy
CitiesPublic health
and transportation
Internet of Things
A host of technologies combineThe Internet of Things depends on a host of technologies – application programming interfaces, radio-frequency identification tags (RFID), cloud-based platforms and architecture to connect devices to the internet. They help individuals and companies manage device connectivity security, as well as collecting data, and build and run applications.
Smart devices generate a massive amount of data that needs to be analysed in real time using data management tools, including predictive and data analytical tools. Machine learning and artificial intelligence are also used to add context to data, and trigger actions without human intervention.
Endless applicationsAs Figure 1 illustrates, the ability to electronically monitor and control things in the physical world has inspired a surge of innovation, and unlocks endless possibilities across a range of industries and applications.
In manufacturing, for example, these technologies completely transform the way products are made. They drive industrial automation, remote monitoring helps predict and prevent equipment failures and – perhaps most importantly – they improve worker safety.
Intelligent transportation systems help move people and cargo all over the world. Thousands of sensors are
used on planes, trains, ships and vehicles to optimise safety, engine performance, and logistics and supply chain management. For example, General Electric’s GEnX jet engine, which powers the Boeing 787 Dreamliner, generates its own service newsfeeds, thereby cutting maintenance time, shortening aircraft turnaround time and boosting performance over time.
Car manufacturers and technology companies are using the Internet of Things to help drivers in connected cars (or smart cars) avoid accidents, predict maintenance issues, find parking spots, and more. The technology is also bringing self-driving cars to the market.
Figure 1: The Internet of Things has a wide range of applications
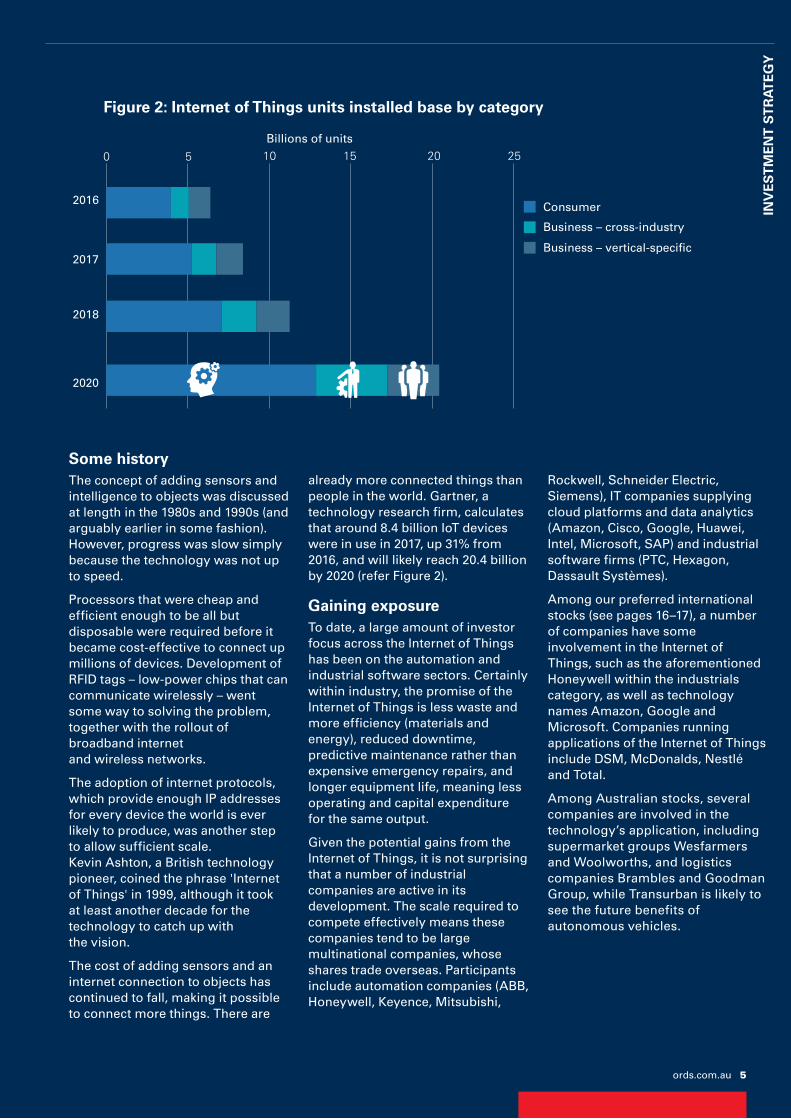
Some historyThe concept of adding sensors and intelligence to objects was discussed at length in the 1980s and 1990s (and arguably earlier in some fashion). However, progress was slow simply because the technology was not up to speed.
Processors that were cheap and efficient enough to be all but disposable were required before it became cost-effective to connect up millions of devices. Development of RFID tags – low-power chips that can communicate wirelessly – went some way to solving the problem, together with the rollout of broadband internet and wireless networks.
The adoption of internet protocols, which provide enough IP addresses for every device the world is ever likely to produce, was another step to allow sufficient scale. Kevin Ashton, a British technology pioneer, coined the phrase 'Internet of Things' in 1999, although it took at least another decade for the technology to catch up with the vision.
The cost of adding sensors and an internet connection to objects has continued to fall, making it possible to connect more things. There are
already more connected things than people in the world. Gartner, a technology research firm, calculates that around 8.4 billion IoT devices were in use in 2017, up 31% from 2016, and will likely reach 20.4 billion by 2020 (refer Figure 2).
Gaining exposureTo date, a large amount of investor focus across the Internet of Things has been on the automation and industrial software sectors. Certainly within industry, the promise of the Internet of Things is less waste and more efficiency (materials and energy), reduced downtime, predictive maintenance rather than expensive emergency repairs, and longer equipment life, meaning less operating and capital expenditure for the same output.
Given the potential gains from the Internet of Things, it is not surprising that a number of industrial companies are active in its development. The scale required to compete effectively means these companies tend to be large multinational companies, whose shares trade overseas. Participants include automation companies (ABB, Honeywell, Keyence, Mitsubishi,
Rockwell, Schneider Electric, Siemens), IT companies supplying cloud platforms and data analytics (Amazon, Cisco, Google, Huawei, Intel, Microsoft, SAP) and industrial software firms (PTC, Hexagon, Dassault Systèmes).
Among our preferred international stocks (see pages 16–17), a number of companies have some involvement in the Internet of Things, such as the aforementioned Honeywell within the industrials category, as well as technology names Amazon, Google and Microsoft. Companies running applications of the Internet of Things include DSM, McDonalds, Nestlé and Total.
Among Australian stocks, several companies are involved in the technology’s application, including supermarket groups Wesfarmers and Woolworths, and logistics companies Brambles and Goodman Group, while Transurban is likely to see the future benefits of autonomous vehicles.
0 5 10 15 20 25
2016
Billions of units
Consumer
Business – cross-industry
Business – vertical-specific
2018
2020
2017
Figure 2: Internet of Things units installed base by category
INV
ES
TM
EN
T S
TR
AT
EG
Y
ords.com.au 5

6 Ords Insights | 2018 ISSUE THREE
ASSETALLOCATION
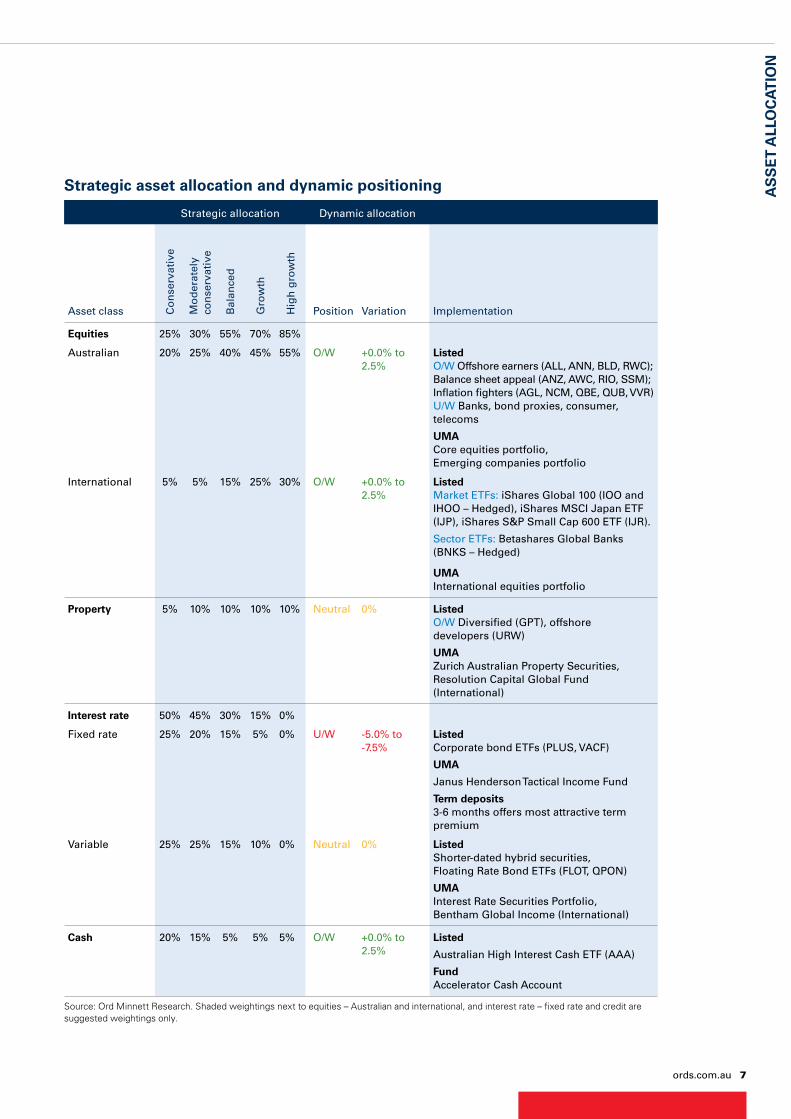
Source: Ord Minnett Research.
CashInterest ratePropertyEquities
Strategic allocation
Dynamic allocation
55%
10%
30%
5%
60%
10%
22.5%
7.5%
Dynamic allocation
70%
10%
15%
5%
75%
10%
7.5%
7.5%
Strategic allocation
Risks to our outlook � Geopolitics and
trade conflict
� Greater volatility
� Higher inflation
� Positive correlations between bonds and equities
OutlookAn escalation in the US–China trade conflict continues to pressure emerging market assets, while USD assets, including equities, continue to run (albeit narrowly concentrated in technology and healthcare). We are wary of the divergence this creates in valuation terms, but would like to see clear evidence of the conflict cooling before making a tactical shift into emerging market assets. The US mid-term election in November is a possible timing point. All other tactical positions remain in place, including an overweight position in cash to help absorb near-term volatility.
Asset classDynamic positioning Comments
Equities Domestic and international remain attractive.
Australian O/W Retain Australian equities overweight range of 0.0% to +2.5%. Maintain existing preferences: global over local, balance sheet appeal and inflation beneficiaries. Underweight banks, bond proxies, consumer and telecoms.
International O/W International equities overweight range of 0.0% to +2.5% Regionally, hold Japanese exposure given the BoJ’s more accommodative stance and domestic-focused US small caps as a shelter from trade tensions.
Property Neutral Retain neutral on property trusts. Sector is trading close to fair value after recovering from a bond sell-off. We prefer developers with growth options and diversified trusts.
Interest rate Favour variable over fixed rate.
Fixed rate U/W Keep fixed rate underweight between -5.0% to -7.5%. Minimise duration with Fed tightening and the ECB quantitative-easing programme winding down.
Variable Neutral Stay neutral on variable. Trading margins have tightened again so lighten longer-dated securities in favour of shorter-dated, where income is attractive but there is less capital volatility.
Cash O/W Overweight cash. The RBA is likely to remain on the sidelines, but tactically we hold extra cash until market volatility subsides.
Balanced allocation Growth allocation
ords.com.au 7
AS
SE
T A
LLO
CA
TIO
N
Strategic allocation Dynamic allocation
Asset class Co
nse
rvat
ive
Mo
der
atel
y co
nse
rvat
ive
Bal
ance
d
Gro
wth
Hig
h g
row
th
Position Variation Implementation
Equities 25% 30% 55% 70% 85%
Australian 20% 25% 40% 45% 55% O/W +0.0% to 2.5%
ListedO/W Offshore earners (ALL, ANN, BLD, RWC);Balance sheet appeal (ANZ, AWC, RIO, SSM);Inflation fighters (AGL, NCM, QBE, QUB, VVR)U/W Banks, bond proxies, consumer, telecoms
UMACore equities portfolio, Emerging companies portfolio
International 5% 5% 15% 25% 30% O/W +0.0% to 2.5%
ListedMarket ETFs: iShares Global 100 (IOO and IHOO – Hedged), iShares MSCI Japan ETF (IJP), iShares S&P Small Cap 600 ETF (IJR).
Sector ETFs: Betashares Global Banks (BNKS – Hedged)
UMAInternational equities portfolio
Property 5% 10% 10% 10% 10% Neutral 0% ListedO/W Diversified (GPT), offshore developers (URW)
UMAZurich Australian Property Securities,Resolution Capital Global Fund (International)
Interest rate 50% 45% 30% 15% 0%
Fixed rate 25% 20% 15% 5% 0% U/W -5.0% to -7.5%
ListedCorporate bond ETFs (PLUS, VACF)
UMA
Janus Henderson Tactical Income Fund
Term deposits3-6 months offers most attractive term premium
Variable 25% 25% 15% 10% 0% Neutral 0% ListedShorter-dated hybrid securities,Floating Rate Bond ETFs (FLOT, QPON)
UMAInterest Rate Securities Portfolio,Bentham Global Income (International)
Cash 20% 15% 5% 5% 5% O/W +0.0% to 2.5%
Listed
Australian High Interest Cash ETF (AAA)
FundAccelerator Cash Account
Strategic asset allocation and dynamic positioning
Source: Ord Minnett Research. Shaded weightings next to equities – Australian and international, and interest rate – fixed rate and credit are suggested weightings only.
8 Ords Insights | 2018 ISSUE THREE
AUSTRALIAN EQUITIES STRATEGY
Further to last issue’s lead article on trade conflict, the US-China trade war has entered another phase. The US is imposing 10% tariffs on US$200 billion of Chinese goods, with the intention of increasing the rate to 25% in January if no trade agreement is reached. Notwithstanding the US threat of tariffs on an additional US$267 billion of Chinese imports if there were any retaliation, China responded with 5–10% levies on US$60 billion of US goods and hinted at non-tariff measures to disrupt supply chains.
Admittedly, the tariff announcement was softer than forecast (staging from 10% to 25% rather than the US making good on its full threat immediately),
which provided some relief for China-facing stocks, including Australian resource stocks.
A move to another phase isn’t our base case, but the risks are growing. It’s certainly feasible that this conflict will endure at least as long as Donald Trump remains president – the conflict seems ideologically rooted in a desire to 'right-size' China, and there is no regular forum to arbitrate either reasonable or unreasonable claims.
The question is 'then' whether markets have already priced in this information and can absorb escalation. From our perspective, more cyclical exposures such as BHP Billiton and Rio Tinto offer value,
Oil sees strong support
ords.com.au 9
AU
ST
RA
LIA
N E
QU
ITIE
S S
TR
AT
EG
Y
mb
d
-
500
1,000
1,500
2,000
2,500
Aug-15 Feb-16 Aug-16 Feb-17 Aug-17 Feb-18 Aug-18
India China South Korea Turkey EU
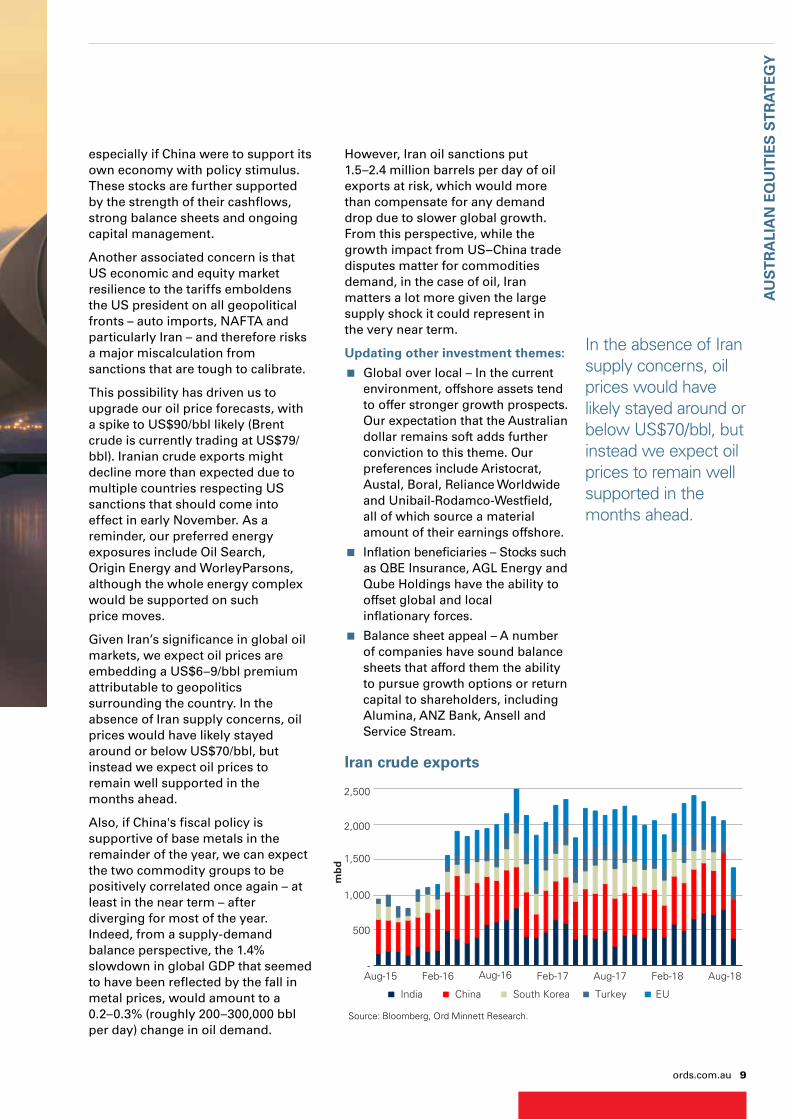
However, Iran oil sanctions put 1.5–2.4 million barrels per day of oil exports at risk, which would more than compensate for any demand drop due to slower global growth. From this perspective, while the growth impact from US–China trade disputes matter for commodities demand, in the case of oil, Iran matters a lot more given the large supply shock it could represent in the very near term.
Updating other investment themes:
� Global over local – In the current environment, offshore assets tend to offer stronger growth prospects. Our expectation that the Australian dollar remains soft adds further conviction to this theme. Our preferences include Aristocrat, Austal, Boral, Reliance Worldwide and Unibail-Rodamco-Westfield, all of which source a material amount of their earnings offshore.
� Inflation beneficiaries – Stocks such as QBE Insurance, AGL Energy and Qube Holdings have the ability to offset global and local inflationary forces.
� Balance sheet appeal – A number of companies have sound balance sheets that afford them the ability to pursue growth options or return capital to shareholders, including Alumina, ANZ Bank, Ansell and Service Stream.
especially if China were to support its own economy with policy stimulus. These stocks are further supported by the strength of their cashflows, strong balance sheets and ongoing capital management.
Another associated concern is that US economic and equity market resilience to the tariffs emboldens the US president on all geopolitical fronts – auto imports, NAFTA and particularly Iran – and therefore risks a major miscalculation from sanctions that are tough to calibrate.
This possibility has driven us to upgrade our oil price forecasts, with a spike to US$90/bbl likely (Brent crude is currently trading at US$79/bbl). Iranian crude exports might decline more than expected due to multiple countries respecting US sanctions that should come into effect in early November. As a reminder, our preferred energy exposures include Oil Search, Origin Energy and WorleyParsons, although the whole energy complex would be supported on such price moves.
Given Iran’s significance in global oil markets, we expect oil prices are embedding a US$6–9/bbl premium attributable to geopolitics surrounding the country. In the absence of Iran supply concerns, oil prices would have likely stayed around or below US$70/bbl, but instead we expect oil prices to remain well supported in the months ahead.
Also, if China's fiscal policy is supportive of base metals in the remainder of the year, we can expect the two commodity groups to be positively correlated once again – at least in the near term – after diverging for most of the year. Indeed, from a supply-demand balance perspective, the 1.4% slowdown in global GDP that seemed to have been reflected by the fall in metal prices, would amount to a 0.2–0.3% (roughly 200–300,000 bbl per day) change in oil demand.
Source: Bloomberg, Ord Minnett Research.
In the absence of Iran supply concerns, oil prices would have likely stayed around or below US$70/bbl, but instead we expect oil prices to remain well supported in the months ahead.
Iran crude exports
10 Ords Insights | 2018 ISSUE THREE
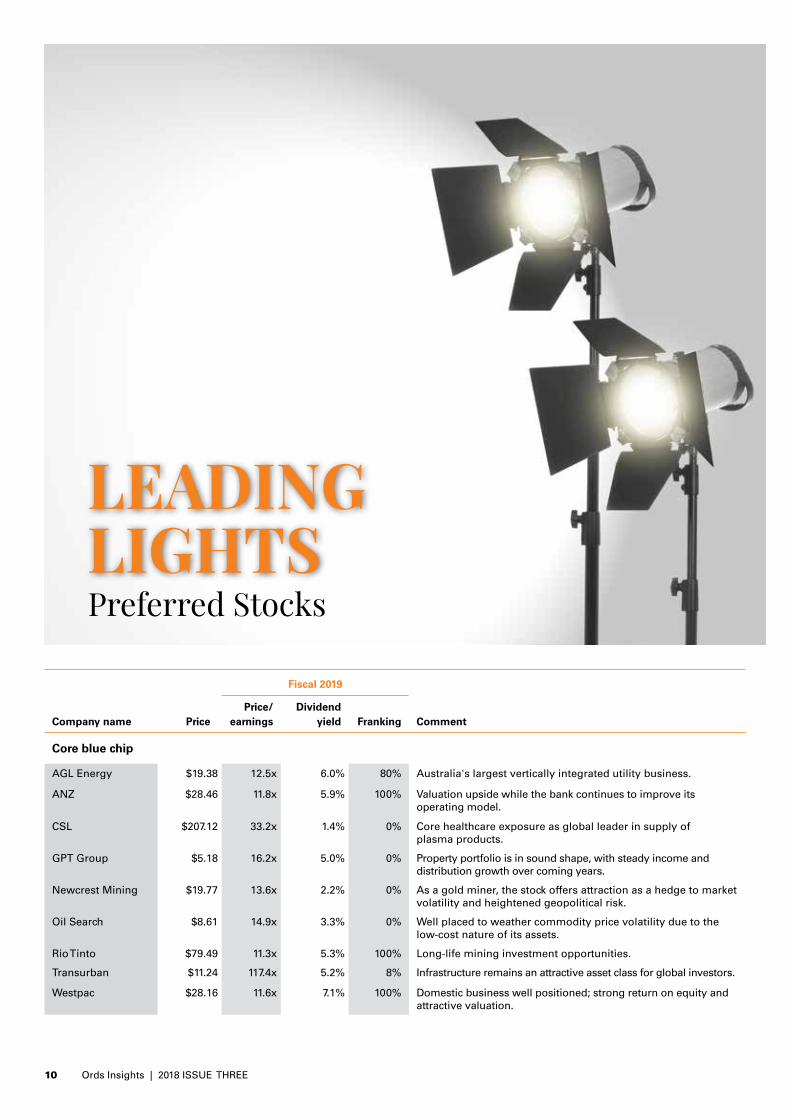
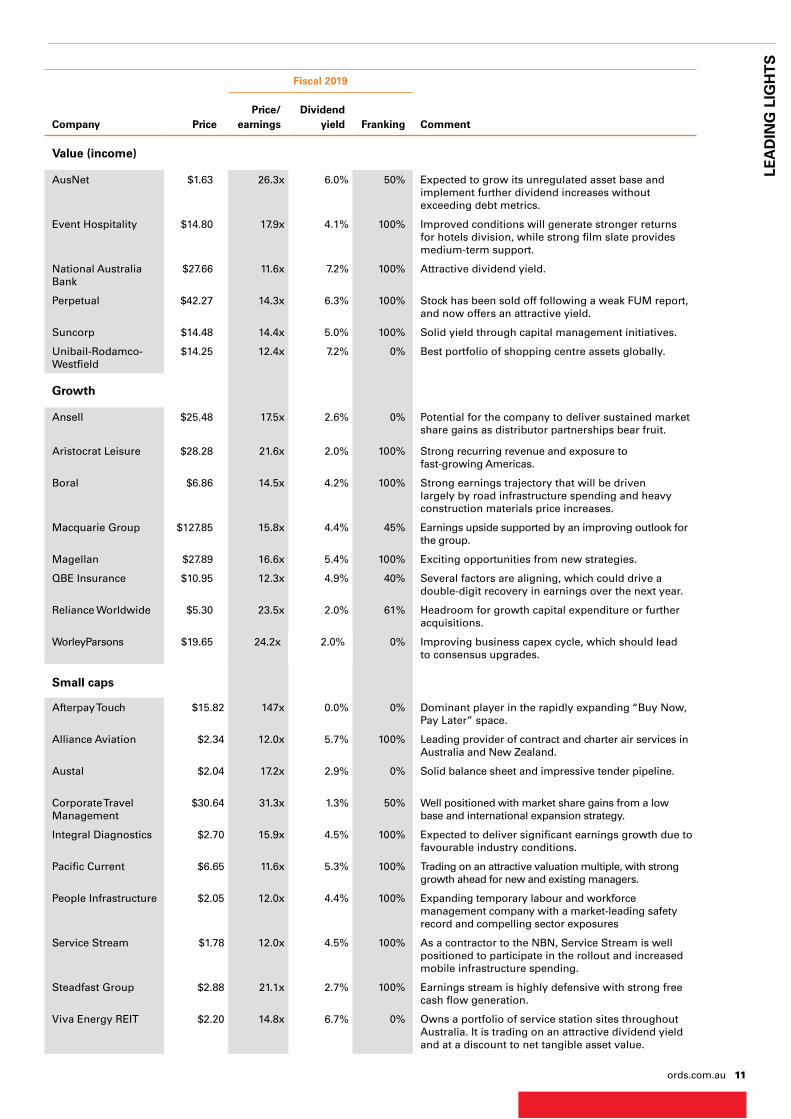
LEADING LIGHTSPreferred Stocks
Fiscal 2019
Company name Price Price/
earningsDividend
yield Franking Comment
Core blue chip
AGL Energy $19.38 12.5x 6.0% 80% Australia's largest vertically integrated utility business.
ANZ $28.46 11.8x 5.9% 100% Valuation upside while the bank continues to improve its operating model.
CSL $207.12 33.2x 1.4% 0% Core healthcare exposure as global leader in supply of plasma products.
GPT Group $5.18 16.2x 5.0% 0% Property portfolio is in sound shape, with steady income and distribution growth over coming years.
Newcrest Mining $19.77 13.6x 2.2% 0% As a gold miner, the stock offers attraction as a hedge to market volatility and heightened geopolitical risk.
Oil Search $8.61 14.9x 3.3% 0% Well placed to weather commodity price volatility due to the low-cost nature of its assets.
Rio Tinto $79.49 11.3x 5.3% 100% Long-life mining investment opportunities.
Transurban $11.24 117.4x 5.2% 8% Infrastructure remains an attractive asset class for global investors.
Westpac $28.16 11.6x 7.1% 100% Domestic business well positioned; strong return on equity and attractive valuation.
ords.com.au 11
Fiscal 2019
Company Price Price/
earningsDividend
yield Franking Comment
Value (income)
AusNet $1.63 26.3x 6.0% 50% Expected to grow its unregulated asset base and implement further dividend increases without exceeding debt metrics.
Event Hospitality $14.80 17.9x 4.1% 100% Improved conditions will generate stronger returns for hotels division, while strong film slate provides medium-term support.
National Australia Bank
$27.66 11.6x 7.2% 100% Attractive dividend yield.
Perpetual $42.27 14.3x 6.3% 100% Stock has been sold off following a weak FUM report, and now offers an attractive yield.
Suncorp $14.48 14.4x 5.0% 100% Solid yield through capital management initiatives.
Unibail-Rodamco-Westfield
$14.25 12.4x 7.2% 0% Best portfolio of shopping centre assets globally.
Growth
Ansell $25.48 17.5x 2.6% 0% Potential for the company to deliver sustained market share gains as distributor partnerships bear fruit.
Aristocrat Leisure $28.28 21.6x 2.0% 100% Strong recurring revenue and exposure to fast-growing Americas.
Boral $6.86 14.5x 4.2% 100% Strong earnings trajectory that will be driven largely by road infrastructure spending and heavy construction materials price increases.
Macquarie Group $127.85 15.8x 4.4% 45% Earnings upside supported by an improving outlook for the group.
Magellan $27.89 16.6x 5.4% 100% Exciting opportunities from new strategies.
QBE Insurance $10.95 12.3x 4.9% 40% Several factors are aligning, which could drive a double-digit recovery in earnings over the next year.
Reliance Worldwide $5.30 23.5x 2.0% 61% Headroom for growth capital expenditure or further acquisitions.
WorleyParsons $19.65 24.2x 2.0% 0% Improving business capex cycle, which should lead to consensus upgrades.
Small caps
Afterpay Touch $15.82 147x 0.0% 0% Dominant player in the rapidly expanding “Buy Now, Pay Later” space.
Alliance Aviation $2.34 12.0x 5.7% 100% Leading provider of contract and charter air services in Australia and New Zealand.
Austal $2.04 17.2x 2.9% 0% Solid balance sheet and impressive tender pipeline.
Corporate Travel Management
$30.64 31.3x 1.3% 50% Well positioned with market share gains from a low base and international expansion strategy.
Integral Diagnostics $2.70 15.9x 4.5% 100% Expected to deliver significant earnings growth due to favourable industry conditions.
Pacific Current $6.65 11.6x 5.3% 100% Trading on an attractive valuation multiple, with strong growth ahead for new and existing managers.
People Infrastructure $2.05 12.0x 4.4% 100% Expanding temporary labour and workforce management company with a market-leading safety record and compelling sector exposures
Service Stream $1.78 12.0x 4.5% 100% As a contractor to the NBN, Service Stream is well positioned to participate in the rollout and increased mobile infrastructure spending.
Steadfast Group $2.88 21.1x 2.7% 100% Earnings stream is highly defensive with strong free cash flow generation.
Viva Energy REIT $2.20 14.8x 6.7% 0% Owns a portfolio of service station sites throughout Australia. It is trading on an attractive dividend yield and at a discount to net tangible asset value.
LEA
DIN
G L
IGH
TS

INVESTMENT FUNDAMENTALS
The price/earnings ratio for the Australian market has moved above its long-term average again following a slight reduction in earnings growth expectations.
Source: Datastream. 12-mth forward consensus estimates are used. Red line represents the average ratio.
Pri
ce/e
arn
ing
s (x
)
Monthly
8
10
12
14
16
18
20
1993 1996 1999 2002 2005 2008 2011 2014 2017
12 Ords Insights | 2018 ISSUE THREE

Dividend yield Payout ratio (RHS)
40%
50%
60%
70%
80%
90%
3%
4%
5%
6%
7%
8%
2004 2006 2008 2010 2012 2014 2016 2018P
ayou
t ratioDiv
iden
d y
ield
Monthly
EPS growth
FY18–20 (%pa)
Price/ earnings
(x)
Price/ earnings
growth (x)
Price/ book
(x)
Dividend yield
(%)
S&P/ASX 200 6 15.3 2.4 2.0 4.5
Discretionary 8 18.7 2.2 2.8 3.4
Staples 6 19.3 3.1 2.8 3.9
Energy 30 14.4 0.5 1.5 4.0
Financials 3 12.5 4.4 1.6 5.9
Banks 2 11.9 7.7 1.5 6.3
Healthcare 12 28.3 2.3 6.3 1.7
Industrials 9 21.4 2.4 3.4 3.9
IT 14 24.5 1.7 5.4 2.0
Materials 11 14.6 1.3 2.0 4.2
Property 4 16.0 4.4 1.1 5.0
Telcos -15.6 10.2 -0.6 2.2 4.9
Utilities 10 18.5 1.9 2.0 5.4
Source: Datastream, Ord Minnett Research. 12-mth forward consensus estimates.
The market’s dividend yield of 4.5% remains close to the long-term average, while the payout ratio is slightly above 70%.
Source: Datastream, Ord Minnett Research. Price/earnings, price/book and dividend yield use 12-mth forward consensus estimates. Price/earnings growth uses 3-yr EPS growth.
Energy stocks are offering the highest earnings growth in coming years, which continues to support a relatively low price/earnings ratio, while healthcare and IT offer the highest growth among non-resource sectors. Banks and telcos continue to trade at the lowest price/earnings across the market, in part because of their weak earnings profile. Property trades closest to book value. Banks offer the highest dividend yield, while dividend cuts have reduced the yield for telcos. Among non-financials, property and utilities also offer attractive yields.
ords.com.au 13

14 Ords Insights | 2018 ISSUE THREE
INTEREST RATE SECURITIES
bond yields gradually ticking higher, we can expect margins to begin to widen over the medium term. Our outlook and strategy are unchanged – stay invested, but reduce risk. Investors should focus on reallocating funds to the front end of the curve – this will help to reduce volatility as interest rates move higher. Fundamentals will ultimately prevail in turbulent market conditions and, with more volatility on the horizon, we recommend positioning portfolios for this next phase.
We are underweight long-dated securities as term premiums remain elusive and leave a negligible buffer to absorb any unexpected move in offshore credit spreads or other shocks. We continue to favour
short-dated securities as they offer capital price stability, albeit at lower yields. Investors should, therefore, couple this with an allocation to more liquid, mid-dated securities with high coupon margins.
Implications of a change in governmentThe possibility of a Labor government after the next federal election has increased. This could diminish the appeal of hybrids, given the party’s intention to restrict access to franking credits for certain investors who would have to focus on the net yields, rather than the gross. However, several factors could help to offset the impact.
The listed hybrids market has gained momentum, adding more than 3% over the past three months, comfortably recovering losses from its sell-off earlier in the year. Despite a resurgence of the possibility of a change in federal government, and Labor’s push to restrict access to franking credit refunds for certain investors, listed interest rate securities held relatively steady. Continued demand for these securities as well as diminishing supply helped. Valuations however are looking increasingly stretched, so at these levels we can expect further volatility.
Market conditions remain supportive of hybrids and we expect trading margins to remain range-bound over the coming months. With

ords.com.au 15
INT
ER
ES
T R
AT
E S
EC
UR
ITIE
S
Specifically around a change in tax treatment:
� APRA could intervene and potentially grandfather existing hybrid securities, which has previously been the case; or
� Exemptions may apply to certain investors, or refunds may still be available, but at a capped rate. This would allow the government to alleviate the impact on low-income retirees while still taxing wealthier investors.
Further, there are some behavioural responses that could offset the revenue benefits of this policy.
� Investors could simply accept the lower returns given there are few substitutes offering the same risk/reward profile. This would be exacerbated by term deposit rates at historical lows and fuller equity valuations.
� Tax-paying investors who can still use the franking offset could absorb reduced demand, particularly institutional investors. Potentially, there could be a shift in the investor base to a more even split between retail and institutional investors.
� Wealthier retirees (with more than $1.6 million in superannuation) could restructure their investments to continue to benefit from franking credits. This would involve moving
non-franked investments into the tax-free pension account while placing securities paying franked dividends in the accumulation account where they can benefit from franking credits.
Looking to the medium to longer term, there are further tailwinds for the hybrids sector:
� The Royal Commission is likely to reduce risk-taking within banks and improve the credit risk profile of issuers.
� Subdued credit growth for the foreseeable future will reduce the need for banks to raise funding by issuing new securities, thereby restricting the supply of hybrids and supporting prices.
� APRA’s ongoing work to improve the transparency and comparability of capital adequacy ratios among global peers is putting pressure on issuance. Banks could have more incentive to boost overseas issuance at lower spreads, further constraining supply.
� Global ratings agency Standard & Poor’s has flagged a potential upgrade to Australia’s economic risk score, which would have positive implications for hybrids, as they would then be considered investment-grade, thereby increasing their appeal for institutional investors.
Cash rate and monetary policy At its September meeting, the Reserve Bank extended its record, holding rates at 1.50% for the 25th consecutive month. The minutes reiterated that the next move in rates is more likely to be up rather than down, but there is no near-term case for adjustment.
Recent economic data has been better than expected and unemployment has reached its cyclical low – but at 5.3%, spare capacity still persists in the labour market. However, forward indicators of labour demand signal above-average employment growth in the coming months. There is evidence that wage pressures are building in some parts of the economy, particularly in healthcare and education (where a large proportion of employees are paid under collective wage agreements), than in other sectors.
Downside risk has increased in the form of greater uncertainty arising from escalating trade tensions, tighter US money market conditions and emerging market ructions. Locally, stubbornly low wage growth and a stretched consumer continue to drag on the economy, although the RBA noted that recent weakness in the local currency was helpful for domestic economic growth.
Code IssueExpected maturity
Last price Coupon structure
Coupon rate (net)
Running yield
Yield to maturity
Trading margin
CBAPD CBA PERLS VII 15/12/2022 $97.30 BBR90 + 2.80% 3.30% qtly 4.85% 6.02% 3.6%
CBAPF CBA PERLS IX 31/03/2022 $101.80 BBR90 + 3.90% 4.19% qtly 5.88% 5.69% 3.4%
NABPB NAB CPS II 17/12/2020 $101.20 BBR90 + 3.25% 3.62% qtly 5.11% 4.84% 2.7%
NABPC NAB Capital Notes 23/03/2020 $101.95 BBR90 + 3.50% 3.80% qtly 5.32% 4.21% 2.2%
SUNPE Suncorp CPS III 17/06/2020 $101.50 BBR90 + 3.40% 3.72% qtly 5.24% 4.63% 2.6%
Source: Iress, Ord Minnett Research. Coupons, yields and margins incorporate franking credits.
Investment ideas NAB CPS II (NABPB), NAB Capital Notes (NABPC) and Suncorp CPS III (SUNPE) – These securities are trading close to par and offer annualised net distributions of around 3.5% (about 5% grossed up). They have almost two years to call and should experience lower capital price volatility while providing a decent income stream. Being shorter-dated securities, these are a neat hedge against any steps to restrict excess franking credit rebates, which would take some time to legislate if Labor were elected to goverment.

16 Ords Insights | 2018 ISSUE THREE
The company’s prestige products are sold principally through limited distribution channels to complement the images associated with the brands.
COMPANY ESTÉE LAUDER
TICKER EL.NYS
EXCHANGE New York
SECTOR Consumer Staples
SUB-INDUSTRY Household &
Personal Products
DescriptionEstée Lauder Companies Inc, founded in 1946 by Estée and Joseph Lauder, is one of the world’s leading manufacturers and marketers of quality skin care, makeup, fragrance and hair care products. Products are sold in more than 150 countries and territories under a number of well-known brand names, including Estée Lauder, Clinique, Origins, MAC, Bobbi Brown, La Mer, Jo Malone London, Aveda and Too Faced.
The company’s prestige products are sold principally through limited distribution channels to complement the images associated with the brands. These channels consist primarily of department stores, specialty multi-brand retailers, upscale perfumeries and pharmacies, and prestige salons and spas. In addition, products are sold on the company’s own websites and in freestanding stores, and duty-free shops.
The company has four divisions:
� Skin care – These products include moisturisers, serums, cleansers, toners, body care, exfoliators, acne care, facial masks, cleansing devices and sun care products;
� Makeup – Includes lipsticks, lip glosses, mascaras, foundations, eyeshadows, nail polishes and powders;
� Fragrance – These are sold in various forms, including eau de parfum sprays and colognes, as well as lotions, powders, creams, candles and soaps that are infused with a particular fragrance; and
� Hair Care – Includes shampoos, conditioners, styling products, treatments, finishing sprays and hair colour products.
Investment ThesisWe believe Estée Lauder offers the best organic growth opportunity among large-cap household and personal care stocks, with its long-term sustainable target of 6–8% sales growth ahead of its peers.
The company’s vast global distribution network, together with its ability to expand distribution within key, fast-growing specialty retailers such as ULTA and Sephora, outweighs concerns about slowing foot traffic in traditional shopping centres.
Beyond the top line, Estée Lauder has ample opportunity to drive operating profit margin expansion through various cost-reduction programs.
INTERNATIONAL STOCKS

ords.com.au 17
Stock Headquarters Cu
rren
cy
Mar
ket
cap
’n
(A$b
n)
Pric
e/ E
arn
ing
s (F
Y19
E, x
)
EP
S G
row
th
(FY
19E
)
Div
iden
d y
ield
(F
Y19
E)
Description
Consumer
Diageo UK GBP 119 19.8 6% 2.7% Distiller
Estée Lauder Companies USA USD 72 27.1 6% 1.3% Beauty products
Masco Corporation USA USD 16 13.3 29% 1.2% Home improvement and building products
McDonald's Corp USA USD 176 20.2 15% 2.7% Quick-service restaurants
Nestlé Switzerland CHF 353 19.1 4% 3.3% Multinational packaged food
Relx UK GBP 55 17.2 -4% 2.9% Media publisher and information provider
Energy
Total France EUR 236 10.2 31% 5.6% Integrated oil gas and chemical producer
Financials
BlackRock USA USD 107 15.9 22% 2.7% Global investment manager
Intercontinental Exchange USA USD 61 20.0 18% 1.4% Financial exchange operator
Mastercard USA USD 317 29.4 40% 0.5% Payment solutions provider
Partners Group Switzerland CHF 30 25.3 1% 3.0% Private equity manager
Healthcare
Edwards Lifesciences USA USD 44 29.1 23% 0.0% Medical devices to treat cardiovascular disease
Johnson & Johnson USA USD 527 16.5 12% 2.6% Consumer, pharmaceutical and medical devices
Thermo Fisher Scientific USA USD 135 20.0 16% 0.3% Analytical instruments and supplies
Industrials
Airbus Netherlands EUR 134 19.1 12% 2.0% Aircraft manufacturer
Honeywell USA USD 171 18.9 15% 2.0% Diversified technology and manufacturing
Raytheon USA USD 80 17.5 30% 1.8% Defence and homeland security technologies
Technology
Alphabet USA USD 1118 24.5 23% 0.0% Web-based search engine
Amazon.com USA USD 1284 74.1 284% 0.0% Online retailer and IT services provider
ASML Netherlands EUR 113 22.3 15% 1.1% Equipment for manufacturing microchips
Capgemini France EUR 30 16.1 -12% 1.8% IT services vendor
Facebook USA USD 646 19.9 33% 0.0% Leading social media company
Microsoft Corp USA USD 1204 22.9 10% 1.7% Software provider
Materials
Koninklijke DSM Netherlands EUR 27 18.3 39% 2.4% Specialty chemical and ingredients supplier
Other
iShares MSCI Japan ETF USA AUD 23 13.4 3% 2.1% Japanese stock market exposure
INT
ER
NA
TIO
NA
L S
TOC
KS

18 Ords Insights | 2018 ISSUE THREE
As has been the pattern this year, the AUD/USD exchange rate has taken another shift lower in the trading range since we last published Insights. Accordingly, we have made some adjustments to our forecast track for the currency, more so to mark-to-market recent developments, in particular, a tightening in emerging market financial conditions. We now forecast the AUD/USD at USD 0.70 by year end, and USD0.68 by mid-2019.
One could argue that with US growth continuing to outperform, the Federal Reserve’s planned adjustment to higher real rates intact, and slower Chinese growth expected in 2019, there is scope to be more bearish on AUD/USD.
However, we think the decline will be capped for a number of reasons. First, our growth forecasts (emerging markets outperforming developed markets) are consistent with the dollar topping out in the first half of 2019. All else being equal, this should put a floor under AUD/USD but allow depreciation versus other reserve currencies.
Second, our profile for the terms of trade (the long run driver for AUD) is broadly stable over the forecast horizon.
Third, despite the strong correlation between commodity currencies and emerging market currencies, our forecasts for the latter over the next year are not particularly bearish.
Finally, Chinese growth is expected to lift towards year-end as stimulus measures take effect. This might engineer some short term stability into the broader emerging market and commodity complex.
From a positioning point of view, net short positions in AUD remain close to their most extreme level since late 2015. Clearly, AUD shorts are a currency speculator’s hedge of choice for concerns over emerging markets, China and trade wars, and it is hard to see any of these headwinds easing in the near term. This means that absent a retracement of USD long positions, catalysts for a shift in AUD positioning appear hard to envisage over the medium term.
RATES*
Dec-18
AVERAGE FOR QUARTER
Jun-19
Source: IRESS, Ord Minnett Research* Per Australian Dollar
0.70 068
75 71
0.89 0.85
4.85 4.77
0.62 0.57
0.55 0.50
1.09 1.11
5.48 5.32
CURRENT
0.72
80
0.93
4.92
0.62
0.55
1.09
5.62
0.69 0.69 0.64
Exchange Rate Forecasts
CURRENCY

ords.com.au 19
Full-Service Financial Advice | Retirement | Wealth Management | Tailored Investment Options
Discover the Value of our advice | ords.com.auOrd Minnett Limited ABN 86 002 733 048 holds AFS Licence Number 237121. The trustee of UMA Super is The Trust Company (Superannuation) Limited ABN 49 006 421 638 and holder of AFS Licence Number 235153. This advertisement contains general financial advice only and does not consider your personal circumstances. Before investing in UMA Super you will need to obtain a copy of the Product Disclosure Statement from Ord Minnett.
Take the stress out of retirement planning with a comprehensive financial strategy.
Talk to your adviser about retirement planning to help capture your dream.
TAKE THE FIRST STEP –RETIRE WITHOUT THE STRESS
20 Ords Insights | 2018 ISSUE THREE
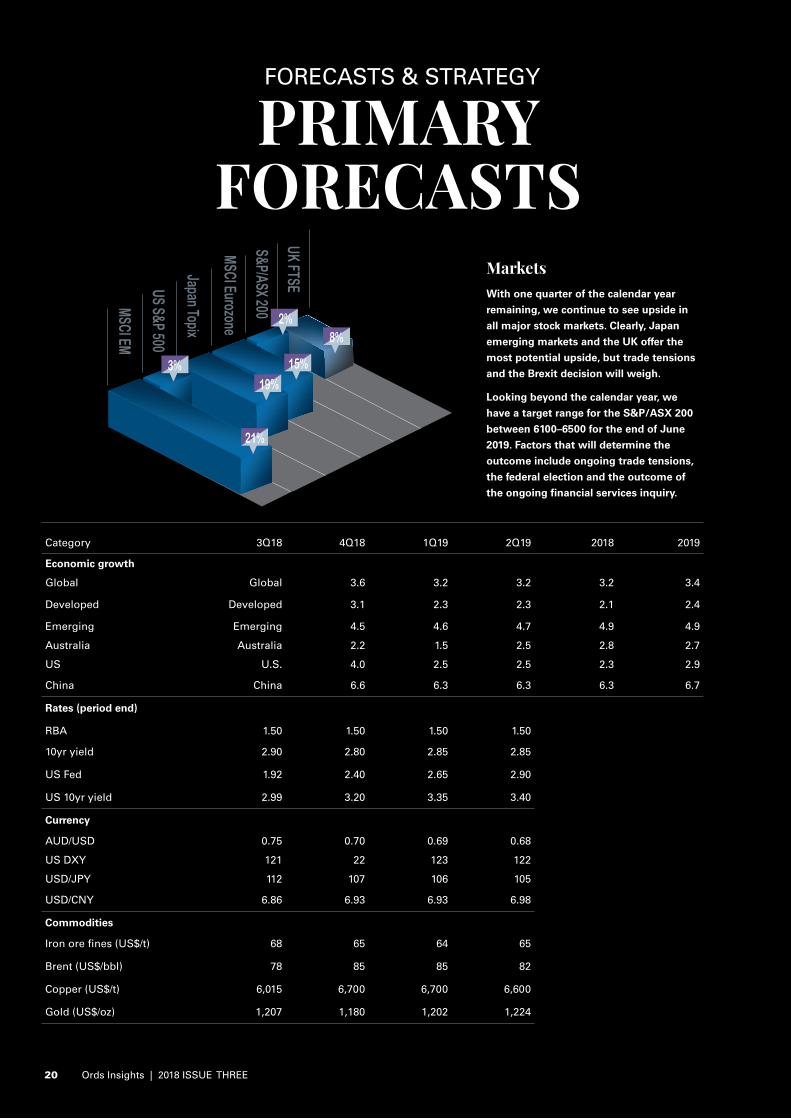
PRIMARY FORECASTS
FORECASTS & STRATEGY
MSCI EM
US S&P 500
Japan Topix
MSCI Eurozone
S&P/ASX 200
UK FTSE
0
5
10
15
20
25
18%
MSCI EM
MOVEMENTJapan TopixUK FTSE
Euro StoxxUS S&P 500
ASX 200
15%19%
3%
8%
21%
2%
Category 3Q18 4Q18 1Q19 2Q19 2018 2019
Economic growth
Global Global 3.6 3.2 3.2 3.2 3.4
Developed Developed 3.1 2.3 2.3 2.1 2.4
Emerging Emerging 4.5 4.6 4.7 4.9 4.9
Australia Australia 2.2 1.5 2.5 2.8 2.7
US U.S. 4.0 2.5 2.5 2.3 2.9
China China 6.6 6.3 6.3 6.3 6.7
Rates (period end)
RBA 1.50 1.50 1.50 1.50
10yr yield 2.90 2.80 2.85 2.85
US Fed 1.92 2.40 2.65 2.90
US 10yr yield 2.99 3.20 3.35 3.40
Currency
AUD/USD 0.75 0.70 0.69 0.68
US DXY 121 22 123 122
USD/JPY 112 107 106 105
USD/CNY 6.86 6.93 6.93 6.98
Commodities
Iron ore fines (US$/t) 68 65 64 65
Brent (US$/bbl) 78 85 85 82
Copper (US$/t) 6,015 6,700 6,700 6,600
Gold (US$/oz) 1,207 1,180 1,202 1,224
MarketsWith one quarter of the calendar year
remaining, we continue to see upside in
all major stock markets. Clearly, Japan
emerging markets and the UK offer the
most potential upside, but trade tensions
and the Brexit decision will weigh.
Looking beyond the calendar year, we
have a target range for the S&P/ASX 200
between 6100–6500 for the end of June
2019. Factors that will determine the
outcome include ongoing trade tensions,
the federal election and the outcome of
the ongoing financial services inquiry.

ords.com.au 21
PRIMARY FORECASTS
Ord Minnett Limited ABN 86 002 733 048; ASX Market Participant AFS Licence Number 237121
ords.com.au ords.com.hk
RE
CO
MM
EN
DA
TIO
NS
GUIDELINES Ord Minnett recommendations are based on the total return of a stock – nominal dividend yield plus capital appreciation – and have a 12-month time horizon.
SPECULATIVE BUYWe expect the stock’s total return (nominal yield plus capital appreciation) to exceed 20% over 12 months. The investment may have a strong capital appreciation but also has high degree of risk and there is a significant risk of capital loss.
BUY
The stock’s total return (nominal dividend yield plus capital appreciation) is expected to exceed 15% over the next 12 months.
ACCUMULATE
We expect a total return of between 5% and 15%. Investors should consider adding to holdings or taking a position in the stock on share price weakness.
HOLD
We expect the stock to return between 0% and 5%, and believe the stock is fairly priced.
LIGHTEN
We expect a loss of between 0% and 15%. Investors should consider decreasing their holdings.
SELL
We expect a total loss of 15% or more. Investors should decrease their holdings.
RISK ASSESSMENT
Classified as Lower, Medium or Higher, the risk assessment denotes the relative assessment of an individual stock’s risk based on an appraisal of its disclosed financial information, historical volatility of its share price, nature of its operations, and other relevant quantitative and qualitative criteria. Risk is assessed by comparison with other Australian stocks, rather than across other asset classes such as cash or fixed interest.
OFFICES Adelaide Level 5, 100 Pirie Street, Adelaide SA 5000 Tel: (08) 8203 2500 | Fax: (08) 8203 2525
Brisbane Level 31, 10 Eagle Street, Brisbane QLD 4000 Tel: (07) 3214 5555 | Fax: (07) 3214 5550
Buderim, Sunshine Coast 1/99 Burnett Street, Buderim QLD 4556 Tel: (07) 5430 4444 | Fax: (07) 5430 4400
Canberra 101 Northbourne Avenue, Canberra ACT 2600 Tel: (02) 6206 1700 | Fax: (02) 6206 1720
Gold Coast Level 7, 50 Appel Street, Surfers Paradise QLD 4217 Tel: (07) 5557 3333 | Fax: (07) 5574 3377
Mackay 45 Gordon Street, Mackay QLD 4740 Tel: (07) 4969 4888 | Fax: (07) 4969 4800
Melbourne Level 7, 161 Collins Street, Melbourne VIC 3000 Tel: (03) 9608 4111 | Fax: (03) 9608 4142
Newcastle 426 King Street, Newcastle NSW 2300 Tel: (02) 4910 2400 | Fax: (02) 4910 2424
Sydney Level 8, 255 George Street, Sydney NSW 2000 Tel: (02) 8216 6300 | Fax: (02) 8216 6311
Hong Kong 1801 Ruttonjee House, 11 Duddell Street, Central, Hong Kong Tel: +852 2912 8980 | Fax: +852 2813 7212

ords.com.au