Embed Size (px)
Citation preview

NBER WORKING PAPER SERIES
INSOLVENCY RESOLUTION AND THE MISSING HIGH YIELD BOND MARKETS
Bo BeckerJens Josephson
Working Paper 19415http://www.nber.org/papers/w19415
NATIONAL BUREAU OF ECONOMIC RESEARCH1050 Massachusetts Avenue
Cambridge, MA 02138September 2013
We thank Jan Ericsson, Mike Burkart, Julio Riutort, Frank Saxen, and participants at the 5th InternationalUC conference, the Second ITAM Finance Conference, and the IFN Stockholm Conference on IndustrialOrganization and Corporate Finance. The views expressed herein are those of the authors and do notnecessarily reflect the views of the National Bureau of Economic Research.
NBER working papers are circulated for discussion and comment purposes. They have not been peer-reviewed or been subject to the review by the NBER Board of Directors that accompanies officialNBER publications.
© 2013 by Bo Becker and Jens Josephson. All rights reserved. Short sections of text, not to exceedtwo paragraphs, may be quoted without explicit permission provided that full credit, including © notice,is given to the source.

Insolvency Resolution and the Missing High Yield Bond MarketsBo Becker and Jens JosephsonNBER Working Paper No. 19415September 2013JEL No. G32,G33
ABSTRACT
In many countries, bankruptcy is associated with low recovery by creditors. We develop a model ofcorporate credit markets in such an environment. Corporate credit is provided by either a bond marketor risk-averse banks. Restructuring of insolvent firms happens out of court if in-court bankruptcy isinefficient, giving banks an advantage over bondholders. Riskier borrowers will use bank loans anywhere,but also bonds when bankruptcy is efficient. The model matches empirical debt mix patterns betterthan fixed-issuance-cost models. Across systems, efficient bankruptcy should be associated with morebond issuance by high-risk borrowers. This effect is small or absent for safe firms. We find that bothpredictions hold both cross-country and using insolvency reforms as natural experiments. Our empiricalestimates suggest that a one-standard-deviation increase in the efficiency of bankruptcy is associatedwith an increase in the stock of corporate bonds equal to 5% of firm assets. This is equivalent to twothirds of the difference between the US and other countries.
Bo BeckerHarvard Business SchoolBaker Library 349Soldiers FieldBoston, MA 02163and [email protected]
Jens JosephsonDepartment of EconomicsStockholm UniversitySE-106 91 Stockholm [email protected]

2
Most external financing to corporations is debt, i.e. financing with a fixed horizon and a
predetermined repayment schedule. Among the dimensions in which corporate debt contracts
vary, such as maturity and seniority, one stands out as particularly salient: the difference
between intermediated debt (such as bank loans) and non-intermediated debt (bonds and
commercial paper). Bank loans are associated with more screening, monitoring and
intervention, but are held in much more concentrated fashion (Diamond 1991). Corporations
use both loans and bonds in large amounts, and individual firms often use both simultaneously,
showing willingness to switch.1 However, there are strong cross-country differences in the mix
of debt use: for European listed companies the amount of loans outstanding is more than twice
the amount of bonds. US firms, on the contrary, have less loans outstanding than bonds. Figure
1 shows aggregate amounts of bond debt, bank loans, and other debt for publicly listed
corporations in North America, Europe, and Asia in 2010, demonstrating the very large
geographical differences.2
This international variation in the corporate debt mix, not previously documented in
detail, cannot easily be explained by standard models of bank-bond choice, which focus on the
superior monitoring ability of banks (Diamond 1991) or the fixed costs associated with bond
issuance (e.g. Bhagat and Frost 1986). These forces do not vary in an obvious way across
countries, especially not on the scale that could plausibly cause these wide differences in debt
mix. After all, firms need monitoring both in France and Canada, and banks presumably screen
and monitor their small and large borrowers with approximately the same technology.
We propose instead that a better explanation of the broad cross-country patterns is
offered by variation in the efficiency with which insolvency is resolved. Countries exhibit
substantial differences in how creditors in insolvent firms are treated: recovery rates range from
negligible to above 90% (Djankov, Hart, McLiesh and Shleifer 2008). The differences in
recoveries can be traced to poor liquidation decisions by courts; sluggish and bureaucratic
decision-making in firms during bankruptcy proceedings; legal delays; lack of funding while in
bankruptcy (perhaps reflecting debt overhang); as well as the direct costs of the process,
including fees to lawyers, administrators and professionals.3
1 In the United States, non-financial non-farm corporate business had $3.0 trillion of loans and $5.6 trillion
of bonds and commercial paper outstanding at the end of the third quarter of 2012 (Flow of Funds
2012Q3). Becker and Ivashina (2013) demonstrate frequent switching. 2 These three regions correspond to broad levels of bankruptcy efficiency (North America being best and
Asia worst), although there is dispersion within each group. 3 We use the term bankruptcy to refer to any in-court procedure. This corresponds to U.S. terminology.
Many countries use different terminology for different procedures (e.g. “Scheme of Arrangement” in the
U.K.). The legal variations are many and complex, but all in-court procedures tend to grant some parties
rights that they lack outside of court, and most involve some ability to “cram down” a restructuring plan

3
To understand the effects of poor bankruptcy on corporate debt markets, we model the
effect of insolvency resolution on firms that can chose between two forms of debt – bank loans
and bonds – to fund an investment, and which can resolve possible future insolvency in and out
of court. Bonds have a risk sharing advantage (especially when a firm is large), but insolvency
may favor banks. When a firm is in distress, the quality of the system for resolving distress
determines what happens. We model in-court bankruptcy as fair – i.e. respecting of dispersed
bondholders’ rights -- but possibly inefficient. If the formal bankruptcy system delivers good
overall payoffs (we model this in terms of the likelihood that courts make efficient liquidation
decisions), insolvency can be resolved in court. Weak claimants such as bondholders get fair
treatment, and therefore are not at a disadvantage. But if the bankruptcy system is poor,
insolvency has to be resolved out of court. In this setting, bargaining power favors banks over
bond holders, and banks can extract some value from bondholders (by forcing them to make
concessions).4 Ex ante, bond holders require higher promised payments (a high interest rate) to
compensate. In this model, when a firm can repay its debts safe firms tend to issue bonds to
take advantage of risk sharing benefits. In contrast, a high-risk firm (for which insolvency is
likely) will tend to use bank loans to finance its investment if bankruptcy is inefficient, but issue
bonds when bankruptcy is efficient. We test these cross-firm and cross-system predictions. In
particular, we examine the idea that a low risk firm can issue bonds in any economy, since
insolvency resolution is not likely to matter, whereas high risk firms will change their debt mix
much more in response to differences in bankruptcy efficiency.
A noteworthy feature of the model is the absence of seniority (i.e., bank loans and bonds
are assumed to be on par). In practice, bank loans are often senior (contractually or structurally,
i.e. by being issued lower down in a corporate hierarchy), perhaps reflecting monitoring
incentives outside of distress. In our model, assuming that bank loans were senior would make
bonds’ out-of-equilibrium threat slightly worse, thus perhaps increasing the extent of conflict,
leading to stronger effects of bankruptcy on equilibrium debt mixes. Thus, assuming parity
instead of the typical bank seniority is likely not a critical assumption, just reducing the
magnitude of the effect we study. A bigger challenge is endogenizing seniority. The question is
whether senior bonds could reduce the disadvantage of bonds (out of court) in the model, by
giving bondholders better bargaining power. The answer is not much, since the weakness of
bondholders stems from their dispersion, not their contractual rights. Because not allowing
that not all creditors agree to. Judicial oversight of managers is always involved, and is sometimes
considerable. 4 Although perhaps intuitively appealing, our assumption that large players have better bargaining
power than small dispersed players is not universally true in bargaining games. We discuss this issue
below.

4
seniority to be endogenously set within the model greatly simplifies solving it, we stick with
this assumption throughout.
While mainly motivated by cross-country patterns, our model turns out to be successful
in matching firm level patterns. Our model predicts that many firms will find it optimal to
maintain bank debt while accessing the bond market. This is in contrast with fixed cost theories
of bond market access, which predict bang-bang solutions (only bonds once a firm is large or
well-known enough). In a large international panel data set, we confirm that firms with
outstanding bonds tend to maintain non-trivial bank debt on their balance sheets. Our findings
do not reject the possible informational advantages of banks.5 They imply, however, that for
large firms, theories that predict a bang-bang choice of first bank loans and then bonds struggle
to fit the data.6
Most importantly, our model makes two key cross-country predictions: (1) low-risk
firms are able to use bonds regardless of the quality of the bankruptcy system; (2) high-risk
firms will issue bonds if the bankruptcy system works well (because they offer superior risk
sharing) but loans if the bankruptcy system works poorly (because firms find it expensive to
compensate bondholders for the expropriation by banks they suffer in distress).7 We document
that cross-sectional differences in bankruptcy recovery rates explain debt usage overall, and
especially for high risk firms. We also use bankruptcy reforms in several countries to reduce
concerns about reverse causality (surrounding bankruptcy reform timing) and omitted
variables. We find that reforms that are associated with improvements in bankruptcy recovery
rates increase bond usage, and vice versa. This confirms that bankruptcy law may be a key
driver of the debt structure of high risk firms.
Our model abstracts from a large set of potential determinants of the size of bank loan
and bond markets. For example, banks may be used as vehicles of government subsidies (to the
extent that this only affects average cost of funding and not the risk aversion of banks, it is
consistent with our model). Bond markets may require certain institutional arrangements,
5According to Rajan (1992), firms with higher profits are more worried about expropriation by banks, and
so have a stronger preference for bond markets. According to Diamond (1991), better known firms are
more likely to issue bonds. In our panel data, we find evidence consistent with both these theories, but
neither explains the coexistence of the two firms of debt. On the other hand, Boot and Thakor (1997)
discuss a possible extension of their model where they envision that firms optimally “balance the benefits of
bank monitoring and financial market information aggregation” so that firms with high moral hazard problems
chose more bank debt and those with less asymmetric information use market debt. 6 Hackbarth, Henessy and Leland (2007) develop a model of bank debt, equity and bonds which also has
the feature that larger firms tend to mix bonds and loans. 7 These predictions apply for firms beyond a certain minimum size below which only bank financing is
used, something which is confirmed by our data.

5
transparency and liquidity, and the existence of institutional investors. These are important
questions that do not have well developed answers. A direct test of the importance of deep,
liquid bond markets is obviously difficult since any other factor improving bond markets (e.g.,
bankruptcy reform), would cause the market to grow and its liquidity to go up. In the absence of
properly identified tests that can isolate the direction of causality, the importance of liquidity
and transparency currently has to be guessed at.8 An argument against assigning this
hypothesis too much weight is that the corporate bond market is well integrated internationally.
Many bonds of European issuers are issued in the UK and many bonds of global issuers are
issued in the US. Furthermore, the legal formats (covenant structure, debentures etc.) tend to be
standardized internationally, many corporate bonds are issued in just a handful of international
currencies, and many bond investors buy foreign-issued bonds. Thus, there is limited scope for
nationality to affect market liquidity and depth. This is in stark contrast with bankruptcy rules:
bankruptcy is almost universally resolved in the home country.9
Additionally, we need to consider whether our measure of bankruptcy may proxy for
other factors that drive bond market development – perhaps unknown factors. In particular,
business cycles may affect the corporate debt mix, since bonds are less pro-cyclical than bank
loans (Becker and Ivashina 2013). We do not believe that such macro-economic factors are likely
to explain the empirical patterns that we document, because bankruptcy efficiency and its
changes over time are distinct legislative reform processes, typically driven as much by legal
technicalities as by current business cycles. In recent years, bankruptcy reform all over the
world appears to have been compelled by a universal desire to make liquidation less frequent,
inspired by the U.S. experience with Chapter 11 (introduced in 1978). The pace of the various
national reform processes has largely been determined by legal considerations. The process of
adapting and adjusting U.S. legal concepts (such as debtor-in-possession financing) to new legal
environments has proven technically challenging. Thus, reform has been slow and deliberate.
For this reason, the local macro-economy is unlikely to be a short-term driver of bankruptcy
reform. We discuss some specific bankruptcy reform efforts more below.
More generally, any alternative theory must explain the range of predictions that our
model provides and which fit the data. In particular, the co-existence of bonds and bank loans
in individual firm’s capital structure, and, also, the differential effects of bankruptcy across safe
8 Indirect evidence can be gleaned from the pricing of bonds. In the U.S., more liquid bonds trade at lower
yields. See, e.g. Bao, Pan and Wang (2011). 9 In many countries, this practice follows the Model Law on Cross-Border Insolvency promulgated by the
United Nations Commission on International Trade Law (“UNCITRAL”). See
http://www.uncitral.org/uncitral/en/uncitral_texts/insolvency.html for the initial 1997 model law and
subsequent updates as well as a list of adopting countries. The European Union has different law, but
embraces similar principles.

6
and risky issuers narrow the set of possible alternative explanations. Based on these
considerations, we would tend to interpret our regression results as reflecting causality from
bankruptcy efficiency to the use of bonds in corporate capital structures.
Our conclusions about the link between bankruptcy and bond markets have important
policy implications. Using a back-of-the envelope calculation, bringing all countries up to US
bankruptcy efficiency would increase corporate bond markets by almost $1 trillion, or around a
quarter of the current size (in our sample), much of the increase in high yield bonds (since the
effect of bankruptcy is largest for high risk issuers). Such a change of corporate debt structures
would close around half the gap between the U.S. and other countries. In this sense, insolvency
resolution appears a possible driver behind the “missing” corporate bond markets in many
countries. Increasing the share of bonds in corporate debt could offer several potential benefits:
(a) reduce exposure of firm funding to the relatively large cycles in the bank loan supply (see
e.g. Chava and Purnandam 2009, Becker and Ivashina 2013, and Jimenez, Ongena, Peydro, and
Saurina 2012); (b) allow better risk sharing, since bonds can be held more widely than bank
loans; and (c) remove large concentrated credit risks from the banking system, making
regulation and oversight of the banking system easier. Thus, apart from any direct benefits of
better bankruptcy decisions, potentially large additional benefits stem from the impact this may
have on credit market structure.
1. Bonds, bank loans and corporate credit
In this section, we briefly discuss the various forms of corporate credit. We focus on
research that bears on the distinctions between the forms of credit and that attempt to explain
them. In fact, debt contracts vary considerably in contracts terms, monitoring intensity and
diversification of risk. Much of the variation is related to the whether credit is intermediated or
not. Bank loans are typically made by government-insured and heavily regulated deposit-
taking institutions10, which may screen and monitor borrowers, whereas bonds are held by
mostly passive institutional investors which are much less regulated.11 These institutional
differences correspond to differences in the flow to credit. The supply of bank debt is pro-
cyclical and sensitive to banks’ financial conditions (Kashyap, Stein and Wilcox 1993, Becker
and Ivashina 2013), whereas bond issuance is sensitive to fund flows (Chernenko and
Sunderam 2012). This has important implications for the role of credit in the business cycle
(Holmström and Tirole 1997).
10 Not all intermediated credit is supplied by deposit-taking banks, although these represent the majority
of corporate lending. See Denis and Mihov (2003) about the role of non-bank debt. 11 The distinction between bank loans and bonds is not as clear as it used to be (Thomas and Wang 2004).
For example, the growth of the syndicated loan market has increased the amount of diversification of
lenders (Benmelech, Dlugosz and Ivashina 2013). We discuss what our model predicts about syndicated
loans below.

7
The coexistence of two such institutionally different credit supply channels (banks and
fixed income markets), providing similar financing to firms, has been considered puzzling.
Fama (1985) suggests that banks face costs that markets do not, and that their existence and
importance is a sign of some countervailing advantage that banks must have. 12 Academic
research has largely proceeded on the assumption that the main challenge in understanding
credit is to identify the advantages banks have (over credit markets), permitting them to exist in
the face of their higher costs. One possible such advantage is that firms raising debt from banks
economize on the reporting, regulatory and underwriting costs associated with issuing public
debt (Bhagat and Frost 1986, Smith 1986, Blackwell and Kidwell 1988, and Carey et al 1993).
These are largely fixed costs (e.g. you have to file a 10-K regardless of amount of public debt). If
fixed costs are significant, small firms will borrow from banks and large firms issue bonds,
based on cost minimization.13
Another possible advantage of banks over bond markets is their ability to produce
information about borrowers. This information production allows them to perform both ex-ante
screening and ex-post monitoring of corporate borrowers.14 Theories of information advantages
predict that firms which require monitoring will rely on bank loans, whereas those that are
sufficiently well known, because they are large (Fama 1985) or because they have a good track
record of repaying debt (Diamond 1991), can turn to bond markets.
The group of theories that start from banks’ costs disadvantage - both those based on
scale and those based on information - predict a strong link between firm size and the form of
debt: small firms will rely exclusively on bank debt, whereas large firms will exclusively use the
bond market. This matches a well-known stylized fact: small firms rely exclusively on banks
and larger firms are more likely to issue bonds (Hale and Santos 2002, and Petersen and Rajan
1994). Also, older firms are more likely to use bonds (Johnson 1997, and Rajan 1992). However,
these theories struggle to explain the co-existence of bank loans and bonds in firms’ capital
structures. In our sample, covering 37 countries for a ten-year period, this is widespread: 84% of
12 These costs may include low returns on required reserves (Black 1975), other costs of regulatory limits
to risk taking and operations, the costs of operating a branch network (Besanko and Kanatas 1993,
Holmström and Tirole 1997) and agency costs between banks and depositors (Diamond 1984). 13 The fixed costs of bond market participation may include underwriting fees, fees to credit rating
agencies, as well as trust and legal fees. Of course, bank borrowing may also entail some fixed costs. 14 Information-based theories of banks include Diamond (1984, 1991), Besanko and Kanatas (1993) and
Boot and Thakor (1997) (banks monitor or screen borrowers), Petersen and Rajan (1994) (lenders gather
information about their borrowers over time); Repullo and Suarez (1998) (banks provide a sharper threat
of liquidation) and Bolton Freixas 2000 (banks have a superior ability to renegotiate). See James (1987),
Houston and James (1997) and Hadlock and James (2002) for evidence consistent with the existence of
informational advantages for banks.

8
firms with bonds outstanding also have bank debt on their balance sheet.15 Thus, these theories
are unable to completely match the key empirical patterns. As pointed out in the introduction,
this does not reject an informational advantage of banks, but suggest other forces must also be
relevant.
Several theories consider the role of default and firm’s debt mix. Gertner and Scharfstein
(1991), Bolton and Scharfstein (1996), Berglöf and von Thadden (1994) and Hege and Mella-
Barral (2005) all build on the idea that one dispersed creditors find it difficult to coordinate. In
some cases, this makes them ‘tougher’ because they cannot agree to be lenient when it is
individually better for bondholders to require full and immediate repayment and let others be
lenient. This coordination failure can dissuade firms from strategic default and allow creditors
to extract value from distressed firms. Our model builds on this literature in that we focus on
the role of creditor bargaining power in distress. We differ in that we assume that concentrated
creditors are at a negotiating advantage. This is the key point of difference in our model, and
deserves some motivation. Grossman and Hart (1980) introduced the nature of the problem. In
their model, small shareholders can free-ride on a potential raider's improvement of a firm,
thereby seriously reducing the raider's profit. Gertner and Scharfstein (1991) utilized the same
coordination problem among creditors of a distressed firm, predicting that small creditors can
extract value from such firms by being tougher. Much of the literature has stayed with such
strong, dispersed vs. soft, concentrated creditors. However, others point out that being small
(e.g. less likely to be pivotal) and uninformed can be a disadvantage when negotiating. Berglöf,
Roland and von Thadden (2000) and Bris and Welch (2005) show how large creditors may be
strong vis-à-vis management. We make a parallel argument that large creditors may be strong
vis-à-vis dispersed creditors through better information about the creditor and it’s liabilities,
through more experience and understanding of both formal law and informal insolvency
practices, as well as through avoiding coordination costs when acting.16 We provide supportive
evidence for bondholders’ weak ex-post bargaining position below. Using Moody’s default
data, we document that bondholders often suffer larger losses than banks in restructurings,
both in formal bankruptcy and out-of-court, holding seniority fixed.
Hackbarth, Henessy and Leland (2007) offer a model which, like ours, considers the
effect of different bankruptcy rules on the debt mix. Their model also sees bankruptcy as
important in part because it establishes out-of-equilibrium threat points for out-of-court
renegotiations. Hackbarth et al model a firm which can have bank loans and bonds, and which
15 This is consistent with Johnson (1997), who reports that “41% of firms with access to public debt
markets have some long-term bank debt” in a smaller and older sample of US firms. Becker and Ivashina
(2013) report that new bank loans are frequent in their sample of firms with recent bond issues. 16 We do not assume a bank advantage directly. Rather, we explicitly consider the strategic interaction
between multiple creditors the bargaining position derives from more primitive assumptions.

9
may become distressed. The firm's debt level is determined by a tradeoff between taxes and
bankruptcy costs, and its debt mix by the lenders' relative flexibility in times of distress. More
precisely, it is assumed that bond holders cannot make concessions, but that the (single) bank
has a unique ability to renegotiate the terms of loans outside of bankruptcy. This gives bank
debt a relative advantage of imposing lower distress costs on the borrower. Thus, by
assumption the model favors bank debt. However, distressed firms can have weak or strong
bargaining power in an out-of-court restructuring. If a firm has strong bargaining power, it can
capture the entire surplus in excess of the bank’s bankruptcy payoff. This limits the amount of
bank financing and forces the firm to obtain additional funds from bond investors. The key
driver of firms’ debt mix is the extent of absolute priority (APR) violations in bankruptcy. If the
bankruptcy process is soft, in the sense of allowing substantial absolute priority violations, then
firms chose a higher fraction of bond financing. This model, like ours, predicts that small firms
initially use bank debt but resort to a combination of bank loans and bonds as they grow larger.
However, there are several important differences between the models. First, the inability
of bond holders to make concessions out of court in the model of Hackbarth et al is in line with
the literature that gives bondholder strong bargaining power. As we have argued above, we
think this is usually a poor description of distressed debt negotiations out-of-court, and build
our model on a contrary intuition. Second, the two models make different predictions about
which features of bankruptcy law matter or debt markets. Our model predicts that, firms will
rely more on the bond market in countries with efficient bankruptcy (in the Djankov et al sense
of producing high aggregate payoffs). In Hackbarth et al, the key driver of corporate debt mixes
is APR violations. A “tough” system which doesn’t allow APR violations – they use German
and British bankruptcy as examples – is good because it limits the ability of firms and
bondholders to take advantage of banks. Their prediction is that “soft” bankruptcy systems –
their example is the US – will have more bonds. Given the Djankov et al findings of low overall
recoveries in many countries, we believe that our model examines the most important issue in
the broad cross-section of countries, while APR violations may well be a key issue among the
smaller set of countries with really good aggregate outcomes. Because of lack of a good cross-
country measure of APR violations, we do not offer a formal test of Hackbarth et al’s
predictions.17 In summary, while we find support for our model’s predictions, which is absent
from the Hackbarth model, our empirical results do not reject that model’s predictions
regarding the role of APR violations.
17 Bris, Welch and Zhu (2006) report that APR violations in Chapter 11 are a smaller than they used to be.
This would seem to suggest an increasing bank share in US corporate debt under the Hackbarth et al
model. Our data set is to short to allow a test of this.

10
2. Theory
In this section, we model a firm's choice of debt structure in a static model with multiple
risk-averse banks and a corporate bond market. Initially, a profit-maximizing firm has a
decreasing demand for capital, , where is the interest rate. Subsequently, the debt comes
due. With probability , where , the firm is solvent (it can repay the debt with interest
in full) and with probability it is insolvent. An insolvent firm’s debt has to be restructured,
either through a formal bankruptcy or an out-of-court restructuring. This process is described in
more detail below.
The firm can initially obtain financing by borrowing from banks and/or by issuing
corporate bonds to dispersed risk-neutral investors. The bond market consists of a measure
of atomistic risk-neutral bond investors. Each bond investor is willing to supply exactly one unit
of capital at any interest rate that gives him or her an expected return greater than or equal to
the risk-free rate . We will denote the interest rate at which bond investors earn zero
expected return by and assume that , i.e. bond investors can satisfy all of
demand at this rate.
There are identical banks in the market, each with a funding cost of per unit of
capital.18 Moreover, each bank is assumed to behave as if it were maximizing expected utility
given an increasing and concave twice continuously differentiable utility function and with
initial wealth . The assumption of concave utility reflects the idea that making large loans
exposes banks to idiosyncratic risks which they do not like. This concavity can reflect owners’
preferences, managerial risk aversion, or be due to regulatory capital requirements.19 To
guarantee the existence of an increasing loan supply function, we also assume that the
associated relative risk aversion is non-increasing and no greater than one for positive wealth
levels. Finally, we assume banks’ marginal utility tends to infinity as their wealth tends to zero
from above, and to zero as wealth tends to infinity.
To avoid dealing with rationing among banks, we assume that each bank can lend a
maximum of . This implies that the interest rate will be equal to in equilibrium. We
may therefore simplify notation by suppressing the dependency of and writing instead of
as long as we do not vary the parameters affecting .
18 The results in the paper also apply if we allow banks to have access to cheaper financing than bond
investors, which could be the case in the presence of deposit insurance and other guarantees of bank debt
by government institutions. Deposit insurance is now very widespread (Demirgüç-Kunt and Kane 2002).
Merton (1977) and O’Hara and Shaw (1990) discuss the value of bank guarantees in theory and in data. 19 Ivashina (2009) provides empirical evidence for the importance of bank risk aversion in syndicated
lending.

11
We assume that the firm’s managers (or owners) chose the debt mix in order to
minimize the interest rate , i.e. the repayment they must make in case the firm remains solvent
and makes good on its liabilities. In contrast, how much is paid to various claimants in a
restructuring scenario (where owners get nothing) does not enter into their decision making.
We will also assume that bank financing is preferred if interest rates are equal.
We now describe the restructuring game that takes place if the firm cannot repay its
debts. The firm can either be liquidated or continue operating. Exactly one of these solutions is
optimal in the sense of offering higher total payoffs, but which depends on the individual firm.
If the optimal action (say liquidation) is undertaken, the value of total claims is , and if
the suboptimal action (in this case continuing operation) is undertaken, the value of claims is
, where
Resolution in case of insolvency can either happen through formal bankruptcy, executed
by a bankruptcy court, or through an out-of-court restructuring. We assume that in such a
resolution, all creditors (lending banks and bond holders) first learn whether the bankruptcy
court will make an optimal liquidation decision or not. Ex ante, the court's decision is optimal
with probability , where , and suboptimal with probability . We model
bankruptcies this way to capture the propensity for inefficient liquidation decisions
documented by Djankov et al (2008) across a wide range of countries.
Out-of-court restructuring requires unanimity, and any creditor can force bankruptcy. In
the absence of unanimity, the firm is put into a formal bankruptcy. In a bankruptcy, the
bankruptcy court decides between liquidation and continuing operations. The priority of claims
is maintained in a bankruptcy, so that if an optimal solution is implemented, each bank with a
loan of obtains and the set of bond holders , where is the sum of all
bank loans. We abstract from security and collateral and other contractual determination of
priority in bankruptcy.20
In an out-of-court restructuring, the optimal liquidation decision is always implemented.
The value to be distributed among creditors is minus an arbitrarily small transaction
cost, proportional to . The creditors simultaneously decide whether to take an active part in
the reorganization, at an arbitrarily small fixed cost 0, or remain passive. This cost may
represent costs of expert advice, time and effort required to participate actively, or more
abstractly, coordination costs. Passive creditors will be offered their outside option, i.e. what
20 In practice, bank debt is often senior to bonds. Allowing this would complicate the model. As long as
the advantage of banks is larger outside of court than in court, the direction of results will maintain.
Granting bonds seniority over banks in bankruptcy would change the model’s predictions. Though
uncommon in practice, we discuss this possibility in more detail below.

12
they would have earned in a bankruptcy.21 We assume that active creditors share the remaining
surplus in a pro rata fashion. If no creditor takes an active part, bankruptcy takes place.
We do not explicitly model the bargaining between creditors, but argue that the stylized
game described above can capture outcome of such a bargaining. The time line of the game is as
follows:
1. Banks and bond investors simultaneously announce how much they are willing to lend
to the firm at bond-investors break-even rate .
2. If the firm is insolvent, its creditors learn whether the bankruptcy court will make an
optimal (probability ) or suboptimal (probability ) decision.
3. The creditors simultaneously choose whether to file for bankruptcy or perform an out-
of-court restructuring. If there is a veto against the restructuring, a bankruptcy with pro
rata allocation takes place and the game ends.
4. If there is no veto against the out-of-court restructuring, the creditors decide whether to
take an active part in the restructuring, at a small fixed cost , or not. Passive creditors
receive their outside option, i.e. the bankruptcy payoff, and active creditors share the
surplus in a pro rata fashion.
A key assumption of this model is that bargaining power is unimportant in bankruptcy.
We have in mind the fact that bankruptcy offers a highly structured environment whose formal
rules aim to quickly reorganize a firm’s debts, and to protect the firm’s integrity. By
comparison, an out-of-court restructuring is much less organized. Gilson (1997) points to
several factors that make it easier to reach a viable solution in court, including rules that reduce
creditors’ ability to block reorganization plans, and mandatory disclosure which reduces
information asymmetries. Such features of the bankruptcy law are widespread. For example,
Djankov et al (2008) report that 82% of countries have some kind of automatic stay on a
bankrupt firm’s assets. For these reason, we abstract completely from bargaining dynamics in
bankruptcy, and assume that different debts get treated similarly.
The other key assumption in this model is that banks have stronger bargaining power
than bond investors. This advantage can reflect the fact that bank loans are held in more
21 This could be motivated by a dynamic bargaining model where it is so costly or take so long to present
a revised out-of-court restructuring proposal that the discounted value of the firm is less than what
would have been obtained in bankruptcy. In the theoretical takeover literature there are several examples
of models where small shareholders accept offers below the post-takover value per share. Among these
are models where the bid is conditional on the squeeze-out threshold (Yarrow 1985; Amihud et al. 2004),
models with debt-financing (Mueller and Panunzi 2004), asymmetric information (At. et al 2007), and
mixed strategies of shareholders (Bebchuk 1989).

13
concentrated positions than bonds, providing stronger incentives to monitor.22 Banks may also
be better informed than other creditors. Loan agreements sometimes include reporting
covenants and visitation rights (but bonds do not tend to have such covenants). Bank loans
often have more stringent default definitions, meaning that defaults occur earlier for loans than
for bonds, giving banks a first mover advantage in distress. Finally, banks tend to be
experienced in handling distress, and typically have departments devoted to loan workouts.
Although plausible for the above reasons, our assumption that bondholders suffer in out-of-
court restructurings is untested. We examine the assumption’s realism by comparing bond and
bank loan outcomes in defaults that take place in and out of court. Using Moody’s Default and
Recovery Database (DRD), we calculate the frequency with which recoveries deviate by more
than 10% points from what would have obtained had absolute priority been respected. We do
this for the US because data coverage is good (when a restructuring does not involve any rated
securities or loans, Moody’s is less likely to capture it). Figure 2 reports the frequency of
deviations in bankruptcy and out of court, for senior bonds (i.e. bonds which are not
subordinated) and (senior) bank loans. Whereas bank loans quite often experience APR
violations in bankruptcy (27% of the time) they very rarely do out of court (7%). Bonds are
marginally more likely to experience APR violations in court (38% vs. 27%), perhaps reflecting
factors such as banks’ willingness to offer DIP financing in Chapter 11. However, and in
contrast to bank loans, bonds are at least as likely to experience APR violations out of court.
APR violations are six times as common for bonds as for bank loans out of court. This evidence
appears consistent with our assumption that out-of-court restructurings favor banks relative to
bond holders.
2.A Results
We will look for a subgame-pefect equilibrium in pure strategies of the above game. For
simplicity, we will assume transaction costs and fixed bargaining costs are close to zero. We
proceed by solving the game backwards.
If is sufficiently small and there are banks lending to the firm, then all of them strictly
prefer to take an active part in the reorganization if the bankruptcy court would make a
suboptimal decision. If the court instead would make an optimal decision, then no creditor
would participate actively since there is no surplus to be shared.
22 Ivashina (2009) demonstrates how bank loan syndicates are designed to ensure that the lead bank has
incentives to be active.

14
If both banks and bond investors lend to the firm, then no bond investors will
participate actively in the reorganization due to the fixed cost . If only bond investors lend to
the firm, then a fraction of them will participate actively in equilibrium.23
If the transaction cost is small enough, banks lending to the firm strictly prefer
restructuring to bankruptcy in stage 3 when the bankruptcy court would implement the
suboptimal solution. Likewise, lending banks strictly prefer bankruptcy when the bankruptcy
court would make an optimal decision. Since bond holders are indifferent, there is subgame-
perfect equilibrium where reorganization takes place when the bankruptcy court is inefficient
and bankruptcy when it is efficient. We will henceforth focus on this equilibrium.24
This gives us three payoff-relevant events (gross payoffs reported in the table):
Event Probability Bank payoff Aggregate bond payoff
Solvency
Bankruptcy
Reorganization
Using this, and defining , we will now proceed to find the equilibrium
actions in stage 1. First, we write each bank's expected payoff as:
Second, we solve for the break-even rate, , of bond investors:
In equilibrium, each bank lends an amount , which is a solution to the following
optimization problem:
This is a concave problem. We will focus on symmetric equilibria, where for all
Such equilibria are characterized by the first-order condition
where the
23 The number of active bond holders in equilibrium, , will be determined by the inequalities
, where denotes the transaction cost and the measure of bond holders.
24 The equilibrium described Pareto dominates any equilibrium where the firm goes bankrupt
irrespective of the bankruptcy court's decision.

15
inequality can be replaced by an equality for .25 There are thus two kinds of equilibria: (a)
those where only banks lend to the firm, and (b) those where both banks and bond
investors lend to the firm, .
Our first result states that there is a threshold firm size such that only banks lend to
smaller firms and both banks and bond investors lend to larger firms.
Proposition 1. There is a such that for , only banks lend to the firm, and
for both banks and bond investors.
The intuition for this result is that banks have weakly smaller capital cost, earn a higher
return than bond holders in out-of-court restructuring, and have a concave utility function.
Thus, the marginal utility from lending is positive for sufficiently small loan size, but negative
for sufficiently large loan size. Note that will depend on .
We will henceforth focus on symmetric equilibria where , such that the firm is
financed both via bank loans and the bond market. Our second result states that under quite
general conditions, the elasticity of bank loans with respect to total debt is positive, but less than
one. Hence, as demand for capital increases, bank loans increase in volume but their fraction of
total debt is decreasing. To state our result, we define the set
), i.e. an
open unit interval from which an interior interval has been removed. Note that as tends to
infinity, converges to the open unit interval.
Proposition 2.
, and if , then
.
Bank loans are increasing in demand since higher total debt implies that each bank can
extract more from the bond holders in case of out-of-court reorganization. The elasticity is
smaller than one due to banks’ concave utility function.
Our third results states that provided the fraction of bank loans is not too large,
increasing bankruptcy efficiency, as measured by , results in a lower fraction of bank loans.
Proposition 3. If and
, then
.
Increasing bankruptcy efficiency has multiple effects. First, it increases the probability of
efficient bankruptcy. Second, it reduces the probability of out-of-court restructuring. Third, it
reduces the interest rate paid if there is no default, by reducing bond investors’ break-even rate.
Fourth, it increases demand and thereby the banks’ payoff from out-of-court restructuring. The
25 We can rule out equilibria with zero bank loans since, for sufficiently small , each bank would have
incentives to deviate and offer a small loan at the interest rate .

16
first and fourth effects have positive impacts on bank loans, but they are dominated by the
negative impacts of the second and third.
Note that the conditions stated in Propositions 2 and 3 are sufficient. Numerical
solutions of the case with CRRA utility reveal that they are not necessary for the results.
Our final results concern the interaction between the bankruptcy efficiency and the
default probability. Due to difficulties in obtaining analytical results, we resort to numerical
solutions of the case with CRRA utility. We obtain the following.
As bankruptcy efficiency ( ) improves, the fraction of bond financing increases, but the
effect is more pronounced the higher the default probability. One explanation for this result is
that the equilibrium interest rate is more sensitive to changes in bankruptcy efficiency the
higher the default probability. A second explanation is that the banks’ payoff when the firm is
insolvent carries greater weight when the default probability is high.
As can be observed in Figure 3a, firms with high probability of default have a lower
fraction of bond financing than firms with a low probability of default when bankruptcy
efficiency is low, but the reverse holds if bankruptcy efficiency is high. This can be explained by
two countervailing forces: banks’ risk aversion and their bargaining advantage in out-of-court
restructuring. If bankruptcy efficiency is low, so that out-of-court restructuring carries relatively
large weight, then banks facing borrowers with high default probability have more incentives to
lend. If, on the other hand, bankruptcy efficiency is high, so that bankruptcy carries a larger
weight, then banks’ risk aversion makes them lend less to borrowers with higher default
probability.
In Figure 3b, we illustrate the relationship between the fraction of bond financing and
default probability for the case of low bankruptcy efficiency.
The key predictions of the model are that (a) the debt structure of firms that have access
to the bond market may contain bank debt, (b) the use of bonds is increasing in the efficiency of
formal bankruptcy proceedings, and (c), especially for high risk firms. These are new
predictions relative to standard models of bond and bank debt. The model is also consistent
with several existing empirical patterns. For example, our theory can explain why large firms
are so willing to shift between bond issuance and bank borrowing, as Becker and Ivashina
(2013) and Adrian, Colla and Shin (2012) document for US firms. In our theory, the marginal
cost of each kind of debt is the same for (many) large firms, so that willingness to substitute
based on small differences in price is precisely what we should expect.

17
The model presented here abstracts from seniority issues. Bank loans are often senior to
bonds through collateral rights, structural seniority (i.e. loans are issued by operating
subsidiaries while bonds are issued by a holding company), guarantees, and inter-creditor
agreements. Thus in practice, it appears that bonds would be even more disadvantaged than the
model suggests if a firm with both forms of debt enters bankruptcy. Hence, as a practical
matter, the model’s assumption is, if anything, conservative.
A more fundamental concern about seniority is why, in our model as well as in reality,
bonds are not given seniority so that they receive better treatment in bankruptcy, improving
their out-of-equilibrium payoff and thereby their bargaining outcomes in out-of-court
restructurings.
There are several possible reasons against senior bonds. A situation where the firm taps
only the bond market is conceivable, in our model, if bonds were senior, especially if banks and
bond investors had similar funding costs, but this would result in additional coordination
problems.26 Additionally, several factors that are not present in our model may also work
against bond seniority. According to our model, growing firms that enter the bonds market
always have bank debt in place. To the extent that most creditors use contractual means to
prohibit issuance of new debt of higher seniority, this timing would suggest that bank loans
would be senior.
Also, making bonds senior may not be feasible. Some countries grant banks special
treatment in the bankruptcy code.27 Finally, our model gives no pre-insolvency function for
creditors. Park (2000) argues that a single senior creditor is optimal to incentivize monitoring (of
solvent firms). For all these reasons, we believe it may be a reasonable simplification to restrict
our model to bonds that are not senior to bank loans.
Most importantly, granting bonds seniority would not solve the key problem in our
model, that banks exploit insolvency resolutions out of court to gain better payoffs. Here is
why: within the specific setting of our model, granting seniority to bonds (i.e. so that they
would be paid in full before banks could receive any payment) would indeed improve their
bankruptcy outcome. But it could not change equilibrium debt mixes much, as long as
bankruptcy remains inefficient.28 Intuitively, very poor bankruptcy payoffs (such as many
26 Given the fixed cost of participating actively in the restructuring, the restructuring game would not
have any symmetric pure-strategy equilibrium, but either an asymmetric equilibrium where only a finite
number of bond investors participate actively, or a completely mixed equilibrium. 27 For example, the French Loi de Sauvegarde, an in-court procedure for insolvent firms, gives credit
institutions (banks) stronger rights (Esquiva-Hesse 2010). 28 Additionally, in our model, bond seniority would imply transferring risk from (risk neutral) bond
investors to (risk averse) banks, raising borrowing costs.

18
countries have) lead to low overall recoveries. Giving bondholders a higher share of the payoff
cannot help much since the total to be shared is so low. Once total bankruptcy payoff is high,
insolvency is resolved in court, and our model already predicts high bond payoffs.
3. Data
We collect data on restructuring payoffs for all different claimants in bankruptcies and
out-of-court restructurings in Moody’s Default and Recovery (DRD) data base. The sample to
covers defaults occurring between 1995 and 2011. For each type of resolution (bankruptcy or
restructuring out of court), claim size and recovery amount is reported for each security or class
of securities (a security in this context may be a bank loan). Several securities may be of equal
priority. Actual recovery is compared to hypothetical recovery if the absolute priority rule
(APR) had been respected. The seniority structure reported in DRD reflects structural as well as
contractual subordination. We then calculate the frequency with which recovery rates deviate
from APR recovery by at least 10%. The sample covers a total of 698 events for 659 firms (39
firms defaulted twice). Payoffs are reported for a total of 2,644 securities, of which 2,191 were
involved in bankruptcies and 453 in out-of-court restructurings. This data is only used for
Figure 2.
We collect firm data from CapitalIQ. The data covers 2000-2011, and firms from 44
countries.29 We exclude financial firms and utilities. Data collected from CapitalIQ include
income statement and balance sheet data, S&P’s industry classification (138 unique values), the
volatility of the weekly stock price changes for the previous year, the trading volume of a firms
shares (annual, as a share of market capitalization) and corporate credit ratings from Moody’s
and S&P. There are 107,941 firm-year observations with data on debt structure and our base line
control variables.
Leverage is the ratio of debt (book value) to assets (book value). Market leverage is the
ratio of book value of debt to the sum of market value of equity and book value of debt. Market
capitalization is the log of the firms market value of equity measured in US dollars. Book to
market is the ratio of book value of equity to market value. Return on assets (ROA) is the ratio
of EBITDA to sales. Cash over assets is total liquid assets divided by lagged book assets.
We also collect measures of firms’ debt structures. We define the bond share as the ratio
of bonds (book value) to total debt. For bonds, we use commercial paper and bonds. We also
29 The 35 countries which are represented by more than 100 firm-year observations in our sample are:
Australia, Austria, Belgium, Canada, Chile, Denmark, Finland, France, Germany, Greece, Hungary, India,
Indonesia, Ireland, Italy, Japan, Korea, Luxembourg, Malaysia, Mexico, Netherlands, New Zealand,
Norway, Philippines, Poland, Portugal, Russia, South Africa, Spain, Sweden, Switzerland, Taiwan,
Turkey, United Kingdom, United States.

19
use the bank debt share, which combines term loans and revolving credit lines. For most
purposes, we do not differentiate between commercial paper and longer term bonds, and just
aggregate (commercial paper is rare and of little importance to our results). For revolvers, we
count the amount drawn down, as the accounting data does when calculating firm liabilities
(the actual debt is only the amount used). We also divide firms into investment grade and high
yield, corresponding to a median rating of BBB+ and above (IG) or BB- and below (HY). We
code ratings according to a scale from AAA=28 down to D=1, where each notch is one step.
When we lack a corporate credit rating (as we do for most firms), we estimate a linear
regression model using cash over assets, interest payments over debt, return on assets, log of
market cap (in USD), book to market ratio, stock price volatility, log of book assets, share
trading volume, year fixed effects, country fixed effects and industry fixed effects to estimate
the rating a firm would have. For the approximately nine thousand observations where we have
ratings data, the R-squared of this regression is 0.74 (0.67 without fixed effects). We truncate
estimated ratings at 1 and 28 (the limits of the actual scale), to avoid some small firms having
outlying values. Using the un-truncated value of estimated ratings does not change our
classification of firms into IG and HY, nor our regression results. We identify first-time bond
issuers as firms with no bonds outstanding at any previous time in the sample. To increase
accuracy, we exclude the first three years of the sample for tests using first-time bond issuers.
Summary statistics for various firm level variables are reproduced in Table 1, Panel A.
On average, bonds constitute 19.7% of total debt. For investment grade firms (where we use
estimated ratings in order to be able to classify all firms), bonds constitute 32.5% of debt, and for
high yield firms, 16.7%. The overall average is closer to the high yield data point because most
firms are high yield. This fact is also evident from the fact that imputed ratings are much lower
on average (12.9, i.e. B) than actual ratings (18.0, i.e. BBB-).
Summary statistics for country level variables are presented in Table 1, Panel B. A list of
some of the most important countries in our data set and their aggregate debt data are
presented in Table 2.
To examine the consequences of bankruptcy efficiency we require a measure of the
aggregate value for firms filing for bankruptcy. To avoid being tainted by selection problems,
the measure should not be influenced by which firms which actually enter bankruptcy in a
country.30 Djankov et al (2008) devised just such a measure, based on surveys of lawyers
regarding the outcome in a hypothetical bankruptcy case. Lawyers in each country were asked
to assess the outcome for all involved parties when a specific firm (a hotel) defaults on an
30 Otherwise, a country might appear to have low efficiency simply because very poor quality firms chose
to file there.

20
interest payment. Since the exact same case was considered in each country, the measure should
be free of selection issues.31 The survey has subsequently been updated by the World Bank in
the Doing Business survey, so that its data are available annually 2004-2013.32 We use 2004 data
for 2000-2003, and otherwise use each year’s data. The main variable used to portray
bankruptcy efficiency is the aggregate recovery of all creditors. The variable is measured in
cents on the dollar, and ranges from 0 (Chad and Zimbabwe, in certain years) to 94.4 (Norway,
2004). Table 1, Panel B presents summary statistics across countries. As an alternative measure
of the efficiency of the bankruptcy system in a country, we use the time in years between filing
and exit, also from the Cost of Doing Business database and based on Djankov et al. In recent
years, bankruptcy reform has been widespread and, in many countries, profound. To illustrate
this point, Table 3 describes four recent reform episodes. These episodes were all associated
with significant changes in the measures of bankruptcy efficiency we use, although in different
directions (Peru saw a drop in efficiency). Several of the episodes cover several years of new
legislation and implementation, and this is often visible in the bankruptcy outcome measure.
We collect data on creditor rights, an index aggregating creditor rights, first produced by
La Porta et al. (1998), and updated in Djankov et al. The index ranges from 0 to 4, where 4
represents stronger rights. We also collect average annual exchange rates from CapitalIQ and
translate all accounting data to USD at year-end market rates.
4. Empirical results
In this section, we examine the predictions of our model and other theories of debt
structure. First, we document broad empirical patterns in bond usage. Second, we track
individual firms around first issuance, and compare this to various types of models of debt
types. Third, we test our model’s predictions about bankruptcy and bond market development
in a multi-country panel. To address endogeneity concerns (the bankruptcy system may be
better in countries that for other reasons have larger bond markets), we use bankruptcy reforms
to identify the effect of bankruptcy through a difference-in-difference methodology.
4.A Corporate debt structures
We start by documenting some facts about firm level debt dynamics and compare them
to our model. We do this for two reasons. First, our theory makes direct predictions about firms’
debt mix. These predictions are not the main focus for us, but constitute falsifiable tests. The
model’s predictions about bankruptcy and bond markets – which we assess between countries
and over time – would seem less relevant if the model fails to match simple stylized patterns of
debt dynamics – which we can assess across firms. Second, alternative theories of debt structure
31 See Djankov et al (2008) for more detail on the hypothetical case. 32 Accessed at http://www.doingbusiness.org.

21
tend to make predictions about firm level patterns which conflict with our models’. Thus, firm
level dynamics are a way to compare models that emphasize different aspects of the bank loan-
bond comparison.
A key firm-level prediction of our model is that firms will tend to maintain the use of
bank debt even after they have access to the bond market. As discussed in detail above, many
theories of bank and bond debt predict the opposite: once a firm has access to the bond market,
it will reduce or eliminate its bank debt, because of fixed costs of some kind (i.e. bonds are
cheaper but have some requirement or fixed issuance cost). We first examine the firm-level
distribution of debt mixes. In Table 4, we examine some parameters of the joint distribution of
bonds and bank loans. We are especially interested in whether, in general, bank loans are used
by firms with outstanding bonds. We divide firm-year observations into two groups based on
whether there are any bonds outstanding. Within each group, we then calculate what number
of observations have outstanding bank loans worth at least 1%, 10% or 20% of assets. In
aggregate, 49.4% of non-bond users and 72.6% of bond users have bank loans worth at least 1%
of assets. Most firms have bank loans, but firms that use bonds are more likely to have bank
loans than those that do not have bonds outstanding. This difference (23.1% of firm-years) is
highly statistically significant. This suggests that firms tend to combine debt from different
sources, rather than use only one type. However, the 1% cutoff may be so low that we include
firms in the bank loan category that have small draw-downs on their credit lines, but for which
bank loans are actually trivial. We thus compare how frequently firms have loans worth 10% or
20% of assets. In both cases, bond issuers show significantly higher use of bank loans. This
evidence indicates that it is not uncommon for firms that use the bond market for funding to
simultaneously borrow from banks. In other words, models that predict exclusive use of a
single type of debt do not fit the data very well.
First-time bond issuers provide a particularly clear setting in which to examine the
extent to which bonds replace bank debt for an individual firms that has access to the bond
market for the first time. In our sample, there are 6,711 such first-time bond issuers between
2003 and 2011 (we lose the first few years of our sample because we require three years of
previous data to make sure a firm has not issued bonds previously or at least recently).
In Figure 4, we track the debt structure of firms around the first issuance of a bond from
year -6 to year 6, counting the year of issuance as zero. All debt categories are normalized by the
firm’s total book assets. Three striking patterns emerge. First, at first bond issue, firms increase
leverage substantially. Second, after the initial spike at first bond issue, there is a gradual
contraction both of bonds and of total leverage. Third, there is no reduction in bank debt around
first bond issues, and no subsequent reduction in bank debt over time. In other words, neither

22
the level nor the growth rate of bank debt relative to assets is typically negative around first
bond issues.
Because of the limited time span of our sample, the non-parametric analysis in Figure 4
tracks a sample that changes through time. We have fewer firms in the early and late years. This
gradual change in the composition of firms might bias the patterns in Figure 4. We therefore
estimate regressions with firm fixed effects. The year-by-year coefficient estimates (not
reported) are very similar to Figure 4. This confirms that bank debt is typically not reduced
when firms issue bonds is robust to controlling for the sample composition.33
We next consider prices. Our model predicts that there should be no reduction in the
cost of debt when a firm issues bonds for the first time. Although measuring the cost of debt is
complicated by maturity and risk considerations, following the same firm through time reduces
the concerns somewhat (as long as the maturity and risk is similar around a first bond issue).
We thus examine the 25th percentile, median average and 75th percentile of the interest costs
around first bond issuance. The results, presented in Figure 5, suggest a modest uptick in the
cost of debt when firms first issue a bond, following a slight decrease in the preceding years.
Both of these small changes are statistically significant. The increase in interest cost appears
inconsistent with predictions that bond markets should provide low interest rates (but high
fixed costs, which mostly do not appear under interest in the income statement). An important
caveat is that the large increase in leverage that we observe when a firm issues bonds for the
first time may be a cause of costlier debt service, due to increased credit risk. Table 5 presents
regression results that control time relative to bond issuance, and then add additional controls:
first firm controls, then three powers of book and market leverage. The tests reject any negative
effect of a first bond issuance on the interest cost. If anything, results with additional controls
seem to suggest that the cost of debt increases when firms issue bonds – in line with the
prediction of our model.
The results in Figures 5 and 6 show limited substitution out of bank debt for firms that
enter the bond market for the first time. A large bond issuance is followed by a gradual decline
in leverage and bond debt outstanding while bank debt is stable or slowly increasing. First,
these results point to some fixed issuance costs in bond markets, and/or large minimum
quantities, since first time bond issuance is associated with large leverage increases. Second, and
more important, the pattern we document is consistent with models in which bonds are a
marginal source of funding, used only after bank lending is exhausted or has become expensive.
This is confirmed by the cost results in Figure 5, which suggest that accessing the bond market
33 Further, unreported, robustness tests include testing for a decline in bank debt around first bond issue
for US firms exclusively, or for non-US firms exclusively. Results are similar across samples.

23
is expensive. All of these findings are consistent with or model, which suggests the introduction
of bonds into corporate debt structures will be gradual; that bonds are not particularly cheap
(even disregarding fixed costs); that bond issuers should retain a certain amount of bank debt;
and that this bank debt should in fact increase with increasing debt, although more slowly than
bond debt. Part of the findings are also consistent with the model of Hackbarth et al (although
how debt mix scales with size in their model is not as clear).
Could the observed patterns reflect maturity differences (Diamond 1993)? In other
words, bank debt may be used by bond issuers as a temporary and variable source of finance,
whereas bond debt is lumpy and adjusted rarely. We do not observe actual maturities on the
various debts, and so cannot test Diamond’s predictions directly. However, we would argue
that this force does not appear to be the major driver of the patterns in our data. First, we can
exclude credit lines, and focus exclusively on term loans, which are longer maturity, and the
pattern that bond issuers use more bank debt than non-issuers remains. Second, we can exploit
the panel nature of our data to check the variability of the sources of financing. In fact, bond
debt is no more stable than bank debt in firm capital structures.
4.B Bankruptcy and bond market development: cross-country evidence
We now test how the efficiency of in-court insolvency procedures (bankruptcy) affect
bond markets. Before turning to firm-level data, we consider some broad, aggregate patterns in
the corporate use of bonds. We sort firms into five broad categories of credit quality: AAA
through A, BBB, BB, B, and CCC through C (these groups are of comparable size). To simplify
and illuminate broad cross-country differences, we sort countries into three groups: Asia, North
America, and Europe. Of these, North America, quantitatively dominated by the US, is
characterized by very good bankruptcy system, Europe has an intermediate efficiency, and Asia
has the poorest bankruptcy efficiency (we will exploit the important within-region variation in
bankruptcy efficiency in regression analysis below). Regional averages for the recovery measure
(the average efficiency) are 79.8 (North America), 55.6 (Europe) and 35.4 (Asia). Does this
correspond to differential use of bonds? The average share of bonds (in total debt) is compared
across continents – separately for each category of credit risk -- in Figure 6. The difference
between North American and European bond shares, and their ratio, are reported at the bottom
of the figure. Clearly, the use of bonds is declining in credit quality. However, this is much less
pronounced for North American firms, while European and Asian firms almost cease the use of
bonds in the low categories. The ratio of average bond share for US firms relative to European
firms rises from 1.25 for high quality firms to 3.97 for the lowest quality firms. This implies that
some quantitatively important determinant of the size of bond markets is related to credit
quality, i.e. default risk. In particular, this pattern is consistent with our theory, which suggests
that better bankruptcy (i.e. the US) should be associated with more bonds, especially for lower

24
credit quality firms. If this pattern were absent at the very high level of aggregation, our theory
would not possibly be of much use even if it had some predictive power at the margin. Thus,
this figure establishes the relevance of our theory. That said, the test is neither very sharp (since
we have not controlled for firm or country level factors that may relate to the use of bonds) nor
necessarily very well identified (for the same reason). We next turn to regressions of individual
firm-year level observations, exploiting the full panel structure of the bankruptcy efficiency
measure (i.e. both differences between countries in the same region and between years within a
country).
Having documented that broad patterns of bond use are consistent with our model, we
will now turn to firm level data. We examine the relationship between our measure of
bankruptcy efficiency and the debt structures of firms. The firm data is in the form of a panel,
and we examine cross-sectional and time-series evidence in turn. Regression results for the full
set of firm-year observations spanning the 2003-2011 period are in Table 6. The dependent
variable is the share of bonds in individual firms’ debt structures. The independent variable of
interest is a measure of bankruptcy efficiency -- average recovery rates from the World Bank’s
Doing Business Survey. We controlling for firm level variables such as size, profitability, credit
risk and stock market valuation ratios, as well as for features of national credit markets, such as
creditor rights. The base line specification is presented in column (1). The coefficient on
bankruptcy efficiency is positive and significant at the 5% level. The positive coefficient
suggests that better bankruptcy systems are associated with increased use of bonds. This holds
controlling for creditor rights (measured at the country level). The economic magnitude is large:
a one standard deviation increase in bankruptcy efficiency (22.6) corresponds to increased bond
issuance by 5.6%, approximately a quarter of the average. If this coefficient reflects causality
running from the structure and performance of bankruptcy proceedings to bond market size
(i.e. not reflecting reverse causality or omitted variables), this is highly supportive of our
model’s key predictions. In columns (2) and (3) we separate firms based on their credit risk. The
positive coefficient on bankruptcy efficiency is slightly higher and much more significant
among low credit quality firms. In column (4), we demonstrate the same effect using the full
sample and an interaction variable that associates the impact of bankruptcy with low credit risk
firms. The coefficient estimates imply that weak firms are much heavier users of bonds when
bankruptcy is more efficient. Figure 7 illustrates the stronger effect of bankruptcy efficiency on
weaker firms by sorting firms into deciles of credit quality. As we move toward weaker firms
(lower credit quality), the effect of bankruptcy on the debt mix grows progressively stronger.
The first decile where the effect is (individually) statistically significant at the 95% level is the
fourth, corresponding to a rating of around BB-. The highest point estimate is for the weakest
decile, and the largest t-statistic for the second to lowest decile. Both Table 6 and Figure 7
emphasize the key role of credit quality in mediating how bankruptcy efficiency is associated

25
with bond use. Loosely put, strong firms issued bonds everywhere, but weak firms only do it in
countries with good bankruptcy.
The next two columns of Table 6 (5 and 6) show that an alternative measure of
bankruptcy efficiency, the time required between filing and exit from bankruptcy, produces
similar results. Finally, we exclude US firms, which constitute a large proportion of our sample.
The results, in columns (7) and (8) are similar.
By looking at the debt mix in capital structures, we can include the full sample of firms,
which gives us a large number of observations (over 120 thousand in Table 6). On the other
hand, many of these firms have a stable debt mix, and several in fact never issue bonds. Such
firms might be passively focusing on bank loans, and may never consider bonds at all. We next
use a different methodology which focuses on first time bond issues, thus isolating an
important and precise decision. We regress an indicator taking on the value 1 if a firm issues
bonds in a given year on the same set of variables used in Table 6. The sample contains all firms
which have not previously had bonds on their balance sheet (within our sample). We replicate
the set of controls for Table 6, use a linear probability model and find that riskier firms (but not
safer firms) are more likely to issue bonds for the first time in countries with more efficient
bankruptcy. A one standard deviation increase in bankruptcy efficiency (22.6) implies that the
probability of issuing bonds is higher by 0.79% for high risk firms, which can be compared to
the average probability of 4.4% per year. This result hold without US firms (columns 3 and 4).
These findings are consistent with the evidence in Table 6.
Taken together, the cross-sectional evidence suggests that countries with better systems for
organizing bankruptcy have larger corporate bond markets. Since we control both for creditor
protection and for a multitude firm variables, we conclude that this likely does not reflect some
overall leverage effect. Because of the protracted and complex nature of bankruptcy reform,
discussed above, we do not consider reverse causality a likely factor in this empirical setting.
However, bankruptcy efficiency may be correlated with other institutional features that vary
from one country to the next. In the next section, we address this identification challenge.
4.C Evidence from bankruptcy reforms
A narrower form of identification comes from bankruptcy reforms, when a country may
see changes in efficiency over time while many other institutions and rules remain the same.
Assuming that such hypothetical alternative institutions do not change at the same time, and in
the same direction, as bankruptcy efficiency, we can use reforms as natural experiments to
identify the effect of bankruptcy. The Doing Business Survey covers a ten year period
coinciding well with our firm data sample, and contains several changes in bankruptcy

26
efficiency (in both directions). These generally follow revisions of the bankruptcy code, such as
those outlined in Table 3.
We collapse data by country-year and regress bond use on bankruptcy efficiency, firm
and country fixed effects. Results are presented in Table 8. The identification now comes
exclusively from changes in bankruptcy efficiency. The positive coefficient suggests that
bankruptcy improvements are followed by increased bond use (and that changes associated
with reduced recovery tend to be followed by lower bond use, although this is rarer). This
result holds both for the average bond share and its 90th percentile, as well as for the propensity
of non-bond users to issue for the first time. These results, although based on a smaller set of
countries than the cross-sectional results, may be less affected by omitted variable bias or
reverse causality, and therefore bolster the case that a good bankruptcy system helps the bond
market.
5. Conclusions
We present a model of two forms of debt, bank debt and loans, which differ in terms of
funding costs, risk sharing, bargaining power in insolvency. From this model we derive the key
predictions that the use of bond debt is favored by efficient in-court bankruptcies, especially for
high risk borrowers.
We test the model’s predictions using a comprehensive panel of publicly listed
international firms. In accordance with the model, we find that firms that issue bonds for the
first time maintain their bank debt. We also find that a modest uptick in the cost of debt when
firms first issue a bond, following a slight decrease in the preceding years. This agrees with our
model’s predictions, but is inconsistent with models where bonds are cheaper than bank debt.
Our theory does well in matching aggregate country-level patterns. Countries with
better bankruptcy systems, based on Djankov et al. (2008), tend to have larger bond markets,
and this effect is largest for high risk firms. This effect can explain some of the large differences
in debt mix between North America, Europe and Asia.
How much larger would the bond market be if the efficiency of formal bankruptcy improved? We
can use the estimates in Table 6 to predict the effect on debt markets by bankruptcy reform. The
cross-country standard deviation in recovery is 26.7. Based on the average coefficient estimate
in Table 6, column (1), increasing recovery rates by one standard deviation everywhere would
be predicted to raise the bond share of high risk issuers by 5 percentage points (or about a
quarter of the average level of bond debt). This thought experiment may be too extreme, as
some recovery rates are already close to 100 and cannot be expected to rise much. A more
intricate thought experiment is to raise every country’s recovery rate to 80, which is close to the
90th percentile (and also close to the US, but below e.g. Singapore, Norway and the UK). In our

27
sample (which is tilted toward countries with good bankruptcy systems), the average firm
would experience an increase in recovery of 8.0 percentage points. Using the 0.180 coefficient
estimate of the impact of recovery rates on bond shares, this corresponds to a 1.4 percentage
point increase in the bond share of debt, or approximately 7% of current debt levels. Based on
total corporate debt (in our sample) of $10.2 trillion in 2010 (see Figure 1), this corresponds to
about $700 billion of new bonds.

28
References
Adrian, Tobias, Paolo Colla and Hyun Song Shin, 2012, “Which Financial Frictions? Parsing the
Evidence from the Financial Crisis of 2007-09”, FRB New York Staff Report 528.
Amihud, Y., M. Kahan, and R. Sundaram, 2004, “The foundations of freezeout laws in
takeovers”, Journal of Finance 59, 1325-1344.
At, Christian, Mike Burkart and Samuel Lee, 2011, “Security-voting and bidder screening”,
Journal of Financial Intermediation 20(3), 458-476.
Bao, J., J. Pan and J. Wang, 2011, “The Illiquidity of Corporate Bonds,” Journal of Finance 66 (3),
911-946.
Becker, Bo, and Victoria Ivashina, 2013,”Cyclicality of Credit Supply”, NBER working paper
17392.
Bebchuk, Lucian, 1989, “Takeover Bids below the Expected Value of Minority Shares”, Journal of
Financial and Quantitative Analysis, 24, 171-184.
Besanko, David, and George Kanatas, 1993, “Credit Market Equilibrium with Bank Monitoring
and Moral Hazard”, Review of Financial Studies, 6(1), pp. 213-232.
Benmelech, Efraim, Jennifer Dlugosz, and Victoria Ivashina, 2013, “Securitization without
Adverse Selection: The Case of CLOs”, Journal of Financial Economics, 106 (1), 91-113.
Berglöf, Erik, Gérard Roland and Ernst-Ludwig von Thadden, 2000, “An Incomplete-Contracts
Approach to Corporate Bankruptcy”, working paper.
Beye, Mem, and Joanna Nasr, 2008, “Repaying creditors without imprisoning debtors”, working
paper.
Bris, Arturo, and Ivo Welch, 2005, “The Optimal Concentration of Creditors”, Journal of Finance,
60(5), 2193-2212.
Bris, Arturo, Ivo Welch and Neng Zhu, 2006, “The Costs of Bankruptcy: Chapter 7 Liquidation
vs. Chapter 11 Reorganization”, Journal of Finance, 61(3), 1253-1303.
Black, Fischer, 1975, “Bank fund management in an efficient market”, Journal of Financial
Economics, 2, 323-339.
Bhagat, Sanjai, and Peter Frost, 1986, “Issuing costs to existing shareholders in competitive and
negotiated underwritten equity offerings”, Journal of Financial Economics, 15, 233-259.
Blackwell, David, and David Kidwell, 1988, “An investigation of cost differences between
public sales and Private placements of debt”, Journal of Financial Economics, 22, 253-278.
Bolton, Patrick, and Xavier Freixas, 2000, “Equity, Bonds, and Bank Debt: Capital Structure and
Financial Market Equilibrium Under Asymmetric Information”, Journal of Political
Economy, Vol. 108, No. 2, pp. 324-351.
Boot, Arnoud W. A., and Thakor, Anjan V., 1997, “Financial System Architecture”, Review of
Financial Studies 10, 693-733.
Carey, Mark, Stephen Prowse, John Rea, and Gregory Udell, 1993, “The economics of private
placements: A new look”, Financial Markets, Institutions and Instruments 2(3), 1-66.

29
Chava, Sudheer, and Amiyatosh Purnanandam, 2011, “The effect of banking crisis on bank-
dependent borrowers”, Journal of Financial Economics, 22, 253-278.
Chernenko, Sergey, and Adi Sunderam, 2012, “The Real Consequences of Market
Segmentation”, Review of Financial Studies, 25(7), 2041-2069.
Demirgüç-Kunt, Asli, and Edward J. Kane, “Deposit Insurance around the Globe: Where Does It
Work?”, Journal of Economic Perspectives, 16(2) , 175-195.
Denis, David J., and Vassil T. Mihov, 2003, “The choice among bank debt, non-bank private
debt, and public debt: evidence from new corporate borrowings”, Journal of Financial
Economics, 70(1), October 2003, Pages 3-28.
Diamond, D., 1984, “Financial Intermediation and Delegated Monitoring”, Review of Economic
Studies, 51, 393-414.
Diamond, D., 1991, “The Choice Between Bank Loans and Directly Placed Debt”, Journal of
Political Economy, 99, 689-721.
Djankov, Simeon, Caralee McLiesh, and Andrei Shleifer, 2007, “Private Credit in 129
Countries.” Journal of Financial Economics, 84, 299–329.
Djankov, Simeon, Oliver Hart, Caralee McLiesh, and Andrei Shleifer, 2008, “Debt Enforcement
around the World”, Journal of Political Economy, 116 (6), December, 1105-1149.
Doing Business, 2013, “Doing Business 2013 - Smarter Regulations for Small and Medium-Size
Enterprises”.
Esquiva-Hesse, Sandra, 2010, “Protection for Companies under French Bankruptcy Law”, in
Barnes, Timothy, Donald Macfarlane, Kristian Andersson, Michael Gregersen, Benjamin
Monclus, Sandra Esquiva-Hesse, Richard Nevins , and Leo Plank, eds, Bankruptcy Law
Client Strategies in Europe: Leading Lawyers on Analyzing the European Bankruptcy Process,
Developing Creative Strategies for Clients, and Understanding the Latest Laws and Trends
(Inside the Minds), Thomson West, Aspatore Books 2010.
Fama, Eugene, 1985, “What's different about banks?”, Journal of Monetary Economics 15, 29-39.
Gertner, Robert and David Scharfstein, 1991, “A Theory of Workouts and the Effects of
Reorganization Law”, Journal of Finance, 46(4), 1189-1222.
Grossman, Sanford J., and Oliver Hart, 1980, “Takeover Bids, The Free-Rider Problem, and the
Theory of the Corporation”, Bell Journal of Economics, 11(1), 42-64.
Hackbarth, Dirk, Christopher A. Hennessy, and Hayne E. Leland, 2007, “Can the Trade-off
Theory Explain Debt Structure?”, The Review of Financial Studies, 20(5), 1389-1428.
Hadlock, Charles J., and Christopher James, 2002, “Do Banks Provide Financial Slack?“, Journal
of Finance, 58(3), 1383-1419.
Hale, Galina and João A.C. Santos, 2008, “The decision to first enter the public bond market:
The role of firm reputation, funding choices, and bank relationships”, Journal of Banking
& Finance, 32, 1928–1940.

30
Hege, U., and P. Mella-Barral, 2005, “Repeated Dilution of Diffusely Held Debt”, Journal of
Business, 78, 737–86.
Holmström, Bengt, and Jean Tirole, 1997, “Financial Intermediation, Loanable Funds, and the
Real Sector”, Quarterly Journal of Economics, 112(3), 663-691.
Houston, Joel, and Christopher James, 1997, “Bank Information Monopolies and the Mix of
Private and Public Debt Claims”, Journal of Finance, 51( 5), Dec., 1863-1889.
James, Christopher, 1987, “Some evidence on the uniqueness of bank loans”, Journal of Financial
Economics 19, 217-235.
Jiménez, Gabriel, Steven Ongena, Jose-Luis Peydro and Jesus Saurina Salas, 2012, “Credit
Supply and Monetary Policy: Identifying the Bank Balance-Sheet Channel with Loan
Applications”, The American Economic Review, Volume 102, Number 5, August, 2301-
2326.
Johnson , Shane A., 1997, “An Empirical Analysis of the Determinants of Corporate Debt
Ownership Structure”, Journal of Financial and Quantitative Analysis, 32(1), 47-69.
Kroszner, Randall, and Philip E. Strahan, 1999, “What Drives Deregulation? Economics and
Politics of the Relaxation of Bank Branching Restrictions”, Quarterly Journal of Economics,
114(4), 1437-1467.
Kashyap, A., J. Stein, and D. Wilcox, 1993, “Monetary Policy and Credit Conditions: Evidence
from the Composition of External Finance”, American Economic Review 83, 221-256.
LaPorta, Rafael, Florencio Lopez-de-Silanes, Andrei Shleifer, and Robert Vishny, 1997, “Legal
Determinants of External Finance”, Journal of Finance, 52, 1131–50.
Merton, Robert, 1977, “An analytic derivation of the cost of deposit insurance and loan
guarantees An application of modern option pricing theory”, Journal of Banking &
Finance, 1(1), 1977, 3-11.
Marechal, Valerie, and Shahid-Saless, Rachel , 2008, “Bringing more credit to the private sector”.
O'Hara, Maureen, and Wayne Shaw, 1990, “Deposit Insurance and Wealth Effects: The Value of
Being ‘Too Big to Fail’”, Journal of Finance, 45(5), 1587-1600.
Mueller, H. and F. Panunzi, 2004, “Tender offer and leverage”, Quarterly Journal of Economics
119, 1217-1248.
Park, Cehol, 2000, “Monitoring and Structure of Debt Contracts”, Journal of Finance, 55(5), 2157-
2195.
Petersen, Mitchell, and Raghuram G. Rajan, 1994, “The benefits of lender relationships:
Evidence from small business data”, Journal of Finance, 49, 3-37.
Ponticelli, Jacopo, 2013, “Firms, Local Courts and Bankruptcy in Brazil”, working paper.
Repullo, Rafael and Javier Suarez, 1998, “Monitoring, Liquidation, and Security Design”, Review
of Financial Studies, 11(1), 163-187.
Shapley, L. S., 1953, “The Value of an N-Person Game”, In Contributions to the Theory of Games,
edited by H W Kuhn and A W tucker. Princeton, NJ: Princeton University Press.

31
Smith, Clifford W., 1986, “Investment banking and the capital acquisition process”, Journal of
Financial Economics, 15 (1–2), 3–29.
Thomas, Hugh, and Zhiqiang Wang, 2004,”The integration of bank syndicated loan and junk
bond markets”, Journal of Banking & Finance, 28(2), 299-329.
Yarrow, G. K., 1985, “Shareholder protection, compulsory acquisitions and the efficiency of the
takeover process”, Journal of Industrial Economics, 34, 3-16.

32
Appendix
Proofs
Proof of Proposition 1. Define the function
where
is the derivative of the
expected utility function. This function is continuous and strictly decreasing in over the
interval . By the definition of the break-even rate, , it follows that
for small enough . Moreover, since marginal utility tends to infinity as bank wealth
tends to zero, for sufficiently close to . Hence, there exists a unique
>0 over the interval such that =0.
Due to the concavity of the banks’ optimization program, if there is a unique symmetric
equilibrium with only bank lending for small enough. Similarly, if , so that ,
there is a unique symmetric equilibrium where each bank lends the maximum amount, ,
provided is small enough.
If, on the other hand, , then either (for ) or the utility
function is not well defined (for ). Hence there cannot be a symmetric
equilibrium with only bank financing. It remains to show that there exists a symmetric
equilibrium with bank and bond financing for such . To see this, define
. Clearly, is a continuous function of , with the property that for
sufficiently close to
and . Moreover, since the utility function has weakly
decreasing relative risk aversion smaller than one, is decreasing over the range
.
Hence, there exists a unique size of bank loan , where
, such that By the
concavity of the utility function follows that this is indeed an equilibrium for sufficiently small
.
Proof of Proposition 2. The comparative statics can be obtained in a straight-forward fashion by
applying the implicit function theorem to the symmetric equilibrium-condition
under the assumption that . The implicit function theorem is
applicable since the denominator,
is negative over
.
Proof of Proposition 3. The statement follows in an analogous fashion to Proposition 2 More
precisely, the implicit function theorem is applied to the symmetric equilibrium condition in
order to compute
, which is thereafter used to calculate
.

33
Figure 1. Debt outstanding, listed non-financial corporations, by region, 2010
The figure presents aggregate outstanding debt for publicly traded in thirty seven countries for
the fiscal year 2010, aggregated by region. Amounts are translated to dollars at year-end market exchange
rates. All numbers are in trillions of dollars. North America is Canada, Mexico, and the United States;
Europe is Austria, Belgium, Czech Republic, Denmark, Finland, France, Germany, Greece, Hungary,
Iceland, Ireland, Italy, Luxembourg, Netherlands, Norway, Poland, Portugal, Russia, Spain, Sweden,
Switzerland, and the United Kingdom; Asia is India, Indonesia, Japan, South Korea, Malaysia,
Philippines, Taiwan, and Turkey.
Europe
3.90
North America
3.85
Bonds
4.28
Bank loans
4.11
Other 2.10
Corporate debt 10.48
0.73
2.38
0.75
1.65
1.22
1.02
Asia 2.73
0.35
0.68
1.70

34
Figure 2. Absolute priority violations for senior debt in and out of court
This figure shows absolute priority violations in bankruptcy and restructurings. The
graph reports the frequency with which bonds and loans receive recovery 10% or more below
the recovery they would have received in case absolute priority had been respected. The sample
is all securities involved in US defaults between 1995 and 2011 included in Moody’s Default and
Recovery Database (DRD). The sample is restricted to senior debt. Actual recovery is compared
to hypothetical recovery following the absolute priority rule. The figure reports how frequently
deviations larger than 10% of principal occur. 95% confidence intervals for the means are
reported in bars.
7% 27% 42% 38% 0%
10%
20%
30%
40%
50%
Out of court restructuring Bankruptcy
Term loans and revolvers Corporate bonds
Frequency of APR violations

35
Figure 3. Model predictions
Figure 3a. Fraction of bond financing as a function of bankruptcy efficiency ( ) for
different default probabilities ( ). Numerical solutions based on CRRA utility with coefficient of
relative risk aversion , , , , , , and
.
Figure 3b. Fraction of bond financing as a function of the default probability ( ) for
different degrees of bankruptcy efficiency ( ). Numerical solutions based on CRRA utility with
coefficient of relative risk aversion , , , , ,
, and .
p=0.03 p=0.06 p=0.09 p=0.12 p=0.15 p=0.18 p=0.21 p=0.24 p=0.27
q=0.10
q=0.20
q=0.30
q=0.05 q=0.10 q=0.15 q=0.20 q=0.25 q=0.30 q=0.35 q=0.40 q=0.45
p=0.05
p=0.10
p=0.15

36
Figure 4. Debt structure around first issuance of bonds
The figure presents the components of debt as a fraction of total assets for firms around the year
of a first bond issue. The year in which the bond issue occurs is zero. There are 6,711 events in the sample,
corresponding to firms issuing a bond, note or commercial paper in one of the years between 2003 and
2011, but which reports no such debt outstanding in previous sample years (the full sample covers 2000-
2011). Countries with more than fifty events are: USA (2,180), Canada (875), Japan (467), India (382),
Australia (329), United Kingdom (243), Malaysia (163), France (150), Germany (127), Poland (85), South
Africa (70), Greece (68), Sweden (68), Hong Kong (63), Norway (64) and Switzerland (53).
0%
5%
10%
15%
20%
25%
30%
35%
40%
-6 -5 -4 -3 -2 -1 0 1 2 3 4 5 6
Bonds
Leases
Other Debt
Bank Debt
Year of first bond issue

37
Figure 5. Interest costs around first bond issue
The figure presents interest cost, calculated as the ratio of interest cost to the average of total debt
outstanding at the beginning and end of the year. Interest cost is plotted around the year of a firm’s first
bond issue in the sample. Observations where the interest cost exceeds 0.5 are excluded. There are 2,397
observations for year zero, and 283 for year -6 (the lowest number of observations). The graph shows the
average (shaded line), the median (dotted line) and the interquartile range (shaded area) of interest.
0
0.02
0.04
0.06
0.08
0.1
0.12
0.14
-6 -5 -4 -3 -2 -1 0 1 2 3 4 5 6
Interquartile range
Median interest cost
Average interest cost

38
Figure 6. Debt structure by region and credit risk category
The figure presents the share of bonds in total debt for public firms, by region and credit risk category.
Credit risk categories are based on estimated ratings using a linear regression estimate (most of the
sample firms are not rated). The figure is based on 2010 data. 95% confidence intervals, assuming cross-
sectional independence, are reported with bars around each column. * represents significantly different
from zero at the 10% level, ** at the 5% level, and *** at the 1% level.
AAA, AA
and A BBB BB B
CCC, CC and
C
US/Europe
ratio 1.25** 1.75*** 3.08*** 3.44*** 3.97***
US-Europe
difference 14.8%*** 32.5%*** 34.3%*** 23.2%*** 24.6%***
0%
10%
20%
30%
40%
50%
60%
70%
80%
90%
AAA, AA and A BBB BB B CCC, CC and C
Bonds/Debt
Estimated credit rating
Asia
Europe
America

39
Figure 7. Efficiency of bankruptcy: effect on corporate bond stock
This figure shows the estimated effect of bankruptcy recovery rates by credit quality.
Observations are sorted into deciles of credit ratings (14.3 thousand firm-years each). The effect
of bankruptcy efficiency (the recovery rate) is estimated separately for each decile (the
regression otherwise corresponds to those reported in Table 6). This table reports the coefficient
estimate for each decile, multiplied with one cross-country standard deviation of recovery rates
(22.3). 95% confidence intervals are indicated with bars for each decile.
-5.0%
-3.0%
-1.0%
1.0%
3.0%
5.0%
7.0%
9.0%
C/D CCC- CCC CCC+ B B+ BB- BB BB+ BBB+
Predicted effect on bond share of
total debt for a standard deviation
increase in bankruptcy efficiency
Median credit rating of each decile
of credit quality (better to worse)

40
Table 1. Selected summary statistics: firm level data
Summary statistics are reported in Panel A for variables that vary by firm and year. Rating is the
corporate credit rating. For S&P, the scale is AAA=28, AA+=26, AA=25, AA-=24, A+=23 and so on down to
CCC-=9. CC=7, C=4 and D=1 (in default). When there are two ratings, the average was used. Estimated
credit ratings are based on a regression. Explanatory variables in the ratings estimation are described in
the text. Investment grade is equal to one if the estimate rating is 18 or higher. In Panel B, cross-country
summaries of variables from the World Bank’s cost of doing business survey, covering 169 countries, are
reported. Each country-year is one observation for the purpose of calculating summary statistics here.
Only 44 countries are represented in our firm sample, and we also report summary statistics across this
subsample.
Panel (A) Firm variables
Mean Std.
dev.
Min 25th
perc.
Median 75th
perc.
Max
Bond share in debt 0.197 0.324 0 0 0 0.291 1
Bond share in debt, IG firms 0.325 0.360 0 0 0.175 0.649 1
Bond share in debt, HY
firms
0.167 0.307 0 0 0 0.178 1
Bond share in debt, ex-US 0.136 0.263 0 0 0 0.137 1
Rating, actual 18.0 3.7 1 15 18 21 28
Rating, estimated 12.9 4.6 1 10.0 13.4 16.1 28
Investment grade 0.167 0.373 0 0 0 0 1
Panel (B) Country variables
Mean Std.
dev.
Min 25th
perc.
Median 75th
perc.
Max
Bankruptcy recovery 36.1 22.6 0.0 20.8 31.6 44.4 92.5
Bankruptcy time (years),
2010
2.90 1.41 0.4 1.9 2.8 4 8
Bankruptcy recovery,
sample countries
56.5 26.7 4.4 34.1 64.2 80.2 92.5
Bankruptcy time, sample
countries
2.12 1.43 0.4 1.1 1.8 3 6.5

41
Table 2. Debt structure by country 2011
Summary statistics by country, for 2011. Total bond debt, total bank loans, and total other debt
are translated to US$ at the year-end market exchange rate and summed up for all firms with available
data. In the last two columns, only firms include in the regression sample (i.e. with data available for all
firm level variables) are included. For space reasons only countries with over 100 sample firms in 2011 are
included.
Country Total bond
debt, $b
Total bank
loans, $b
Total other debt,
$b
Sample firms,
number
Sample firms,
average share
bond debt
Australia 84.7 80.7 17.9 532 11.5%
Canada 209.5 64.9 27.1 859 30.0%
Chile 30.5 34.4 2.9 104 23.2%
Finland 16.4 25.2 10.9 102 15.9%
France 356.6 182.1 112.5 445 14.4%
Germany 334.7 168.2 99.6 414 15.0%
Great Britain 313.8 114.2 54.7 623 16.2%
India 47.6 265.1 42 1,695 4.0%
Indonesia 11.3 30.1 -0.3 152 13.4%
Italy 138.7 130.2 45.4 184 8.2%
Japan 481.3 1,254.10 121.8 2,487 8.1%
Malaysia 17.9 52.5 5.7 661 5.9%
Norway 32.4 30.2 10.5 105 19.5%
Philippines 12.8 20.8 7.8 120 15.6%
Poland 5.3 16.5 1.2 252 7.7%
South Africa 13.6 26.8 12.9 173 9.8%
South Korea 36 29.1 15.9 900 1.5%
Spain 89.3 170.9 35.3 100 5.9%
Sweden 44.3 56.4 12.4 232 10.4%
Switzerland 150.3 43.8 17.8 152 28.5%
Taiwan 29.3 194.5 10.5 1,086 11.9%
USA 2,429.0 443.8 408.4 2,357 43.0%

42
Table 3. Bankruptcy reform examples
This table presents brief summaries of four selected reform examples. Each of these
corresponds to a change in bankruptcy efficiency.
Country Reform summary
Brazil A new bankruptcy law aiming to allow viable firms to reorganize and survive was
passed in 2004. Key features were a stronger role for creditors, limitations to the
size of labor claims in bankruptcy, and reduced priority for tax claims. Going
concern sales free and clear of tax and labor liens and liabilities were introduced
by the new law. Bankruptcy times fell by half over subsequent years.
See Ponticelli (2013).
Italy Prompted by the Parmalat scandal and a couple of other large firm failures, a
number of reforms were implemented to Italian bankruptcy and insolvency rules
between 2004 and 2007. Notably, creditors were allowed to reach a deal with
creditors outside of bankruptcy; the minimum requirements for a reorganization
(instead of a liquidation) were reduced; the creditor’s committee gained more
influence in proceedings; it removed limits to operations while in bankruptcy. The
Italian reforms dramatically reduced backlogs and reduced the frequency of
liquidation. See Beye and Nasr (2008).
Poland Poland recently undertook a number of procedural and operational reforms to
facilitate the resolution of insolvency. Features include: changed documentation
requirements for bankruptcy filings; increased qualifications for administrators;
limiting pay for administrators. Improved electronic systems to processes cases
and assign them to judges as well as to improve the operations of courts were
introduced over the 2004-2007 period, reducing case backlogs. The civil procedure
was amended in 2012, eliminating separate procedural steps in commercial cases.
Poland has also reformed insolvency law, notably introducing a reorganization
procedure. Secured creditors have also received stronger rights.
See Doing Business (2013).
Peru Peru undertook a range of reforms to improve credit availability to the private
sector during the early 2000-s. For example, security interests were vastly
simplified and out-of-court resolution facilitated. The implementation of the
reforms were problematic. Also, amending and adjusting a reorganization plan
became more difficult. These issues resulted in a reduction of bankruptcy
efficiency around 2007. See Marechal and Shahi-Saless (2008).

43
Table 4. Coexistence of bank loans and bond debt
The table reports the frequency of firm-years having or not having bonds outstanding having bank loans above 1%, 10% or 20% of assets. The
difference in the propensity to have bank debt above the threshold between bond and no bond observations is reported below each box. *
represents significantly different from zero at the 10% level, ** at the 5% level, and *** at the 1% level.
Among firm-years
with….
…the fraction
with bank debt
≥ 1% assets is:
…the fraction
with bank debt
≥ 10% assets is:
…the fraction
with bank debt
≥ 20 % assets is:
No bond debt (131,944) 49.4%
<10% 35.9%
<20% 25.5%
Bond debt (62,370) 72.6%
>10% 49.5%
>20% 31.5%
Difference: 23.1%***
13.7%***
5.9%***

44
Table 5. Interest costs around first bond issue
The table presents results for regression of interest cost (the ratio of interest cost to the average of
total debt outstanding at the beginning and end of the year) on controls. Leverage is book value of debt to
book assets. Market leverage is book value of debt to the sum of market value of equity and book value of
debt. Market capitalization is the log of the firms market value of equity measured in US dollars. Book to
market is the ratio of book value of equity to market value. Return on assets is the ratio of EBITDA to
sales. Cash over assets is total liquid assets divided by lagged book assets. The regression includes
indicators for year relative to bond issues, from -6 to 6, but some coefficients are suppressed.
Heteroskedasticity –robust standard errors, clustered by country, are reported below coefficients. *
represents significantly different from zero at the 10% level, ** at the 5% level, and *** at the 1% level.
Interest cost
(1) (2) (3)
Year -2 -0.003 0.003 -0.006**
0.003 0.003 0.003
Year -1 -0.005* 0.001 -0.007***
0.003 0.002 0.002
Year 0 -- omitted -- -- omitted -- -- omitted --
Year 1 -0.002 0.001 0.000
0.002 0.002 0.002
Year 2 -0.001 0.001 0.000
0.002 0.002 0.002
Market capitalization, book to market, ROA,
Dividend payer indicator, Cash to assets No Yes Yes
Third-degree polynomials in book and market
leverage No No Yes
Firm fixed effects Yes Yes Yes
N 15,451 10,513 10,513
R-squared 0.431 0.579 0.590

45
Table 6. Bankruptcy efficiency and corporate debt mix
The table shows regressions of the share of debt constituted by bonds for a multi-country sample
of public firms. Variable definitions are described in the data section. Safe firms refers to firms whose
estimated rating is above 13.86 (this is set to divide the firm-year sample in half). Heteroskedasticity –
robust standard errors, clustered by country, are reported below coefficients. * represents significantly
different from zero at the 10% level, ** at the 5% level, and *** at the 1% level.
(1) (2) (3) (4) (5) (6) (7) (8)
Sample All SAFE
FIRMS
RISKY
FIRMS
All SAFE RISKY SAFE,
ex-US
RISKY,
ex-US
Dep. var. mean 0.212 0.248 0.178 0.212 0.247 0.160 0.173 0.119
Bankruptcy
recovery
0.246** 0.210* 0.232*** 0.580*** 0.023 0.151***
0.009 0.120 0.060 0.126 0.079 0.055
Recovery * Rating -0.025***
0.009
Bankruptcy delays -0.025 -0.029***
0.015 0.009
Creditor rights -0.055** -0.043** -0.043** -0.055** -0.057* -0.045*** -0.012 -0.022*
0.022 0.016 0.016 0.022 0.030 0.019 0.014 0.011
Credit Rating -0.038** -0.029*** -0.029*** -0.016 -0.024 -0.029*** -0.016 -0.013**
0.015 0.008 0.008 0.016 0.024 0.008 0.013 0.010
ROA 0.023 0.163 0.001 0.042 0.076 -0.023 -0.077 0.053
0.122 0.197 0.056 0.113 0.192 0.048 0.148 0.068
Dividend indicator 0.052* 0.050 0.027* 0.046 0.055 0.022* 0.006 0.007
0.033 0.050 0.012 0.034 0.056 0.012 0.035 0.018
Cash/Assets 0.163*** 0.242*** 0.138*** 0.150*** 0.180** 0.122*** 0.165** 0.118***
0.031 0.079 0.016 0.032 0.084 0.017 0.078 0.027
Market cap., US$ 0.049*** 0.069*** 0.017** 0.053*** 0.047*** 0.018*** 0.022 0.007
0.015 0.022 0.007 0.015 0.021 0.006 0.019 0.009
Book-to-market -0.001 0.030 -0.021*** -0.001 0.021 -0.022*** -0.010 -0.022**
0.012 0.020 0.004 0.001 0.018 0.005 0.030 0.009
Volatility 0.001 -0.000 0.001 0.003 0.003 0.002* 0.004 0.002
0.001 0.001 0.001 0.002 0.005 0.001 0.004 0.002
Book assets 0.034*** 0.046*** 0.021*** 0.034*** 0.062*** 0.018*** 0.030*** 0.016***
0.007 0.014 0.007 0.007 0.012 0.004 0.004 0.005
Volume 0.189*** 0.223** 0.160*** 0.196*** 0.176* 0.159*** 0.050 0.116**
0.057 0.096 0.030 0.059 0.092 0.023 0.067 0.044
Year F.E. Yes Yes Yes Yes Yes Yes Yes Yes
Industry F.E. Yes Yes Yes Yes Yes Yes Yes Yes
N 123,838 61,922 61,916 123,838 46,402 46,720 50,270 44,904
R-squared 0.193 0.279 0.156 0.180 0.294 0.149 0.173 0.134
Clusters 40 40 40 40 33 38 39 34

46
Table 7. Bankruptcy efficiency and first time bond issues
The table shows regressions of the share of debt constituted by bonds for a multi-country sample
of public firms. Variable definitions are described in the data section. Safe firms refers to firms whose
estimated rating is above 13.86 (consistent with Table 6). Heteroskedasticity –robust standard errors,
clustered by country, are reported below coefficients. * represents significantly different from zero at the
10% level, ** at the 5% level, and *** at the 1% level.
First time bond issue (indicator)
(1) (2) (3) (4)
Sample SAFE FIRMS RISKY
FIRMS
SAFE, ex-US RISKY, ex-
US
Dep. variable mean 0.026 0.044 0.028 0.043
Bankruptcy recovery -0.006 0.035** 0.006 0.044***
0.010 0.016 0.010 0.017
Bankruptcy time
Creditor rights 0.101 0.141 -0.164 -0.069
0.176 0.354 0.119 0.292
Credit Rating -0.092 -0.179 -0.413* -0.241
0.234 0.161 0.219 0.222
ROA -1.957 -5.499*** -2.090 -6.060***
2.536 1.823 2.375 2.020
Dividend indicator 0.094 -0.002 0.558 0.158
0.496 0.437 0.550 0.566
Cash/Assets 0.650 -0.179 1.466 0.090
0.935 0.526 1.103 0.740
Market cap., US$ -0.396** -0.645 -0.502** -0.149
0.156 0.530 0.242 0.290
Book-to-market -0.448* -0.675 -1.129*** -1.451***
0.251 0.530 0.357 0.494
Volatility 0.014*** 0.010*** 0.014** 0.009*
0.005 0.002 0.006 0.005
Book assets 0.190 0.306 0.677*** 0.950***
0.267 0.347 0.181 0.183
Volume 0.569 1.904** 1.486 3.582**
0.761 0.775 1.018 1.450
Year F.E. Yes Yes Yes Yes
Industry F.E. Yes Yes Yes Yes
N 50,347 49,867 39,393 35,636
R-squared 0.012 0.029 0.013 0.030
Clusters 35 39 34 38
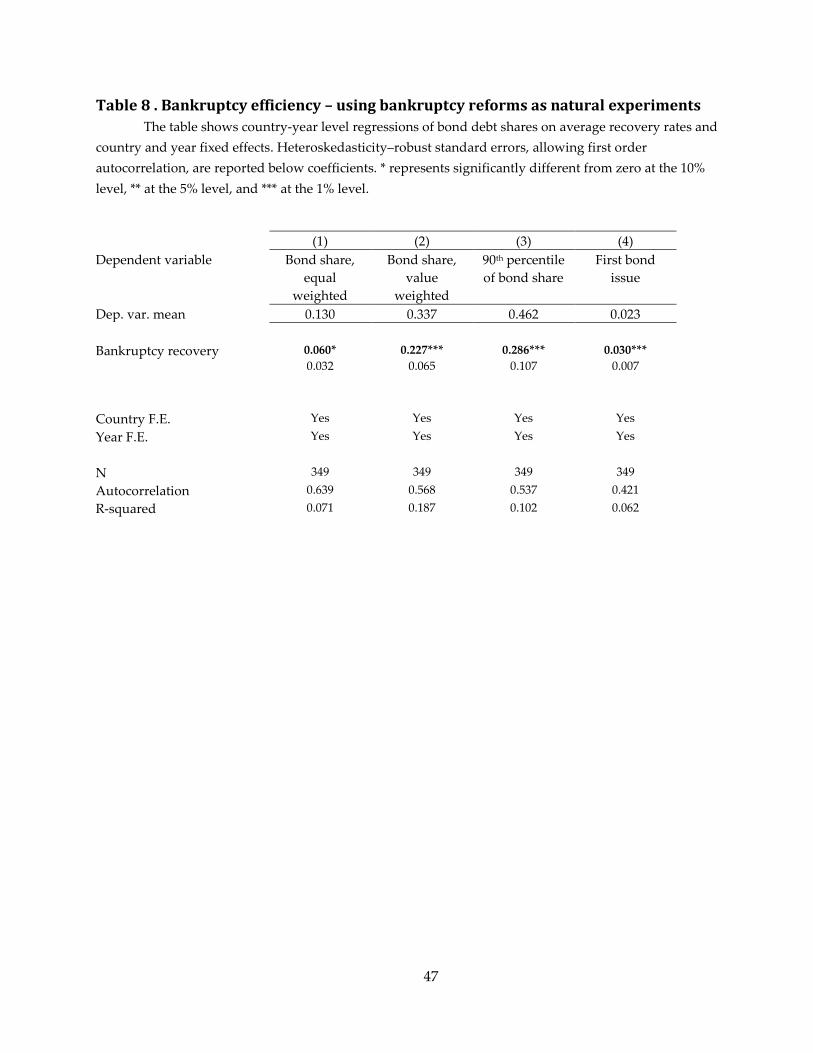
47
Table 8 . Bankruptcy efficiency – using bankruptcy reforms as natural experiments
The table shows country-year level regressions of bond debt shares on average recovery rates and
country and year fixed effects. Heteroskedasticity–robust standard errors, allowing first order
autocorrelation, are reported below coefficients. * represents significantly different from zero at the 10%
level, ** at the 5% level, and *** at the 1% level.
(1) (2) (3) (4)
Dependent variable Bond share,
equal
weighted
Bond share,
value
weighted
90th percentile
of bond share
First bond
issue
Dep. var. mean 0.130 0.337 0.462 0.023
Bankruptcy recovery 0.060* 0.227*** 0.286*** 0.030***
0.032 0.065 0.107 0.007
Country F.E. Yes Yes Yes Yes
Year F.E. Yes Yes Yes Yes
N 349 349 349 349
Autocorrelation 0.639 0.568 0.537 0.421
R-squared 0.071 0.187 0.102 0.062