Embed Size (px)
Citation preview

2017 ANNUAL REPORT
Inspired packaging. A world of difference.
Graphic Packaging Holding Company (NYSE: GPK),
headquartered in Atlanta, Georgia, is committed to providing consumer packaging that makes a world of difference. The Company is a leading provider of paper-based packaging solutions for a wide variety of products to food, beverage, foodservice, and other consumer products companies. The Company operates on a global basis, is one of the largest producers of folding cartons and paper-based foodservice products in the United States, and holds leading market positions in solid bleached sulfate paperboard, coated unbleached kraft paperboard and coated recycled paperboard. The Company's customers include many of the world's most widely-recognized companies and brands.
1Graphic Packaging Holding Company Annual Report 2017
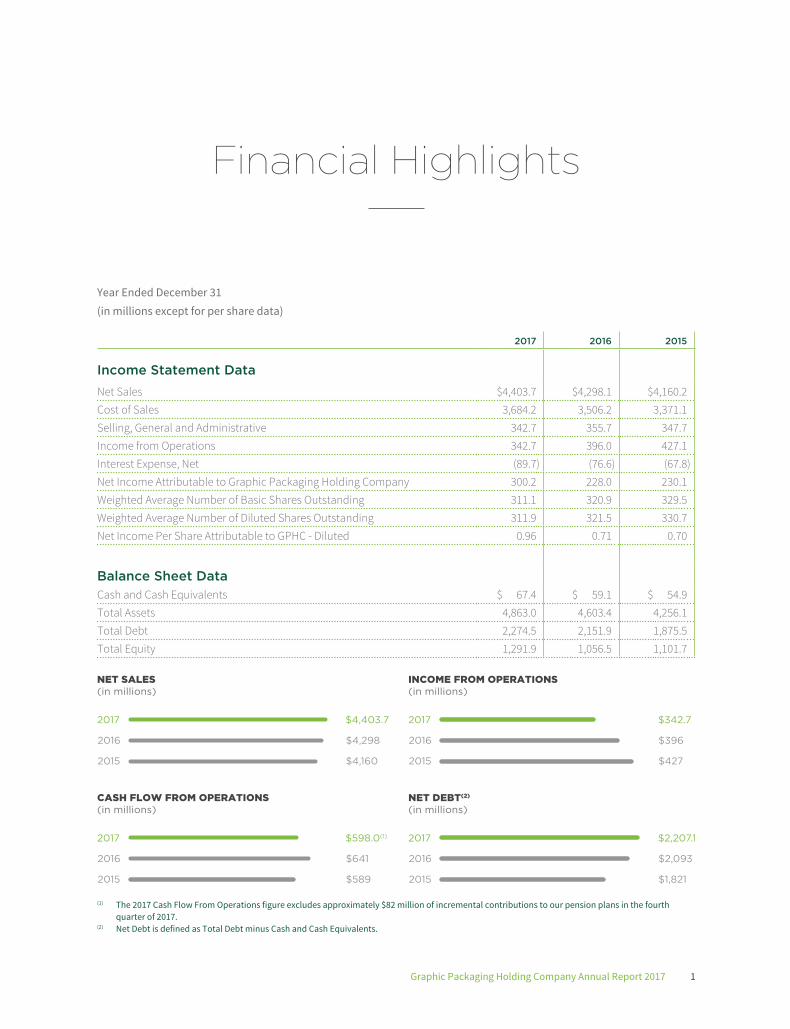
Financial Highlights
Year Ended December 31 (in millions except for per share data)
2017 2016 2015
Income Statement DataNet Sales $4,403.7 $4,298.1 $4,160.2Cost of Sales 3,684.2 3,506.2 3,371.1Selling, General and Administrative 342.7 355.7 347.7Income from Operations 342.7 396.0 427.1Interest Expense, Net (89.7) (76.6) (67.8)Net Income Attributable to Graphic Packaging Holding Company 300.2 228.0 230.1Weighted Average Number of Basic Shares Outstanding 311.1 320.9 329.5Weighted Average Number of Diluted Shares Outstanding 311.9 321.5 330.7Net Income Per Share Attributable to GPHC - Diluted 0.96 0.71 0.70
Balance Sheet DataCash and Cash Equivalents $ 67.4 $ 59.1 $ 54.9Total Assets 4,863.0 4,603.4 4,256.1Total Debt 2,274.5 2,151.9 1,875.5Total Equity 1,291.9 1,056.5 1,101.7
2017
2016
2015
$4,403.7
$4,298
$4,160
NET SALES(in millions)
2017
2016
2015
$598.0(1)
$641
$589
CASH FLOW FROM OPERATIONS(in millions)
2017
2016
2015
$342.7
$396
$427
INCOME FROM OPERATIONS(in millions)
2017
2016
2015
$2,207.1
$2,093
$1,821
NET DEBT(2)
(in millions)
(1) The 2017 Cash Flow From Operations figure excludes approximately $82 million of incremental contributions to our pension plans in the fourth quarter of 2017.
(2) Net Debt is defined as Total Debt minus Cash and Cash Equivalents.
2 Graphic Packaging Holding Company Annual Report 2017
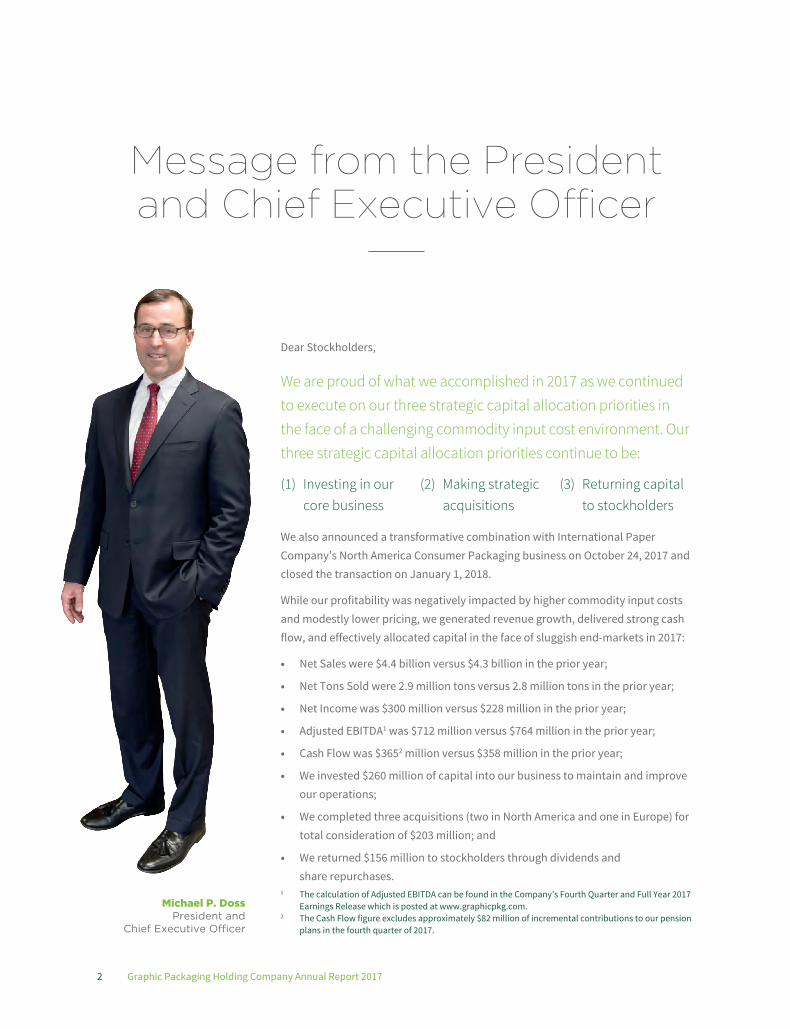
Message from the President and Chief Executive Officer
Dear Stockholders,
We are proud of what we accomplished in 2017 as we continued to execute on our three strategic capital allocation priorities in the face of a challenging commodity input cost environment. Our three strategic capital allocation priorities continue to be:
(1) Investing in our core business
(2) Making strategic acquisitions
(3) Returning capital to stockholders
We also announced a transformative combination with International Paper Company’s North America Consumer Packaging business on October 24, 2017 and closed the transaction on January 1, 2018.
While our profitability was negatively impacted by higher commodity input costs and modestly lower pricing, we generated revenue growth, delivered strong cash flow, and effectively allocated capital in the face of sluggish end-markets in 2017:
• Net Sales were $4.4 billion versus $4.3 billion in the prior year;
• Net Tons Sold were 2.9 million tons versus 2.8 million tons in the prior year;
• Net Income was $300 million versus $228 million in the prior year;
• Adjusted EBITDA1 was $712 million versus $764 million in the prior year;
• Cash Flow was $3652 million versus $358 million in the prior year;
• We invested $260 million of capital into our business to maintain and improve our operations;
• We completed three acquisitions (two in North America and one in Europe) for total consideration of $203 million; and
• We returned $156 million to stockholders through dividends and share repurchases.
Michael P. Doss President and
Chief Executive Officer
1 The calculation of Adjusted EBITDA can be found in the Company’s Fourth Quarter and Full Year 2017 Earnings Release which is posted at www.graphicpkg.com.
2 The Cash Flow figure excludes approximately $82 million of incremental contributions to our pension plans in the fourth quarter of 2017.
3Graphic Packaging Holding Company Annual Report 2017
In 2018, we remain keenly focused on executing our strategic operating priorities, specifically: recovering commodity input cost inflation through higher pricing, implementing targeted plans to outperform end-market demand trends through new product development, and generating productivity benefits that are well in excess of our labor and benefits cost inflation.
We are also well positioned to execute on our three strategic capital allocation priorities to drive top and bottom line growth.
Investing in Our Core Business
Our first strategic priority is to invest into our business where we can generate compelling rates of return on capital projects across our mill and converting systems. We generated $57 million of productivity improvements in 2017, with a significant portion of the productivity improvements driven by the $295 million of capital expenditures during 2016. We invested $260 million in the business in 2017, which we expect will drive a significant portion of our 2018 productivity.
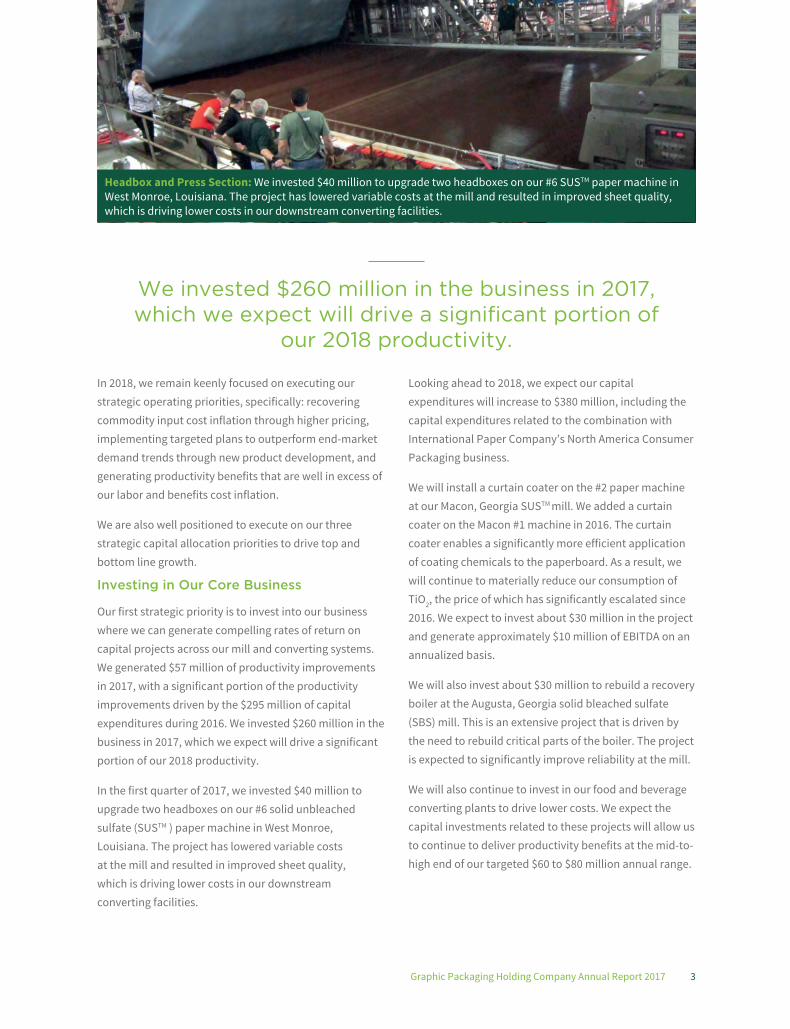
In the first quarter of 2017, we invested $40 million to upgrade two headboxes on our #6 solid unbleached sulfate (SUSTM ) paper machine in West Monroe, Louisiana. The project has lowered variable costs at the mill and resulted in improved sheet quality, which is driving lower costs in our downstream converting facilities.
Looking ahead to 2018, we expect our capital expenditures will increase to $380 million, including the capital expenditures related to the combination with International Paper Company’s North America Consumer Packaging business.
We will install a curtain coater on the #2 paper machine at our Macon, Georgia SUSTM mill. We added a curtain coater on the Macon #1 machine in 2016. The curtain coater enables a significantly more efficient application of coating chemicals to the paperboard. As a result, we will continue to materially reduce our consumption of TiO2, the price of which has significantly escalated since 2016. We expect to invest about $30 million in the project and generate approximately $10 million of EBITDA on an annualized basis.
We will also invest about $30 million to rebuild a recovery boiler at the Augusta, Georgia solid bleached sulfate (SBS) mill. This is an extensive project that is driven by the need to rebuild critical parts of the boiler. The project is expected to significantly improve reliability at the mill.
We will also continue to invest in our food and beverage converting plants to drive lower costs. We expect the capital investments related to these projects will allow us to continue to deliver productivity benefits at the mid-to-high end of our targeted $60 to $80 million annual range.
We invested $260 million in the business in 2017, which we expect will drive a significant portion of
our 2018 productivity.
Headbox and Press Section: We invested $40 million to upgrade two headboxes on our #6 SUSTM paper machine in West Monroe, Louisiana. The project has lowered variable costs at the mill and resulted in improved sheet quality, which is driving lower costs in our downstream converting facilities.
4 Graphic Packaging Holding Company Annual Report 2017
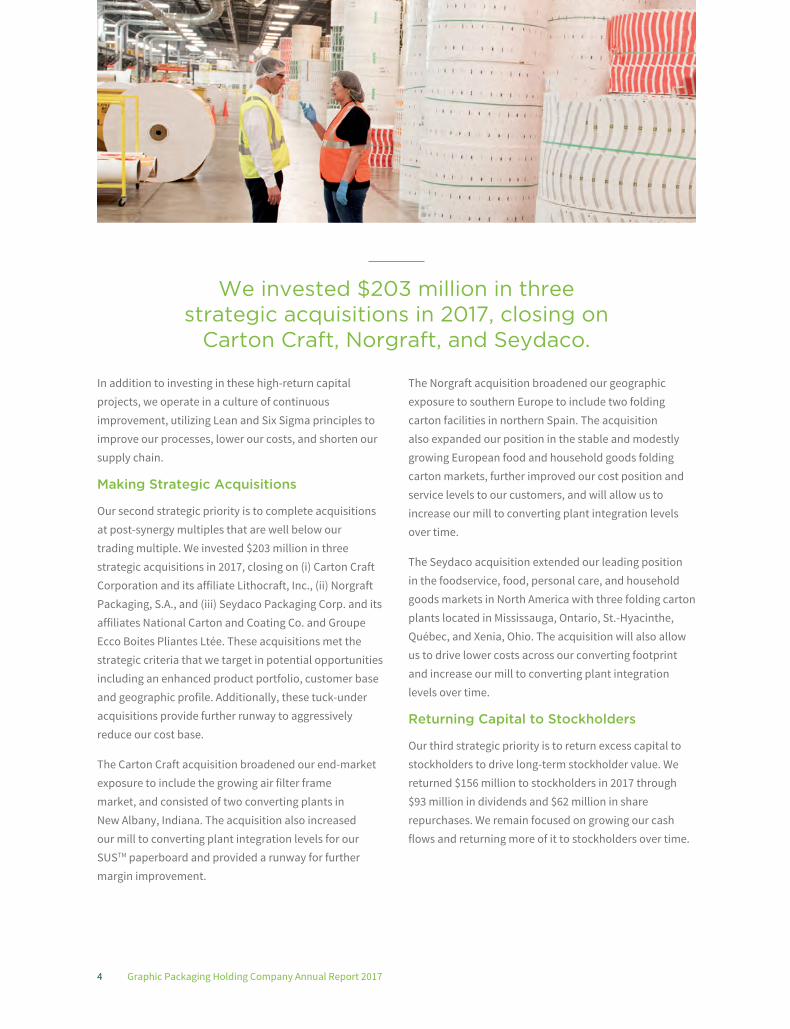
In addition to investing in these high-return capital projects, we operate in a culture of continuous improvement, utilizing Lean and Six Sigma principles to improve our processes, lower our costs, and shorten our supply chain.
Making Strategic Acquisitions
Our second strategic priority is to complete acquisitions at post-synergy multiples that are well below our trading multiple. We invested $203 million in three strategic acquisitions in 2017, closing on (i) Carton Craft Corporation and its affiliate Lithocraft, Inc., (ii) Norgraft Packaging, S.A., and (iii) Seydaco Packaging Corp. and its affiliates National Carton and Coating Co. and Groupe Ecco Boites Pliantes Ltée. These acquisitions met the strategic criteria that we target in potential opportunities including an enhanced product portfolio, customer base and geographic profile. Additionally, these tuck-under acquisitions provide further runway to aggressively reduce our cost base.
The Carton Craft acquisition broadened our end-market exposure to include the growing air filter frame market, and consisted of two converting plants in New Albany, Indiana. The acquisition also increased our mill to converting plant integration levels for our SUSTM paperboard and provided a runway for further margin improvement.
The Norgraft acquisition broadened our geographic exposure to southern Europe to include two folding carton facilities in northern Spain. The acquisition also expanded our position in the stable and modestly growing European food and household goods folding carton markets, further improved our cost position and service levels to our customers, and will allow us to increase our mill to converting plant integration levels over time.
The Seydaco acquisition extended our leading position in the foodservice, food, personal care, and household goods markets in North America with three folding carton plants located in Mississauga, Ontario, St.-Hyacinthe, Québec, and Xenia, Ohio. The acquisition will also allow us to drive lower costs across our converting footprint and increase our mill to converting plant integration levels over time.
Returning Capital to Stockholders
Our third strategic priority is to return excess capital to stockholders to drive long-term stockholder value. We returned $156 million to stockholders in 2017 through $93 million in dividends and $62 million in share repurchases. We remain focused on growing our cash flows and returning more of it to stockholders over time.
We invested $203 million in three strategic acquisitions in 2017, closing on
Carton Craft, Norgraft, and Seydaco.
5Graphic Packaging Holding Company Annual Report 2017
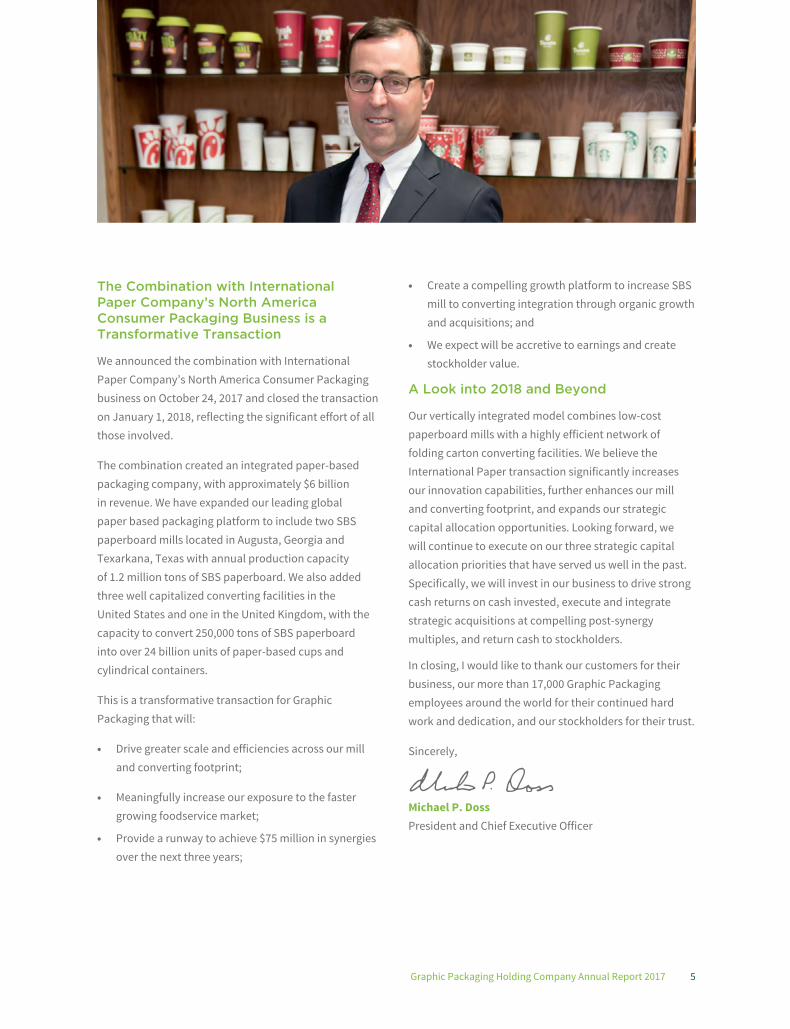
The Combination with International Paper Company’s North America Consumer Packaging Business is a Transformative Transaction
We announced the combination with International Paper Company’s North America Consumer Packaging business on October 24, 2017 and closed the transaction on January 1, 2018, reflecting the significant effort of all those involved.
The combination created an integrated paper-based packaging company, with approximately $6 billion in revenue. We have expanded our leading global paper based packaging platform to include two SBS paperboard mills located in Augusta, Georgia and Texarkana, Texas with annual production capacity of 1.2 million tons of SBS paperboard. We also added three well capitalized converting facilities in the United States and one in the United Kingdom, with the capacity to convert 250,000 tons of SBS paperboard into over 24 billion units of paper-based cups and cylindrical containers.
This is a transformative transaction for Graphic Packaging that will:
• Drive greater scale and efficiencies across our mill and converting footprint;
• Meaningfully increase our exposure to the faster growing foodservice market;
• Provide a runway to achieve $75 million in synergies over the next three years;
• Create a compelling growth platform to increase SBS mill to converting integration through organic growth and acquisitions; and
• We expect will be accretive to earnings and create stockholder value.
A Look into 2018 and Beyond
Our vertically integrated model combines low-cost paperboard mills with a highly efficient network of folding carton converting facilities. We believe the International Paper transaction significantly increases our innovation capabilities, further enhances our mill and converting footprint, and expands our strategic capital allocation opportunities. Looking forward, we will continue to execute on our three strategic capital allocation priorities that have served us well in the past. Specifically, we will invest in our business to drive strong cash returns on cash invested, execute and integrate strategic acquisitions at compelling post-synergy multiples, and return cash to stockholders.
In closing, I would like to thank our customers for their business, our more than 17,000 Graphic Packaging employees around the world for their continued hard work and dedication, and our stockholders for their trust.
Sincerely,
Michael P. Doss President and Chief Executive Officer

6 Graphic Packaging Holding Company Annual Report 2017
UNITED STATES SECURITIES AND EXCHANGE COMMISSIONWashington, D.C. 20549
Form 10-K/AAmendment No.1
ANNUAL REPORT PURSUANT TO SECTION 13 OR 15(d) OF THE SECURITIES EXCHANGE ACT OF 1934For the fiscal year ended December 31, 2017
orTRANSITION REPORT PURSUANT TO SECTION 13 OR 15(d) OF THE SECURITIES EXCHANGE ACT OF 1934For the transition period from to
COMMISSION FILE NUMBER: 001-33988
Graphic Packaging Holding Company(Exact name of registrant as specified in its charter)
Delaware 26-0405422(State of incorporation) (I.R.S. employer identification no.)
1500 Riveredge Parkway, Suite 100, Atlanta, Georgia 30328(Address of principal executive offices) (Zip Code)
(770) 240-7200Registrant’s telephone number, including area code:
Securities registered pursuant to Section 12(b) of the Act:
Title of Each Class Name of Each Exchange on Which RegisteredCommon Stock, $0.01 par value per share New York Stock Exchange
Series A Junior Participating Preferred Stock Purchase Rights New York Stock ExchangeAssociated with the Common Stock
Securities registered pursuant to Section 12(g) of the Act:None
Indicate by check mark if the registrant is a well-known seasoned issuer, as defined in Rule 405 of the Securities Act. Yes No
Indicate by check mark if the registrant is not required to file reports pursuant to Section 13 or Section 15(d) of the Act. Yes No
Indicate by check mark whether the registrant (1) has filed all reports required to be filed by Section 13 or 15(d) of the Securities Exchange Act of 1934 during the preceding 12 months (or for such shorter period that the registrant was required to file such reports), and (2) has been subject to such filing requirements for the past 90 days. Yes No
Indicate by check mark whether the registrant has submitted electronically and posted on its corporate Web site, if any, every Interactive Data File required to be submitted and posted pursuant to Rule 405 of Regulation S-T during the preceding 12 months (or for such shorter period that the registrant was required to submit and post such files). Yes No
Indicate by check mark if disclosure of delinquent filers pursuant to Item 405 of Regulation S-K is not contained herein, and will not be contained, to the best of the registrant’s knowledge, in definitive proxy or information statements incorporated by reference in Part III of this Form 10-K or any amendment to this Form 10-K.
Indicate by check mark whether the registrant is a large accelerated filer, an accelerated filer, a non-accelerated filer, a smaller reporting company or an emerging growth company. See the definitions of “large accelerated filer,” “accelerated filer,” “smaller reporting company” and "emerging growth company" in Rule 12b-2 of the Exchange Act. (Check one):
Large accelerated filer Accelerated filer Smaller reporting company
Non-accelerated filer (Do not check if a smaller reporting company) Emerging growth company
If an emerging growth company, indicate by check mark if the registrant has elected not to use the extended transition period for complying with any new or revised financial accounting standards provided pursuant to Section 13(a) of the Exchange Act.
Indicate by check mark whether the registrant is a shell company (as defined in Rule 12b-2 of the Act). Yes No
The aggregate market value of voting and non-voting common equity held by non-affiliates at June 30, 2017 was approximately $4 billion.
As of February 5, 2018 there were approximately 309,715,624 shares of the registrant’s Common Stock, $0.01 par value per share outstanding.
DOCUMENTS INCORPORATED BY REFERENCE:Portions of the registrant’s definitive Proxy Statement for the 2018 Annual Meeting of Stockholders are incorporated by reference into Part III of this Annual Report on
Form 10-K.

Explanatory Note The sole purpose of this Amendment No. 1 on Form 10-K/A to Graphic Packaging Holding Company’s Annual Report on Form 10-K for the year ended December 31, 2017, filed with the Securities and Exchange Commission on February 7, 2018 (the “Form 10-K”), is, at the request of Ernst & Young LLP, to update their opinion on internal control over financial reporting to include a previously omitted sentence (specifically, "We are a public accounting firm registered with the PCAOB and are required to be independent with respect to the Company in accordance with the U.S. federal securities laws and the applicable rules and regulations of the Securities and Exchange Commission and the PCAOB."), include paragraph headers and reorder the paragraphs in accordance with the standards of the Public Company Accounting Oversight Board (United States). No change has been made to Ernst & Young LLP’s opinion that Graphic Packaging Holding Company maintained, in all material respects, effective internal control over financial reporting as of December 31, 2017, based on the Committee of Sponsoring Organizations of the Treadway Commission ("COSO") criteria.
No other changes have been made to any of the disclosures in the Form 10-K. This Form 10-K/A speaks as of the original filing date of the Form 10-K, does not reflect events that may have occurred subsequent to the original filing date, and does not modify or update in any way disclosures made in the Form 10-K, except as set forth above.
As required by Rule 12b-15 under the Securities Exchange Act of 1934, currently-dated certifications from the Company’s Chief Executive Officer and Chief Financial Officer have been included as exhibits to this Amendment No. 1.
TABLE OF CONTENTS OF FORM 10-K
INFORMATION CONCERNING FORWARD-LOOKING STATEMENTSPART I
ITEM 1. BUSINESSITEM 1A. RISK FACTORSITEM 1B. UNRESOLVED STAFF COMMENTSITEM 2. PROPERTIESITEM 3. LEGAL PROCEEDINGSITEM 4. MINE SAFETY DISCLOSURES
EXECUTIVE OFFICERS OF THE REGISTRANTPART II
ITEM 5. MARKET FOR REGISTRANT’S COMMON EQUITY, RELATED STOCKHOLDER MATTERS AND ISSUER PURCHASES OF EQUITY SECURITIES
ITEM 6. SELECTED FINANCIAL DATAITEM 7. MANAGEMENT’S DISCUSSION AND ANALYSIS OF FINANCIAL CONDITION AND RESULTS
OF OPERATIONSITEM 7A. QUANTITATIVE AND QUALITATIVE DISCLOSURE ABOUT MARKET RISKITEM 8. FINANCIAL STATEMENTS AND SUPPLEMENTARY DATAITEM 9. CHANGES IN AND DISAGREEMENTS WITH ACCOUNTANTS ON ACCOUNTING AND
FINANCIAL DISCLOSUREITEM 9A. CONTROLS AND PROCEDURESITEM 9B. OTHER INFORMATION
PART IIIITEM 10. DIRECTORS, EXECUTIVE OFFICERS AND CORPORATE GOVERNANCEITEM 11. EXECUTIVE COMPENSATIONITEM 12. SECURITY OWNERSHIP OF CERTAIN BENEFICIAL OWNERS AND MANAGEMENT AND
RELATED STOCKHOLDER MATTERSITEM 13. CERTAIN RELATIONSHIPS AND RELATED TRANSACTIONS, AND DIRECTOR
INDEPENDENCEITEM 14. PRINCIPAL ACCOUNTANT FEES AND SERVICES
PART IVITEM 15. EXHIBITS AND FINANCIAL STATEMENT SCHEDULESSIGNATURES
5
6121516181819
2123
244042
9999
100
100100
100
100100
100106
5
INFORMATION CONCERNING FORWARD-LOOKING STATEMENTS
Certain statements regarding the expectations of Graphic Packaging Holding Company (“GPHC” and, together with its subsidiaries, the “Company”), including, but not limited to, the availability of net operating losses to offset U.S. federal income taxes and the timing related to the Company's future U.S. federal income tax payments, the deductibility of goodwill related to the acquisitions of Carton Craft Corporation and Seydaco Packaging Corp., capital investment, contractual obligations, available cash and liquidity, depreciation and amortization, interest expense, reclassification of Accumulated Other Comprehensive Loss to earnings, pension plan contributions and postretirement health care benefit payments, in this report constitute “forward-looking statements” as defined in the Private Securities Litigation Reform Act of 1995. Such statements are based on currently available operating, financial and competitive information and are subject to various risks and uncertainties that could cause actual results to differ materially from the Company’s historical experience and its present expectations. These risks and uncertainties include, but are not limited to, inflation of and volatility in raw material and energy costs, changes in consumer buying habits and product preferences, competition with other paperboard manufacturers and product substitution, the Company’s ability to implement its business strategies, including strategic acquisitions, the Company's ability to successfully integrate acquisitions, including the North America Consumer Packaging business of International Paper Company, productivity initiatives and cost reduction plans, the Company’s debt level, currency movements and other risks of conducting business internationally, and the impact of regulatory and litigation matters, including those that could impact the Company’s ability to utilize its net operating losses to offset taxable income and those that impact the Company's ability to protect and use its intellectual property. Undue reliance should not be placed on such forward-looking statements, as such statements speak only as of the date on which they are made and the Company undertakes no obligation to update such statements, except as may be required by law. Additional information regarding these and other risks is contained in Part I, Item 1A., Risk Factors.
6
PART I
ITEM 1. BUSINESS
Overview
Graphic Packaging Holding Company (“GPHC” and, together with its subsidiaries, the “Company”) is committed to providing consumer packaging that makes a world of difference. The Company is a leading provider of paper-based packaging solutions for a wide variety of products to food, beverage and other consumer products companies. The Company operates on a global basis, is one of the largest producers of folding cartons in the United States ("U.S."), and holds leading market positions in coated unbleached kraft paperboard (“CUK”) and coated-recycled paperboard (“CRB”).
The Company’s customers include many of the world’s most widely recognized companies and brands with prominent market positions in beverage, food and other consumer products. The Company strives to provide its customers with packaging solutions designed to deliver marketing and performance benefits at a competitive cost by capitalizing on its low-cost paperboard mills and converting plants, its proprietary carton and packaging designs, and its commitment to quality and service.
In preparation for the combination of the Company's existing businesses with the North America Consumer Packaging business of International Paper Company ("IP") as described in Note 19 in the Notes to Consolidated Financial Statements included herein under “Item 8. Financial Statements and Supplementary Data" (the "Consumer Packaging Combination"), on December 29, 2017, Graphic Packaging International, Inc., the primary operating subsidiary of GPHC, underwent a statutory conversion and became a Delaware limited liability company. As a result, Graphic Packaging International, Inc.'s name changed to Graphic Packaging International, LLC ("GPI"). When used herein, GPI refers to Graphic Packaging International, Inc. prior to December 29, 2017 and Graphic Packaging International, LLC after such date. As of December 29, 2017, GPI was wholly owned by Graphic Packaging International Partners, LLC, which was in turn wholly-owned by GPI Holding III, LLC, a limited liability company that is classified as a partnership for U.S. Federal income tax purposes. GPI Holding III, LLC is a wholly-owned indirect subsidiary of GPHC.
Acquisitions and Dispositions
2017
On December 1, 2017, the Company acquired the assets of Seydaco Packaging Corp. and its affiliates National Carton and Coating Co., and Groupe Ecco Boites Pliantes Ltée (collectively, "Seydaco"), a folding carton producer focused on the foodservice, food, personal care, and household goods markets. The acquisition includes three folding carton facilities located in Mississauga, Ontario, St.-Hyacinthe, Québec, and Xenia, Ohio.
On December 1, 2017, the Company closed its coated recycled paperboard mill in Santa Clara, California. This decision was made as a result of a thorough assessment of the facility's manufacturing capabilities and associated costs in the context of the Company's overall mill operating capabilities and cost structure.
On October 4, 2017, the Company acquired Norgraft Packaging, S.A. ("Norgraft"), a leading folding carton producer in Spain focused on the food and household goods markets. The acquisition includes two folding carton facilities located in Miliaño and Requejada, Spain.
On July 10, 2017, the Company acquired substantially all the assets of Carton Craft Corporation and its affiliate Lithocraft, Inc. (collectively, "Carton Craft"). The acquisition includes two folding carton facilities located in New Albany, Indiana, focused on the production of paperboard-based air filter frames and folding cartons.
The Seydaco, Norgraft, and Carton Craft transactions are referred to collectively as the "2017 Acquisitions." Seydaco and Carton Craft are included in the Americas Paperboard Packaging Segment. Norgraft is included in the Europe Paperboard Packaging Segment.
2016 On April 29, 2016, the Company acquired Colorpak Limited ("Colorpak"), a leading folding carton supplier in Australia and
New Zealand. Colorpak operates three folding carton facilities that convert paperboard into folding cartons for the food, beverage and consumer product markets. The folding carton facilities are located in Melbourne and Sydney, Australia and Auckland, New Zealand.
On March 31, 2016, the Company acquired substantially all the assets of Metro Packaging & Imaging, Inc. ("Metro"), a single converting facility located in Wayne, New Jersey.
On February 16, 2016, the Company acquired Walter G. Anderson, Inc. ("WG Anderson"), a folding carton manufacturer with a focus on store branded food and consumer product markets. WG Anderson operates two sheet-fed folding carton facilities located in Hamel, Minnesota and Newton, Iowa.
7
On January 5, 2016, the Company acquired G-Box, S.A. de C.V., ("G-Box"). The acquisition included two folding carton facilities located in Monterrey, Mexico and Tijuana, Mexico that service the food, beverage, and consumer product markets.
The Colorpak, Metro, WG Anderson and G-Box transactions are referred to collectively as the "2016 Acquisitions." Metro, WG Anderson and G-Box are included in the Americas Paperboard Packaging Segment. Colorpak is included in Corporate/Other/Eliminations.
2015 On October 1, 2015, the Company acquired the folding carton assets of Staunton, VA-based Carded Graphics, LLC. ("Carded"), a folding carton producer with a strong regional presence in the food, craft beer and other consumer product markets.
On February 4, 2015, the Company acquired certain assets of Cascades' Norampac Division ("Cascades") in Canada. Cascades primarily services the food and beverage markets and operates three folding carton converting facilities located in Cobourg, Ontario, Mississauga, Ontario and Winnipeg, Manitoba along with a thermo mechanical pulp ("TMP") mill located in Jonquière, Quebec and a coated-recycled board mill located in East Angus, Quebec. The Jonquière mill was closed in the third quarter of 2015.
On January 2, 2015, the Company acquired Rose City Printing and Packaging Inc. ("Rose City"). Rose City services food and beverage markets and operates two folding carton facilities located in Gresham, OR and Vancouver, WA.
The Carded, Cascades, and Rose City transactions are included in the Americas Paperboard Packaging Segment.
Capital Allocation Plan
On January 10, 2017, the Company's board of directors authorized an additional share repurchase program to allow the Company to purchase up to $250 million of the Company's issued and outstanding shares of common stock through open market purchases, privately negotiated transactions and Rule 10b5-1 plans (the "2017 share repurchase program"). The original $250 million share repurchase program was authorized on February 4, 2015 (the "2015 share repurchase program").
During 2017, the Company repurchased 4.5 million shares, or approximately $58 million, of its common stock at an average price of $13.08, including 1.4 million shares repurchased under the 2015 share repurchase program thereby completing that program. During 2016, the Company repurchased 13.2 million shares, or approximately $169 million, of its common stock at an average price of $12.77. During 2015, the Company repurchased 4.6 million shares, or approximately $63 million, at an average price of $13.60.
At December 31, 2017, the Company had approximately $210 million remaining under the 2017 share repurchase program.
During 2017 and 2016, the Company paid cash dividends of $93.4 million and $64.4 million, respectively.
Products
The Company reports its results in three segments: Paperboard Mills includes the six North American paperboard mills which produce primarily CUK and CRB. The majority of the paperboard is consumed internally to produce paperboard packaging for the Americas and Europe Paperboard Packaging segments. The remaining paperboard is sold externally to a wide variety of paperboard packaging converters and brokers. Americas Paperboard Packaging includes paperboard packaging folding cartons sold primarily to Consumer Packaged Goods ("CPG") companies serving the food, beverage, and consumer product markets in the Americas.
Europe Paperboard Packaging includes paperboard packaging folding cartons sold primarily to CPG companies serving the food, beverage and consumer product markets in Europe.
The Company also operates in three geographic areas: the Americas, Europe and Asia Pacific.
For reportable segment and geographic area information for each of the last three fiscal years, see Note 14 in the Notes to Consolidated Financial Statements included herein under “Item 8. Financial Statements and Supplementary Data."
8
Paperboard Packaging
The Company’s paperboard packaging products deliver brand, marketing and performance benefits at a competitive cost. The Company supplies paperboard cartons and carriers designed to protect and contain products while providing:
• convenience through ease of carrying, storage, delivery, dispensing of product and food preparation for consumers;
• a smooth surface printed with high-resolution, multi-color graphic images that help improve brand awareness and visibility of products on store shelves; and
• durability, stiffness and wet and dry tear strength; leak, abrasion and heat resistance; barrier protection from moisture, oxygen, oils and greases, as well as enhanced microwave heating performance.
The Company provides a wide range of paperboard packaging solutions for the following end-use markets:
• beverage, including beer, soft drinks, energy drinks, teas, water and juices;
• food, including cereal, desserts, frozen, refrigerated and microwavable foods and pet foods;
• prepared foods, including snacks, quick-serve foods for restaurants and food service products;
• household products, including dishwasher and laundry detergent, health care and beauty aids, and tissues and papers; and
• air filter frames.
The Company’s packaging applications meet the needs of its customers for:
Strength Packaging. The Company's products provide sturdiness to meet a variety of packaging needs, including tear and wet strength, puncture resistance, durability and compression strength (providing stacking strength to meet store display packaging requirements).
Promotional Packaging. The Company offers a broad range of promotional packaging options that help differentiate its customers’ products in the marketplace. These promotional enhancements improve brand awareness and visibility on store shelves.
Convenience Packaging. These packaging solutions improve package usage and food preparation:
• beverage multiple-packaging — multi-packs for beer, soft drinks, energy drinks, teas, water and juices;
• active microwave technologies — substrates that improve the preparation of foods in the microwave; and
• easy opening and closing features — dispensing features, pour spouts and sealable liners.
Barrier Packaging. The Company provides packages that protect against moisture, grease, oil, oxygen, sunlight, insects and other potential product-damaging factors.
Paperboard Mills and Folding Carton Facilities
The Company produces paperboard at its mills; prints, cuts, folds, and glues (“converts”) the paperboard into folding cartons at its converting plants; and designs and manufactures specialized, proprietary packaging machines that package bottles and cans and, to a lesser extent, non-beverage consumer products. The Company also installs its packaging machines at customer plants and provides support, service and advanced performance monitoring of the machines.
The Company offers a variety of laminated, coated and printed packaging structures that are produced from its CUK and CRB, as well as other grades of paperboard that are purchased from third-party suppliers.
9
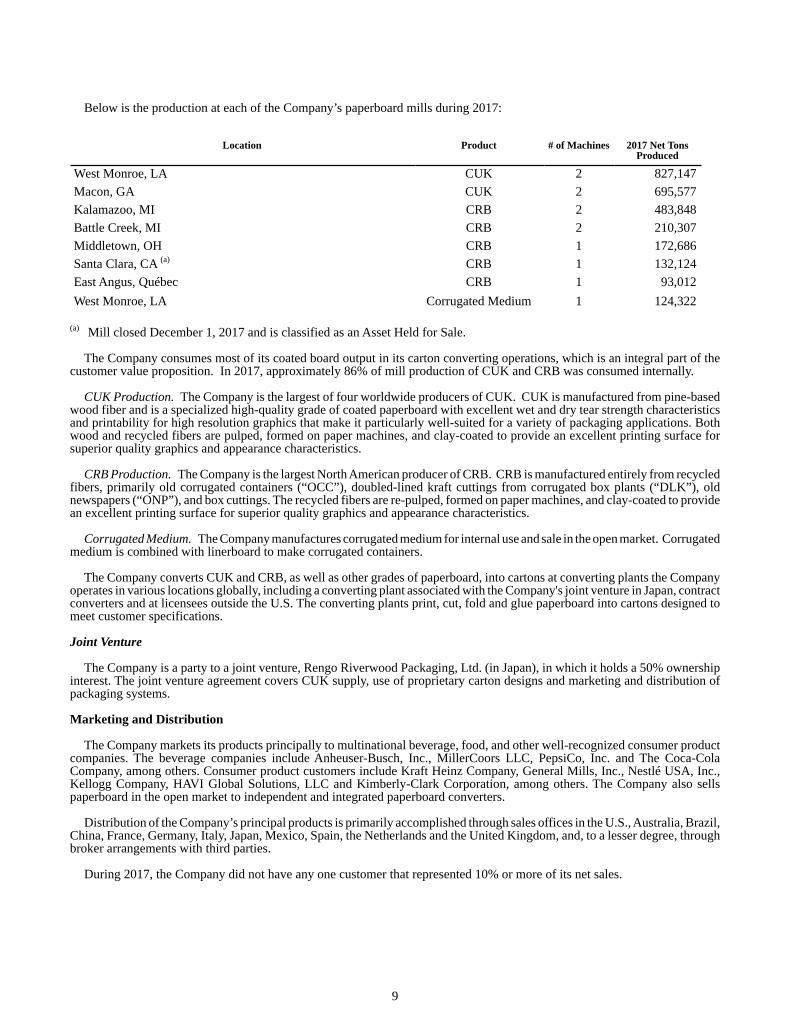
Below is the production at each of the Company’s paperboard mills during 2017:
Location Product # of Machines 2017 Net TonsProduced
West Monroe, LA CUK 2 827,147Macon, GA CUK 2 695,577Kalamazoo, MI CRB 2 483,848Battle Creek, MI CRB 2 210,307Middletown, OH CRB 1 172,686Santa Clara, CA (a) CRB 1 132,124East Angus, Québec CRB 1 93,012West Monroe, LA Corrugated Medium 1 124,322
(a) Mill closed December 1, 2017 and is classified as an Asset Held for Sale.
The Company consumes most of its coated board output in its carton converting operations, which is an integral part of the customer value proposition. In 2017, approximately 86% of mill production of CUK and CRB was consumed internally.
CUK Production. The Company is the largest of four worldwide producers of CUK. CUK is manufactured from pine-based wood fiber and is a specialized high-quality grade of coated paperboard with excellent wet and dry tear strength characteristics and printability for high resolution graphics that make it particularly well-suited for a variety of packaging applications. Both wood and recycled fibers are pulped, formed on paper machines, and clay-coated to provide an excellent printing surface for superior quality graphics and appearance characteristics.
CRB Production. The Company is the largest North American producer of CRB. CRB is manufactured entirely from recycled fibers, primarily old corrugated containers (“OCC”), doubled-lined kraft cuttings from corrugated box plants (“DLK”), old newspapers (“ONP”), and box cuttings. The recycled fibers are re-pulped, formed on paper machines, and clay-coated to provide an excellent printing surface for superior quality graphics and appearance characteristics.
Corrugated Medium. The Company manufactures corrugated medium for internal use and sale in the open market. Corrugated medium is combined with linerboard to make corrugated containers.
The Company converts CUK and CRB, as well as other grades of paperboard, into cartons at converting plants the Company operates in various locations globally, including a converting plant associated with the Company's joint venture in Japan, contract converters and at licensees outside the U.S. The converting plants print, cut, fold and glue paperboard into cartons designed to meet customer specifications.
Joint Venture
The Company is a party to a joint venture, Rengo Riverwood Packaging, Ltd. (in Japan), in which it holds a 50% ownership interest. The joint venture agreement covers CUK supply, use of proprietary carton designs and marketing and distribution of packaging systems.
Marketing and Distribution
The Company markets its products principally to multinational beverage, food, and other well-recognized consumer product companies. The beverage companies include Anheuser-Busch, Inc., MillerCoors LLC, PepsiCo, Inc. and The Coca-Cola Company, among others. Consumer product customers include Kraft Heinz Company, General Mills, Inc., Nestlé USA, Inc., Kellogg Company, HAVI Global Solutions, LLC and Kimberly-Clark Corporation, among others. The Company also sells paperboard in the open market to independent and integrated paperboard converters.
Distribution of the Company’s principal products is primarily accomplished through sales offices in the U.S., Australia, Brazil, China, France, Germany, Italy, Japan, Mexico, Spain, the Netherlands and the United Kingdom, and, to a lesser degree, through broker arrangements with third parties.
During 2017, the Company did not have any one customer that represented 10% or more of its net sales.
10
Competition
Although a relatively small number of large competitors hold a significant portion of the paperboard packaging market, the Company’s business is subject to strong competition. The Company and WestRock Company ("WestRock") are the two major CUK producers in the U.S. Internationally, The Klabin Company in Brazil and Stora Enso in Sweden produce similar grades of paperboard.
In beverage packaging, cartons made from CUK compete with substitutes such as plastics and corrugated packaging for packaging glass or plastic bottles, cans and other primary containers. Although plastics and corrugated packaging may be priced lower than CUK, the Company believes that cartons made from CUK offer advantages over these materials in areas such as distribution, brand awareness, carton designs, package performance, package line speed, environmental friendliness and design flexibility.
In non-beverage consumer packaging, the Company’s paperboard competes with WestRock CUK, as well as CRB and solid bleach sulfate ("SBS") from numerous competitors, and internationally, folding boxboard and white-lined chip. There are a large number of producers in the paperboard markets. Suppliers of paperboard compete primarily on the basis of price, strength and printability of their paperboard, quality and service.
Raw Materials
The paperboard packaging produced by the Company comes from pine trees and recycled fibers. Pine pulpwood, paper and recycled fibers (including DLK, OCC and ONP) and energy used in the manufacture of paperboard, as well as poly sheeting, plastic resins and various chemicals used in the coating of paperboard, represent the largest components of the Company’s variable costs of paperboard production.
For the West Monroe, LA and Macon, GA mills, the Company relies on private landowners and the open market for all of its pine pulpwood and recycled fiber requirements, supplemented by CUK clippings that are obtained from its converting operations. The Company believes that adequate supplies from both private landowners and open market fiber sellers currently are available in close proximity to meet its fiber needs at these mills.
The paperboard grades produced at the Kalamazoo, MI, Battle Creek, MI, Middletown, OH and East Angus, Quebec mills are made from 100% recycled fiber. The Company procures its recycled fiber from external suppliers and internal converting operations. The market price of each of the various recycled fiber grades fluctuates with supply and demand. The Company’s internal recycled fiber procurement function enables the Company to pay lower prices for its recycled fiber needs given the Company’s highly fragmented supplier base. The Company believes there are adequate supplies of recycled fiber to serve its mills.
In North America, the Company also converts a variety of other paperboard grades such as SBS, in addition to paperboard that is supplied to its converting operations from its own mills. The Company purchases such paperboard requirements, including additional CRB, from outside vendors. The majority of external paperboard purchases are acquired through long-term arrangements with other major industry suppliers. The Company's European converting plants consume CUK supplied from the Company's mills and also convert other paperboard grades such as white-lined chip and folding box board purchased from external suppliers.
Energy
Energy, including natural gas, fuel oil and electricity, represents a significant portion of the Company’s manufacturing costs. The Company has entered into contracts designed to manage risks associated with future variability in cash flows and price risk related to future energy cost increases for a portion of its natural gas requirements at its U.S. mills. The Company’s hedging program for natural gas is discussed in Note 9 in the Notes to Consolidated Financial Statements included herein under “Item 8., Financial Statements and Supplementary Data.”
Backlog
Orders from the Company’s principal customers are manufactured and shipped with minimal lead time. The Company did not have a material amount relating to backlog orders at December 31, 2017 or 2016.
Seasonality
The Company’s net sales, income from operations and cash flows from operations are subject to moderate seasonality, with demand usually increasing in the late spring through early fall due to increases in demand for beverage and food products.
11
Research and Development
The Company’s research and development team works directly with its sales, marketing and consumer insights personnel to understand long-term consumer and retailer trends and create relevant new packaging. These innovative solutions provide customers with differentiated packaging to meet customer needs. The Company’s development efforts include, but are not limited to, extending the shelf life of customers’ products; reducing production and waste costs; enhancing the heat-managing characteristics of food packaging; improving the sturdiness and compression strength of packaging to meet store display needs; and refining packaging appearance through new printing techniques and materials.
Sustainability represents one of the strongest trends in the packaging industry and the Company focuses on developing more sustainable and eco-friendly manufacturing processes and products. The Company’s strategy is to combine sustainability with innovation to create new packaging solutions for its customers.
For more information on research and development expenses see Note 1 in the Notes to Consolidated Financial Statements included herein under “Item 8., Financial Statements and Supplementary Data.”
Patents and Trademarks
As of December 31, 2017, the Company had a large patent portfolio, presently owning, controlling or holding rights to more than 2,200 U.S. and foreign patents, with more than 600 U.S. and foreign patent applications currently pending. The Company’s patent portfolio consists primarily of patents relating to packaging machinery, manufacturing methods, structural carton designs, active microwave packaging technology and barrier protection packaging. These patents and processes are significant to the Company’s operations and are supported by trademarks such as Fridge Vendor™, IntegraPak™, MicroFlex-Q™ , MicroRite™, Quilt Wave™, Qwik Crisp™, Tite-Pak™, and Z-Flute™. The Company takes significant steps to protect its intellectual property and proprietary rights.
Culture and Employees
The Company’s corporate vision — Inspired packaging. A world of difference. — and values of integrity, respect, accountability, relationships and teamwork guide employee behavior, expectations and relations. The Company’s ongoing efforts to build a high-performance culture and improve the manner in which work is done across the Company includes a significant focus on continuous improvement utilizing processes like Lean Sigma and Six Sigma.
As of December 31, 2017, the Company had approximately 13,000 employees worldwide, of which approximately 45% were represented by labor unions and covered by collective bargaining agreements or covered by works councils in Europe. As of December 31, 2017, 399 of the Company’s employees were working under expired contracts, which are currently being negotiated, and 1,602 were covered under collective bargaining agreements that expire within one year. The Company considers its employee relations to be satisfactory.
Environmental Matters
The Company is subject to a broad range of foreign, federal, state and local environmental and health and safety regulations and employs a team of professionals in order to maintain compliance at each of its facilities. For additional information on such regulation and compliance, see “Environmental Matters” in “Item 7., Management’s Discussion and Analysis of Financial Condition and Results of Operations” and Note 13 in the Notes to Consolidated Financial Statements included herein under “Item 8., Financial Statements and Supplementary Data.”
The Company did not have material capital expenditures for environmental control or compliance in 2017.
Available Information
The Company’s website is located at http://www.graphicpkg.com. The Company makes available, free of charge through its website, its Annual Report on Form 10-K, Quarterly Reports on Form 10-Q, Current Reports on Form 8-K, and amendments to those reports filed or furnished pursuant to Section 13(a) or 15(d) of the Securities Exchange Act of 1934, as soon as reasonably practicable after such materials are electronically filed or furnished to the Securities and Exchange Commission (the “SEC”). The Company also makes certain investor presentations and access to analyst conference calls available through its website. The information contained or incorporated into the Company’s website is not a part of this Annual Report on Form 10-K.
The SEC maintains an Internet website that contains reports, proxy and information statements, and other information regarding issuers like the Company that file electronically with the SEC at http://www.SEC.gov.
12
Item 1A. RISK FACTORS
The following risks could affect (and in some cases have affected) the Company's actual results and could cause such results to differ materially from estimates or expectations reflected in certain forward-looking statements:
The Company's financial results could be adversely impacted if there are significant increases in prices for raw materials, energy, transportation and other necessary supplies, and the Company is unable to raise prices, or improve productivity to reduce costs.
Limitations on the availability of, and increases in, the costs of raw materials, including secondary fiber, petroleum-based materials, energy, wood, transportation and other necessary goods and services, could have an adverse effect on the Company's financial results. Because negotiated sales contracts and the market largely determine the pricing for its products, the Company is at times limited in its ability to raise prices and pass through to its customers any inflationary or other cost increases that the Company may incur.
The Company uses productivity improvements to reduce costs and offset inflation. These include global continuous improvement initiatives that use statistical process control to help design and manage many types of activities, including production and maintenance. The Company's ability to realize anticipated savings from these improvements is subject to significant operational, economic and competitive uncertainties and contingencies, many of which are beyond the Company's control. If the Company cannot successfully implement cost savings plans, it may not be able to continue to compete successfully against other manufacturers. In addition, any failure to generate the anticipated efficiencies and savings could adversely affect the Company's financial results.
Changes in consumer buying habits and preferences for products could have an effect on our sales volumes.
Changing consumer dietary habits and preferences have slowed sales growth for many of the food and beverage products the Company packages. If these trends continue, the Company’s financial results could be adversely affected.
Competition and product substitution could have an adverse effect on the Company's financial results.
The Company competes with other paperboard manufacturers and carton converters, both domestically and internationally. The Company's products compete with those made from other manufacturers' CUK board, as well as SBS and CRB, and other board substrates. Substitute products include plastic, shrink film and corrugated containers. In addition, while the Company has long-term relationships with many of its customers, the underlying contracts may be re-bid or renegotiated from time to time, and the Company may not be successful in renewing such contracts on favorable terms or at all. The Company works to maintain market share through efficiency, product innovations and strategic sourcing to its customers; however, pricing and other competitive pressures may occasionally result in the loss of a customer relationship.
The Company's future growth and financial results could be adversely impacted if the Company is unable to identify strategic acquisitions and to successfully integrate the acquired businesses.
The Company has made a significant number of acquisitions in recent years. The Company's ability to continue to make strategic acquisitions and to integrate the acquired businesses successfully, including obtaining anticipated cost savings or synergies and expected operating results within a reasonable period of time, is an important factor in the Company's future growth. If the Company is unable to realize the expected revenue and cash flow growth and other benefits from its acquisitions, the Company may be required to spend additional time or money on integration efforts that would otherwise have been spent on the development and expansion of its business.
13
Integration of the Consumer Packaging Combination will be complex, costly and time-consuming, and the anticipated benefits from the combined business may take longer to realize than expected or may not be realized at all.
The Company's ability to realize the anticipated benefits from the Consumer Packaging Combination will depend, to a large extent, on its ability to integrate the businesses of legacy GPI and IP. The combination of two independent businesses is a complex, costly and time-consuming process and there can be no assurance that the Company will be able to successfully integrate the businesses, or if such integration is successfully accomplished, that such integration will not be more costly or take longer than presently contemplated. In addition, the Company's ability to realize the expected synergies and benefits from the combined business is dependent upon the ability to complete the timely integration of operations and information technology systems, controls, procedures and policies and to preserve important customer and supplier relationships during the transition. If the Company cannot successfully integrate and manage the combined business and achieve the anticipated benefits from the combined business, the combination could have a material adverse effect on the Company's share price, business, cash flows, results of operations and financial position.
The Company is relying on IP to provide a wide range of services required to operate the combined business under a Transition Services Agreement ("TSA") and such reliance may continue for an extended period.
During the integration of the Consumer Packaging Combination, the Company will be dependent on IP to continue to perform elements of such critical functions as information technology, finance, logistics and operations for parts of the IP business under a TSA. Operating under a TSA exposes the Company to risks that the costs of operating the combined business may be greater than planned, that the services provided will not meet the requirements in an effective manner and that the Company may not be able to maintain appropriate controls while operating under the TSA. In addition, if the Company cannot integrate systems and operations, the Company may need to operate under the TSA for longer than expected.
The Company may not be able to develop and introduce new products and adequately protect its intellectual property and proprietary rights, which could harm its future success and competitive position.
The Company works to increase market share and profitability through product innovation and the introduction of new products. The inability to develop new or better products that satisfy customer and consumer preferences in a timely manner may impact the Company's competitive position.
The Company's future success and competitive position also depends, in part, upon its ability to obtain and maintain protection for certain proprietary carton and packaging machine technologies used in its value-added products, particularly those incorporating the Fridge Vendor, IntegraPak, MicroFlex-Q, MicroRite, Quilt Wave, Qwik Crisp, Tite-Pak, and Z-Flute technologies. Failure to protect the Company's existing intellectual property rights may result in the loss of valuable technologies or may require it to license other companies' intellectual property rights. It is possible that any of the patents owned by the Company may be invalidated, rendered unenforceable, circumvented, challenged or licensed to others or any of its pending or future patent applications may not be issued within the scope of the claims sought by the Company, if at all. Further, others may develop technologies that are similar or superior to the Company's technologies, duplicate its technologies or design around its patents, and steps taken by the Company to protect its technologies may not prevent misappropriation of such technologies.
The Company could experience material disruptions at our facilities.
Although the Company takes appropriate measures to minimize the risk and effect of material disruptions to the business conducted at our facilities, natural disasters such as hurricanes, tornadoes, floods and fires, as well as other unexpected disruptions such as the unavailability of critical raw materials, power outages and equipment failures can reduce production and increase manufacturing costs. These types of disruptions could materially adversely affect our earnings, depending upon the duration of the disruption and our ability to shift business to other facilities or find other sources of materials or energy. Any losses due to these events may not be covered by our existing insurance policies or may be subject to certain deductibles.
14
The Company is subject to the risks of doing business in foreign countries.
The Company has converting plants in 11 countries outside of the U.S. and sells its products worldwide. For 2017, before intercompany eliminations, net sales from operations outside of the U.S. represented approximately 17% of the Company’s net sales. The Company’s revenues from foreign sales fluctuate with changes in foreign currency exchange rates. The Company pursues a currency hedging program in order to reduce the impact of foreign currency exchange fluctuations on financial results. At December 31, 2017, approximately 22% of its total assets were denominated in currencies other than the U.S. dollar.
The Company is also subject to the following significant risks associated with operating in foreign countries:
• Compliance with and enforcement of environmental, health and safety and labor laws and other regulations of the foreign countries in which the Company operates;
• Export compliance;• Imposition or increase of withholding and other taxes on remittances and other payments by foreign
subsidiaries; and• Imposition of new or increases in capital investment requirements and other financing requirements by foreign
governments.
The Company’s information technology systems could suffer interruptions, failures or breaches and our business operations could be disrupted adversely effecting results of operations and the Company’s reputation. The Company’s information technology systems, some of which are dependent on services provided by third parties, serve an important role in the operation of the business. These systems could be damaged or cease to function properly due to any number of causes, such as catastrophic events, power outages, security breaches, computer viruses or cyber-based attacks. The Company has contingency plans in place to prevent or mitigate the impact of these events, however, if they are not effective on a timely basis, business interruptions could occur which may adversely impact results of operations. Increased cyber-security threats also pose a potential risk to the security of the Company’s information technology systems, as well as the confidentiality, integrity and availability of data stored on those systems. Any breach could result in disclosure or misuse of confidential or proprietary information, including sensitive customer, vendor, employee or financial information. Such events could cause damage to the Company’s reputation and result in significant recovery or remediation costs, which may adversely impact results of operations.
The Company is subject to environmental, health and safety laws and regulations, and costs to comply with such laws and regulations, or any liability or obligation imposed under new laws or regulations, could negatively impact its financial condition and results of operations.
The Company is subject to a broad range of foreign, federal, state and local environmental, health and safety laws and regulations, including those governing discharges to air, soil and water, the management, treatment and disposal of hazardous substances, the investigation and remediation of contamination resulting from releases of hazardous substances, and the health and safety of employees. The Company cannot currently assess the impact that future emission standards, climate control initiatives and enforcement practices will have on the Company's operations and capital expenditure requirements. Environmental liabilities and obligations may result in significant costs, which could negatively impact the Company's financial position, results of operations or cash flows. See Note 13 in the Notes to Consolidated Financial Statements included herein under “Item 8., Financial Statements and Supplementary Data.”
The Company's indebtedness may adversely affect its financial condition and its ability to react to changes in its business.
As of December 31, 2017, the Company had an aggregate principal amount of $2,287.0 million of outstanding debt. Subsequent to December 31, 2017, in connection with the consummation of the Consumer Packaging Combination, GPI entered into a Third Amended and Restated Credit Agreement dated as of January 1, 2018 (the “Amended and Restated Credit Agreement”). There were no additional borrowings under the Amended and Restated Credit Agreement in connection with the consummation of the Consumer Packaging Combination. However, GPI entered into an Amended and Restated Credit Agreement dated as of January 1, 2018 and effective as of January 8, 2018 (the “Term Loan Credit Agreement”) by which GPI assumed a $660.0 million term loan previously incurred by IP. See Note 19 in the Notes to Consolidated Financial Statements included herein under “Item 8., Financial Statements and Supplementary Data.”
15
Because of the Company's debt level, a portion of its cash flows from operations are dedicated to payments on indebtedness
and the Company's ability to obtain additional financing for working capital, capital expenditures, acquisitions or general corporate purposes may be restricted in the future.
Additionally, the Company’s Amended and Restated Credit Agreement, Term Loan Credit Agreement and the indentures governing the 4.75% Senior Notes due 2021, 4.875% Senior Notes due 2022, and 4.125% Senior Notes due 2024 (the “Indentures”) may prohibit or restrict, among other things, the disposal of assets, the incurrence of additional indebtedness (including guarantees), the incurrence of liens, payment of dividends, share repurchases, the making of acquisitions and other investments and certain other types of transactions. These restrictions could limit the Company’s flexibility to respond to changing market conditions and competitive pressures. The debt obligations and restrictions may also leave the Company more vulnerable to a downturn in general economic conditions or its business, or unable to carry out capital expenditures that are necessary or important to its growth strategy and productivity improvement programs.
As of December 31, 2017, approximately 45% of the Company’s debt is subject to variable rates of interest and exposes the Company to increased debt service obligations in the event of increased interest rates.
The Company's pension plans are currently underfunded, and the Company may be required to make cash payments to the plans, reducing the cash available for its business.
The Company's cash flows may be adversely impacted by the Company's pension funding obligations. The Company's pension funding obligations are dependent upon multiple factors resulting from actual plan experience and assumptions of future experience. The Company has unfunded obligations of $26.4 million under its domestic and foreign defined benefit pension plans. The funded status of these plans is dependent upon various factors, including returns on invested assets, the level of certain market interest rates and the discount rate used to determine the pension obligations. Unfavorable returns on the plan assets or unfavorable changes in applicable laws or regulations could materially change the timing and amount of required plan funding, which would reduce the cash available to the Company for other purposes.
ITEM 1B. UNRESOLVED STAFF COMMENTS
None.
16
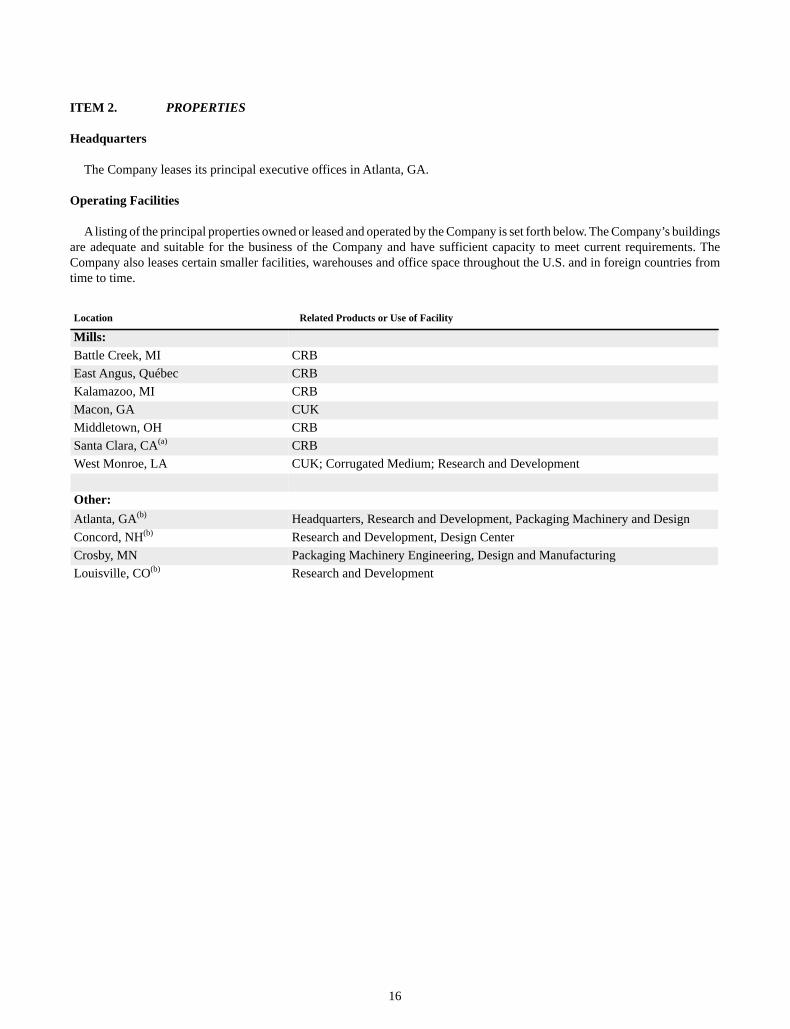
ITEM 2. PROPERTIES
Headquarters
The Company leases its principal executive offices in Atlanta, GA.
Operating Facilities
A listing of the principal properties owned or leased and operated by the Company is set forth below. The Company’s buildings are adequate and suitable for the business of the Company and have sufficient capacity to meet current requirements. The Company also leases certain smaller facilities, warehouses and office space throughout the U.S. and in foreign countries from time to time.
Location Related Products or Use of Facility
Mills:Battle Creek, MI CRBEast Angus, Québec CRBKalamazoo, MI CRBMacon, GA CUKMiddletown, OH CRBSanta Clara, CA(a) CRBWest Monroe, LA CUK; Corrugated Medium; Research and Development
Other:Atlanta, GA(b) Headquarters, Research and Development, Packaging Machinery and DesignConcord, NH(b) Research and Development, Design CenterCrosby, MN Packaging Machinery Engineering, Design and ManufacturingLouisville, CO(b) Research and Development
17
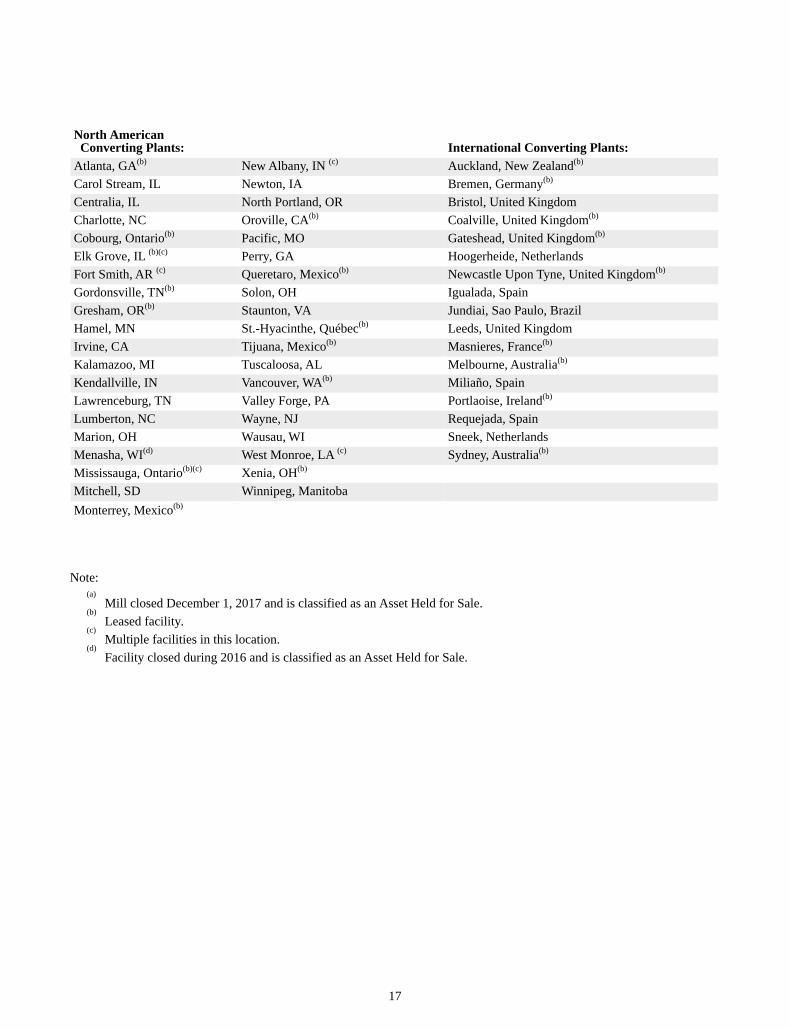
North AmericanConverting Plants: International Converting Plants:
Atlanta, GA(b) New Albany, IN (c) Auckland, New Zealand(b)
Carol Stream, IL Newton, IA Bremen, Germany(b)
Centralia, IL North Portland, OR Bristol, United KingdomCharlotte, NC Oroville, CA(b) Coalville, United Kingdom(b)
Cobourg, Ontario(b) Pacific, MO Gateshead, United Kingdom(b)
Elk Grove, IL (b)(c) Perry, GA Hoogerheide, NetherlandsFort Smith, AR (c) Queretaro, Mexico(b) Newcastle Upon Tyne, United Kingdom(b)
Gordonsville, TN(b) Solon, OH Igualada, SpainGresham, OR(b) Staunton, VA Jundiai, Sao Paulo, BrazilHamel, MN St.-Hyacinthe, Québec(b) Leeds, United KingdomIrvine, CA Tijuana, Mexico(b) Masnieres, France(b)
Kalamazoo, MI Tuscaloosa, AL Melbourne, Australia(b)
Kendallville, IN Vancouver, WA(b) Miliaño, SpainLawrenceburg, TN Valley Forge, PA Portlaoise, Ireland(b)
Lumberton, NC Wayne, NJ Requejada, SpainMarion, OH Wausau, WI Sneek, NetherlandsMenasha, WI(d) West Monroe, LA (c) Sydney, Australia(b)
Mississauga, Ontario(b)(c) Xenia, OH(b)
Mitchell, SD Winnipeg, ManitobaMonterrey, Mexico(b)
Note:
(a)Mill closed December 1, 2017 and is classified as an Asset Held for Sale.
(b)Leased facility.
(c)Multiple facilities in this location.
(d)Facility closed during 2016 and is classified as an Asset Held for Sale.
18
ITEM 3. LEGAL PROCEEDINGS
The Company is a party to a number of lawsuits arising in the ordinary conduct of its business. Although the timing and outcome of these lawsuits cannot be predicted with certainty, the Company does not believe that disposition of these lawsuits will have a material adverse effect on the Company’s consolidated financial position, results of operations or cash flows. See Note 13 in the Notes to Consolidated Financial Statements included herein under “Item 8., Financial Statements and Supplementary Data.”
ITEM 4. MINE SAFETY DISCLOSURES
Not Applicable.

19
EXECUTIVE OFFICERS OF THE REGISTRANT
Pursuant to General Instruction G.(3) of Form 10-K, the following list is included as an unnumbered item in Part I of this Report in lieu of being included in the definitive proxy statement that will be filed within 120 days after December 31, 2017.
Michael P. Doss, 51, is the President and Chief Executive Officer of Graphic Packaging Holding Company. Prior to January 1, 2016, Mr. Doss held the position of President and Chief Operating Officer from May 20, 2015 through December 31, 2015 and Chief Operating Officer from January 1, 2014 until May 19, 2015. Prior to these positions he served as the Executive Vice President, Commercial Operations of Graphic Packaging Holding Company. Prior to this Mr. Doss held the position of Senior Vice President, Consumer Packaging Division. Prior to March 10, 2008, he had served as Senior Vice President, Consumer Products Packaging of Graphic Packaging Corporation since September 2006. From July 2000 until September 2006, he was the Vice President of Operations, Universal Packaging Division. Mr. Doss was Director of Web Systems for the Universal Packaging Division prior to his promotion to Vice President of Operations. Since joining Graphic Packaging International Corporation in 1990, Mr. Doss has held positions of increasing management responsibility, including Plant Manager at the Gordonsville, TN and Wausau, WI plants.
Stephen R. Scherger, 53, is the Senior Vice President and Chief Financial Officer of Graphic Packaging Holding Company.
From October 1, 2014 through December 31, 2014, Mr. Scherger was the Senior Vice President - Finance. From April 2012 through September 2014, Mr. Scherger served as Senior Vice President, Consumer Packaging Division. Mr. Scherger joined Graphic Packaging Holding Company in April of 2012 from MeadWestvaco Corporation, where he served as President, Beverage and Consumer Electronics. Mr. Scherger was with MeadWestvaco Corporation from 1986 to 2012 and held positions including Vice President, Corporate Strategy; Vice President and General Manager, Beverage Packaging; Vice President and CFO, Papers Group, Vice President Asia Pacific and Latin America, Beverage Packaging, CFO Beverage Packaging and other executive-level positions.
Carla J. Chaney, 47, is the Senior Vice President, Human Resources of Graphic Packaging Holding Company, a position she has held since July 15, 2013. Ms. Chaney joined Graphic Packaging Holding Company from Exide Technologies. Ms. Chaney was with Exide Technologies from February 2012 to July 2013 and served most recently as Executive Vice President, Human Resources and Communications. Prior to Exide Technologies, Ms. Chaney held a variety of leadership roles with Newell Rubbermaid, Inc. from 2004 to 2011, including Group Vice President, Human Resources for the Home & Family business segment, Regional Vice President, Human Resources, EMEA; Corporate Vice President, Global Organization and People Development; and Vice President, Human Resources, Culinary Lifestyles Business. Ms. Chaney also worked for Georgia-Pacific from 1992 to 2004.
Alan R. Nichols, 55, is the Senior Vice President, Mills Division of Graphic Packaging Holding Company. He served as Vice President, Mills from August 2008 until March 2009. From March 2008 until August 2008, Mr. Nichols was Vice President, CRB Mills. Prior to the Altivity Transaction, Mr. Nichols served as Vice President, CRB Mills for Altivity Packaging, LLC from February 2007 until March 2008 and was the Division Manufacturing Manager, Mills for Altivity Packaging and the Consumer Products Division of Smurfit-Stone Container Corporation from August 2005 to February 2007. From February 2001 until August 2005, Mr. Nichols was the General Manager of the Wabash Mill for Smurfit-Stone.
Spencer H. Maurer, 48, is the Senior Vice President, Americas Foodservice of Graphic Packaging Holding Company. Prior to December 8, 2017, Mr. Maurer served as Senior Vice President, Supply Chain of Graphic Packaging Holding Company. Prior to January 1, 2017, Mr. Maurer had served as Vice President, Supply Chain of GPI since January 1, 2013. From December 1, 2009 until December 31, 2012, Mr. Maurer was the Vice President, Procurement of GPI. Prior to December 2009, Mr. Maurer held numerous positions with increasing responsibility including: Plant Manager, Golden, CO from 2006 until 2009; Production Manager, Kalamazoo, MI in 2005; Director of Environmental Services for Commercial Operations from 2003 until 2004; Director of Environmental, Health and Safety from 1998 until 2002; and numerous positions in the Environmental, Health and Safety area with James River Corporation and Fort James Corporation (predecessors of GPI) from 1992 until 1998.
Lauren S. Tashma, 51, is the Senior Vice President, General Counsel and Secretary of Graphic Packaging Holding Company, serving in this position since February 2014. Previously, Ms. Tashma served as Senior Vice President, General Counsel and Secretary of Fortune Brands Home & Security, Inc., where she led the legal, compliance and EHS functions. Prior to that, Ms. Tashma had various roles with Fortune Brands, Inc., including Vice President and Associate General Counsel.
20
Hilde Van Moeseke, 47, is the Senior Vice President & President, Europe, Middle East and Africa of Graphic Packaging Holding Company. From January 2017 to July 1, 2017, Ms. Van Moeseke served as Vice President, Finance Europe and Interim EMEA Leader of GPI. From July 2015 until January 2017, Ms. Van Moeseke was the Vice President, Finance Europe of GPI. Ms. Van Moeseke joined the Company in January 2014 as Director Controlling and was promoted to Director, Finance Europe in July 2014. Prior to January 2014, Ms. Van Moeseke held the position of Group Controller, Project Management, Shared Service Center and Accounting at Azelis Corporate Services S.A. for two years. She has also worked for the Walt Disney Company in Europe for six years in the positions of Director Finance and Controllership, Director Regional Studio Controllership, Regional Studio Controllership and Senior Manager.
Joseph P. Yost, 50, is the Senior Vice President, and President, Americas of Graphic Packaging Holding Company. Prior to January 5, 2017, Mr. Yost served as Senior Vice President, Global Beverage and Europe from September 1, 2015 to January 4, 2017, Senior Vice President, Europe from March 1, 2014 to August 31, 2015 and Senior Vice President, European Chief Integration Officer/Chief Financial Officer from February 2013 until February 2014. From 2009 until February 2013, Mr. Yost was the Senior Vice President, Supply Chain of Graphic Packaging Holding Company. From 2006 to 2009, he served as Vice President, Operations Support, Consumer Packaging for GPI. Mr. Yost has also served in the following positions: Director, Finance and Centralized Services from 2003 to 2006 with GPI and from 2000 to 2003 with Graphic Packaging Corporation; Manager, Operations Planning and Analysis, Consumer Products Division from 1999 to 2000 with Graphic Packaging Corporation; and other management positions from 1997 to 1999 with Fort James Corporation.
21
PART II
ITEM 5. MARKET FOR REGISTRANT’S COMMON EQUITY, RELATED STOCKHOLDER MATTERS AND ISSUER PURCHASES OF EQUITY SECURITIES
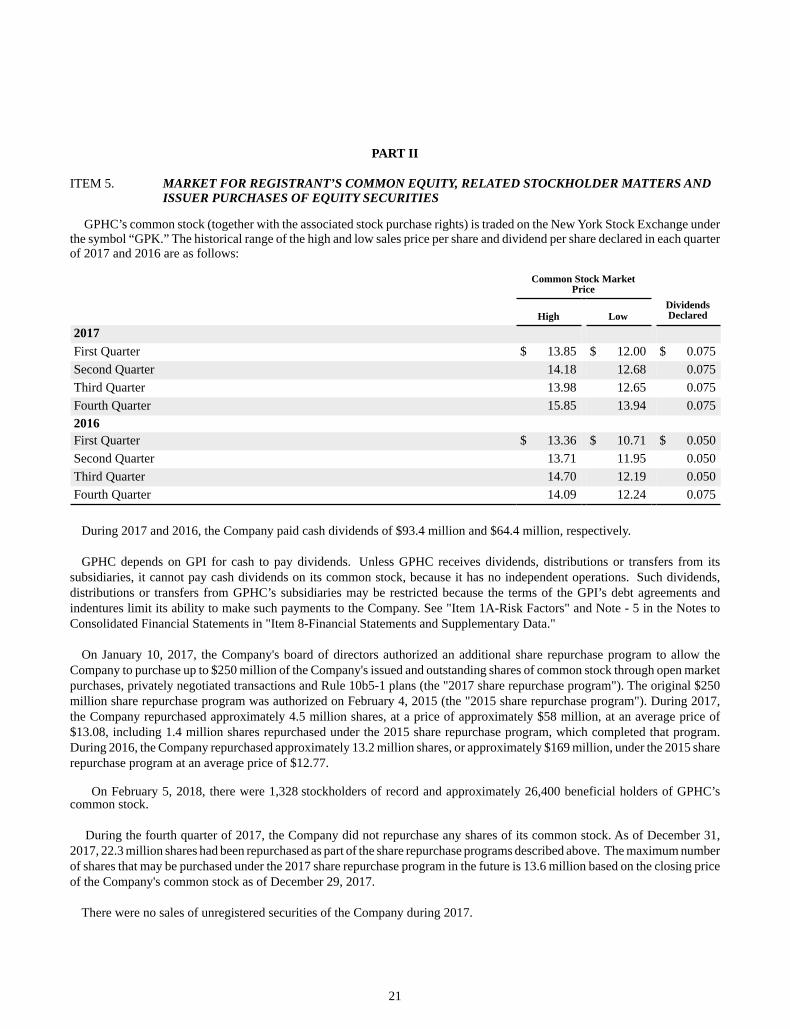
GPHC’s common stock (together with the associated stock purchase rights) is traded on the New York Stock Exchange under the symbol “GPK.” The historical range of the high and low sales price per share and dividend per share declared in each quarter of 2017 and 2016 are as follows:
Common Stock MarketPrice
High LowDividendsDeclared
2017First Quarter $ 13.85 $ 12.00 $ 0.075Second Quarter 14.18 12.68 0.075Third Quarter 13.98 12.65 0.075Fourth Quarter 15.85 13.94 0.0752016First Quarter $ 13.36 $ 10.71 $ 0.050Second Quarter 13.71 11.95 0.050Third Quarter 14.70 12.19 0.050Fourth Quarter 14.09 12.24 0.075
During 2017 and 2016, the Company paid cash dividends of $93.4 million and $64.4 million, respectively.
GPHC depends on GPI for cash to pay dividends. Unless GPHC receives dividends, distributions or transfers from its subsidiaries, it cannot pay cash dividends on its common stock, because it has no independent operations. Such dividends, distributions or transfers from GPHC’s subsidiaries may be restricted because the terms of the GPI’s debt agreements and indentures limit its ability to make such payments to the Company. See "Item 1A-Risk Factors" and Note - 5 in the Notes to Consolidated Financial Statements in "Item 8-Financial Statements and Supplementary Data."
On January 10, 2017, the Company's board of directors authorized an additional share repurchase program to allow the Company to purchase up to $250 million of the Company's issued and outstanding shares of common stock through open market purchases, privately negotiated transactions and Rule 10b5-1 plans (the "2017 share repurchase program"). The original $250 million share repurchase program was authorized on February 4, 2015 (the "2015 share repurchase program"). During 2017, the Company repurchased approximately 4.5 million shares, at a price of approximately $58 million, at an average price of $13.08, including 1.4 million shares repurchased under the 2015 share repurchase program, which completed that program. During 2016, the Company repurchased approximately 13.2 million shares, or approximately $169 million, under the 2015 share repurchase program at an average price of $12.77.
On February 5, 2018, there were 1,328 stockholders of record and approximately 26,400 beneficial holders of GPHC’s common stock.
During the fourth quarter of 2017, the Company did not repurchase any shares of its common stock. As of December 31, 2017, 22.3 million shares had been repurchased as part of the share repurchase programs described above. The maximum number of shares that may be purchased under the 2017 share repurchase program in the future is 13.6 million based on the closing price of the Company's common stock as of December 29, 2017.
There were no sales of unregistered securities of the Company during 2017.
22
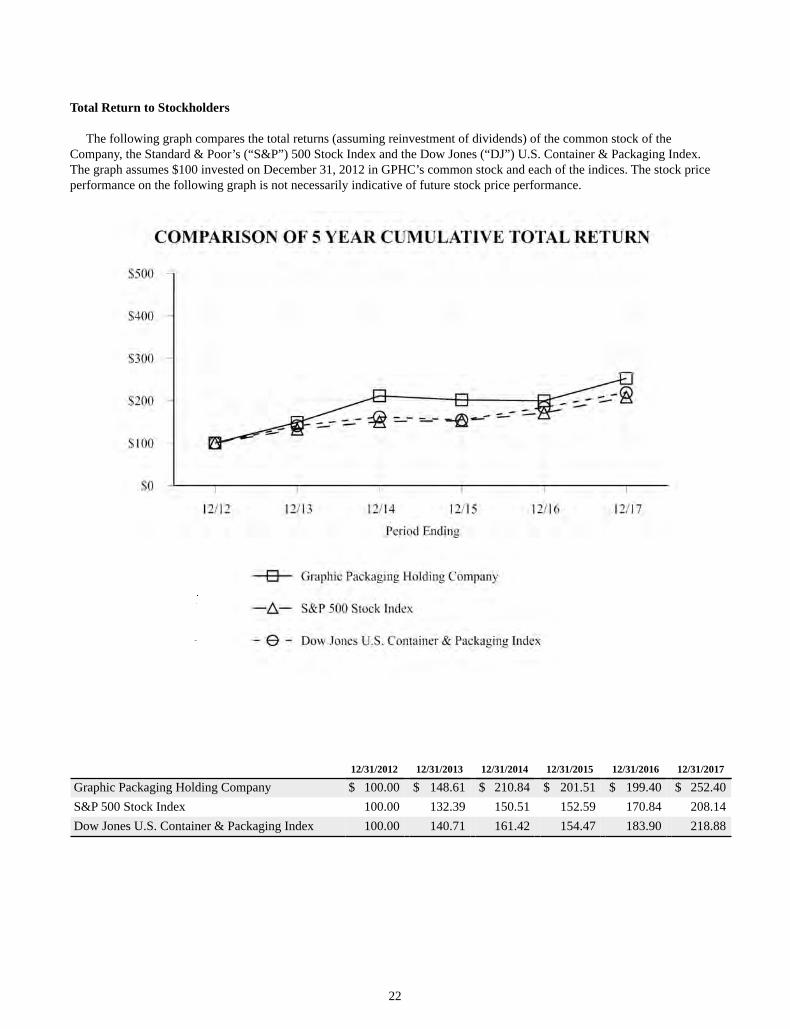
Total Return to Stockholders
The following graph compares the total returns (assuming reinvestment of dividends) of the common stock of the Company, the Standard & Poor’s (“S&P”) 500 Stock Index and the Dow Jones (“DJ”) U.S. Container & Packaging Index. The graph assumes $100 invested on December 31, 2012 in GPHC’s common stock and each of the indices. The stock price performance on the following graph is not necessarily indicative of future stock price performance.
12/31/2012 12/31/2013 12/31/2014 12/31/2015 12/31/2016 12/31/2017
Graphic Packaging Holding Company $ 100.00 $ 148.61 $ 210.84 $ 201.51 $ 199.40 $ 252.40S&P 500 Stock Index 100.00 132.39 150.51 152.59 170.84 208.14Dow Jones U.S. Container & Packaging Index 100.00 140.71 161.42 154.47 183.90 218.88
23
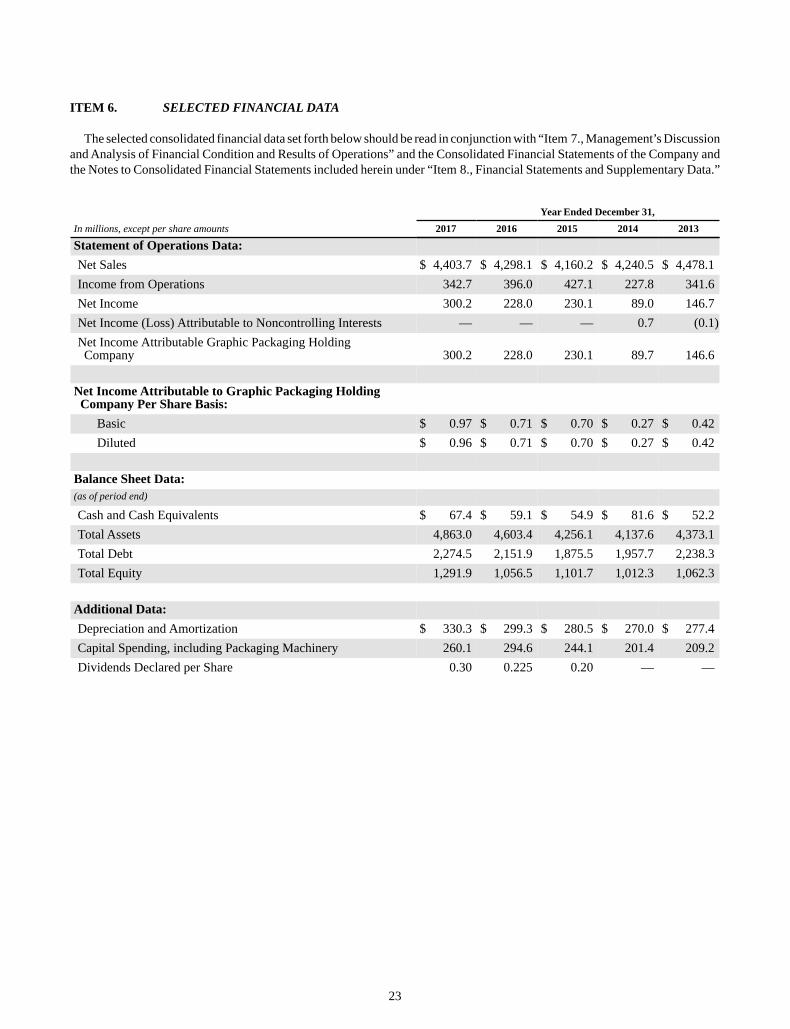
ITEM 6. SELECTED FINANCIAL DATA
The selected consolidated financial data set forth below should be read in conjunction with “Item 7., Management’s Discussion and Analysis of Financial Condition and Results of Operations” and the Consolidated Financial Statements of the Company and the Notes to Consolidated Financial Statements included herein under “Item 8., Financial Statements and Supplementary Data.”
Year Ended December 31,In millions, except per share amounts 2017 2016 2015 2014 2013
Statement of Operations Data:Net Sales $ 4,403.7 $ 4,298.1 $ 4,160.2 $ 4,240.5 $ 4,478.1Income from Operations 342.7 396.0 427.1 227.8 341.6Net Income 300.2 228.0 230.1 89.0 146.7Net Income (Loss) Attributable to Noncontrolling Interests — — — 0.7 (0.1)Net Income Attributable Graphic Packaging HoldingCompany 300.2 228.0 230.1 89.7 146.6
Net Income Attributable to Graphic Packaging HoldingCompany Per Share Basis:
Basic $ 0.97 $ 0.71 $ 0.70 $ 0.27 $ 0.42Diluted $ 0.96 $ 0.71 $ 0.70 $ 0.27 $ 0.42
Balance Sheet Data:(as of period end)
Cash and Cash Equivalents $ 67.4 $ 59.1 $ 54.9 $ 81.6 $ 52.2Total Assets 4,863.0 4,603.4 4,256.1 4,137.6 4,373.1Total Debt 2,274.5 2,151.9 1,875.5 1,957.7 2,238.3Total Equity 1,291.9 1,056.5 1,101.7 1,012.3 1,062.3
Additional Data:Depreciation and Amortization $ 330.3 $ 299.3 $ 280.5 $ 270.0 $ 277.4Capital Spending, including Packaging Machinery 260.1 294.6 244.1 201.4 209.2Dividends Declared per Share 0.30 0.225 0.20 — —
24
ITEM 7. MANAGEMENT’S DISCUSSION AND ANALYSIS OF FINANCIAL CONDITION AND RESULTS OF OPERATIONS
INTRODUCTION
This management’s discussion and analysis of financial conditions and results of operations is intended to provide investors with an understanding of the Company’s past performance, financial condition and prospects. The following will be discussed and analyzed:
Overview of Business
Overview of 2017 Results
Results of Operations
Financial Condition, Liquidity and Capital Resources
Critical Accounting Policies
New Accounting Standards
Business Outlook
OVERVIEW OF BUSINESS
The Company’s objective is to strengthen its position as a leading provider of paper-based packaging solutions. To achieve this objective, the Company offers customers its paperboard, cartons and packaging machines, either as an integrated solution or separately. Cartons and carriers are designed to protect and contain products. Product offerings include a variety of laminated, coated and printed packaging structures that are produced from the Company’s coated unbleached kraft (“CUK”) and coated recycled board (“CRB”), as well as other grades of paperboard that are purchased from third party suppliers. Innovative designs and combinations of paperboard, films, foils, metallization, holographics and embossing are customized to the individual needs of the customers.
The Company is implementing strategies (i) to expand market share in its current markets and to identify and penetrate new markets; (ii) to capitalize on the Company’s customer relationships, business competencies, and mills and folding carton assets; (iii) to develop and market innovative, sustainable products and applications; and (iv) to continue to reduce costs by focusing on operational improvements. The Company’s ability to fully implement its strategies and achieve its objectives may be influenced by a variety of factors, many of which are beyond its control, such as inflation of raw material and other costs, which the Company cannot always pass through to its customers, and the effect of overcapacity in the worldwide paperboard packaging industry.
Significant Factors That Impact The Company’s Business and Results of Operations
Impact of Inflation/Deflation. The Company’s cost of sales consists primarily of energy (including natural gas, fuel oil and electricity), pine pulpwood, chemicals, secondary fibers, purchased paperboard, aluminum foil, ink, plastic films and resins, depreciation expense and labor. Costs increased year over year by $95.8 million in 2017 and increased year over year by $25.0 million in 2016. The higher costs in 2017 were primarily due to secondary fiber ($40.1 million), labor and benefits ($22.5 million), freight ($15.6 million), chemicals ($14.3 million) and other costs, net ($3.3 million).
Because the price of natural gas experiences significant volatility, the Company has entered into contracts designed to manage risks associated with future variability in cash flows caused by changes in the price of natural gas. The Company has entered into natural gas swap contracts to hedge prices for a portion of its expected usage for 2018. Since negotiated sales contracts and the market largely determine the pricing for its products, the Company is at times limited in its ability to raise prices and pass through to its customers any inflationary or other cost increases that the Company may incur.
25
Commitment to Cost Reduction. In light of increasing margin pressure throughout the packaging industry, the Company has programs in place that are designed to reduce costs, improve productivity and increase profitability. The Company utilizes a global continuous improvement initiative that uses statistical process control to help design and manage many types of activities, including production and maintenance. This includes a Six Sigma process focused on reducing variable and fixed manufacturing and administrative costs. The Company has expanded the continuous improvement initiative to include the deployment of Lean Sigma principles into manufacturing and supply chain services.
The Company’s ability to continue to successfully implement its business strategies and to realize anticipated savings and operating efficiencies is subject to significant business, economic and competitive uncertainties and contingencies, many of which are beyond the Company’s control. If the Company cannot successfully implement the strategic cost reductions or other cost savings plans it may not be able to continue to compete successfully against other manufacturers. In addition, any failure to generate the anticipated efficiencies and savings could adversely affect the Company’s financial results.
Competition and Market Factors. As some products can be packaged in different types of materials, the Company’s sales are affected by competition from other manufacturers’ CUK board, CRB and other paper substrates such as solid bleached sulfate ("SBS") and recycled clay-coated news. Additional substitute products also include plastic, shrink film and corrugated containers. In addition, while the Company has long-term relationships with many of its customers, the underlying contracts may be re-bid or renegotiated from time to time, and the Company may not be successful in renewing on favorable terms or at all. The Company works to maintain market share through efficiency, product innovation and strategic sourcing to its customers; however, pricing and other competitive pressures may occasionally result in the loss of a customer relationship.
In addition, the Company’s sales historically are driven by consumer buying habits in the markets its customers serve. Changes in consumer dietary habits and preferences, increases in the costs of living, unemployment rates, access to credit markets, as well as other macroeconomic factors, may negatively affect consumer spending behavior. New product introductions and promotional activity by the Company’s customers and the Company’s introduction of new packaging products also impact its sales.
Debt Obligations. The Company had an aggregate principal amount of $2,287.0 million of outstanding debt obligations as of December 31, 2017. This debt has consequences for the Company, as it requires a portion of cash flow from operations to be used for the payment of principal and interest, exposes the Company to the risk of increased interest rates and may restrict the Company’s ability to obtain additional financing. Covenants in the Company’s Amended and Restated Credit Agreement, the Term Loan Credit Agreement and Indentures may, among other things, restrict the ability of the Company to dispose of assets, incur guarantee obligations, prepay other indebtedness, repurchase stock, pay dividends, make other restricted payments and make acquisitions or other investments. The Credit Agreement and the Term Loan Credit Agreement also require compliance with a maximum consolidated leverage ratio and a minimum consolidated interest coverage ratio. The Company’s ability to comply in future periods with the financial covenants will depend on its ongoing financial and operating performance, which in turn will be subject to many other factors, many of which are beyond the Company’s control. See “Covenant Restrictions” in “Financial Condition, Liquidity and Capital Resources” for additional information regarding the Company’s debt obligations.
The debt and the restrictions under the Amended and Restated Credit Agreement, the Term Loan Credit Agreement and the Indentures could limit the Company’s flexibility to respond to changing market conditions and competitive pressures. The outstanding debt obligations and the restrictions may also leave the Company more vulnerable to a downturn in general economic conditions or its business, or unable to carry out capital expenditures that are necessary or important to its growth strategy and productivity improvement programs.
26
OVERVIEW OF RESULTS
This management’s discussion and analysis contains an analysis of Net Sales, Income from Operations and other information relevant to an understanding of the Company's results of operations.
• Net Sales in 2017 increased by $105.6 million or 2.5%, to $4,403.7 million from $4,298.1 million in 2016 primarily due to the acquisitions discussed below and increased volume, partially offset by lower selling prices and unfavorable foreign currency exchange rates.
• Income from Operations in 2017 decreased by $53.3 million or 13.5%, to $342.7 million from $396.0 million in 2016 due to higher inflation including secondary fiber, the lower selling prices and the unfavorable foreign currency exchange rates. These decreases were partially offset by the acquisitions and cost savings through continuous improvement and other programs.
Acquisitions and Dispositions
• On December 1, 2017, the Company acquired the assets of Seydaco Packaging Corp. and its affiliates National Carton and Coating Co., and Groupe Ecco Boites Pliantes Ltée (collectively, "Seydaco"), a folding carton producer focused on the foodservice, food, personal care, and household goods markets. The acquisition includes three folding carton facilities located in Mississauga, Ontario, St.-Hyacinthe, Québec, and Xenia, Ohio.
• On December 1, 2017, the Company closed its coated recycled paperboard mill in Santa Clara, California. This decision was made as a result of a thorough assessment of the facility's manufacturing capabilities and associated costs in the context of the Company's overall mill operating capabilities and cost structure.
• On October 24, 2017, the Company announced that it would combine its business with IP's North American Consumer Packaging business. The Company will own 79.5% of the subsidiary that owns GPI and will be the sole operator of such subsidiary and the business of GPI. See Note 19 in the Notes to Consolidated Financial Statements included herein under “Item 8. Financial Statements and Supplementary Data."
• On October 4, 2017, the Company acquired Norgraft Packaging, S.A. ("Norgraft"), a leading folding carton producer in Spain focused on the food and household goods markets. The acquisition includes two folding carton facilities located in Miliaño and Requejada, Spain.
• On July 10, 2017, the Company acquired substantially all the assets of Carton Craft Corporation and its affiliate Lithocraft, Inc (collectively, "Carton Craft"). The acquisition includes two folding carton facilities located in New Albany, Indiana, focused on the production of paperboard based air filter frames and folding cartons.
The Seydaco, Norgraft, and Carton Craft transactions are referred to collectively as the "2017 Acquisitions."
• During 2016, the Company acquired G-Box, S.A. de C.V., ("G-Box"), Walter G. Anderson, Inc., ("WG Anderson"), Metro Packaging & Imaging, Inc. ("Metro"), and Colorpak Limited ("Colorpak"). These transactions are referred to collectively as the "2016 Acquisitions."
27
Capital Allocations
• On January 10, 2017, the Company's board of directors authorized an additional share repurchase program to allow the Company to purchase up to $250 million of the Company's issued and outstanding shares of common stock through open market purchases, privately negotiated transactions and Rule 10b5-1 plans (the "2017 share repurchase program"). The original $250 million share repurchase program was authorized on February 4, 2015 (the "2015 share repurchase program"). During 2017, the Company repurchased 4.5 million shares, or approximately $58 million, at an aggregate average price of $13.08, including 1.4 million shares repurchased under the 2015 share repurchase program thereby completing that plan. At December 31, 2017, the Company had approximately $210 million remaining under the 2017 share repurchase program.
• During 2017, the Company declared and paid cash dividends of $93.1 million and $93.4 million, respectively.
RESULTS OF OPERATIONS
Year Ended December 31,In millions 2017 2016 2015
Net Sales $ 4,403.7 $ 4,298.1 $ 4,160.2Income from Operations $ 342.7 $ 396.0 $ 427.1Interest Expense, Net (89.7) (76.6) (67.8)Income before Income Taxes and Equity Income of Unconsolidated Entity $ 253.0 $ 319.4 $ 359.3Income Tax Benefit (Expense) 45.5 (93.2) (130.4)Income before Equity Income of Unconsolidated Entity $ 298.5 $ 226.2 $ 228.9Equity Income of Unconsolidated Entity 1.7 1.8 1.2Net Income $ 300.2 $ 228.0 $ 230.1
2017 COMPARED WITH 2016
Net Sales
The components of the change in Net Sales are as follows:
Year Ended December 31,Variances
In millions 2016 Price
Volume/Mix
ForeignExchange 2017 Increase
PercentChange
Consolidated $ 4,298.1 $ (27.1) $ 135.6 $ (2.9) $ 4,403.7 $ 105.6 2.5%
The Company's Net Sales in 2017 increased by $105.6 million or 2.5%, to $4,403.7 million from $4,298.1 million for the same period in 2016, due to Net Sales of $106.9 million from the 2017 Acquisitions and the 2016 Acquisitions and increased converting volume, including new product introductions. These increases were partially offset by lower selling prices and unfavorable currency exchange rates, primarily the British pound. Global beverage volume increased, while softness continued in certain consumer product markets (cereal and dry foods).
28
Income from Operations
The components of the change in Income from Operations are as follows:
Year Ended December 31,
Variances
In millions 2016 PriceVolume/
Mix InflationForeign
Exchange Other (a) 2017 DecreasePercentChange
Consolidated $396.0 $ (27.1) $ (0.8) $ (95.8) $ (3.0) $ 73.4 $342.7 $ (53.3) (13.5)%(a) Includes the Company’s cost reduction initiatives, sales of assets, expenses related to acquisitions, integration activities,
and shutdown costs.
The Company's Income from Operations for 2017 decreased $53.3 million or 13.5%, to $342.7 million from $396.0 millionfor the same period in 2016 due to higher inflation, including the impact of the hurricanes, the lower selling prices, and higher depreciation and amortization expense related to the acquisitions and the shutdown of Santa Clara. These decreases were partially offset by cost savings through continuous improvement and other programs, lower restricted stock unit expense and lower costs associated with acquisitions and integration. Inflation for 2017 increased primarily due to secondary fiber ($40.1 million), labor and benefits ($22.5 million), freight ($15.6 million), chemicals ($14.3 million) and other costs, net ($3.3 million).
Interest Expense, Net
Interest Expense, Net increased by $13.1 million to $89.7 million in 2017 from $76.6 million in 2016. Interest Expense, Net increased due primarily to higher average interest rates as compared to the same period in the prior year. As of December 31, 2017, approximately 45% of the Company’s total debt was subject to floating interest rates.
Income Tax Expense
During 2017, the Company recognized Income Tax Benefit of $45.5 million on Income before Income Taxes and Equity Income of Unconsolidated Entity of $253.0 million. During 2016, the Company recognized Income Tax Expense of $93.2 millionon Income before Income Taxes and Equity Income of Unconsolidated Entity of $319.4 million. The effective tax rate for 2017is significantly different than the statutory rate primarily due to the effect of the enactment of the Tax Cuts and Jobs Act (the "Act") on December 22, 2017. The Act significantly reduced U.S. federal corporate income tax rates which resulted in an income tax benefit in the current year of $156.3 million as a result of the remeasurement of the Company’s domestic net Deferred Tax Liabilities. In addition, the Act requires companies to record a one-time transition tax impact based on foreign earnings and profits which resulted in additional tax expense in the current year of $20.5 million.
The Company has available net operating losses ("NOLs") of approximately $327 million for U.S. federal income tax purposes
which may be used to offset future taxable income. Based on these NOLs and other tax benefits as well as the impact of U.S. tax reform on projections of future taxable income, the Company does not expect to be a meaningful U.S. federal cash taxpayer until 2021.
Equity Income of Unconsolidated Entity
Equity Income of Unconsolidated Entity was $1.7 million in 2017 and $1.8 million in 2016 and is related to the Company’s equity investment in the joint venture, Rengo Riverwood Packaging, Ltd.
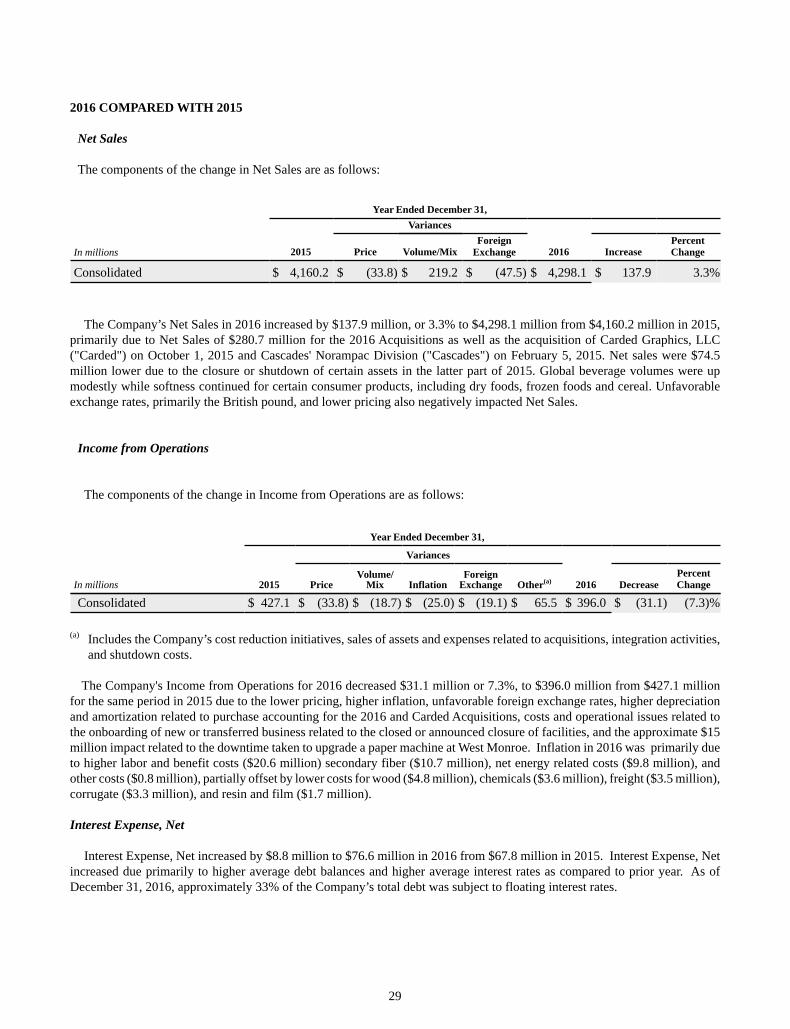
29
2016 COMPARED WITH 2015
Net Sales
The components of the change in Net Sales are as follows:
Year Ended December 31,Variances
In millions 2015 Price Volume/Mix
ForeignExchange 2016 Increase
PercentChange
Consolidated $ 4,160.2 $ (33.8) $ 219.2 $ (47.5) $ 4,298.1 $ 137.9 3.3%
The Company’s Net Sales in 2016 increased by $137.9 million, or 3.3% to $4,298.1 million from $4,160.2 million in 2015, primarily due to Net Sales of $280.7 million for the 2016 Acquisitions as well as the acquisition of Carded Graphics, LLC ("Carded") on October 1, 2015 and Cascades' Norampac Division ("Cascades") on February 5, 2015. Net sales were $74.5 million lower due to the closure or shutdown of certain assets in the latter part of 2015. Global beverage volumes were up modestly while softness continued for certain consumer products, including dry foods, frozen foods and cereal. Unfavorable exchange rates, primarily the British pound, and lower pricing also negatively impacted Net Sales.
Income from Operations
The components of the change in Income from Operations are as follows:
Year Ended December 31,
Variances
In millions 2015 PriceVolume/
Mix InflationForeign
Exchange Other(a) 2016 DecreasePercentChange
Consolidated $ 427.1 $ (33.8) $ (18.7) $ (25.0) $ (19.1) $ 65.5 $ 396.0 $ (31.1) (7.3)%
(a) Includes the Company’s cost reduction initiatives, sales of assets and expenses related to acquisitions, integration activities, and shutdown costs.
The Company's Income from Operations for 2016 decreased $31.1 million or 7.3%, to $396.0 million from $427.1 million for the same period in 2015 due to the lower pricing, higher inflation, unfavorable foreign exchange rates, higher depreciation and amortization related to purchase accounting for the 2016 and Carded Acquisitions, costs and operational issues related to the onboarding of new or transferred business related to the closed or announced closure of facilities, and the approximate $15 million impact related to the downtime taken to upgrade a paper machine at West Monroe. Inflation in 2016 was primarily due to higher labor and benefit costs ($20.6 million) secondary fiber ($10.7 million), net energy related costs ($9.8 million), and other costs ($0.8 million), partially offset by lower costs for wood ($4.8 million), chemicals ($3.6 million), freight ($3.5 million), corrugate ($3.3 million), and resin and film ($1.7 million).
Interest Expense, Net
Interest Expense, Net increased by $8.8 million to $76.6 million in 2016 from $67.8 million in 2015. Interest Expense, Net increased due primarily to higher average debt balances and higher average interest rates as compared to prior year. As of December 31, 2016, approximately 33% of the Company’s total debt was subject to floating interest rates.
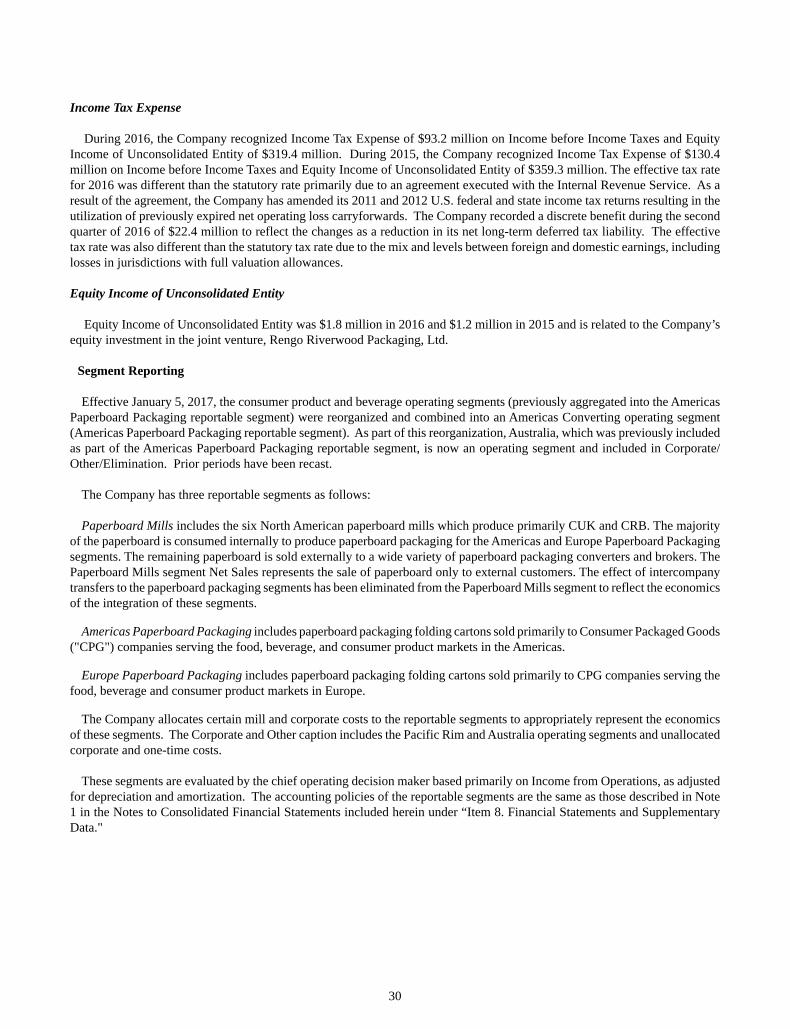
30
Income Tax Expense
During 2016, the Company recognized Income Tax Expense of $93.2 million on Income before Income Taxes and Equity Income of Unconsolidated Entity of $319.4 million. During 2015, the Company recognized Income Tax Expense of $130.4 million on Income before Income Taxes and Equity Income of Unconsolidated Entity of $359.3 million. The effective tax rate for 2016 was different than the statutory rate primarily due to an agreement executed with the Internal Revenue Service. As a result of the agreement, the Company has amended its 2011 and 2012 U.S. federal and state income tax returns resulting in the utilization of previously expired net operating loss carryforwards. The Company recorded a discrete benefit during the second quarter of 2016 of $22.4 million to reflect the changes as a reduction in its net long-term deferred tax liability. The effective tax rate was also different than the statutory tax rate due to the mix and levels between foreign and domestic earnings, including losses in jurisdictions with full valuation allowances.
Equity Income of Unconsolidated Entity
Equity Income of Unconsolidated Entity was $1.8 million in 2016 and $1.2 million in 2015 and is related to the Company’s equity investment in the joint venture, Rengo Riverwood Packaging, Ltd.
Segment Reporting
Effective January 5, 2017, the consumer product and beverage operating segments (previously aggregated into the Americas Paperboard Packaging reportable segment) were reorganized and combined into an Americas Converting operating segment (Americas Paperboard Packaging reportable segment). As part of this reorganization, Australia, which was previously included as part of the Americas Paperboard Packaging reportable segment, is now an operating segment and included in Corporate/Other/Elimination. Prior periods have been recast.
The Company has three reportable segments as follows:
Paperboard Mills includes the six North American paperboard mills which produce primarily CUK and CRB. The majority of the paperboard is consumed internally to produce paperboard packaging for the Americas and Europe Paperboard Packaging segments. The remaining paperboard is sold externally to a wide variety of paperboard packaging converters and brokers. The Paperboard Mills segment Net Sales represents the sale of paperboard only to external customers. The effect of intercompany transfers to the paperboard packaging segments has been eliminated from the Paperboard Mills segment to reflect the economics of the integration of these segments.
Americas Paperboard Packaging includes paperboard packaging folding cartons sold primarily to Consumer Packaged Goods ("CPG") companies serving the food, beverage, and consumer product markets in the Americas.
Europe Paperboard Packaging includes paperboard packaging folding cartons sold primarily to CPG companies serving the food, beverage and consumer product markets in Europe.
The Company allocates certain mill and corporate costs to the reportable segments to appropriately represent the economics of these segments. The Corporate and Other caption includes the Pacific Rim and Australia operating segments and unallocated corporate and one-time costs.
These segments are evaluated by the chief operating decision maker based primarily on Income from Operations, as adjusted for depreciation and amortization. The accounting policies of the reportable segments are the same as those described in Note 1 in the Notes to Consolidated Financial Statements included herein under “Item 8. Financial Statements and Supplementary Data."
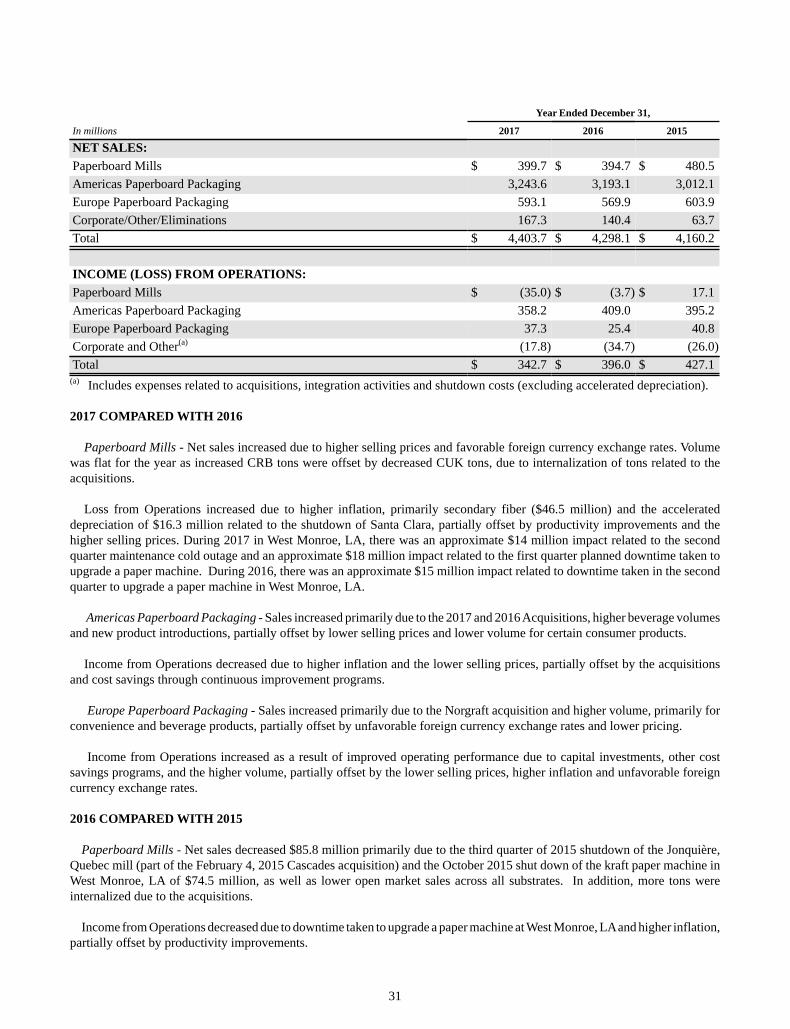
31
Year Ended December 31,
In millions 2017 2016 2015
NET SALES:Paperboard Mills $ 399.7 $ 394.7 $ 480.5Americas Paperboard Packaging 3,243.6 3,193.1 3,012.1Europe Paperboard Packaging 593.1 569.9 603.9Corporate/Other/Eliminations 167.3 140.4 63.7Total $ 4,403.7 $ 4,298.1 $ 4,160.2
INCOME (LOSS) FROM OPERATIONS:Paperboard Mills $ (35.0) $ (3.7) $ 17.1Americas Paperboard Packaging 358.2 409.0 395.2Europe Paperboard Packaging 37.3 25.4 40.8Corporate and Other(a) (17.8) (34.7) (26.0)Total $ 342.7 $ 396.0 $ 427.1
(a) Includes expenses related to acquisitions, integration activities and shutdown costs (excluding accelerated depreciation).
2017 COMPARED WITH 2016 Paperboard Mills - Net sales increased due to higher selling prices and favorable foreign currency exchange rates. Volume
was flat for the year as increased CRB tons were offset by decreased CUK tons, due to internalization of tons related to the acquisitions.
Loss from Operations increased due to higher inflation, primarily secondary fiber ($46.5 million) and the accelerated depreciation of $16.3 million related to the shutdown of Santa Clara, partially offset by productivity improvements and the higher selling prices. During 2017 in West Monroe, LA, there was an approximate $14 million impact related to the second quarter maintenance cold outage and an approximate $18 million impact related to the first quarter planned downtime taken to upgrade a paper machine. During 2016, there was an approximate $15 million impact related to downtime taken in the second quarter to upgrade a paper machine in West Monroe, LA.
Americas Paperboard Packaging - Sales increased primarily due to the 2017 and 2016 Acquisitions, higher beverage volumes
and new product introductions, partially offset by lower selling prices and lower volume for certain consumer products.
Income from Operations decreased due to higher inflation and the lower selling prices, partially offset by the acquisitions and cost savings through continuous improvement programs.
Europe Paperboard Packaging - Sales increased primarily due to the Norgraft acquisition and higher volume, primarily for
convenience and beverage products, partially offset by unfavorable foreign currency exchange rates and lower pricing.
Income from Operations increased as a result of improved operating performance due to capital investments, other cost savings programs, and the higher volume, partially offset by the lower selling prices, higher inflation and unfavorable foreign currency exchange rates.
2016 COMPARED WITH 2015 Paperboard Mills - Net sales decreased $85.8 million primarily due to the third quarter of 2015 shutdown of the Jonquière,
Quebec mill (part of the February 4, 2015 Cascades acquisition) and the October 2015 shut down of the kraft paper machine in West Monroe, LA of $74.5 million, as well as lower open market sales across all substrates. In addition, more tons were internalized due to the acquisitions.
Income from Operations decreased due to downtime taken to upgrade a paper machine at West Monroe, LA and higher inflation, partially offset by productivity improvements.
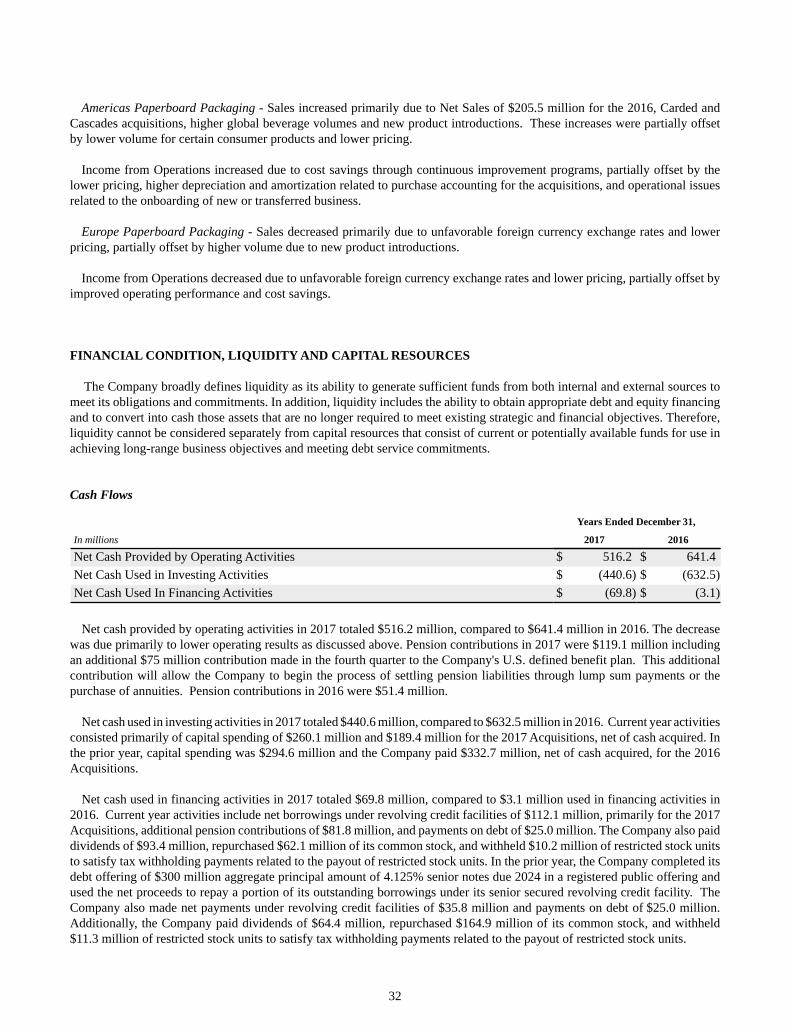
32
Americas Paperboard Packaging - Sales increased primarily due to Net Sales of $205.5 million for the 2016, Carded and Cascades acquisitions, higher global beverage volumes and new product introductions. These increases were partially offset by lower volume for certain consumer products and lower pricing.
Income from Operations increased due to cost savings through continuous improvement programs, partially offset by the lower pricing, higher depreciation and amortization related to purchase accounting for the acquisitions, and operational issues related to the onboarding of new or transferred business.
Europe Paperboard Packaging - Sales decreased primarily due to unfavorable foreign currency exchange rates and lower
pricing, partially offset by higher volume due to new product introductions.
Income from Operations decreased due to unfavorable foreign currency exchange rates and lower pricing, partially offset by improved operating performance and cost savings.
FINANCIAL CONDITION, LIQUIDITY AND CAPITAL RESOURCES
The Company broadly defines liquidity as its ability to generate sufficient funds from both internal and external sources to meet its obligations and commitments. In addition, liquidity includes the ability to obtain appropriate debt and equity financing and to convert into cash those assets that are no longer required to meet existing strategic and financial objectives. Therefore, liquidity cannot be considered separately from capital resources that consist of current or potentially available funds for use in achieving long-range business objectives and meeting debt service commitments.
Cash Flows
Years Ended December 31,
In millions 2017 2016
Net Cash Provided by Operating Activities $ 516.2 $ 641.4Net Cash Used in Investing Activities $ (440.6) $ (632.5)Net Cash Used In Financing Activities $ (69.8) $ (3.1)
Net cash provided by operating activities in 2017 totaled $516.2 million, compared to $641.4 million in 2016. The decreasewas due primarily to lower operating results as discussed above. Pension contributions in 2017 were $119.1 million including an additional $75 million contribution made in the fourth quarter to the Company's U.S. defined benefit plan. This additional contribution will allow the Company to begin the process of settling pension liabilities through lump sum payments or the purchase of annuities. Pension contributions in 2016 were $51.4 million.
Net cash used in investing activities in 2017 totaled $440.6 million, compared to $632.5 million in 2016. Current year activities consisted primarily of capital spending of $260.1 million and $189.4 million for the 2017 Acquisitions, net of cash acquired. In the prior year, capital spending was $294.6 million and the Company paid $332.7 million, net of cash acquired, for the 2016 Acquisitions.
Net cash used in financing activities in 2017 totaled $69.8 million, compared to $3.1 million used in financing activities in 2016. Current year activities include net borrowings under revolving credit facilities of $112.1 million, primarily for the 2017 Acquisitions, additional pension contributions of $81.8 million, and payments on debt of $25.0 million. The Company also paid dividends of $93.4 million, repurchased $62.1 million of its common stock, and withheld $10.2 million of restricted stock units to satisfy tax withholding payments related to the payout of restricted stock units. In the prior year, the Company completed its debt offering of $300 million aggregate principal amount of 4.125% senior notes due 2024 in a registered public offering and used the net proceeds to repay a portion of its outstanding borrowings under its senior secured revolving credit facility. The Company also made net payments under revolving credit facilities of $35.8 million and payments on debt of $25.0 million. Additionally, the Company paid dividends of $64.4 million, repurchased $164.9 million of its common stock, and withheld $11.3 million of restricted stock units to satisfy tax withholding payments related to the payout of restricted stock units.
33
Liquidity and Capital Resources
The Company's liquidity needs arise primarily from debt service on its indebtedness and from the funding of its capital expenditures, ongoing operating costs, working capital, share repurchases and dividend payments. Principal and interest payments under the term loan facilities and the revolving credit facilities, together with principal and interest payments on the Company's 4.75% Senior Notes due 2021, 4.875% Senior Notes due 2022 and 4.125% Senior Notes due 2024 (the “Notes”), represent liquidity requirements for the Company. Based upon current levels of operations, anticipated cost savings and expectations as to future growth, the Company believes that cash generated from operations, together with amounts available under its revolving credit facilities and other available financing sources, will be adequate to permit the Company to meet its debt service obligations, necessary capital expenditure program requirements and ongoing operating costs and working capital needs, although no assurance can be given in this regard. The Company's future financial and operating performance, ability to service or refinance its debt and ability to comply with the covenants and restrictions contained in its debt agreements (see “Covenant Restrictions” below) will be subject to future economic conditions, including conditions in the credit markets, and to financial, business and other factors, many of which are beyond the Company's control, and will be substantially dependent on the selling prices and demand for the Company's products, raw material and energy costs, and the Company's ability to successfully implement its overall business and profitability strategies.
As of December 31, 2017, the Company had approximately $327 million of NOLs for U.S. federal income tax purposes. These NOLs generally may be used by the Company to offset taxable income earned in subsequent taxable years.
Accounts receivable are stated at the amount owed by the customer, net of an allowance for estimated uncollectible accounts, returns and allowances, and cash discounts. The allowance for doubtful accounts is estimated based on historical experience, current economic conditions and the creditworthiness of customers. Receivables are charged to the allowance when determined to be no longer collectible.
In addition to existing receivable sale programs from prior years, the Company entered into a receivable securitization agreement in the fourth quarter of 2017 to sell, on a revolving basis, certain trade accounts receivable to a third party financial institution (the “2017 Agreement”). The 2017 Agreement and existing agreements are referred to collectively as the "Agreements" and meet the requirements to be accounted for as sales in accordance with the Transfers and Servicing topic of the FASB Codification. During 2017, under these Agreements, the Company sold and derecognized $1.8 billion of receivables, collected $1.6 billion on behalf of the financial institutions, and received funding of approximately $134 million by the financial institutions, resulting in deferred proceeds of approximately $102 million as of December 31, 2017. During 2016 under the Agreements, the Company sold and derecognized $1.3 billion of receivables, collected approximately $1.2 billion on behalf of the financial institutions, and received funding of approximately $116 million by the financial institutions, resulting in deferred proceeds of approximately $31 million as of December 31, 2016. Cash proceeds related to the sales are included in cash from operating activities on the Consolidated Statements of Cash Flows in the Changes in Operating Assets and Liabilities line item. The loss on sale is not material and is included in Other Expense (Income), Net line item on the Consolidated Statement of Operations.
The Company has also entered into various factoring and supply chain financing arrangements which also qualify for sale accounting in accordance with the Transfers and Servicing topic of the FASB Codification. For the years ended December 31, 2017 and 2016, the Company sold receivables of approximately $64 million and $66 million, respectively, related to these factoring arrangements.
Receivables sold under all programs subject to continuing involvement, which consist principally of collection services, were approximately $583 million and $376 million as of December 31, 2017 and 2016, respectively.
34
Covenant Restrictions
Covenants contained in the Amended and Restated Credit Agreement, the Term Loan Credit Agreement and the Indentures may, among other things, limit the ability to incur additional indebtedness, restrict the ability of the Company to dispose of assets, incur guarantee obligations, prepay other indebtedness, repurchase shares, pay dividends and make other restricted payments, create liens, make equity or debt investments, make acquisitions, modify terms of the indentures under which the Notes are issued, engage in mergers or consolidations, change the business conducted by the Company and its subsidiaries, and engage in certain transactions with affiliates. Such restrictions, together with disruptions in the credit markets, could limit the Company's ability to respond to changing market conditions, fund its capital spending program, provide for unexpected capital investments or take advantage of business opportunities.
Under the terms of the Amended and Restated Credit Agreement, the Company must comply with a maximum Consolidated Total Leverage Ratio covenant and a minimum Consolidated Interest Expense Ratio covenant. The Third Amended and Restated Credit Agreement, which contains the definitions of these covenants, was filed as an exhibit to the Company's Form 8-K filed on January 2, 2018.
The Company must maintain a maximum Consolidated Total Leverage Ratio of less than 4.25 to 1.00. At December 31, 2017, the Company was in compliance with the Consolidated Total Leverage Ratio covenant in the Credit Agreement and the ratio was 3.01 to 1.00.
The Company must also comply with a minimum Consolidated Interest Expense Ratio of 3.00 to 1.00. At December 31, 2017, the Company was in compliance with the minimum Consolidated Interest Expense Ratio covenant in the Credit Agreement and the ratio was 8.66 to 1.00.
As of December 31, 2017, the Company's credit was rated BB+ by Standard & Poor's and Ba1 by Moody's Investor Services. Standard & Poor's and Moody's Investor Services' ratings on the Company included a stable outlook.
Capital Investment
The Company’s capital investment in 2017 was $264.5 million ($260.1 million was paid), compared to $280.0 million ($294.6 million was paid) in 2016. During 2017, the Company had capital spending of $213.1 million for improving process capabilities, $32.2 million for capital spares and $19.2 million for manufacturing packaging machinery.
Environmental Matters
Some of the Company’s current and former facilities are the subject of environmental investigations and remediations resulting from historical operations and the release of hazardous substances or other constituents. Some current and former facilities have a history of industrial usage for which investigation and remediation obligations may be imposed in the future or for which indemnification claims may be asserted against the Company. Also, closures or sales of facilities may necessitate further investigation and may result in remediation at those facilities. The Company has established reserves for those facilities or issues where liability is probable and the costs are reasonably estimable.
For further discussion of the Company’s environmental matters, see Note 13 in the Notes to Consolidated Financial Statements included herein under “Item 8., Financial Statements and Supplementary Data.”
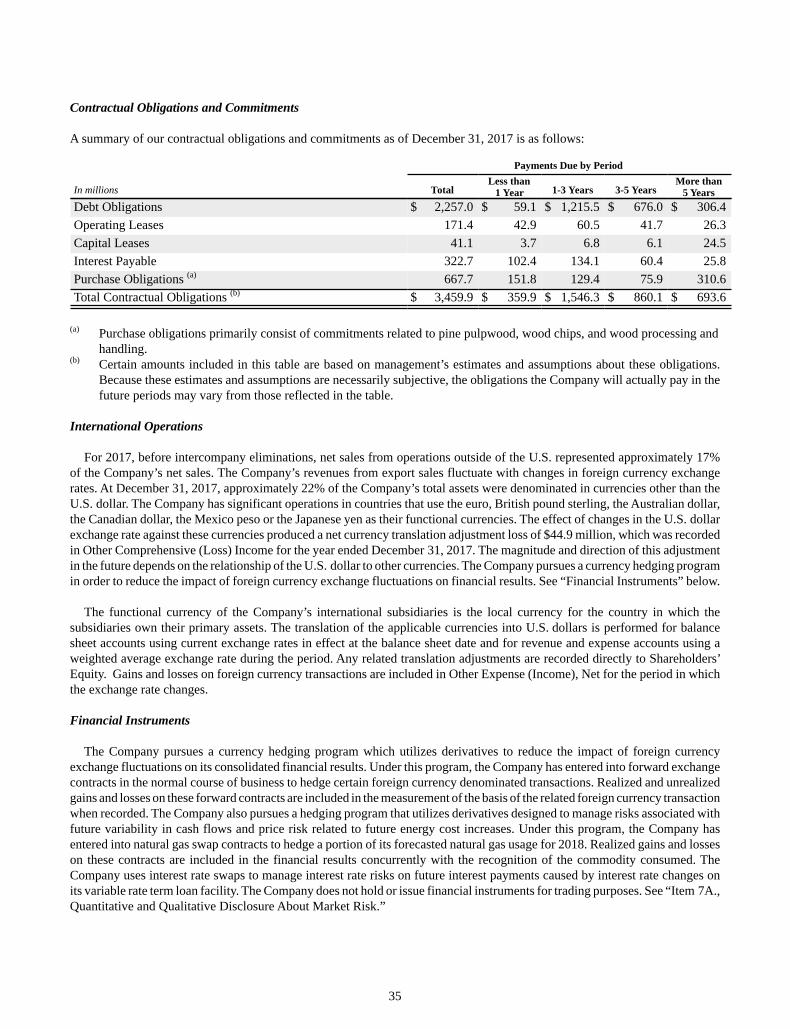
35
Contractual Obligations and Commitments
A summary of our contractual obligations and commitments as of December 31, 2017 is as follows:
Payments Due by Period
In millions TotalLess than
1 Year 1-3 Years 3-5 YearsMore than
5 YearsDebt Obligations $ 2,257.0 $ 59.1 $ 1,215.5 $ 676.0 $ 306.4Operating Leases 171.4 42.9 60.5 41.7 26.3Capital Leases 41.1 3.7 6.8 6.1 24.5Interest Payable 322.7 102.4 134.1 60.4 25.8Purchase Obligations (a) 667.7 151.8 129.4 75.9 310.6Total Contractual Obligations (b) $ 3,459.9 $ 359.9 $ 1,546.3 $ 860.1 $ 693.6
(a) Purchase obligations primarily consist of commitments related to pine pulpwood, wood chips, and wood processing andhandling.
(b) Certain amounts included in this table are based on management’s estimates and assumptions about these obligations. Because these estimates and assumptions are necessarily subjective, the obligations the Company will actually pay in the future periods may vary from those reflected in the table.
International Operations
For 2017, before intercompany eliminations, net sales from operations outside of the U.S. represented approximately 17%of the Company’s net sales. The Company’s revenues from export sales fluctuate with changes in foreign currency exchange rates. At December 31, 2017, approximately 22% of the Company’s total assets were denominated in currencies other than the U.S. dollar. The Company has significant operations in countries that use the euro, British pound sterling, the Australian dollar, the Canadian dollar, the Mexico peso or the Japanese yen as their functional currencies. The effect of changes in the U.S. dollar exchange rate against these currencies produced a net currency translation adjustment loss of $44.9 million, which was recorded in Other Comprehensive (Loss) Income for the year ended December 31, 2017. The magnitude and direction of this adjustment in the future depends on the relationship of the U.S. dollar to other currencies. The Company pursues a currency hedging program in order to reduce the impact of foreign currency exchange fluctuations on financial results. See “Financial Instruments” below.
The functional currency of the Company’s international subsidiaries is the local currency for the country in which the subsidiaries own their primary assets. The translation of the applicable currencies into U.S. dollars is performed for balance sheet accounts using current exchange rates in effect at the balance sheet date and for revenue and expense accounts using a weighted average exchange rate during the period. Any related translation adjustments are recorded directly to Shareholders’ Equity. Gains and losses on foreign currency transactions are included in Other Expense (Income), Net for the period in which the exchange rate changes.
Financial Instruments
The Company pursues a currency hedging program which utilizes derivatives to reduce the impact of foreign currency exchange fluctuations on its consolidated financial results. Under this program, the Company has entered into forward exchange contracts in the normal course of business to hedge certain foreign currency denominated transactions. Realized and unrealized gains and losses on these forward contracts are included in the measurement of the basis of the related foreign currency transaction when recorded. The Company also pursues a hedging program that utilizes derivatives designed to manage risks associated with future variability in cash flows and price risk related to future energy cost increases. Under this program, the Company has entered into natural gas swap contracts to hedge a portion of its forecasted natural gas usage for 2018. Realized gains and losses on these contracts are included in the financial results concurrently with the recognition of the commodity consumed. The Company uses interest rate swaps to manage interest rate risks on future interest payments caused by interest rate changes on its variable rate term loan facility. The Company does not hold or issue financial instruments for trading purposes. See “Item 7A., Quantitative and Qualitative Disclosure About Market Risk.”

36
CRITICAL ACCOUNTING POLICIES
The preparation of financial statements in conformity with U.S. GAAP requires management to make estimates and assumptions that affect the reported amounts of assets and liabilities at the date of the financial statements and the reported amounts of net sales and expenses during the reporting period. Actual results could differ from these estimates, and changes in these estimates are recorded when known. The critical accounting policies used by management in the preparation of the Company’s consolidated financial statements are those that are important both to the presentation of the Company’s financial condition and results of operations and require significant judgments by management with regard to estimates used. The critical judgments by management relate to pension benefits, retained insurable risks, future cash flows associated with impairment testing for goodwill and long-lived assets, and deferred income taxes.
• Pension Benefits
The Company sponsors defined benefit pension plans (the “Plans”) for eligible employees in North America and certain international locations. The funding policy for the qualified defined benefit plans is to, at a minimum, contribute assets as required by the Internal Revenue Code Section 412. Nonqualified defined benefit U.S. plans providing benefits in excess of limitations imposed by the U.S. income tax code are not funded.
The Company’s pension income for defined benefit pension plans was $5.5 million in 2017 compared with pension expense of $22.4 million in 2016. Pension expense is calculated based upon a number of actuarial assumptions applied to each of the defined benefit plans. The weighted average expected long-term rate of return on pension fund assets used to calculate pension expense was 5.79% and 5.90% in 2017 and 2016, respectively. The expected long-term rate of return on pension assets was determined based on several factors, including historical rates of return, input from our pension investment consultants and projected long-term returns of broad equity and bond indices. The Company evaluates its long-term rate of return assumptions annually and adjusts them as necessary.
The Company determined pension expense using both the fair value of assets and a calculated value that averages gains and losses over a period of years. Investment gains or losses represent the difference between the expected and actual return on assets. As of December 31, 2017, the net actuarial loss was $267.1 million. These net losses may increase future pension expense if not offset by (i) actual investment returns that exceed the assumed investment returns, or (ii) other factors, including reduced pension liabilities arising from higher discount rates used to calculate pension obligations, or (iii) other actuarial gains, including whether such accumulated actuarial losses at each measurement date exceed the “corridor” determined under the Compensation — Retirement Benefits topic of the FASB Codification. For the largest plan, the actuarial loss is amortized over the average remaining life expectancy period of employees expected to receive benefits.
The discount rate used to determine the present value of future pension obligations at December 31, 2017 was based on a yield curve constructed from a portfolio of high-quality corporate debt securities with maturities ranging from 1 year to 30 years. Each year’s expected future benefit payments were discounted to their present value at the spot yield curve rate thereby generating the overall discount rate for the Company’s pension obligations. The weighted average discount rate used to determine the pension obligations was 3.49% and 4.01% in 2017 and 2016, respectively.
The Company’s pension expense is estimated to be approximately $3 million in 2018. The estimate is based on a weighted average expected long-term rate of return of 4.86%, a weighted average discount rate of 3.49% and other assumptions. Pension expense beyond 2018 will depend on future investment performance, the Company’s contribution to the plans, changes in discount rates and other factors related to covered employees in the plans. Beginning in 2016, the Company changed its methodology of calculating the service and interest cost components of pension expense from using a yield curve aggregate approach to using individual spot rates along the yield curve.
If the discount rate assumptions for the Company’s U.S. plans were reduced by 0.25%, pension expense would increase by approximately $41 thousand and the December 31, 2017 projected benefit obligation would increase approximately $33 million.
The fair value of assets in the Company’s plans was $1,340.7 million at December 31, 2017 and $1,115.6 million at December 31, 2016. The projected benefit obligations exceed the fair value of plan assets by $26.4 million and $163.4 million as of December 31, 2017 and 2016, respectively. The accumulated benefit obligation (“ABO”) exceeded plan assets by $18.7 million at the end of 2017. At the end of 2016, the ABO exceeded the fair value of plan assets by $154.4 million.
37
• Retained Insurable Risks
The Company is self-insured for certain losses relating to workers’ compensation claims and employee medical and dental benefits. Provisions for expected losses are recorded based on the Company’s estimates, on an undiscounted basis, of the aggregate liabilities for known claims and estimated claims incurred but not reported. The Company has purchased stop-loss coverage or insurance with deductibles in order to limit its exposure to significant claims. The Company also has an extensive safety program in place to minimize its exposure to workers’ compensation claims. Self-insured losses are accrued based upon estimates of the aggregate uninsured claims incurred using certain actuarial assumptions, loss development factors followed in the insurance industry and historical experience.
• Goodwill
The Company evaluates goodwill for potential impairment annually as of October 1, as well as whenever events or changes in circumstances suggest that the fair value of a reporting unit may no longer exceed its carrying amount. Potential impairment of goodwill is measured at the reporting unit level by comparing the reporting unit’s carrying amount, including goodwill, to the estimated fair value of the reporting unit. As of October 1, 2017, the Company had six reporting units, four of which had goodwill.
Periodically, the Company may perform a qualitative impairment analysis of goodwill associated with each of its reporting units to determine if it is more likely than not that the carrying value of a reporting unit exceeded its fair value. If the results of the qualitative analysis of any of the reporting units is inconclusive or other facts or circumstances necessitate further analysis, the Company will perform a quantitative analysis for those reporting units.
The quantitative analysis involves calculating the fair value of each reporting unit by utilizing a discounted cash flow analysis based on the Company’s forecasts, discounted using a weighted average cost of capital and market indicators of terminal year cash flows based upon a multiple of earnings before interest, taxes, depreciation and amortization ("EBITDA").
In determining fair value, management relies on and considers a number of factors, including but not limited to, operating results, business plans, economic projections, forecasts including anticipated future cash flows, and market data and analysis, including market capitalization. Fair value determinations are sensitive to changes in the factors described above. There are inherent uncertainties related to these factors and judgments in applying them to the analysis of potential goodwill impairment.
The variability of the assumptions that management uses to perform the goodwill impairment test depends on a number of conditions, including uncertainty about future events and cash flows. Accordingly, the Company’s accounting estimates may materially change from period to period due to changing market factors. If the Company had used other assumptions and estimates or if different conditions occur in future periods, future operating results could be materially impacted.
The assumptions used in the goodwill impairment testing process could be adversely impacted by certain of the risks discussed in “Item 1A., Risk Factors” and thus could result in future goodwill impairment charges.
The Company performed its annual goodwill impairment tests as of October 1, 2017 and concluded that goodwill was not impaired.
• Recovery of Long-Lived Assets
The Company reviews long-lived assets (including property, plant and equipment and intangible assets) for impairment whenever events or changes in circumstances indicate that the carrying amount of such long-lived assets may not be fully recoverable by undiscounted cash flows. Measurement of the impairment loss, if any, is based on the fair value of the asset, which is determined by an income, cost or market approach. The Company evaluates the recovery of its long-lived assets by analyzing operating results and considering significant events or changes in the business environment that may have triggered impairment.
38
• Deferred Income Taxes and Potential Assessments
According to the Income Taxes topic of the FASB Codification, a valuation allowance is required to be established or maintained when, based on currently available information and other factors, it is more likely than not that all or a portion of a deferred tax asset will not be realized. The FASB Codification provides important factors in determining whether a deferred tax asset will be realized, including whether there has been sufficient taxable income in recent years and whether sufficient income can reasonably be expected in future years in order to utilize the deferred tax asset. The Company has evaluated the need to maintain a valuation allowance for deferred tax assets based on its assessment of whether it is more likely than not that deferred tax benefits would be realized through the generation of future taxable income. Appropriate consideration was given to all available evidence, both positive and negative, in assessing the need for a valuation allowance. In determining whether a valuation allowance is required, many factors are considered, including the specific taxing jurisdiction, the carryforward period, reversals of existing taxable temporary differences, cumulative pretax book earnings, income tax strategies and forecasted earnings for the entities in each jurisdiction.
As of December 31, 2017, the Company has recorded a valuation allowance of $51.5 million against its net deferred tax assets
in certain foreign jurisdictions and against domestic deferred tax assets related to certain state net operating loss carryforwards and federal capital loss carryforwards. As of December 31, 2016, a total valuation allowance of $45.5 million was recorded.
As of December 31, 2017, the Company has only provided for deferred U.S. income taxes attributable to future withholding tax expense related to the Company's equity investment in the joint venture, Rengo Riverwood Packaging, Ltd. The Company has not provided for deferred U.S. income taxes on any of its undistributed earnings in international subsidiaries because of the deemed taxation of all post-1986 earnings and profits required by the Act. In addition, the Company’s intention to indefinitely reinvest these earnings outside the U.S. remains unchanged, despite the effect of the Act. The determination of the amount of the unrecognized deferred U.S. income tax liability on the unremitted earnings or any other associated outside basis difference is not practicable because of the complexities associated with the calculation.
The Company records liabilities for potential assessments. The accruals relate to uncertain tax positions in a variety of taxing jurisdictions and are based on what management believes will be the most likely outcome of these positions. These liabilities may be affected by changing interpretations of laws, rulings by tax authorities, or the expiration of the statute of limitations.
NEW ACCOUNTING STANDARDS
For a discussion of recent accounting pronouncements impacting the Company, see Note 1 in the Notes to Consolidated Financial Statements included herein under “Item 8., Financial Statements and Supplementary Data.”
39
BUSINESS OUTLOOK
Total capital investment for 2018 is expected to be approximately $380 million and is expected to relate principally to the Company’s process capability improvements (approximately $320 million), acquiring capital spares (approximately $50 million), and producing packaging machinery (approximately $10 million).
The Company also expects the following in 2018, subject to finalization of purchase accounting for the 2017 acquisitions and the Consumer Packaging Combination:
• Depreciation and amortization expense between $430 million and $450 million, excluding approximately $6 million of pension amortization.
• Interest expense of $125 million to $135 million, including approximately $6 million to $7 million of non-cash interest expense associated with amortization of debt issuance costs.
• Pension plan contributions of $5 million to $10 million.
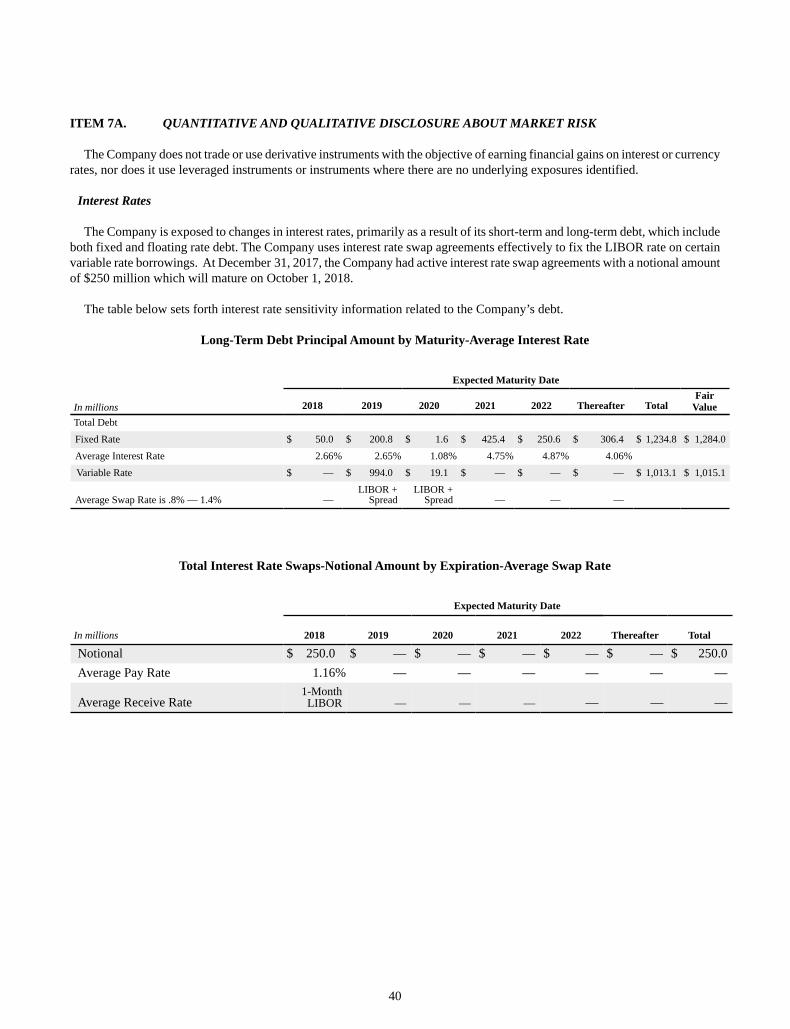
40
ITEM 7A. QUANTITATIVE AND QUALITATIVE DISCLOSURE ABOUT MARKET RISK
The Company does not trade or use derivative instruments with the objective of earning financial gains on interest or currency rates, nor does it use leveraged instruments or instruments where there are no underlying exposures identified.
Interest Rates
The Company is exposed to changes in interest rates, primarily as a result of its short-term and long-term debt, which include both fixed and floating rate debt. The Company uses interest rate swap agreements effectively to fix the LIBOR rate on certain variable rate borrowings. At December 31, 2017, the Company had active interest rate swap agreements with a notional amount of $250 million which will mature on October 1, 2018.
The table below sets forth interest rate sensitivity information related to the Company’s debt.
Long-Term Debt Principal Amount by Maturity-Average Interest Rate
Expected Maturity Date In millions 2018 2019 2020 2021 2022 Thereafter Total
FairValue
Total DebtFixed Rate $ 50.0 $ 200.8 $ 1.6 $ 425.4 $ 250.6 $ 306.4 $ 1,234.8 $ 1,284.0Average Interest Rate 2.66% 2.65% 1.08% 4.75% 4.87% 4.06%Variable Rate $ — $ 994.0 $ 19.1 $ — $ — $ — $ 1,013.1 $ 1,015.1
Average Swap Rate is .8% — 1.4% —LIBOR +
SpreadLIBOR +
Spread — — —
Total Interest Rate Swaps-Notional Amount by Expiration-Average Swap Rate
Expected Maturity Date
In millions 2018 2019 2020 2021 2022 Thereafter Total
Notional $ 250.0 $ — $ — $ — $ — $ — $ 250.0Average Pay Rate 1.16% — — — — — —
Average Receive Rate1-Month
LIBOR — — — — — —
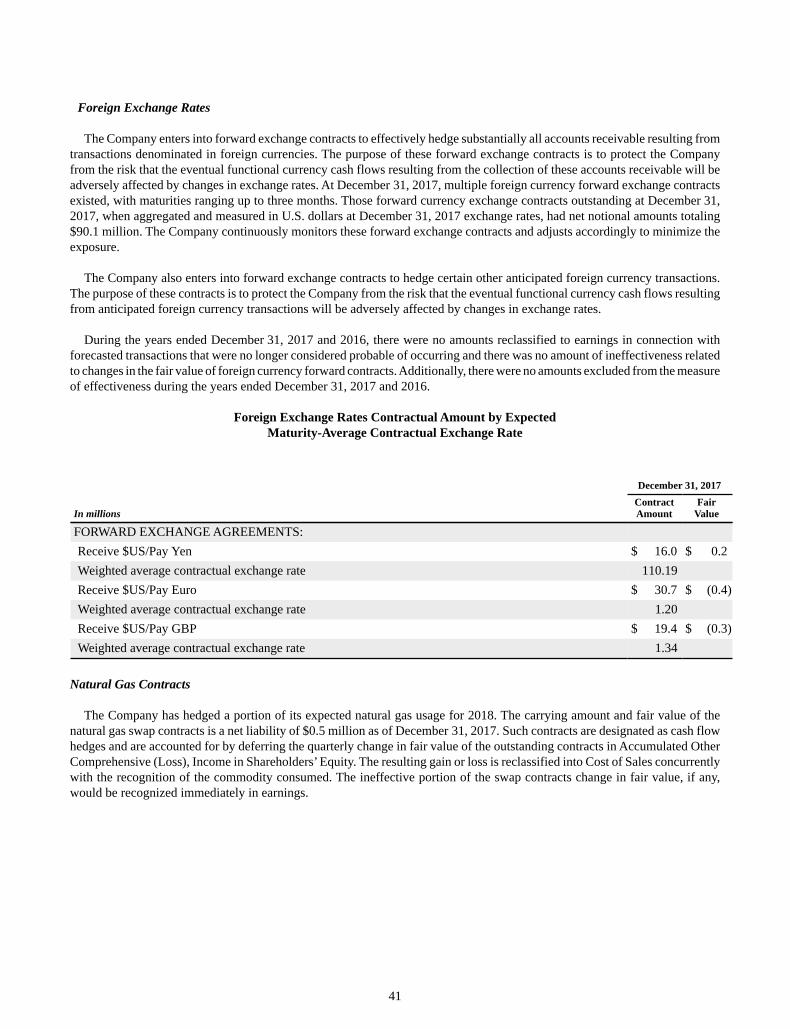
41
Foreign Exchange Rates
The Company enters into forward exchange contracts to effectively hedge substantially all accounts receivable resulting from transactions denominated in foreign currencies. The purpose of these forward exchange contracts is to protect the Company from the risk that the eventual functional currency cash flows resulting from the collection of these accounts receivable will be adversely affected by changes in exchange rates. At December 31, 2017, multiple foreign currency forward exchange contracts existed, with maturities ranging up to three months. Those forward currency exchange contracts outstanding at December 31, 2017, when aggregated and measured in U.S. dollars at December 31, 2017 exchange rates, had net notional amounts totaling $90.1 million. The Company continuously monitors these forward exchange contracts and adjusts accordingly to minimize the exposure.
The Company also enters into forward exchange contracts to hedge certain other anticipated foreign currency transactions. The purpose of these contracts is to protect the Company from the risk that the eventual functional currency cash flows resulting from anticipated foreign currency transactions will be adversely affected by changes in exchange rates.
During the years ended December 31, 2017 and 2016, there were no amounts reclassified to earnings in connection with forecasted transactions that were no longer considered probable of occurring and there was no amount of ineffectiveness related to changes in the fair value of foreign currency forward contracts. Additionally, there were no amounts excluded from the measure of effectiveness during the years ended December 31, 2017 and 2016.
Foreign Exchange Rates Contractual Amount by ExpectedMaturity-Average Contractual Exchange Rate
December 31, 2017 In millions
ContractAmount
FairValue
FORWARD EXCHANGE AGREEMENTS:Receive $US/Pay Yen $ 16.0 $ 0.2Weighted average contractual exchange rate 110.19Receive $US/Pay Euro $ 30.7 $ (0.4)Weighted average contractual exchange rate 1.20Receive $US/Pay GBP $ 19.4 $ (0.3)Weighted average contractual exchange rate 1.34
Natural Gas Contracts
The Company has hedged a portion of its expected natural gas usage for 2018. The carrying amount and fair value of the natural gas swap contracts is a net liability of $0.5 million as of December 31, 2017. Such contracts are designated as cash flow hedges and are accounted for by deferring the quarterly change in fair value of the outstanding contracts in Accumulated Other Comprehensive (Loss), Income in Shareholders’ Equity. The resulting gain or loss is reclassified into Cost of Sales concurrently with the recognition of the commodity consumed. The ineffective portion of the swap contracts change in fair value, if any, would be recognized immediately in earnings.
42
ITEM 8. FINANCIAL STATEMENTS AND SUPPLEMENTARY DATA
INDEX TO FINANCIAL STATEMENTS
Page
GRAPHIC PACKAGING HOLDING COMPANYConsolidated Statements of Operations for each of the three years in the period ended December 31, 2017Consolidated Statements of Comprehensive Income (Loss) for each of the three years in the period endedDecember 31, 2017
Consolidated Balance Sheets as of December 31, 2017 and 2016Consolidated Statements of Shareholders’ Equity for each of the three years in the period ended December 31, 2017Consolidated Statements of Cash Flows for each of the three years in the period ended December 31, 2017Notes to Consolidated Financial StatementsReports of Independent Registered Public Accounting Firm
43
444546474896
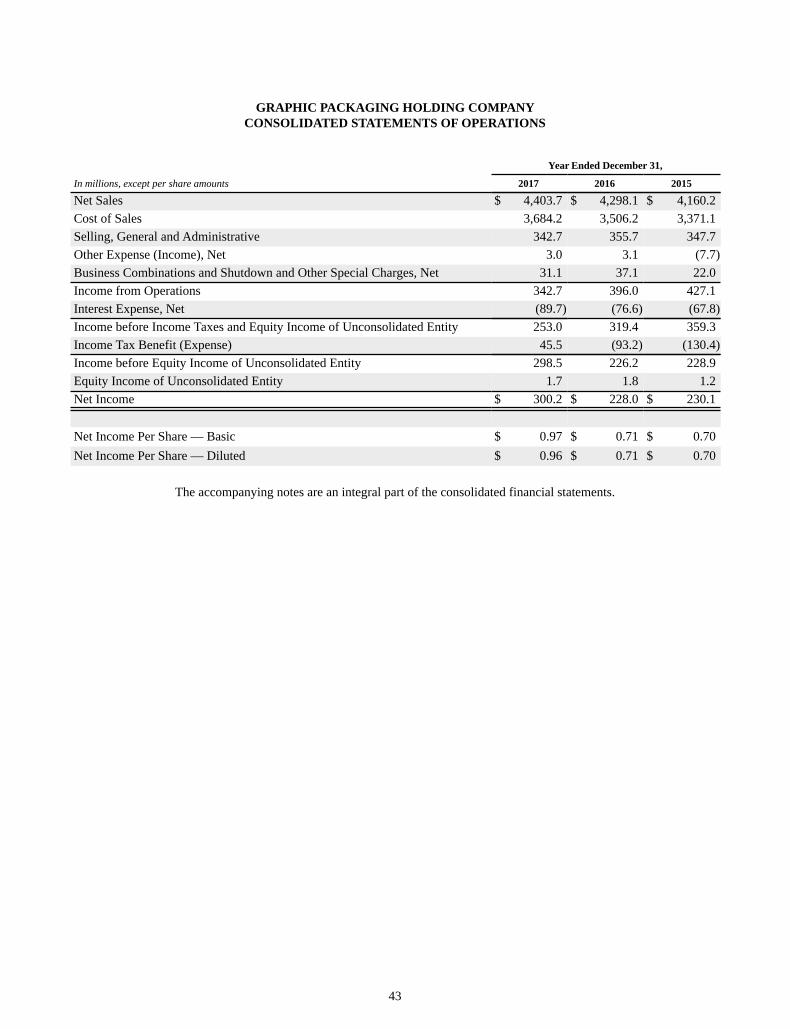
43
GRAPHIC PACKAGING HOLDING COMPANYCONSOLIDATED STATEMENTS OF OPERATIONS
Year Ended December 31,
In millions, except per share amounts 2017 2016 2015
Net Sales $ 4,403.7 $ 4,298.1 $ 4,160.2Cost of Sales 3,684.2 3,506.2 3,371.1Selling, General and Administrative 342.7 355.7 347.7Other Expense (Income), Net 3.0 3.1 (7.7)Business Combinations and Shutdown and Other Special Charges, Net 31.1 37.1 22.0Income from Operations 342.7 396.0 427.1Interest Expense, Net (89.7) (76.6) (67.8)Income before Income Taxes and Equity Income of Unconsolidated Entity 253.0 319.4 359.3Income Tax Benefit (Expense) 45.5 (93.2) (130.4)Income before Equity Income of Unconsolidated Entity 298.5 226.2 228.9Equity Income of Unconsolidated Entity 1.7 1.8 1.2Net Income $ 300.2 $ 228.0 $ 230.1
Net Income Per Share — Basic $ 0.97 $ 0.71 $ 0.70Net Income Per Share — Diluted $ 0.96 $ 0.71 $ 0.70
The accompanying notes are an integral part of the consolidated financial statements.
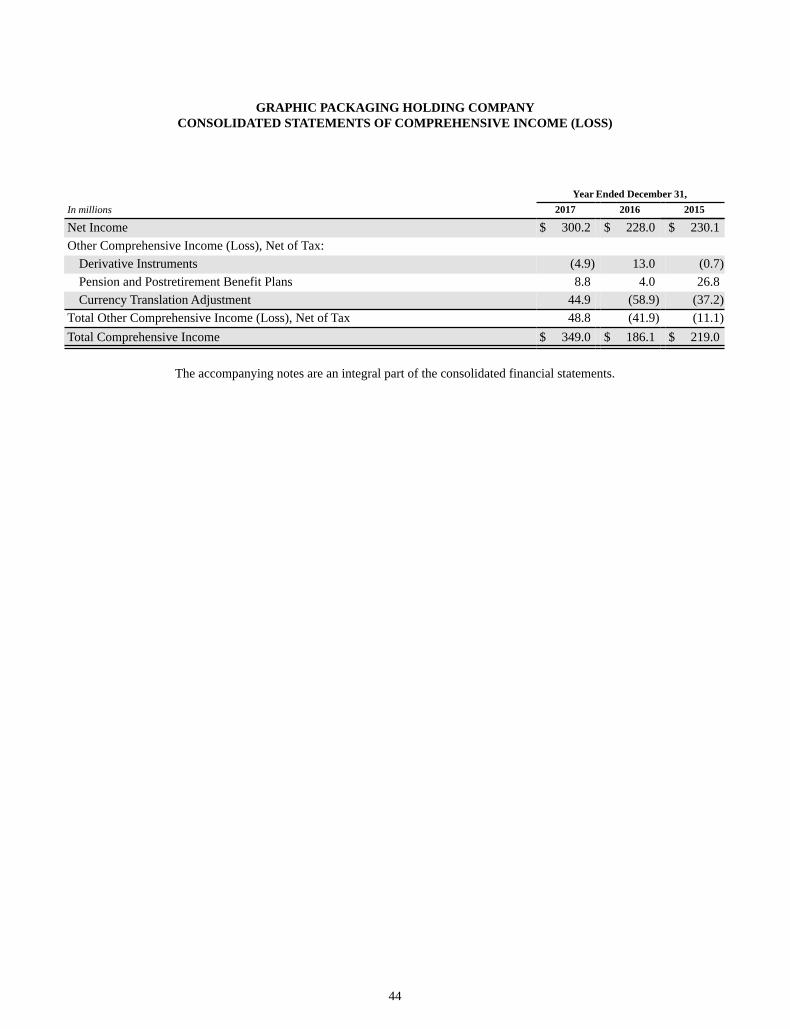
44
GRAPHIC PACKAGING HOLDING COMPANYCONSOLIDATED STATEMENTS OF COMPREHENSIVE INCOME (LOSS)
Year Ended December 31,In millions 2017 2016 2015
Net Income $ 300.2 $ 228.0 $ 230.1Other Comprehensive Income (Loss), Net of Tax:
Derivative Instruments (4.9) 13.0 (0.7)Pension and Postretirement Benefit Plans 8.8 4.0 26.8Currency Translation Adjustment 44.9 (58.9) (37.2)
Total Other Comprehensive Income (Loss), Net of Tax 48.8 (41.9) (11.1)Total Comprehensive Income $ 349.0 $ 186.1 $ 219.0
The accompanying notes are an integral part of the consolidated financial statements.
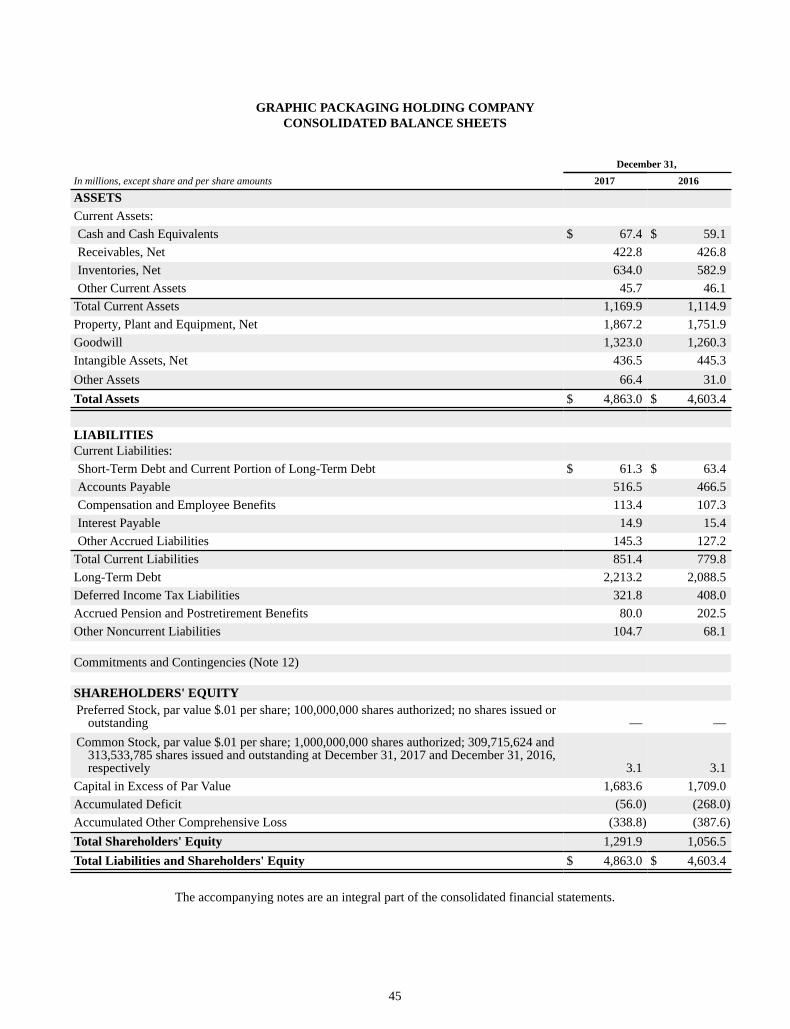
45
GRAPHIC PACKAGING HOLDING COMPANYCONSOLIDATED BALANCE SHEETS
December 31,In millions, except share and per share amounts 2017 2016
ASSETSCurrent Assets:Cash and Cash Equivalents $ 67.4 $ 59.1Receivables, Net 422.8 426.8Inventories, Net 634.0 582.9Other Current Assets 45.7 46.1
Total Current Assets 1,169.9 1,114.9Property, Plant and Equipment, Net 1,867.2 1,751.9Goodwill 1,323.0 1,260.3Intangible Assets, Net 436.5 445.3Other Assets 66.4 31.0Total Assets $ 4,863.0 $ 4,603.4
LIABILITIESCurrent Liabilities:Short-Term Debt and Current Portion of Long-Term Debt $ 61.3 $ 63.4Accounts Payable 516.5 466.5Compensation and Employee Benefits 113.4 107.3Interest Payable 14.9 15.4Other Accrued Liabilities 145.3 127.2
Total Current Liabilities 851.4 779.8Long-Term Debt 2,213.2 2,088.5Deferred Income Tax Liabilities 321.8 408.0Accrued Pension and Postretirement Benefits 80.0 202.5Other Noncurrent Liabilities 104.7 68.1
Commitments and Contingencies (Note 12)
SHAREHOLDERS' EQUITYPreferred Stock, par value $.01 per share; 100,000,000 shares authorized; no shares issued or
outstanding — —Common Stock, par value $.01 per share; 1,000,000,000 shares authorized; 309,715,624 and
313,533,785 shares issued and outstanding at December 31, 2017 and December 31, 2016,respectively 3.1 3.1
Capital in Excess of Par Value 1,683.6 1,709.0Accumulated Deficit (56.0) (268.0)Accumulated Other Comprehensive Loss (338.8) (387.6)Total Shareholders' Equity 1,291.9 1,056.5Total Liabilities and Shareholders' Equity $ 4,863.0 $ 4,603.4
The accompanying notes are an integral part of the consolidated financial statements.
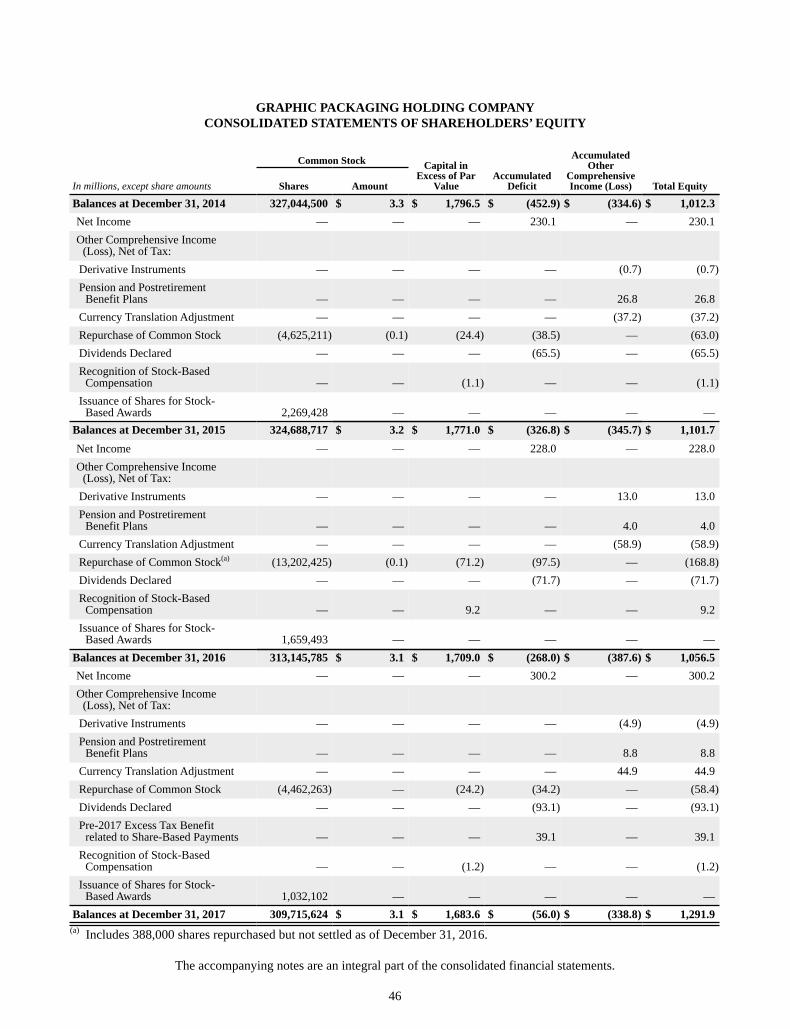
46
GRAPHIC PACKAGING HOLDING COMPANYCONSOLIDATED STATEMENTS OF SHAREHOLDERS’ EQUITY
AccumulatedOther
ComprehensiveIncome (Loss)
Common Stock Capital inExcess of Par
ValueIn millions, except share amounts Shares AmountAccumulated
Deficit Total Equity
Balances at December 31, 2014 327,044,500 $ 3.3 $ 1,796.5 $ (452.9) $ (334.6) $ 1,012.3Net Income — — — 230.1 — 230.1Other Comprehensive Income
(Loss), Net of Tax:Derivative Instruments — — — — (0.7) (0.7)Pension and Postretirement
Benefit Plans — — — — 26.8 26.8Currency Translation Adjustment — — — — (37.2) (37.2)Repurchase of Common Stock (4,625,211) (0.1) (24.4) (38.5) — (63.0)Dividends Declared — — — (65.5) — (65.5)Recognition of Stock-Based
Compensation — — (1.1) — — (1.1)Issuance of Shares for Stock-
Based Awards 2,269,428 — — — — —Balances at December 31, 2015 324,688,717 $ 3.2 $ 1,771.0 $ (326.8) $ (345.7) $ 1,101.7Net Income — — — 228.0 — 228.0Other Comprehensive Income
(Loss), Net of Tax:Derivative Instruments — — — — 13.0 13.0Pension and Postretirement
Benefit Plans — — — — 4.0 4.0Currency Translation Adjustment — — — — (58.9) (58.9)Repurchase of Common Stock(a) (13,202,425) (0.1) (71.2) (97.5) — (168.8)Dividends Declared — — — (71.7) — (71.7)Recognition of Stock-Based
Compensation — — 9.2 — — 9.2Issuance of Shares for Stock-
Based Awards 1,659,493 — — — — —Balances at December 31, 2016 313,145,785 $ 3.1 $ 1,709.0 $ (268.0) $ (387.6) $ 1,056.5Net Income — — — 300.2 — 300.2Other Comprehensive Income
(Loss), Net of Tax:Derivative Instruments — — — — (4.9) (4.9)Pension and Postretirement
Benefit Plans — — — — 8.8 8.8Currency Translation Adjustment — — — — 44.9 44.9Repurchase of Common Stock (4,462,263) — (24.2) (34.2) — (58.4)Dividends Declared — — — (93.1) — (93.1)Pre-2017 Excess Tax Benefit
related to Share-Based Payments — — — 39.1 — 39.1Recognition of Stock-Based
Compensation — — (1.2) — — (1.2)Issuance of Shares for Stock-
Based Awards 1,032,102 — — — — —Balances at December 31, 2017 309,715,624 $ 3.1 $ 1,683.6 $ (56.0) $ (338.8) $ 1,291.9
(a) Includes 388,000 shares repurchased but not settled as of December 31, 2016.
The accompanying notes are an integral part of the consolidated financial statements.
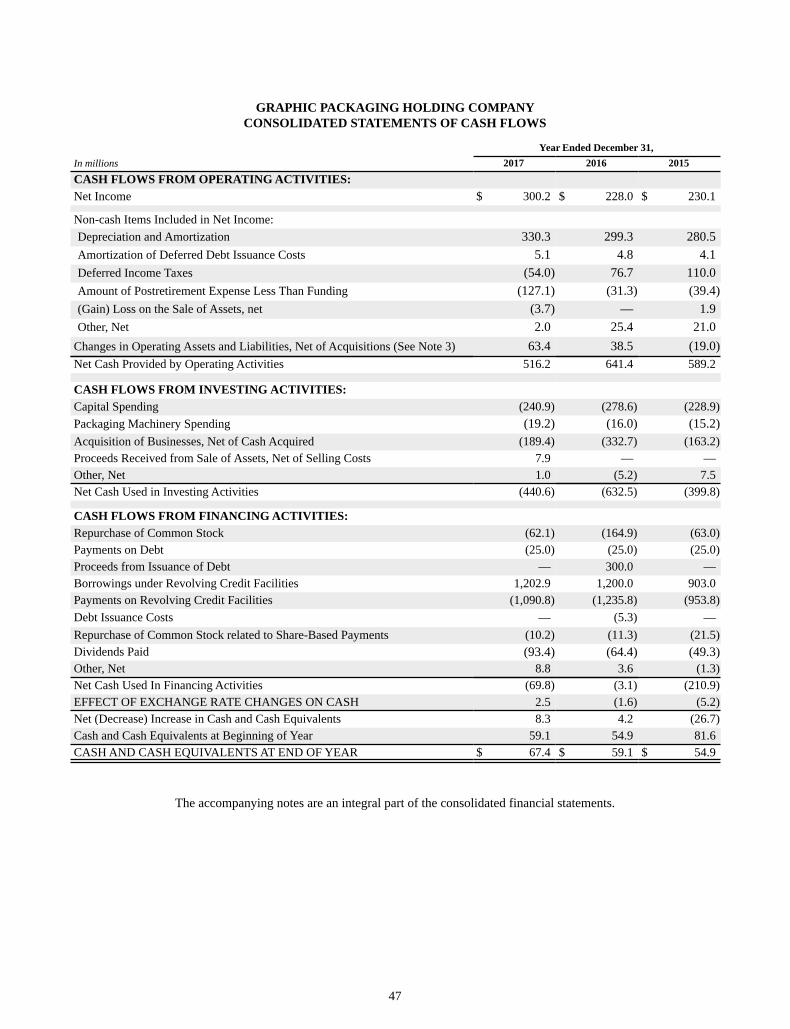
47
GRAPHIC PACKAGING HOLDING COMPANYCONSOLIDATED STATEMENTS OF CASH FLOWS
Year Ended December 31,In millions 2017 2016 2015CASH FLOWS FROM OPERATING ACTIVITIES:Net Income $ 300.2 $ 228.0 $ 230.1
Non-cash Items Included in Net Income:Depreciation and Amortization 330.3 299.3 280.5Amortization of Deferred Debt Issuance Costs 5.1 4.8 4.1Deferred Income Taxes (54.0) 76.7 110.0Amount of Postretirement Expense Less Than Funding (127.1) (31.3) (39.4)(Gain) Loss on the Sale of Assets, net (3.7) — 1.9Other, Net 2.0 25.4 21.0
Changes in Operating Assets and Liabilities, Net of Acquisitions (See Note 3) 63.4 38.5 (19.0)Net Cash Provided by Operating Activities 516.2 641.4 589.2
CASH FLOWS FROM INVESTING ACTIVITIES:Capital Spending (240.9) (278.6) (228.9)Packaging Machinery Spending (19.2) (16.0) (15.2)Acquisition of Businesses, Net of Cash Acquired (189.4) (332.7) (163.2)Proceeds Received from Sale of Assets, Net of Selling Costs 7.9 — —Other, Net 1.0 (5.2) 7.5Net Cash Used in Investing Activities (440.6) (632.5) (399.8)
CASH FLOWS FROM FINANCING ACTIVITIES:Repurchase of Common Stock (62.1) (164.9) (63.0)Payments on Debt (25.0) (25.0) (25.0)Proceeds from Issuance of Debt — 300.0 —Borrowings under Revolving Credit Facilities 1,202.9 1,200.0 903.0Payments on Revolving Credit Facilities (1,090.8) (1,235.8) (953.8)Debt Issuance Costs — (5.3) —Repurchase of Common Stock related to Share-Based Payments (10.2) (11.3) (21.5)Dividends Paid (93.4) (64.4) (49.3)Other, Net 8.8 3.6 (1.3)Net Cash Used In Financing Activities (69.8) (3.1) (210.9)EFFECT OF EXCHANGE RATE CHANGES ON CASH 2.5 (1.6) (5.2)Net (Decrease) Increase in Cash and Cash Equivalents 8.3 4.2 (26.7)Cash and Cash Equivalents at Beginning of Year 59.1 54.9 81.6CASH AND CASH EQUIVALENTS AT END OF YEAR $ 67.4 $ 59.1 $ 54.9
The accompanying notes are an integral part of the consolidated financial statements.
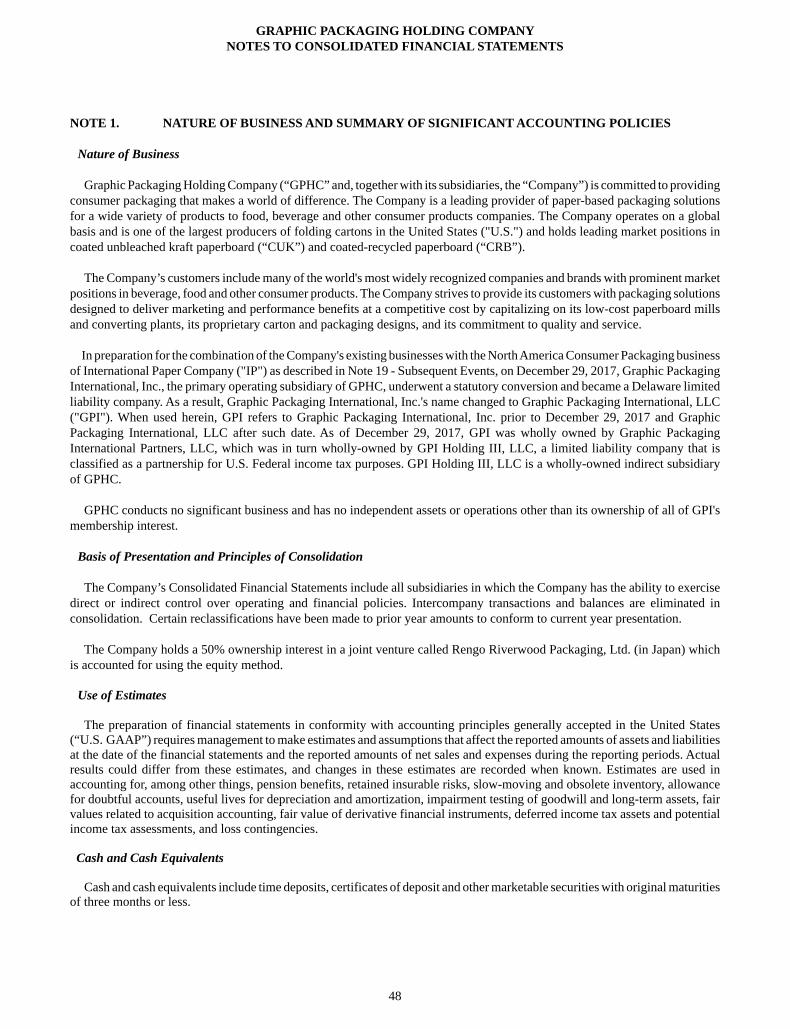
GRAPHIC PACKAGING HOLDING COMPANYNOTES TO CONSOLIDATED FINANCIAL STATEMENTS
48
NOTE 1. NATURE OF BUSINESS AND SUMMARY OF SIGNIFICANT ACCOUNTING POLICIES
Nature of Business
Graphic Packaging Holding Company (“GPHC” and, together with its subsidiaries, the “Company”) is committed to providing consumer packaging that makes a world of difference. The Company is a leading provider of paper-based packaging solutions for a wide variety of products to food, beverage and other consumer products companies. The Company operates on a global basis and is one of the largest producers of folding cartons in the United States ("U.S.") and holds leading market positions in coated unbleached kraft paperboard (“CUK”) and coated-recycled paperboard (“CRB”).
The Company’s customers include many of the world's most widely recognized companies and brands with prominent market positions in beverage, food and other consumer products. The Company strives to provide its customers with packaging solutions designed to deliver marketing and performance benefits at a competitive cost by capitalizing on its low-cost paperboard mills and converting plants, its proprietary carton and packaging designs, and its commitment to quality and service.
In preparation for the combination of the Company's existing businesses with the North America Consumer Packaging business of International Paper Company ("IP") as described in Note 19 - Subsequent Events, on December 29, 2017, Graphic Packaging International, Inc., the primary operating subsidiary of GPHC, underwent a statutory conversion and became a Delaware limited liability company. As a result, Graphic Packaging International, Inc.'s name changed to Graphic Packaging International, LLC ("GPI"). When used herein, GPI refers to Graphic Packaging International, Inc. prior to December 29, 2017 and Graphic Packaging International, LLC after such date. As of December 29, 2017, GPI was wholly owned by Graphic Packaging International Partners, LLC, which was in turn wholly-owned by GPI Holding III, LLC, a limited liability company that is classified as a partnership for U.S. Federal income tax purposes. GPI Holding III, LLC is a wholly-owned indirect subsidiary of GPHC.
GPHC conducts no significant business and has no independent assets or operations other than its ownership of all of GPI's membership interest.
Basis of Presentation and Principles of Consolidation
The Company’s Consolidated Financial Statements include all subsidiaries in which the Company has the ability to exercise direct or indirect control over operating and financial policies. Intercompany transactions and balances are eliminated in consolidation. Certain reclassifications have been made to prior year amounts to conform to current year presentation.
The Company holds a 50% ownership interest in a joint venture called Rengo Riverwood Packaging, Ltd. (in Japan) which is accounted for using the equity method.
Use of Estimates
The preparation of financial statements in conformity with accounting principles generally accepted in the United States (“U.S. GAAP”) requires management to make estimates and assumptions that affect the reported amounts of assets and liabilities at the date of the financial statements and the reported amounts of net sales and expenses during the reporting periods. Actual results could differ from these estimates, and changes in these estimates are recorded when known. Estimates are used in accounting for, among other things, pension benefits, retained insurable risks, slow-moving and obsolete inventory, allowance for doubtful accounts, useful lives for depreciation and amortization, impairment testing of goodwill and long-term assets, fair values related to acquisition accounting, fair value of derivative financial instruments, deferred income tax assets and potential income tax assessments, and loss contingencies.
Cash and Cash Equivalents
Cash and cash equivalents include time deposits, certificates of deposit and other marketable securities with original maturities of three months or less.
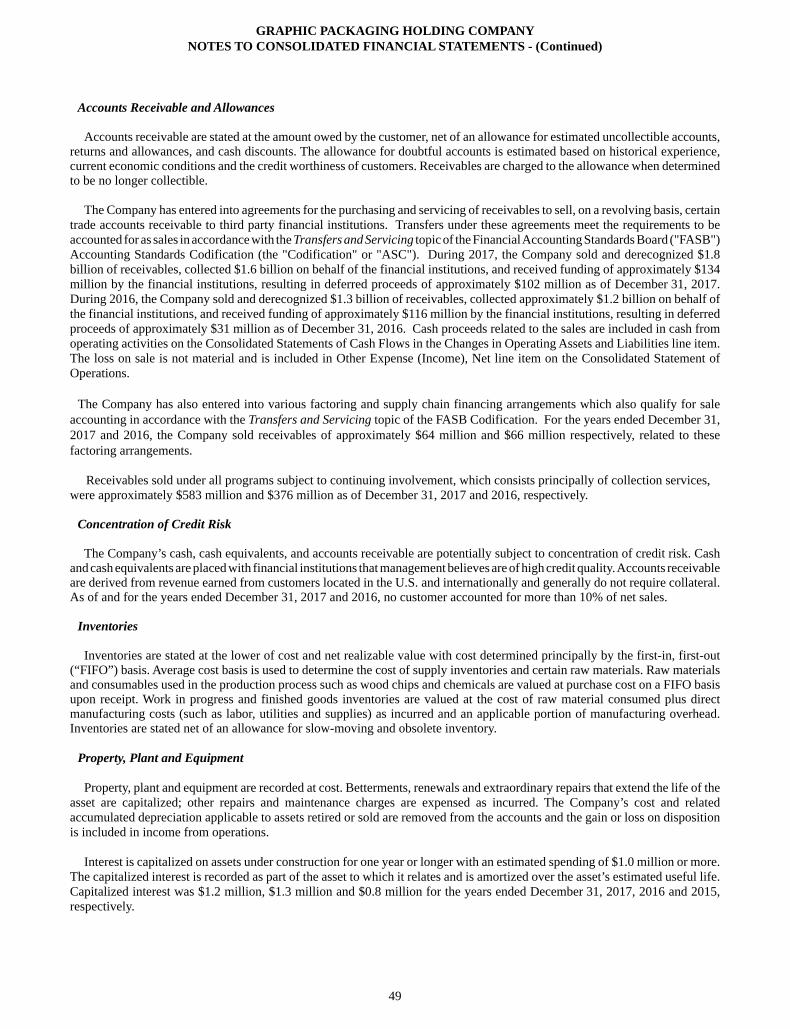
GRAPHIC PACKAGING HOLDING COMPANYNOTES TO CONSOLIDATED FINANCIAL STATEMENTS - (Continued)
49
Accounts Receivable and Allowances
Accounts receivable are stated at the amount owed by the customer, net of an allowance for estimated uncollectible accounts, returns and allowances, and cash discounts. The allowance for doubtful accounts is estimated based on historical experience, current economic conditions and the credit worthiness of customers. Receivables are charged to the allowance when determined to be no longer collectible.
The Company has entered into agreements for the purchasing and servicing of receivables to sell, on a revolving basis, certain trade accounts receivable to third party financial institutions. Transfers under these agreements meet the requirements to be accounted for as sales in accordance with the Transfers and Servicing topic of the Financial Accounting Standards Board ("FASB") Accounting Standards Codification (the "Codification" or "ASC"). During 2017, the Company sold and derecognized $1.8 billion of receivables, collected $1.6 billion on behalf of the financial institutions, and received funding of approximately $134 million by the financial institutions, resulting in deferred proceeds of approximately $102 million as of December 31, 2017. During 2016, the Company sold and derecognized $1.3 billion of receivables, collected approximately $1.2 billion on behalf of the financial institutions, and received funding of approximately $116 million by the financial institutions, resulting in deferred proceeds of approximately $31 million as of December 31, 2016. Cash proceeds related to the sales are included in cash from operating activities on the Consolidated Statements of Cash Flows in the Changes in Operating Assets and Liabilities line item. The loss on sale is not material and is included in Other Expense (Income), Net line item on the Consolidated Statement of Operations.
The Company has also entered into various factoring and supply chain financing arrangements which also qualify for sale accounting in accordance with the Transfers and Servicing topic of the FASB Codification. For the years ended December 31, 2017 and 2016, the Company sold receivables of approximately $64 million and $66 million respectively, related to these factoring arrangements.
Receivables sold under all programs subject to continuing involvement, which consists principally of collection services, were approximately $583 million and $376 million as of December 31, 2017 and 2016, respectively.
Concentration of Credit Risk
The Company’s cash, cash equivalents, and accounts receivable are potentially subject to concentration of credit risk. Cash and cash equivalents are placed with financial institutions that management believes are of high credit quality. Accounts receivable are derived from revenue earned from customers located in the U.S. and internationally and generally do not require collateral. As of and for the years ended December 31, 2017 and 2016, no customer accounted for more than 10% of net sales.
Inventories
Inventories are stated at the lower of cost and net realizable value with cost determined principally by the first-in, first-out (“FIFO”) basis. Average cost basis is used to determine the cost of supply inventories and certain raw materials. Raw materials and consumables used in the production process such as wood chips and chemicals are valued at purchase cost on a FIFO basis upon receipt. Work in progress and finished goods inventories are valued at the cost of raw material consumed plus direct manufacturing costs (such as labor, utilities and supplies) as incurred and an applicable portion of manufacturing overhead. Inventories are stated net of an allowance for slow-moving and obsolete inventory.
Property, Plant and Equipment
Property, plant and equipment are recorded at cost. Betterments, renewals and extraordinary repairs that extend the life of the asset are capitalized; other repairs and maintenance charges are expensed as incurred. The Company’s cost and related accumulated depreciation applicable to assets retired or sold are removed from the accounts and the gain or loss on disposition is included in income from operations.
Interest is capitalized on assets under construction for one year or longer with an estimated spending of $1.0 million or more. The capitalized interest is recorded as part of the asset to which it relates and is amortized over the asset’s estimated useful life. Capitalized interest was $1.2 million, $1.3 million and $0.8 million for the years ended December 31, 2017, 2016 and 2015, respectively.
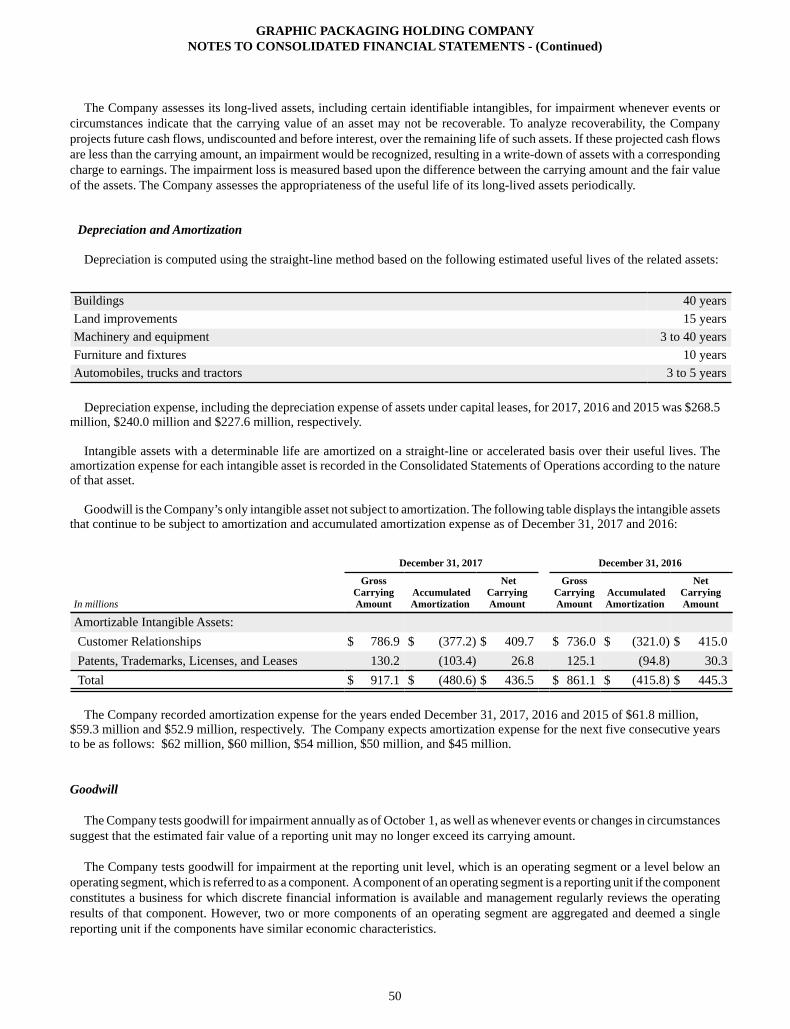
GRAPHIC PACKAGING HOLDING COMPANYNOTES TO CONSOLIDATED FINANCIAL STATEMENTS - (Continued)
50
The Company assesses its long-lived assets, including certain identifiable intangibles, for impairment whenever events or circumstances indicate that the carrying value of an asset may not be recoverable. To analyze recoverability, the Company projects future cash flows, undiscounted and before interest, over the remaining life of such assets. If these projected cash flows are less than the carrying amount, an impairment would be recognized, resulting in a write-down of assets with a corresponding charge to earnings. The impairment loss is measured based upon the difference between the carrying amount and the fair value of the assets. The Company assesses the appropriateness of the useful life of its long-lived assets periodically.
Depreciation and Amortization
Depreciation is computed using the straight-line method based on the following estimated useful lives of the related assets:
Buildings 40 yearsLand improvements 15 yearsMachinery and equipment 3 to 40 yearsFurniture and fixtures 10 yearsAutomobiles, trucks and tractors 3 to 5 years
Depreciation expense, including the depreciation expense of assets under capital leases, for 2017, 2016 and 2015 was $268.5 million, $240.0 million and $227.6 million, respectively.
Intangible assets with a determinable life are amortized on a straight-line or accelerated basis over their useful lives. The amortization expense for each intangible asset is recorded in the Consolidated Statements of Operations according to the nature of that asset.
Goodwill is the Company’s only intangible asset not subject to amortization. The following table displays the intangible assets that continue to be subject to amortization and accumulated amortization expense as of December 31, 2017 and 2016:
December 31, 2017 December 31, 2016
In millions
GrossCarryingAmount
AccumulatedAmortization
NetCarryingAmount
GrossCarryingAmount
AccumulatedAmortization
NetCarryingAmount
Amortizable Intangible Assets:Customer Relationships $ 786.9 $ (377.2) $ 409.7 $ 736.0 $ (321.0) $ 415.0Patents, Trademarks, Licenses, and Leases 130.2 (103.4) 26.8 125.1 (94.8) 30.3Total $ 917.1 $ (480.6) $ 436.5 $ 861.1 $ (415.8) $ 445.3
The Company recorded amortization expense for the years ended December 31, 2017, 2016 and 2015 of $61.8 million,$59.3 million and $52.9 million, respectively. The Company expects amortization expense for the next five consecutive years to be as follows: $62 million, $60 million, $54 million, $50 million, and $45 million.
Goodwill
The Company tests goodwill for impairment annually as of October 1, as well as whenever events or changes in circumstances suggest that the estimated fair value of a reporting unit may no longer exceed its carrying amount.
The Company tests goodwill for impairment at the reporting unit level, which is an operating segment or a level below an operating segment, which is referred to as a component. A component of an operating segment is a reporting unit if the component constitutes a business for which discrete financial information is available and management regularly reviews the operating results of that component. However, two or more components of an operating segment are aggregated and deemed a single reporting unit if the components have similar economic characteristics.
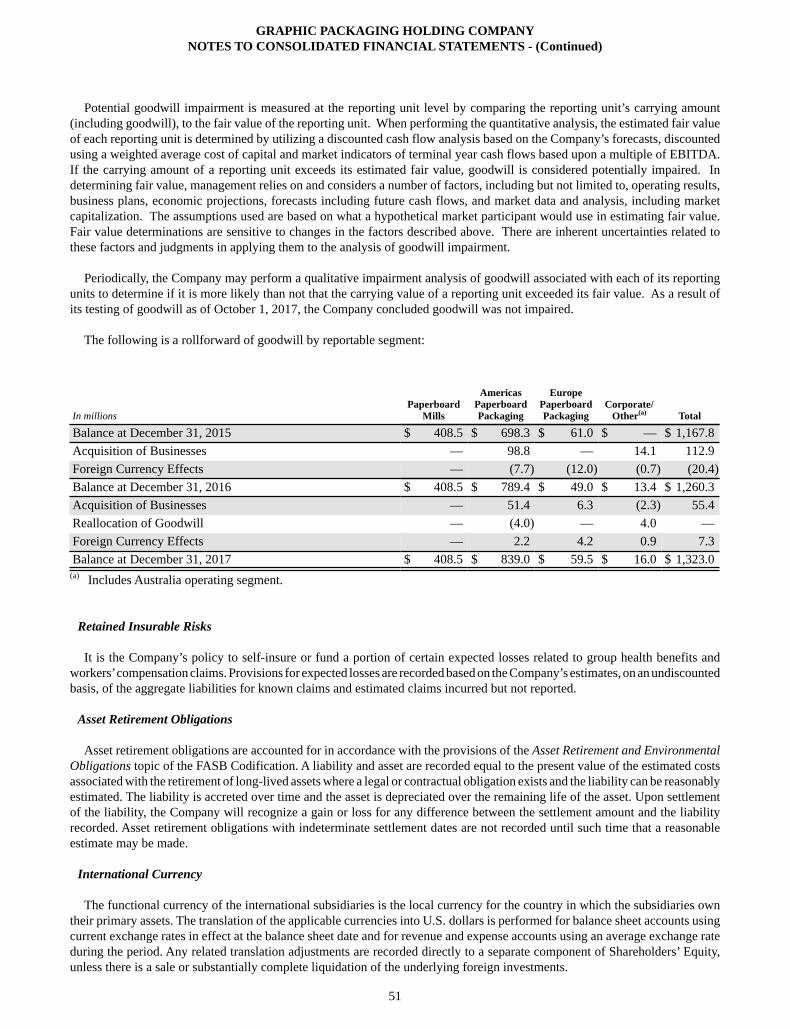
GRAPHIC PACKAGING HOLDING COMPANYNOTES TO CONSOLIDATED FINANCIAL STATEMENTS - (Continued)
51
Potential goodwill impairment is measured at the reporting unit level by comparing the reporting unit’s carrying amount (including goodwill), to the fair value of the reporting unit. When performing the quantitative analysis, the estimated fair value of each reporting unit is determined by utilizing a discounted cash flow analysis based on the Company’s forecasts, discounted using a weighted average cost of capital and market indicators of terminal year cash flows based upon a multiple of EBITDA. If the carrying amount of a reporting unit exceeds its estimated fair value, goodwill is considered potentially impaired. In determining fair value, management relies on and considers a number of factors, including but not limited to, operating results, business plans, economic projections, forecasts including future cash flows, and market data and analysis, including market capitalization. The assumptions used are based on what a hypothetical market participant would use in estimating fair value. Fair value determinations are sensitive to changes in the factors described above. There are inherent uncertainties related to these factors and judgments in applying them to the analysis of goodwill impairment.
Periodically, the Company may perform a qualitative impairment analysis of goodwill associated with each of its reporting units to determine if it is more likely than not that the carrying value of a reporting unit exceeded its fair value. As a result of its testing of goodwill as of October 1, 2017, the Company concluded goodwill was not impaired.
The following is a rollforward of goodwill by reportable segment:
In millionsPaperboard
Mills
AmericasPaperboardPackaging
EuropePaperboardPackaging
Corporate/Other(a) Total
Balance at December 31, 2015 $ 408.5 $ 698.3 $ 61.0 $ — $ 1,167.8Acquisition of Businesses — 98.8 — 14.1 112.9Foreign Currency Effects — (7.7) (12.0) (0.7) (20.4)Balance at December 31, 2016 $ 408.5 $ 789.4 $ 49.0 $ 13.4 $ 1,260.3Acquisition of Businesses — 51.4 6.3 (2.3) 55.4Reallocation of Goodwill — (4.0) — 4.0 —Foreign Currency Effects — 2.2 4.2 0.9 7.3Balance at December 31, 2017 $ 408.5 $ 839.0 $ 59.5 $ 16.0 $ 1,323.0
(a) Includes Australia operating segment.
Retained Insurable Risks
It is the Company’s policy to self-insure or fund a portion of certain expected losses related to group health benefits and workers’ compensation claims. Provisions for expected losses are recorded based on the Company’s estimates, on an undiscounted basis, of the aggregate liabilities for known claims and estimated claims incurred but not reported.
Asset Retirement Obligations
Asset retirement obligations are accounted for in accordance with the provisions of the Asset Retirement and Environmental Obligations topic of the FASB Codification. A liability and asset are recorded equal to the present value of the estimated costs associated with the retirement of long-lived assets where a legal or contractual obligation exists and the liability can be reasonably estimated. The liability is accreted over time and the asset is depreciated over the remaining life of the asset. Upon settlement of the liability, the Company will recognize a gain or loss for any difference between the settlement amount and the liability recorded. Asset retirement obligations with indeterminate settlement dates are not recorded until such time that a reasonable estimate may be made.
International Currency
The functional currency of the international subsidiaries is the local currency for the country in which the subsidiaries own their primary assets. The translation of the applicable currencies into U.S. dollars is performed for balance sheet accounts using current exchange rates in effect at the balance sheet date and for revenue and expense accounts using an average exchange rate during the period. Any related translation adjustments are recorded directly to a separate component of Shareholders’ Equity, unless there is a sale or substantially complete liquidation of the underlying foreign investments.
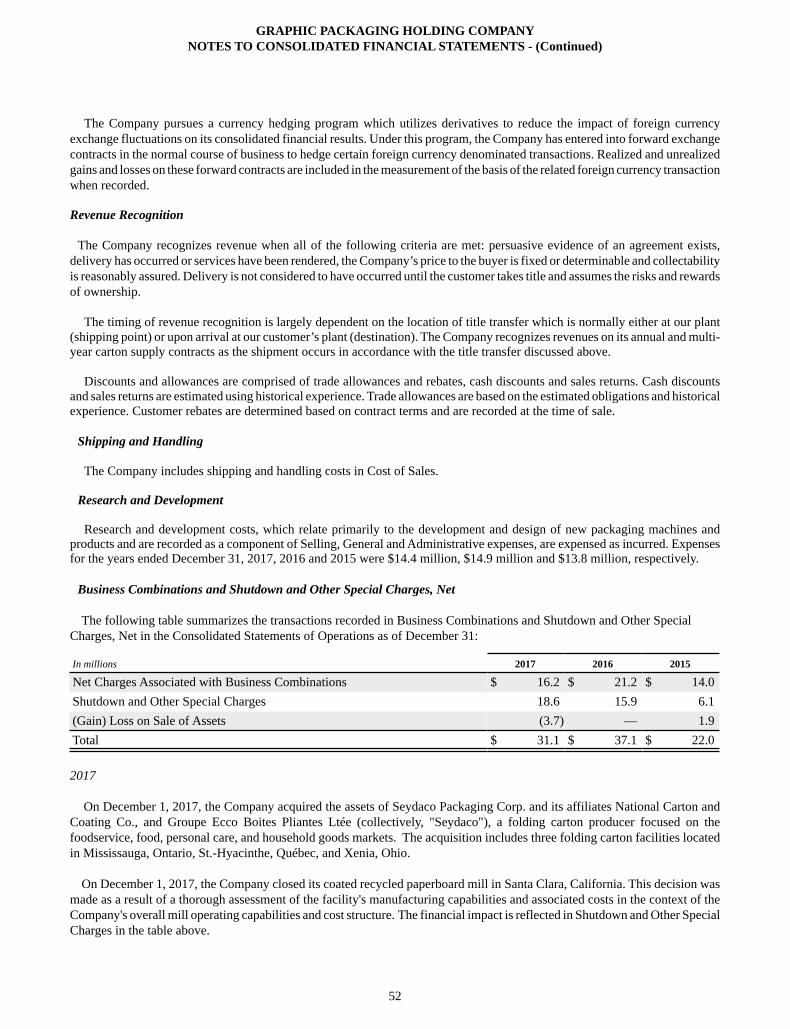
GRAPHIC PACKAGING HOLDING COMPANYNOTES TO CONSOLIDATED FINANCIAL STATEMENTS - (Continued)
52
The Company pursues a currency hedging program which utilizes derivatives to reduce the impact of foreign currency exchange fluctuations on its consolidated financial results. Under this program, the Company has entered into forward exchange contracts in the normal course of business to hedge certain foreign currency denominated transactions. Realized and unrealized gains and losses on these forward contracts are included in the measurement of the basis of the related foreign currency transaction when recorded.
Revenue Recognition
The Company recognizes revenue when all of the following criteria are met: persuasive evidence of an agreement exists, delivery has occurred or services have been rendered, the Company’s price to the buyer is fixed or determinable and collectability is reasonably assured. Delivery is not considered to have occurred until the customer takes title and assumes the risks and rewards of ownership.
The timing of revenue recognition is largely dependent on the location of title transfer which is normally either at our plant (shipping point) or upon arrival at our customer’s plant (destination). The Company recognizes revenues on its annual and multi-year carton supply contracts as the shipment occurs in accordance with the title transfer discussed above.
Discounts and allowances are comprised of trade allowances and rebates, cash discounts and sales returns. Cash discounts and sales returns are estimated using historical experience. Trade allowances are based on the estimated obligations and historical experience. Customer rebates are determined based on contract terms and are recorded at the time of sale.
Shipping and Handling
The Company includes shipping and handling costs in Cost of Sales.
Research and Development
Research and development costs, which relate primarily to the development and design of new packaging machines and products and are recorded as a component of Selling, General and Administrative expenses, are expensed as incurred. Expenses for the years ended December 31, 2017, 2016 and 2015 were $14.4 million, $14.9 million and $13.8 million, respectively.
Business Combinations and Shutdown and Other Special Charges, Net
The following table summarizes the transactions recorded in Business Combinations and Shutdown and Other Special Charges, Net in the Consolidated Statements of Operations as of December 31:
In millions 2017 2016 2015
Net Charges Associated with Business Combinations $ 16.2 $ 21.2 $ 14.0Shutdown and Other Special Charges 18.6 15.9 6.1(Gain) Loss on Sale of Assets (3.7) — 1.9Total $ 31.1 $ 37.1 $ 22.0
2017
On December 1, 2017, the Company acquired the assets of Seydaco Packaging Corp. and its affiliates National Carton and Coating Co., and Groupe Ecco Boites Pliantes Ltée (collectively, "Seydaco"), a folding carton producer focused on the foodservice, food, personal care, and household goods markets. The acquisition includes three folding carton facilities located in Mississauga, Ontario, St.-Hyacinthe, Québec, and Xenia, Ohio.
On December 1, 2017, the Company closed its coated recycled paperboard mill in Santa Clara, California. This decision was made as a result of a thorough assessment of the facility's manufacturing capabilities and associated costs in the context of the Company's overall mill operating capabilities and cost structure. The financial impact is reflected in Shutdown and Other Special Charges in the table above.
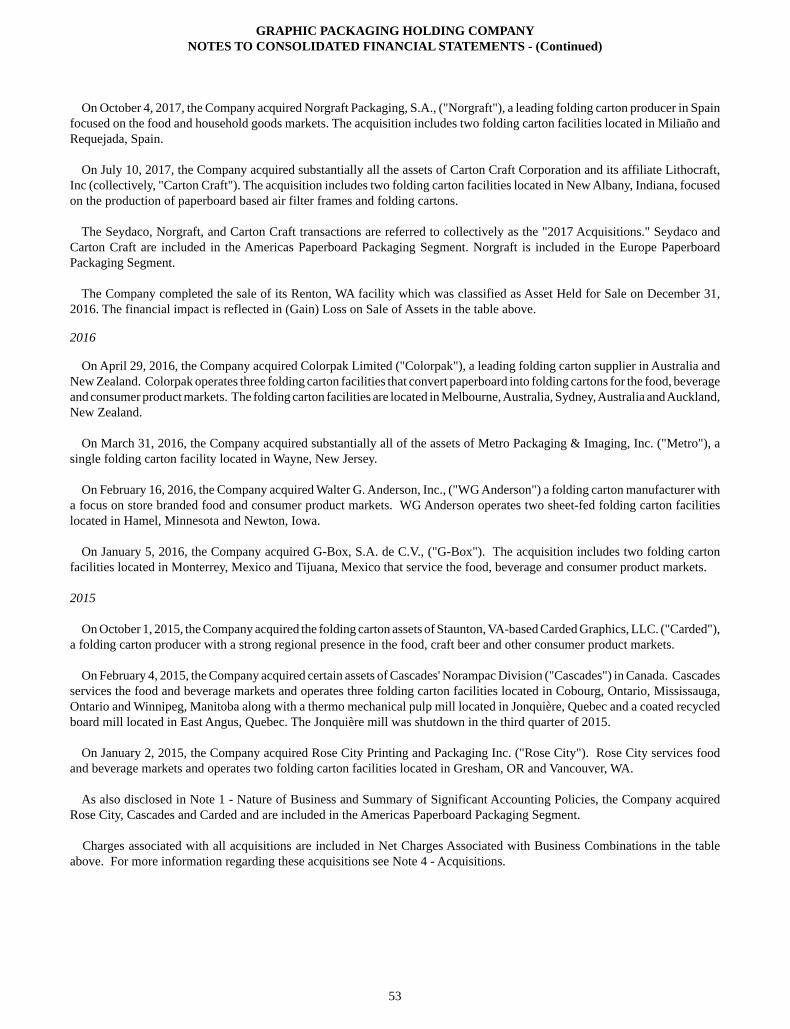
GRAPHIC PACKAGING HOLDING COMPANYNOTES TO CONSOLIDATED FINANCIAL STATEMENTS - (Continued)
53
On October 4, 2017, the Company acquired Norgraft Packaging, S.A., ("Norgraft"), a leading folding carton producer in Spain focused on the food and household goods markets. The acquisition includes two folding carton facilities located in Miliaño and Requejada, Spain.
On July 10, 2017, the Company acquired substantially all the assets of Carton Craft Corporation and its affiliate Lithocraft, Inc (collectively, "Carton Craft"). The acquisition includes two folding carton facilities located in New Albany, Indiana, focused on the production of paperboard based air filter frames and folding cartons.
The Seydaco, Norgraft, and Carton Craft transactions are referred to collectively as the "2017 Acquisitions." Seydaco and Carton Craft are included in the Americas Paperboard Packaging Segment. Norgraft is included in the Europe Paperboard Packaging Segment.
The Company completed the sale of its Renton, WA facility which was classified as Asset Held for Sale on December 31, 2016. The financial impact is reflected in (Gain) Loss on Sale of Assets in the table above.
2016
On April 29, 2016, the Company acquired Colorpak Limited ("Colorpak"), a leading folding carton supplier in Australia and New Zealand. Colorpak operates three folding carton facilities that convert paperboard into folding cartons for the food, beverage and consumer product markets. The folding carton facilities are located in Melbourne, Australia, Sydney, Australia and Auckland, New Zealand.
On March 31, 2016, the Company acquired substantially all of the assets of Metro Packaging & Imaging, Inc. ("Metro"), a single folding carton facility located in Wayne, New Jersey.
On February 16, 2016, the Company acquired Walter G. Anderson, Inc., ("WG Anderson") a folding carton manufacturer with a focus on store branded food and consumer product markets. WG Anderson operates two sheet-fed folding carton facilities located in Hamel, Minnesota and Newton, Iowa.
On January 5, 2016, the Company acquired G-Box, S.A. de C.V., ("G-Box"). The acquisition includes two folding carton facilities located in Monterrey, Mexico and Tijuana, Mexico that service the food, beverage and consumer product markets.
2015
On October 1, 2015, the Company acquired the folding carton assets of Staunton, VA-based Carded Graphics, LLC. ("Carded"), a folding carton producer with a strong regional presence in the food, craft beer and other consumer product markets.
On February 4, 2015, the Company acquired certain assets of Cascades' Norampac Division ("Cascades") in Canada. Cascades services the food and beverage markets and operates three folding carton facilities located in Cobourg, Ontario, Mississauga, Ontario and Winnipeg, Manitoba along with a thermo mechanical pulp mill located in Jonquière, Quebec and a coated recycled board mill located in East Angus, Quebec. The Jonquière mill was shutdown in the third quarter of 2015.
On January 2, 2015, the Company acquired Rose City Printing and Packaging Inc. ("Rose City"). Rose City services food and beverage markets and operates two folding carton facilities located in Gresham, OR and Vancouver, WA.
As also disclosed in Note 1 - Nature of Business and Summary of Significant Accounting Policies, the Company acquired Rose City, Cascades and Carded and are included in the Americas Paperboard Packaging Segment.
Charges associated with all acquisitions are included in Net Charges Associated with Business Combinations in the table above. For more information regarding these acquisitions see Note 4 - Acquisitions.
GRAPHIC PACKAGING HOLDING COMPANYNOTES TO CONSOLIDATED FINANCIAL STATEMENTS - (Continued)
54
Capital Allocation Plan
On January 10, 2017, the Company's board of directors authorized an additional share repurchase program to allow the Company to repurchase up to $250 million of the Company's issued and outstanding shares of common stock through open market purchases, privately negotiated transactions and Rule 10b5-1 plans (the "2017 share repurchase program"). The original $250 million share repurchase program was authorized on February 4, 2015 (the "2015 share repurchase program").
During 2017, the Company repurchased 4.5 million shares, or approximately $58 million, of its common stock at an average price of $13.08, including 1.4 million shares repurchased under the 2015 share repurchase program thereby completing that program. During 2016, the Company repurchased 13.2 million shares, or approximately $169 million, of its common stock at an average price of $12.77. During 2015, the Company repurchased 4.6 million shares, or approximately $63 million at an average price of $13.60.
At December 31, 2017, the Company had approximately $210 million remaining under the 2017 share repurchase program.
During 2017 and 2016, the Company paid cash dividends of $93.4 million and $64.4 million, respectively.
Adoption of New Accounting Standards
Effective January 1, 2017 the Company adopted Accounting Standards Update ("ASU") No. 2016-09, Compensation-Stock Compensation (Topic 718): Improvements to Employee Share-Based Payment Accounting, which simplifies the accounting for income taxes, among other changes, related to stock-based compensation. In the first quarter of 2017, the Company recorded a discrete benefit of approximately $2 million related to the excess benefit associated with share based payments to employees. The remaining $39 million of previously unrecognized excess tax benefits, which were prohibited from recognition due to net operating loss carryforwards, were recognized in accumulated deficit. The Company is continuing its practice of estimating forfeitures and recording cash paid for withholding taxes as a financing activity.
Effective January 1, 2017 the Company adopted ASU No. 2015-11, Inventory (Topic 330); Simplifying the Measurement of Inventory. This amendment replaced the method of measuring inventories at lower of cost or market with a lower of cost and net realizable value method. The adoption had no impact on the Company's financial position, results of operations and cash flows.
Accounting Standards Not Yet Adopted
In August 2017, the FASB issued ASU No. 2017-12, Derivatives and Hedging (Topic 815); Targeted Improvements to Accounting for Hedging Activities. The amendments in this ASU better align the risk management activities and financial reporting for these hedging relationships through changes to both the designation and measurement guidance for qualifying hedging relationships and presentation of hedge results. The guidance is effective for fiscal years beginning after December 15, 2018, and interim periods within those fiscal years. The Company does not expect the adoption of this standard to have a material impact on the Company’s financial position, results of operations and cash flows.
In May 2017, the FASB issued ASU No. 2017-09, Compensation - Stock Compensation (Topic 718); Scope of Modification Accounting. The amendments in this ASU provide guidance that clarifies when changes to the terms or conditions of a share-based payment award must be accounted for as modifications. If the value, vesting conditions or classification of the award changes, modification accounting will apply. The guidance is effective for fiscal years beginning after December 15, 2017, and interim periods within those fiscal years. The Company does not expect the adoption of this standard to have a material impact on the Company’s financial position, results of operations and cash flows.
In March 2017, the FASB issued ASU No. 2017-07, Compensation - Retirement Benefits (Topic 715); Improving the Presentation of Net Periodic Pension Cost and Net Periodic Postretirement Benefit Cost. The amendments to this ASU require the service cost component of net periodic benefit cost be reported in the same income statement line or lines as other compensation costs for employees. The other components of net periodic benefit cost are required to be reported separately from service costs and outside a subtotal of income from operations. Only the service cost component is eligible for capitalization. The guidance is effective for fiscal years beginning after December 15, 2017, including interim periods within those fiscal years. The amendments should be applied retrospectively for the income statement presentations and prospectively for the capitalization of service costs. The Company does not expect the adoption of this standard to have a material impact on the Company’s financial position, results of operations and cash flows.
GRAPHIC PACKAGING HOLDING COMPANYNOTES TO CONSOLIDATED FINANCIAL STATEMENTS - (Continued)
55
In January 2017, the FASB issued ASU No. 2017-04 Intangibles - Goodwill and Other (Topic 350); Simplifying the Test for Goodwill Impairment which simplifies how an entity is required to test goodwill for impairment by eliminating Step 2 of the goodwill impairment model. Step 2 measures a goodwill impairment loss by comparing the implied value of a reporting unit’s goodwill with the carrying amount of that goodwill. An entity would recognize an impairment charge for the amount by which the carrying amount of a reporting unit exceeds its fair value; however, the loss recognized is limited to the amount of goodwill allocated to that reporting unit. The guidance is effective for fiscal years beginning after December 15, 2019. Early adoption is permitted for any impairment tests performed after January 1, 2017.
In January 2017, the FASB issued ASU No. 2017-01, Business Combinations (Topic 805); Clarifying the Definition of a Business. The amendments in this ASU provide guidance in evaluating whether transactions should be accounted for as acquisitions (or disposals) of assets or businesses. The definition of a business affects many areas of accounting including acquisitions, disposals, goodwill and consolidation. The amendments are effective for fiscal years beginning after December 15, 2017, and interim periods within those fiscal years, and will be applied prospectively.
In August 2016, the FASB issued ASU No. 2016-15, Statement of Cash Flows (Topic 230); Classification of Certain Cash Receipts and Cash Payments. This ASU provides guidance to clarify how certain cash receipts and payments should be presented in the statement of cash flows. The guidance is effective for fiscal years beginning after December 15, 2017 and interim periods within those fiscal years. Early adoption is permitted. The updated guidance requires a retrospective adoption method. The Company is evaluating the impact of adoption of this standard on the Company's statement of cash flows.
In February 2016, the FASB issued ASU No. 2016-02, Leases (Topic 842). The amendments in this ASU require an entity to recognize a right-of-use asset and lease liability for all leases with terms of more than 12 months. Recognition, measurement and presentation of expenses will depend on classification as a finance or operating lease. The amendments also require certain quantitative and qualitative disclosures about leasing arrangements. The amendments are effective for fiscal years beginning after December 15, 2018, including interim periods within those fiscal years. Early adoption is permitted. The updated guidance requires a modified retrospective adoption. The Company is evaluating the impact of adoption on the Company's financial position, results of operation and cash flows.
In May 2014, the FASB issued ASU No. 2014-09, Revenue from Contracts with Customers (Topic 606). Adoption of ASU No. 2014-09 requires that an entity recognize revenue to depict the transfer of goods or services to customers in an amount that reflects the consideration to which the entity expects to be entitled in exchange for those goods or services. On July 9, 2015, the FASB deferred the effective date by one year to December 15, 2017 for interim and annual reporting periods beginning after that date and permitted early adoption of the standard but not before the original effective date of December 15, 2016, and can be applied using a full retrospective or modified retrospective approach. The Company is adopting this standard in the first quarter of fiscal 2018 and will use the modified retrospective approach. The Company formed an implementation team including representatives from finance, sales, and legal to assist in the assessment and implementation of this standard. The Company considered whether the adoption may require acceleration of revenue for products produced by the Company without an alternative use and when the Company would have a legally enforceable right of payment. Based on the Company's contract review, relevant laws, and other procedures, the Company concluded an enforceable right of payment does not exist because the Company is only entitled to cost for unclaimed cartons should a customer terminate without cause; therefore acceleration of revenue is not required. The Company is continuing its evaluation of all other aspects of the standard, and currently does not believe the adoption of the standard will have a material impact on the Company's financial position, results of operations and cash flows.
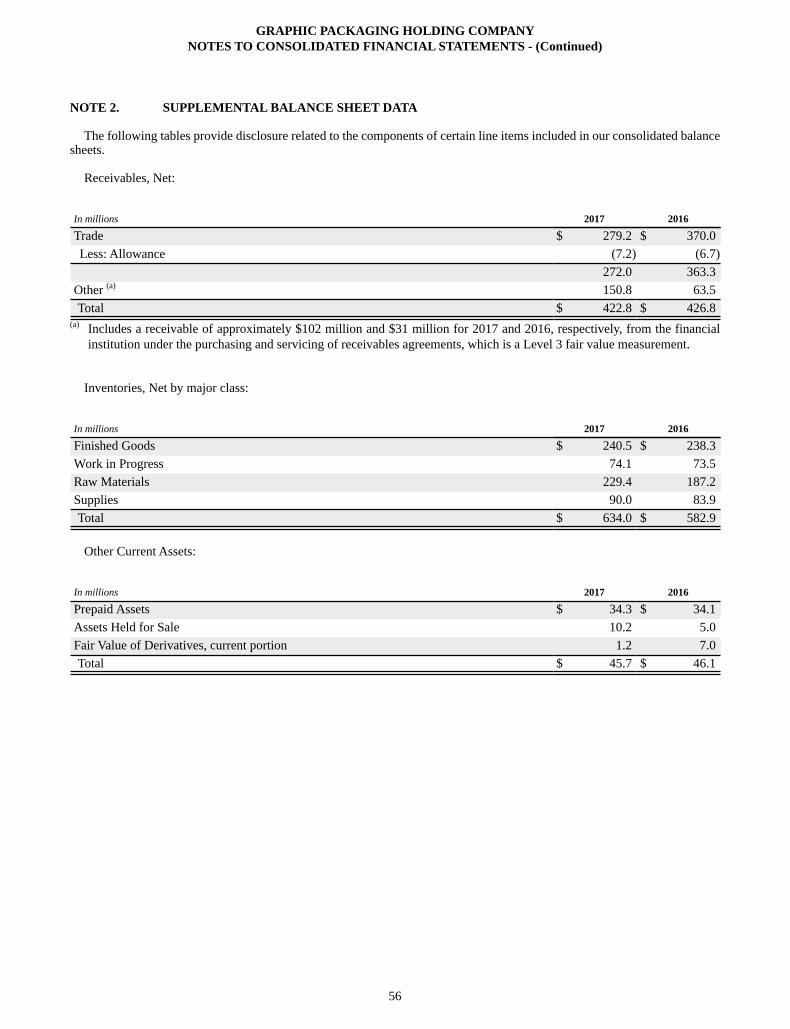
GRAPHIC PACKAGING HOLDING COMPANYNOTES TO CONSOLIDATED FINANCIAL STATEMENTS - (Continued)
56
NOTE 2. SUPPLEMENTAL BALANCE SHEET DATA
The following tables provide disclosure related to the components of certain line items included in our consolidated balance sheets.
Receivables, Net:
In millions 2017 2016
Trade $ 279.2 $ 370.0Less: Allowance (7.2) (6.7)
272.0 363.3Other (a) 150.8 63.5Total $ 422.8 $ 426.8
(a) Includes a receivable of approximately $102 million and $31 million for 2017 and 2016, respectively, from the financial institution under the purchasing and servicing of receivables agreements, which is a Level 3 fair value measurement.
Inventories, Net by major class:
In millions 2017 2016
Finished Goods $ 240.5 $ 238.3Work in Progress 74.1 73.5Raw Materials 229.4 187.2Supplies 90.0 83.9Total $ 634.0 $ 582.9
Other Current Assets:
In millions 2017 2016
Prepaid Assets $ 34.3 $ 34.1Assets Held for Sale 10.2 5.0Fair Value of Derivatives, current portion 1.2 7.0Total $ 45.7 $ 46.1
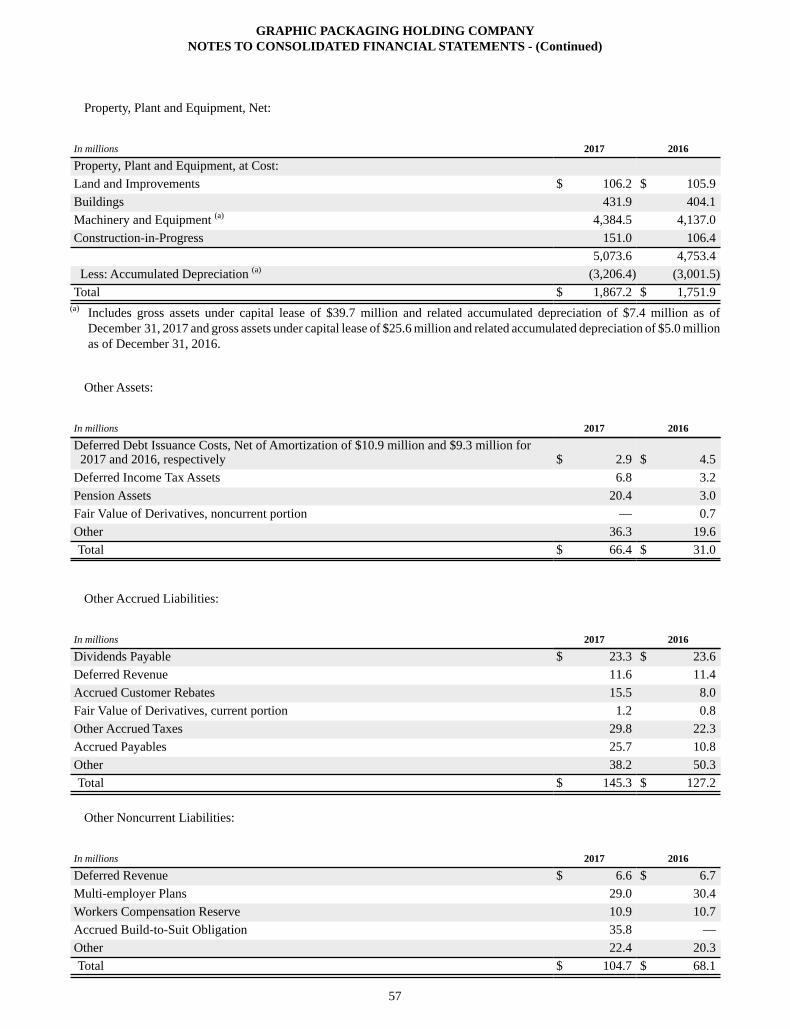
GRAPHIC PACKAGING HOLDING COMPANYNOTES TO CONSOLIDATED FINANCIAL STATEMENTS - (Continued)
57
Property, Plant and Equipment, Net:
In millions 2017 2016
Property, Plant and Equipment, at Cost:Land and Improvements $ 106.2 $ 105.9Buildings 431.9 404.1Machinery and Equipment (a) 4,384.5 4,137.0Construction-in-Progress 151.0 106.4
5,073.6 4,753.4Less: Accumulated Depreciation (a) (3,206.4) (3,001.5)
Total $ 1,867.2 $ 1,751.9(a) Includes gross assets under capital lease of $39.7 million and related accumulated depreciation of $7.4 million as of
December 31, 2017 and gross assets under capital lease of $25.6 million and related accumulated depreciation of $5.0 millionas of December 31, 2016.
Other Assets:
In millions 2017 2016
Deferred Debt Issuance Costs, Net of Amortization of $10.9 million and $9.3 million for 2017 and 2016, respectively $ 2.9 $ 4.5
Deferred Income Tax Assets 6.8 3.2Pension Assets 20.4 3.0Fair Value of Derivatives, noncurrent portion — 0.7Other 36.3 19.6Total $ 66.4 $ 31.0
Other Accrued Liabilities:
In millions 2017 2016
Dividends Payable $ 23.3 $ 23.6Deferred Revenue 11.6 11.4Accrued Customer Rebates 15.5 8.0Fair Value of Derivatives, current portion 1.2 0.8Other Accrued Taxes 29.8 22.3Accrued Payables 25.7 10.8Other 38.2 50.3Total $ 145.3 $ 127.2
Other Noncurrent Liabilities:
In millions 2017 2016
Deferred Revenue $ 6.6 $ 6.7Multi-employer Plans 29.0 30.4Workers Compensation Reserve 10.9 10.7Accrued Build-to-Suit Obligation 35.8 —Other 22.4 20.3Total $ 104.7 $ 68.1
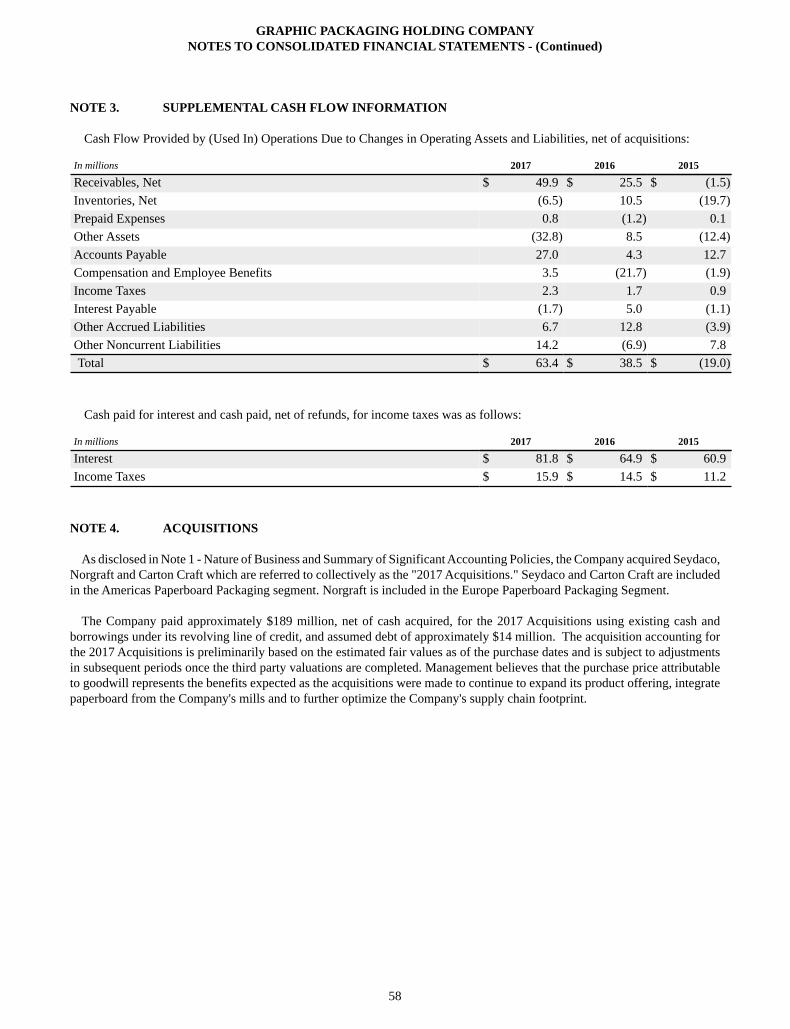
GRAPHIC PACKAGING HOLDING COMPANYNOTES TO CONSOLIDATED FINANCIAL STATEMENTS - (Continued)
58
NOTE 3. SUPPLEMENTAL CASH FLOW INFORMATION
Cash Flow Provided by (Used In) Operations Due to Changes in Operating Assets and Liabilities, net of acquisitions:
In millions 2017 2016 2015
Receivables, Net $ 49.9 $ 25.5 $ (1.5)Inventories, Net (6.5) 10.5 (19.7)Prepaid Expenses 0.8 (1.2) 0.1Other Assets (32.8) 8.5 (12.4)Accounts Payable 27.0 4.3 12.7Compensation and Employee Benefits 3.5 (21.7) (1.9)Income Taxes 2.3 1.7 0.9Interest Payable (1.7) 5.0 (1.1)Other Accrued Liabilities 6.7 12.8 (3.9)Other Noncurrent Liabilities 14.2 (6.9) 7.8Total $ 63.4 $ 38.5 $ (19.0)
Cash paid for interest and cash paid, net of refunds, for income taxes was as follows:
In millions 2017 2016 2015
Interest $ 81.8 $ 64.9 $ 60.9Income Taxes $ 15.9 $ 14.5 $ 11.2
NOTE 4. ACQUISITIONS
As disclosed in Note 1 - Nature of Business and Summary of Significant Accounting Policies, the Company acquired Seydaco, Norgraft and Carton Craft which are referred to collectively as the "2017 Acquisitions." Seydaco and Carton Craft are included in the Americas Paperboard Packaging segment. Norgraft is included in the Europe Paperboard Packaging Segment.
The Company paid approximately $189 million, net of cash acquired, for the 2017 Acquisitions using existing cash and borrowings under its revolving line of credit, and assumed debt of approximately $14 million. The acquisition accounting for the 2017 Acquisitions is preliminarily based on the estimated fair values as of the purchase dates and is subject to adjustments in subsequent periods once the third party valuations are completed. Management believes that the purchase price attributable to goodwill represents the benefits expected as the acquisitions were made to continue to expand its product offering, integrate paperboard from the Company's mills and to further optimize the Company's supply chain footprint.
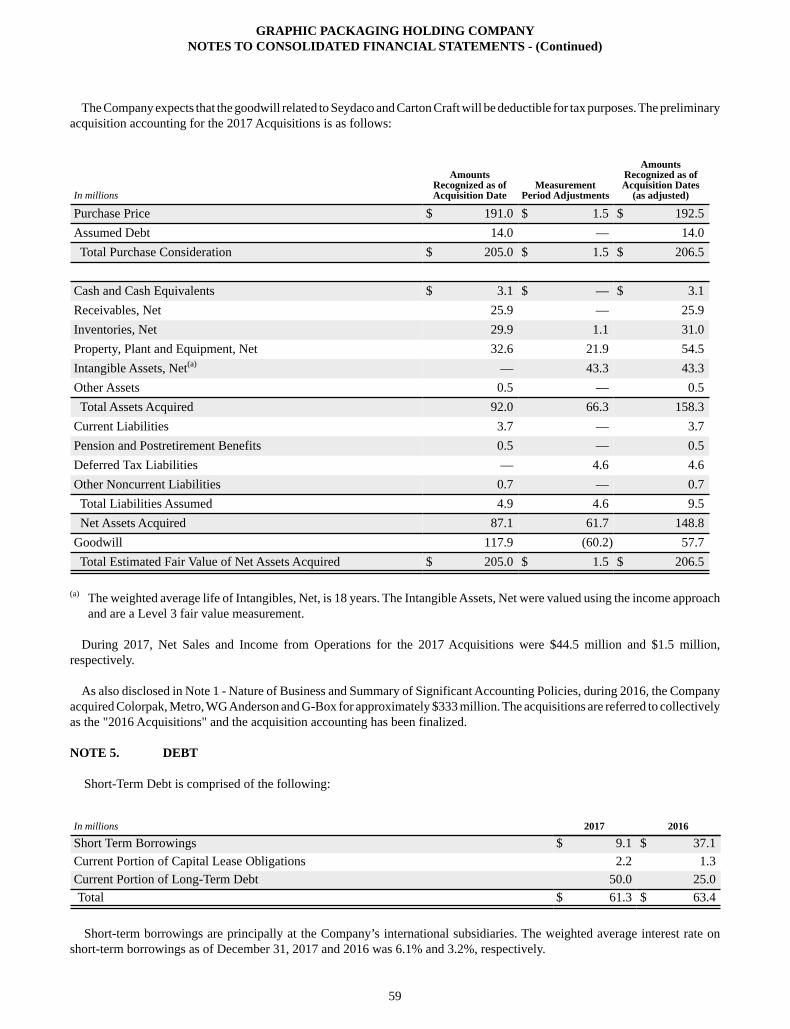
GRAPHIC PACKAGING HOLDING COMPANYNOTES TO CONSOLIDATED FINANCIAL STATEMENTS - (Continued)
59
The Company expects that the goodwill related to Seydaco and Carton Craft will be deductible for tax purposes. The preliminary acquisition accounting for the 2017 Acquisitions is as follows:
In millions
AmountsRecognized as ofAcquisition Date
MeasurementPeriod Adjustments
AmountsRecognized as ofAcquisition Dates
(as adjusted)
Purchase Price $ 191.0 $ 1.5 $ 192.5Assumed Debt 14.0 — 14.0 Total Purchase Consideration $ 205.0 $ 1.5 $ 206.5
Cash and Cash Equivalents $ 3.1 $ — $ 3.1Receivables, Net 25.9 — 25.9Inventories, Net 29.9 1.1 31.0Property, Plant and Equipment, Net 32.6 21.9 54.5Intangible Assets, Net(a) — 43.3 43.3Other Assets 0.5 — 0.5 Total Assets Acquired 92.0 66.3 158.3Current Liabilities 3.7 — 3.7Pension and Postretirement Benefits 0.5 — 0.5Deferred Tax Liabilities — 4.6 4.6Other Noncurrent Liabilities 0.7 — 0.7 Total Liabilities Assumed 4.9 4.6 9.5 Net Assets Acquired 87.1 61.7 148.8Goodwill 117.9 (60.2) 57.7 Total Estimated Fair Value of Net Assets Acquired $ 205.0 $ 1.5 $ 206.5
(a) The weighted average life of Intangibles, Net, is 18 years. The Intangible Assets, Net were valued using the income approach and are a Level 3 fair value measurement.
During 2017, Net Sales and Income from Operations for the 2017 Acquisitions were $44.5 million and $1.5 million, respectively.
As also disclosed in Note 1 - Nature of Business and Summary of Significant Accounting Policies, during 2016, the Company acquired Colorpak, Metro, WG Anderson and G-Box for approximately $333 million. The acquisitions are referred to collectively as the "2016 Acquisitions" and the acquisition accounting has been finalized.
NOTE 5. DEBT
Short-Term Debt is comprised of the following:
In millions 2017 2016
Short Term Borrowings $ 9.1 $ 37.1Current Portion of Capital Lease Obligations 2.2 1.3Current Portion of Long-Term Debt 50.0 25.0Total $ 61.3 $ 63.4
Short-term borrowings are principally at the Company’s international subsidiaries. The weighted average interest rate on short-term borrowings as of December 31, 2017 and 2016 was 6.1% and 3.2%, respectively.
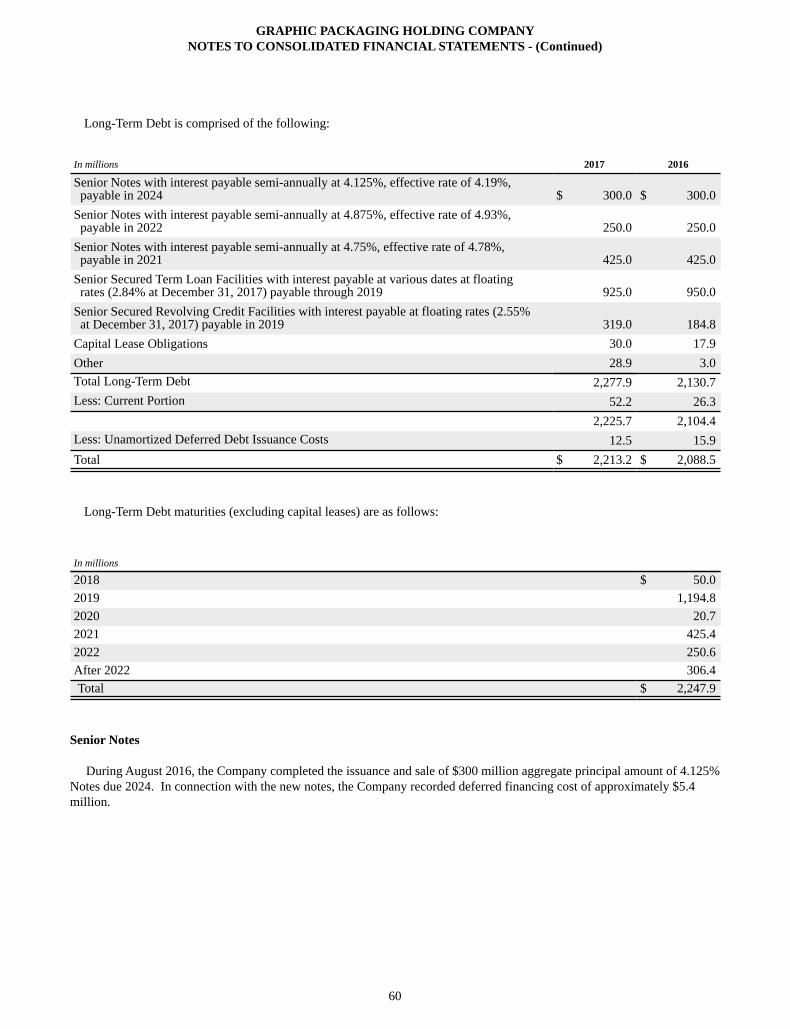
GRAPHIC PACKAGING HOLDING COMPANYNOTES TO CONSOLIDATED FINANCIAL STATEMENTS - (Continued)
60
Long-Term Debt is comprised of the following:
In millions 2017 2016
Senior Notes with interest payable semi-annually at 4.125%, effective rate of 4.19%,payable in 2024 $ 300.0 $ 300.0
Senior Notes with interest payable semi-annually at 4.875%, effective rate of 4.93%,payable in 2022 250.0 250.0
Senior Notes with interest payable semi-annually at 4.75%, effective rate of 4.78%,payable in 2021 425.0 425.0
Senior Secured Term Loan Facilities with interest payable at various dates at floatingrates (2.84% at December 31, 2017) payable through 2019 925.0 950.0
Senior Secured Revolving Credit Facilities with interest payable at floating rates (2.55%at December 31, 2017) payable in 2019 319.0 184.8
Capital Lease Obligations 30.0 17.9Other 28.9 3.0Total Long-Term Debt 2,277.9 2,130.7Less: Current Portion 52.2 26.3
2,225.7 2,104.4Less: Unamortized Deferred Debt Issuance Costs 12.5 15.9Total $ 2,213.2 $ 2,088.5
Long-Term Debt maturities (excluding capital leases) are as follows:
In millions
2018 $ 50.02019 1,194.82020 20.72021 425.42022 250.6After 2022 306.4Total $ 2,247.9
Senior Notes
During August 2016, the Company completed the issuance and sale of $300 million aggregate principal amount of 4.125% Notes due 2024. In connection with the new notes, the Company recorded deferred financing cost of approximately $5.4 million.
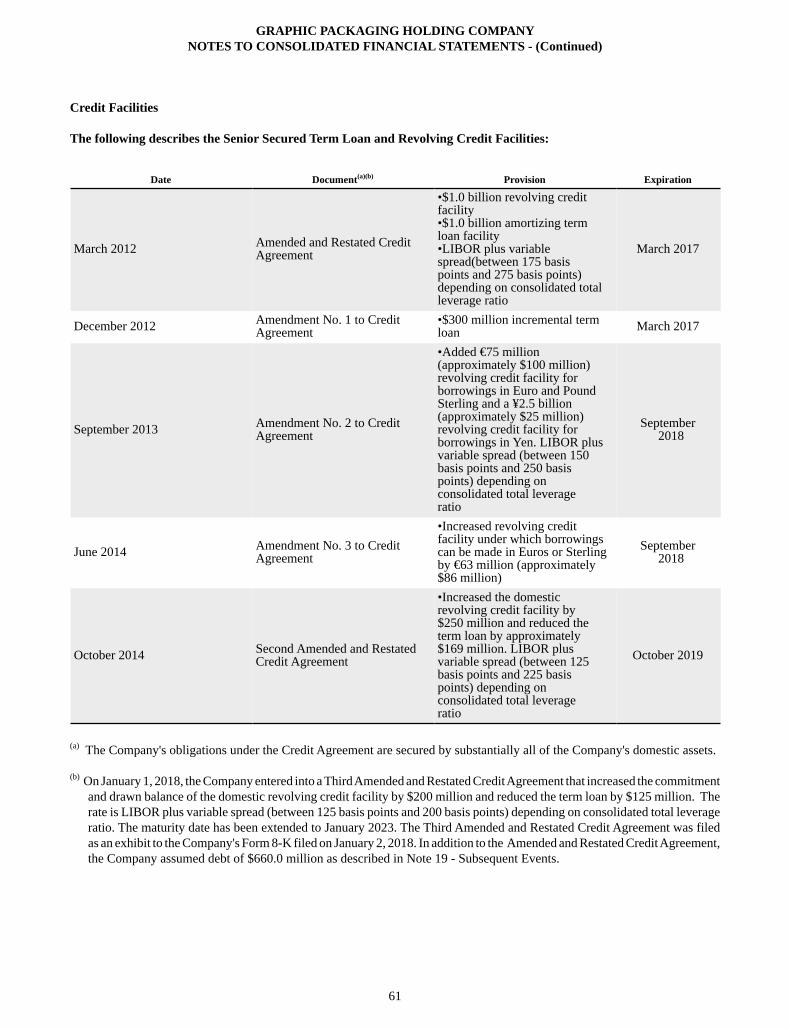
GRAPHIC PACKAGING HOLDING COMPANYNOTES TO CONSOLIDATED FINANCIAL STATEMENTS - (Continued)
61
Credit Facilities
The following describes the Senior Secured Term Loan and Revolving Credit Facilities:
Date Document(a)(b) Provision Expiration
March 2012 Amended and Restated CreditAgreement
•$1.0 billion revolving creditfacility•$1.0 billion amortizing termloan facility•LIBOR plus variablespread(between 175 basispoints and 275 basis points)depending on consolidated totalleverage ratio
March 2017
December 2012 Amendment No. 1 to CreditAgreement
•$300 million incremental termloan March 2017
September 2013 Amendment No. 2 to CreditAgreement
•Added €75 million(approximately $100 million)revolving credit facility forborrowings in Euro and PoundSterling and a ¥2.5 billion(approximately $25 million)revolving credit facility forborrowings in Yen. LIBOR plusvariable spread (between 150basis points and 250 basispoints) depending onconsolidated total leverageratio
September2018
June 2014 Amendment No. 3 to CreditAgreement
•Increased revolving creditfacility under which borrowingscan be made in Euros or Sterlingby €63 million (approximately$86 million)
September2018
October 2014 Second Amended and RestatedCredit Agreement
•Increased the domesticrevolving credit facility by$250 million and reduced theterm loan by approximately$169 million. LIBOR plusvariable spread (between 125basis points and 225 basispoints) depending onconsolidated total leverageratio
October 2019
(a) The Company's obligations under the Credit Agreement are secured by substantially all of the Company's domestic assets.
(b) On January 1, 2018, the Company entered into a Third Amended and Restated Credit Agreement that increased the commitment and drawn balance of the domestic revolving credit facility by $200 million and reduced the term loan by $125 million. The rate is LIBOR plus variable spread (between 125 basis points and 200 basis points) depending on consolidated total leverage ratio. The maturity date has been extended to January 2023. The Third Amended and Restated Credit Agreement was filed as an exhibit to the Company's Form 8-K filed on January 2, 2018. In addition to the Amended and Restated Credit Agreement, the Company assumed debt of $660.0 million as described in Note 19 - Subsequent Events.
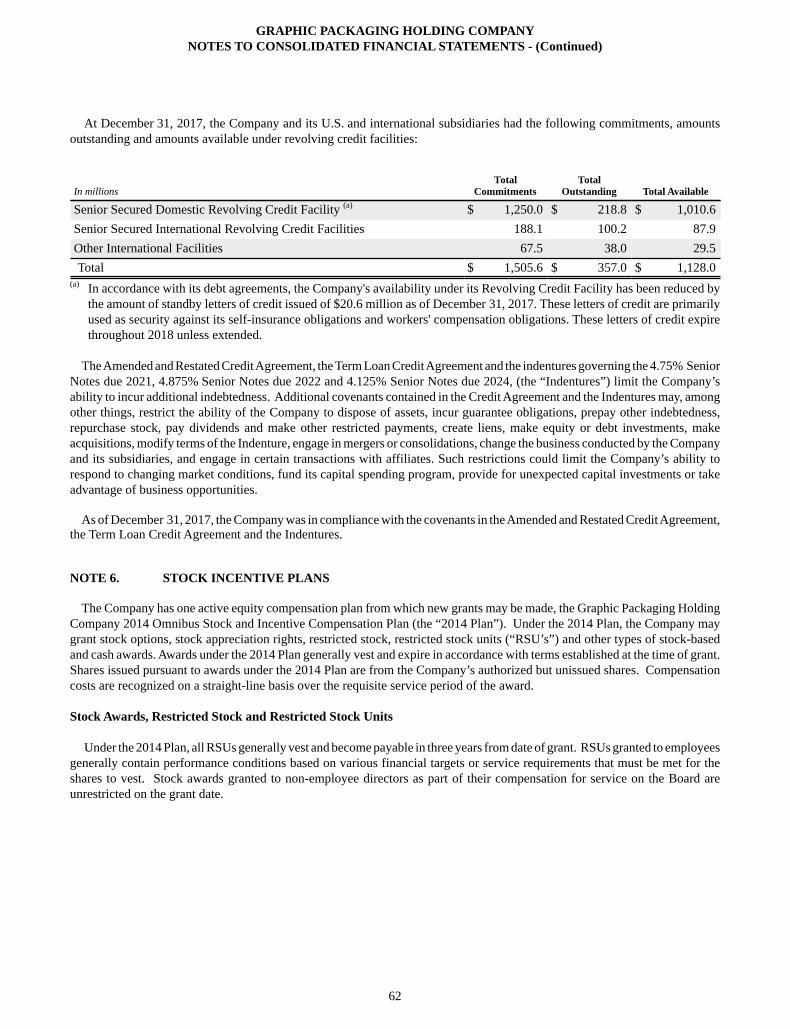
GRAPHIC PACKAGING HOLDING COMPANYNOTES TO CONSOLIDATED FINANCIAL STATEMENTS - (Continued)
62
At December 31, 2017, the Company and its U.S. and international subsidiaries had the following commitments, amounts
outstanding and amounts available under revolving credit facilities:
In millionsTotal
CommitmentsTotal
Outstanding Total Available
Senior Secured Domestic Revolving Credit Facility (a) $ 1,250.0 $ 218.8 $ 1,010.6Senior Secured International Revolving Credit Facilities 188.1 100.2 87.9Other International Facilities 67.5 38.0 29.5Total $ 1,505.6 $ 357.0 $ 1,128.0
(a) In accordance with its debt agreements, the Company's availability under its Revolving Credit Facility has been reduced by the amount of standby letters of credit issued of $20.6 million as of December 31, 2017. These letters of credit are primarily used as security against its self-insurance obligations and workers' compensation obligations. These letters of credit expire throughout 2018 unless extended.
The Amended and Restated Credit Agreement, the Term Loan Credit Agreement and the indentures governing the 4.75% Senior Notes due 2021, 4.875% Senior Notes due 2022 and 4.125% Senior Notes due 2024, (the “Indentures”) limit the Company’s ability to incur additional indebtedness. Additional covenants contained in the Credit Agreement and the Indentures may, among other things, restrict the ability of the Company to dispose of assets, incur guarantee obligations, prepay other indebtedness, repurchase stock, pay dividends and make other restricted payments, create liens, make equity or debt investments, make acquisitions, modify terms of the Indenture, engage in mergers or consolidations, change the business conducted by the Company and its subsidiaries, and engage in certain transactions with affiliates. Such restrictions could limit the Company’s ability to respond to changing market conditions, fund its capital spending program, provide for unexpected capital investments or take advantage of business opportunities.
As of December 31, 2017, the Company was in compliance with the covenants in the Amended and Restated Credit Agreement, the Term Loan Credit Agreement and the Indentures.
NOTE 6. STOCK INCENTIVE PLANS
The Company has one active equity compensation plan from which new grants may be made, the Graphic Packaging Holding Company 2014 Omnibus Stock and Incentive Compensation Plan (the “2014 Plan”). Under the 2014 Plan, the Company may grant stock options, stock appreciation rights, restricted stock, restricted stock units (“RSU’s”) and other types of stock-based and cash awards. Awards under the 2014 Plan generally vest and expire in accordance with terms established at the time of grant. Shares issued pursuant to awards under the 2014 Plan are from the Company’s authorized but unissued shares. Compensation costs are recognized on a straight-line basis over the requisite service period of the award.
Stock Awards, Restricted Stock and Restricted Stock Units
Under the 2014 Plan, all RSUs generally vest and become payable in three years from date of grant. RSUs granted to employees generally contain performance conditions based on various financial targets or service requirements that must be met for the shares to vest. Stock awards granted to non-employee directors as part of their compensation for service on the Board are unrestricted on the grant date.
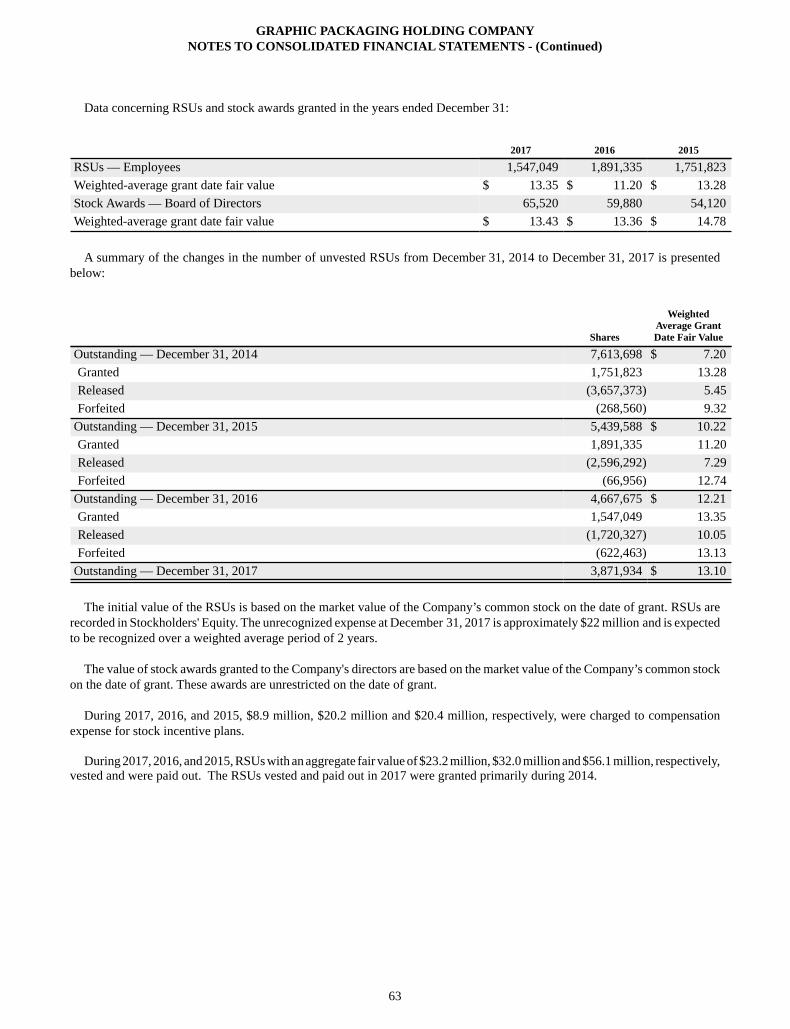
GRAPHIC PACKAGING HOLDING COMPANYNOTES TO CONSOLIDATED FINANCIAL STATEMENTS - (Continued)
63
Data concerning RSUs and stock awards granted in the years ended December 31:
2017 2016 2015
RSUs — Employees 1,547,049 1,891,335 1,751,823Weighted-average grant date fair value $ 13.35 $ 11.20 $ 13.28Stock Awards — Board of Directors 65,520 59,880 54,120Weighted-average grant date fair value $ 13.43 $ 13.36 $ 14.78
A summary of the changes in the number of unvested RSUs from December 31, 2014 to December 31, 2017 is presented below:
Shares
WeightedAverage GrantDate Fair Value
Outstanding — December 31, 2014 7,613,698 $ 7.20Granted 1,751,823 13.28Released (3,657,373) 5.45Forfeited (268,560) 9.32
Outstanding — December 31, 2015 5,439,588 $ 10.22Granted 1,891,335 11.20Released (2,596,292) 7.29Forfeited (66,956) 12.74
Outstanding — December 31, 2016 4,667,675 $ 12.21Granted 1,547,049 13.35Released (1,720,327) 10.05Forfeited (622,463) 13.13
Outstanding — December 31, 2017 3,871,934 $ 13.10
The initial value of the RSUs is based on the market value of the Company’s common stock on the date of grant. RSUs are recorded in Stockholders' Equity. The unrecognized expense at December 31, 2017 is approximately $22 million and is expected to be recognized over a weighted average period of 2 years.
The value of stock awards granted to the Company's directors are based on the market value of the Company’s common stock on the date of grant. These awards are unrestricted on the date of grant.
During 2017, 2016, and 2015, $8.9 million, $20.2 million and $20.4 million, respectively, were charged to compensation expense for stock incentive plans.
During 2017, 2016, and 2015, RSUs with an aggregate fair value of $23.2 million, $32.0 million and $56.1 million, respectively, vested and were paid out. The RSUs vested and paid out in 2017 were granted primarily during 2014.
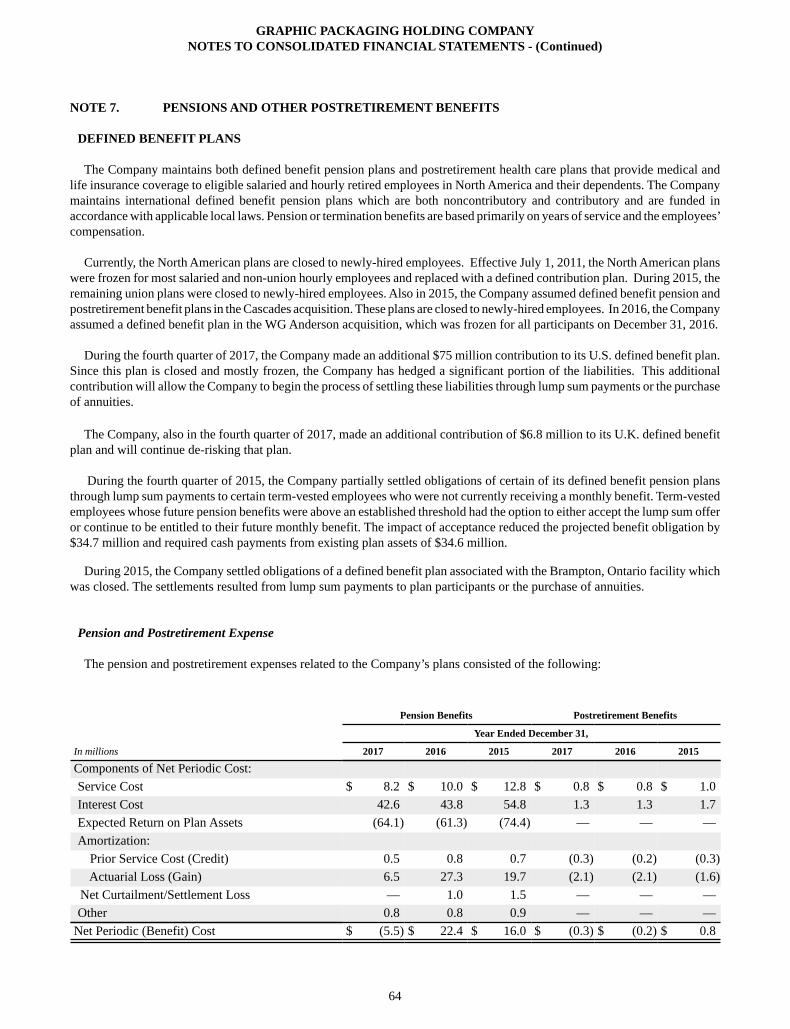
GRAPHIC PACKAGING HOLDING COMPANYNOTES TO CONSOLIDATED FINANCIAL STATEMENTS - (Continued)
64
NOTE 7. PENSIONS AND OTHER POSTRETIREMENT BENEFITS
DEFINED BENEFIT PLANS
The Company maintains both defined benefit pension plans and postretirement health care plans that provide medical and life insurance coverage to eligible salaried and hourly retired employees in North America and their dependents. The Company maintains international defined benefit pension plans which are both noncontributory and contributory and are funded in accordance with applicable local laws. Pension or termination benefits are based primarily on years of service and the employees’ compensation.
Currently, the North American plans are closed to newly-hired employees. Effective July 1, 2011, the North American plans were frozen for most salaried and non-union hourly employees and replaced with a defined contribution plan. During 2015, the remaining union plans were closed to newly-hired employees. Also in 2015, the Company assumed defined benefit pension and postretirement benefit plans in the Cascades acquisition. These plans are closed to newly-hired employees. In 2016, the Company assumed a defined benefit plan in the WG Anderson acquisition, which was frozen for all participants on December 31, 2016.
During the fourth quarter of 2017, the Company made an additional $75 million contribution to its U.S. defined benefit plan. Since this plan is closed and mostly frozen, the Company has hedged a significant portion of the liabilities. This additional contribution will allow the Company to begin the process of settling these liabilities through lump sum payments or the purchase of annuities.
The Company, also in the fourth quarter of 2017, made an additional contribution of $6.8 million to its U.K. defined benefit plan and will continue de-risking that plan.
During the fourth quarter of 2015, the Company partially settled obligations of certain of its defined benefit pension plans through lump sum payments to certain term-vested employees who were not currently receiving a monthly benefit. Term-vested employees whose future pension benefits were above an established threshold had the option to either accept the lump sum offer or continue to be entitled to their future monthly benefit. The impact of acceptance reduced the projected benefit obligation by $34.7 million and required cash payments from existing plan assets of $34.6 million.
During 2015, the Company settled obligations of a defined benefit plan associated with the Brampton, Ontario facility which was closed. The settlements resulted from lump sum payments to plan participants or the purchase of annuities.
Pension and Postretirement Expense
The pension and postretirement expenses related to the Company’s plans consisted of the following:
Pension Benefits Postretirement Benefits
Year Ended December 31,
In millions 2017 2016 2015 2017 2016 2015
Components of Net Periodic Cost:Service Cost $ 8.2 $ 10.0 $ 12.8 $ 0.8 $ 0.8 $ 1.0Interest Cost 42.6 43.8 54.8 1.3 1.3 1.7Expected Return on Plan Assets (64.1) (61.3) (74.4) — — —Amortization: Prior Service Cost (Credit) 0.5 0.8 0.7 (0.3) (0.2) (0.3) Actuarial Loss (Gain) 6.5 27.3 19.7 (2.1) (2.1) (1.6)
Net Curtailment/Settlement Loss — 1.0 1.5 — — —Other 0.8 0.8 0.9 — — —
Net Periodic (Benefit) Cost $ (5.5) $ 22.4 $ 16.0 $ (0.3) $ (0.2) $ 0.8
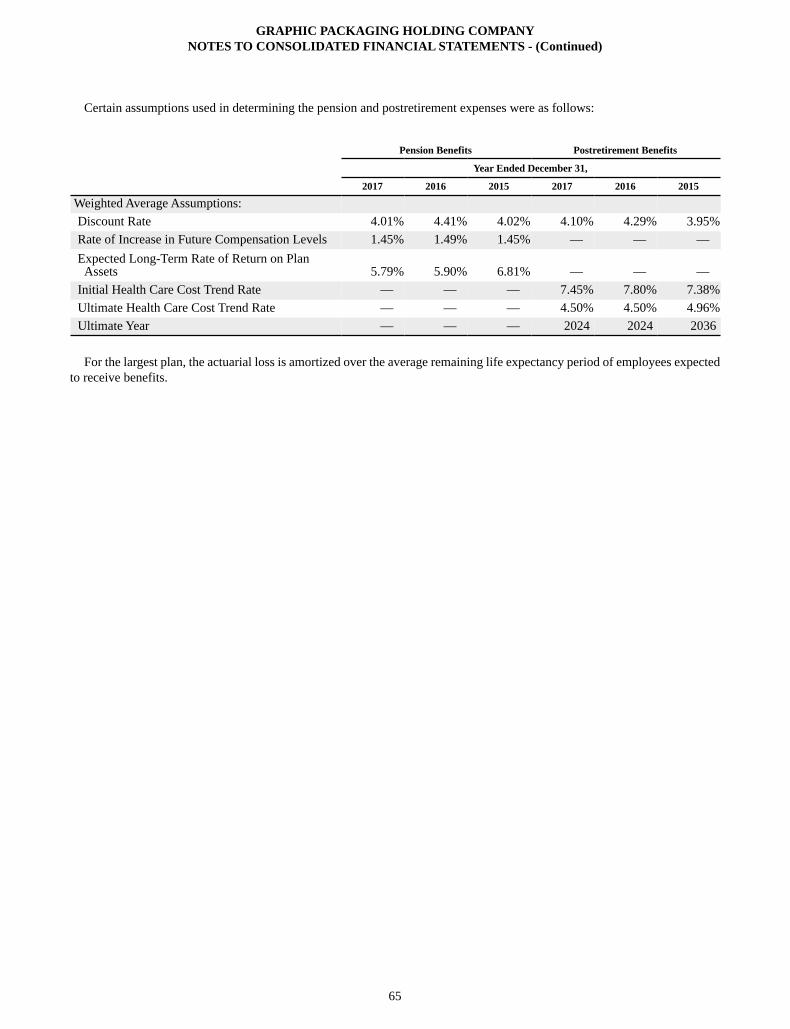
GRAPHIC PACKAGING HOLDING COMPANYNOTES TO CONSOLIDATED FINANCIAL STATEMENTS - (Continued)
65
Certain assumptions used in determining the pension and postretirement expenses were as follows:
Pension Benefits Postretirement Benefits
Year Ended December 31,
2017 2016 2015 2017 2016 2015
Weighted Average Assumptions:Discount Rate 4.01% 4.41% 4.02% 4.10% 4.29% 3.95%Rate of Increase in Future Compensation Levels 1.45% 1.49% 1.45% — — —Expected Long-Term Rate of Return on PlanAssets 5.79% 5.90% 6.81% — — —
Initial Health Care Cost Trend Rate — — — 7.45% 7.80% 7.38%Ultimate Health Care Cost Trend Rate — — — 4.50% 4.50% 4.96%Ultimate Year — — — 2024 2024 2036
For the largest plan, the actuarial loss is amortized over the average remaining life expectancy period of employees expected to receive benefits.
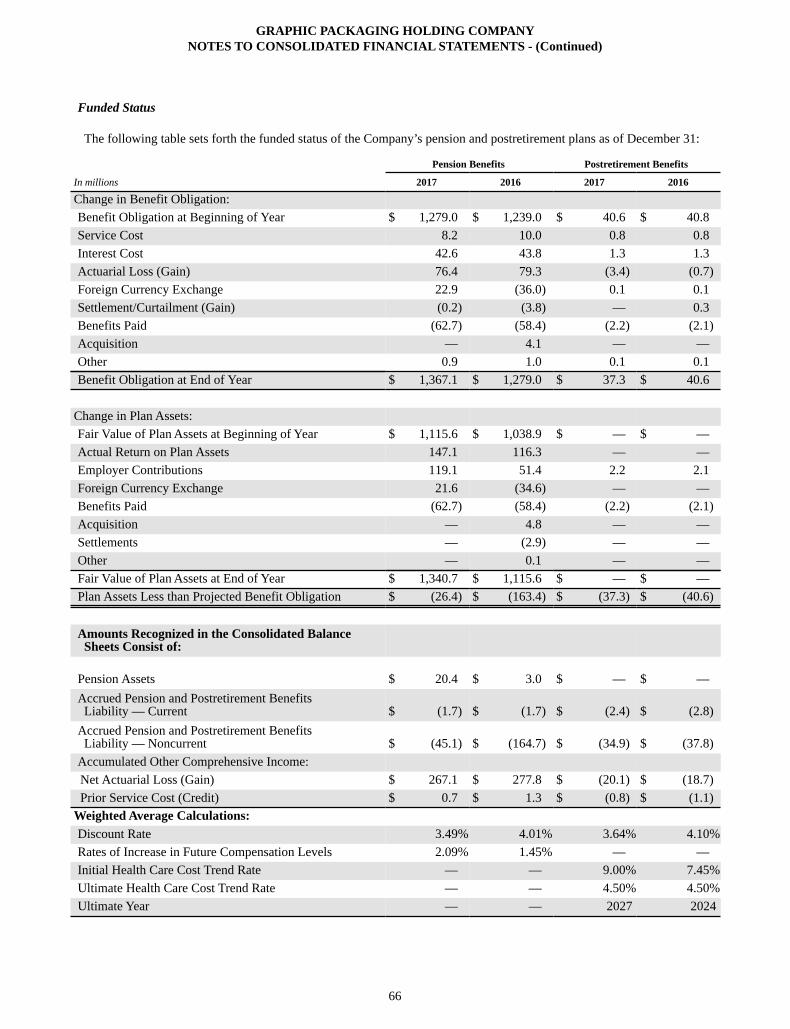
GRAPHIC PACKAGING HOLDING COMPANYNOTES TO CONSOLIDATED FINANCIAL STATEMENTS - (Continued)
66
Funded Status
The following table sets forth the funded status of the Company’s pension and postretirement plans as of December 31:
Pension Benefits Postretirement Benefits
In millions 2017 2016 2017 2016
Change in Benefit Obligation:Benefit Obligation at Beginning of Year $ 1,279.0 $ 1,239.0 $ 40.6 $ 40.8Service Cost 8.2 10.0 0.8 0.8Interest Cost 42.6 43.8 1.3 1.3Actuarial Loss (Gain) 76.4 79.3 (3.4) (0.7)Foreign Currency Exchange 22.9 (36.0) 0.1 0.1Settlement/Curtailment (Gain) (0.2) (3.8) — 0.3Benefits Paid (62.7) (58.4) (2.2) (2.1)Acquisition — 4.1 — —Other 0.9 1.0 0.1 0.1Benefit Obligation at End of Year $ 1,367.1 $ 1,279.0 $ 37.3 $ 40.6
Change in Plan Assets:Fair Value of Plan Assets at Beginning of Year $ 1,115.6 $ 1,038.9 $ — $ —Actual Return on Plan Assets 147.1 116.3 — —Employer Contributions 119.1 51.4 2.2 2.1Foreign Currency Exchange 21.6 (34.6) — —Benefits Paid (62.7) (58.4) (2.2) (2.1)Acquisition — 4.8 — —Settlements — (2.9) — —Other — 0.1 — —Fair Value of Plan Assets at End of Year $ 1,340.7 $ 1,115.6 $ — $ —Plan Assets Less than Projected Benefit Obligation $ (26.4) $ (163.4) $ (37.3) $ (40.6)
Amounts Recognized in the Consolidated BalanceSheets Consist of:
Pension Assets $ 20.4 $ 3.0 $ — $ —Accrued Pension and Postretirement BenefitsLiability — Current $ (1.7) $ (1.7) $ (2.4) $ (2.8)
Accrued Pension and Postretirement BenefitsLiability — Noncurrent $ (45.1) $ (164.7) $ (34.9) $ (37.8)
Accumulated Other Comprehensive Income:Net Actuarial Loss (Gain) $ 267.1 $ 277.8 $ (20.1) $ (18.7)Prior Service Cost (Credit) $ 0.7 $ 1.3 $ (0.8) $ (1.1)
Weighted Average Calculations:Discount Rate 3.49% 4.01% 3.64% 4.10%Rates of Increase in Future Compensation Levels 2.09% 1.45% — —Initial Health Care Cost Trend Rate — — 9.00% 7.45%Ultimate Health Care Cost Trend Rate — — 4.50% 4.50%Ultimate Year — — 2027 2024
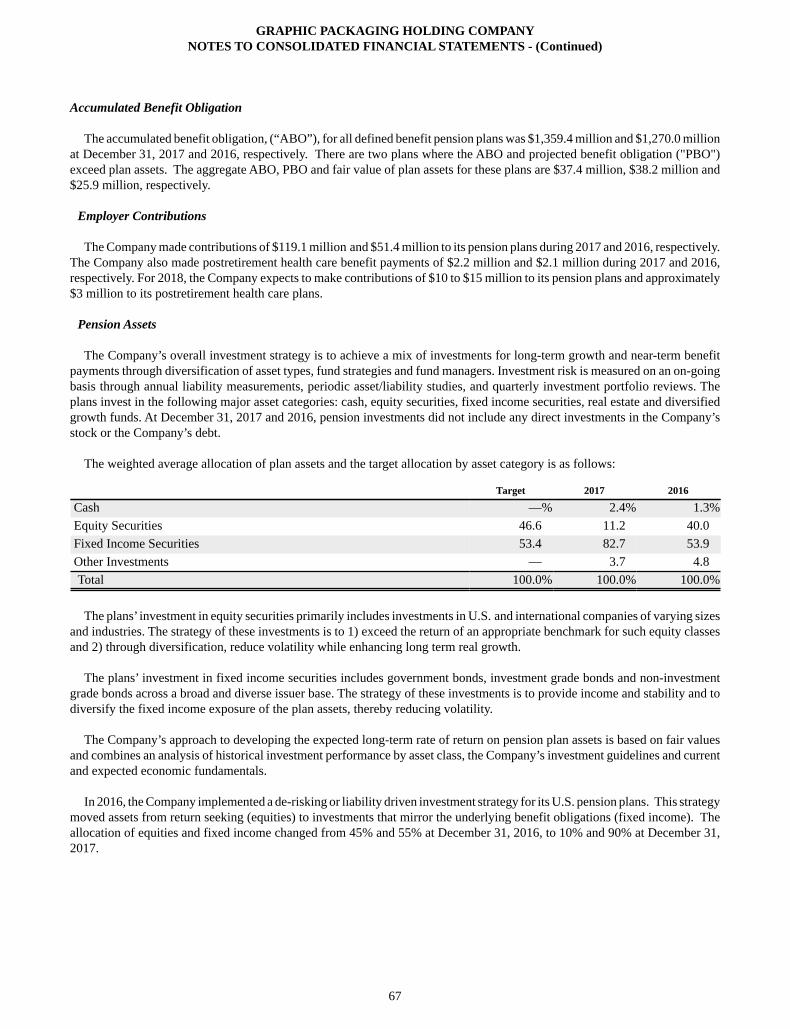
GRAPHIC PACKAGING HOLDING COMPANYNOTES TO CONSOLIDATED FINANCIAL STATEMENTS - (Continued)
67
Accumulated Benefit Obligation
The accumulated benefit obligation, (“ABO”), for all defined benefit pension plans was $1,359.4 million and $1,270.0 millionat December 31, 2017 and 2016, respectively. There are two plans where the ABO and projected benefit obligation ("PBO") exceed plan assets. The aggregate ABO, PBO and fair value of plan assets for these plans are $37.4 million, $38.2 million and $25.9 million, respectively.
Employer Contributions
The Company made contributions of $119.1 million and $51.4 million to its pension plans during 2017 and 2016, respectively. The Company also made postretirement health care benefit payments of $2.2 million and $2.1 million during 2017 and 2016, respectively. For 2018, the Company expects to make contributions of $10 to $15 million to its pension plans and approximately $3 million to its postretirement health care plans.
Pension Assets
The Company’s overall investment strategy is to achieve a mix of investments for long-term growth and near-term benefit payments through diversification of asset types, fund strategies and fund managers. Investment risk is measured on an on-going basis through annual liability measurements, periodic asset/liability studies, and quarterly investment portfolio reviews. The plans invest in the following major asset categories: cash, equity securities, fixed income securities, real estate and diversified growth funds. At December 31, 2017 and 2016, pension investments did not include any direct investments in the Company’s stock or the Company’s debt.
The weighted average allocation of plan assets and the target allocation by asset category is as follows:
Target 2017 2016
Cash —% 2.4% 1.3%Equity Securities 46.6 11.2 40.0Fixed Income Securities 53.4 82.7 53.9Other Investments — 3.7 4.8Total 100.0% 100.0% 100.0%
The plans’ investment in equity securities primarily includes investments in U.S. and international companies of varying sizes and industries. The strategy of these investments is to 1) exceed the return of an appropriate benchmark for such equity classes and 2) through diversification, reduce volatility while enhancing long term real growth.
The plans’ investment in fixed income securities includes government bonds, investment grade bonds and non-investment grade bonds across a broad and diverse issuer base. The strategy of these investments is to provide income and stability and to diversify the fixed income exposure of the plan assets, thereby reducing volatility.
The Company’s approach to developing the expected long-term rate of return on pension plan assets is based on fair values and combines an analysis of historical investment performance by asset class, the Company’s investment guidelines and current and expected economic fundamentals.
In 2016, the Company implemented a de-risking or liability driven investment strategy for its U.S. pension plans. This strategy moved assets from return seeking (equities) to investments that mirror the underlying benefit obligations (fixed income). The allocation of equities and fixed income changed from 45% and 55% at December 31, 2016, to 10% and 90% at December 31, 2017.
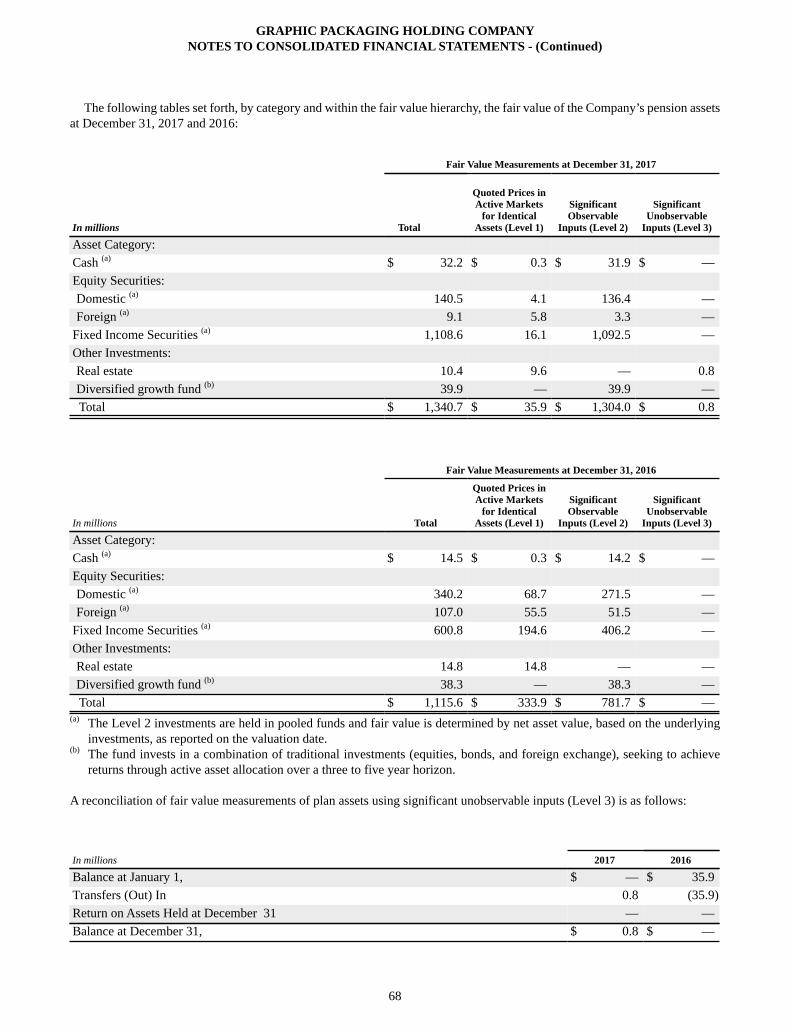
GRAPHIC PACKAGING HOLDING COMPANYNOTES TO CONSOLIDATED FINANCIAL STATEMENTS - (Continued)
68
The following tables set forth, by category and within the fair value hierarchy, the fair value of the Company’s pension assets at December 31, 2017 and 2016:
Fair Value Measurements at December 31, 2017 In millions
Total
Quoted Prices inActive Markets
for IdenticalAssets (Level 1)
SignificantObservable
Inputs (Level 2)
SignificantUnobservable
Inputs (Level 3)
Asset Category:Cash (a) $ 32.2 $ 0.3 $ 31.9 $ —Equity Securities:Domestic (a) 140.5 4.1 136.4 —Foreign (a) 9.1 5.8 3.3 —
Fixed Income Securities (a) 1,108.6 16.1 1,092.5 —Other Investments:Real estate 10.4 9.6 — 0.8Diversified growth fund (b) 39.9 — 39.9 —Total $ 1,340.7 $ 35.9 $ 1,304.0 $ 0.8
Fair Value Measurements at December 31, 2016
In millions Total
Quoted Prices inActive Markets
for IdenticalAssets (Level 1)
SignificantObservable
Inputs (Level 2)
SignificantUnobservable
Inputs (Level 3)
Asset Category:Cash (a) $ 14.5 $ 0.3 $ 14.2 $ —Equity Securities:Domestic (a) 340.2 68.7 271.5 —Foreign (a) 107.0 55.5 51.5 —
Fixed Income Securities (a) 600.8 194.6 406.2 —Other Investments:Real estate 14.8 14.8 — —Diversified growth fund (b) 38.3 — 38.3 —Total $ 1,115.6 $ 333.9 $ 781.7 $ —
(a) The Level 2 investments are held in pooled funds and fair value is determined by net asset value, based on the underlying investments, as reported on the valuation date.
(b) The fund invests in a combination of traditional investments (equities, bonds, and foreign exchange), seeking to achieve returns through active asset allocation over a three to five year horizon.
A reconciliation of fair value measurements of plan assets using significant unobservable inputs (Level 3) is as follows:
In millions 2017 2016
Balance at January 1, $ — $ 35.9Transfers (Out) In 0.8 (35.9)Return on Assets Held at December 31 — —Balance at December 31, $ 0.8 $ —
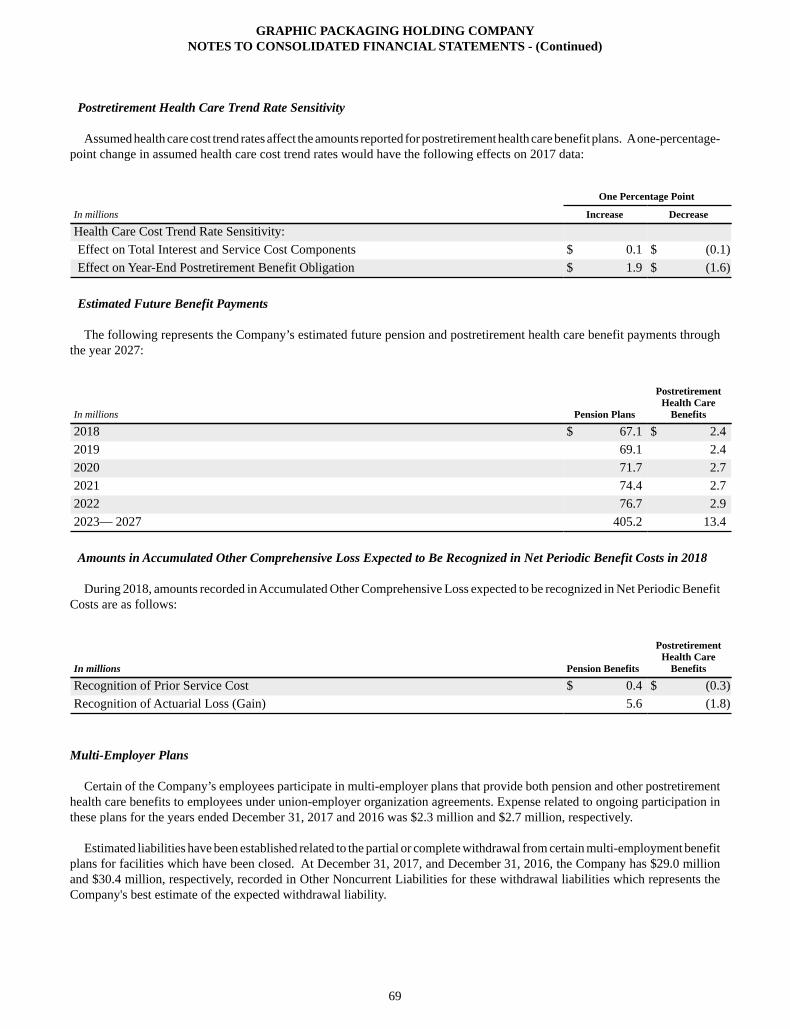
GRAPHIC PACKAGING HOLDING COMPANYNOTES TO CONSOLIDATED FINANCIAL STATEMENTS - (Continued)
69
Postretirement Health Care Trend Rate Sensitivity
Assumed health care cost trend rates affect the amounts reported for postretirement health care benefit plans. A one-percentage-point change in assumed health care cost trend rates would have the following effects on 2017 data:
One Percentage Point
In millions Increase Decrease
Health Care Cost Trend Rate Sensitivity:Effect on Total Interest and Service Cost Components $ 0.1 $ (0.1)Effect on Year-End Postretirement Benefit Obligation $ 1.9 $ (1.6)
Estimated Future Benefit Payments
The following represents the Company’s estimated future pension and postretirement health care benefit payments through the year 2027:
In millions Pension Plans
PostretirementHealth Care
Benefits
2018 $ 67.1 $ 2.42019 69.1 2.42020 71.7 2.72021 74.4 2.72022 76.7 2.92023— 2027 405.2 13.4
Amounts in Accumulated Other Comprehensive Loss Expected to Be Recognized in Net Periodic Benefit Costs in 2018
During 2018, amounts recorded in Accumulated Other Comprehensive Loss expected to be recognized in Net Periodic Benefit Costs are as follows:
In millions Pension Benefits
PostretirementHealth Care
Benefits
Recognition of Prior Service Cost $ 0.4 $ (0.3)Recognition of Actuarial Loss (Gain) 5.6 (1.8)
Multi-Employer Plans
Certain of the Company’s employees participate in multi-employer plans that provide both pension and other postretirement health care benefits to employees under union-employer organization agreements. Expense related to ongoing participation in these plans for the years ended December 31, 2017 and 2016 was $2.3 million and $2.7 million, respectively.
Estimated liabilities have been established related to the partial or complete withdrawal from certain multi-employment benefit plans for facilities which have been closed. At December 31, 2017, and December 31, 2016, the Company has $29.0 millionand $30.4 million, respectively, recorded in Other Noncurrent Liabilities for these withdrawal liabilities which represents the Company's best estimate of the expected withdrawal liability.
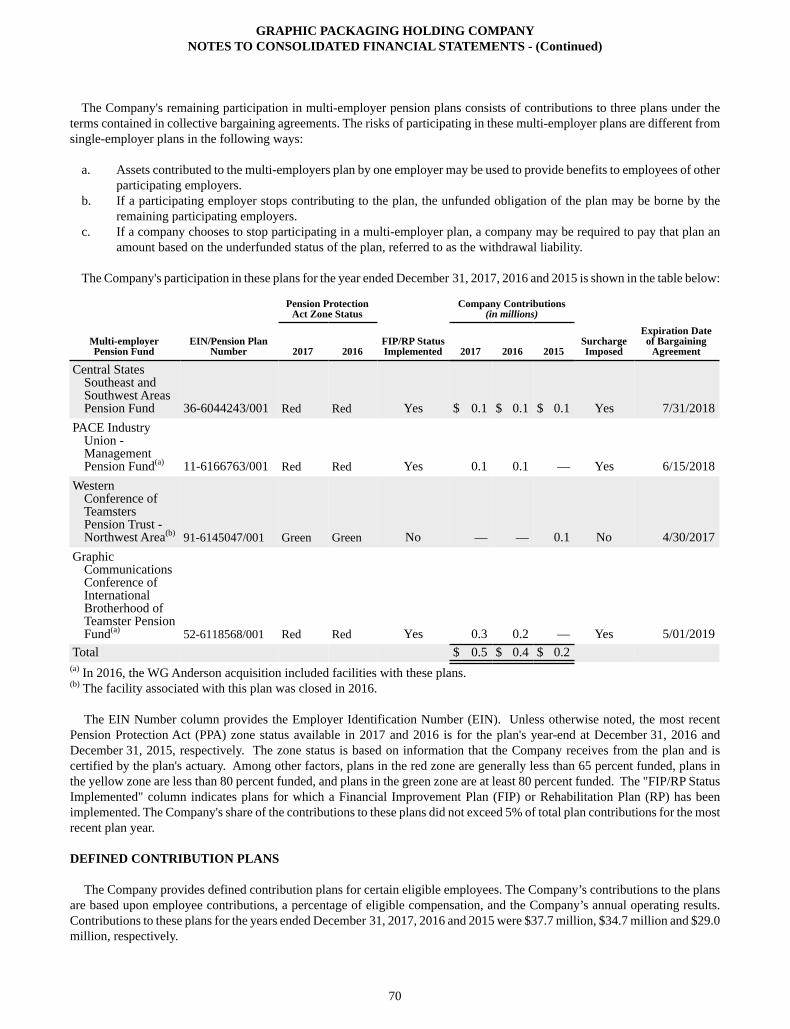
GRAPHIC PACKAGING HOLDING COMPANYNOTES TO CONSOLIDATED FINANCIAL STATEMENTS - (Continued)
70
The Company's remaining participation in multi-employer pension plans consists of contributions to three plans under the terms contained in collective bargaining agreements. The risks of participating in these multi-employer plans are different from single-employer plans in the following ways:
a. Assets contributed to the multi-employers plan by one employer may be used to provide benefits to employees of other participating employers.
b. If a participating employer stops contributing to the plan, the unfunded obligation of the plan may be borne by the remaining participating employers.
c. If a company chooses to stop participating in a multi-employer plan, a company may be required to pay that plan an amount based on the underfunded status of the plan, referred to as the withdrawal liability.
The Company's participation in these plans for the year ended December 31, 2017, 2016 and 2015 is shown in the table below:
Pension ProtectionAct Zone Status
Company Contributions (in millions)
Multi-employerPension Fund
EIN/Pension PlanNumber 2017 2016
FIP/RP StatusImplemented 2017 2016 2015
SurchargeImposed
Expiration Dateof Bargaining
Agreement
Central StatesSoutheast andSouthwest AreasPension Fund 36-6044243/001 Red Red Yes $ 0.1 $ 0.1 $ 0.1 Yes 7/31/2018
PACE Industry Union - Management Pension Fund(a) 11-6166763/001 Red Red Yes 0.1 0.1 — Yes 6/15/2018
Western Conference of Teamsters Pension Trust - Northwest Area(b) 91-6145047/001 Green Green No — — 0.1 No 4/30/2017
Graphic Communications Conference of International Brotherhood of Teamster Pension Fund(a) 52-6118568/001 Red Red Yes 0.3 0.2 — Yes 5/01/2019
Total $ 0.5 $ 0.4 $ 0.2(a) In 2016, the WG Anderson acquisition included facilities with these plans. (b) The facility associated with this plan was closed in 2016.
The EIN Number column provides the Employer Identification Number (EIN). Unless otherwise noted, the most recent Pension Protection Act (PPA) zone status available in 2017 and 2016 is for the plan's year-end at December 31, 2016 and December 31, 2015, respectively. The zone status is based on information that the Company receives from the plan and is certified by the plan's actuary. Among other factors, plans in the red zone are generally less than 65 percent funded, plans in the yellow zone are less than 80 percent funded, and plans in the green zone are at least 80 percent funded. The "FIP/RP Status Implemented" column indicates plans for which a Financial Improvement Plan (FIP) or Rehabilitation Plan (RP) has been implemented. The Company's share of the contributions to these plans did not exceed 5% of total plan contributions for the most recent plan year.
DEFINED CONTRIBUTION PLANS
The Company provides defined contribution plans for certain eligible employees. The Company’s contributions to the plans are based upon employee contributions, a percentage of eligible compensation, and the Company’s annual operating results. Contributions to these plans for the years ended December 31, 2017, 2016 and 2015 were $37.7 million, $34.7 million and $29.0 million, respectively.
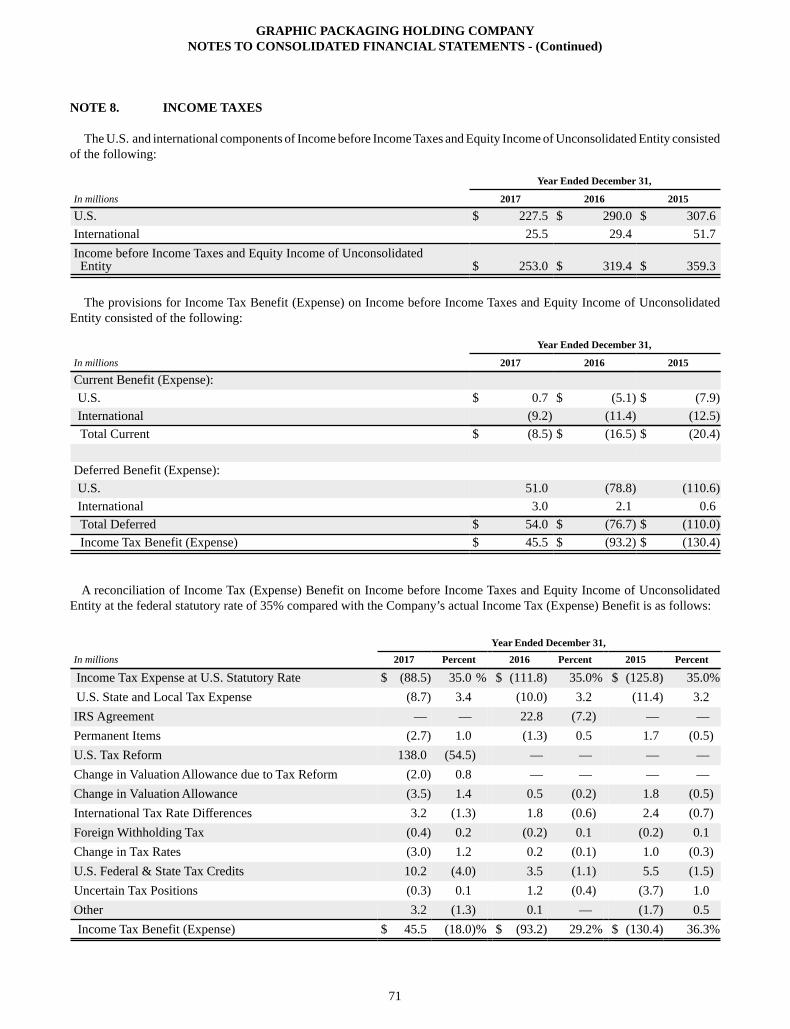
GRAPHIC PACKAGING HOLDING COMPANYNOTES TO CONSOLIDATED FINANCIAL STATEMENTS - (Continued)
71
NOTE 8. INCOME TAXES
The U.S. and international components of Income before Income Taxes and Equity Income of Unconsolidated Entity consisted of the following:
Year Ended December 31,
In millions 2017 2016 2015
U.S. $ 227.5 $ 290.0 $ 307.6International 25.5 29.4 51.7Income before Income Taxes and Equity Income of UnconsolidatedEntity $ 253.0 $ 319.4 $ 359.3
The provisions for Income Tax Benefit (Expense) on Income before Income Taxes and Equity Income of Unconsolidated Entity consisted of the following:
Year Ended December 31,
In millions 2017 2016 2015
Current Benefit (Expense):U.S. $ 0.7 $ (5.1) $ (7.9)International (9.2) (11.4) (12.5)Total Current $ (8.5) $ (16.5) $ (20.4)
Deferred Benefit (Expense):U.S. 51.0 (78.8) (110.6)International 3.0 2.1 0.6Total Deferred $ 54.0 $ (76.7) $ (110.0)Income Tax Benefit (Expense) $ 45.5 $ (93.2) $ (130.4)
A reconciliation of Income Tax (Expense) Benefit on Income before Income Taxes and Equity Income of Unconsolidated Entity at the federal statutory rate of 35% compared with the Company’s actual Income Tax (Expense) Benefit is as follows:
Year Ended December 31,In millions 2017 Percent 2016 Percent 2015 Percent
Income Tax Expense at U.S. Statutory Rate $ (88.5) 35.0 % $ (111.8) 35.0% $ (125.8) 35.0%U.S. State and Local Tax Expense (8.7) 3.4 (10.0) 3.2 (11.4) 3.2IRS Agreement — — 22.8 (7.2) — —Permanent Items (2.7) 1.0 (1.3) 0.5 1.7 (0.5)U.S. Tax Reform 138.0 (54.5) — — — —Change in Valuation Allowance due to Tax Reform (2.0) 0.8 — — — —Change in Valuation Allowance (3.5) 1.4 0.5 (0.2) 1.8 (0.5)International Tax Rate Differences 3.2 (1.3) 1.8 (0.6) 2.4 (0.7)Foreign Withholding Tax (0.4) 0.2 (0.2) 0.1 (0.2) 0.1Change in Tax Rates (3.0) 1.2 0.2 (0.1) 1.0 (0.3)U.S. Federal & State Tax Credits 10.2 (4.0) 3.5 (1.1) 5.5 (1.5)Uncertain Tax Positions (0.3) 0.1 1.2 (0.4) (3.7) 1.0Other 3.2 (1.3) 0.1 — (1.7) 0.5Income Tax Benefit (Expense) $ 45.5 (18.0)% $ (93.2) 29.2% $ (130.4) 36.3%
GRAPHIC PACKAGING HOLDING COMPANYNOTES TO CONSOLIDATED FINANCIAL STATEMENTS - (Continued)
72
U.S. Tax Reform
The Tax Cuts and Jobs Act (the "Act") was enacted on December 22, 2017. The Act reduces the U.S. federal corporate tax rate from 35% to 21%, requires companies to record/pay a one-time transition tax on earnings of certain foreign subsidiaries that were previously tax deferred and creates new taxes on certain foreign sourced earnings. At December 31, 2017, the Company has not completed its accounting for the tax effects of enactment of the Act; however, in certain cases, as described below, the Company has made a reasonable estimate of the effects on its existing deferred tax balances and the one-time transition tax. The Company recognized a provisional net tax benefit of $136.0 million, which is included as a component of income tax expense from continuing operations.
Provisional Amounts
Deferred tax assets and liabilities: The Company remeasured certain deferred tax assets and liabilities based on the federal rate at which they are expected to reverse in the future, which is generally 21%. The Company also remeasured the state rate at which certain deferred tax assets and liabilities are expected to reverse in the future associated with the reduction in the future federal benefit from state deferred tax assets and liabilities from 35% to 21%. However, the Company is still analyzing certain aspects of the Act and refining its calculations, which could potentially affect the measurement of these balances or potentially give rise to new deferred tax amounts. The provisional amount recorded related to the remeasurement of the Company's deferred tax balance was a tax benefit of $156.3 million, including the remeasurement of its federal valuation allowance.
Foreign tax effects: The one-time transition tax is based on the Company's total post-1986 earnings and profits ("E&P") that were previously deferred from U.S. income taxes. The Company recorded a provisional amount for the one-time transition tax liability for all of its foreign subsidiaries resulting in an increase in income tax expense of $20.5 million. The Company has not yet completed its calculation of the total post-1986 E&P for these foreign subsidiaries. Further, the transition tax is based, in part, on the amount of those earnings held in cash and other specified assets. This amount may change when the Company finalizes the calculation of post-1986 foreign E&P previously deferred from U.S. federal taxation and finalize the amounts held in cash or other specified assets.
The Company has not provided for any additional outside basis difference inherent in its foreign subsidiaries, as these amounts continue to be indefinitely reinvested in foreign operations. Determining the amount of unrecognized deferred tax liability related to any additional outside basis difference in these entities is not practicable. In addition, the Company is still evaluating the impact of the one-time transition tax on the outside basis differences and cumulative temporary differences inherent in these subsidiaries as of December 31, 2017 and as a result, it is not practicable to provide the amount of any cumulative temporary differences related to unrecorded differences. The Company has adjusted the existing deferred tax liability it previously recorded associated with the Company's equity investment in the joint venture, Rengo Riverwood Packaging, Ltd. resulting in a provisional income tax benefit of $1.7 million. The remaining deferred tax liability recorded relates to future withholding tax expense attributable to the remaining outside basis difference.
The Company has not yet made a policy election with respect to its treatment of potential global intangible low-taxed income (“GILTI”). Companies can either account for taxes on GILTI as incurred or recognize deferred taxes when basis differences exist that are expected to affect the amount of the GILTI inclusion upon reversal. The Company is still in the process of analyzing the provisions of the Act associated with GILTI and the expected impact of GILTI on the Company in the future.
State tax effects: As noted above, the Company remeasured certain deferred tax assets and liabilities to account for the reduction in the future federal benefit from state deferred tax assets and liabilities. In addition, the Company reassessed its previous determination of the realizability of certain state deferred tax assets based on whether or not the state’s currently enacted legislation adopts the changes made by the Act. As a result of a reduction in projected future taxable income associated with certain state’s adoption of federal tax reform, the Company has increased its valuation allowance against certain state deferred tax assets resulting in expense of $0.9 million.
Other Federal effects: As a result of the Act, the corporate alternative minimum tax ("AMT") was repealed. In addition, taxpayers with AMT credit carryovers in excess of their regular tax liability may have the credits refunded over multiple years from 2018 to 2022. However, AMT transactions, including refunds, are subject to sequestration by the Office of Management Budget. As a result, the Company has reclassed its AMT credit carryforward to a non-current federal income tax receivable and reduced the estimated refund to account for the effects of the sequester. This provisional adjustment resulted in additional tax expense of $0.6 million.
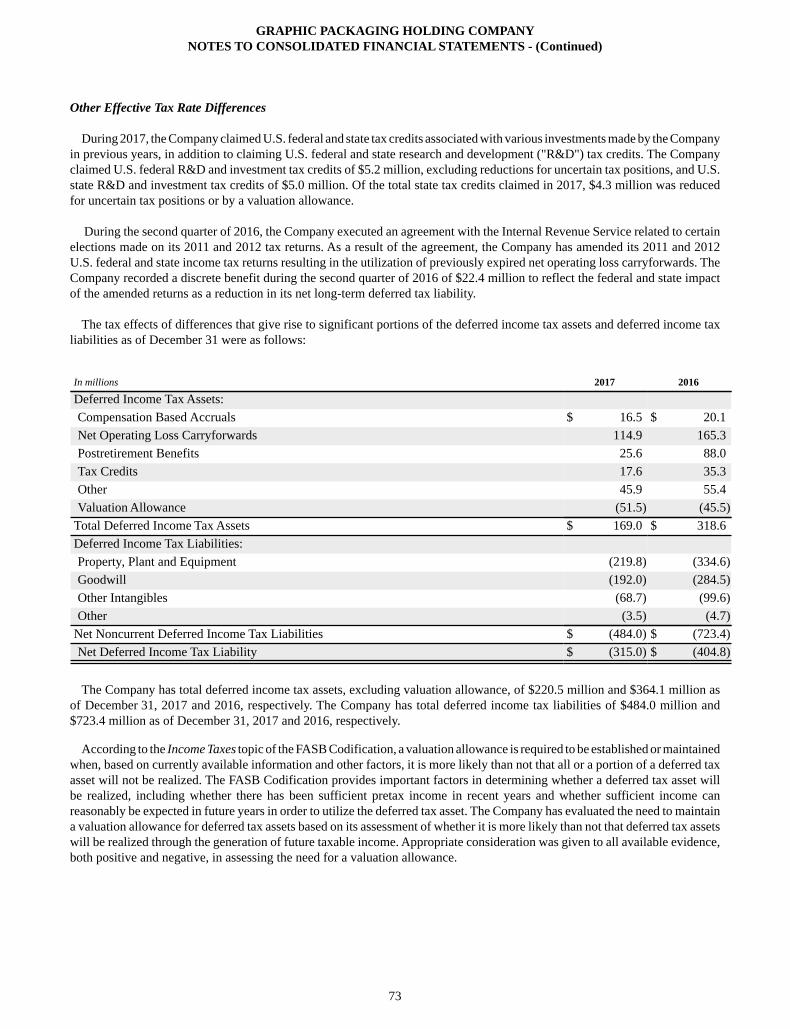
GRAPHIC PACKAGING HOLDING COMPANYNOTES TO CONSOLIDATED FINANCIAL STATEMENTS - (Continued)
73
Other Effective Tax Rate Differences
During 2017, the Company claimed U.S. federal and state tax credits associated with various investments made by the Company in previous years, in addition to claiming U.S. federal and state research and development ("R&D") tax credits. The Company claimed U.S. federal R&D and investment tax credits of $5.2 million, excluding reductions for uncertain tax positions, and U.S. state R&D and investment tax credits of $5.0 million. Of the total state tax credits claimed in 2017, $4.3 million was reduced for uncertain tax positions or by a valuation allowance.
During the second quarter of 2016, the Company executed an agreement with the Internal Revenue Service related to certain elections made on its 2011 and 2012 tax returns. As a result of the agreement, the Company has amended its 2011 and 2012 U.S. federal and state income tax returns resulting in the utilization of previously expired net operating loss carryforwards. The Company recorded a discrete benefit during the second quarter of 2016 of $22.4 million to reflect the federal and state impact of the amended returns as a reduction in its net long-term deferred tax liability.
The tax effects of differences that give rise to significant portions of the deferred income tax assets and deferred income tax liabilities as of December 31 were as follows:
In millions 2017 2016
Deferred Income Tax Assets:Compensation Based Accruals $ 16.5 $ 20.1Net Operating Loss Carryforwards 114.9 165.3Postretirement Benefits 25.6 88.0Tax Credits 17.6 35.3Other 45.9 55.4Valuation Allowance (51.5) (45.5)
Total Deferred Income Tax Assets $ 169.0 $ 318.6Deferred Income Tax Liabilities:Property, Plant and Equipment (219.8) (334.6)Goodwill (192.0) (284.5)Other Intangibles (68.7) (99.6)Other (3.5) (4.7)
Net Noncurrent Deferred Income Tax Liabilities $ (484.0) $ (723.4)Net Deferred Income Tax Liability $ (315.0) $ (404.8)
The Company has total deferred income tax assets, excluding valuation allowance, of $220.5 million and $364.1 million as of December 31, 2017 and 2016, respectively. The Company has total deferred income tax liabilities of $484.0 million and $723.4 million as of December 31, 2017 and 2016, respectively.
According to the Income Taxes topic of the FASB Codification, a valuation allowance is required to be established or maintained when, based on currently available information and other factors, it is more likely than not that all or a portion of a deferred tax asset will not be realized. The FASB Codification provides important factors in determining whether a deferred tax asset will be realized, including whether there has been sufficient pretax income in recent years and whether sufficient income can reasonably be expected in future years in order to utilize the deferred tax asset. The Company has evaluated the need to maintain a valuation allowance for deferred tax assets based on its assessment of whether it is more likely than not that deferred tax assets will be realized through the generation of future taxable income. Appropriate consideration was given to all available evidence, both positive and negative, in assessing the need for a valuation allowance.
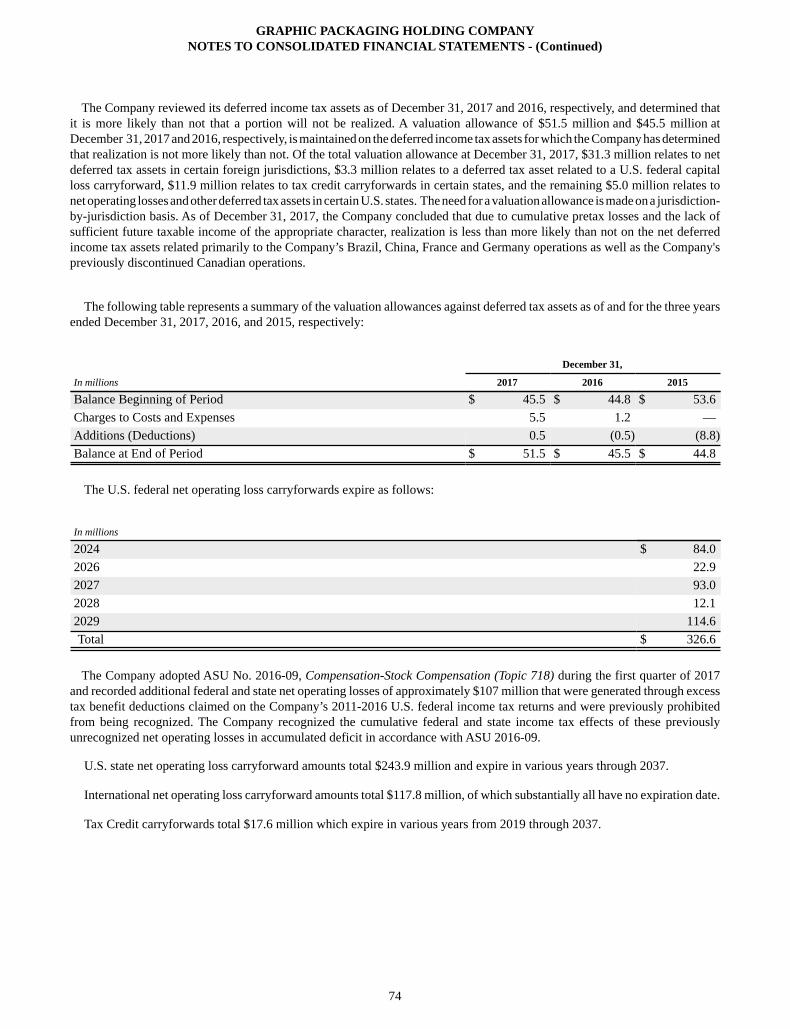
GRAPHIC PACKAGING HOLDING COMPANYNOTES TO CONSOLIDATED FINANCIAL STATEMENTS - (Continued)
74
The Company reviewed its deferred income tax assets as of December 31, 2017 and 2016, respectively, and determined that it is more likely than not that a portion will not be realized. A valuation allowance of $51.5 million and $45.5 million at December 31, 2017 and 2016, respectively, is maintained on the deferred income tax assets for which the Company has determined that realization is not more likely than not. Of the total valuation allowance at December 31, 2017, $31.3 million relates to net deferred tax assets in certain foreign jurisdictions, $3.3 million relates to a deferred tax asset related to a U.S. federal capital loss carryforward, $11.9 million relates to tax credit carryforwards in certain states, and the remaining $5.0 million relates to net operating losses and other deferred tax assets in certain U.S. states. The need for a valuation allowance is made on a jurisdiction-by-jurisdiction basis. As of December 31, 2017, the Company concluded that due to cumulative pretax losses and the lack of sufficient future taxable income of the appropriate character, realization is less than more likely than not on the net deferred income tax assets related primarily to the Company’s Brazil, China, France and Germany operations as well as the Company's previously discontinued Canadian operations.
The following table represents a summary of the valuation allowances against deferred tax assets as of and for the three years ended December 31, 2017, 2016, and 2015, respectively:
December 31,
In millions 2017 2016 2015
Balance Beginning of Period $ 45.5 $ 44.8 $ 53.6Charges to Costs and Expenses 5.5 1.2 —Additions (Deductions) 0.5 (0.5) (8.8)Balance at End of Period $ 51.5 $ 45.5 $ 44.8
The U.S. federal net operating loss carryforwards expire as follows:
In millions
2024 $ 84.02026 22.92027 93.02028 12.12029 114.6Total $ 326.6
The Company adopted ASU No. 2016-09, Compensation-Stock Compensation (Topic 718) during the first quarter of 2017 and recorded additional federal and state net operating losses of approximately $107 million that were generated through excess tax benefit deductions claimed on the Company’s 2011-2016 U.S. federal income tax returns and were previously prohibited from being recognized. The Company recognized the cumulative federal and state income tax effects of these previously unrecognized net operating losses in accumulated deficit in accordance with ASU 2016-09.
U.S. state net operating loss carryforward amounts total $243.9 million and expire in various years through 2037.
International net operating loss carryforward amounts total $117.8 million, of which substantially all have no expiration date.
Tax Credit carryforwards total $17.6 million which expire in various years from 2019 through 2037.
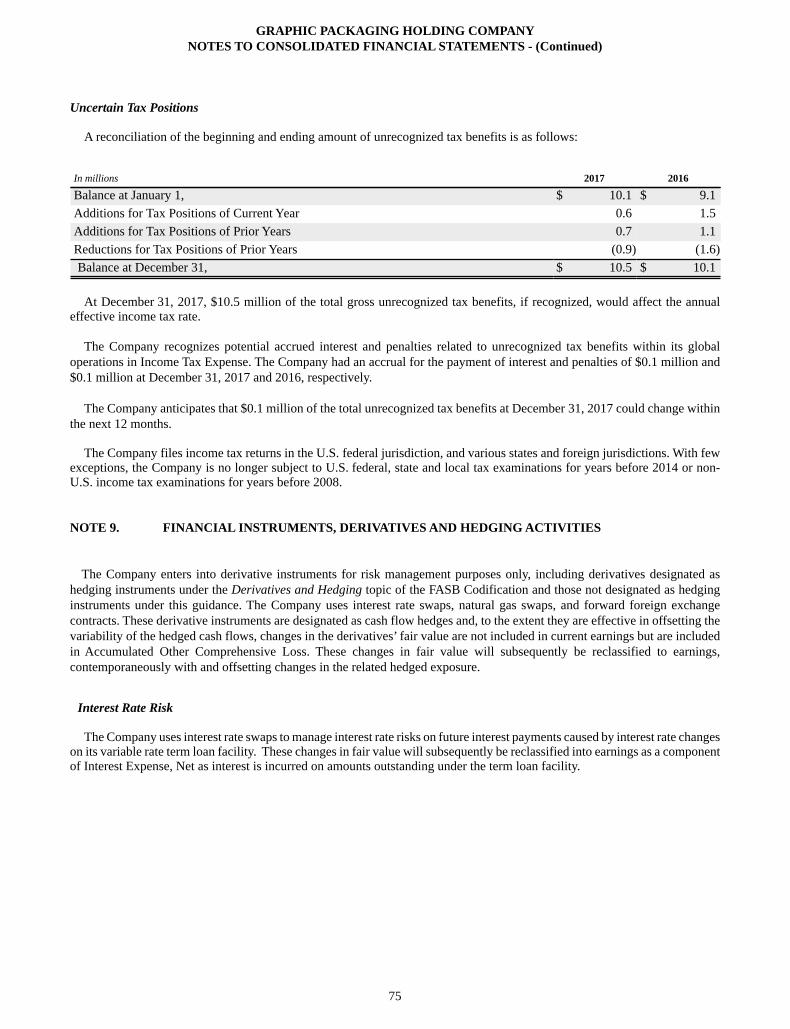
GRAPHIC PACKAGING HOLDING COMPANYNOTES TO CONSOLIDATED FINANCIAL STATEMENTS - (Continued)
75
Uncertain Tax Positions
A reconciliation of the beginning and ending amount of unrecognized tax benefits is as follows:
In millions 2017 2016
Balance at January 1, $ 10.1 $ 9.1Additions for Tax Positions of Current Year 0.6 1.5Additions for Tax Positions of Prior Years 0.7 1.1Reductions for Tax Positions of Prior Years (0.9) (1.6)Balance at December 31, $ 10.5 $ 10.1
At December 31, 2017, $10.5 million of the total gross unrecognized tax benefits, if recognized, would affect the annual effective income tax rate.
The Company recognizes potential accrued interest and penalties related to unrecognized tax benefits within its global operations in Income Tax Expense. The Company had an accrual for the payment of interest and penalties of $0.1 million and $0.1 million at December 31, 2017 and 2016, respectively.
The Company anticipates that $0.1 million of the total unrecognized tax benefits at December 31, 2017 could change within the next 12 months.
The Company files income tax returns in the U.S. federal jurisdiction, and various states and foreign jurisdictions. With few exceptions, the Company is no longer subject to U.S. federal, state and local tax examinations for years before 2014 or non-U.S. income tax examinations for years before 2008.
NOTE 9. FINANCIAL INSTRUMENTS, DERIVATIVES AND HEDGING ACTIVITIES
The Company enters into derivative instruments for risk management purposes only, including derivatives designated as hedging instruments under the Derivatives and Hedging topic of the FASB Codification and those not designated as hedging instruments under this guidance. The Company uses interest rate swaps, natural gas swaps, and forward foreign exchange contracts. These derivative instruments are designated as cash flow hedges and, to the extent they are effective in offsetting the variability of the hedged cash flows, changes in the derivatives’ fair value are not included in current earnings but are included in Accumulated Other Comprehensive Loss. These changes in fair value will subsequently be reclassified to earnings, contemporaneously with and offsetting changes in the related hedged exposure.
Interest Rate Risk
The Company uses interest rate swaps to manage interest rate risks on future interest payments caused by interest rate changes on its variable rate term loan facility. These changes in fair value will subsequently be reclassified into earnings as a component of Interest Expense, Net as interest is incurred on amounts outstanding under the term loan facility.
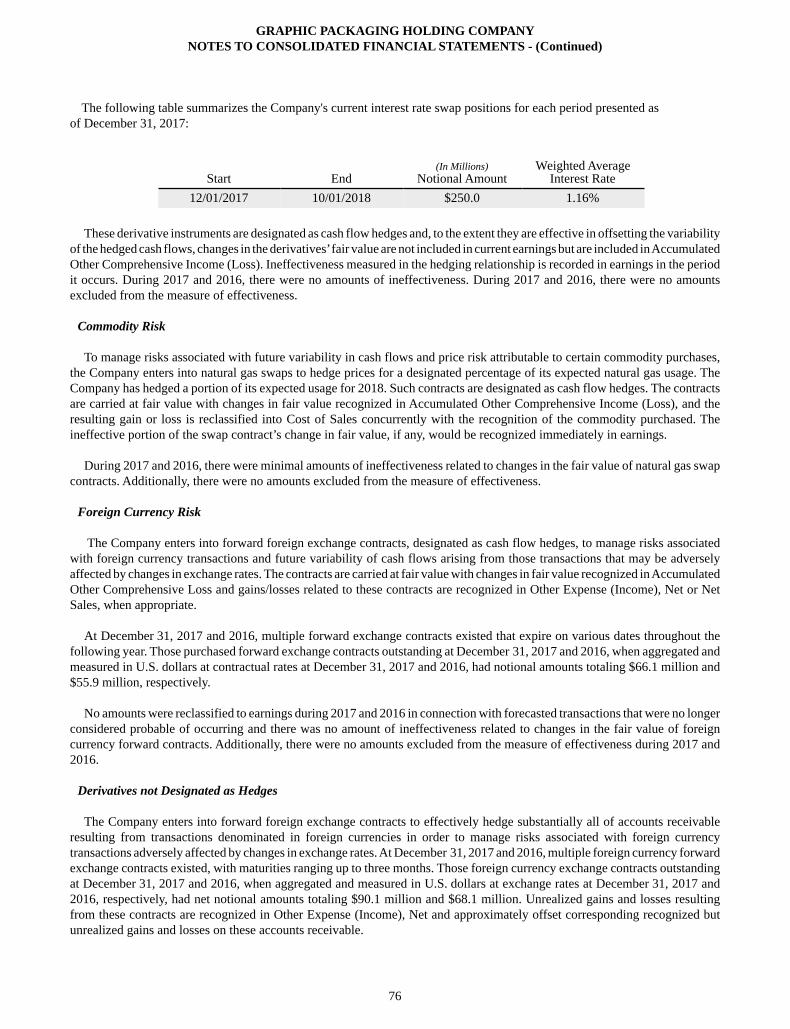
GRAPHIC PACKAGING HOLDING COMPANYNOTES TO CONSOLIDATED FINANCIAL STATEMENTS - (Continued)
76
The following table summarizes the Company's current interest rate swap positions for each period presented as of December 31, 2017:
Start End(In Millions)
Notional Amount Weighted Average
Interest Rate12/01/2017 10/01/2018 $250.0 1.16%
These derivative instruments are designated as cash flow hedges and, to the extent they are effective in offsetting the variability of the hedged cash flows, changes in the derivatives’ fair value are not included in current earnings but are included in Accumulated Other Comprehensive Income (Loss). Ineffectiveness measured in the hedging relationship is recorded in earnings in the period it occurs. During 2017 and 2016, there were no amounts of ineffectiveness. During 2017 and 2016, there were no amounts excluded from the measure of effectiveness.
Commodity Risk
To manage risks associated with future variability in cash flows and price risk attributable to certain commodity purchases, the Company enters into natural gas swaps to hedge prices for a designated percentage of its expected natural gas usage. The Company has hedged a portion of its expected usage for 2018. Such contracts are designated as cash flow hedges. The contracts are carried at fair value with changes in fair value recognized in Accumulated Other Comprehensive Income (Loss), and the resulting gain or loss is reclassified into Cost of Sales concurrently with the recognition of the commodity purchased. The ineffective portion of the swap contract’s change in fair value, if any, would be recognized immediately in earnings.
During 2017 and 2016, there were minimal amounts of ineffectiveness related to changes in the fair value of natural gas swap contracts. Additionally, there were no amounts excluded from the measure of effectiveness.
Foreign Currency Risk
The Company enters into forward foreign exchange contracts, designated as cash flow hedges, to manage risks associated with foreign currency transactions and future variability of cash flows arising from those transactions that may be adversely affected by changes in exchange rates. The contracts are carried at fair value with changes in fair value recognized in Accumulated Other Comprehensive Loss and gains/losses related to these contracts are recognized in Other Expense (Income), Net or Net Sales, when appropriate.
At December 31, 2017 and 2016, multiple forward exchange contracts existed that expire on various dates throughout the following year. Those purchased forward exchange contracts outstanding at December 31, 2017 and 2016, when aggregated and measured in U.S. dollars at contractual rates at December 31, 2017 and 2016, had notional amounts totaling $66.1 million and $55.9 million, respectively.
No amounts were reclassified to earnings during 2017 and 2016 in connection with forecasted transactions that were no longer considered probable of occurring and there was no amount of ineffectiveness related to changes in the fair value of foreign currency forward contracts. Additionally, there were no amounts excluded from the measure of effectiveness during 2017 and 2016.
Derivatives not Designated as Hedges
The Company enters into forward foreign exchange contracts to effectively hedge substantially all of accounts receivable resulting from transactions denominated in foreign currencies in order to manage risks associated with foreign currency transactions adversely affected by changes in exchange rates. At December 31, 2017 and 2016, multiple foreign currency forward exchange contracts existed, with maturities ranging up to three months. Those foreign currency exchange contracts outstanding at December 31, 2017 and 2016, when aggregated and measured in U.S. dollars at exchange rates at December 31, 2017 and 2016, respectively, had net notional amounts totaling $90.1 million and $68.1 million. Unrealized gains and losses resulting from these contracts are recognized in Other Expense (Income), Net and approximately offset corresponding recognized but unrealized gains and losses on these accounts receivable.
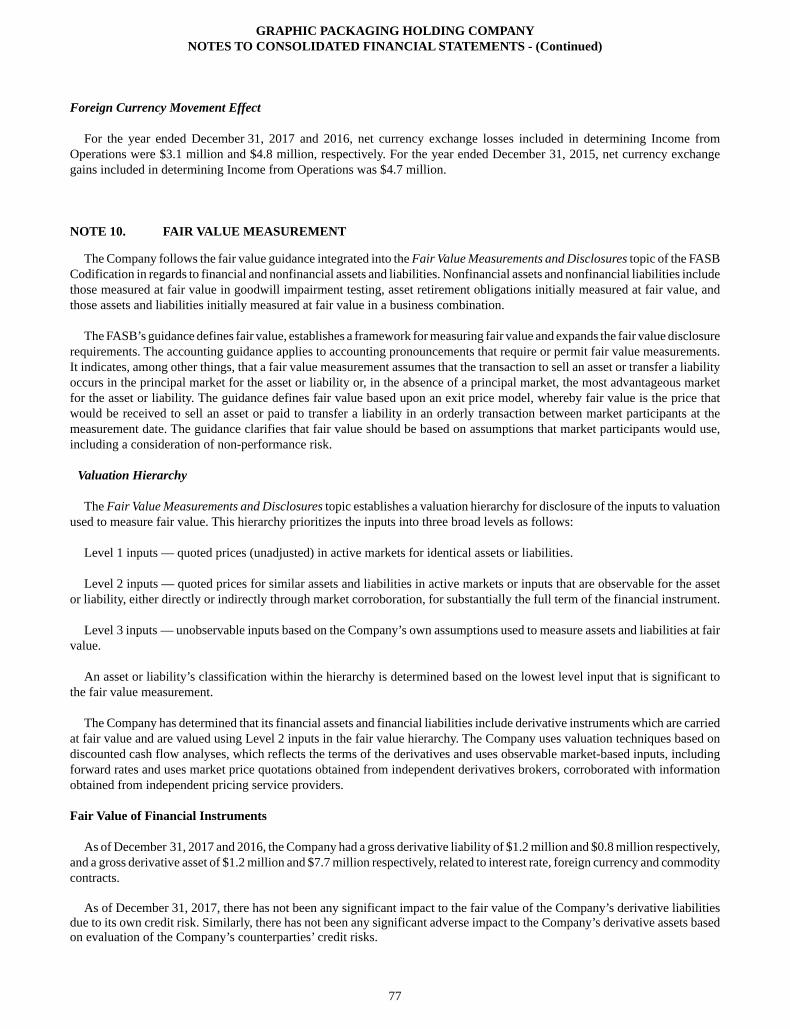
GRAPHIC PACKAGING HOLDING COMPANYNOTES TO CONSOLIDATED FINANCIAL STATEMENTS - (Continued)
77
Foreign Currency Movement Effect
For the year ended December 31, 2017 and 2016, net currency exchange losses included in determining Income from Operations were $3.1 million and $4.8 million, respectively. For the year ended December 31, 2015, net currency exchange gains included in determining Income from Operations was $4.7 million.
NOTE 10. FAIR VALUE MEASUREMENT
The Company follows the fair value guidance integrated into the Fair Value Measurements and Disclosures topic of the FASB Codification in regards to financial and nonfinancial assets and liabilities. Nonfinancial assets and nonfinancial liabilities include those measured at fair value in goodwill impairment testing, asset retirement obligations initially measured at fair value, and those assets and liabilities initially measured at fair value in a business combination.
The FASB’s guidance defines fair value, establishes a framework for measuring fair value and expands the fair value disclosure requirements. The accounting guidance applies to accounting pronouncements that require or permit fair value measurements. It indicates, among other things, that a fair value measurement assumes that the transaction to sell an asset or transfer a liability occurs in the principal market for the asset or liability or, in the absence of a principal market, the most advantageous market for the asset or liability. The guidance defines fair value based upon an exit price model, whereby fair value is the price that would be received to sell an asset or paid to transfer a liability in an orderly transaction between market participants at the measurement date. The guidance clarifies that fair value should be based on assumptions that market participants would use, including a consideration of non-performance risk.
Valuation Hierarchy
The Fair Value Measurements and Disclosures topic establishes a valuation hierarchy for disclosure of the inputs to valuation used to measure fair value. This hierarchy prioritizes the inputs into three broad levels as follows:
Level 1 inputs — quoted prices (unadjusted) in active markets for identical assets or liabilities.
Level 2 inputs — quoted prices for similar assets and liabilities in active markets or inputs that are observable for the asset or liability, either directly or indirectly through market corroboration, for substantially the full term of the financial instrument.
Level 3 inputs — unobservable inputs based on the Company’s own assumptions used to measure assets and liabilities at fair value.
An asset or liability’s classification within the hierarchy is determined based on the lowest level input that is significant to the fair value measurement.
The Company has determined that its financial assets and financial liabilities include derivative instruments which are carried at fair value and are valued using Level 2 inputs in the fair value hierarchy. The Company uses valuation techniques based on discounted cash flow analyses, which reflects the terms of the derivatives and uses observable market-based inputs, including forward rates and uses market price quotations obtained from independent derivatives brokers, corroborated with information obtained from independent pricing service providers.
Fair Value of Financial Instruments
As of December 31, 2017 and 2016, the Company had a gross derivative liability of $1.2 million and $0.8 million respectively, and a gross derivative asset of $1.2 million and $7.7 million respectively, related to interest rate, foreign currency and commodity contracts.
As of December 31, 2017, there has not been any significant impact to the fair value of the Company’s derivative liabilities due to its own credit risk. Similarly, there has not been any significant adverse impact to the Company’s derivative assets based on evaluation of the Company’s counterparties’ credit risks.
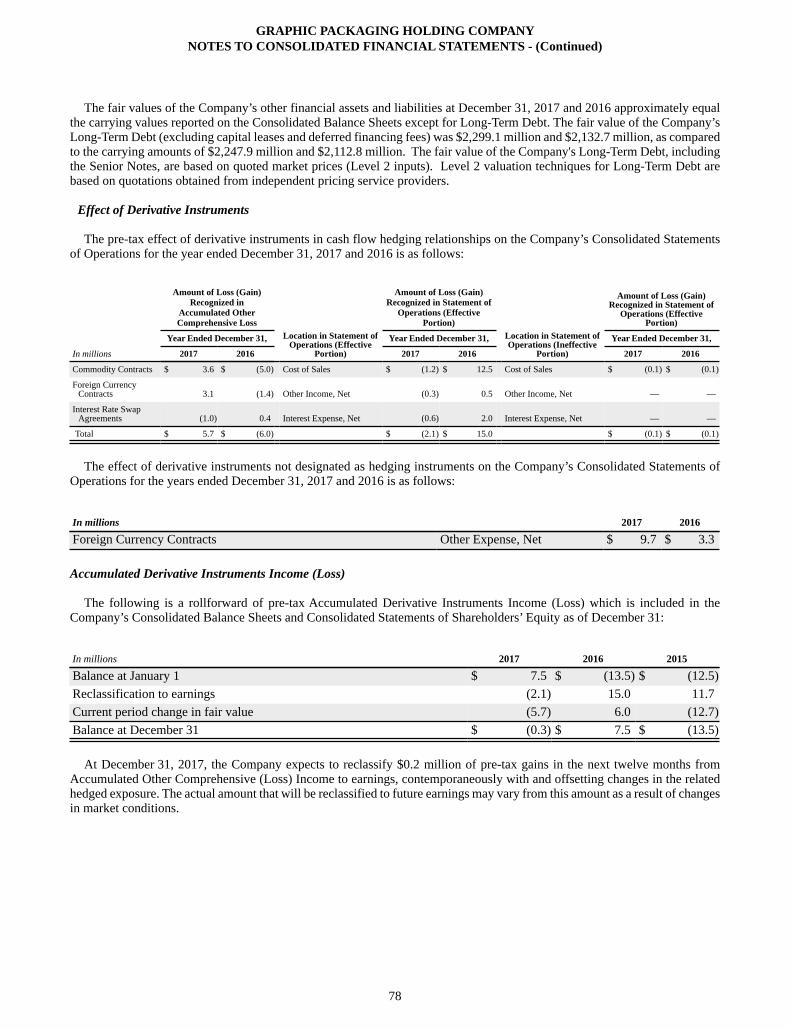
GRAPHIC PACKAGING HOLDING COMPANYNOTES TO CONSOLIDATED FINANCIAL STATEMENTS - (Continued)
78
The fair values of the Company’s other financial assets and liabilities at December 31, 2017 and 2016 approximately equal the carrying values reported on the Consolidated Balance Sheets except for Long-Term Debt. The fair value of the Company’s Long-Term Debt (excluding capital leases and deferred financing fees) was $2,299.1 million and $2,132.7 million, as compared to the carrying amounts of $2,247.9 million and $2,112.8 million. The fair value of the Company's Long-Term Debt, including the Senior Notes, are based on quoted market prices (Level 2 inputs). Level 2 valuation techniques for Long-Term Debt are based on quotations obtained from independent pricing service providers.
Effect of Derivative Instruments
The pre-tax effect of derivative instruments in cash flow hedging relationships on the Company’s Consolidated Statements of Operations for the year ended December 31, 2017 and 2016 is as follows:
Amount of Loss (Gain)Recognized in
Accumulated OtherComprehensive Loss
Location in Statement ofOperations (Effective
Portion)
Amount of Loss (Gain)Recognized in Statement of
Operations (EffectivePortion)
Location in Statement ofOperations (Ineffective
Portion)
Amount of Loss (Gain)Recognized in Statement of
Operations (EffectivePortion)
Year Ended December 31, Year Ended December 31, Year Ended December 31,
In millions 2017 2016 2017 2016 2017 2016
Commodity Contracts $ 3.6 $ (5.0) Cost of Sales $ (1.2) $ 12.5 Cost of Sales $ (0.1) $ (0.1)
Foreign CurrencyContracts 3.1 (1.4) Other Income, Net (0.3) 0.5 Other Income, Net — —
Interest Rate SwapAgreements (1.0) 0.4 Interest Expense, Net (0.6) 2.0 Interest Expense, Net — —
Total $ 5.7 $ (6.0) $ (2.1) $ 15.0 $ (0.1) $ (0.1)
The effect of derivative instruments not designated as hedging instruments on the Company’s Consolidated Statements of Operations for the years ended December 31, 2017 and 2016 is as follows:
In millions 2017 2016
Foreign Currency Contracts Other Expense, Net $ 9.7 $ 3.3
Accumulated Derivative Instruments Income (Loss)
The following is a rollforward of pre-tax Accumulated Derivative Instruments Income (Loss) which is included in the Company’s Consolidated Balance Sheets and Consolidated Statements of Shareholders’ Equity as of December 31:
In millions 2017 2016 2015
Balance at January 1 $ 7.5 $ (13.5) $ (12.5)Reclassification to earnings (2.1) 15.0 11.7Current period change in fair value (5.7) 6.0 (12.7)Balance at December 31 $ (0.3) $ 7.5 $ (13.5)
At December 31, 2017, the Company expects to reclassify $0.2 million of pre-tax gains in the next twelve months from Accumulated Other Comprehensive (Loss) Income to earnings, contemporaneously with and offsetting changes in the related hedged exposure. The actual amount that will be reclassified to future earnings may vary from this amount as a result of changes in market conditions.
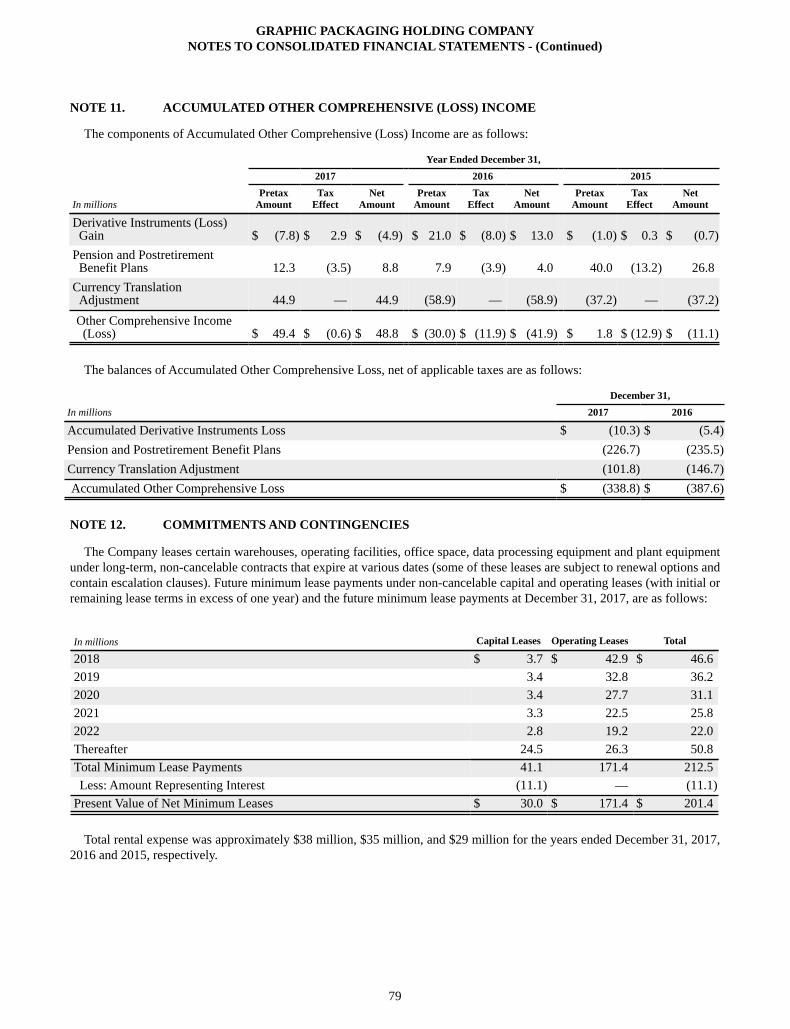
GRAPHIC PACKAGING HOLDING COMPANYNOTES TO CONSOLIDATED FINANCIAL STATEMENTS - (Continued)
79
NOTE 11. ACCUMULATED OTHER COMPREHENSIVE (LOSS) INCOME
The components of Accumulated Other Comprehensive (Loss) Income are as follows:
Year Ended December 31,2017 2016 2015
In millions
PretaxAmount
TaxEffect
NetAmount
PretaxAmount
TaxEffect
NetAmount
PretaxAmount
TaxEffect
NetAmount
Derivative Instruments (Loss)Gain $ (7.8) $ 2.9 $ (4.9) $ 21.0 $ (8.0) $ 13.0 $ (1.0) $ 0.3 $ (0.7)
Pension and PostretirementBenefit Plans 12.3 (3.5) 8.8 7.9 (3.9) 4.0 40.0 (13.2) 26.8
Currency TranslationAdjustment 44.9 — 44.9 (58.9) — (58.9) (37.2) — (37.2)Other Comprehensive Income(Loss) $ 49.4 $ (0.6) $ 48.8 $ (30.0) $ (11.9) $ (41.9) $ 1.8 $ (12.9) $ (11.1)
The balances of Accumulated Other Comprehensive Loss, net of applicable taxes are as follows:
December 31,In millions 2017 2016
Accumulated Derivative Instruments Loss $ (10.3) $ (5.4)Pension and Postretirement Benefit Plans (226.7) (235.5)Currency Translation Adjustment (101.8) (146.7)Accumulated Other Comprehensive Loss $ (338.8) $ (387.6)
NOTE 12. COMMITMENTS AND CONTINGENCIES
The Company leases certain warehouses, operating facilities, office space, data processing equipment and plant equipment under long-term, non-cancelable contracts that expire at various dates (some of these leases are subject to renewal options and contain escalation clauses). Future minimum lease payments under non-cancelable capital and operating leases (with initial or remaining lease terms in excess of one year) and the future minimum lease payments at December 31, 2017, are as follows:
In millions Capital Leases Operating Leases Total
2018 $ 3.7 $ 42.9 $ 46.62019 3.4 32.8 36.22020 3.4 27.7 31.12021 3.3 22.5 25.82022 2.8 19.2 22.0Thereafter 24.5 26.3 50.8Total Minimum Lease Payments 41.1 171.4 212.5Less: Amount Representing Interest (11.1) — (11.1)
Present Value of Net Minimum Leases $ 30.0 $ 171.4 $ 201.4
Total rental expense was approximately $38 million, $35 million, and $29 million for the years ended December 31, 2017, 2016 and 2015, respectively.
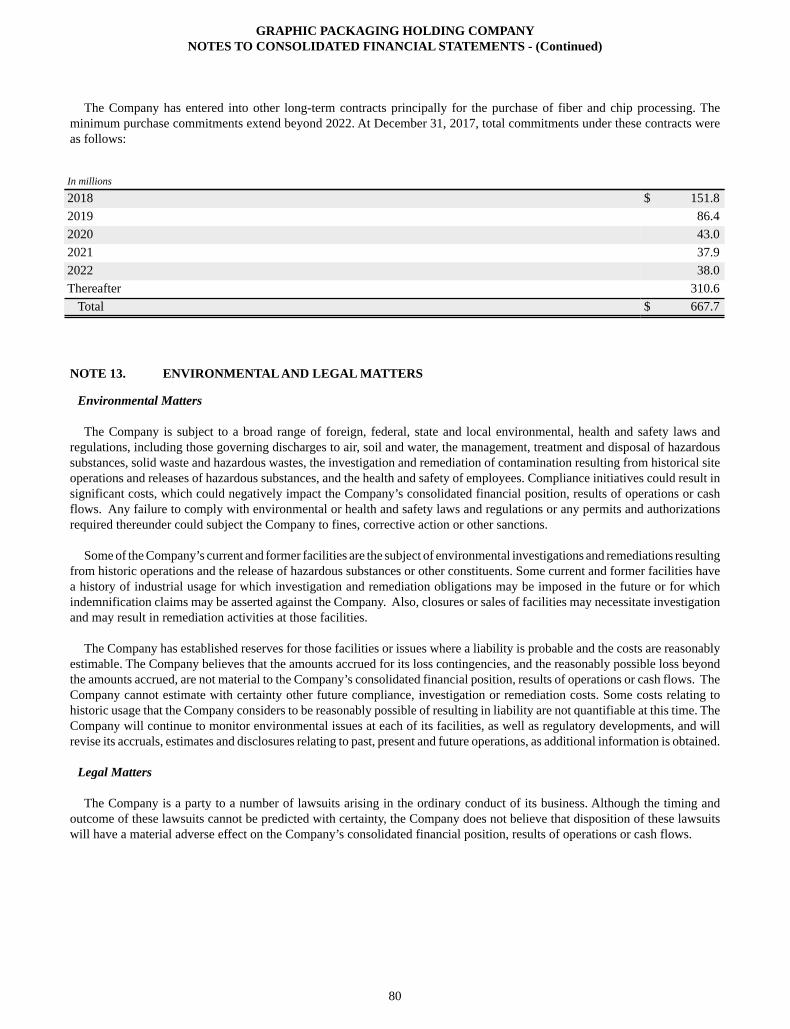
GRAPHIC PACKAGING HOLDING COMPANYNOTES TO CONSOLIDATED FINANCIAL STATEMENTS - (Continued)
80
The Company has entered into other long-term contracts principally for the purchase of fiber and chip processing. The minimum purchase commitments extend beyond 2022. At December 31, 2017, total commitments under these contracts were as follows:
In millions
2018 $ 151.82019 86.42020 43.02021 37.92022 38.0Thereafter 310.6
Total $ 667.7
NOTE 13. ENVIRONMENTAL AND LEGAL MATTERS
Environmental Matters
The Company is subject to a broad range of foreign, federal, state and local environmental, health and safety laws and regulations, including those governing discharges to air, soil and water, the management, treatment and disposal of hazardous substances, solid waste and hazardous wastes, the investigation and remediation of contamination resulting from historical site operations and releases of hazardous substances, and the health and safety of employees. Compliance initiatives could result in significant costs, which could negatively impact the Company’s consolidated financial position, results of operations or cash flows. Any failure to comply with environmental or health and safety laws and regulations or any permits and authorizations required thereunder could subject the Company to fines, corrective action or other sanctions.
Some of the Company’s current and former facilities are the subject of environmental investigations and remediations resulting from historic operations and the release of hazardous substances or other constituents. Some current and former facilities have a history of industrial usage for which investigation and remediation obligations may be imposed in the future or for which indemnification claims may be asserted against the Company. Also, closures or sales of facilities may necessitate investigation and may result in remediation activities at those facilities.
The Company has established reserves for those facilities or issues where a liability is probable and the costs are reasonably estimable. The Company believes that the amounts accrued for its loss contingencies, and the reasonably possible loss beyond the amounts accrued, are not material to the Company’s consolidated financial position, results of operations or cash flows. The Company cannot estimate with certainty other future compliance, investigation or remediation costs. Some costs relating to historic usage that the Company considers to be reasonably possible of resulting in liability are not quantifiable at this time. The Company will continue to monitor environmental issues at each of its facilities, as well as regulatory developments, and will revise its accruals, estimates and disclosures relating to past, present and future operations, as additional information is obtained.
Legal Matters
The Company is a party to a number of lawsuits arising in the ordinary conduct of its business. Although the timing and outcome of these lawsuits cannot be predicted with certainty, the Company does not believe that disposition of these lawsuits will have a material adverse effect on the Company’s consolidated financial position, results of operations or cash flows.
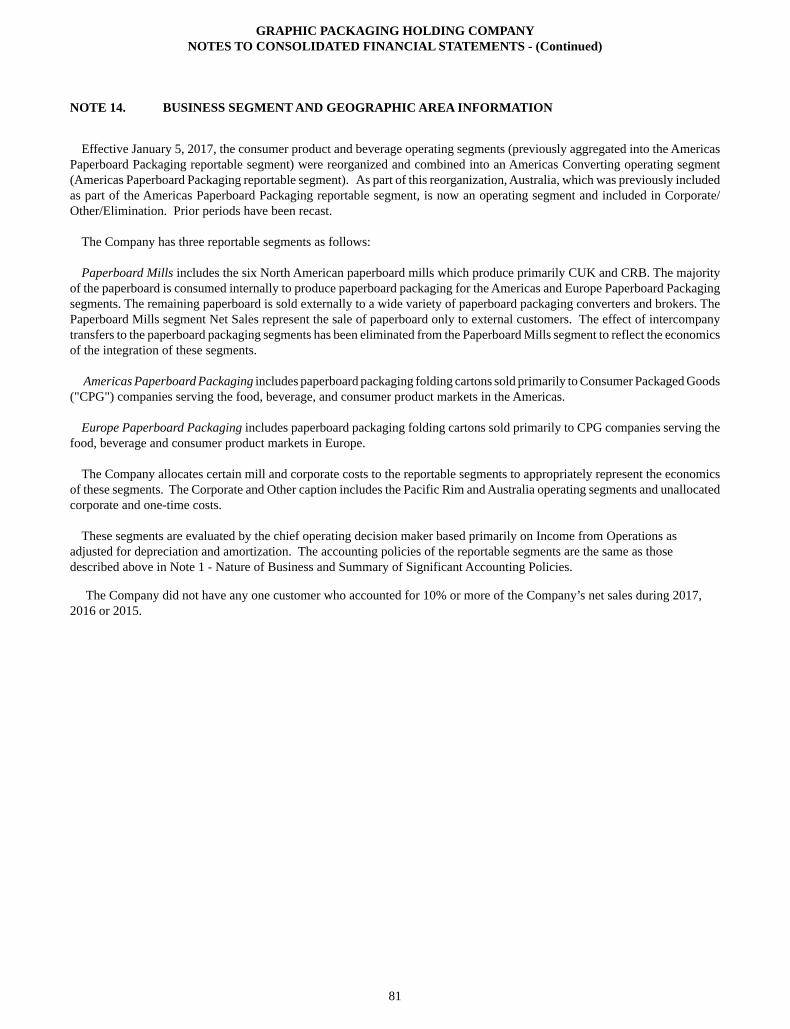
GRAPHIC PACKAGING HOLDING COMPANYNOTES TO CONSOLIDATED FINANCIAL STATEMENTS - (Continued)
81
NOTE 14. BUSINESS SEGMENT AND GEOGRAPHIC AREA INFORMATION
Effective January 5, 2017, the consumer product and beverage operating segments (previously aggregated into the Americas Paperboard Packaging reportable segment) were reorganized and combined into an Americas Converting operating segment (Americas Paperboard Packaging reportable segment). As part of this reorganization, Australia, which was previously included as part of the Americas Paperboard Packaging reportable segment, is now an operating segment and included in Corporate/Other/Elimination. Prior periods have been recast.
The Company has three reportable segments as follows:
Paperboard Mills includes the six North American paperboard mills which produce primarily CUK and CRB. The majority of the paperboard is consumed internally to produce paperboard packaging for the Americas and Europe Paperboard Packaging segments. The remaining paperboard is sold externally to a wide variety of paperboard packaging converters and brokers. The Paperboard Mills segment Net Sales represent the sale of paperboard only to external customers. The effect of intercompany transfers to the paperboard packaging segments has been eliminated from the Paperboard Mills segment to reflect the economics of the integration of these segments.
Americas Paperboard Packaging includes paperboard packaging folding cartons sold primarily to Consumer Packaged Goods
("CPG") companies serving the food, beverage, and consumer product markets in the Americas.
Europe Paperboard Packaging includes paperboard packaging folding cartons sold primarily to CPG companies serving the food, beverage and consumer product markets in Europe.
The Company allocates certain mill and corporate costs to the reportable segments to appropriately represent the economics
of these segments. The Corporate and Other caption includes the Pacific Rim and Australia operating segments and unallocated corporate and one-time costs.
These segments are evaluated by the chief operating decision maker based primarily on Income from Operations as adjusted for depreciation and amortization. The accounting policies of the reportable segments are the same as those described above in Note 1 - Nature of Business and Summary of Significant Accounting Policies.
The Company did not have any one customer who accounted for 10% or more of the Company’s net sales during 2017, 2016 or 2015.
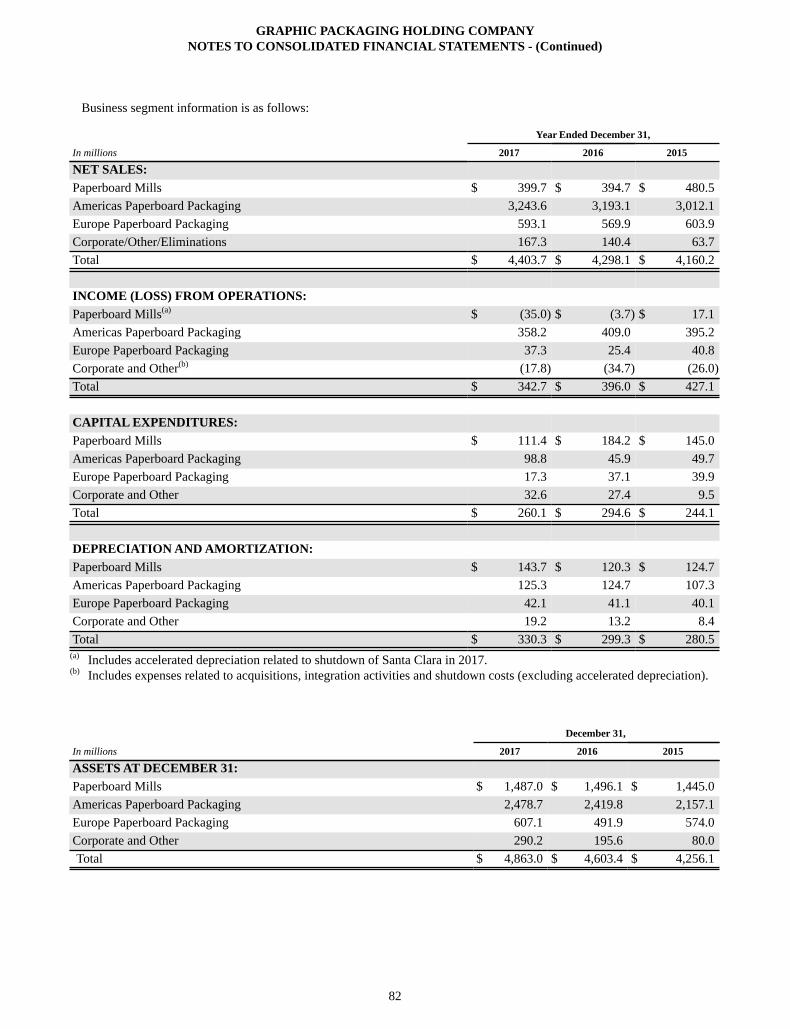
GRAPHIC PACKAGING HOLDING COMPANYNOTES TO CONSOLIDATED FINANCIAL STATEMENTS - (Continued)
82
Business segment information is as follows:
Year Ended December 31,
In millions 2017 2016 2015
NET SALES:Paperboard Mills $ 399.7 $ 394.7 $ 480.5Americas Paperboard Packaging 3,243.6 3,193.1 3,012.1Europe Paperboard Packaging 593.1 569.9 603.9Corporate/Other/Eliminations 167.3 140.4 63.7Total $ 4,403.7 $ 4,298.1 $ 4,160.2
INCOME (LOSS) FROM OPERATIONS:Paperboard Mills(a) $ (35.0) $ (3.7) $ 17.1Americas Paperboard Packaging 358.2 409.0 395.2Europe Paperboard Packaging 37.3 25.4 40.8Corporate and Other(b) (17.8) (34.7) (26.0)Total $ 342.7 $ 396.0 $ 427.1
CAPITAL EXPENDITURES:Paperboard Mills $ 111.4 $ 184.2 $ 145.0Americas Paperboard Packaging 98.8 45.9 49.7Europe Paperboard Packaging 17.3 37.1 39.9Corporate and Other 32.6 27.4 9.5Total $ 260.1 $ 294.6 $ 244.1
DEPRECIATION AND AMORTIZATION:Paperboard Mills $ 143.7 $ 120.3 $ 124.7Americas Paperboard Packaging 125.3 124.7 107.3Europe Paperboard Packaging 42.1 41.1 40.1Corporate and Other 19.2 13.2 8.4Total $ 330.3 $ 299.3 $ 280.5
(a) Includes accelerated depreciation related to shutdown of Santa Clara in 2017.(b) Includes expenses related to acquisitions, integration activities and shutdown costs (excluding accelerated depreciation).
December 31,
In millions 2017 2016 2015
ASSETS AT DECEMBER 31:Paperboard Mills $ 1,487.0 $ 1,496.1 $ 1,445.0Americas Paperboard Packaging 2,478.7 2,419.8 2,157.1Europe Paperboard Packaging 607.1 491.9 574.0Corporate and Other 290.2 195.6 80.0Total $ 4,863.0 $ 4,603.4 $ 4,256.1
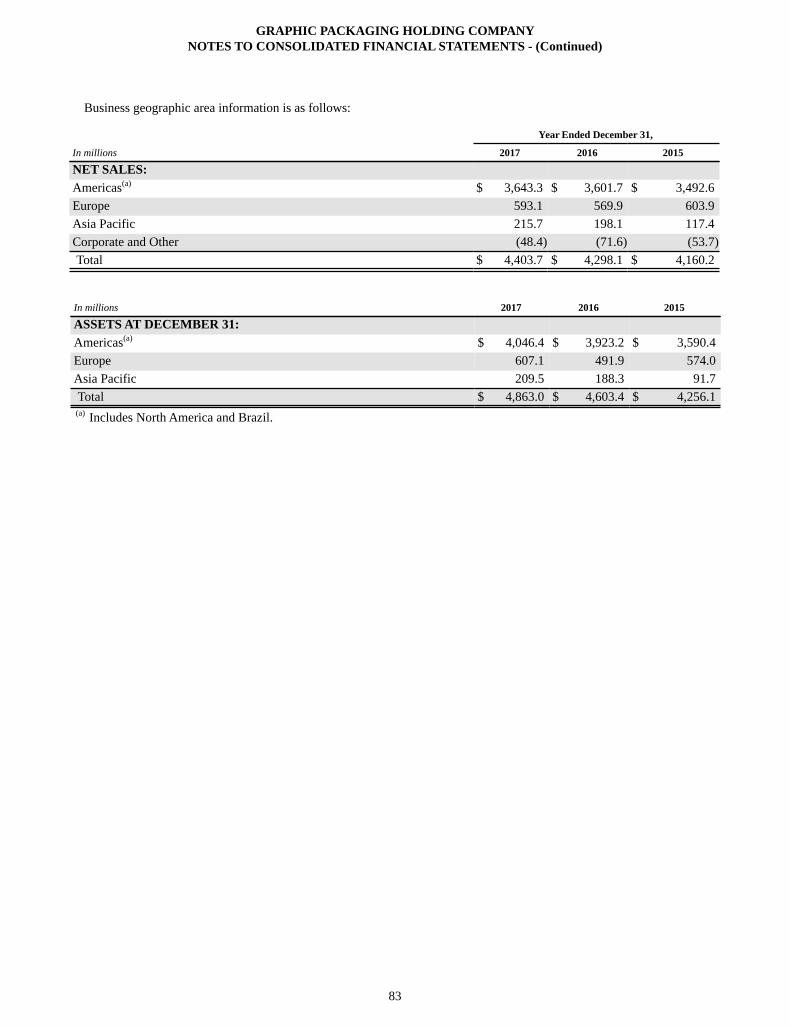
GRAPHIC PACKAGING HOLDING COMPANYNOTES TO CONSOLIDATED FINANCIAL STATEMENTS - (Continued)
83
Business geographic area information is as follows:
Year Ended December 31,
In millions 2017 2016 2015
NET SALES:Americas(a) $ 3,643.3 $ 3,601.7 $ 3,492.6Europe 593.1 569.9 603.9Asia Pacific 215.7 198.1 117.4Corporate and Other (48.4) (71.6) (53.7)Total $ 4,403.7 $ 4,298.1 $ 4,160.2
In millions 2017 2016 2015
ASSETS AT DECEMBER 31:Americas(a) $ 4,046.4 $ 3,923.2 $ 3,590.4Europe 607.1 491.9 574.0Asia Pacific 209.5 188.3 91.7Total $ 4,863.0 $ 4,603.4 $ 4,256.1(a) Includes North America and Brazil.
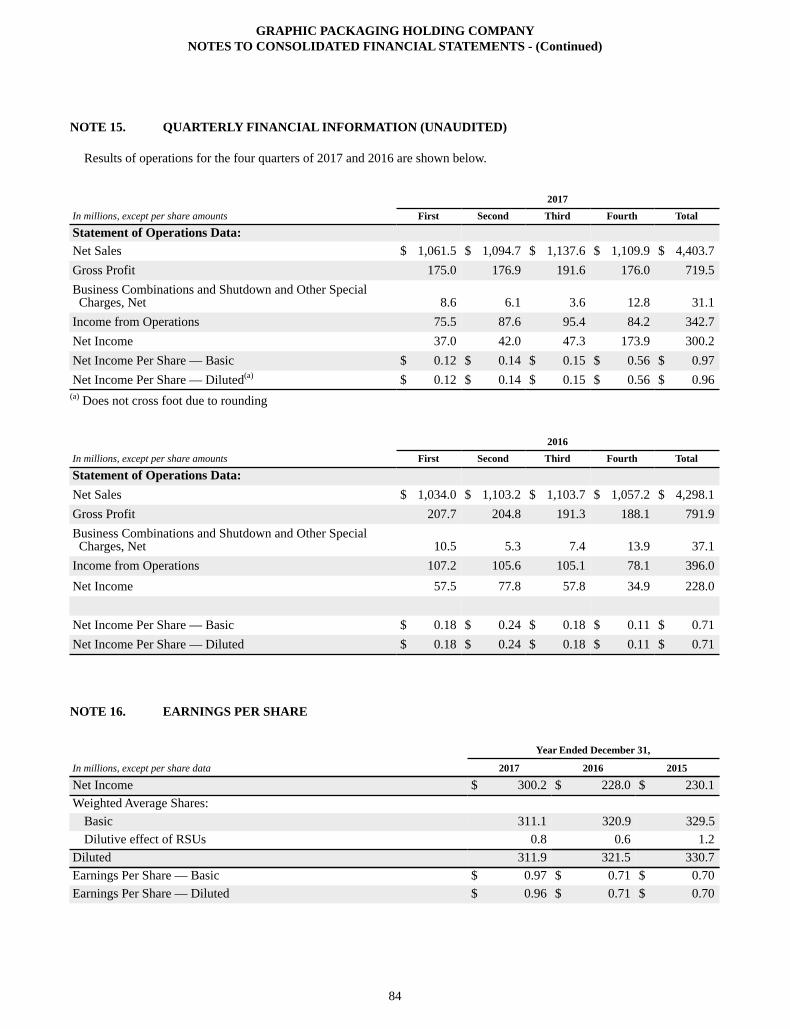
GRAPHIC PACKAGING HOLDING COMPANYNOTES TO CONSOLIDATED FINANCIAL STATEMENTS - (Continued)
84
NOTE 15. QUARTERLY FINANCIAL INFORMATION (UNAUDITED)
Results of operations for the four quarters of 2017 and 2016 are shown below.
2017In millions, except per share amounts First Second Third Fourth Total
Statement of Operations Data:Net Sales $ 1,061.5 $ 1,094.7 $ 1,137.6 $ 1,109.9 $ 4,403.7Gross Profit 175.0 176.9 191.6 176.0 719.5Business Combinations and Shutdown and Other SpecialCharges, Net 8.6 6.1 3.6 12.8 31.1
Income from Operations 75.5 87.6 95.4 84.2 342.7Net Income 37.0 42.0 47.3 173.9 300.2Net Income Per Share — Basic $ 0.12 $ 0.14 $ 0.15 $ 0.56 $ 0.97Net Income Per Share — Diluted(a) $ 0.12 $ 0.14 $ 0.15 $ 0.56 $ 0.96
(a) Does not cross foot due to rounding
2016In millions, except per share amounts First Second Third Fourth Total
Statement of Operations Data:Net Sales $ 1,034.0 $ 1,103.2 $ 1,103.7 $ 1,057.2 $ 4,298.1Gross Profit 207.7 204.8 191.3 188.1 791.9Business Combinations and Shutdown and Other SpecialCharges, Net 10.5 5.3 7.4 13.9 37.1
Income from Operations 107.2 105.6 105.1 78.1 396.0Net Income 57.5 77.8 57.8 34.9 228.0
Net Income Per Share — Basic $ 0.18 $ 0.24 $ 0.18 $ 0.11 $ 0.71Net Income Per Share — Diluted $ 0.18 $ 0.24 $ 0.18 $ 0.11 $ 0.71
NOTE 16. EARNINGS PER SHARE
Year Ended December 31,
In millions, except per share data 2017 2016 2015
Net Income $ 300.2 $ 228.0 $ 230.1Weighted Average Shares:
Basic 311.1 320.9 329.5Dilutive effect of RSUs 0.8 0.6 1.2
Diluted 311.9 321.5 330.7Earnings Per Share — Basic $ 0.97 $ 0.71 $ 0.70Earnings Per Share — Diluted $ 0.96 $ 0.71 $ 0.70
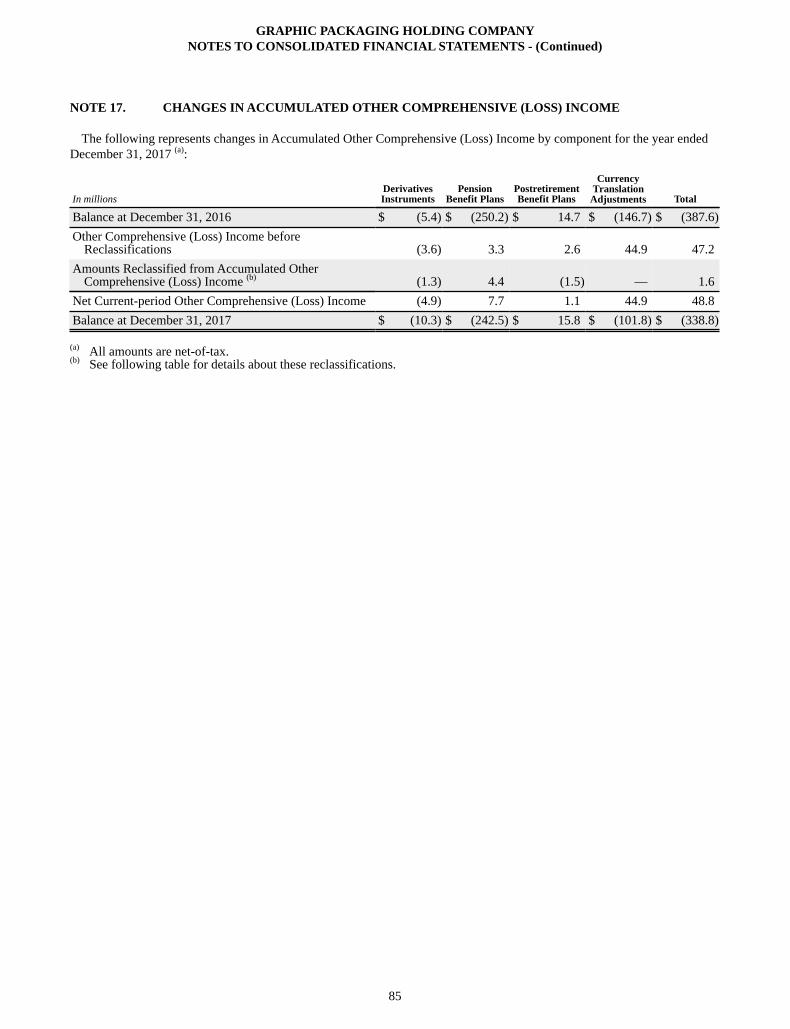
GRAPHIC PACKAGING HOLDING COMPANYNOTES TO CONSOLIDATED FINANCIAL STATEMENTS - (Continued)
85
NOTE 17. CHANGES IN ACCUMULATED OTHER COMPREHENSIVE (LOSS) INCOME
The following represents changes in Accumulated Other Comprehensive (Loss) Income by component for the year ended December 31, 2017 (a):
In millionsDerivativesInstruments
PensionBenefit Plans
PostretirementBenefit Plans
CurrencyTranslation
Adjustments Total
Balance at December 31, 2016 $ (5.4) $ (250.2) $ 14.7 $ (146.7) $ (387.6)Other Comprehensive (Loss) Income before
Reclassifications (3.6) 3.3 2.6 44.9 47.2Amounts Reclassified from Accumulated Other
Comprehensive (Loss) Income (b) (1.3) 4.4 (1.5) — 1.6Net Current-period Other Comprehensive (Loss) Income (4.9) 7.7 1.1 44.9 48.8Balance at December 31, 2017 $ (10.3) $ (242.5) $ 15.8 $ (101.8) $ (338.8)
(a) All amounts are net-of-tax.(b) See following table for details about these reclassifications.
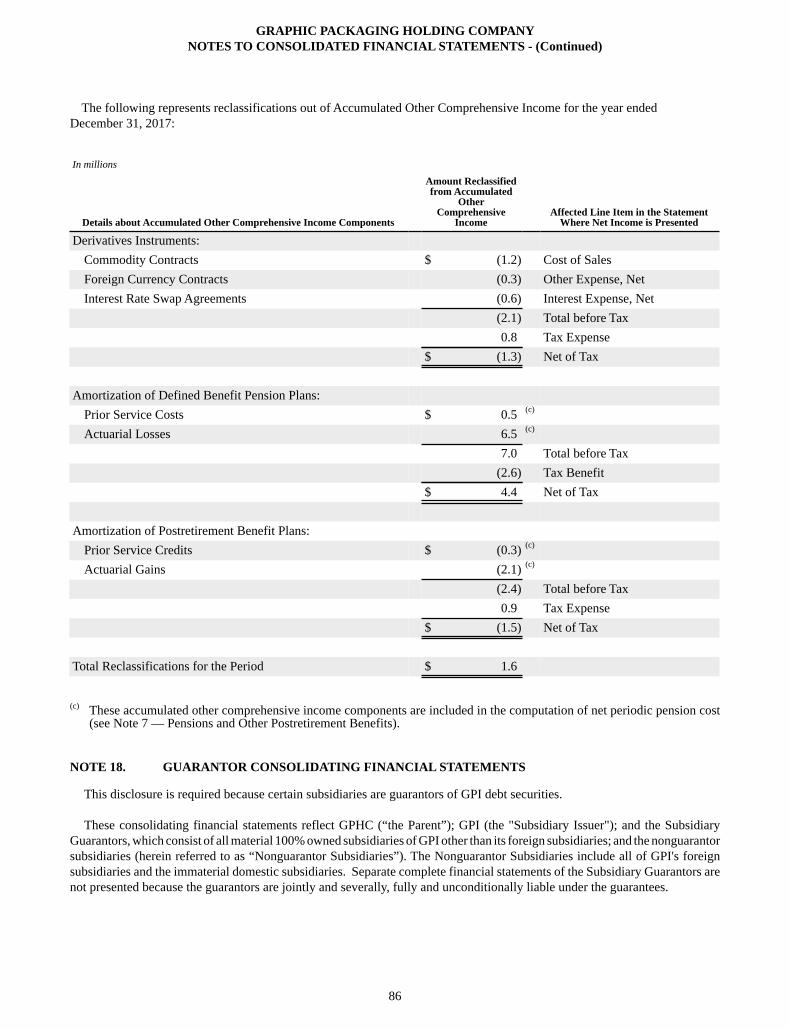
GRAPHIC PACKAGING HOLDING COMPANYNOTES TO CONSOLIDATED FINANCIAL STATEMENTS - (Continued)
86
The following represents reclassifications out of Accumulated Other Comprehensive Income for the year ended December 31, 2017:
In millions
Details about Accumulated Other Comprehensive Income Components
Amount Reclassifiedfrom Accumulated
OtherComprehensive
IncomeAffected Line Item in the Statement
Where Net Income is Presented
Derivatives Instruments:Commodity Contracts $ (1.2) Cost of SalesForeign Currency Contracts (0.3) Other Expense, NetInterest Rate Swap Agreements (0.6) Interest Expense, Net
(2.1) Total before Tax0.8 Tax Expense
$ (1.3) Net of Tax
Amortization of Defined Benefit Pension Plans:Prior Service Costs $ 0.5 (c)
Actuarial Losses 6.5 (c)
7.0 Total before Tax(2.6) Tax Benefit
$ 4.4 Net of Tax
Amortization of Postretirement Benefit Plans:Prior Service Credits $ (0.3) (c)
Actuarial Gains (2.1) (c)
(2.4) Total before Tax0.9 Tax Expense
$ (1.5) Net of Tax
Total Reclassifications for the Period $ 1.6 (c) These accumulated other comprehensive income components are included in the computation of net periodic pension cost
(see Note 7 — Pensions and Other Postretirement Benefits).
NOTE 18. GUARANTOR CONSOLIDATING FINANCIAL STATEMENTS
This disclosure is required because certain subsidiaries are guarantors of GPI debt securities.
These consolidating financial statements reflect GPHC (“the Parent”); GPI (the "Subsidiary Issuer"); and the Subsidiary Guarantors, which consist of all material 100% owned subsidiaries of GPI other than its foreign subsidiaries; and the nonguarantor subsidiaries (herein referred to as “Nonguarantor Subsidiaries”). The Nonguarantor Subsidiaries include all of GPI's foreign subsidiaries and the immaterial domestic subsidiaries. Separate complete financial statements of the Subsidiary Guarantors are not presented because the guarantors are jointly and severally, fully and unconditionally liable under the guarantees.
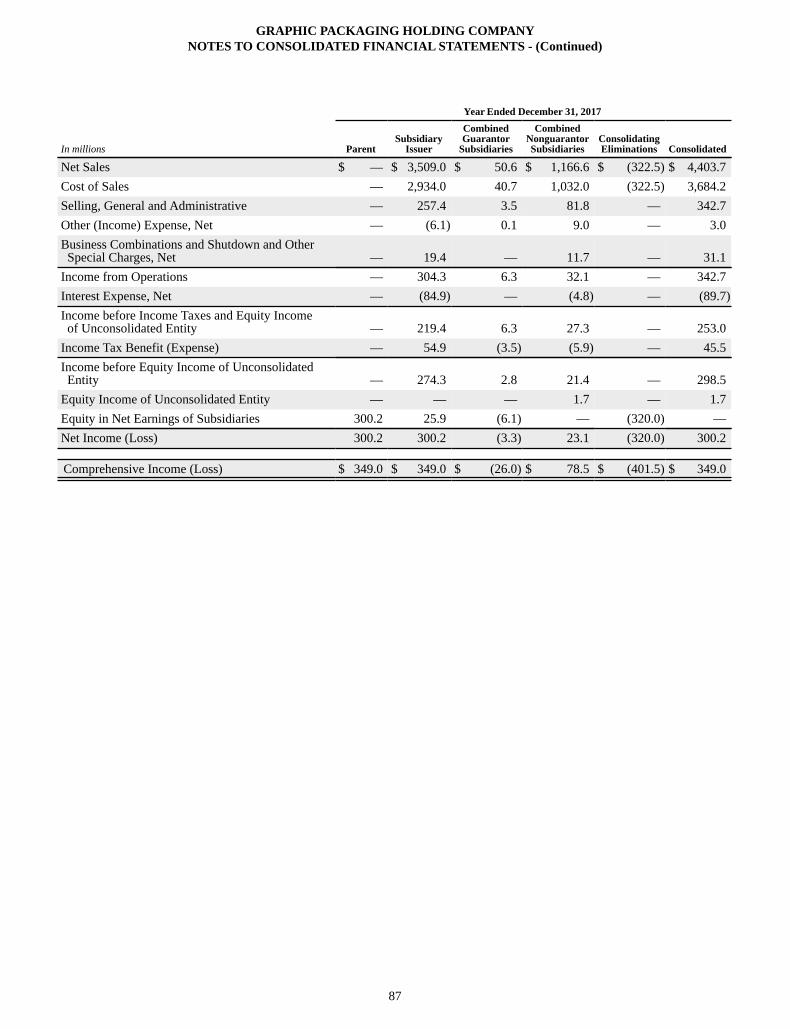
GRAPHIC PACKAGING HOLDING COMPANYNOTES TO CONSOLIDATED FINANCIAL STATEMENTS - (Continued)
87
Year Ended December 31, 2017
In millions ParentSubsidiary
Issuer
CombinedGuarantor
Subsidiaries
CombinedNonguarantorSubsidiaries
ConsolidatingEliminations Consolidated
Net Sales $ — $ 3,509.0 $ 50.6 $ 1,166.6 $ (322.5) $ 4,403.7Cost of Sales — 2,934.0 40.7 1,032.0 (322.5) 3,684.2Selling, General and Administrative — 257.4 3.5 81.8 — 342.7Other (Income) Expense, Net — (6.1) 0.1 9.0 — 3.0Business Combinations and Shutdown and OtherSpecial Charges, Net — 19.4 — 11.7 — 31.1
Income from Operations — 304.3 6.3 32.1 — 342.7Interest Expense, Net — (84.9) — (4.8) — (89.7)Income before Income Taxes and Equity Incomeof Unconsolidated Entity — 219.4 6.3 27.3 — 253.0
Income Tax Benefit (Expense) — 54.9 (3.5) (5.9) — 45.5Income before Equity Income of UnconsolidatedEntity — 274.3 2.8 21.4 — 298.5
Equity Income of Unconsolidated Entity — — — 1.7 — 1.7Equity in Net Earnings of Subsidiaries 300.2 25.9 (6.1) — (320.0) —Net Income (Loss) 300.2 300.2 (3.3) 23.1 (320.0) 300.2
Comprehensive Income (Loss) $ 349.0 $ 349.0 $ (26.0) $ 78.5 $ (401.5) $ 349.0
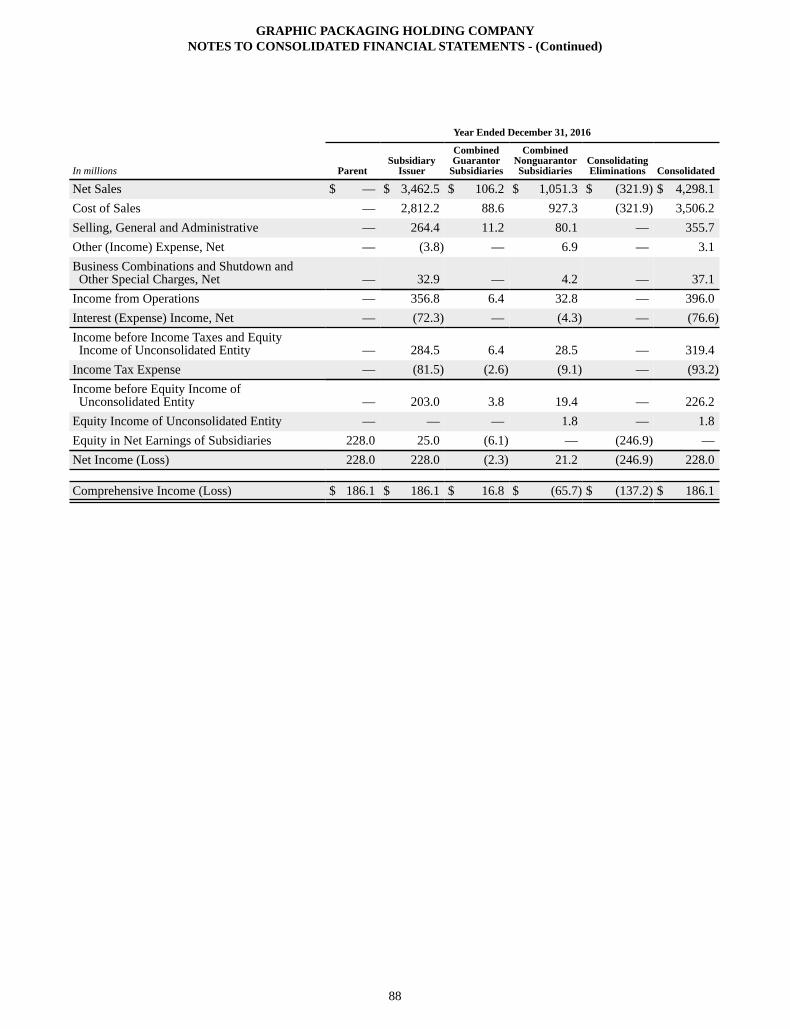
GRAPHIC PACKAGING HOLDING COMPANYNOTES TO CONSOLIDATED FINANCIAL STATEMENTS - (Continued)
88
Year Ended December 31, 2016
In millions ParentSubsidiary
Issuer
CombinedGuarantor
Subsidiaries
CombinedNonguarantorSubsidiaries
ConsolidatingEliminations Consolidated
Net Sales $ — $ 3,462.5 $ 106.2 $ 1,051.3 $ (321.9) $ 4,298.1Cost of Sales — 2,812.2 88.6 927.3 (321.9) 3,506.2Selling, General and Administrative — 264.4 11.2 80.1 — 355.7Other (Income) Expense, Net — (3.8) — 6.9 — 3.1Business Combinations and Shutdown andOther Special Charges, Net — 32.9 — 4.2 — 37.1
Income from Operations — 356.8 6.4 32.8 — 396.0Interest (Expense) Income, Net — (72.3) — (4.3) — (76.6)Income before Income Taxes and EquityIncome of Unconsolidated Entity — 284.5 6.4 28.5 — 319.4
Income Tax Expense — (81.5) (2.6) (9.1) — (93.2)Income before Equity Income ofUnconsolidated Entity — 203.0 3.8 19.4 — 226.2
Equity Income of Unconsolidated Entity — — — 1.8 — 1.8Equity in Net Earnings of Subsidiaries 228.0 25.0 (6.1) — (246.9) —Net Income (Loss) 228.0 228.0 (2.3) 21.2 (246.9) 228.0
Comprehensive Income (Loss) $ 186.1 $ 186.1 $ 16.8 $ (65.7) $ (137.2) $ 186.1
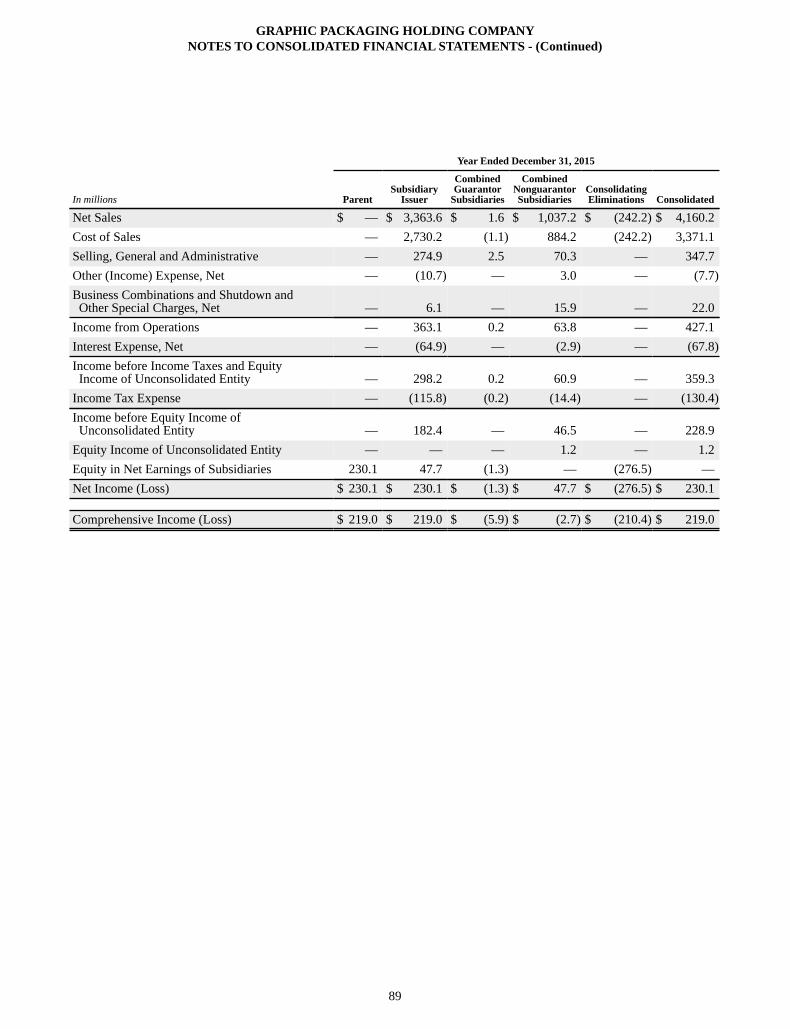
GRAPHIC PACKAGING HOLDING COMPANYNOTES TO CONSOLIDATED FINANCIAL STATEMENTS - (Continued)
89
Year Ended December 31, 2015
In millions ParentSubsidiary
Issuer
CombinedGuarantor
Subsidiaries
CombinedNonguarantorSubsidiaries
ConsolidatingEliminations Consolidated
Net Sales $ — $ 3,363.6 $ 1.6 $ 1,037.2 $ (242.2) $ 4,160.2Cost of Sales — 2,730.2 (1.1) 884.2 (242.2) 3,371.1Selling, General and Administrative — 274.9 2.5 70.3 — 347.7Other (Income) Expense, Net — (10.7) — 3.0 — (7.7)Business Combinations and Shutdown andOther Special Charges, Net — 6.1 — 15.9 — 22.0
Income from Operations — 363.1 0.2 63.8 — 427.1Interest Expense, Net — (64.9) — (2.9) — (67.8)Income before Income Taxes and EquityIncome of Unconsolidated Entity — 298.2 0.2 60.9 — 359.3
Income Tax Expense — (115.8) (0.2) (14.4) — (130.4)Income before Equity Income ofUnconsolidated Entity — 182.4 — 46.5 — 228.9
Equity Income of Unconsolidated Entity — — — 1.2 — 1.2Equity in Net Earnings of Subsidiaries 230.1 47.7 (1.3) — (276.5) —Net Income (Loss) $ 230.1 $ 230.1 $ (1.3) $ 47.7 $ (276.5) $ 230.1
Comprehensive Income (Loss) $ 219.0 $ 219.0 $ (5.9) $ (2.7) $ (210.4) $ 219.0
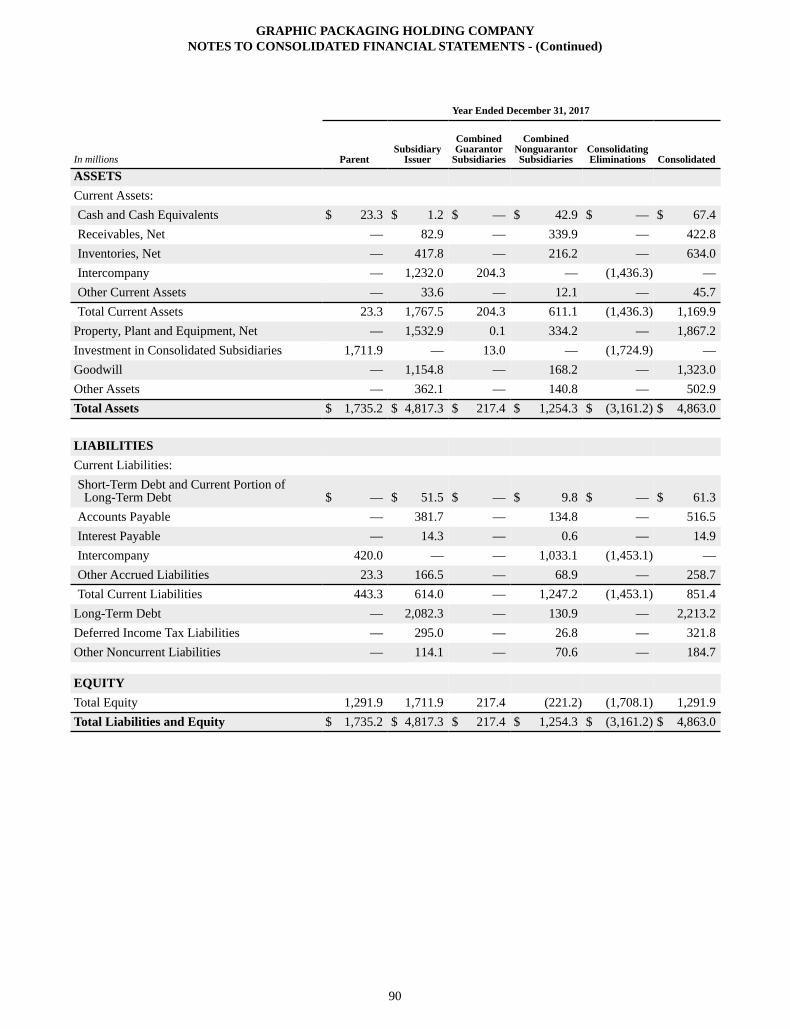
GRAPHIC PACKAGING HOLDING COMPANYNOTES TO CONSOLIDATED FINANCIAL STATEMENTS - (Continued)
90
Year Ended December 31, 2017
In millions ParentSubsidiary
Issuer
CombinedGuarantor
Subsidiaries
CombinedNonguarantorSubsidiaries
ConsolidatingEliminations Consolidated
ASSETSCurrent Assets:Cash and Cash Equivalents $ 23.3 $ 1.2 $ — $ 42.9 $ — $ 67.4Receivables, Net — 82.9 — 339.9 — 422.8Inventories, Net — 417.8 — 216.2 — 634.0Intercompany — 1,232.0 204.3 — (1,436.3) —Other Current Assets — 33.6 — 12.1 — 45.7Total Current Assets 23.3 1,767.5 204.3 611.1 (1,436.3) 1,169.9
Property, Plant and Equipment, Net — 1,532.9 0.1 334.2 — 1,867.2Investment in Consolidated Subsidiaries 1,711.9 — 13.0 — (1,724.9) —Goodwill — 1,154.8 — 168.2 — 1,323.0Other Assets — 362.1 — 140.8 — 502.9Total Assets $ 1,735.2 $ 4,817.3 $ 217.4 $ 1,254.3 $ (3,161.2) $ 4,863.0
LIABILITIESCurrent Liabilities:Short-Term Debt and Current Portion ofLong-Term Debt $ — $ 51.5 $ — $ 9.8 $ — $ 61.3
Accounts Payable — 381.7 — 134.8 — 516.5Interest Payable — 14.3 — 0.6 — 14.9Intercompany 420.0 — — 1,033.1 (1,453.1) —Other Accrued Liabilities 23.3 166.5 — 68.9 — 258.7Total Current Liabilities 443.3 614.0 — 1,247.2 (1,453.1) 851.4
Long-Term Debt — 2,082.3 — 130.9 — 2,213.2Deferred Income Tax Liabilities — 295.0 — 26.8 — 321.8Other Noncurrent Liabilities — 114.1 — 70.6 — 184.7
EQUITYTotal Equity 1,291.9 1,711.9 217.4 (221.2) (1,708.1) 1,291.9Total Liabilities and Equity $ 1,735.2 $ 4,817.3 $ 217.4 $ 1,254.3 $ (3,161.2) $ 4,863.0
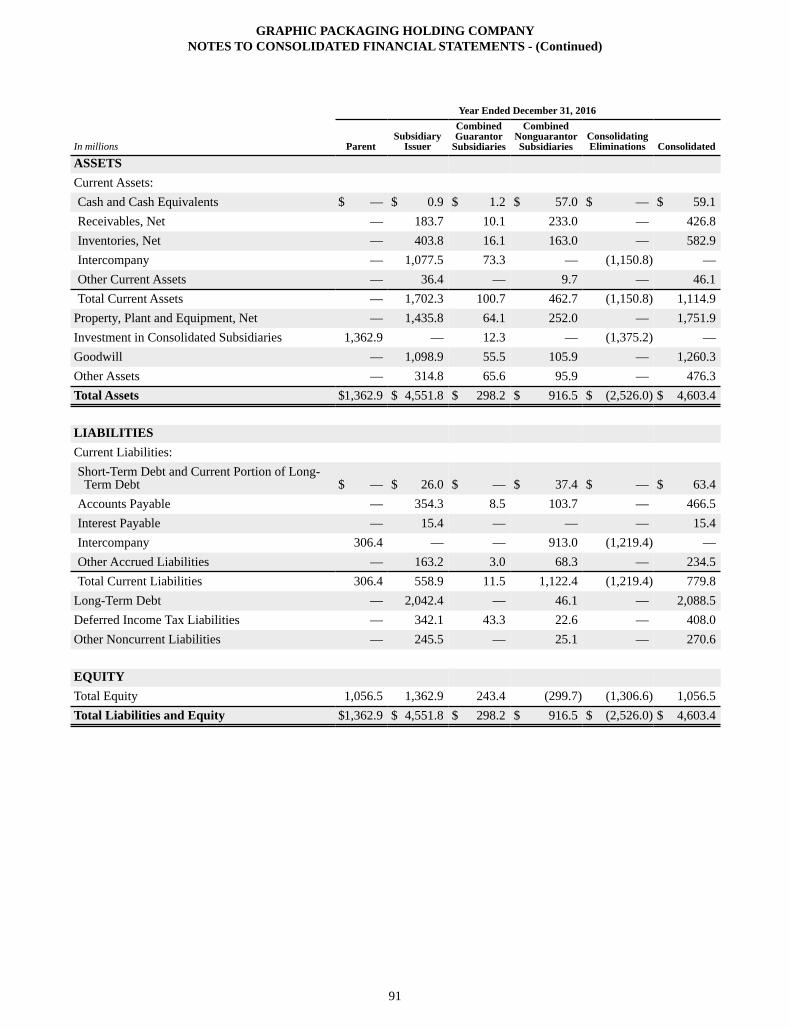
GRAPHIC PACKAGING HOLDING COMPANYNOTES TO CONSOLIDATED FINANCIAL STATEMENTS - (Continued)
91
Year Ended December 31, 2016
In millions ParentSubsidiary
Issuer
CombinedGuarantor
Subsidiaries
CombinedNonguarantorSubsidiaries
ConsolidatingEliminations Consolidated
ASSETSCurrent Assets:Cash and Cash Equivalents $ — $ 0.9 $ 1.2 $ 57.0 $ — $ 59.1Receivables, Net — 183.7 10.1 233.0 — 426.8Inventories, Net — 403.8 16.1 163.0 — 582.9Intercompany — 1,077.5 73.3 — (1,150.8) —Other Current Assets — 36.4 — 9.7 — 46.1Total Current Assets — 1,702.3 100.7 462.7 (1,150.8) 1,114.9
Property, Plant and Equipment, Net — 1,435.8 64.1 252.0 — 1,751.9Investment in Consolidated Subsidiaries 1,362.9 — 12.3 — (1,375.2) —Goodwill — 1,098.9 55.5 105.9 — 1,260.3Other Assets — 314.8 65.6 95.9 — 476.3Total Assets $1,362.9 $ 4,551.8 $ 298.2 $ 916.5 $ (2,526.0) $ 4,603.4
LIABILITIESCurrent Liabilities:Short-Term Debt and Current Portion of Long-Term Debt $ — $ 26.0 $ — $ 37.4 $ — $ 63.4
Accounts Payable — 354.3 8.5 103.7 — 466.5Interest Payable — 15.4 — — — 15.4Intercompany 306.4 — — 913.0 (1,219.4) —Other Accrued Liabilities — 163.2 3.0 68.3 — 234.5Total Current Liabilities 306.4 558.9 11.5 1,122.4 (1,219.4) 779.8
Long-Term Debt — 2,042.4 — 46.1 — 2,088.5Deferred Income Tax Liabilities — 342.1 43.3 22.6 — 408.0Other Noncurrent Liabilities — 245.5 — 25.1 — 270.6
EQUITYTotal Equity 1,056.5 1,362.9 243.4 (299.7) (1,306.6) 1,056.5Total Liabilities and Equity $1,362.9 $ 4,551.8 $ 298.2 $ 916.5 $ (2,526.0) $ 4,603.4
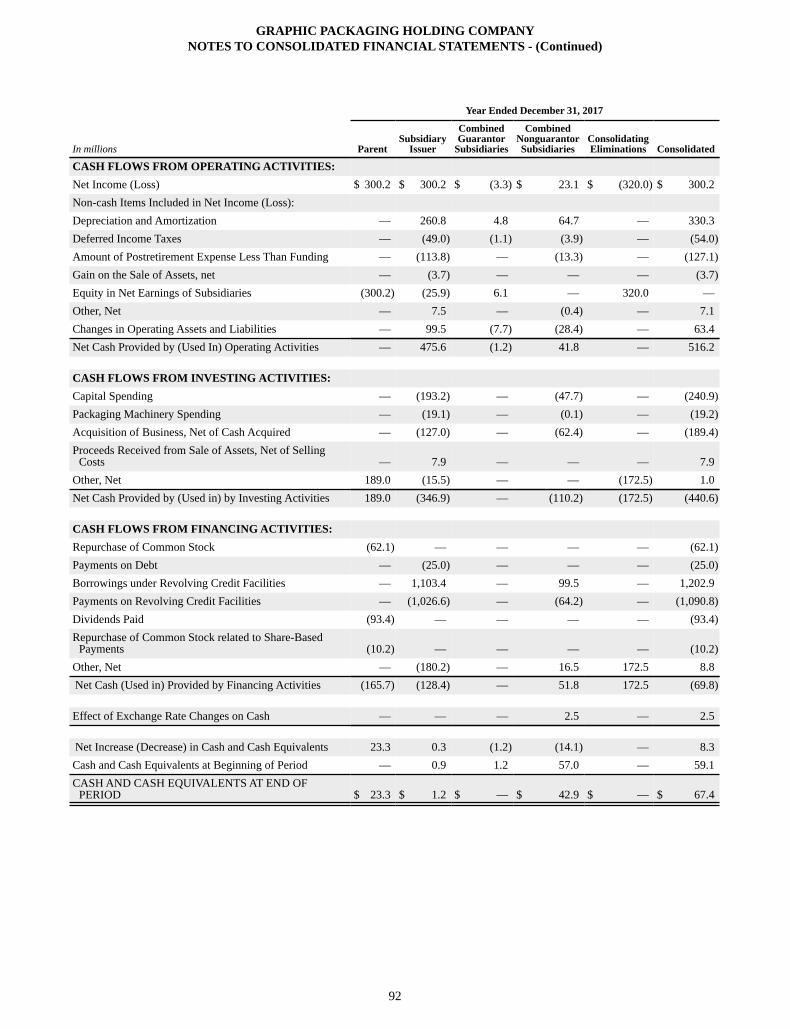
GRAPHIC PACKAGING HOLDING COMPANYNOTES TO CONSOLIDATED FINANCIAL STATEMENTS - (Continued)
92
Year Ended December 31, 2017
In millions ParentSubsidiary
Issuer
CombinedGuarantor
Subsidiaries
CombinedNonguarantorSubsidiaries
ConsolidatingEliminations Consolidated
CASH FLOWS FROM OPERATING ACTIVITIES:Net Income (Loss) $ 300.2 $ 300.2 $ (3.3) $ 23.1 $ (320.0) $ 300.2Non-cash Items Included in Net Income (Loss):Depreciation and Amortization — 260.8 4.8 64.7 — 330.3Deferred Income Taxes — (49.0) (1.1) (3.9) — (54.0)Amount of Postretirement Expense Less Than Funding — (113.8) — (13.3) — (127.1)Gain on the Sale of Assets, net — (3.7) — — — (3.7)Equity in Net Earnings of Subsidiaries (300.2) (25.9) 6.1 — 320.0 —Other, Net — 7.5 — (0.4) — 7.1Changes in Operating Assets and Liabilities — 99.5 (7.7) (28.4) — 63.4Net Cash Provided by (Used In) Operating Activities — 475.6 (1.2) 41.8 — 516.2
CASH FLOWS FROM INVESTING ACTIVITIES:Capital Spending — (193.2) — (47.7) — (240.9)Packaging Machinery Spending — (19.1) — (0.1) — (19.2)Acquisition of Business, Net of Cash Acquired — (127.0) — (62.4) — (189.4)Proceeds Received from Sale of Assets, Net of Selling
Costs — 7.9 — — — 7.9Other, Net 189.0 (15.5) — — (172.5) 1.0Net Cash Provided by (Used in) by Investing Activities 189.0 (346.9) — (110.2) (172.5) (440.6)
CASH FLOWS FROM FINANCING ACTIVITIES:Repurchase of Common Stock (62.1) — — — — (62.1)Payments on Debt — (25.0) — — — (25.0)Borrowings under Revolving Credit Facilities — 1,103.4 — 99.5 — 1,202.9Payments on Revolving Credit Facilities — (1,026.6) — (64.2) — (1,090.8)Dividends Paid (93.4) — — — — (93.4)Repurchase of Common Stock related to Share-Based
Payments (10.2) — — — — (10.2)Other, Net — (180.2) — 16.5 172.5 8.8Net Cash (Used in) Provided by Financing Activities (165.7) (128.4) — 51.8 172.5 (69.8)
Effect of Exchange Rate Changes on Cash — — — 2.5 — 2.5
Net Increase (Decrease) in Cash and Cash Equivalents 23.3 0.3 (1.2) (14.1) — 8.3Cash and Cash Equivalents at Beginning of Period — 0.9 1.2 57.0 — 59.1CASH AND CASH EQUIVALENTS AT END OF
PERIOD $ 23.3 $ 1.2 $ — $ 42.9 $ — $ 67.4
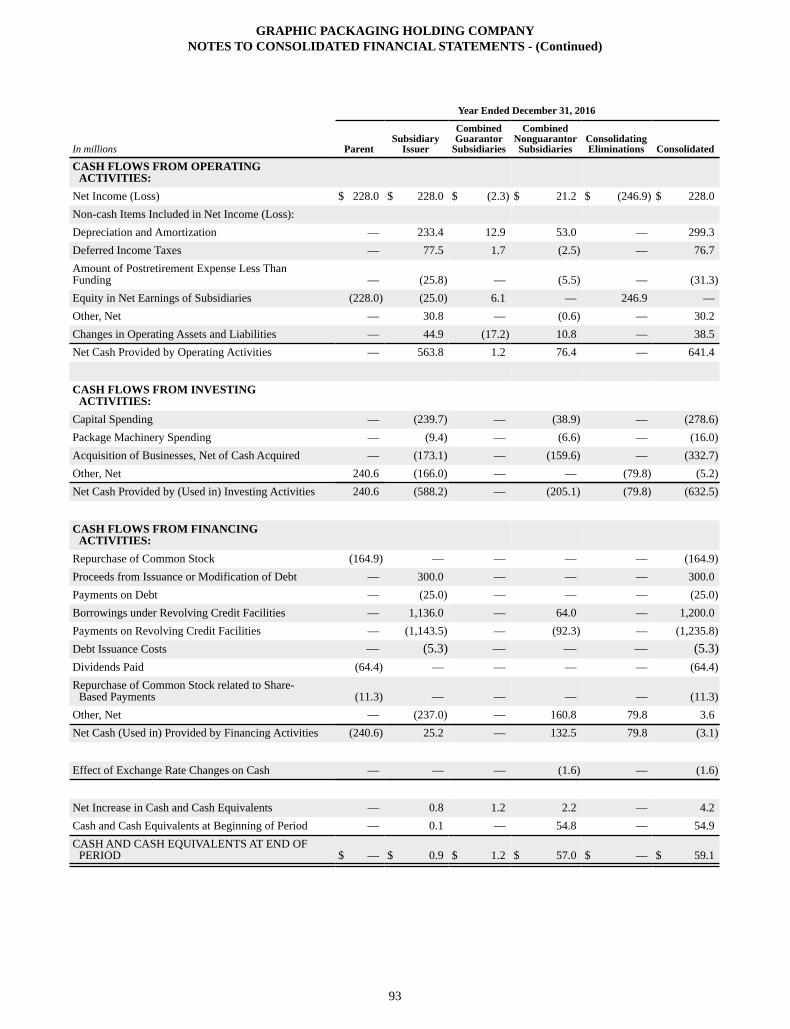
GRAPHIC PACKAGING HOLDING COMPANYNOTES TO CONSOLIDATED FINANCIAL STATEMENTS - (Continued)
93
Year Ended December 31, 2016
In millions ParentSubsidiary
Issuer
CombinedGuarantor
Subsidiaries
CombinedNonguarantorSubsidiaries
ConsolidatingEliminations Consolidated
CASH FLOWS FROM OPERATINGACTIVITIES:
Net Income (Loss) $ 228.0 $ 228.0 $ (2.3) $ 21.2 $ (246.9) $ 228.0Non-cash Items Included in Net Income (Loss):Depreciation and Amortization — 233.4 12.9 53.0 — 299.3Deferred Income Taxes — 77.5 1.7 (2.5) — 76.7Amount of Postretirement Expense Less ThanFunding — (25.8) — (5.5) — (31.3)Equity in Net Earnings of Subsidiaries (228.0) (25.0) 6.1 — 246.9 —Other, Net — 30.8 — (0.6) — 30.2Changes in Operating Assets and Liabilities — 44.9 (17.2) 10.8 — 38.5Net Cash Provided by Operating Activities — 563.8 1.2 76.4 — 641.4
CASH FLOWS FROM INVESTINGACTIVITIES:
Capital Spending — (239.7) — (38.9) — (278.6)Package Machinery Spending — (9.4) — (6.6) — (16.0)Acquisition of Businesses, Net of Cash Acquired — (173.1) — (159.6) — (332.7)Other, Net 240.6 (166.0) — — (79.8) (5.2)Net Cash Provided by (Used in) Investing Activities 240.6 (588.2) — (205.1) (79.8) (632.5)
CASH FLOWS FROM FINANCINGACTIVITIES:
Repurchase of Common Stock (164.9) — — — — (164.9)Proceeds from Issuance or Modification of Debt — 300.0 — — — 300.0Payments on Debt — (25.0) — — — (25.0)Borrowings under Revolving Credit Facilities — 1,136.0 — 64.0 — 1,200.0Payments on Revolving Credit Facilities — (1,143.5) — (92.3) — (1,235.8)Debt Issuance Costs — (5.3) — — — (5.3)Dividends Paid (64.4) — — — — (64.4)Repurchase of Common Stock related to Share-
Based Payments (11.3) — — — — (11.3)Other, Net — (237.0) — 160.8 79.8 3.6Net Cash (Used in) Provided by Financing Activities (240.6) 25.2 — 132.5 79.8 (3.1)
Effect of Exchange Rate Changes on Cash — — — (1.6) — (1.6)
Net Increase in Cash and Cash Equivalents — 0.8 1.2 2.2 — 4.2Cash and Cash Equivalents at Beginning of Period — 0.1 — 54.8 — 54.9CASH AND CASH EQUIVALENTS AT END OF
PERIOD $ — $ 0.9 $ 1.2 $ 57.0 $ — $ 59.1
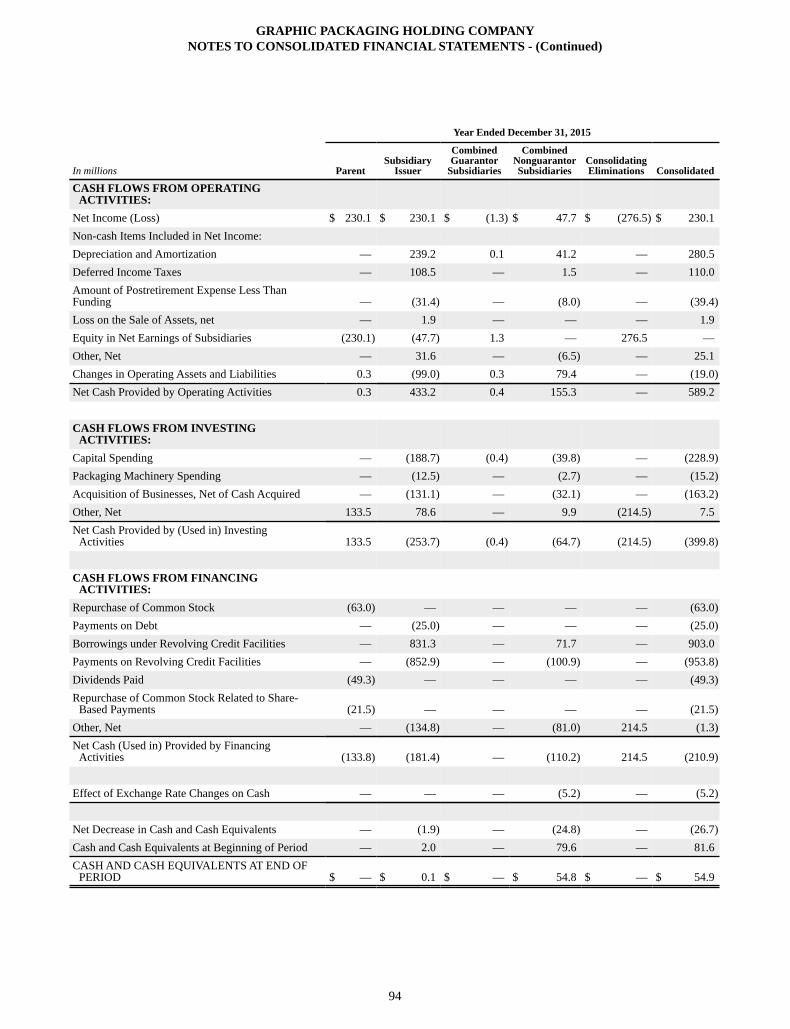
GRAPHIC PACKAGING HOLDING COMPANYNOTES TO CONSOLIDATED FINANCIAL STATEMENTS - (Continued)
94
Year Ended December 31, 2015
In millions ParentSubsidiary
Issuer
CombinedGuarantor
Subsidiaries
CombinedNonguarantorSubsidiaries
ConsolidatingEliminations Consolidated
CASH FLOWS FROM OPERATINGACTIVITIES:
Net Income (Loss) $ 230.1 $ 230.1 $ (1.3) $ 47.7 $ (276.5) $ 230.1Non-cash Items Included in Net Income:Depreciation and Amortization — 239.2 0.1 41.2 — 280.5Deferred Income Taxes — 108.5 — 1.5 — 110.0Amount of Postretirement Expense Less ThanFunding — (31.4) — (8.0) — (39.4)Loss on the Sale of Assets, net — 1.9 — — — 1.9Equity in Net Earnings of Subsidiaries (230.1) (47.7) 1.3 — 276.5 —Other, Net — 31.6 — (6.5) — 25.1Changes in Operating Assets and Liabilities 0.3 (99.0) 0.3 79.4 — (19.0)Net Cash Provided by Operating Activities 0.3 433.2 0.4 155.3 — 589.2
CASH FLOWS FROM INVESTINGACTIVITIES:
Capital Spending — (188.7) (0.4) (39.8) — (228.9)Packaging Machinery Spending — (12.5) — (2.7) — (15.2)Acquisition of Businesses, Net of Cash Acquired — (131.1) — (32.1) — (163.2)Other, Net 133.5 78.6 — 9.9 (214.5) 7.5Net Cash Provided by (Used in) Investing
Activities 133.5 (253.7) (0.4) (64.7) (214.5) (399.8)
CASH FLOWS FROM FINANCINGACTIVITIES:
Repurchase of Common Stock (63.0) — — — — (63.0)Payments on Debt — (25.0) — — — (25.0)Borrowings under Revolving Credit Facilities — 831.3 — 71.7 — 903.0Payments on Revolving Credit Facilities — (852.9) — (100.9) — (953.8)Dividends Paid (49.3) — — — — (49.3)Repurchase of Common Stock Related to Share-
Based Payments (21.5) — — — — (21.5)Other, Net — (134.8) — (81.0) 214.5 (1.3)Net Cash (Used in) Provided by Financing
Activities (133.8) (181.4) — (110.2) 214.5 (210.9)
Effect of Exchange Rate Changes on Cash — — — (5.2) — (5.2)
Net Decrease in Cash and Cash Equivalents — (1.9) — (24.8) — (26.7)Cash and Cash Equivalents at Beginning of Period — 2.0 — 79.6 — 81.6CASH AND CASH EQUIVALENTS AT END OF
PERIOD $ — $ 0.1 $ — $ 54.8 $ — $ 54.9
GRAPHIC PACKAGING HOLDING COMPANYNOTES TO CONSOLIDATED FINANCIAL STATEMENTS - (Continued)
95
NOTE 19. SUBSEQUENT EVENTS
On January 1, 2018, GPHC, International Paper Company (“IP”), Graphic Packaging International Partners, LLC (“GPIP”), and GPI completed a series of transactions by which the North America Consumer Packaging business of IP was combined with the businesses of GPI. Pursuant to the Transaction Agreement dated October 23, 2017, on the closing date IP transferred its business to GPIP, which subsequently transferred the business to GPI. Concurrently therewith, GPIP issued 20.5% of its membership interests to IP and IP was admitted as a member of GPIP. As a result, GPHC indirectly holds 79.5% of the membership interests in GPIP and IP holds 20.5% of the membership interests in GPIP.
In connection with consummation of the transactions with IP, GPI entered into a Third Amended and Restated Credit Agreement dated as of January 1, 2018 (the “Amended and Restated Credit Agreement”) by and among GPI and certain subsidiaries thereof as Borrowers, the lenders and agents named therein, and Bank of America, N.A., as Administrative Agent. The Amended and Restated Credit Agreement effects an “amend and extend” transaction with respect to the Company’s existing senior credit facility by which, among other things: (i) the maturity date thereof was extended to January 1, 2023, (ii) the U.S. dollar commitment portion increased by $75 million, (iii) the applicable margin interest rate pricing grid levels were reduced from those set forth in the prior credit facility, (iv) certain negative covenants contained in the prior credit facility were relaxed and (v) certain amendments were effected so as to accommodate the transactions with IP.
In addition to the Amended and Restated Credit Agreement, on January 1, 2018 the Company assumed the term loan indebtedness previously incurred by IP (the “Term Loan Credit Agreement”) in an aggregate amount of $660.0 million, repayable pursuant to the same amortization schedule (expressed as a percentage of the principal amount thereof) as the Term Loan A under the Amended and Restated Credit Agreement and has the same maturity date of January 1, 2023. The applicable margin pricing grid, covenant and other terms are substantially equivalent to those contained in the Amended and Restated Credit Agreement. The Term Loan Credit Agreement is secured by a lien and security interest in substantially all of the assets of GPI on a pari passu basis with the liens and security interests securing the Amended and Restated Credit Agreement pursuant to the terms of a customary intercreditor agreement among the parties.
96
Report of Independent Registered Public Accounting Firm
The Board of Directors and Shareholders of Graphic Packaging Holding Company
Opinion on the Financial Statements
We have audited the accompanying consolidated balance sheets of Graphic Packaging Holding Company (the Company) as of December 31, 2017 and 2016, and the related consolidated statements of operations, comprehensive income (loss), shareholders' equity and cash flows for each of the three years in the period ended December 31, 2017, and the related notes (collectively referred to as the “financial statements”). In our opinion, the financial statements present fairly, in all material respects, the consolidated financial position of the Company at December 31, 2017 and 2016, and the consolidated results of its operations and its cash flows for each of the three years in the period ended December 31, 2017, in conformity with U.S. generally accepted accounting principles.
We also have audited, in accordance with the standards of the Public Company Accounting Oversight Board (United States) (PCAOB), the Company's internal control over financial reporting as of December 31, 2017, based on criteria established in Internal Control-Integrated Framework issued by the Committee of Sponsoring Organizations of the Treadway Commission (2013 framework) and our report dated February 7, 2018 expressed an unqualified opinion thereon.
Basis for Opinion These financial statements are the responsibility of the Company's management. Our responsibility is to express an opinion on the Company’s financial statements based on our audits. We are a public accounting firm registered with the PCAOB and are required to be independent with respect to the Company in accordance with the U.S. federal securities laws and the applicable rules and regulations of the Securities and Exchange Commission and the PCAOB. We conducted our audits in accordance with the standards of the PCAOB. Those standards require that we plan and perform the audit to obtain reasonable assurance about whether the financial statements are free of material misstatement, whether due to error or fraud. Our audits included performing procedures to assess the risks of material misstatement of the financial statements, whether due to error or fraud, and performing procedures that respond to those risks. Such procedures included examining, on a test basis, evidence regarding the amounts and disclosures in the financial statements. Our audits also included evaluating the accounting principles used and significant estimates made by management, as well as evaluating the overall presentation of the financial statements. We believe that our audits provide a reasonable basis for our opinion.
/s/ Ernst & Young LLP
We have served as the Company’s auditor since 2008.
Atlanta, GeorgiaFebruary 7, 2018
97
Report of Independent Registered Public Accounting Firm
The Board of Directors and Shareholders of Graphic Packaging Holding Company
Opinion on Internal Control over Financial ReportingWe have audited Graphic Packaging Holding Company’s internal control over financial reporting as of December 31, 2017, based on criteria established in Internal Control-Integrated Framework issued by the Committee of Sponsoring Organizations of the Treadway Commission (2013 framework) (the COSO criteria). In our opinion, Graphic Packaging Holding Company (the Company) maintained, in all material respects, effective internal control over financial reporting as of December 31, 2017, based on the COSO criteria.
As indicated in the accompanying Management’s Report on Internal Control Over Financial Reporting, management’s assessment of and conclusion on the effectiveness of internal control over financial reporting did not include the internal controls of Carton Craft Corporation, Norgraft Packaging, S.A., and Seydaco Packaging Corporation, which are included in the 2017 consolidated financial statements of the Company and constituted 5.1%, and 18.0% of total and net assets, respectively, as of December 31, 2017 and 1.0%, and 0.5% of net sales and net income, respectively, for the year then ended. Our audit of internal control over financial reporting of the Company also did not include an evaluation of the internal control over financial reporting of Carton Craft Corporation, Norgraft Packaging, S.A., and Seydaco Packaging Corporation.
We also have audited, in accordance with the standards of the Public Company Accounting Oversight Board (United States) (PCAOB), the consolidated balance sheets of Graphic Packaging Holding Company as of December 31, 2017 and 2016, and the related consolidated statements of operations, comprehensive income (loss), shareholders’ equity and cash flows for each of the three years in the period ended December 31, 2017, and the related notes (collectively referred to as the “financial statements”) and our report dated February 7, 2018 expressed an unqualified opinion thereon.
Basis for OpinionThe Company’s management is responsible for maintaining effective internal control over financial reporting and for its assessment of the effectiveness of internal control over financial reporting included in the accompanying Management’s Report on Internal Control Over Financial Reporting. Our responsibility is to express an opinion on the Company’s internal control over financial reporting based on our audit. We are a public accounting firm registered with the PCAOB and are required to be independent with respect to the Company in accordance with the U.S. federal securities laws and the applicable rules and regulations of the Securities and Exchange Commission and the PCAOB.
We conducted our audit in accordance with the standards of the PCAOB. Those standards require that we plan and perform the audit to obtain reasonable assurance about whether effective internal control over financial reporting was maintained in all material respects.
Our audit included obtaining an understanding of internal control over financial reporting, assessing the risk that a material weakness exists, testing and evaluating the design and operating effectiveness of internal control based on the assessed risk, and performing such other procedures as we considered necessary in the circumstances. We believe that our audit provides a reasonable basis for our opinion.
Definition and Limitations on Internal Control Over Financial ReportingA company’s internal control over financial reporting is a process designed to provide reasonable assurance regarding the reliability of financial reporting and the preparation of financial statements for external purposes in accordance with generally accepted accounting principles. A company’s internal control over financial reporting includes those policies and procedures that (1) pertain to the maintenance of records that, in reasonable detail, accurately and fairly reflect the transactions and dispositions of the assets of the company; (2) provide reasonable assurance that transactions are recorded as necessary to permit preparation of financial statements in accordance with generally accepted accounting principles, and that receipts and expenditures of the company are being made only in accordance with authorizations of management and directors of the company; and (3) provide reasonable assurance regarding prevention or timely detection of unauthorized acquisition, use, or disposition of the company’s assets that could have a material effect on the financial statements.
98
Because of its inherent limitations, internal control over financial reporting may not prevent or detect misstatements. Also, projections of any evaluation of effectiveness to future periods are subject to the risk that controls may become inadequate because of changes in conditions, or that the degree of compliance with the policies or procedures may deteriorate.
/s/ Ernst & Young LLP
Atlanta, GeorgiaFebruary 7, 2018
99
ITEM 9. CHANGES IN AND DISAGREEMENTS WITH ACCOUNTANTS ON ACCOUNTING AND FINANCIAL DISCLOSURE
None.
ITEM 9A. CONTROLS AND PROCEDURES
Evaluation of Disclosure Controls and Procedures
The Company’s management has established disclosure controls and procedures designed to ensure that information required to be disclosed by the Company in the reports that it files or submits under the Securities Exchange Act of 1934, as amended (the “Exchange Act”) is recorded, processed, summarized and reported within time periods specified in the Securities and Exchange Commission rules and forms. Such disclosure controls and procedures include, without limitation, controls and procedures designed to ensure that information required to be disclosed by the Company in the reports that it files or submits under the Exchange Act is accumulated and communicated to the Company’s management to allow timely decisions regarding required disclosure.
Based on management’s evaluation as of the end of the period covered by this Annual Report on Form 10-K, the Company’s Chief Executive Officer and Chief Financial Officer have concluded that the Company’s disclosure controls and procedures (as defined in Rules 13a-15(e) and 15d-15(e) promulgated under the Exchange Act) were effective as of the end of the period covered by this Annual Report on Form 10-K.
Management’s Report on Internal Control Over Financial Reporting
The Company’s management is responsible for establishing and maintaining adequate internal control over financial reporting for the Company, as such term is defined in Exchange Act Rule 13a-15(f). Internal control over financial reporting is a process designed to provide reasonable assurance regarding the reliability of financial reporting and the preparation of financial statements for external purposes in accordance with generally accepted accounting principles. Internal control over financial reporting includes those policies and procedures that (i) pertain to the maintenance of records that, in reasonable detail, accurately and fairly reflect the transactions and dispositions of the Company’s assets; (ii) provide reasonable assurance that transactions are recorded as necessary to permit preparation of the financial statements in accordance with generally accepted accounting principles, and that receipts and expenditures are being made only with proper authorizations; and (iii) provide reasonable assurance regarding prevention or timely detection of unauthorized acquisition, use or disposition of the Company’s assets that could have a material effect on the financial statements.
Because of its inherent limitations, internal control over financial reporting may not prevent or detect misstatements. Also, projections of any evaluation of effectiveness to future periods are subject to the risk that controls may become inadequate because of changes in conditions, or that the degree of compliance with the policies or procedures may deteriorate. The Company's management did not include the internal controls of the North American and European Acquisitions in 2017, which are included in the Company's results for the year-end December 31, 2017.
The Company’s management, under the supervision of and with the participation of the President and Chief Executive Officer and the Chief Financial Officer, assessed the effectiveness of the Company’s internal control over financial reporting as of December 31, 2017 based on criteria for effective control over financial reporting described in Internal Control — Integrated Framework issued by the Committee of Sponsoring Organizations of the Treadway Commission (2013 framework). Based on this assessment, the Company’s management concluded that its internal control over financial reporting was effective as of December 31, 2017.
The effectiveness of the Company’s internal control over financial reporting as of December 31, 2017 has been audited by Ernst & Young LLP, an independent registered public accounting firm, as stated in their report which appears herein.
Changes in Internal Control Over Financial Reporting
None.
100
ITEM 9B. OTHER INFORMATION
None.PART III
ITEM 10. DIRECTORS, EXECUTIVE OFFICERS AND CORPORATE GOVERNANCE
Pursuant to Instruction G(3) to Form 10-K, the information relating to Directors of the Registrant, compliance with Section 16(a) of the Exchange Act, compliance with the Company’s Code of Ethics, and certain other information required by Item 10 is incorporated by reference to the Registrant’s definitive Proxy Statement for the 2018 Annual Meeting of Stockholders, which is to be filed pursuant to Regulation 14A within 120 days after the end of the Registrant’s fiscal year ended December 31, 2017.
ITEM 11. EXECUTIVE COMPENSATION
Pursuant to Instruction G(3) to Form 10-K, the information required by Item 11 is incorporated by reference to the Registrant’s definitive Proxy Statement for the 2018 Annual Meeting of Stockholders, which is to be filed pursuant to Regulation 14A within 120 days after the end of the Registrant’s fiscal year ended December 31, 2017.
ITEM 12. SECURITY OWNERSHIP OF CERTAIN BENEFICIAL OWNERS AND MANAGEMENT AND RELATED STOCKHOLDER MATTERS
Pursuant to Instruction G(3) to Form 10-K, the information required by Item 12 is incorporated by reference to the Registrant’s definitive Proxy Statement for the 2018 Annual Meeting of Stockholders, which is to be filed pursuant to Regulation 14A within 120 days after the end of the Registrant’s fiscal year ended December 31, 2017.
ITEM 13. CERTAIN RELATIONSHIPS AND RELATED TRANSACTIONS, AND DIRECTOR INDEPENDENCE
Pursuant to Instruction G(3) to Form 10-K, the information required by Item 13 is incorporated by reference to the Registrant’s definitive Proxy Statement for the 2018 Annual Meeting of Stockholders, which is to be filed pursuant to Regulation 14A within 120 days after the end of the Registrant’s fiscal year ended December 31, 2017.
ITEM 14. PRINCIPAL ACCOUNTANT FEES AND SERVICES
Pursuant to Instruction G(3) to Form 10-K, the information required by Item 14 is incorporated by reference to the Registrant’s definitive Proxy Statement for the 2017 Annual Meeting of Stockholders, which is to be filed pursuant to Regulation 14A within 120 days after the end of the Registrant’s fiscal year ended December 31, 2017.
PART IV
ITEM 15. EXHIBITS AND FINANCIAL STATEMENT SCHEDULES
a. Financial statements, financial statement schedule and exhibits filed as part of this report:
1. Consolidated Statements of Operations for each of the three years in the period ended December 31, 2017
Consolidated Statements of Comprehensive Income for each of the three years in the period ended December 31, 2017
Consolidated Balance Sheets as of December 31, 2017 and 2016
Consolidated Statements of Shareholders’ Equity for each of the three years in the period ended December 31, 2017
Consolidated Statements of Cash Flows for each of the three years in the period ended December 31, 2017
101
Notes to Consolidated Financial Statements
Reports of Independent Registered Public Accounting Firm
2. All schedules are omitted as the information required is either included elsewhere in the consolidated financial statements herein or is not applicable.
3. Exhibits to Annual Report on Form 10-K for Year Ended December 31, 2017.
ExhibitNumber Description
2.1 Transaction Agreement dated October 23, 2017, by and among International Paper Company, Graphic PackagingHolding Company, Gazelle Newco LLC and Graphic Packaging International, Inc. Filed as Exhibit 2.1 to theRegistrant’s Current Report on Form 8-K filed on October 24, 2017 and incorporated herein by reference.
3.1 Restated Certificate of Incorporation of New Giant Corporation. Filed as Exhibit 3.1 to Graphic PackagingHolding Company’s Current Report on Form 8-K filed on March 10, 2008 and incorporated herein by reference.
3.2 Bylaws of Graphic Packaging Holding Company, as amended on May 20, 2015. Filed as Exhibit 3.1 to GraphicPackaging Holding Company’s Current Report on Form 8-K filed on May 27, 2015 and incorporated herein byreference.
3.3 Certificate of Designation Preferences and Rights of Series A Junior Participating Preferred Stock. Filed asExhibit 3.3 to Graphic Packaging Holding Company’s Current Report on Form 8-K filed on March 10, 2008 andincorporated herein by reference.
3.4 Certificate of Formation of Graphic Packaging International, LLC. Filed as Exhibit 3.1 to the Registrant’s CurrentReport on Form 8-K filed on January 1, 2018 and incorporated herein by reference.
3.5 Amended and Restated Limited Liability Company Operating Agreement of Graphic Packaging International,LLC. Filed as Exhibit 3.2 to the Registrant’s Current Report on Form 8-K filed on January 1, 2018 andincorporated herein by reference.
4.1 Rights Agreement entered into between Graphic Packaging Holding Company and Wells Fargo Bank, NationalAssociation. Filed as Exhibit 4.3 to Graphic Packaging Holding Company’s Current Report on Form 8-K filed onMarch 10, 2008 and incorporated herein by reference.
4.2 Indenture, dated as of September 29, 2010, among Graphic Packaging International, Inc. and Graphic PackagingHolding Company, Graphic Packaging Corporation and the other Note Guarantors party thereto, as NoteGuarantors, and U.S. Bank National Association, as Trustee. Filed as Exhibit 4.1 to Graphic Packaging HoldingCompany’s Current Report on Form 8-K filed on September 29, 2010 and incorporated herein by reference.
4.3 Supplemental Indenture, dated as of April 2, 2013, among Graphic Packaging International, Inc., the guarantorsnamed therein and U.S. Bank National Association, as Trustee, relating to the 4.75% Senior Notes due 2021 ofGraphic Packaging International, Inc. Filed as Exhibit 4.1 to Graphic Packaging Holding Company’s CurrentReport on Form 8-K filed on April 2, 2013 and incorporated herein by reference.
4.4 Indenture dated as of November 6, 2014, by and among Graphic Packaging International, Inc., the guarantorsnamed therein and U.S. Bank National Association, as trustee. Filed as Exhibit 4.1 to the Registrant's CurrentReport on Form 8-K filed on November 6, 2014 and incorporated herein by reference.
4.5 First Supplemental Indenture dated as of November 6, 2014 by and among Graphic Packaging International, Inc.the guarantors named therein and U.S. Bank National Association, as trustee. Filed as Exhibit 4.2 to theRegistrant's Current Report on Form 8-K filed on November 6, 2014 and incorporated herein by reference.
4.6 Second Supplemental Indenture dated as of August 11, 2016 by and among Graphic Packaging International Inc.,Graphic Packaging Holding Company, the other guarantors named therein and U.S. Bank National Association astrustee. Filed as Exhibit 4.2 to the Registrant's Current Report on Form 8-K filed on August 11, 2016 andincorporated herein by reference.
4.7 First Amendment to Rights Agreement, dated as of October 23, 2017 by and between Graphic Packaging HoldingCompany and Wells Fargo Bank, National Association. Filed as Exhibit 4.1 to the Registrant’s Current Report onForm 8-K filed on October 24, 2017 and incorporated herein by reference.
10.1* GPI U.S. Consolidated Pension Plan Master Document as amended and restated, effective January 1, 2017. Filedas exhibit 10.1 to the Registrant's Annual Report on Form 10-K filed on February 8, 2017 and incorporated hereinby reference.
102
10.2* Second Amendment to the GPI Savings Plan as amended and restated, effective January 1, 2015. Filed as Exhibit10.1 to the Registrant's Quarterly Report on Form 10-Q filed on April 28, 2016 and incorporated herein byreference.
10.3* Third Amendment to the GPI Savings Plan as amended and restated, effective January 1, 2015. Filed as Exhibit10.2 to the Registrant's Quarterly Report on Form 10-Q filed on April 28, 2016 and incorporated herein byreference.
10.4* Employment Agreement, dated as of July 22, 2013 by and among Graphic Packaging International, Inc., theRegistrant and Carla J. Chaney. Filed as Exhibit 10.1 to the Registrant’s Current Report on Form 8-K filed on July23, 2013 and incorporated herein by reference.
10.5* Employment Agreement, dated as of October 26, 2009, by and among Graphic Packaging International, Inc., theRegistrant and Alan Nichols. Filed as Exhibit 10.7 to the Registrant’s Current Report on Form 8-K filed onJanuary 22, 2010 and incorporated herein by reference.
10.6* Fourth Amendment to the GPI Savings Plan as amended and restated, effective January 1, 2015. Filed as Exhibit10.3 to the Registrant's Quarterly Report on Form 10-Q filed on April 28, 2016 and incorporated herein byreference.
10.7* Amended and Restated Employment Agreement dated as of November 19, 2015 by and among Graphic PackagingInternational, Inc., the Registrant and Michael P. Doss. Filed as Exhibit 10.1 to the Registrant's Current Report onForm 8-K filed on November 19, 2015 and incorporated herein by reference.
10.8* Graphic Packaging Excess Benefit Plan, as amended and restated, effective as of January 1, 2009. Filed asExhibit 10.22 to Registrant’s Annual Report on Form 10-K filed on February 23, 2010 and incorporated herein byreference.
10.9* Graphic Packaging Supplemental Retirement Plan, as amended and restated, effective as of January 1, 2009. Filedas Exhibit 10.23 to Registrant’s Annual Report on Form 10-K filed on February 23, 2010 and incorporated hereinby reference.
10.10 Form of Indemnification Agreement, dated as of September 10, 2003, entered into by and among Registrant, GPIHolding, Inc., Graphic Packaging International, Inc. and each of Jeffrey H. Coors, Stephen M. Humphrey, Kevin J.Conway, G. Andrea Botta, John D. Beckett, Harold R. Logan, Jr., John R. Miller, Robert W. Tieken, B. CharlesAmes (as emeritus director) and William K. Coors (as emeritus director). Filed as Exhibit 10.30 to GraphicPackaging Corporation’s Annual Report on Form 10-K filed on March 16, 2004 and incorporated herein byreference.
10.11* Amended and Restated 2004 Stock and Incentive Compensation Plan effective May 19, 2011. Filed as Appendix Ato the Registrant’s Definitive Proxy Statement on Schedule 14A filed on April 8, 2011 and incorporated herein byreference.
10.12* Graphic Packaging Holding Company 2014 Omnibus Stock and Incentive Compensation Plan effective as of May21, 2014. Filed as Appendix A to the Registrant's Definitive Proxy Statement on Schedule 14A filed on April 10,2014 and incorporated herein by reference.
10.13* Graphic Packaging International, Inc. Management Incentive Plan filed as Exhibit 10.32 to the Registrant's AnnualReport on Form 10-K filed on February 23, 2012 and incorporated herein by reference.
10.14 Master Services Agreement dated November 29, 2007 by and between Graphic Packaging International, Inc. andPerot Systems Corporation. Filed as Exhibit 10.1 to the Registrant's Current Report on Form 8-K filed onDecember 5, 2007 and incorporate herein by reference.
10.15* Graphic Packaging International, Inc. Supplemental Plan for Participants in the Riverwood InternationalEmployees Retirement Plan, as amended and restated, effective as of January 1, 2009. Filed as Exhibit 10.36 to theRegistrant’s Annual Report on Form 10-K filed on February 23, 2010 and incorporated herein by reference.
10.16* Riverwood International Change in Control Supplemental Retirement Plan, as amended and restated, effective asof January 1, 2008. Filed as Exhibit 10.37 to Graphic Packaging Holding Company’s Annual Report on Form 10-Kfiled on February 23, 2010 and incorporated herein by reference.
10.17 Amended and Restated Form of Indemnification Agreement for Directors. Filed as Exhibit 10.1 to the Registrant’sQuarterly Report on Form 10-Q filed on November 4, 2010 and incorporated herein by reference.
10.18* Graphic Packaging International, Inc. Non-Qualified Deferred Compensation Plan filed as Exhibit 10.44 to theRegistrant’s Annual Report on Form 10-K filed on February 23, 2012 and incorporated herein by reference.
10.19* First Amendment to the Graphic Packaging International, Inc. Supplemental Plan for Participants in the RiverwoodInternational Employees Retirement Plan. Filed as Exhibit 10.1 to the Registrant's Current Report on Form 8-Kfiled on May 24, 2012 and incorporated herein by reference.
10.20* Employment Agreement dated as of April 1, 2012 by and among Graphic Packaging International, Inc., GraphicPackaging Holding Company and Stephen Scherger. Filed as Exhibit 10.1 to the Registrant's Current Report onForm 8-K filed on April 5, 2012 and incorporated herein by reference.
103
10.21 Second Amended and Restated Credit Agreement effective October 2, 2014 among Graphic PackagingInternational, Inc. and certain of its subsidiaries, as Borrowers; Bank of American, N.A. as Administrative Agent,L/C Issuer, Swing Line Lender, Swing Line Euro Tranche Lender and Alternative Currency Funding FrontingLender; Cooperative Centrale Raiffeisen-Boerenleenbank B.A., "Rabobank Nederland" New York Branch,SunTrust Bank, JPMorgan Bank, N.A. and Citibank, N.A., as Co-Syndication Agents; Compass Bank, asDocumentation Agent; and several lenders from time to time parties thereto. Filed as Exhibit 10.1 to theRegistrant's Current Report on Form 8-K filed on October 7, 2014 and incorporated herein by reference.
10.22 First Amendment to Master Services Agreement dated as of September 22, 2008 by and between GraphicPackaging International, Inc. and Perot Systems Corporation.
10.23 Second Amendment to Master Services Agreement effective as of August 1, 2012 by and between GraphicPackaging International, Inc. and Dell Marketing L.P. (as assignee of Perot Systems Corporation).
10.24* Fifth Amendment to the GPI Savings Plan as amended and restated, effective January 1, 2015. Filed as exhibit10.24 to the Registrant's Annual Report on Form 10-K filed on February 8, 2017 and incorporated herein byreference.
10.25* GPI Savings Plan, as amended and restated effective January 1, 2015. Filed as Exhibit 10.32 to the Registrant’sAnnual Report on Form 10-K filed on February 12, 2016 and incorporated herein by reference.
10.26* First Amendment to the GPI Savings Plan, effective January 1, 2015. Filed as Exhibit 10.33 to the Registrant’sAnnual Report on Form 10-K filed on February 12, 2016 and incorporated herein by reference.
10.27* First Amendment to the Graphic Packaging International, Inc. Non-Qualified Deferred Compensation Plan,effective January 31, 2012. Filed as Exhibit 10.34 to the Registrant’s Annual Report on Form 10-K filed onFebruary 12, 2016 and incorporated herein by reference.
10.28* Second Amendment to the Graphic Packaging International, Inc. Non-Qualified Deferred Compensation Plan,executed on December 30, 2013. Filed as Exhibit 10.35 to the Registrant’s Annual Report on Form 10-K filed onFebruary 12, 2016 and incorporated herein by reference.
10.29* Third Amendment to the Graphic Packaging International, Inc. Non-Qualified Deferred Compensation Plan,effective June 23, 2014. Filed as Exhibit 10.36 to the Registrant’s Annual Report on Form 10-K filed on February12, 2016 and incorporated herein by reference.
10.30* Fourth Amendment to the Graphic Packaging International Inc. Non-Qualified Deferred Compensation Plan,effective January 1, 2016. Filed as Exhibit 10.37 to the Registrant’s Annual Report on Form 10-K filed onFebruary 12, 2016 and incorporated herein by reference.
10.31* Amended and Restated Employment Agreement among the Registrant, Graphic Packaging International, Inc. andJoseph P. Yost effective September 1, 2015. Filed as Exhibit 10.38 to the Registrant’s Annual Report on Form 10-K filed on February 12, 2016 and incorporated herein by reference.
10.32* Graphic Packaging International, Inc. Executive Severance Plan dated as of February 25, 2014. Filed as Exhibit10.39 to the Registrant’s Annual Report on Form 10-K filed on February 12, 2016 and incorporated herein byreference.
10.33* First Amendment to the Graphic Packaging Holding Company 2014 Omnibus Stock and Incentive CompensationPlan effective January 1, 2017. Filed as exhibit 10.33 to the Registrant's Annual Report on Form 10-K filed onFebruary 8, 2017 and incorporated herein by reference.
10.34 Local Country Agreement - European Union Addendum effective as of November 1, 2016 to the Master ServicesAgreement between Graphic Packaging International, Inc. and Dell Marketing, L.P., as amended. Filed as Exhibit10.1 to the Registrant’s Quarterly Report on Form 10-Q filed on April 26, 2017 and incorporated herein byreference.
10.35 Third Amendment to Master Services Agreement dated as of November 1, 2016 between Graphic PackagingInternational, Inc. and Dell Marketing, L.P. Filed as Exhibit 10.2 to the Registrant’s Quarterly Report on Form 10-Q filed on April 26, 2017 and incorporated herein by reference.
10.36 Fourth Amendment to Master Services Agreement dated as of March 1, 2017 between Graphic PackagingInternational, Inc. and NTT DATA Services, LLC, as successor-in-interest to Dell Marketing, L.P. Filed as Exhibit10.3 to the Registrant’s Quarterly Report on Form 10-Q filed on April 26, 2017 and incorporated herein byreference.
10.37* First Amendment to the GPI US Consolidated Pension Plan, dated as of May 19, 2017 and effective as of January1, 2017. Filed as Exhibit 10.1 to the Registrant’s Quarterly Report on Form 10-Q filed on July 26, 2017 andincorporated herein by reference.
10.38* Sixth Amendment to the GPI Savings Plan, dated as of June 27, 2017 and effective as of January 1, 2015. Filed asExhibit 10.2 to the Registrant’s Quarterly Report on Form 10-Q filed on July 26, 2017 and incorporated herein byreference.
104
10.39 Supplemental Indenture among Graphic Packaging International, Inc., Graphic Packaging Holding Company, theother guarantors party thereto and U.S. Bank National Association, as Trustee, with respect to the 4.75% SeniorNotes due 2021. Filed as Exhibit 10.1 to the Registrant’s Current Report on Form 8-K filed on October 24, 2017and incorporated herein by reference.
10.40 Supplemental Indenture among Graphic Packaging International, Inc., Graphic Packaging Holding Company, theother guarantors party thereto and U.S. Bank National Association, as Trustee, with respect to the 4.875% SeniorNotes due 2022. Filed as Exhibit 10.2 to the Registrant’s Current Report on Form 8-K filed on October 24, 2017and incorporated herein by reference.
10.41 Supplemental Indenture among Graphic Packaging International, Inc., Graphic Packaging Holding Company, theother guarantors party thereto and U.S. Bank National Association, as Trustee, with respect to the 4.125% SeniorNotes due 2024. Filed as Exhibit 10.3 to the Registrant’s Current Report on Form 8-K filed on October 24, 2017and incorporated herein by reference.
10.42* Graphic Packaging International, Inc. Non-Qualified Deferred Compensation Plan, as amended and restatedeffective November 1, 2017. Filed as Exhibit 10.1 to the Registrant’s Quarterly Report on Form 10-Q filed onOctober 25, 2017 and incorporated herein by reference.
10.43 Amended and Restated Limited Liability Company Agreement dated as of January 1, 2018 by and among GraphicPackaging Holding Company, Graphic Packaging International Partners, LLC (formerly known as Gazelle NewcoLLC), GPI Holding III, LLC, and International Paper Company. Filed as Exhibit 10.1 to the Registrant’s CurrentReport on Form 8-K filed on January 1, 2018 and incorporated herein by reference.
10.44 Exchange Agreement dated as of January 1, 2018 by and among Graphic Packaging Holding Company, GraphicPackaging International Partners, LLC (formerly known as Gazelle Newco LLC), GPI Holding III, LLC andInternational Paper Company. Filed as Exhibit 10.2 to the Registrant’s Current Report on Form 8-K filed onJanuary 1, 2018 and incorporated herein by reference.
10.45 Governance Agreement dated as of January 1, 2018 by and among Graphic Packaging Holding Company,Grapohic Packaging International Partners, LLC (formerly known as Gazelle Newco LLC), and InternationalPaper Company. Filed as Exhibit 10.3 to the Registrant’s Current Report on Form 8-K filed on January 1, 2018 andincorporated herein by reference.
10.46 Tax Receivable Agreement dated as of January 1, 2018 by and among Graphic Packaging Holding Company,Graphic Packaging International Partners, LLC (formerly known as Gazelle Newco LLC), GPI Holding III, LLCand International Paper Company. Filed as Exhibit 10.4 to the Registrant’s Current Report on Form 8-K filed onJanuary 1, 2018 and incorporated herein by reference.
10.47 Registration Rights Agreement dated as of January 1, 2018 by and between Graphic Packaging Holding Companyand International Paper Company. Filed as Exhibit 10.5 to the Registrant’s Current Report on Form 8-K filed onJanuary 1, 2018 and incorporated herein by reference.
10.48 Restrictive Covenants Agreement dated as of January 1, 2018 by and between Graphic Packaging InternationalPartners, LLC (formerly known as Gazelle Newco LLC) and International Paper Company. Filed as Exhibit 10.6to the Registrant’s Current Report on Form 8-K filed on January 1, 2018 and incorporated herein by reference.
10.49 Third Amended and Restated Credit Agreement dated as of January 1, 2018 by and among Graphic PackagingInternational, LLC and certain subsidiaries thereof as Borrowers, the lenders and agents named therein, and Bankof America, N.A., as Administrative Agent. Filed as Exhibit 10.7 to the Registrant’s Current Report on Form 8-Kfiled on January 1, 2018 and incorporated herein by reference.
10.50 Amended and Restated Credit Agreement dated as of January 1, 2018 and effective as of January 8, 2018 by andamong Graphic Packaging International, LLC, the lenders and agents named therein and Bank of America, N.A.,as Administrative Agent. Filed as Exhibit 10.8 to the Registrant’s Current Report on Form 8-K filed on January 1,2018 and incorporated herein by reference.
10.51* First Amendment to the Amended and Restated Graphic Packaging International, Inc. Non-Qualified DeferredCompensation Plan effective January 1, 2018.
10.52* Second Amendment to the GPI US Consolidated Pension Plan effective as of December 31, 2017.10.53* Third Amendment to the GPI US Consolidated Pension Plan effective as of January 1, 2018.10.54* Seventh Amendment to the GPI Savings Plan effective as of January 1 2018.10.55* Eighth Amendment to the GPI Savings Plan effective as of January 1, 2018.
14.1 Code of Business Conduct and Ethics. Filed as Exhibit 14.1 to the Company's Annual Report on Form 10-K filedon March 8, 2011 and incorporated herein by reference.
21.1 List of Subsidiaries.
23.1 Consent of Independent Registered Public Accounting Firm.
24.1 Power of Attorney Incorporated by reference to the signature page of this Annual Report on Form 10-K.

105
31.1 Certification required by Rule 13a-14(a).
31.2 Certification required by Rule 13a-14(a).
32.1 Certification required by Section 1350 of Chapter 63 of Title 18 of the United States Code.
32.2 Certification required by Section 1350 of Chapter 63 of Title 18 of the United States Code.
____________* Executive compensation plan or agreement
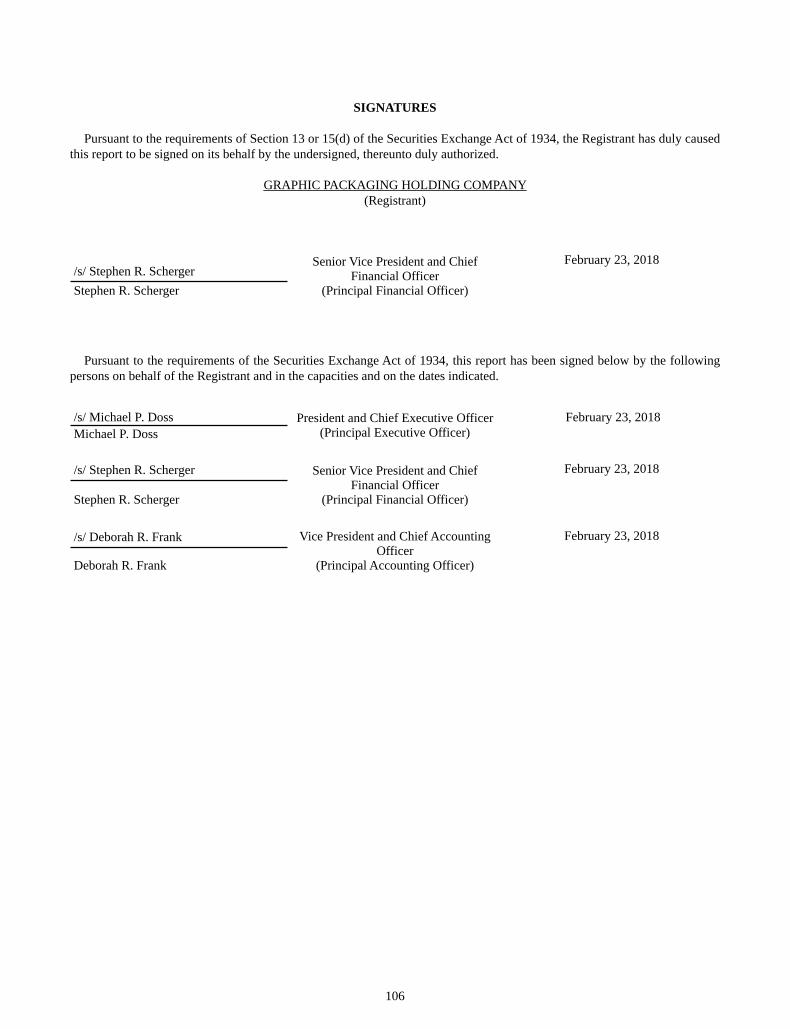
106
SIGNATURES
Pursuant to the requirements of Section 13 or 15(d) of the Securities Exchange Act of 1934, the Registrant has duly caused this report to be signed on its behalf by the undersigned, thereunto duly authorized.
GRAPHIC PACKAGING HOLDING COMPANY(Registrant)
/s/ Stephen R. SchergerSenior Vice President and Chief
Financial Officer (Principal Financial Officer)
February 23, 2018
Stephen R. Scherger
Pursuant to the requirements of the Securities Exchange Act of 1934, this report has been signed below by the following persons on behalf of the Registrant and in the capacities and on the dates indicated.
/s/ Michael P. Doss President and Chief Executive Officer(Principal Executive Officer)
February 23, 2018Michael P. Doss
/s/ Stephen R. Scherger Senior Vice President and Chief Financial Officer
(Principal Financial Officer)
February 23, 2018
Stephen R. Scherger
/s/ Deborah R. Frank Vice President and Chief Accounting Officer
(Principal Accounting Officer)
February 23, 2018
Deborah R. Frank
107
Signatures Title Date
* Director February 23, 2018G. Andrea Botta
* Director February 23, 2018David D. Campbell
* Director February 23, 2018Paul D. Carrico
* Director, President and Chief Executive Officer February 23, 2018Michael P. Doss
* Director February 23, 2018Robert A. Hagemann
* Director February 23, 2018Peter Kelly
* Chairman of the Board February 23, 2018Philip R. Martens
* Director February 23, 2018Larry M. Venturelli
* Director February 23, 2018Lynn A. Wentworth
* By: /s/ Lauren S. TashmaLauren S. TashmaAttorney-in-Fact, pursuant to Power of Attorney dated February 7, 2018

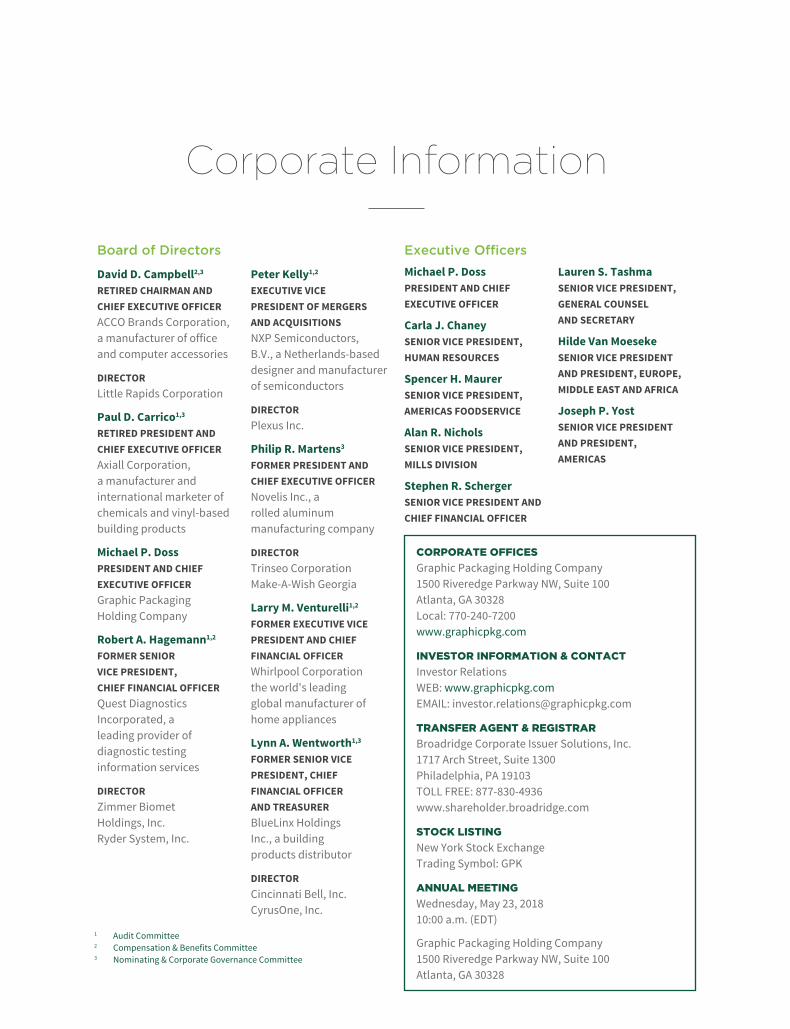
Board of Directors
David D. Campbell2,3 RETIRED CHAIRMAN AND CHIEF EXECUTIVE OFFICER ACCO Brands Corporation, a manufacturer of office and computer accessories
DIRECTOR Little Rapids Corporation
Paul D. Carrico1,3 RETIRED PRESIDENT AND CHIEF EXECUTIVE OFFICER Axiall Corporation, a manufacturer and international marketer of chemicals and vinyl-based building products
Michael P. Doss PRESIDENT AND CHIEF EXECUTIVE OFFICER Graphic Packaging Holding Company
Robert A. Hagemann1,2
FORMER SENIOR VICE PRESIDENT, CHIEF FINANCIAL OFFICER Quest Diagnostics Incorporated, a leading provider of diagnostic testing information services
DIRECTOR Zimmer Biomet Holdings, Inc. Ryder System, Inc.
Peter Kelly1,2 EXECUTIVE VICE PRESIDENT OF MERGERS AND ACQUISITIONS NXP Semiconductors, B.V., a Netherlands-based designer and manufacturer of semiconductors
DIRECTOR Plexus Inc.
Philip R. Martens3 FORMER PRESIDENT AND CHIEF EXECUTIVE OFFICER Novelis Inc., a rolled aluminum manufacturing company
DIRECTOR Trinseo Corporation Make-A-Wish Georgia
Larry M. Venturelli1,2 FORMER EXECUTIVE VICE PRESIDENT AND CHIEF FINANCIAL OFFICER Whirlpool Corporation the world's leading global manufacturer of home appliances
Lynn A. Wentworth1,3 FORMER SENIOR VICE PRESIDENT, CHIEF FINANCIAL OFFICER AND TREASURER BlueLinx Holdings Inc., a building products distributor
DIRECTOR Cincinnati Bell, Inc. CyrusOne, Inc.
1 Audit Committee2 Compensation & Benefits Committee3 Nominating & Corporate Governance Committee
CORPORATE OFFICESGraphic Packaging Holding Company 1500 Riveredge Parkway NW, Suite 100 Atlanta, GA 30328 Local: 770-240-7200 www.graphicpkg.com
INVESTOR INFORMATION & CONTACTInvestor Relations WEB: www.graphicpkg.com EMAIL: [email protected]
TRANSFER AGENT & REGISTRARBroadridge Corporate Issuer Solutions, Inc. 1717 Arch Street, Suite 1300 Philadelphia, PA 19103 TOLL FREE: 877-830-4936 www.shareholder.broadridge.com
STOCK LISTINGNew York Stock Exchange Trading Symbol: GPK
ANNUAL MEETINGWednesday, May 23, 2018 10:00 a.m. (EDT)
Graphic Packaging Holding Company 1500 Riveredge Parkway NW, Suite 100 Atlanta, GA 30328
Corporate Information
Executive OfficersMichael P. Doss PRESIDENT AND CHIEF EXECUTIVE OFFICER
Carla J. Chaney SENIOR VICE PRESIDENT, HUMAN RESOURCES
Spencer H. Maurer SENIOR VICE PRESIDENT, AMERICAS FOODSERVICE
Alan R. Nichols SENIOR VICE PRESIDENT, MILLS DIVISION
Stephen R. Scherger SENIOR VICE PRESIDENT AND CHIEF FINANCIAL OFFICER
Lauren S. Tashma SENIOR VICE PRESIDENT, GENERAL COUNSEL AND SECRETARY
Hilde Van Moeseke SENIOR VICE PRESIDENT AND PRESIDENT, EUROPE, MIDDLE EAST AND AFRICA
Joseph P. Yost SENIOR VICE PRESIDENT AND PRESIDENT, AMERICAS
1500 Riveredge Parkway NW Suite 100Atlanta, GA 30328
www.graphicpkg.com