Embed Size (px)
Citation preview
Changesin the Food Sector
after the Enlargementof the EU
THE ECONOMIC AND SOCIAL CONDITIONS
OF THE DEVELOPMENT OF THE POLISH FOOD
ECONOMY FOLLOWING POLAND`S ACCESSION
TO THE EUROPEAN UNION
INSTITUTE OF AGRICULTURALA N D F O O D E C O N O M I C SNATIONAL RESEARCH INSTITUTE
no 57.1Warsaw 2007
Mul
ti-A
nnua
l Pro
gram
me
20
05
-20
09
nr
57
.1
Changesin the Food Sector
after the Enlargementof the EU
�
Warsaw 2007
Changesin the Food Sector
after the Enlargementof the EU
�
The study was part of the research project: The Polish Food Sector in the First Years of Membership („Polski sektor żywnościowy w pierwszych latach członkostwa”) Within the framework of the tasks: The assessment of the Polish food economy following Poland’s accession to the EU („Ocena stanu polskich gospodarki żywnościowej po wejściu Polski do UE”) The impact assessment of the common agricultural policy on agricultural markets („Ocena wpływu Wspólnej Polityki Rolnej na rynki rolne”) The assessment of changes in the competitiveness of Polish food producers in the common European market and in market of third countries („Ocena zmian konkurencyjności polskich producentów żywności na wspólnym rynku europejskim i na rynkach innych krajów”) The impact of the European Union structural funds on rural development in the first years of membership. The general concept of rural development support from structural funds and the Cohesion Fund in 2007-2013 („Wpływ funduszy strukturalnych Unii Europejskiej na rozwój regionów wiejskich w pierwszych latach członkostwa. Ogólna koncepcja wsparcia tego rozwoju w latach 2007-2013 środkami funduszy strukturalnych i funduszu kohezji”) Within the framework of the tasks: The analysis of the implementation and outcomes of the PROW and SPO programmes (Program Rozwoju Obszarów Wiejskich – Rural Development Programme, Sektorowy Program Operacyjny “Restrukturyzacja i modernizacja sektora żywnościowego i rozwój obszarów Wiejskich – the Sectoral Operational Programme for the “Restructuring and modernization of the food sector and rural development’) („Analiza przebiegu realizacji i skutków programów PROW i SOP”) The concept of rural development support from structural funds and the Cohesion Fund in 2007-2013 („Koncepcja wsparcia w latach 2007-2013 rozwoju regionów wiejskich środkami funduszy strukturalnych i funduszu kohezji”) The aim of the study is recognition and identification the events that occurred during 2001-2006 in food sector of EU New Member States while integrating into the European Union. Translation polish articles into English and editing Dr. Witold Czartoryski Compiuting Anna Staszczak Technical editor Leszek Ślipski Cover Project AKME Projekty Sp. z.o.o. ISBN 978-83-89666-94-9 Instytut Ekonomiki Rolnictwa i Gospodarki Żywnościowej – Państwowy Instytut Badawczy 00-950 Warszawa, ul. Świętokrzyska 20, skr. poczt. nr 984 tel.: (0⋅ prefiks⋅ 22) 50 54 444 faks: (0⋅ prefiks⋅ 22) 827 19 60 e-mail: [email protected] http://www.ierigz.waw.pl

COPY FREE
Print run: 250 copies Print: Dział Wydawnictw IERiGŻ-PIB
Contents
Introduction …………………………………………………………...…………Prof. Dr. Roman Urban
7
The Condition of the Polish Food Economy Following the Accession to the European Union ……………………..…….….
Dr. Eng. Robert Mroczek, Prof. Dr. Roman Urban
11
Impact of the Common Agricultural Policy upon the Agricultural Markets in Poland …………………………...…………
Dr. Sławomir Gburczyk
21
Competitiveness of the Polish Food Sector after the Accession to the European Union …………………………...……….
Dr. Iwona Szczepaniak
30
Public Resources as the Source for Funding Investments in the Polish Food Industry ……………………………………………………..
Dr. Marek Wigier
41
Significance of EU Co-Financed Programmes for the Polish Food Economy and Rural Areas ………………….…………….
Dr. Janusz Rowiński
49
Food Industry in the Czech Republic …………………………....……………..
Doc. Eng. Dušan Vaněk, Ph. D., Eng. JUDr. Josef Mezera, CSc., Eng. Lenka Mejstříková
67
EU Integration Experiences of the Agri-Food Sector in Hungary ……...……
Dr. Norbert Potori, Dr. Levente Nyárs
94
The State of Agriculture in Slovakia – Three Years after EU Accession ……
Doc. Eng. Gejza Blaas CSc., Eng. Marian Božík PhD
122
Bulgarian Food Industry in the Pre-Accession Period: Trends and Challenges ……….…………………………………………………
Dr. Tsvetana Kovacheva, Dr. Izide Petrova Dr. Nona Malamova, Dr. Plamena Yovchevska
146
The Romanian Agri-Food Sector – How Well is it Prepared to Join the EU? …………………………………….
Prof. Dr. Dinu Gavrilescu Dr. Dan Marius Voicilas
159
Development of the Food Sector after Lithuania Joined the EU ……………..
Dr. R. Melnikienė, A. Gapšys, T. Petuchova, D. Mikelionytė Dr. V. Bradūnas, Dr. V. Vaikutis, I. Lukošiutė, A. Motova
183
The Impact of EU Accession on Latvia’s Food Sector ………………………..
Dr. Inguna Gulbe, Dr. Ligita Melece, Juris Hazners Ph.D. Csaba Jansik
226
The Agri-Food Sector in Slovenia after European Union Accession ………...
Dr. Tina Volk, Dr. Miroslav Rednak Dr. Emil Erjavec
244
7
Introduction
The present publication contains materials prepared for the Conference on
"Changes in the Food Sector after EU Enlargement" organised by IERiGŻ-PIB within the scope of the Multi-Annual Programme in Wigry [Poland] on 13-16 June 2007. The purpose of the Conference is to review and identify the phenomena that appeared in the food sector of the new EU member states in the years 2001-2006, which was a period of becoming integrated with the Union, but also to assess the degree of persistence of these phenomena, similarities and differences between these countries, and their conditioning by local (and regional) and global factors. The subject matter of the Conference will also consist of the discussion concerning the impact of the CAP and of the processes of liberalisation and globalisation exerted upon agriculture and the food industry of the 12 new member states.
The basis for the identification and assessment of the adaptation of the food sector to integration with the European Union consists of the presentations of the condition and developments of that sector in the new EU member states during the period of their integration with the EU-15. In the presentations, the representatives of the new member states have presented, in particular:
• Changes of domestic demand for food and beverages; • Developments in foreign trade in agricultural and food products, especially
with other EU countries; • Changes in the level and structure of output and supply of agricultural products; • Changes in pricing of agricultural products and changes of retail prices of food; • Developments in the industrial production of food and beverages (its pace,
directions of change, transformations of production structures); • The degree of adaptation of processing industry enterprises to EU standards
and the application of food safety assurance systems; • The level and change dynamics of investment in the food industry, including
foreign investment and sources of financing; • The condition and the changes of structure of companies in the food industry,
including the role of small and medium size enterprises; • The role of public support (including structural funds) in the process of evolution
of the food sector.
8
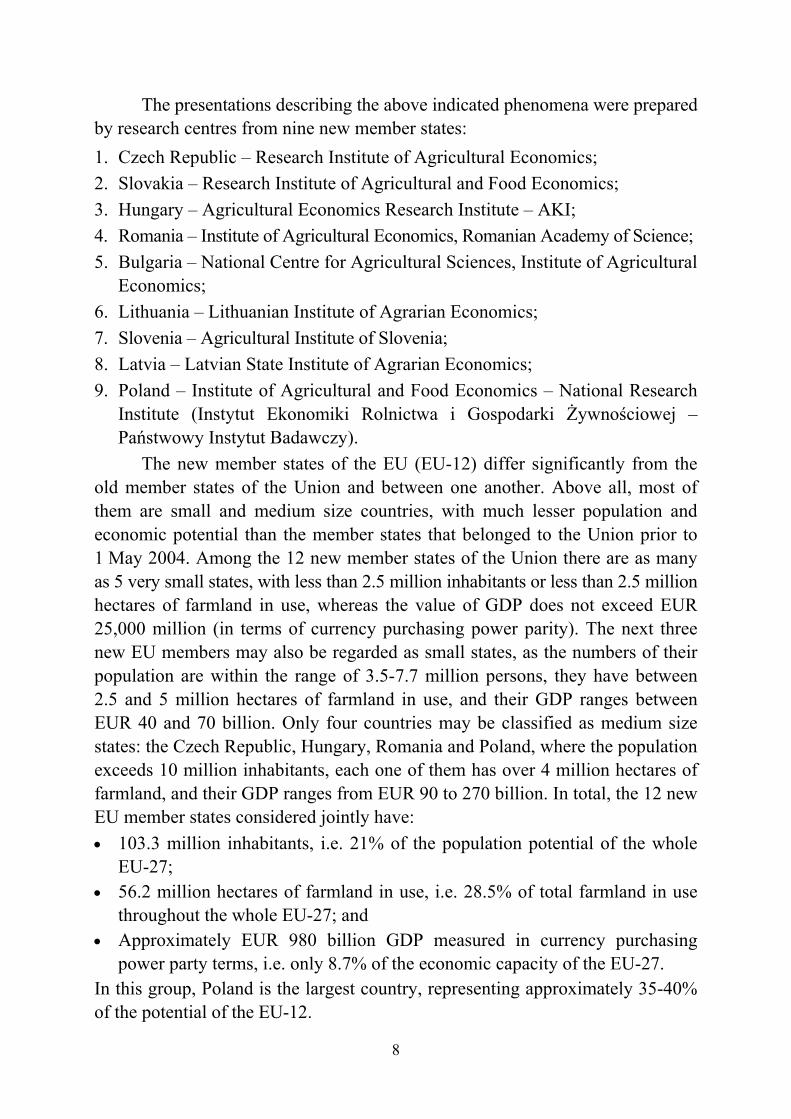
The presentations describing the above indicated phenomena were prepared by research centres from nine new member states: 1. Czech Republic – Research Institute of Agricultural Economics; 2. Slovakia – Research Institute of Agricultural and Food Economics; 3. Hungary – Agricultural Economics Research Institute – AKI; 4. Romania – Institute of Agricultural Economics, Romanian Academy of Science; 5. Bulgaria – National Centre for Agricultural Sciences, Institute of Agricultural
Economics; 6. Lithuania – Lithuanian Institute of Agrarian Economics; 7. Slovenia – Agricultural Institute of Slovenia; 8. Latvia – Latvian State Institute of Agrarian Economics; 9. Poland – Institute of Agricultural and Food Economics – National Research
Institute (Instytut Ekonomiki Rolnictwa i Gospodarki Żywnościowej – Państwowy Instytut Badawczy).
The new member states of the EU (EU-12) differ significantly from the old member states of the Union and between one another. Above all, most of them are small and medium size countries, with much lesser population and economic potential than the member states that belonged to the Union prior to 1 May 2004. Among the 12 new member states of the Union there are as many as 5 very small states, with less than 2.5 million inhabitants or less than 2.5 million hectares of farmland in use, whereas the value of GDP does not exceed EUR 25,000 million (in terms of currency purchasing power parity). The next three new EU members may also be regarded as small states, as the numbers of their population are within the range of 3.5-7.7 million persons, they have between 2.5 and 5 million hectares of farmland in use, and their GDP ranges between EUR 40 and 70 billion. Only four countries may be classified as medium size states: the Czech Republic, Hungary, Romania and Poland, where the population exceeds 10 million inhabitants, each one of them has over 4 million hectares of farmland, and their GDP ranges from EUR 90 to 270 billion. In total, the 12 new EU member states considered jointly have: • 103.3 million inhabitants, i.e. 21% of the population potential of the whole
EU-27; • 56.2 million hectares of farmland in use, i.e. 28.5% of total farmland in use
throughout the whole EU-27; and • Approximately EUR 980 billion GDP measured in currency purchasing
power party terms, i.e. only 8.7% of the economic capacity of the EU-27. In this group, Poland is the largest country, representing approximately 35-40% of the potential of the EU-12.
9
The average level of economic development of the new EU members is more than twice as low as that of the old members. In comparison to the average per capita GDP value of the EU-27, measured in purchasing power party terms, the same indicator amounts to: • in Romania and Bulgaria 33-34%; • in Latvia, Poland and Lithuania 48-52%; • in Slovakia, Estonia and Hungary 57-63%; • in the Czech Republic, Slovenia, Cyprus and Malta 75-85%.
Only in the last four of the above indicated states is the level of economic development similar to that of the poorest old members of the Union, i.e. Greece and Portugal.
At the same time, the new EU members are characterised by a very Fast pace of economic growth. Over the years 2004-2006 the average annual GDP growth rate in the EU-12 was almost 6%, including:
• as much as 10% in Latvia and Estonia; • below 5% only in Slovenia, Poland and Hungary.
According to forecast projections, the high rate of economic growth in the new member states will be sustained also over the years 2007-2008. They achieve about three times higher rates of economic growth than the EU-15 countries. New members of the Unison also distinguish themselves by higher inflation (on average ca. 5% per annum) and high deficits on current account (5 countries with over 10%). In this respect, Poland is the country with the best indicators (both inflation and deficit: ca. 2%).
The potential of agriculture in the new EU members is greater than their general economic potential. This is indicated not only by vast resources of arable land, but also by the high share of these member states in the output of the main products of agriculture. Indeed, in 2005 it amounted to:
• 29% in the production of cereals; • 17% in the production of beet; • 19% in the production of vegetables; • 13% in the production of fruit; • 16.5% in the production of meat; including:
− 17.3% of pork; − 21% of poultry;
• 19.5% of the output of milk.
10
In the enlarged EU only Poland is a major producer of food. Our country occupies the third place in the Union in the production of cereals, beet and vegetables, fourth position in the production of rape, pork and poultry meat, as well as milk. Moreover, Poland is the leading producer of potatoes in the Union and is the sixth producer of fruit.
The food industry of the old EU is more developed than in the new member states. The value of output of that industry in the EU-15 in current prices in 2005 amounted to approximately EUR 720 billion, whereas in the EU-12 of newly acceded countries approximately EUR 65 billion. Taken jointly, in comparable prices, after adjustment of currency exchange rates to purchasing power parity in 27 EU member states, it amounts to approximately EU 850 billion. Among those countries, the greatest value of production is achieved by the Polish food industry (ca. EUR 30 billion at the regular exchange rate or EUR 55 billion in purchasing power parity terms), which puts Poland in sixth position in the EU as producer of food and beverages, with a share of approximately 6.5%.
In spite of relatively large volume of output, the new members of the Union participate to a small degree in EU trade with agricultural and food products. Exports of such products from EU-12 countries in 2005 amounted to only EUR 17.5 billion, which represented just 7.5% of agricultural and food exports of the whole EU-27. At the same time, they have a fast growth trend, as over 2 years they have increased by 50%. Only Poland, Hungary, Lithuania and Bulgaria are net exporters among the new member states. These countries play similar roles as that played in the old Union by France and 4 other states with intensive agriculture (Denmark, Netherlands, Belgium and Ireland). The value of food exports from these 5 states jointly amounts to EUR 116 billion, and the balance of the exchange is EUR 44.5 billion. The remaining countries, both of the old and the new Union are net importers, to which mainly the products from the previously indicated exporters are supplied. The Union is characterised by developed internal exchange, the value of which, both on the exports and imports side totals approximately EUR 180 billion each, which represents over 20% of the value of output of the food industry of the whole European Union.
11
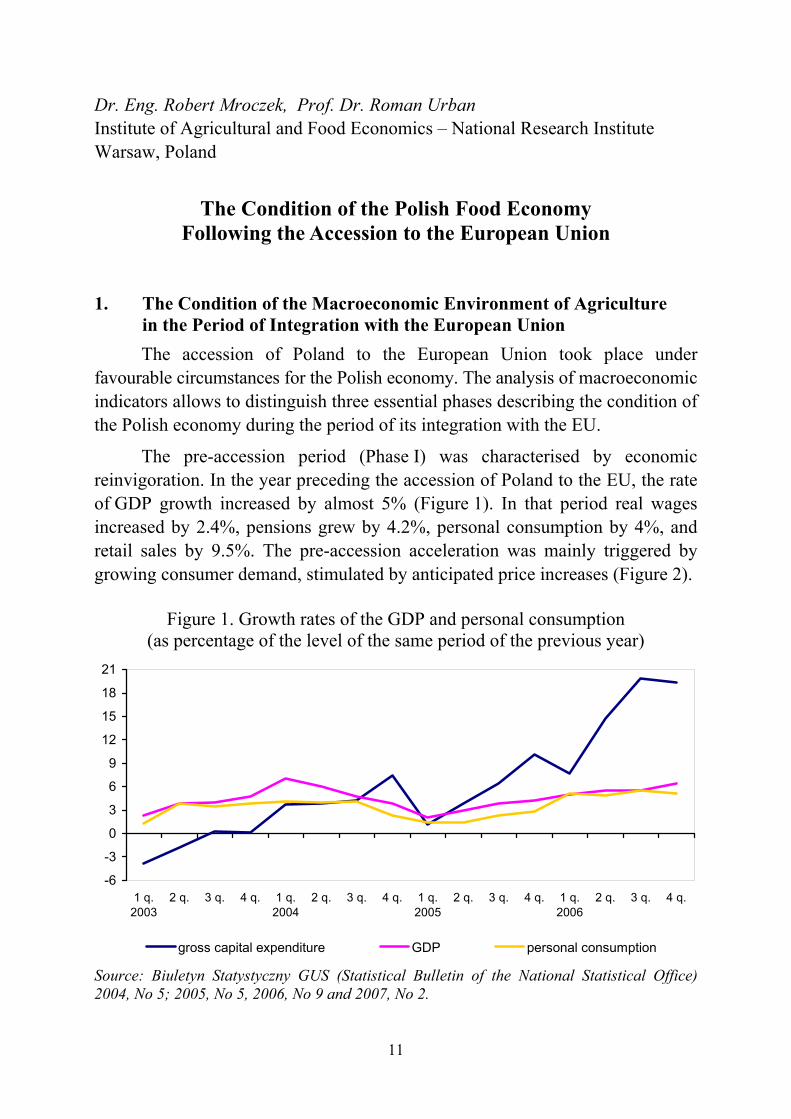
Dr. Eng. Robert Mroczek, Prof. Dr. Roman Urban Institute of Agricultural and Food Economics – National Research Institute Warsaw, Poland
The Condition of the Polish Food Economy Following the Accession to the European Union
1. The Condition of the Macroeconomic Environment of Agriculture in the Period of Integration with the European Union
The accession of Poland to the European Union took place under favourable circumstances for the Polish economy. The analysis of macroeconomic indicators allows to distinguish three essential phases describing the condition of the Polish economy during the period of its integration with the EU.
The pre-accession period (Phase I) was characterised by economic reinvigoration. In the year preceding the accession of Poland to the EU, the rate of GDP growth increased by almost 5% (Figure 1). In that period real wages increased by 2.4%, pensions grew by 4.2%, personal consumption by 4%, and retail sales by 9.5%. The pre-accession acceleration was mainly triggered by growing consumer demand, stimulated by anticipated price increases (Figure 2).
Figure 1. Growth rates of the GDP and personal consumption (as percentage of the level of the same period of the previous year)
-6
-3
0
3
6
9
12
15
18
21
1 q.2003
2 q. 3 q. 4 q. 1 q.2004
2 q. 3 q. 4 q. 1 q.2005
2 q. 3 q. 4 q. 1 q.2006
2 q. 3 q. 4 q.
gross capital expenditure GDP personal consumption
Source: Biuletyn Statystyczny GUS (Statistical Bulletin of the National Statistical Office) 2004, No 5; 2005, No 5, 2006, No 9 and 2007, No 2.

12
The initial months after the accession of Poland to the EU (Phase II) involved the continuation of the high 5% GDP growth rate, combined with the concurrent decrease of the rate of growth of national consumer demand. Economic growth over these months was driven mainly by rapidly growing exports (Figure 3).
Figure 2. Growth rates of real wages, pensions and retail sales (%)
-6-4-202468
1012
1 q.2003
2 q. 3 q. 4 q. 1 q.2004
2 q. 3 q. 4 q. 1 q.2005
2 q. 3 q. 4q. 1 q.2006
2 q. 3 q. 4 q.
retail sales in fixed prices pensions in real terms real wages
Source: Biuletyn Statystyczny GUS (Statistical Bulletin of the National Statistical Office) 2004, No 5; 2005, No 5, 2006, No 9 and 2007, No 2.
Figure 3. Value of exports and imports of goods and services
(EUR’000,000,000)
13
15
17
19
21
23
25
27
29
1 q.2003
2 q. 3 q. 4 q. 1 q.2004
2 q. 3 q. 4 q. 1 q.2005
2 q. 3 q. 4 q. 1 q.2006
2 q. 3 q.
imports
exports
Source: Biuletyn Statystyczny GUS (Statistical Bulletin of the National Statistical Office) 2004, No 5; 2005, No 5, 2006, No 9 and 2007, No 2.
The next after-accession increase of economic activity (Phase III) is noted from the middle of the year 2005. GDP growth in 2006 amounted to 6.1%, and
13
in the 1st quarter of 2007 it may exceed 7% and 6% over the whole year. This acceleration of growth has a solid basis, because: • The rate of growth of exports (approximately 20% per year) continues to
be high; • The economic growth leads to the improvement of the disposable income of
the population, as wages rise in real terms at the rate of over 4% per year, whereas retail sales increase by over 10%;
• Since the middle of the year 2005 there has been a notable acceleration of investment; capital expenditures are increasing at the pace of approximately 10% per year.
A lasting basis for the present economic animation is therefore provided not only by the growing exports, but also by the high growth rate of consumer demand and capital expenditure.
The above described changes in the Polish economy, resulting from the accession to the EU, were additionally accompanied by the following factors: • Improvement of the balance between exports and imports of goods and
services; from the beginning of 2005 until the end of the 3rd quarter of 2006 the average quarterly deficit amounted to approximately EUR 265 million, whereas over the years 2003-2004 it was 4 times greater;
• Strengthening of the local currency, especially in relation to the Euro; in the middle of 2004 the price paid for one Euro was approximately PLN 4.5, whereas over the whole year 2006 it was less than PLN 4;
• Low inflation – under 2% per annum, with the exception of the period of the 2nd quarter of 2004 – 2nd quarter 2005;
• Reduction of the unemployment rate from 20% over the years 2002-2003 down to 14.4% in March 2007;
• Reduction of the deficit of the state budget from approximately PLN 40,000 million per annum over the years 2002-2004 down to under PLN 30,000 million in 2005 and just over PLN 25,000 million in 2006;
• Increase of the public debt to the amount of PLN 500,000 million. 2. Price Developments in the Market Environment of Agriculture
and Food Industry The development of prices in the market environment has been and
continues to be unfavourable both for the farmers and for the food processors. Price indicators of agricultural products and food prices have been and continue to be lower than the inflation rates and the rate of change of prices of the means of production for agriculture (Figure 4).
14
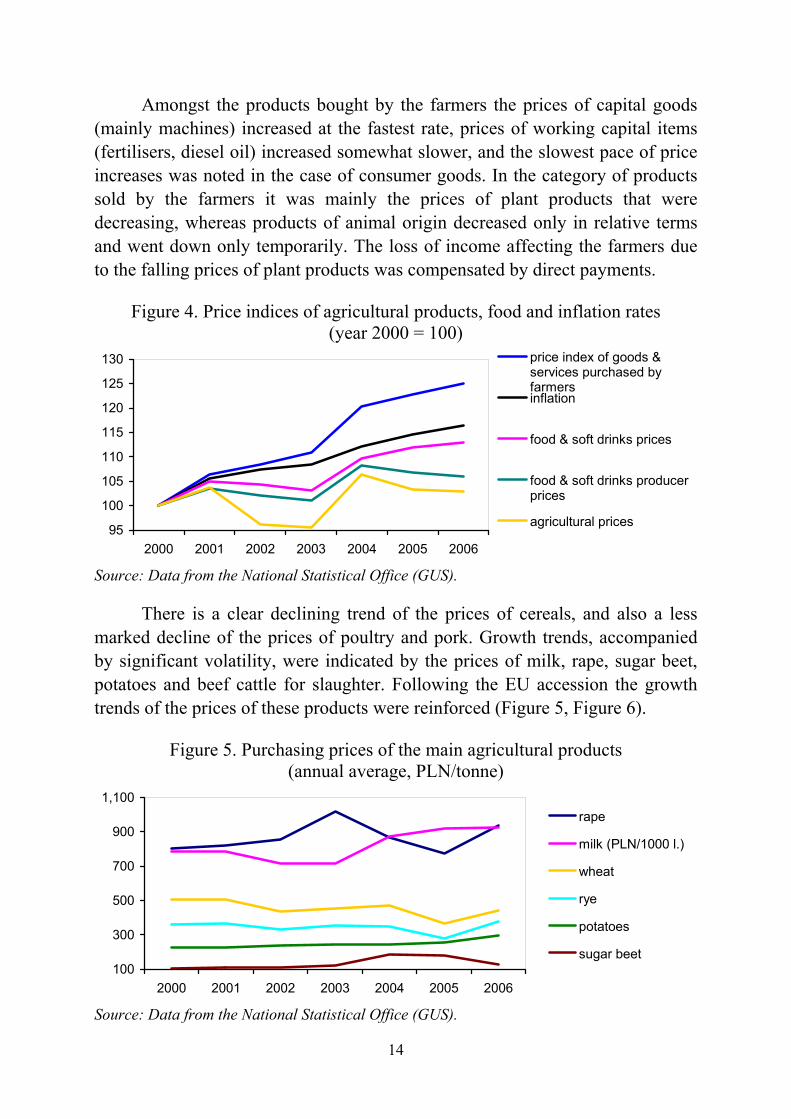
Amongst the products bought by the farmers the prices of capital goods (mainly machines) increased at the fastest rate, prices of working capital items (fertilisers, diesel oil) increased somewhat slower, and the slowest pace of price increases was noted in the case of consumer goods. In the category of products sold by the farmers it was mainly the prices of plant products that were decreasing, whereas products of animal origin decreased only in relative terms and went down only temporarily. The loss of income affecting the farmers due to the falling prices of plant products was compensated by direct payments.
Figure 4. Price indices of agricultural products, food and inflation rates (year 2000 = 100)
95
100
105
110
115
120
125
130
2000 2001 2002 2003 2004 2005 2006
price index of goods &services purchased byfarmersinflation
food & soft drinks prices
food & soft drinks producerprices
agricultural prices
Source: Data from the National Statistical Office (GUS).
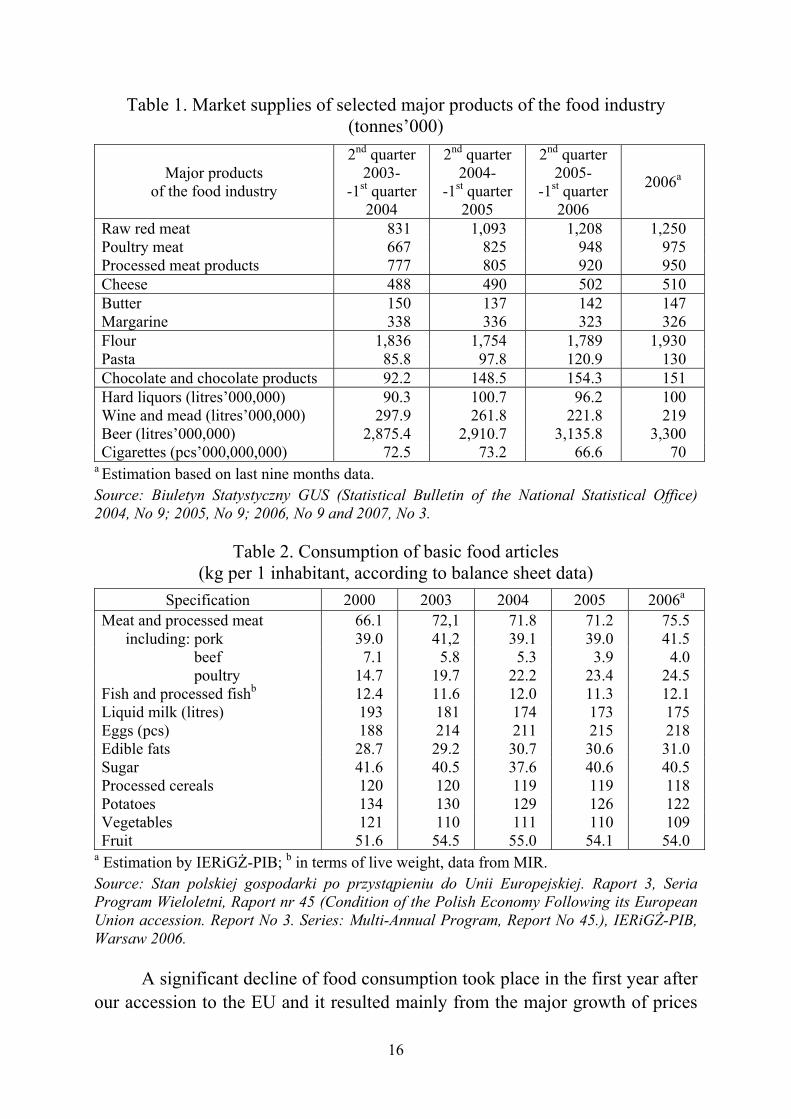
There is a clear declining trend of the prices of cereals, and also a less marked decline of the prices of poultry and pork. Growth trends, accompanied by significant volatility, were indicated by the prices of milk, rape, sugar beet, potatoes and beef cattle for slaughter. Following the EU accession the growth trends of the prices of these products were reinforced (Figure 5, Figure 6).
Figure 5. Purchasing prices of the main agricultural products (annual average, PLN/tonne)
100
300
500
700
900
1,100
2000 2001 2002 2003 2004 2005 2006
rape
milk (PLN/1000 l.)
wheat
rye
potatoes
sugar beet
Source: Data from the National Statistical Office (GUS).

15
Figure 6. Purchasing prices of animals for slaughter (PLN/kg, annual average)
2
2.5
3
3.5
4
4.5
2000 2001 2002 2003 2004 2005 2006
cattle
swine
poultry
Source: Data from the National Statistical Office (GUS).
The fastest growth rate applied to the retail prices (and sales prices) of such categories of food as processed cereals, as well as milk and processed dairy products. Prices increased also in the case of sweet confectionery, fish and processed fish, as well as other highly processed food, and also soft drinks and tobacco products. Sudden increases of retail prices took place only on the market for sugar, beef meat and animal tissue fat, and in the course of last year also on the vegetables and potato markets (Figure 7).
Figure 7. Retail price indices of the main categories of food (year 2000 = 100)
95
100
105
110
115
120
125
2001 2002 2003 2004 2005 2006
fish & processed fish
sugar & sweetconfectionarybread & processedcerealsfat
milk & dairy produce
meat
Source: Data from the National Statistical Office ( GUS). 3. Domestic Demand for Food
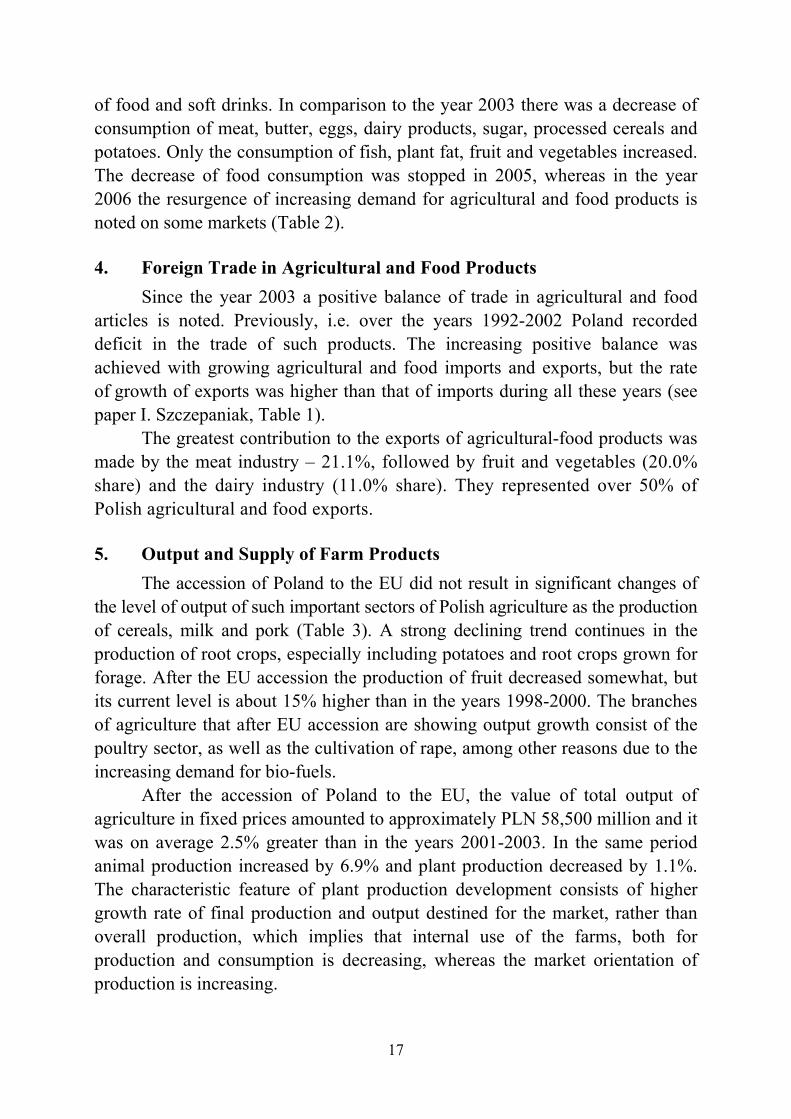
Following the accession of Poland to the EU, there was above all a major growth of market supply of red meat and poultry, as well as processed meat products. This is the result of industrialisation of agricultural produce and food processing combined with the concentration of such processing, forced by the processes of adaptation to European Union standards. The growth trend of the supply of maturing cheese, milk drinks and desserts, chocolate products and beer continued (Table 1).
16
Table 1. Market supplies of selected major products of the food industry (tonnes’000)
Major products of the food industry
2nd quarter 2003-
-1st quarter 2004
2nd quarter 2004-
-1st quarter 2005
2nd quarter 2005-
-1st quarter 2006
2006a
Raw red meat 831 1,093 1,208 1,250 Poultry meat 667 825 948 975 Processed meat products 777 805 920 950 Cheese 488 490 502 510 Butter 150 137 142 147 Margarine 338 336 323 326 Flour 1,836 1,754 1,789 1,930 Pasta 85.8 97.8 120.9 130 Chocolate and chocolate products 92.2 148.5 154.3 151 Hard liquors (litres’000,000) 90.3 100.7 96.2 100 Wine and mead (litres’000,000) 297.9 261.8 221.8 219 Beer (litres’000,000) 2,875.4 2,910.7 3,135.8 3,300 Cigarettes (pcs’000,000,000) 72.5 73.2 66.6 70
a Estimation based on last nine months data. Source: Biuletyn Statystyczny GUS (Statistical Bulletin of the National Statistical Office) 2004, No 9; 2005, No 9; 2006, No 9 and 2007, No 3.
Table 2. Consumption of basic food articles (kg per 1 inhabitant, according to balance sheet data)
Specification 2000 2003 2004 2005 2006a
Meat and processed meat 66.1 72,1 71.8 71.2 75.5 including: pork 39.0 41,2 39.1 39.0 41.5
beef 7.1 5.8 5.3 3.9 4.0 poultry 14.7 19.7 22.2 23.4 24.5
Fish and processed fishb 12.4 11.6 12.0 11.3 12.1 Liquid milk (litres) 193 181 174 173 175 Eggs (pcs) 188 214 211 215 218 Edible fats 28.7 29.2 30.7 30.6 31.0 Sugar 41.6 40.5 37.6 40.6 40.5 Processed cereals 120 120 119 119 118 Potatoes 134 130 129 126 122 Vegetables 121 110 111 110 109 Fruit 51.6 54.5 55.0 54.1 54.0
a Estimation by IERiGŻ-PIB; b in terms of live weight, data from MIR. Source: Stan polskiej gospodarki po przystąpieniu do Unii Europejskiej. Raport 3, Seria Program Wieloletni, Raport nr 45 (Condition of the Polish Economy Following its European Union accession. Report No 3. Series: Multi-Annual Program, Report No 45.), IERiGŻ-PIB, Warsaw 2006.
A significant decline of food consumption took place in the first year after
our accession to the EU and it resulted mainly from the major growth of prices
17
of food and soft drinks. In comparison to the year 2003 there was a decrease of consumption of meat, butter, eggs, dairy products, sugar, processed cereals and potatoes. Only the consumption of fish, plant fat, fruit and vegetables increased. The decrease of food consumption was stopped in 2005, whereas in the year 2006 the resurgence of increasing demand for agricultural and food products is noted on some markets (Table 2).
4. Foreign Trade in Agricultural and Food Products
Since the year 2003 a positive balance of trade in agricultural and food articles is noted. Previously, i.e. over the years 1992-2002 Poland recorded deficit in the trade of such products. The increasing positive balance was achieved with growing agricultural and food imports and exports, but the rate of growth of exports was higher than that of imports during all these years (see paper I. Szczepaniak, Table 1).
The greatest contribution to the exports of agricultural-food products was made by the meat industry – 21.1%, followed by fruit and vegetables (20.0% share) and the dairy industry (11.0% share). They represented over 50% of Polish agricultural and food exports.
5. Output and Supply of Farm Products
The accession of Poland to the EU did not result in significant changes of the level of output of such important sectors of Polish agriculture as the production of cereals, milk and pork (Table 3). A strong declining trend continues in the production of root crops, especially including potatoes and root crops grown for forage. After the EU accession the production of fruit decreased somewhat, but its current level is about 15% higher than in the years 1998-2000. The branches of agriculture that after EU accession are showing output growth consist of the poultry sector, as well as the cultivation of rape, among other reasons due to the increasing demand for bio-fuels.
After the accession of Poland to the EU, the value of total output of agriculture in fixed prices amounted to approximately PLN 58,500 million and it was on average 2.5% greater than in the years 2001-2003. In the same period animal production increased by 6.9% and plant production decreased by 1.1%. The characteristic feature of plant production development consists of higher growth rate of final production and output destined for the market, rather than overall production, which implies that internal use of the farms, both for production and consumption is decreasing, whereas the market orientation of production is increasing.
18
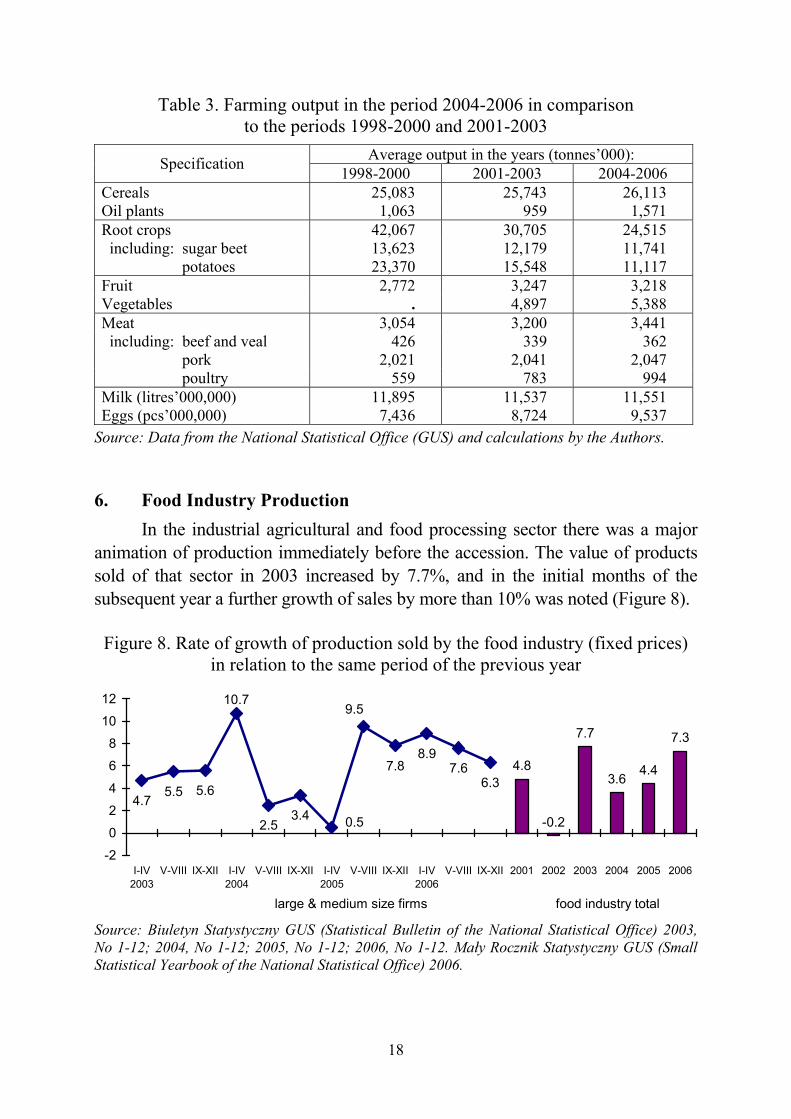
Table 3. Farming output in the period 2004-2006 in comparison to the periods 1998-2000 and 2001-2003
Average output in the years (tonnes’000): Specification 1998-2000 2001-2003 2004-2006 Cereals 25,083 25,743 26,113 Oil plants 1,063 959 1,571 Root crops 42,067 30,705 24,515 including: sugar beet 13,623 12,179 11,741
potatoes 23,370 15,548 11,117 Fruit 2,772 3,247 3,218 Vegetables . 4,897 5,388 Meat 3,054 3,200 3,441 including: beef and veal 426 339 362
pork 2,021 2,041 2,047 poultry 559 783 994
Milk (litres’000,000) 11,895 11,537 11,551 Eggs (pcs’000,000) 7,436 8,724 9,537
Source: Data from the National Statistical Office (GUS) and calculations by the Authors. 6. Food Industry Production
In the industrial agricultural and food processing sector there was a major animation of production immediately before the accession. The value of products sold of that sector in 2003 increased by 7.7%, and in the initial months of the subsequent year a further growth of sales by more than 10% was noted (Figure 8).
Figure 8. Rate of growth of production sold by the food industry (fixed prices)
in relation to the same period of the previous year
4.8
7.7
3.64.4
7.3
-0.24.7
5.5 5.6
2.53.4
7.88.9
7.66.3
9.5
0.5
10.7
-2
0
2
4
6
8
10
12
I-IV2003
V-VIII IX-XII I-IV2004
V-VIII IX-XII I-IV2005
V-VIII IX-XII I-IV2006
V-VIII IX-XII 2001 2002 2003 2004 2005 2006
large & medium size firms food industry total
Source: Biuletyn Statystyczny GUS (Statistical Bulletin of the National Statistical Office) 2003, No 1-12; 2004, No 1-12; 2005, No 1-12; 2006, No 1-12. Mały Rocznik Statystyczny GUS (Small Statistical Yearbook of the National Statistical Office) 2006.

19
7. Structural Transformations in Polish Agriculture and Food Industry Over the years 2004-2005 the number of farms decreased by 103,000
(5.9%) of holdings. This represents a several times greater reduction of the number farms than was the case in the period of the years 2001-2003. Changes of the acreage structure of the farms progressed in a similar direction (Table 4). The proportion of farms with areas of 2-15 ha of agriculturally utilised land was decreasing, whereas the proportion of the smallest holdings (1-2 ha) and the largest farms (15 ha and more) was increasing.
Table 4. Changes of structure of farms in terms of land area (percent) Years Farm area in hectares Average in the years 2001-2003 2004 2005
1 - 2 25.0 26.1 25.1 2 - 15a 65.2 63.4 64.0
15 and more 9.8 10.5 10.9 a farms with areas of 2-5, 5-10 and 10-15 ha were aggregated into one group, because their number was decreasing over the years subject to this analysis Source: Stan polskiej…, (Condition…) op. cit.
In the first year after the accession of Poland to the EU and in subsequent years there were no significant changes of the structure of business entities operating in the food industry (Table 5). At that time the number of industrial firms decreased slightly, mainly in the case of small and micro firms. After the EU accession there were no mass scale bankruptcies of local firms. There was also no intensification of the processes of mergers, acquisitions or consolidation of whole sectors.
Table 5. Functioning enterprises producing food and drinks
Number of firms Sales value in basis prices (PLN’000,000,000) Specification
2003 2005 2003 2005 Number of firms 19,516 18,354 101.7 120.0 including: large 270 275 44.2 56.7
medium size 1,255 1,195 31.5 34.3 small 5,353 5,201 16.8 19.1 micro 12,638 11,683 9.2 9.9
Source: Rocznik Statystyczny Przemysłu (Statistical Yearbook of Industry) 2004 and 2006; GUS.
The accession of Poland to the EU caused the acceleration of the adaptation processes of the enterprises operating in so called vulnerable sectors to the standards of the EU. Their effect consisted of the rapid increase of enterprises disposing of licences for sales on the enlarged market of the EU states. Over the period of three years the number of such enterprises has increased: • Fifteen times in red meat processing; • Over five times in the dairy and poultry business; • Over three times in fish processing.
20
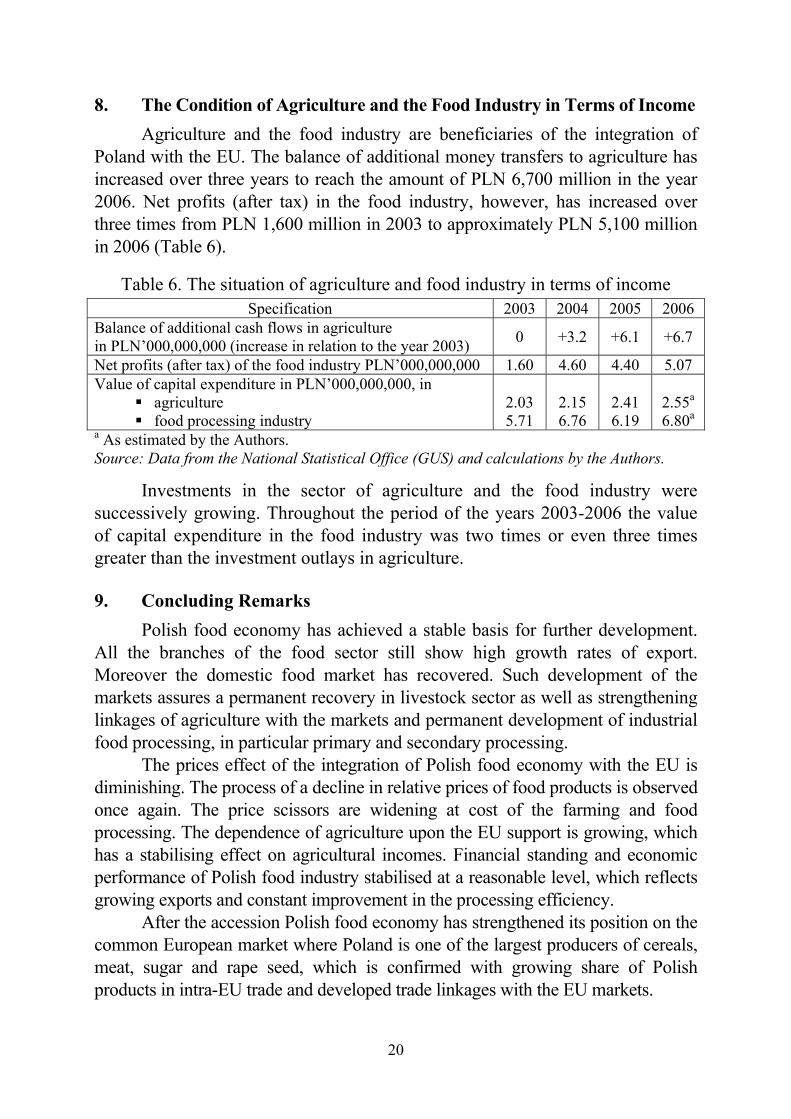
8. The Condition of Agriculture and the Food Industry in Terms of Income Agriculture and the food industry are beneficiaries of the integration of Poland with the EU. The balance of additional money transfers to agriculture has increased over three years to reach the amount of PLN 6,700 million in the year 2006. Net profits (after tax) in the food industry, however, has increased over three times from PLN 1,600 million in 2003 to approximately PLN 5,100 million in 2006 (Table 6).
Table 6. The situation of agriculture and food industry in terms of income Specification 2003 2004 2005 2006
Balance of additional cash flows in agriculture in PLN’000,000,000 (increase in relation to the year 2003) 0 +3.2 +6.1 +6.7
Net profits (after tax) of the food industry PLN’000,000,000 1.60 4.60 4.40 5.07 Value of capital expenditure in PLN’000,000,000, in
agriculture food processing industry
2.03 5.71
2.15 6.76
2.41 6.19
2.55a 6.80a
a As estimated by the Authors. Source: Data from the National Statistical Office (GUS) and calculations by the Authors.
Investments in the sector of agriculture and the food industry were successively growing. Throughout the period of the years 2003-2006 the value of capital expenditure in the food industry was two times or even three times greater than the investment outlays in agriculture. 9. Concluding Remarks
Polish food economy has achieved a stable basis for further development. All the branches of the food sector still show high growth rates of export. Moreover the domestic food market has recovered. Such development of the markets assures a permanent recovery in livestock sector as well as strengthening linkages of agriculture with the markets and permanent development of industrial food processing, in particular primary and secondary processing.
The prices effect of the integration of Polish food economy with the EU is diminishing. The process of a decline in relative prices of food products is observed once again. The price scissors are widening at cost of the farming and food processing. The dependence of agriculture upon the EU support is growing, which has a stabilising effect on agricultural incomes. Financial standing and economic performance of Polish food industry stabilised at a reasonable level, which reflects growing exports and constant improvement in the processing efficiency.
After the accession Polish food economy has strengthened its position on the common European market where Poland is one of the largest producers of cereals, meat, sugar and rape seed, which is confirmed with growing share of Polish products in intra-EU trade and developed trade linkages with the EU markets.
21
Dr. Sławomir Gburczyk Institute of Agricultural and Food Economics – National Research Institute Warsaw, Poland
Impact of the Common Agricultural Policy upon the Agricultural Markets in Poland
The Common Agricultural Policy of the European Union (CAP) influenced
the Polish agricultural markets already before the accession of Poland to the Community. Initially it was the impact exerted by the conditions of foreign trade in agricultural and food products as well as in the means of production for farming between Poland and the Union. During the last years preceding the accession of Poland to the EU the process of adaptation of Polish legislation to the requirements of the Union was already in progress, covering also the provisions regulating the functioning of agricultural markets. As a result of these measures, by the time of accession, some of the Polish agricultural markets were already organised identically or very similarly to what prevailed in the member states of the Union. This concerns, for example, the market for sugar and the market for starch. On other markets, at the time of the accession of Poland to the EU, a system combining elements of the previously existing market organisation with some of the instruments of the CAP was in place. This applied, for example, to the market for meat and the market for milk. In the first year of membership of the European Union the changes on agricultural markets in Poland resulted to a relatively small degree from the initiation of the functioning of specific measures of the Common Agricultural Policy. Profound changes, however, were caused by the very opening of the markets of the European Union, and, to put it more precisely – the inclusion of the Polish market in the single European market. The impact of the opening of the EU market could be observed on the markets for all the basic products (including cereals, meat, milk and sugar), resulting in the growth of exports even at the times, when the very strong Polish currency did not particularly favour that. Another effect of accession had psychological grounds. The political campaigns of Euro-sceptics and Euro-enthusiasts, both of whom claimed to be Euro-realists, gave rise to many hopes and even more fears among the producers, traders and consumers. The mass media provoked such sentiments by publishing a lot of usually superficial opinions. Hopes for rapid growth of profits on the part of some of the producers and trading intermediaries were mixed with rather widespread fears among consumers of major increases of the costs of living. All this

22
resulted in the growth of prices of many basic products in the months preceding the accession to the Union and in the initial months after the accession. Analysis of changes of the synthetic indicator of agricultural prices (comprising 7 basic products and covering 2/3 of the market production of Polish agriculture) indicates that although it was short-lived, an evident growth trend of these prices started from November 2003, and therefore about half a year before the accession of Poland to the European Union. This rise of prices lasted until June 2005 inclusively, and in comparison against October 2003 it reached as much as 37.4%. In July and August 2004 this indicator clearly fell, to be stabilised during the 4th quarter of 2004 at a level almost 9% lower than during the peak moment (June 2004), but remained approximately 25% higher than in October of the previous year. At the beginning of 2005 further decline of this indicator was noted, although it went down very slowly this time.
Changes of the synthetic index of agricultural prices during the analysed period can hardly be attributed to the impact of any specific instruments of the CAP. The level of this index is decisively driven by the purchasing prices paid to farmers for swine livestock and milk. Most CAP instruments concerning the markets for these products had been in operation on the Polish market already before the accession of our country to the EU (e.g. the refunds for pork exports beyond the EU territory or intervention purchasing), or did not need to be applied owing to the good market situation, as was the case with the market for milk.
The growth of agricultural prices over the period from November 2003 – to June 2004 (and in the case of animal production even until November 2004) was decisively driven by three factors: equalisation of prices to the EU level, the increase of demand connected with the opening of new sales markets, and the psychological effect. The first two of these factors will drive agricultural prices in Poland still for some years to come, but the turbulent wave of rising prices is already behind us. Gradually, a factor pulling in the opposite direction will gain significance, namely the general tendency for the food prices to fall in the developed countries. A significant role will also be played by the discontinuation of application of price related instruments of intervention on agricultural markets in favour of instruments of direct support of farmers’ incomes. The increase of prices of basic agricultural products upon and shortly after the accession was accompanied by substantial growth of prices of inputs of factors of production for farming. The price hikes, which began in February 2004, lasted until May – June 2004. On average, over the same period, the prices of means of production for agriculture increased by 17.5%, and throughout the whole first year of EU membership by approximately 20%. The rising prices of the means of production resulted from successful efforts on the part of producers and intermediaries, when trading with such products, to
23
capture at least some part of the income generating effects of the increase of purchasing prices paid to farmers and the anticipated income from direct payments. In the case of farming machines, some of the funds flowing from the SAPARD programme were tapped in this way at an even earlier stage.
Whereas the prices of farm products began to fall significantly in the second half of 2004, prices of the means of production continued to rise. On the whole, therefore, the price gap continued to widen to the disadvantage of agriculture. Reductions of purchasing prices paid to farmers, as well as the somewhat slower decrease of the prices obtained by the producers of food, were also not beneficial for the consumers. One year after the EU accession the prices obtained by food producers were almost 4% higher than in December 2003, purchasing prices paid to farmers were 6.5% higher and retail prices increased by 7%.
The fact that in the first year of membership of the European Union the very accession, and more precisely the opening of the market of the Community, played a greater role than the application of the instruments of the Common Agricultural Policy in our food economy, does not imply that these instruments were insignificant. The assessment of the strength of the impact of particular CAP instruments upon the behaviour of the agricultural markets in Poland will only become possible after a longer period of their operation. It may be expected, however, that their impact will increase in step with the fading of the “accession effect”, which was by its very nature a temporary phenomenon. A rather particular place amongst the instruments of the Common Agricultural Policy is occupied by direct payments. This has to do not so much with the power of the impact of this instrument, but rather with its universal coverage. It is also interesting to note the evolution of CAP instruments, which led to the establishment of direct payments. It should be recalled here that the predecessor of the European Union, the European Economic Community, began its operation under the conditions of lacking self-sufficiency of food supplies and its agricultural policy had to stimulate the growth of production. As self-sufficiency was achieved, followed even by surplus production on successive agricultural markets, the range of CAP instruments underwent the evolution toward more or less successful attempts to influence the structure of agricultural output. After the fairly rapid arrival at the condition of surplus production practically on all the markets concerned, new CAP measures were devised in order to limit production or at least to prevent its increase, while resolving other, e.g. income related problems of agriculture.
Direct payments, introduced in the early nineteen-nineties, were reformed in June 2003. Two pillars of that reform of the Common Agricultural Policy consisted of decoupling (découplage in French), namely the disconnection of payments and production, as well as the introduction of the principle of the single integrated
24
payment. In this way it was assumed that “aid would be paid to the producers completely independently of the kind of production”.
The statement that “all farmers would be eligible to receive direct payments regardless of their production and to supplement their income”, however, is immediately followed by a stipulation contradicting the above quoted sentence, informing that “systems of special support were foreseen for hard wheat, protein crops, rice, nuts, energy crops, starch potatoes, milk products, seeds, arable crops, mutton and goat meat, beef, leguminous plants for seed, cotton, tobacco, hops and for farmers cultivating olive groves”.
Such an approach, which may be delicately described as “inconsistent”, results in reality from the typical “Brussels-style” compromise, in which the implementation of the purposefully correct and well thought through principle is foregone in the name of the interests of a few countries, especially when this concerns countries with dominant positions within the Union. The introduction of exceptions, covering a very significant part of agricultural production results from the lack of confidence for market mechanisms and a mixture of bureaucratic and socialist leanings towards “manual control” over the economy. This judgment cannot be modified even in the face of the fact that such inconsistency is also temporarily favourable for Poland, as a matter of some years to come.
The documents prepared by the European Commission which present the idea of direct payments go on to say that these payments are supposed to assure greater stability of incomes of the farmers, at the same time allowing the farmers to decide what they wish to produce, without suffering losses, and taking into account the market balance of supply and demand.
A farmer is able to take advantage of direct payments provided that he maintains his land in good agricultural condition and observes the standards of public health, good health of animals and plants, protection of the natural environment, as well as assuring the so called animal welfare, jointly referred to as eco-conditions (from the French: écoconditionnalité).
In this manner the direct payments, which were initially conceived just to play the role of stabilising agricultural incomes, were first spoilt by numerous exceptions, and subsequently were charged with the condition that the beneficiary should observe numerous ecological and ethical conditions, which are, by the way profoundly justified. It should be remembered, however, that measures designed to simultaneously fulfil various functions, do not satisfactorily fulfil any of them. During the negotiations preceding its accession to the European Union, Poland obtained a system of payments from EU funds equivalent to 25% of the level of payments in force in the countries of the “old Union” in the year 2004 and increasing each year until it would reach 100% of that level in the year 2013. Apart from that, Poland obtained the consent for partial topping up of the direct
25
payments from its own budget, and it is actually making use of the right to apply this instrument. The conditions for obtaining and disbursing the direct payments negotiated by the “10 new member states” were not identical. Furthermore, some of the countries entitled to top up these payments from their own budget similarly as Poland, are not making use of this right. This is undoubtedly related with the power of the agricultural electorate in those countries.
The impact of direct payments exerted upon the markets for the main agricultural and food products is very differentiated. Direct payments relatively strongly affect the market for cereals, which is probably the most regulated one amongst all such markets. It is covered by the operation of the system of intervention purchasing, which is linked to quality and quantitative requirements. It is assumed that this system should play the role of a contingency solution, preventing excessively deep falls of income of the producers of cereals in years of surplus production. In those countries, where expectations concerning achievable prices of cereals are more modest, which is also the case in Poland, the intervention price may nevertheless at least periodically be regarded as quite attractive.
The regulations concerning foreign trade applicable to the market for cereals may be described as rather brutal. Import or export licences are required even for very small quantities of such goods (0.5-5 tonnes). Customs duties, in turn, are in fact prohibitive, practically making it impossible (with some minor exceptions) to import cereals from the so-called third countries.
Contrary to expectations, direct payments have turned out to be too small to fully amortise the impact of price variations caused by differences in the yields of cereals harvested in different years. It is worth noting in this context that the abrupt decrease in profitability, which occurred in 2004, in spite of the disbursement of direct payments, above all affected the efficient producers. On the other hand, direct payments supported the production of cereals on small farms, where the yields as a rule are lower.
In a relatively longer term perspective, direct payments will enable to force the producers of cereals to accept somewhat lower prices. This will be a factor imposing the need to improve the efficiency of production, perhaps even by a certain reduction of its intensity, on the large, highly productive farms. In the case of small and relatively inefficient farms, such price changes will practically not exert any impact upon their technology of cultivation of cereal crops.
The stabilisation of the market for cereals at a relatively low price level will be favourable for the milling and animal feed industries, and in consequence it should also be beneficial for consumers of bread and other cereal products, as well as for producers of livestock for slaughter, and therefore, further down the food chain – also for consumers of meat (mainly pork and poultry).
26
The situation on the market for sugar, considered from the point of view of the impact of direct payments upon that market, differs decisively from what we observe on the market for cereals. The accession to the European Union has probably caused the greatest disturbances on the sugar market, consisting of a sudden upsurge of prices (both of bulk sales prices and retail prices), continuing throughout the entire first half of the year 2004. The market bulk sale price amounting to 1.52 PLN/kg in December 2003, increased to 3.17 PLN/kg in May 2004, that is more than twice. This price upsurge had no deeper production related or economic causes, but was triggered by psychological factors, in particular the excessive expectations of producers and traders combined with exaggerated fears of the consumers. After the accession of Poland to the EU the prices of sugar fell rather visibly, but at the beginning of the year 2006 they were stabilised at a level of slightly over 2.50 PLN/kg, which was clearly higher than what had been achieved in earlier years. All this clearly improved the economic and financial condition of the sugar industry.
Returning to the matter of the impact of direct payments upon the sugar market, it should be noted that the farmers growing sugar beet have been covered by one of the two elements of such payments, namely the single area payments. In the year 2004 these amounted to 211 PLN/ha, and in the year 2005 – 225 PLN/ha, so they increased the net agricultural income from the cultivation of sugar beet only to a small extent. According to calculations done by Ł. Chudoba, the contribution of direct payments to such income amounted only to approximately 5% in 2004, and in 2005 to approximately 7%.
The impact of compensatory payments upon the incomes of sugar beet growers, therefore, may be assessed as being weak, and their influence with regards to production decisions as non-existent. The production of sugar beet may still be regarded as very profitable in comparison to other crops, in spite of the unfavourable changes in the system of intervention initiated in 2006. The only factor, which limits or even completely prevents any growth of such production consists of the quota system. Direct payments, therefore, practically do not exert any impact upon the market for sugar.
The impact of direct payments upon the market for milk and processed milk products is rather difficult to assess. Since a dozen of years or so the process of concentration of milk production is under way in the case of larger farms, both when measured in terms of the acreage of the respective farm land, and when measured by the number of cattle livestock on the farm. Over the last few years this process accelerated significantly. At the same time, milk prices are changing. In Poland these prices have been systematically rising over the last few years, but their growth was slowed down in the autumn of 2005. Over the same period, in the EU-15 countries there was a clear declining trend of the purchasing prices for milk
27
as material for dairy production, above all due to the limitation of refunds applicable to exports to third countries.
It may be expected that the direct payments will shift the sensitivity threshold of reaction to decreasing profitability of milk production in the case of small farms with 2-5 cows to a somewhat lower level. Nevertheless, this issue will come to the fore only in a few years from now, because presently, regardless of the calculations proving the unprofitability of milk production on such farms, such production is still regarded as being profitable. A significant role in this regard is played by the fact, that the proceeds from milk sales are relatively evenly spread over the whole year and are most frequently the only source of small but systematic inflow of cash to the farm.
Direct payments will undoubtedly slow down the process of concentration of land in medium size and large farms, and as a consequences of that – they will also slow down the process of concentration of milk production. It is probable that the process of concentration of production will proceed somewhat faster than that of the concentration of land.
In the EU-15 countries the direct payments (premiums) served to support the breeding of cattle and sheep for meat, by means of a rather complicated system. As a result of pre-accession negotiations the respective limits of entitlements to such premiums were also granted to Poland. The limits of such premiums in Poland are included in the supplementary area payment, financed from the national budget and from structural funds, and they are paid in proportion to the area under cultivation, including the cultivation of forage crops and green pastures. Other “new” EU member states have adopted their own specific solutions in this respect, rather widely differing from one another.
From the year 2009 all the member states of the EU should comply with the solutions adopted by the CAP reform of the year 2003, that is to choose one of the two available solutions: either to include the premium on the account of cattle and sheep in the single payment and pay it regardless of whether the farm continues breeding such animals, or to pay the premium in connection with production, but only within determined limits, as so called individual payment. The second solution has been chosen by nine countries, so far, with respect to the breeding of cattle, and in the case of sheep by ten of the fifteen countries of the “old” Union.
In the case of Poland, given the described construction of the system, it is difficult to assess the impact of the direct payments upon the market for meat. This difficulty is made even greater by the fact that the supplementary area payments were received also by farms not breeding any cattle or sheep, and in addition also by such farms, which do keep the respective livestock, but are most often oriented to exploit the cattle in two ways – both for milk and for meat. In the final analysis,
28
however, it should not be presumed that direct payments exert a particularly significant impact upon the production decisions of the producers of beef and mutton.
It may be regarded as a particular paradox that, at least in the long term, greater impact upon the market for meet seems to be made by the payments disbursed to the producers of cereals and thus contributing to the decrease of the prices of fodder, rather than by the payments granted to the producers of meat.
Farmers cultivating starch potatoes receive direct payments in the form of the basic payment and the supplementary payment, which is higher per hectare than the benefits they received prior to the accession. The situation on the market for potato starch is similar in terms of the market impact of the compensatory payments to what we have observed on the sugar market. In both cases production is relatively very profitable and the fact of receiving or not receiving any compensatory payments does not significantly influence the decisions of the producers. What is decisive is the very capacity to produce and to sell starch potatoes to the processing industry, which, similarly as in the case of sugar beet, is conditioned by the existence of the system of production quotas.
The fruit and vegetable market differs rather significantly from the other markets under discussion, in terms of the scope and techniques of intervention. Intervention boils down here to support for the organisations of producers, compensation for not supplying fresh fruit and vegetables to trade, the upholding of common quality requirements, supplementary payments to certain categories of fruit and vegetables destined for processing, as well as export refunds and import permits. Direct payments practically do not exert any impact at all upon this market.
Theoretically, direct payments could influence the market for drinks and other products of secondary processing of food via the prices of raw materials sourced from farming. In reality, however, the impact of direct payments upon the prices of such inputs is very small or does not exist at all, as we have tried to demonstrate above. Furthermore, the costs of raw material inputs contribute to a minimal extent to the production costs of the products under discussion here.
A certain rather small impact of direct payments upon the market for drinks and other products of secondary food processing could at most be found in the influence of these payments upon the incomes, and in consequence also the consumption, of the poorer part of the families of farmers.
This brief review of the situation on the main agricultural and food markets in Poland allows to make an assessment of the impact of the compensatory payments upon these markets. The immediate impact of direct payments may be regarded as very small. In spite of the fact that these payments will continue to increase over the next few years, their impact upon the agricultural markets should not increase. In even longer time perspective the impact of direct payments should be weakened by the increase of farmers’ incomes. Finally, the universal introduction of the Single
29
Payment system, completely disconnected from production, which must prevail sooner or later, will practically completely eliminate the impact of direct payments upon the agricultural markets.
Although the direct impact of direct payments upon the agricultural markets may be regarded as not very powerful, the indirect effect is much greater. Direct payments exert a significant influence upon agricultural incomes. This impact is many times greater than in the countries of the “old Union”. In poorer countries, where the incomes from farming production are very low, direct payments, even when they have not reached the full amount, have a very strong impact. This will lead to particular consequences for the transformation of the land holding structure. The slowing down of such transformations will become the unexpected and unwanted effect of the introduction of such payments.
Finally, it is worth noting that the countries acceding to the European Union, such as the “10” in 2004, and most recently Bulgaria and Romania, are joining a group of states with technically very productive and effective agriculture, which is nevertheless extremely inefficient economically. The process of making the farmers in the Union dependent on support flowing from Brussels in the framework of the Common Agricultural Policy, has resulted in the situation that without such support and protection against external competition, agriculture in the EU could no longer exist.
The threats to further continuation of this policy of supporting agriculture are twofold. On the one hand, the group of net contributors to the EU budget have increasing reservations with regards to the agreement to keep on financing the CAP, while on the other hand, the “rest of the world” increasingly assertively demands the opening up of the EU markets. In the nearest future this will come about, as the group of countries having vested interests in continuing to support their own agriculture, comprising also the new member states, is very strong. But somewhat more distant future is nevertheless difficult to predict.
The statement that with the accession the agriculture of new member states of the Union has entered upon the way toward progressive dependence on external support and incessant weakening of its capacity to be competitive, does not carry any practical conclusions for the agricultural policy of these countries. It is hardly imaginable that the benefits of the Common Agricultural Policy should be voluntarily given up, even if such benefits might be short lived and somewhat doubtful in the longer term perspective. One ought to be at least aware that by entering the course currently determined by the CAP, we have found ourselves on a particular path, from which there is no return.
30
Dr. Iwona Szczepaniak Institute of Agricultural and Food Economics – National Research Institute Warsaw, Poland
Competitiveness of the Polish Food Sector after the Accession to the European Union
Competition is the basic economic mechanism of the market economy, from which competitiveness is derived and of which it is an element. Competitiveness is most often referred to the foreign or global market, but there is also the view that success on such markets is decided by the previous success in the competitive rivalry on the local and regional market. If follows from the generally quoted OECD definition, in turn, that competitiveness of the economy consists of the capacity to face international competition, and therefore to realise major exports and to maintain a high level and growth rate of domestic demand, without deteriorating the trade balance on current account.1 Competitiveness of the Polish food sector, therefore, may be defined as the ability of the local food producers to establish themselves on foreign markets – both on the EU market and on third markets, as well as the capacity to develop effective exports.
Foreign trade in agricultural and food products has always been an important part of Polish foreign trade. Nevertheless, the turnover of this category of goods since the middle of the nineteen-nineties until the year 2002 remained on a basically stable level, and the difficult conditions of access to foreign sales markets made it impossible to achieve a positive balance of trade in this category of goods. The brake through came from the day of accession of Poland to the European Union.
The EU membership of Poland was tantamount to the removal of all constraints, both in terms of tariffs and non-tariff barriers, in mutual trade in agricultural and food products, both with the “old” and with the “new” member states of the EU. As a result of this, Polish agricultural and food products may be exported to the markets of other member states without any impediments. At the same time, goods produced in those countries may freely compete on the Polish market with Polish products. By opening its market of just under 40 million consumers (with relatively small purchasing power) Poland obtained therewith the free access to the wealthy and developed European market, numbering approximately 450 million consumers. 1 E. Skawińska (ed.), Konkurencyjność przedsiębiorstw – nowe podejście [Competitiveness of enterprises – a new approach], PWN, Warsaw 2002.
31
The basic problem of the Polish food economy has now come to consist of the issue, whether the inevitable loss of some part of its own domestic market will be more than compensated by the increased sales on the markets of the other EU member states. From the formal point of view, the sufficient condition for being able to place agricultural and food products on the markets of member states of the Union consisted of fulfilment by Polish producers of the EU sanitary, veterinary, phytosanitary, animal welfare and environmental protection standards2. The actual utilisation of the possibilities for the growth of Polish food exports to the markets of the other EU member states was dependent, however, on the acceptance of Polish products by consumers from these countries.
Three years after the accession of Poland to the European Union it is clearly visible that the entry into the structures of the Common Economic Market (CEM) turned out to be beneficial for the Polish food economy. The results of foreign trade are very good. There has been a strong growth of exports of Polish agricultural and food products, which has more than compensated for the weaker growth of imports of such goods produced in other EU member states3. In this way the effective demand for Polish agricultural and food products has increased substantially. The results of the agricultural and food sector after the accession of Poland to the EU have therefore indeed confirmed its good preparedness for the conduct of business activities on the CEM and on most other markets as well, and they have also revealed the competitive advantages of the Polish food economy over the food industries of the other EU countries. As a result of this, Polish food producers have significantly improved their position in the enlarged Union. The mutual full opening of markets was not, as some economists anticipated, any break slowing down the development of the Polish food economy, but rather to the contrary – it became a strong impulse acting as the driver of development. This is indicated by the following phenomena:
• During the three years of our EU membership the exports of agricultural and food products have increased over two times and imports by almost 74%.
2 An exception from his rule consists of the granting by the EU of transition periods to selected dairy companies, meat, poultry and fish processing plants, over which periods the establishments concerned are allowed not to meet some of the EU standards, and may then sell their products only on the local market of the country. 3 The significant appreciation of the Polish currency, which prevails since the middle of 2004 (average exchange rate of the EUR/PLN quoted by the National Bank of Poland: 2004 – PLN 4.5340; 2005 – PLN 4.0354; 2006 – PLN 3.8951) leads to the effect that the growth rate of exports of agricultural and food produce calculated in PLN is much lower than in EUR, but it may be regarded as very high anyway.
32
• Trade with other EU member states has developed even faster. Supplies of food from Poland to EU-25 countries over the years 2003-2006 increased by over 141%, whereas imports to our country increased by almost 75%.
• CEM already in the first year after accession became the dominant procurement and sales market for Polish trade in agricultural and food products. In the successive years of our membership the share of EU-25 in exports of that category of goods grew especially fast – from approximately 65% in 2003 to as much as over 76% in 2006. The share of EU-25 in imports of agricultural and food products was more stable and varied over that period within the limits of 61-63%.
• The development of trade with countries of the Union concerned not only the EU-15 countries, but also the “new” member states. EU membership gave a new, very strong impulse for the exports of Polish agricultural and food products to the EU-10 countries. Over the years 2003-2006 the exports of such products to EU-15 countries increased by almost 135%, and to EU-10 countries by over 165%. Imports from EU-15 countries increased by 75.5%, whereas imports from EU-10 states by 68.5%.
• The part of the Polish food market taken over by foreign producers was much smaller than the part of the EU market won over by Polish producers. As a result, over the years 2003-2006 the balance of foreign trade in agricultural and food products improved significantly: − The total balance changed from EUR 453.5 million in 2003 to EUR
2,116.8 million in 2006; − With EU-25 from EUR 440.8 million in 2003 to EUR 2,517.8 million
in 2006; − With EU-15 countries from EUR 193.1 million in 2003 to EUR 1,543.8
million in 2006. As a result of this, the three years of our EU membership have borne fruit in the form of fivefold growth of the total balance of foreign trade in agricultural and food products and almost sixfold growth of the balance of trade with the members of the enlarged Community.
• The index of coverage of agricultural and food product imports by exports of such products (TC – Trade Coverage) in the year 2006 exceeded 1.34, whereas in the year 2003 it amounted to only 1.13.
The mutual elimination of any limitations of access to EU markets and the necessity to cope with many conditions concerning access to third markets, turned out to be favourable for the Polish food economy in the final analysis.
33
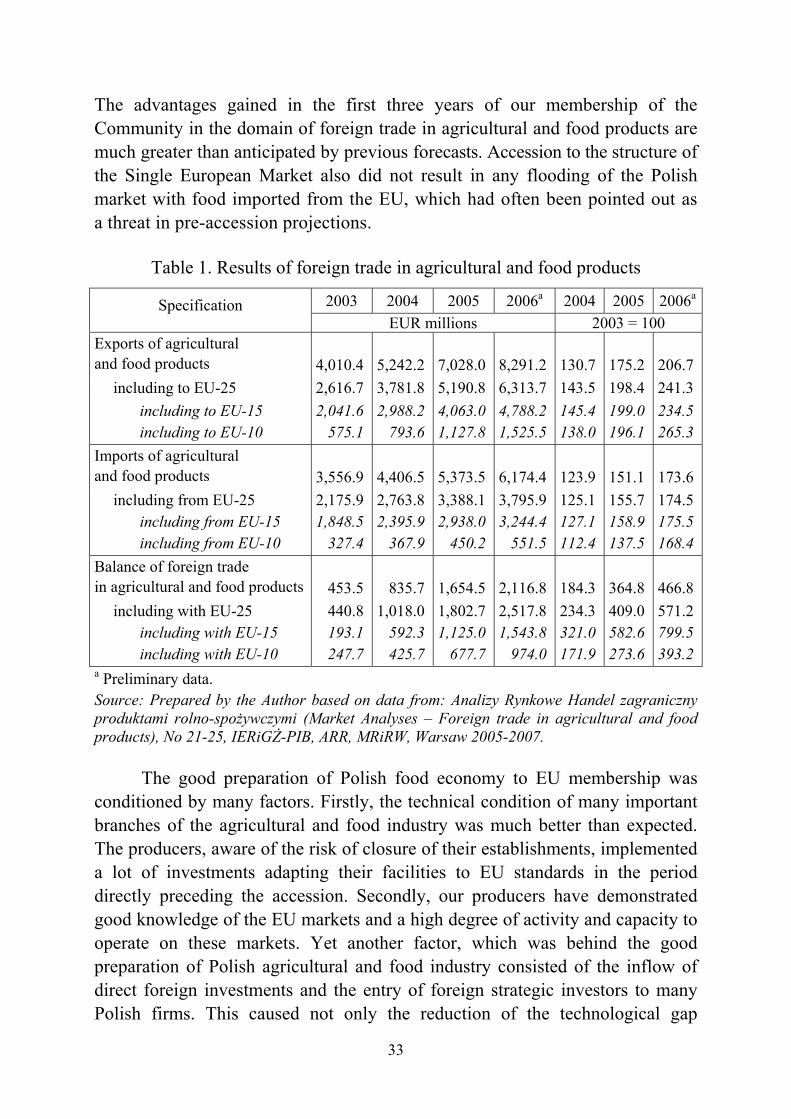
The advantages gained in the first three years of our membership of the Community in the domain of foreign trade in agricultural and food products are much greater than anticipated by previous forecasts. Accession to the structure of the Single European Market also did not result in any flooding of the Polish market with food imported from the EU, which had often been pointed out as a threat in pre-accession projections.
Table 1. Results of foreign trade in agricultural and food products
2003 2004 2005 2006a 2004 2005 2006aSpecification
EUR millions 2003 = 100 Exports of agricultural and food products
4,010.4
5,242.2
7,028.0
8,291.2
130.7
175.2
206.7
including to EU-25 2,616.7 3,781.8 5,190.8 6,313.7 143.5 198.4 241.3 including to EU-15 including to EU-10
2,041.6575.1
2,988.2793.6
4,063.01,127.8
4,788.21,525.5
145.4 138.0
199.0 196.1
234.5265.3
Imports of agricultural and food products
3,556.9
4,406.5
5,373.5
6,174.4
123.9
151.1
173.6
including from EU-25 including from EU-15 including from EU-10
2,175.9 1,848.5
327.4
2,763.8 2,395.9
367.9
3,388.1 2,938.0
450.2
3,795.9 3,244.4
551.5
125.1 127.1 112.4
155.7 158.9 137.5
174.5 175.5168.4
Balance of foreign trade in agricultural and food products
453.5
835.7
1,654.5
2,116.8
184.3
364.8
466.8
including with EU-25 including with EU-15 including with EU-10
440.8 193.1247.7
1,018.0 592.3425.7
1,802.7 1,125.0
677.7
2,517.8 1,543.8
974.0
234.3 321.0 171.9
409.0 582.6 273.6
571.2 799.5393.2
a Preliminary data. Source: Prepared by the Author based on data from: Analizy Rynkowe Handel zagraniczny produktami rolno-spożywczymi (Market Analyses – Foreign trade in agricultural and food products), No 21-25, IERiGŻ-PIB, ARR, MRiRW, Warsaw 2005-2007.
The good preparation of Polish food economy to EU membership was conditioned by many factors. Firstly, the technical condition of many important branches of the agricultural and food industry was much better than expected. The producers, aware of the risk of closure of their establishments, implemented a lot of investments adapting their facilities to EU standards in the period directly preceding the accession. Secondly, our producers have demonstrated good knowledge of the EU markets and a high degree of activity and capacity to operate on these markets. Yet another factor, which was behind the good preparation of Polish agricultural and food industry consisted of the inflow of direct foreign investments and the entry of foreign strategic investors to many Polish firms. This caused not only the reduction of the technological gap
34
between the food industry in Poland and the food industry in the EU-15 countries, but has also resulted in the dissemination of modern methods of management, marketing, etc. Many of our enterprises have become part of foreign firms, becoming therewith included in the processes of globalisation and international specialisation. It was also not without significance that the international distribution networks, by purchasing Polish food products for the needs of their entire networks, came to assume the role of special ambassadors of Polish food.
The growth of exports of agricultural and food products over the past few years has exerted major impact upon the development of the entire food industry. The share of exports in sales of the same industry was showing a systematic growth trend and over the years 2003-2006 it increased by 6 percentage points (from close to 14% to approx. 20%). In the years 2003-2006 the total value of sales of the products of the food industry increased by approximately PLN 35,000 million, including sales worth close to PLN 13,000 million placed on foreign markets. The growth of export demand, therefore constituted in those years approximately 40% of the growth of effective demand for the products of the agricultural and food industry.
Such fast growth of exports of agricultural and food products, as well as the significant improvement of the balance of foreign trade in this category of goods after Poland’s EU accession could not have happened if Polish products would not have been accepted and willingly purchased by consumers from other countries. The results of foreign trade indicate the significant degree of competitiveness of Polish food producers on international markets and they indicate that our product range offered for exports is both safe and of good quality, as well being attractively priced for foreign consumers.4
In accordance with the adopted methodology,5 for the purposes of analysis of competitiveness of Polish food producers after Poland’s EU accession, the assessment of the relationship between the value of agricultural and food exports from Poland to the value of sales from the main sectors of farming and the food industry (so called export orientation index).
4 An important role in the development of Polish agricultural and food exports was also played by re-export, i.e. the exports of finished goods produced from raw materials imported from other climate zones (this applies, in particular, to processed fish products, fruit and vegetable products, coffee and tea processing, the production of spices). 5 I. Szczepaniak, Ocena konkurencyjności polskich producentów żywności, Seria Program Wieloletni, Raport nr 15, [Assessment of competitiveness of Polish food producers, Series: Multi-Annual Program, Report No 15.], IERiGŻ-PIB, Warsaw 2005.
35
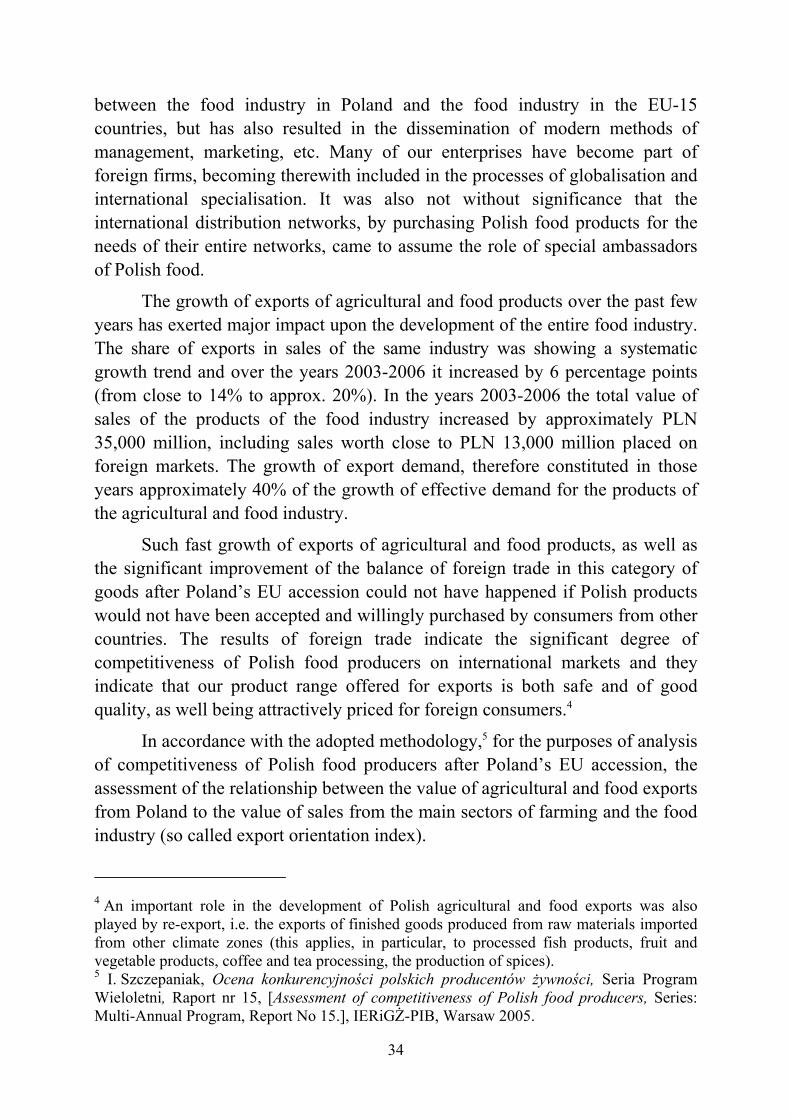
The ratio of the value of exports to the value of sales of farm products indicates that a strong export orientation in the years 2004-2006 was demonstrated by such sectors of agricultural production as the following: fruit and vegetables production, cattle and veal raising, as well as sheep and goats. Exports of horses were also significant. In these areas, with the exception of the sector of production of fruit, there was a large surplus of exports over imports. In the sector of fruit production, in spite of large exports, a negative balance of trade was noted, which is linked with the high position of fruit imports coming from other climate zones. The remaining groups of agricultural products were characterised by much weaker exporting orientation, although in 2005 there were also significant exports of cereals, involving especially oats and rye. Also in these sectors, the role of imports was small, with the exception of cereals (owing to maize) and potatoes. In the sector of production of potatoes, mainly due to large imports of potatoes in early spring varieties, a markedly negative balance of foreign trade was noted.
Table 2. Proportion of exports in sales of basic sectors of agriculture (percent) Specification 2004 2005 2006a
Vegetables 33.0 31.2 26.6 Fruit 37.0 30.7 22.8 Cattle and calves 30.9 29.1 30.6 Sheep and goats 104.9 90.6 99.6 Horses 86.5 63.5 58.8 Cereals 3.5 17.1 10.2 Potatoes 2.0 0.7 0.7 Swine 0.7 1.4 3.2 Poultry 1.1 1.3 1.8 Eggs 4.4 7.5 9.6 Milk 0.5 1.9 1.8 a Preliminary data. Source: Prepared by the Author based data from GUS and CIHZ.
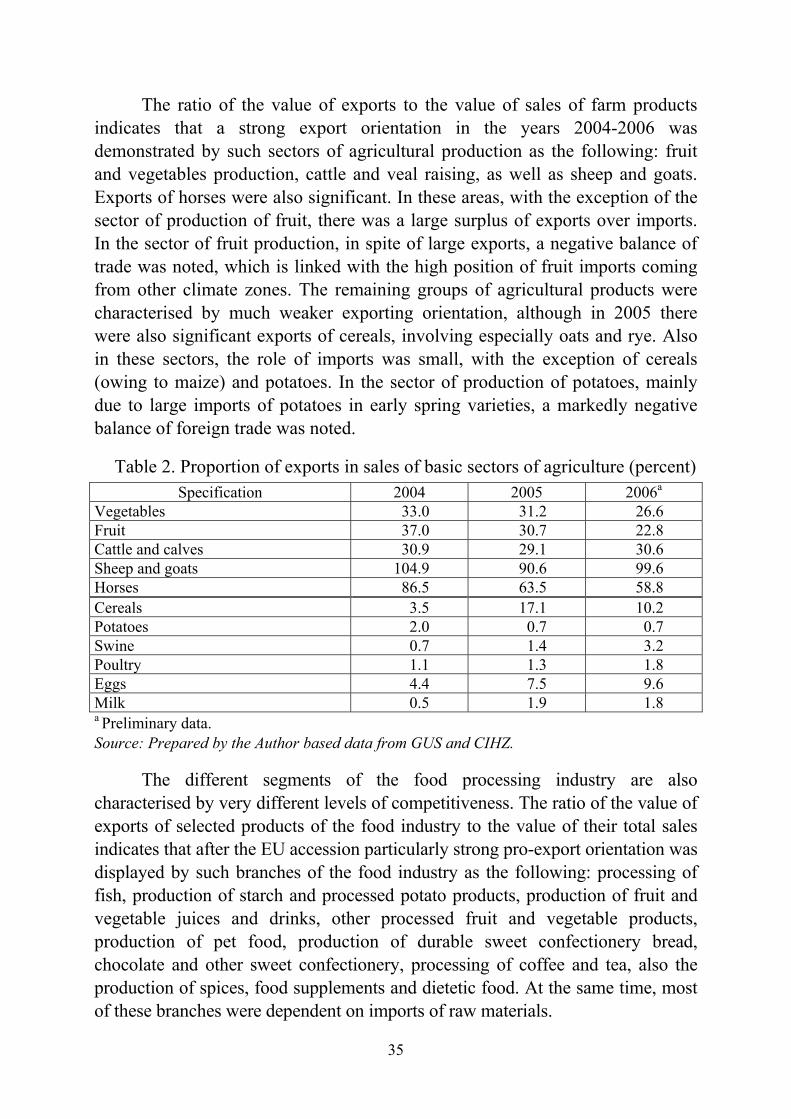
The different segments of the food processing industry are also characterised by very different levels of competitiveness. The ratio of the value of exports of selected products of the food industry to the value of their total sales indicates that after the EU accession particularly strong pro-export orientation was displayed by such branches of the food industry as the following: processing of fish, production of starch and processed potato products, production of fruit and vegetable juices and drinks, other processed fruit and vegetable products, production of pet food, production of durable sweet confectionery bread, chocolate and other sweet confectionery, processing of coffee and tea, also the production of spices, food supplements and dietetic food. At the same time, most of these branches were dependent on imports of raw materials.
36
In the years 2004-2006 the basic branches of the food industry were characterised by competitiveness close to the average level throughout the whole food industry. They included such branches of this industry as the following: production and processing of meat (including both red meat and poultry meat), production of oils, margarines and other fats, milk processing, production of sugar and the production of alcoholic beverages and tobacco products. At the same time, in some of these sectors (production of oil, margarines and other fats, sugar, and tobacco products) the phenomenon of marked increase of the contribution of exports to their sales, which in future periods may cause their shift to the group of segments with the highest competitiveness.
The segments of the food industry, which had low competitiveness and were not displaying the features of being export-oriented, consisted of the following: production of ice cream (although their exports have recently been rapidly growing), the production of processed cereals, pasta and fresh bread, the winery sector, beer brewing industry and soft drinks business, as well as production of fodder for livestock animals.
Table 3. Share of exports in sales of basic food industry branches (percent) Specification 2003 2004 2005 2006a
Fish and processed fish 62.2 61.5 58.3 56.8 Starch and processed potatoes 30.3 33.2 41.2 46.3 Fruit and vegetable juices and drinks 42.2 43.7 39.6 37.2 Processed fruit and vegetable products 40.8 42.2 34.9 35.6 Pet food 20.9 30.6 38.1 39.4 Durable sweet bread confectionary 37.2 51.8 58.0 61.1 Cocoa, chocolate and other sweets 31.8 29.8 28.1 26.1 Tea and coffee 41.1 51.8 59.6 80.7 Spices 21.9 27.6 28.6 22.2 Food supplements and dietetic food 14.0 17.6 54.0 58.6 Red meat and poultry meat, as well as processed products from such meat
15.0
13.2
16.2
16.2
Oil, margarine and other fats 7.1 9.8 20.4 28.4 Milk and processed milk products 11.7 17.0 21.9 19.5 Sugar 14.4 14.9 20.3 30.9 Alcoholic beverages 10.8 13.4 15.4 15.2 Tobacco and tobacco products 13.0 16.4 23.1 37.6 Ice cream 5.6 8.5 14.6 21.5 Processed cereals 4.9 5.6 8.6 8.9 Fresh bread 0.4 0.4 0.4 0.4 Biscuits 4.5 6.3 11.5 12.1 Pasta 9.8 11.8 14.6 11.1 Wine 1.3 1.4 2.5 2.2 Beer and malt 1.4 2.4 2.4 2.8 Soft drinks 3.4 7.8 11.0 11.9 a Preliminary data. Source: Prepared by the Author based on data from GUS and CIHZ.
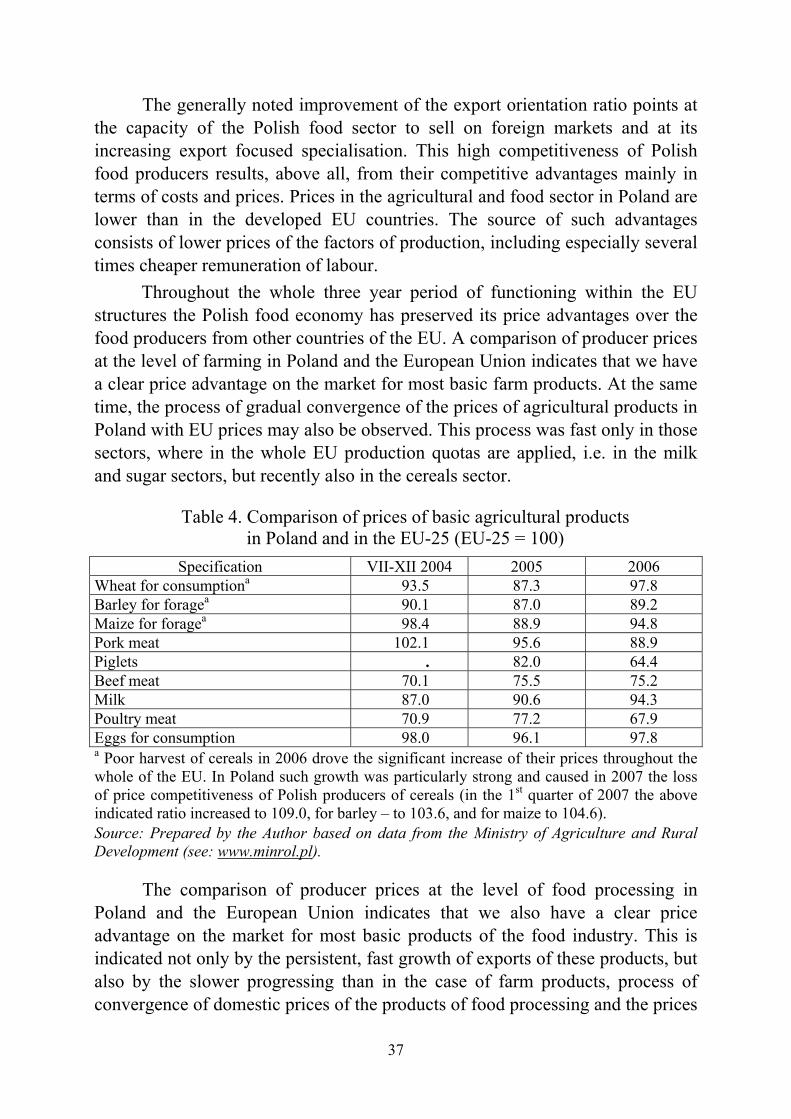
37
The generally noted improvement of the export orientation ratio points at the capacity of the Polish food sector to sell on foreign markets and at its increasing export focused specialisation. This high competitiveness of Polish food producers results, above all, from their competitive advantages mainly in terms of costs and prices. Prices in the agricultural and food sector in Poland are lower than in the developed EU countries. The source of such advantages consists of lower prices of the factors of production, including especially several times cheaper remuneration of labour.
Throughout the whole three year period of functioning within the EU structures the Polish food economy has preserved its price advantages over the food producers from other countries of the EU. A comparison of producer prices at the level of farming in Poland and the European Union indicates that we have a clear price advantage on the market for most basic farm products. At the same time, the process of gradual convergence of the prices of agricultural products in Poland with EU prices may also be observed. This process was fast only in those sectors, where in the whole EU production quotas are applied, i.e. in the milk and sugar sectors, but recently also in the cereals sector.
Table 4. Comparison of prices of basic agricultural products in Poland and in the EU-25 (EU-25 = 100)
Specification VII-XII 2004 2005 2006 Wheat for consumptiona 93.5 87.3 97.8 Barley for foragea 90.1 87.0 89.2 Maize for foragea 98.4 88.9 94.8 Pork meat 102.1 95.6 88.9 Piglets . 82.0 64.4 Beef meat 70.1 75.5 75.2 Milk 87.0 90.6 94.3 Poultry meat 70.9 77.2 67.9 Eggs for consumption 98.0 96.1 97.8 a Poor harvest of cereals in 2006 drove the significant increase of their prices throughout the whole of the EU. In Poland such growth was particularly strong and caused in 2007 the loss of price competitiveness of Polish producers of cereals (in the 1st quarter of 2007 the above indicated ratio increased to 109.0, for barley – to 103.6, and for maize to 104.6). Source: Prepared by the Author based on data from the Ministry of Agriculture and Rural Development (see: www.minrol.pl).
The comparison of producer prices at the level of food processing in Poland and the European Union indicates that we also have a clear price advantage on the market for most basic products of the food industry. This is indicated not only by the persistent, fast growth of exports of these products, but also by the slower progressing than in the case of farm products, process of convergence of domestic prices of the products of food processing and the prices
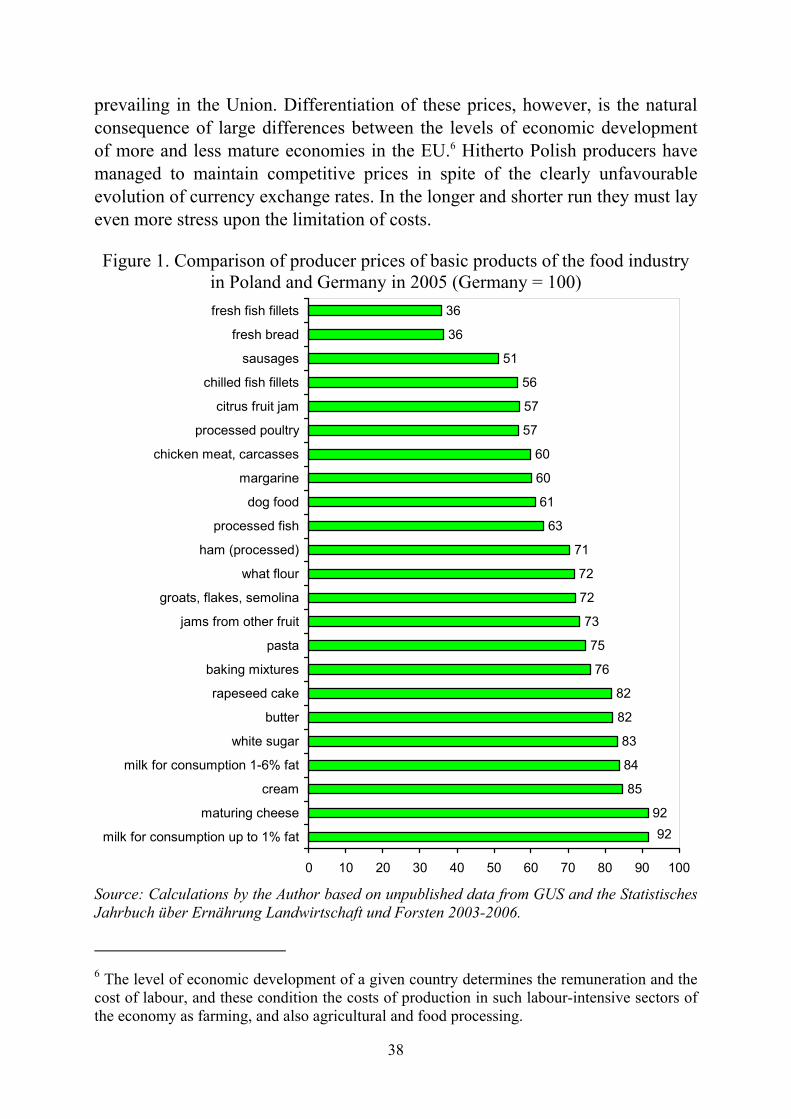
38
prevailing in the Union. Differentiation of these prices, however, is the natural consequence of large differences between the levels of economic development of more and less mature economies in the EU.6 Hitherto Polish producers have managed to maintain competitive prices in spite of the clearly unfavourable evolution of currency exchange rates. In the longer and shorter run they must lay even more stress upon the limitation of costs. Figure 1. Comparison of producer prices of basic products of the food industry
in Poland and Germany in 2005 (Germany = 100)
61
60
63
71
72
72
73
75
76
82
82
83
84
85
9292
60
57
57
56
51
36
36
0 10 20 30 40 50 60 70 80 90 100
milk for consumption up to 1% fat
maturing cheese
cream
milk for consumption 1-6% fat
white sugar
butter
rapeseed cake
baking mixtures
pasta
jams from other fruit
groats, flakes, semolina
what flour
ham (processed)
processed fish
dog food
margarine
chicken meat, carcasses
processed poultry
citrus fruit jam
chilled fish fillets
sausages
fresh bread
fresh fish fillets
Source: Calculations by the Author based on unpublished data from GUS and the Statistisches Jahrbuch über Ernährung Landwirtschaft und Forsten 2003-2006.
6 The level of economic development of a given country determines the remuneration and the cost of labour, and these condition the costs of production in such labour-intensive sectors of the economy as farming, and also agricultural and food processing.
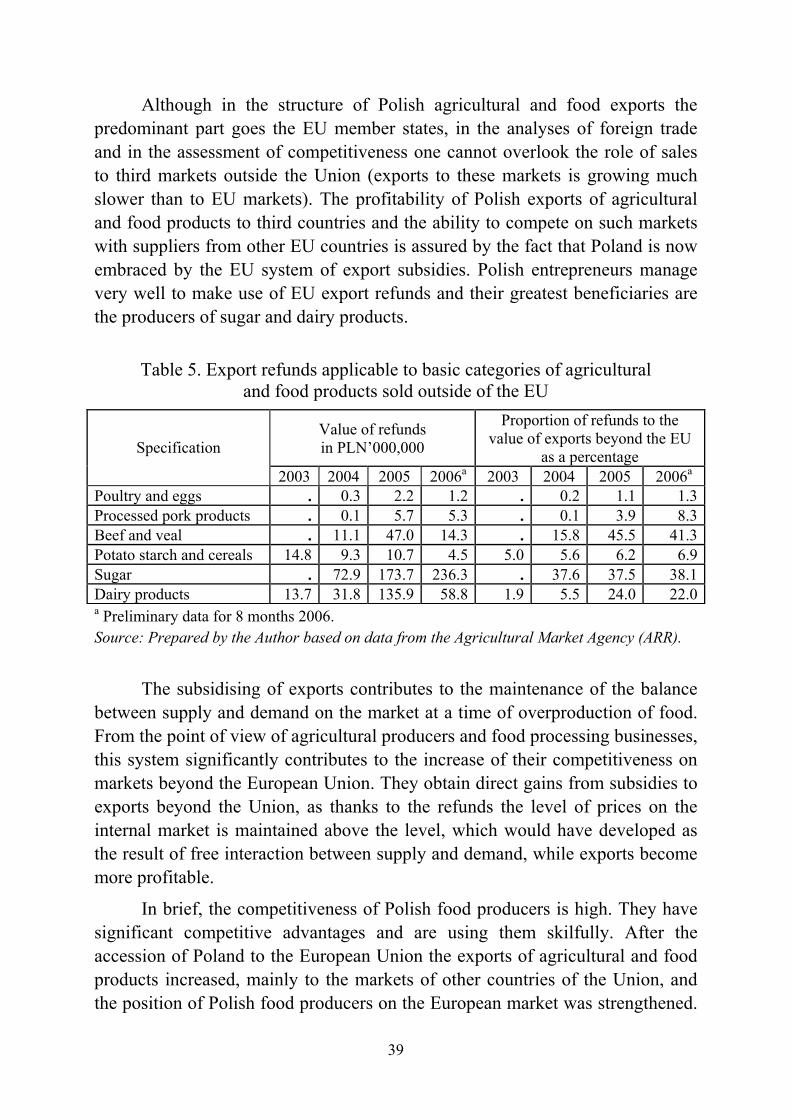
39
Although in the structure of Polish agricultural and food exports the predominant part goes the EU member states, in the analyses of foreign trade and in the assessment of competitiveness one cannot overlook the role of sales to third markets outside the Union (exports to these markets is growing much slower than to EU markets). The profitability of Polish exports of agricultural and food products to third countries and the ability to compete on such markets with suppliers from other EU countries is assured by the fact that Poland is now embraced by the EU system of export subsidies. Polish entrepreneurs manage very well to make use of EU export refunds and their greatest beneficiaries are the producers of sugar and dairy products.
Table 5. Export refunds applicable to basic categories of agricultural
and food products sold outside of the EU
Value of refunds in PLN’000,000
Proportion of refunds to the value of exports beyond the EU
as a percentage Specification
2003 2004 2005 2006a 2003 2004 2005 2006a Poultry and eggs . 0.3 2.2 1.2 . 0.2 1.1 1.3Processed pork products . 0.1 5.7 5.3 . 0.1 3.9 8.3Beef and veal . 11.1 47.0 14.3 . 15.8 45.5 41.3Potato starch and cereals 14.8 9.3 10.7 4.5 5.0 5.6 6.2 6.9Sugar . 72.9 173.7 236.3 . 37.6 37.5 38.1Dairy products 13.7 31.8 135.9 58.8 1.9 5.5 24.0 22.0a Preliminary data for 8 months 2006. Source: Prepared by the Author based on data from the Agricultural Market Agency (ARR).
The subsidising of exports contributes to the maintenance of the balance between supply and demand on the market at a time of overproduction of food. From the point of view of agricultural producers and food processing businesses, this system significantly contributes to the increase of their competitiveness on markets beyond the European Union. They obtain direct gains from subsidies to exports beyond the Union, as thanks to the refunds the level of prices on the internal market is maintained above the level, which would have developed as the result of free interaction between supply and demand, while exports become more profitable.
In brief, the competitiveness of Polish food producers is high. They have significant competitive advantages and are using them skilfully. After the accession of Poland to the European Union the exports of agricultural and food products increased, mainly to the markets of other countries of the Union, and the position of Polish food producers on the European market was strengthened.
40
In most branches the processes of adaptation of the production facilities to EU standards were completed and the processes of propagation of quality management systems were accelerated, which significantly enhanced their competitiveness. After the accession of Poland to the EU it turned out that the threats were lesser than it had been previously estimated and that our food producers take good advantage of the opportunities that have emerged as the result of the opening of the large and wealthy European market for food. This sector is well prepared to operate on the Common European Market.
The competitiveness of the Polish food sector is determined, above all, by lower prices in the agricultural and food sector in Poland when compared with the more developed EU countries. Competitiveness on the EU market and on global markets, however, are not based only on price competition. The factors of competitiveness include also: the development of enterprise, improvement of the local environment, rationalisation of organisational and ownership structures, and also competition policy realised by the state. Also the quality features, which significantly differentiate products are extremely important. They include, in particular: quality and uniqueness, in the domain of products, the ability to identify and satisfy individual needs of the clients, versatile promotion activities and the image of the firm based on confidence in the quality and reliability of the products, as well as quality of customer service. These factors may determine our competitiveness in the future and be decisive for the acceptance of Polish products by consumers from other countries.
Consumers from other EU countries already accept Polish food today, together with its quality features, as the increase of the export orientation of different branches of the food economy indicates. The growing sales on demanding foreign markets, subject to rigorous rules of quality control, indirectly gives evidence of the high quality of our food. As competition on foreign markets builds up, however, Polish producers and exporters of food should attach even greater attention to the quality aspects and promote our products even more effectively than before, the more so as following the accession to the Union they have improved their skills concerning the documentation of quality, compliance with complex procedures or the methods of communication with the closest potential recipients.
41
Dr. Marek Wigier Institute of Agriculture and Food Economics – National Research Institute Warsaw, Poland
Public Resources as the Source for Funding Investments in the Polish Food Industry
Food industry is one of the key sectors of the Polish national economy. Its share in GDP stands at about 6%, and the gross added value it generates fetches around EUR 6 billion. The importance of this branch is also reflected by the fact that it holds an approximately 20% share products sold by the entire industry and an about 16% share in total employment of this sector. Manufacturing food and beverages, the Polish food industry is also an important player on the European market. On its accession to the EU, Poland has grown to become the sixth biggest food producer and a major net exporter of agricultural and food products. The year 2003 marked a positive balance in foreign food trade (for the first time since the early nineties) totalling almost EUR 0.5 billion, whereas the positive balance in 2006 fetched EUR 2.1 billion. Better condition of this sector is also confirmed by the growing share of industrial products in agricultural and food export, which accounted for over 82% of export in 2006. The EU enlargement by adoption of 12 new states boosted the share of the EU-24 countries in foreign trade of agricultural and food products to about 78%.
The success of Polish food producers on the European market was driven by privatisation of this sector, structural transformations rolled out in the food industry in the 1990-ties as well its adjustment to the EU veterinary and sanitary standards during the pre-accession period. These processes were reinforced by financial resources allocated from the EU budget as well as national sources.
In the 1990-ties as well as in the years preceding accession to the EU, investments in the food sector were mainly funded with own resources of entities, preferential loans with ARiMR1 subsidies as well as commercial bank loans. ARiMR deployed subsidies mainly to interest on key investment credits and supported the sector’s restructuring schemes: production of potato-derived starch, meat and milk processing as well as provided credit warranties and securities. The PHARE programme was the major source of funding, which provided resources for upgrading of the Polish agricultural and food processing
1 ARiMR – The Agency for Agriculture Restructuring and Upgrading.
42
sector, and especially its adjustment to the EU standards. PHARE resources were allocated to set up veterinary and phytosanitary food control systems, design CAP mechanisms2 as well as to implement restructuring of the Polish milk processing plants and their adjustment to the EU standards3. Support for the agriculture, rural areas and food industry granted under the PHARE programme (totalling around EUR 230 million) accounted for approx. 10% of total resources allocated to Poland under this scheme.
The launch of pre-accession funds (the SAPARD programme), and structural funds on Poland’s accession to the EU (SOP „Agriculture”4 and RDP5 programmes) with direct payments allocated to rural areas and the entire food industry, marked a new influx of public funding. The EU and domestic transfers went up from about PLN 1.8 billion in 2003 to fetch around PLN 14 in 2006. From early May 2004 until end- 2006, total transfers of public resources exceeded PLN 36 billion. The bulk of these funds were area payments (about PLN 20.3 billion) as well as payments supporting implementation of structural programmes, including SAPARD, RDP, SOP „Agriculture”, and SOP „Fishery”. The food industry had its share in the above transfers and managed to successfully capitalise on them. Between 2000 and 2002, investment expenditures in the food industry rose from about PLN 4 billion per year to around PLN 6 billion.
Launched in 2002, the SAPARD programme served as a major supplement to investment funding for the food industry. PLN 1,708.9 million, that is 35.3% of total financial resources granted under this scheme, were allocated to investments in improvement of processing and marketing of agricultural and fish products (action 1 of the SAPARD programme). Its goals also included improvement of production safety and the quality of food, increase in the number of manufacturing sites conforming to the EU sanitary and veterinary requirements for food processing, supporting production restructuring and enhancement of the competitive edge of the food sector, reinforcement of agricultural producer groups and limiting the negative impact of the food industry on the environment. Eventually, the programme was rolled out to cover only four sectors of food manufacturing: milk, meat, fruit and vegetable processing with relevant transition periods arranged in the course of accession negotiations.
2 CAP – Common Agricultural Policy. 3 A 1999 PHARE project called „Common Milk Fund” – EUR 40 million. 4 The full name of the programme is the Sectoral Operating Programme „Restructuring and upgrading the food sector and development of rural areas in the years 2004-2006”. 5 RDP – Rural Development Plan for the years 2004-2006.
43
Despite initial issues constraining the launching of this action, administration barriers and problems with drafting applications by future beneficiaries, public support met with enormous interest of entrepreneurs. Due to limited resources as well as massive investment needs, a portion of applications to which financial resources were not allocated under the SAPARD programme, received allocations from structural funds as late as on Poland’s accession to the EU. When the SAPARD programme was launched, 1,342 contracts were made with entities to implement projects related to improvement of processing and marketing of agricultural and fish products, also in the meat sector (689 contracts), milk (325 contracts), fruit and vegetable (241 contracts) and fish industry (87 contracts). According to the status at end-2006, the total value of subsidies, paid out in line with all applications submitted, exceeded PLN 1,523 million. These subventions were mainly allocated (59% of the support value) to procurement of new machinery and devices. Their overwhelming majority was related to adoption of the EU standards and implementation of sanitary and veterinary requirements. 513 manufacturing sites implemented the HACCP system and 716 entities adopted themselves to the EU standards. Assistance allocated to 60% of projects failed to exceed PLN 1 million, and corresponded to the maximum value of PLN 5-10 million in case of 4% companies. Most funds (60%) were allocated to purchase and installation of machinery and equipment for agricultural product processing. Procurement of materials, construction services, installations and equipment accounted for barely 40% of investment expenditures.
In addition to implementation of contracts made under the SAPARD programme during the pre-accession period, on Poland’s accession to the EU, the food industry gained access to whole new sources of public funding, which was granted under the action „Improvement of processing and marketing of agricultural products” of the „Agriculture” Sectoral Operating Programme. This action supports adjustment of the agricultural and food industry to the EU standards in food safety and environmental protection. The goal of the support provided was to streamline production for the market and capitalise on the existing “market niches”, develop new distribution channels, deploy new technologies, improve food quality, increase the added value of production and improve animal welfare. These investments may also be focused on improvement of wholesale market infrastructure, the status of the cooling infrastructure for food products and their calibration. This time, support was available to a much wider (than in case of the SAPARD programme) of group of entities with core business focused on agricultural product processing (milk, meat, fruit and vegetable, grain, production of potato-derived starch, eggs, hoop, honey, flax, and hemp), commercial meet storage and freezing services and egg packing as well as wholesale trade. Total financial support allocated to these investments
44
in the years 2004-2006 totalled PLN 1,976.0 million, what corresponds to 26.3% of public funding granted under the SOP „Agriculture” programme.
Until end-February 2007, contracts worth PLN 1861 million were made with 1089 entities, what led to the ultimate allocation of total funds appropriated to implementation of this action. The biggest number of investments was pursued by the meat sector (35% of total projects), the milk industry (23%), fruit and vegetable sector (21%), and poultry sector (11%). Such structure confirms that although subventions were also available to other sectors of the food processing industry, as much as 90% contracts (Table 1) were streamlined to sectors which were previously co-financed under the SAPARD programme. At the same time, almost one-third of total projects is implemented by entities who have previously capitalised on SAPARD. High interest of future beneficiaries in the scheme is testified by the fact that the budget allocated to this action was exceeded by 50% in October 2005, what resulted in suspension of admission of subsequent applications. The number of 1000 beneficiaries of financial support, which was scheduled in the action was significantly exceeded.6
Table 1. Projects under action „Improvement of processing and marketing of agricultural products” of the „Agriculture” SOP by sectors
Key Sector Number of projects approved
Number of projects implemented
Meat 189 41 Milk 216 40 Poultry (eggs and poultry) 103 8 Other animal products 135 23 Grain products 35 6 Dairy products 6 1 Fruit and vegetables 199 37 Flower and decorative flowers 6 2 Potatoes 6 0 Hoop 1 0 Honey 1 0 Flax and hemp processing 1 0 Other vegetative products 0 0 Mixed products 18 1 Others 13 1 TOTAL 929 160 including products of sustainable farming 2 0 Source: Own study based on ARiMR data (status as of end Q2 2006).
6 ARiMR received as much as 1644 applications altogether for financial support under action 1.5 „Improvement of processing and marketing of food products”.
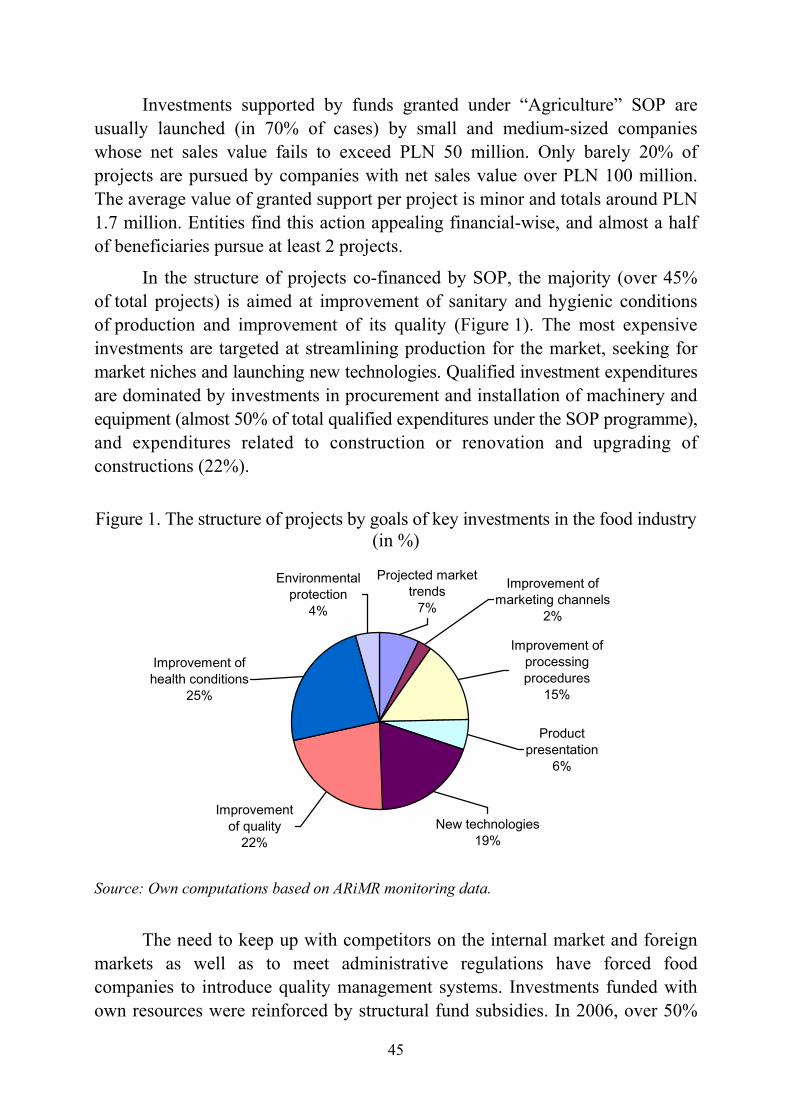
45
Investments supported by funds granted under “Agriculture” SOP are usually launched (in 70% of cases) by small and medium-sized companies whose net sales value fails to exceed PLN 50 million. Only barely 20% of projects are pursued by companies with net sales value over PLN 100 million. The average value of granted support per project is minor and totals around PLN 1.7 million. Entities find this action appealing financial-wise, and almost a half of beneficiaries pursue at least 2 projects.
In the structure of projects co-financed by SOP, the majority (over 45% of total projects) is aimed at improvement of sanitary and hygienic conditions of production and improvement of its quality (Figure 1). The most expensive investments are targeted at streamlining production for the market, seeking for market niches and launching new technologies. Qualified investment expenditures are dominated by investments in procurement and installation of machinery and equipment (almost 50% of total qualified expenditures under the SOP programme), and expenditures related to construction or renovation and upgrading of constructions (22%).
Figure 1. The structure of projects by goals of key investments in the food industry
(in %)
Projected market trends
7%
Environmental protection
4%
Improvement of health conditions
25%
Improvement of marketing channels
2%
Improvement of processing procedures
15%
Product presentation
6%
New technologies19%
Improvementof quality
22%
Source: Own computations based on ARiMR monitoring data.
The need to keep up with competitors on the internal market and foreign markets as well as to meet administrative regulations have forced food companies to introduce quality management systems. Investments funded with own resources were reinforced by structural fund subsidies. In 2006, over 50%
46
of total companies from the food sector implemented the Good Hygiene Practices (GHP) programme, and subsequently 30% more businesses were in the process of putting it in place. Good Manufacturing Practises (GMP) were observed at the time by about 45% food companies (and about 30% of businesses were in the process of implementing it),whereas the HACCP system was deployed by some 30% of entities (slightly over 20% were then implementing it). The highest implementation dynamics of obligatory quality management systems was observed after 1 May 2004 in small food companies. The number of entities operating these systems went up two or even tree-fold, depending on the sector. Implementation of systems assuring production quality led to a growth in the number of plants holding export certificates.
The value of subsidies granted to entities under the “Agriculture” SOP programme varies by regions. The average value of allocated assistance ranged from PLN 640,000 in the Śląsk voivodeship to over PLN 3 million in the Podlasie voivodeship. Overall, in voivodeships being home to robust food industry (mainly large dairy and meat processing plants), the value of subsidies was higher than in other regions. The overwhelming majority of applications strove to gain much lower value of support than available, and ranged from PLN 6.5 million in the Podlasie voivodeship, PLN 5.6 million in the Warmińsko- -Mazurskie to PLN 1.3 million in the Silesian voivodeship or PLN 1.9 million in the Lubuskie voivodeship. Support granted to the bulk of projects (65%) failed to exceed PLN 1 million, and fetched over PLN 10 million in barely 3.5% of total projects, what indicates that the ceiling value set by the programme at PLN 20 million proved to be exuberant.
Key deliverables of food industry investments, which were co-financed with public funding, include improvement of quality and the competitive edge of its output. Food companies were mainly focused on investments in improvement and control of health conditions and output quality as well as implementation of new technologies. Entities demonstrated no interest in development of new markets, innovations or initiatives aimed at better use or utilisation of production waste and by-products.
In the new budgetary period between 2007 and 2013, co-funding of investments in the food sector with public resources was also envisioned under the RDP7 programme. At the same time, investment goals were reformulated together with the amount and the scope of financial support granted to entities. The goal of action „Increasing the added-value of basic agricultural or forest
7 Rural Development Plan for the years 2007-2013.
47
production” includes improvement of its competitive edge by increase of its added value, output, cost decrease, development of new products, process and technologies as well as improvement of production conditions, what facilitated meeting existing and newly enforced standards. Direct support granted to entities is aimed at improving the status of agricultural producers who have the potential to achieve greater stabilisation of sales of agricultural products thanks to contracts with processing plants.
Unlike SAPARD or “Agriculture” SOP programmes, the new scheme8 for the years 2007-2013 is addressed to all small, medium-sized and large economic entities whose core business is focused on processing or trade in agricultural products and which employ up to 750 staff members or demonstrate turnover under EUR 200 million. The support will thus cover more sectors of agricultural and food processing industry than previous programmes, including production and processing of meat, juices, fruit and vegetable products, milk, grain, raw and refined oils and fats for bio-diesel, potato and grain-derived starch, animal foodstuffs, powdered eggs, hoop extracts and granulates, honey, ethyl alcohol for energy production, fruit wines and cider, flax and hemp. In addition, support will be granted to wholesale trade in grain, seeds and animal foodstuffs, flowers and plants, fruit and vegetable, meat and its products as well as commercial freezing, storage and warehousing agricultural products as well as lease of non-residential constructions for wholesale in agricultural products.
As compared to “Agriculture” SOP and the SAPARD programme, the new scheme comes with an expanded scope of investments to be supported with public funding. Assistance will be exclusively available to entities which meet hygiene and sanitary, environmental and animal welfare standards. Exceptions from this rule will only apply to micro-entities with employment level of 10 employees and under and annual turnover below EUR 2 million. Such companies may apply for co-funding of investments aimed at their adjustment to newly enforced standards based on the EU regulations. Contrary to current solutions, the scheme offers a diversified level of investment funding (from 25 to 50% of qualified expenditures), depending on the size of an entity and the format of cooperation with raw product suppliers. The bigger is the entity and its contract-driven cooperation with farmers or producer groups, the higher is the amount of funding.
8 Draft ordinance of the Ministry of Agriculture and Agricultural Development on detailed conditions and procedures for funding granted under action „Increasing the amount of the added-value of basic agricultural and forest production” covered by RDP in the years 2007- -2013. www.minrol.gov.pl
48
Public support addressed to the food industry has triggered its significant upgrading and boosted its competitive edge, what was made possible when the Polish economy opened itself to external competition. Accession to the EU enabled Polish entities to join the single market. The Polish food sector gained access to the European market which is home to over 420 million consumers, but also has exposed itself to competition of food producers from the remaining 24 EU member states. From 1 January 2007 onwards, upon the EU enlargement with Bulgaria and Romania, this market has been further expanded by 28 million more consumers. And although offering products which failed to conform to the EU standards, many Polish entities were not ready to launch their operations on the common market and many feared that food producers will not be able to adjust themselves to the EU regulations, it turned out that a surprisingly large number of entities have put adjustment measures in place. Between 2004 and 2006, the number of plants certified to trade on the EU markets went up 14-fold in the meat sector (to 856 entities), 5-fold in the poultry sector (up to 218 entities) and the dairy sector (up to 272 entities), and three times in the fish sector (up to 195 entities), with implementation of quality management systems (HACCP, GHP, GMP) also being accelerated. SAPARD and “Agriculture” SOP were the driving force of this process, with both schemes enabling implementation of almost 2,900 projects in various food companies. The Polish food and agriculture processing industry has grown to become competitive on the European market.
Investment needs, especially focused on innovations, cutting manufacturing costs and environmental protection, remain high. Deliverables of public funding allocated to the food sector to-date indicate that it has managed to successfully capitalise on all resources obtained. Solutions to be introduced by the programme in the years 2007-2013 offer benefits to the food sector, but are unable to solve its specific problems. The Ministry of Agriculture and Rural Development estimates that about 3,000 entities, that is 15% of all entitled businesses, will benefit from the programme in the seven-year perspective. The budget allocated to implementation of the action (EUR 1.1 billion for the years 2007-2013) offers average support per entity at about EUR 370,000 (PLN 1,450,000). This is much less that the maximum quota of support. RDP 2007-2013 probably marks the last chance for the food sector to obtain public funding co-financed by the EU budget, which is aimed at improvement of the competitive and innovative edge of production, decrease in its costs, rise in the added-value and supporting adjustments to the binding or newly-enforced regulations. Whether this chance is wasted or not – this is now up to entities themselves.
49
Dr. Janusz Rowiński Institute of Agricultural and Food Economics – National Research Institute Warsaw, Poland
Significance of EU Co-Financed Programmes for the Polish Food Economy and Rural Areas
1. Initial Remarks
Poland belongs to the poorest countries of the European Union (in terms of GDP per capita, it occupies the fourth worst position, followed only by Latvia and two states which entered the EU on January 1, 2007 – Bulgaria and Romania), and the national financial resources that can be assigned for development are insufficient to assure fast progress of its economy and civilization. Foreign capital flows into Poland, but it targets those sectors, which guarantee profits, i.e. industry, trade and services. Moreover, most foreign investments are located in large cities or their suburbs. Polish capital also avoids smaller towns and rural areas. Rural areas, therefore, can only draw on their own resources or national public funds.
As a result, we are witnessing an increasingly clear division of Poland into two parts – large cities, which experience fast development, and small towns with surrounding rural areas, which develop at a slower pace, or suffer from economic stagnation. Hence, interregional differentiation of Poland’s economic development is growing. Differences between voivodships (provinces) are increasing. Differentiation between districts (poviats) within voivodships is also intensifying.
Slow development or economic stagnation of many rural regions is undoubtedly one of the most serious economic and social problems faced by Poland. In Poland, rural areas account for about 93% (291,000 km2) of the total area of the country and are inhabited by approximately 14.7 million people (38.6% of the total population of Poland). Agriculture employs 2.1 million people (16.2% of the total employed). One of the tasks of the state and the local authorities is to help local communities create conditions that would enable the achievement of adequate standards of living. Obviously, a lot depends on people’s ability to cope with difficulties; nevertheless, they cannot solve without external aid all the problems. Hence, there is a need for various organizational measures and investments, leading to improvement of the quality of education in

50
rural schools (which is usually much lower than in the urban schools) and better access to healthcare services. It is also necessary to invest in technical infrastructure (water supply systems, sewage systems, sewage treatment plants). The transport infrastructure is of special importance, including both roads and railways, since it is not possible for full social infrastructure (education and healthcare) to be available in each village, and for each person to work in the same place where he/she lives. Moreover, the state should enhance the possibilities for active inhabitants of rural areas to undertake potentially successful business initiatives.
In order for the state and the local governments to fulfil their obligations towards inhabitants and to stimulate people’s initiatives, significant funds are needed. National resources, both public and private, are not sufficient. This is why external support, including especially EU funds, is of such great importance.
2. Implementation of EU Programmes Providing Support to Polish Agriculture and Rural Areas Poland, including its rural areas, received EU financial assistance
(PHARE programme) since the beginning of the 1990s. Only in the initial years of the current decade, however, when membership negotiations were well advanced, it obtained significant resources for the development of rural areas from the SAPARD programme. The programme, covering all candidate countries of Central and Eastern Europe, including Bulgaria and Romania, was aimed at providing assistance in: (1) efficient implementation of the acquis communautaire in the area of common agricultural policy and related policies; and (2) solving the most important problems of agriculture and rural areas in the candidate countries.
Candidate countries had the possibility to choose from a list of 14 measures (Measure 15 consisted of technical assistance necessary to implement the remaining measures). Poland recognized four measures as the most important ones: 1. Investments in agricultural holdings; 2. Investments in those branches of the agri-food industry which had difficulty in adjusting to EU standards; 3. Investments in municipal technical infrastructure; 4. Support for non-agricultural economic activities (the final distribution of the total funds between measures, including all the shifts during the implementation of the SAPARD programme, is shown in Table 1).

51
Table 1. SAPARD, RDP–2004, SPOR and RDP–2013 programmes Distribution of total public (EU and national) funds among measures
(in million EUR)
SAPARD RDP–2004 and SPOR RDP–2013
Measure total fundsspent
average in 1 year
total funds
planned
average in 1 year
total funds
planned
average in 1 year
Vocational training and information actions
5.5 1.4 19.4 /s/ 6.5 /s/ 50.0 7.1
Setting up of young farmers 178.9 /s/ 59.6 /s/ 440.0 62.9 Early retirement 534.9 /p/
178.3 /p/ 2,187.6
[1,400.0] (787.6)
312.5 [200.0] (112.5)
Modernization of agricultural holdings
128.0 32.0 586.6 /s/ 195.5 /s/ 1,650.0 235.7
Adding value to agricultural and forestry products
280.5 70.1 502.7 /s/ 167.6 /s/ 1,100.0 157.1
Infrastructure related to the development and adaptation of agriculture and forestry
195.5 /s/ 65.2 /s/ 629.9 90.0
Participation of farmers in food quality schemes
120.0 17.1
Information and promotion activities 30.0 4.3 Producer groups 6.4 /p/
2.1 /p/
140.0 [10.0]
(130.0)
20.0 [1.4]
(18.6) Setting up of management, relief and advisory services
42.8 /s/ 14.3 /s/ 400.0 57.1
Semi-subsistence farming 329.1 /p/
109.7 /p/ 440.0 [440.0]
( - )
62.9 [62.9] [ - ]
Handicap payments in mountain areas and payments in other areas with handicaps
957.8 /p/
319.3 /p/ 2 448.8 349.8 [
Natura 2000 payments and payments linked to the Directive 2000/60/EC
550.0 78.6
Agro-environment payments - - 218.9 /p/
73.0 /p/ 1,753.8 [853.8] (900.0)
250.5 [122.0] (128.6)
First afforestation of agricultural land and first afforestation of non-agricultural land
84.7 /p/
28.2 /p/
653.5 [183.8] (469.7)
93.4 [26.2] (67.1)
Restoring forestry potential and introducing prevention actions
13.9 /s/ 4.6 /s/ 140.0 20.0
Diversification into non-agricultural activities
472.3 67.5
Basic services for the economy and rural population
459.9 115.0 1,471.4 210.2
Conservation and upgrading the rural heritage
112.5 /s/ 37.5 /s/ 823.6 117.7
Creation and development of micro-enterprises
1,150.3 164.3
Technical assistance 1.0 0.3 21.5 /p/ 7.2 /p/
266.6 38.1
Leader+ 30.4 /s/ 10.1 /s/ 300.0 42.9
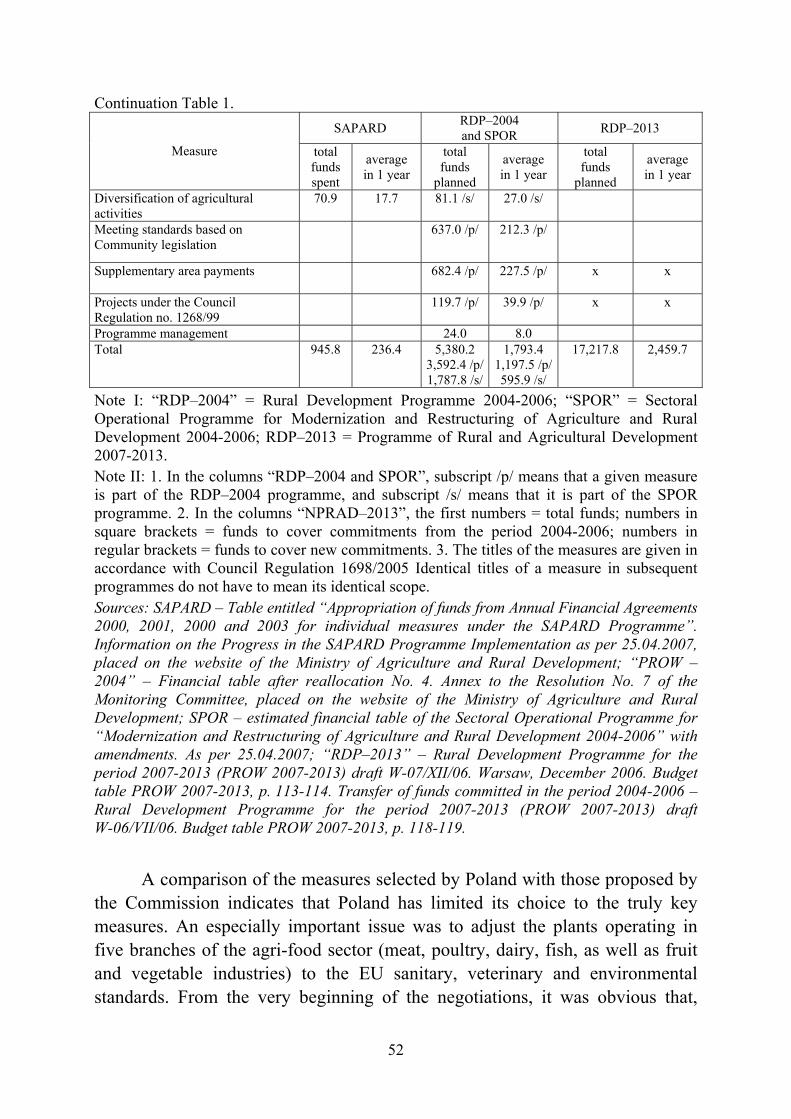
52
Continuation Table 1. SAPARD RDP–2004
and SPOR RDP–2013
Measure total fundsspent
average in 1 year
total funds
planned
average in 1 year
total funds
planned
average in 1 year
Diversification of agricultural activities
70.9 17.7 81.1 /s/ 27.0 /s/
Meeting standards based on Community legislation
637.0 /p/
212.3 /p/
Supplementary area payments 682.4 /p/
227.5 /p/ x x
Projects under the Council Regulation no. 1268/99
119.7 /p/
39.9 /p/
x x
Programme management 24.0 8.0 Total 945.8 236.4 5,380.2
3,592.4 /p/1,787.8 /s/
1,793.4 1,197.5 /p/595.9 /s/
17,217.8 2,459.7
Note I: “RDP–2004” = Rural Development Programme 2004-2006; “SPOR” = Sectoral Operational Programme for Modernization and Restructuring of Agriculture and Rural Development 2004-2006; RDP–2013 = Programme of Rural and Agricultural Development 2007-2013. Note II: 1. In the columns “RDP–2004 and SPOR”, subscript /p/ means that a given measure is part of the RDP–2004 programme, and subscript /s/ means that it is part of the SPOR programme. 2. In the columns “NPRAD–2013”, the first numbers = total funds; numbers in square brackets = funds to cover commitments from the period 2004-2006; numbers in regular brackets = funds to cover new commitments. 3. The titles of the measures are given in accordance with Council Regulation 1698/2005 Identical titles of a measure in subsequent programmes do not have to mean its identical scope. Sources: SAPARD – Table entitled “Appropriation of funds from Annual Financial Agreements 2000, 2001, 2000 and 2003 for individual measures under the SAPARD Programme”. Information on the Progress in the SAPARD Programme Implementation as per 25.04.2007, placed on the website of the Ministry of Agriculture and Rural Development; “PROW – 2004” – Financial table after reallocation No. 4. Annex to the Resolution No. 7 of the Monitoring Committee, placed on the website of the Ministry of Agriculture and Rural Development; SPOR – estimated financial table of the Sectoral Operational Programme for “Modernization and Restructuring of Agriculture and Rural Development 2004-2006” with amendments. As per 25.04.2007; “RDP–2013” – Rural Development Programme for the period 2007-2013 (PROW 2007-2013) draft W-07/XII/06. Warsaw, December 2006. Budget table PROW 2007-2013, p. 113-114. Transfer of funds committed in the period 2004-2006 –Rural Development Programme for the period 2007-2013 (PROW 2007-2013) draft W-06/VII/06. Budget table PROW 2007-2013, p. 118-119.
A comparison of the measures selected by Poland with those proposed by the Commission indicates that Poland has limited its choice to the truly key measures. An especially important issue was to adjust the plants operating in five branches of the agri-food sector (meat, poultry, dairy, fish, as well as fruit and vegetable industries) to the EU sanitary, veterinary and environmental standards. From the very beginning of the negotiations, it was obvious that,
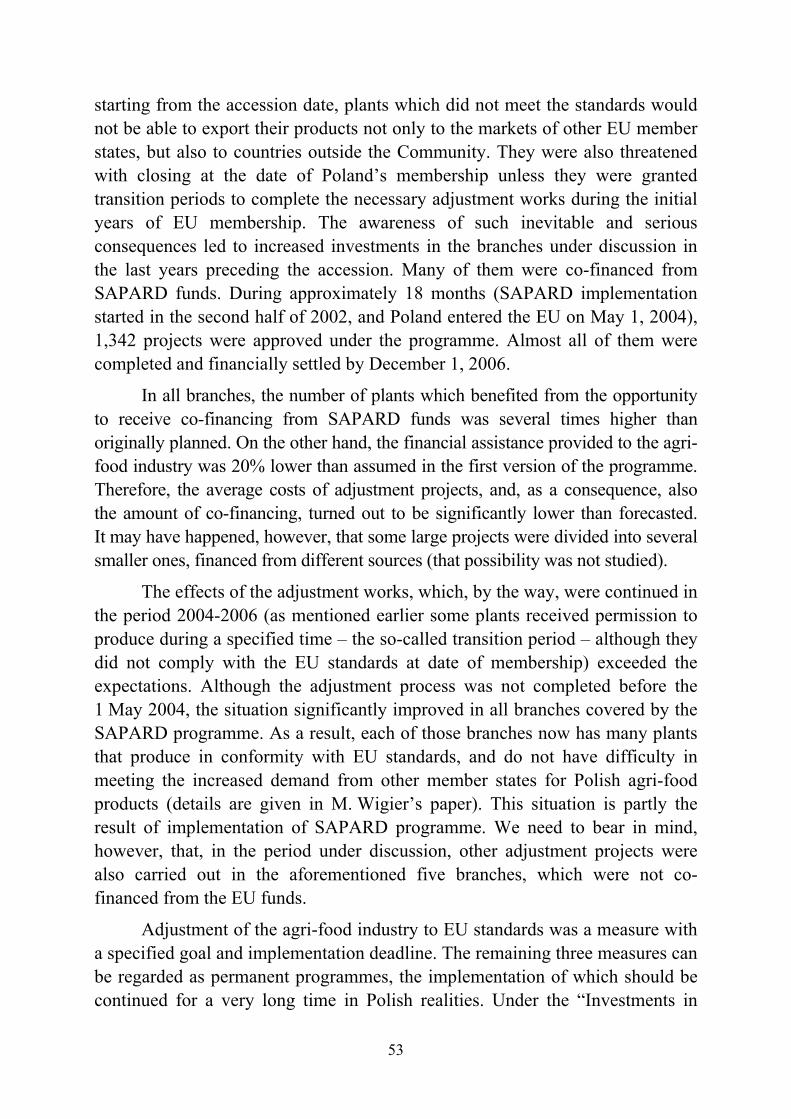
53
starting from the accession date, plants which did not meet the standards would not be able to export their products not only to the markets of other EU member states, but also to countries outside the Community. They were also threatened with closing at the date of Poland’s membership unless they were granted transition periods to complete the necessary adjustment works during the initial years of EU membership. The awareness of such inevitable and serious consequences led to increased investments in the branches under discussion in the last years preceding the accession. Many of them were co-financed from SAPARD funds. During approximately 18 months (SAPARD implementation started in the second half of 2002, and Poland entered the EU on May 1, 2004), 1,342 projects were approved under the programme. Almost all of them were completed and financially settled by December 1, 2006.
In all branches, the number of plants which benefited from the opportunity to receive co-financing from SAPARD funds was several times higher than originally planned. On the other hand, the financial assistance provided to the agri-food industry was 20% lower than assumed in the first version of the programme. Therefore, the average costs of adjustment projects, and, as a consequence, also the amount of co-financing, turned out to be significantly lower than forecasted. It may have happened, however, that some large projects were divided into several smaller ones, financed from different sources (that possibility was not studied).
The effects of the adjustment works, which, by the way, were continued in the period 2004-2006 (as mentioned earlier some plants received permission to produce during a specified time – the so-called transition period – although they did not comply with the EU standards at date of membership) exceeded the expectations. Although the adjustment process was not completed before the 1 May 2004, the situation significantly improved in all branches covered by the SAPARD programme. As a result, each of those branches now has many plants that produce in conformity with EU standards, and do not have difficulty in meeting the increased demand from other member states for Polish agri-food products (details are given in M. Wigier’s paper). This situation is partly the result of implementation of SAPARD programme. We need to bear in mind, however, that, in the period under discussion, other adjustment projects were also carried out in the aforementioned five branches, which were not co-financed from the EU funds.
Adjustment of the agri-food industry to EU standards was a measure with a specified goal and implementation deadline. The remaining three measures can be regarded as permanent programmes, the implementation of which should be continued for a very long time in Polish realities. Under the “Investments in
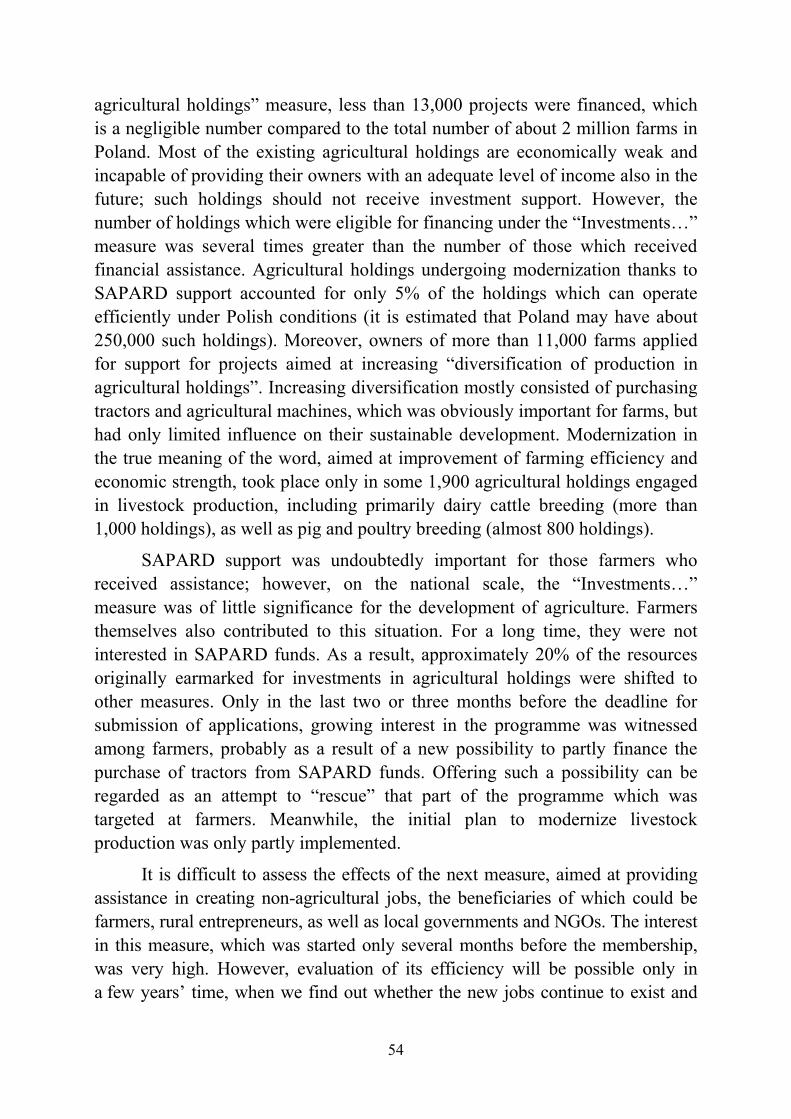
54
agricultural holdings” measure, less than 13,000 projects were financed, which is a negligible number compared to the total number of about 2 million farms in Poland. Most of the existing agricultural holdings are economically weak and incapable of providing their owners with an adequate level of income also in the future; such holdings should not receive investment support. However, the number of holdings which were eligible for financing under the “Investments…” measure was several times greater than the number of those which received financial assistance. Agricultural holdings undergoing modernization thanks to SAPARD support accounted for only 5% of the holdings which can operate efficiently under Polish conditions (it is estimated that Poland may have about 250,000 such holdings). Moreover, owners of more than 11,000 farms applied for support for projects aimed at increasing “diversification of production in agricultural holdings”. Increasing diversification mostly consisted of purchasing tractors and agricultural machines, which was obviously important for farms, but had only limited influence on their sustainable development. Modernization in the true meaning of the word, aimed at improvement of farming efficiency and economic strength, took place only in some 1,900 agricultural holdings engaged in livestock production, including primarily dairy cattle breeding (more than 1,000 holdings), as well as pig and poultry breeding (almost 800 holdings).
SAPARD support was undoubtedly important for those farmers who received assistance; however, on the national scale, the “Investments…” measure was of little significance for the development of agriculture. Farmers themselves also contributed to this situation. For a long time, they were not interested in SAPARD funds. As a result, approximately 20% of the resources originally earmarked for investments in agricultural holdings were shifted to other measures. Only in the last two or three months before the deadline for submission of applications, growing interest in the programme was witnessed among farmers, probably as a result of a new possibility to partly finance the purchase of tractors from SAPARD funds. Offering such a possibility can be regarded as an attempt to “rescue” that part of the programme which was targeted at farmers. Meanwhile, the initial plan to modernize livestock production was only partly implemented.
It is difficult to assess the effects of the next measure, aimed at providing assistance in creating non-agricultural jobs, the beneficiaries of which could be farmers, rural entrepreneurs, as well as local governments and NGOs. The interest in this measure, which was started only several months before the membership, was very high. However, evaluation of its efficiency will be possible only in a few years’ time, when we find out whether the new jobs continue to exist and
55
whether the tourist facilities still function and contribute to increased attractiveness of the region. Nevertheless, the huge interest demonstrated by small rural entrepreneurs in the possibility to receive support for creating new jobs should be taken into account in the elaboration of subsequent programs aimed at the development of rural areas.
The last important measure, which finally consumed most resources from the programme, was “Development and improvement of rural infrastructure”. Local governments could apply for funds for construction and modernization of water supply networks, sewage systems, local roads, sewage treatment plants, litter storages and electricity supply networks. Local governments took full advantage of this opportunity, and, as a result of their pressure, some funds were reallocated to the measure under discussion from other measures, in which were not so efficiently used. As a result, almost 49% of SAPARD public funds were put at the disposal of the local governments (see Table 1).
Such reaction to the SAPARD offer was due to the fact that local government managers and councils perfectly understand that one of their most important obligations is to provide citizens with access to basic technical infrastructure. However, although the situation, at least in some regions, is improving from one year to another, there are still many villages which are missing at least part of such infrastructure (especially sewage systems and sewage treatment plants). Making up for the backlog is a lengthy process, and SAPARD funds only helped in that process by supplementing local governments’ own funds and accelerating the implementation of some projects. At the same time, local governments carried out a lot of infrastructural investments without support from the programme.
In summary: Poland, when preparing SAPARD, decided to concentrate the funds on a few most important measures, which provided significant indirect (technical infrastructure; the lack of technical infrastructure makes regions unattractive for investors) or direct (other measures) support to the development of agriculture and rural areas. It is definitely not certain if all the measures were implemented in an optimum way, but, undoubtedly, the Ministry of Agriculture and Rural Development, which was the managing institution, was forced to respond to the unexpectedly reluctant reaction of farmers to the programme.
x x
x
56
Currently, the implementation of two EU co-financed programmes aimed at supporting the development of agriculture and rural areas is coming to an end. These programmes are the Sectoral Operational Programme for “Modernization and Restructuring of Agriculture and Rural Development” (appearing as SPOR in the text) and the “Rural Development Programme” (appearing as RDP–2004 in the text). Both programmes were developed according to slightly modified regulations, on the basis of which the “old” member states prepared and implemented EU co-financed rural development programmes for the period 2000-2006. There are two significant differences between the programmes of the “old” and the “new” member states: firstly, programmes of the new member states covered a period of three years (2004-2006), while in the “old” member states they were implemented during seven years (2000-2006); secondly, the new member states were offered a possibility to introduce additional measures.
The fundamental goal of the programmes co-financed by the Community from the 2000-2006 budget in the old member states, and, starting from 2004, also in the new member states, was to support sustainable development of rural regions. Such a goal is much broader than SAPARD objectives. However, the list of measures eligible for co-financing from SAPARD is, in many cases, identical with the list of measures to be included in the SPOR and RDP–2004 programmes. The SAPARD list did not comprise such measures as early retirement, handicap payments to farmers in mountain areas and other less-favoured areas, setting up of young farmers and support for semi-subsistence farming, but it included development and modernization of rural technical infrastructure. Meanwhile, in the programmes that were “active” in the period 2004-2006, rural technical infrastructure received support from the Integrated Operational Programme of Regional Development (IOPRD), and in the years 2007-2013 – from 16 Regional Operational Programmes (RPO). Such a solution is not favourable for rural regions. In the case of ZPORR, approximately EUR 470 million were assigned for development and modernization of rural technical infrastructure, i.e. less than EUR 160 million per year. This amount is not much higher than the annual SAPARD allocation for this measure. At the same time, total funds earmarked each year for rural development in the period 2004-2006 were more than 6.5 times higher than SAPARD funds. Such an approach to development and modernization of rural technical infrastructure in the IOPRD is not accidental; it proves that the “rural lobby” is losing out to the much stronger and efficient “urban lobby” in the battle for assistance funds. Under the conditions prevailing in Poland, a much better solution for the development of disadvantaged rural areas would be to co-finance technical infrastructure from the EAFRD, in the same way as it was
57
done in the case of SAPARD. Such a model of managing the “Infrastructure…” measure worked well in practice. The current solution, on the other hand, may further increase the differences in the economic level between the wealthy and the poor regions of Poland.
At the moment, it is hard to tell what amounts will be assigned for rural technical infrastructure in the period 2007-2013. The resources are available in 16 RPOs, and how much funds in the voivodship programmes will be earmarked for the financing of technical infrastructure in rural areas is largely up to the negotiation skills of local governments.
x x
x
It follows from the analysis of Table 1 that the authors of SPOR and RDP–2004 did not concentrate on the solution of the most important problems of Polish agriculture and rural areas, but included most of the measures foreseen for these programmes (23 measures out of 35 possibilities). Such evaluation, as follows from more detailed analysis, is only partly justified. In several cases the programmers had practically no choice. Two measures: structural pensions (early retirement) and subsidising farming in less favoured areas had to be included in the Polish rural support programmes simply because these measures are implemented in all EU countries. It is doubtful, however, whether such large fund allocations should indeed by dedicated to these measures. Structural pensions were determined at a higher level than those pensions, which farmers can obtain on the basis of existing regulations on pensions for farmers. Poland has requested with determination and with success that as much as possible of Polish territory should be classified as less favoured areas. As a result of that, close to EUR 500 million per year (approximately 28% of all the available funds) were allocated for the financing of the above two measures, which have little to do with agricultural development, substantially cutting the funds available for other purposes.
RDP–2004 also necessarily had to include the measure “Agro-environment payments”. Owing to the persistent insistence on the part of the Commission, agro-environmental projects were to be co-financed from SAPARD funds. Nevertheless, this measure was not activated. The Polish side argued that it could not implement the agro-environment payments due to the too short preparation period. Finally, after discussions with the Commission, this measure was deleted from SAPARD and the earmarked funds were allocated elsewhere. The same arguments could not be repeated when agreeing and approving RDP–2004.
58
The next measure included in RDP–2004, which did not exist in the SAPARD programme, consists of the “Adjustment of agricultural holdings to EU standards”. As in the previous measures, substantial financial resources were earmarked here (see: Table 1). It is hard to question its introduction, although undoubtedly it could have been combined with the measure “Investments...”. Particular emphasis on the implementation of EU standards on the farms was appropriate due to the close deadline, by which the cross–compliance conditions were to be fulfilled, subject to the risk of at least partial suspension of direct payments.
It should also be noted that RDP–2004 includes two measures of a special nature. Both of them limited the capabilities of co-financing for the other measures. The first one, “Supplementary area payments” is the result of the accession negotiations. The EU side did not agree that Polish farmers should receive direct payments from the Community budget in full amount from day one of EU membership, and in spite of very tense negotiations, did not change its position. As a result, Polish farmers will obtain full direct payments from the Community budget only in the year 2013, and in the initial three years only at the level of 25%, 30% and 35%, respectively. Nevertheless, the EU agreed to the disbursement by Poland of complementary payments in limited amount from funds of the Community given to Poland’s disposal and destined for the support of the development of agriculture and rural areas. Poland took advantage of this possibility and included the respective means in the RDP–2004 measure “Supplementary area payments” (regardless of that, Poland obtained the right to top-up the direct payments from the national budget; as a result, in the years 2004-2006 Polish farmers received 55%, 60% and 65% of the full direct payments, respectively).
The second special measure consists of co-financing of positively assessed projects, which due to the exhaustion of funds had not obtained support from the SAPARD programme. It was rightly decided that the farmers concerned should not submit new applications, but that the approved projects should be financed in the next programming period from RDP–2004.
The expansion of the programme co-financed from the multiannual budget for 2004-2006 by the addition of the five above described measures was an understandable decision. Nevertheless, it is hard to agree with the inclusion in RDP–2004 the measure “semi-subsistence farming”. As anywhere else, economically weak farms, which after receiving financial support may be converted into fully viable business entities, indeed exist in Poland. The granting of assistance to some of them may be purposeful, but aid should target the right
59
group of farms, in reasonable amount and under adequate control. None of these conditions were fulfilled in the RDP–2004. Farms with economic strength of at least 2 ESU and not greater than 4 ESU were deemed eligible to seek co-financing. Both limits were set at a much too low level. Presently, in Poland, a farm with economic capacity of 4 ESU does not warrant sufficient income (the appropriate threshold should be 8 ESU). Flat-rate support amounting to EUR 1,250 per year (just under PLN 5,000) over five years is insufficient to enable the implementation of any substantial changes even on a small farm. (What is the sense of fragmenting the aid totalling less than PLN 25,000 and spreading it over five years, making it even harder to make any reasonable use of the received money?) Moreover, no progress review of the implementation of the programme of farm development was foreseen over the first three years. If a farmer fails to fulfil it, the only “sanction” consists of discontinuation of support in the fourth and fifth year.
It may be presumed that support for “semi-subsistence farming” was included in RDP–2004 as a separate measure only because it was proposed to the new member states by the Community as a token of understanding for the difficult conditions of their agricultural sectors. Undoubtedly, transformations of semi-subsistence farms could have been much more effectively co-financed and would have produced much better results from the measure “Modernization of agricultural holdings”, if only due to the possibility of control over the application of the public funds received by the beneficiaries.
SPOR and RDP–2004 were furthermore provided with 10 measures engaging much smaller funds (training, information and promotion, producer groups, extension services, land afforestation, restoring of forests damaged by natural disasters, village renewal, technical assistance, land consolidation, water management for farming). The introduction of each one of them is justified, of course, but it is doubtful whether all projects linked to broadly conceived development of agriculture and rural areas should be co-financed from EU funds? Perhaps some of them ought to be supported exclusively from the national resources or abandoned as less important. In the current version, the apparent intention seems to be to co-finance too many pertinent goals and to satisfy every suggestion. In consequence, this has led to incomprehensible dispersion of resources.
x x
x
60
The Polish group preparing the National Rural Development Programme 2007-2013 (RDP–2013) had less leeway than the authors of SPOR and RDP–2004. The first limitation consisted of the rules of the Council Regulation No 1698/2005 (hereafter: CR 1698/2005). The uniform structure of all Rural Development Programmes for the years 2007-2013 requires the division into axes, grouping the measures according to the goals assigned by the Community. It is not only a method of assuring “bureaucratic” order, but also a vehicle assuring the application of half of the EU funds in conformity with the preferences of the Community. CR 1698/2005 requires the member states to assign at least 10% of the allocated resources from the European Agricultural Fund for Rural Development (EAFRD) to Axis One “Improving the competitiveness of agricultural and forestry sector”, at least 25% to Axis Two “Improving the environment and the countryside”, at least 10% to Axis Three “The quality of life in rural areas diversification of the rural economy”, and finally, at least 5% to the additional Axis “Leader+”.
The above categorisation suggests, that according to the Community decision makers, sustainable development of rural areas under European conditions ought to consist, above all, of the protection and improvement of the environment. This goal has been reckoned much more important (as indicated by the obligatory guidelines concerning the allocation of funds) than the enhancement of competitiveness of agriculture and forestry or the improvement of the quality of life in rural areas and diversification of the rural economy. Especially the disregard for competitiveness is surprising here. It is well known, after all, that most products of European agriculture can be placed on international markets only thanks to all kinds of subsidies, sometimes, such as direct payments, skilfully concealed under the guise of quite different instruments. It is also obvious that the European food industry will have problems with facing the competition from countries not belonging to the Community, if its protection will be phased down.
When preparing the national development plan, a member state is allowed to allocate the remaining 50% of the EAFRD funds at its disposal to any measures at its discretion. The ultimate structure of allocation between the axes does not need to conform with Community preferences. The binding Community guidelines, therefore, requiring the assignment of determined parts of the EU resources to particular axes, are not a serious limitation of liberty of decision on the part of the member state, so the share of funds allocated to the financing of particular axes may completely differ from the one indicated in CR 1698/2005 20:50:20:10. Finally each national RDP–2013 is a compromise between the binding Community guidelines and the needs of the particular member state.
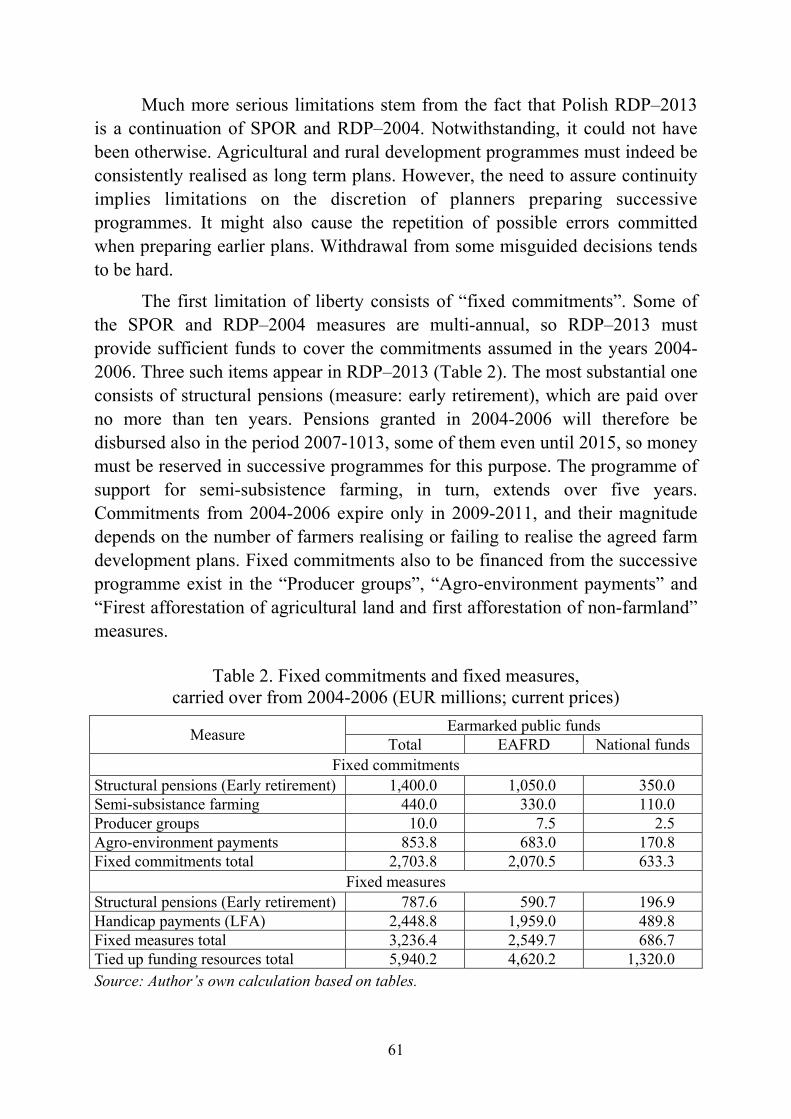
61
Much more serious limitations stem from the fact that Polish RDP–2013 is a continuation of SPOR and RDP–2004. Notwithstanding, it could not have been otherwise. Agricultural and rural development programmes must indeed be consistently realised as long term plans. However, the need to assure continuity implies limitations on the discretion of planners preparing successive programmes. It might also cause the repetition of possible errors committed when preparing earlier plans. Withdrawal from some misguided decisions tends to be hard.
The first limitation of liberty consists of “fixed commitments”. Some of the SPOR and RDP–2004 measures are multi-annual, so RDP–2013 must provide sufficient funds to cover the commitments assumed in the years 2004-2006. Three such items appear in RDP–2013 (Table 2). The most substantial one consists of structural pensions (measure: early retirement), which are paid over no more than ten years. Pensions granted in 2004-2006 will therefore be disbursed also in the period 2007-1013, some of them even until 2015, so money must be reserved in successive programmes for this purpose. The programme of support for semi-subsistence farming, in turn, extends over five years. Commitments from 2004-2006 expire only in 2009-2011, and their magnitude depends on the number of farmers realising or failing to realise the agreed farm development plans. Fixed commitments also to be financed from the successive programme exist in the “Producer groups”, “Agro-environment payments” and “Firest afforestation of agricultural land and first afforestation of non-farmland” measures.
Table 2. Fixed commitments and fixed measures, carried over from 2004-2006 (EUR millions; current prices)
Earmarked public funds Measure Total EAFRD National funds Fixed commitments
Structural pensions (Early retirement) 1,400.0 1,050.0 350.0 Semi-subsistance farming 440.0 330.0 110.0 Producer groups 10.0 7.5 2.5 Agro-environment payments 853.8 683.0 170.8 Fixed commitments total 2,703.8 2,070.5 633.3
Fixed measures Structural pensions (Early retirement) 787.6 590.7 196.9 Handicap payments (LFA) 2,448.8 1,959.0 489.8 Fixed measures total 3,236.4 2,549.7 686.7 Tied up funding resources total 5,940.2 4,620.2 1,320.0 Source: Author’s own calculation based on tables.
62
A second, seemingly weaker limitation of discretion consists of “fixed measures”. Although such measures may be discontinued, their withdrawal is difficult for at least two reasons. Firstly, because discontinuation understandably triggers the reaction of the group losing out on such a move, which may be expressed by anger against the politicians “taking away the money”. Secondly, the system of support for agriculture and rural areas needs stability; frequent changes harm such stability.
In the RDP–2013 at least two measures are of a fixed nature. One is the “Handicap payments in mountain areas and payments in other areas with handicaps”. Reduction of the negotiated area and shifting the resources to other measures could make sense, but is presently impossible. It is difficult to change the details of the system already after three years of its operation. The second fixed measure “early retirement” consists of the structural pensions. Pension and retirement benefit systems are extremely sensitive instruments of social and economic policy and should be characterised by maximum feasible stability, also because their beneficiaries are elderly people. Therefore, the introduction of structural pensions to the Polish system is a decision that limits the leeway not only for the planners of RDP–2013, but possibly also for the next multi-annual programme (2014-2020).
Programme stability also implies the stability of conditions and of the magnitude of support. When designing the RDP–2013, the stability requirement was not fulfilled. In the years 2007-2013 new rules governing the calculation of structural pensions are to apply, with the consequence that from 2007 they will be lower than those granted in 2004-2006. Moreover, there are reasons to be afraid that not enough money has been assigned for them in 2007-2013 (see: Table 1). It is not clear, therefore, whether all the farmers meeting the conditions and wishing to retire will be able to obtain the pensions. Such a situation would imply the application of the “first come – first served” principle in the actual operation of the measure “Early retirement”, which is unacceptable in this case. Pensions should be granted to all those eligible who apply for them.
Table 1 indicates that RDP–2013 has encompassed all the measures co-financed from SPOR and RDP–2004. The dispersion of funds across many different measures in programmes co-financed from the previous multi-annual budget was not recognised as mistake, but as a rule worth continuing.
x x
x

63
It follows from the analysis presented above that the team working on the RDP–2013 did not enjoy full liberty of decision. Moreover, the plan is a compromise between the interests of various pressure groups and between the need to implement important but difficult projects, and the demand to fully absorb the funds made available by the EU. This expectation inclines to implement “easy” projects, which often have little to do with development.
The RDP–2013 submitted to the Commission can hardly be regarded as the optimum programme under the Polish conditions. Apart from the fragmentation of resources, it has the serious deficiency of applying relatively little funds to direct support of the food economy. This is indicated, above all, by some of the anticipated effects of RDP–2013. Over the whole seven year period, the programme will lead to the modernisation of only 50,000 farms (approximately 7,000 per year). There are reasons to be afraid that it will consist, above all, of the supplement and replacement of farm machinery, whereas major investments will be relatively scarce. If the approximately 35,000 young farmers receiving a single lump-sum of support of PLN 50,000 each (insufficient for any major investment) are added to the previously mentioned modernised farms, approximately 85,000 holdings will receive support from RDP–2013. Therefore, it is hard to believe that RDP–2013 will contribute to any substantial changes of the production structure of Polish agriculture.
According to RDP–2013 support will be received by 3,000 entrepreneurs engaged in the processing of agricultural raw materials or in wholesale trade with farm products. Above all, small and medium size enterprises are to be supported, but also businesses employing up to 750 persons or having turnover under EUR 200 million. This is serious support for agri-food industry and trade, but it is doubtful if it will be sufficient. The measure “Adding value to agricultural and forestry products” is provided for the years 2007-2013 with a similar yearly amount of funding as in the previous programming period. Yet, the overall amount of support claimed by entrepreneurs in 2004-2006 largely exceeded the means earmarked for the co-financing of this measure and not all the projects could be regarded. The agri-food industry is such link in the food chain, which could “pull up” the entire food economy. Financial support for good investment projects in the agri-food industry is therefore an important factor enhancing the development of the whole food economy, above all agriculture.
This issue has a broader aspect. Additional analysis, based on a different classification of activities than that adopted in CR 1698/2005 demonstrates that RDP–2013 insufficiently supports the Polish food economy. The analysis was based on the conviction that the division of measures into the different axes
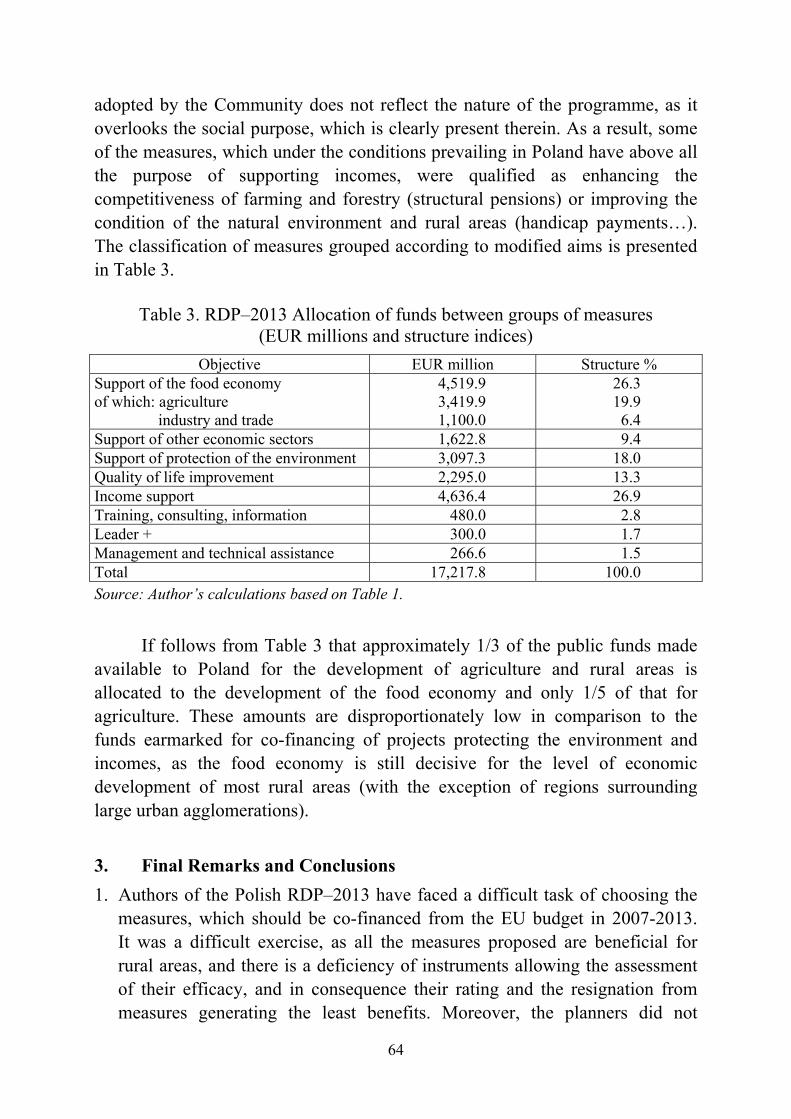
64
adopted by the Community does not reflect the nature of the programme, as it overlooks the social purpose, which is clearly present therein. As a result, some of the measures, which under the conditions prevailing in Poland have above all the purpose of supporting incomes, were qualified as enhancing the competitiveness of farming and forestry (structural pensions) or improving the condition of the natural environment and rural areas (handicap payments…). The classification of measures grouped according to modified aims is presented in Table 3.
Table 3. RDP–2013 Allocation of funds between groups of measures (EUR millions and structure indices)
Objective EUR million Structure % Support of the food economy of which: agriculture
industry and trade
4,519.9 3,419.9 1,100.0
26.3 19.9 6.4
Support of other economic sectors 1,622.8 9.4 Support of protection of the environment 3,097.3 18.0 Quality of life improvement 2,295.0 13.3 Income support 4,636.4 26.9 Training, consulting, information 480.0 2.8 Leader + 300.0 1.7 Management and technical assistance 266.6 1.5 Total 17,217.8 100.0 Source: Author’s calculations based on Table 1.
If follows from Table 3 that approximately 1/3 of the public funds made available to Poland for the development of agriculture and rural areas is allocated to the development of the food economy and only 1/5 of that for agriculture. These amounts are disproportionately low in comparison to the funds earmarked for co-financing of projects protecting the environment and incomes, as the food economy is still decisive for the level of economic development of most rural areas (with the exception of regions surrounding large urban agglomerations).
3. Final Remarks and Conclusions 1. Authors of the Polish RDP–2013 have faced a difficult task of choosing the
measures, which should be co-financed from the EU budget in 2007-2013. It was a difficult exercise, as all the measures proposed are beneficial for rural areas, and there is a deficiency of instruments allowing the assessment of their efficacy, and in consequence their rating and the resignation from measures generating the least benefits. Moreover, the planners did not
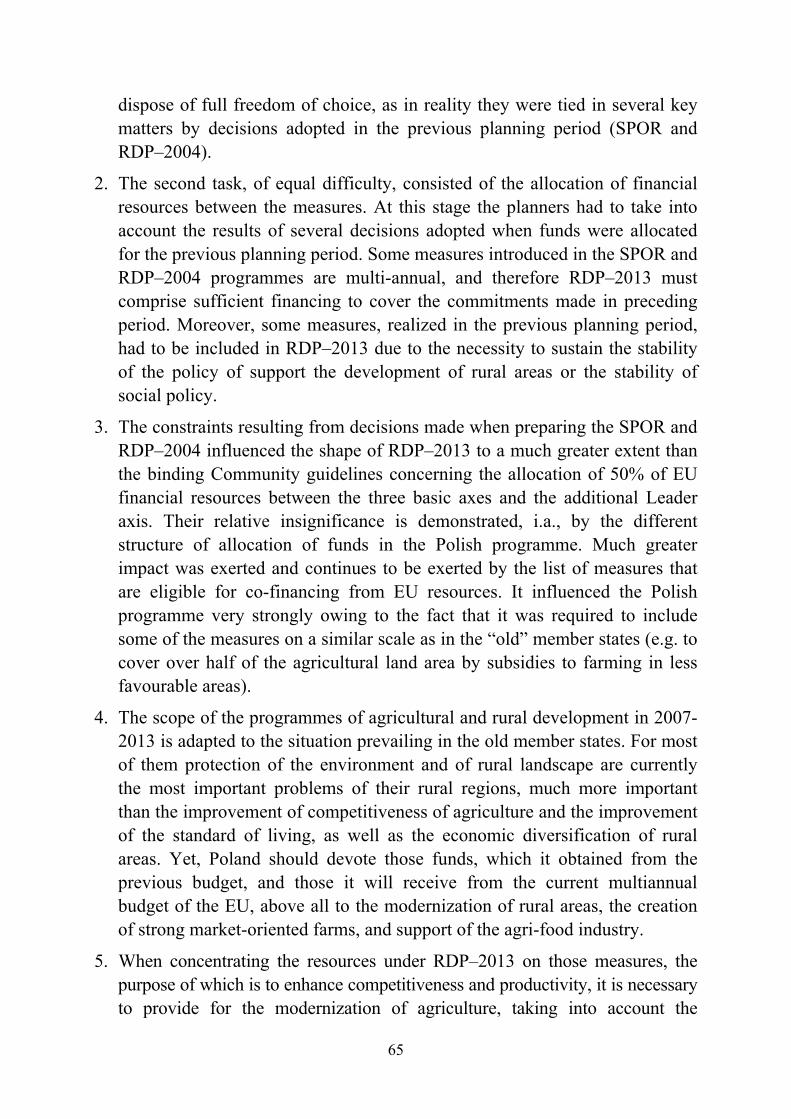
65
dispose of full freedom of choice, as in reality they were tied in several key matters by decisions adopted in the previous planning period (SPOR and RDP–2004).
2. The second task, of equal difficulty, consisted of the allocation of financial resources between the measures. At this stage the planners had to take into account the results of several decisions adopted when funds were allocated for the previous planning period. Some measures introduced in the SPOR and RDP–2004 programmes are multi-annual, and therefore RDP–2013 must comprise sufficient financing to cover the commitments made in preceding period. Moreover, some measures, realized in the previous planning period, had to be included in RDP–2013 due to the necessity to sustain the stability of the policy of support the development of rural areas or the stability of social policy.
3. The constraints resulting from decisions made when preparing the SPOR and RDP–2004 influenced the shape of RDP–2013 to a much greater extent than the binding Community guidelines concerning the allocation of 50% of EU financial resources between the three basic axes and the additional Leader axis. Their relative insignificance is demonstrated, i.a., by the different structure of allocation of funds in the Polish programme. Much greater impact was exerted and continues to be exerted by the list of measures that are eligible for co-financing from EU resources. It influenced the Polish programme very strongly owing to the fact that it was required to include some of the measures on a similar scale as in the “old” member states (e.g. to cover over half of the agricultural land area by subsidies to farming in less favourable areas).
4. The scope of the programmes of agricultural and rural development in 2007-2013 is adapted to the situation prevailing in the old member states. For most of them protection of the environment and of rural landscape are currently the most important problems of their rural regions, much more important than the improvement of competitiveness of agriculture and the improvement of the standard of living, as well as the economic diversification of rural areas. Yet, Poland should devote those funds, which it obtained from the previous budget, and those it will receive from the current multiannual budget of the EU, above all to the modernization of rural areas, the creation of strong market-oriented farms, and support of the agri-food industry.
5. When concentrating the resources under RDP–2013 on those measures, the purpose of which is to enhance competitiveness and productivity, it is necessary to provide for the modernization of agriculture, taking into account the

66
requirements of protecting the rural productive space, including also the environment. Modernization not only cannot cause the deterioration of the condition of the environment in rural areas, but it must also contribute to its improvement. These two goals may complement each other, when modernization will also consist of the development of technical infrastructure, leading to the improvement of the sanitary condition of rural areas, and at the same time propagating good agricultural practices (i.a. driven by the rules of cross–compliance, which makes the disbursement of the whole or partial direct payments conditional upon the fulfilment by the farmer of precisely defined procedures when running the farm).
6. It follows from the conducted analysis that RDP–2013 does not fulfil the stipulation of concentration of means on those measures that improve the competitiveness and productivity of Polish farming and Polish agri-food industry. It is characterised by fairly even distribution of funds across the measures supporting: (a) development, (b) protection of the environment, (c) non-agricultural activity, (d) farm income. It is therefore a compromise, and even a conformist programme, which probably will not satisfy anyone, but at the same time it shields against any accusation that some important measures that could have been included in the programme were overlooked.
7. The equal distribution of funds across different objectives results in their dispersion. There are reasons to be afraid that after the conclusion of RDP–2013 the structure of Polish agriculture will not differ much from what it is at present, and that the competitive position of Polish agriculture and food industry on the markets of other member states and on global markets will be much weaker than it could be. But by that time it will be too late for any corrections. Moreover, it is not so sure, whether in the next programming period Poland will have the opportunity to apply such massive funds for the improvement of competitiveness of Polish food economy.
8. The basic conclusion drawn from the conducted analysis is the stipulation of the need to revise the RDP–2013 in consultation with the Commission. This should result in: (a) reduction of the number of measures; (b) concentration of resources on those measures, which most strongly drive the improvement of competitiveness of the Polish food economy.

67
Doc. Eng. Dušan Vaněk, Ph. D., Eng. JUDr. Josef Mezera, CSc., Eng. Lenka Mejstříková
Research Institute of Agricultural Economics Prague, Czech Republic
Food Industry in the Czech Republic
1. Introduction 1.1. Characteristics of the Branch
The characteristic feature of the manufacture of food products and beverages (NACE 15) is its close linkage to agriculture, the production of which is further processed and delivered to distributors or directly to the consumer market. As it provides for the nutrition needs of the population, the manufacture of food products and beverages is a strategic sector. Both presently and for the future it is necessary to consider food safety as a key priority. The importance of this NACE branch is also underlined by the fact that owing to its production performance it is also one of the key branches of the manufacturing industry. In terms of its structure, the analysed branch is relatively fragmented.
As the assortment of foods and beverages must meet numerous needs of consumers, the branch is broadly diversified into product groups. According to the NACE nomenclature, it includes the following product groups (with their respective aggregations): • 15.1 Production, processing and preserving of meat and meat products, • 15.2 Processing and preserving of fish and fish products, • 15.3 Processing and preserving of fruit, vegetables and potatoes, • 15.4 Manufacture of vegetable and animal oils and fats, • 15.5 Processing of milk, manufacture of dairy products and ice cream, • 15.6 Manufacture of grain mill and starch products, • 15.7 Manufacture of prepared animal feeds, • 15.8 Manufacture of other food products, • 15.9 Manufacture of beverages.
Figure 1 indicates the share of the above mentioned product groups, their respective shares in total receipts from sales of own products and services of the branch under review in 2005. The graph clearly shows that in terms of output, the following four groups predominate (ranked in descending order of sales
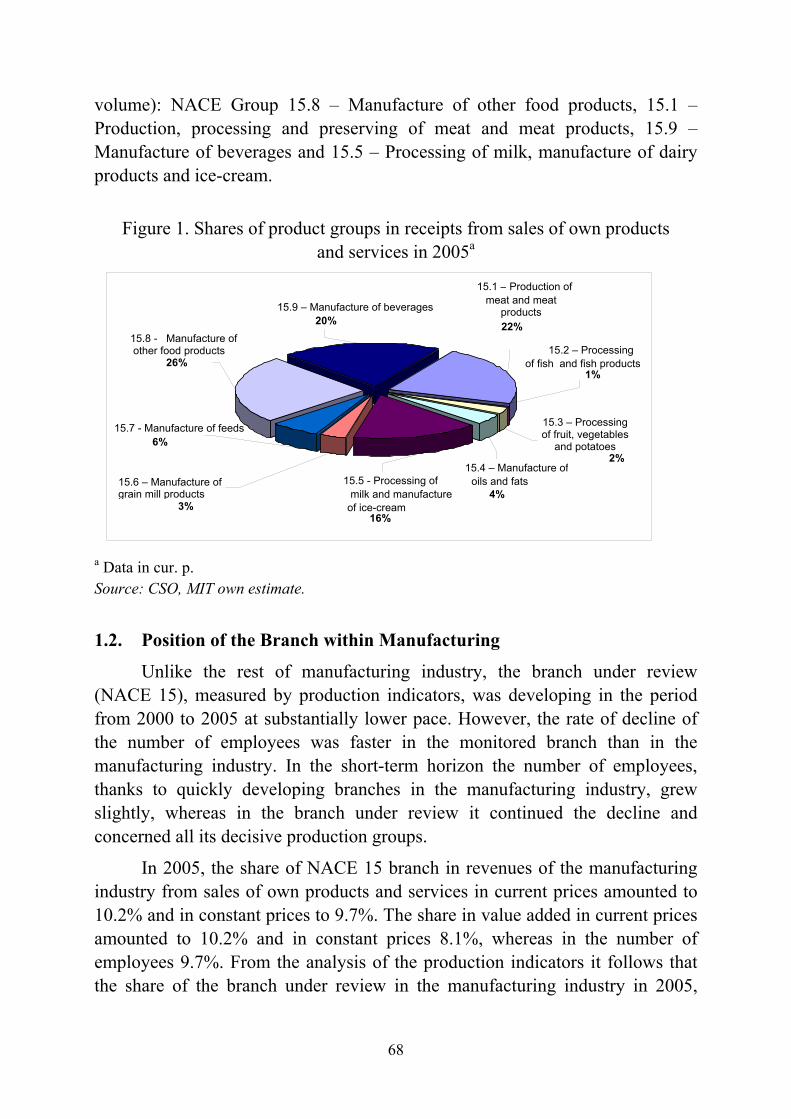
68
volume): NACE Group 15.8 – Manufacture of other food products, 15.1 – Production, processing and preserving of meat and meat products, 15.9 – Manufacture of beverages and 15.5 – Processing of milk, manufacture of dairy products and ice-cream.
Figure 1. Shares of product groups in receipts from sales of own products
and services in 2005a
a Data in cur. p. Source: CSO, MIT own estimate.
1.2. Position of the Branch within Manufacturing
Unlike the rest of manufacturing industry, the branch under review (NACE 15), measured by production indicators, was developing in the period from 2000 to 2005 at substantially lower pace. However, the rate of decline of the number of employees was faster in the monitored branch than in the manufacturing industry. In the short-term horizon the number of employees, thanks to quickly developing branches in the manufacturing industry, grew slightly, whereas in the branch under review it continued the decline and concerned all its decisive production groups.
In 2005, the share of NACE 15 branch in revenues of the manufacturing industry from sales of own products and services in current prices amounted to 10.2% and in constant prices to 9.7%. The share in value added in current prices amounted to 10.2% and in constant prices 8.1%, whereas in the number of employees 9.7%. From the analysis of the production indicators it follows that the share of the branch under review in the manufacturing industry in 2005,
15.3 – Processing of fruit, vegetables
and potatoes
2%
15.1 – Production of meat and meat
products 22%
15.2 – Processing of fish and fish products
1%
15.6 – Manufacture of grain mill products
3% 15.5 - Processing of milk and manufacture
of ice-cream 16%
15.7 - Manufacture of feeds6%
15.4 – Manufacture of oils and fats
4%
15.8 - Manufacture of other food products
26%
15.9 – Manufacture of beverages20%
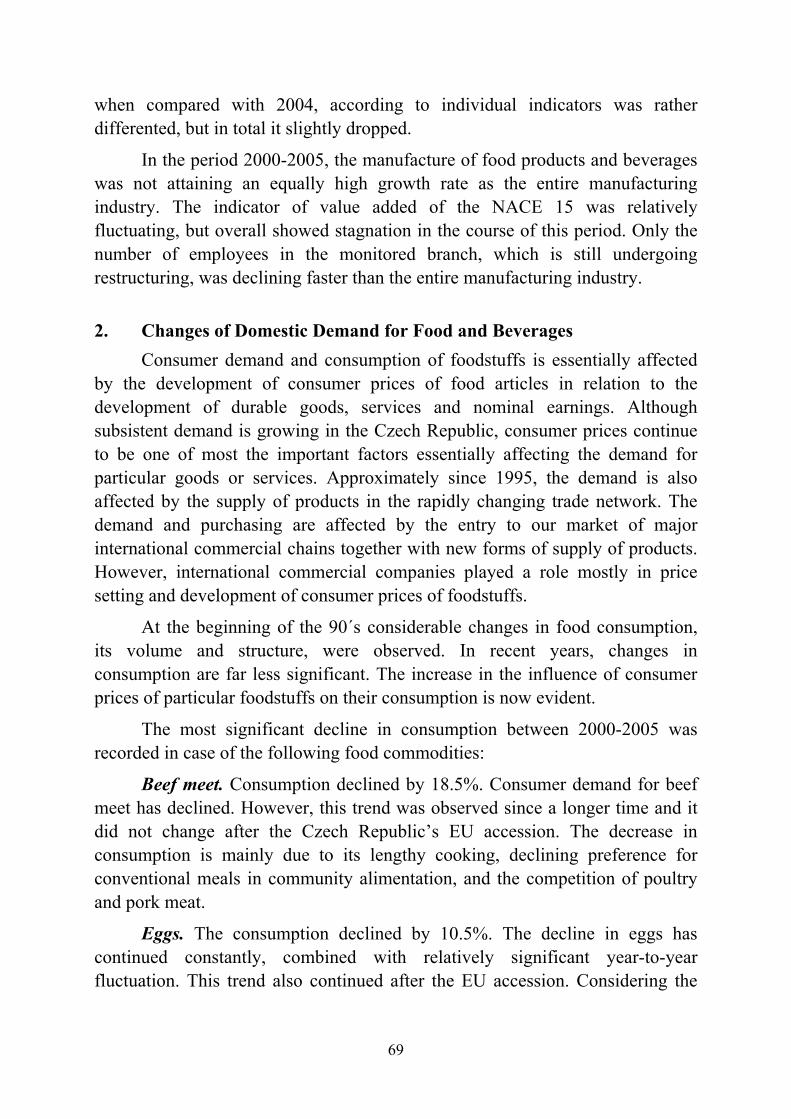
69
when compared with 2004, according to individual indicators was rather differented, but in total it slightly dropped.
In the period 2000-2005, the manufacture of food products and beverages was not attaining an equally high growth rate as the entire manufacturing industry. The indicator of value added of the NACE 15 was relatively fluctuating, but overall showed stagnation in the course of this period. Only the number of employees in the monitored branch, which is still undergoing restructuring, was declining faster than the entire manufacturing industry.
2. Changes of Domestic Demand for Food and Beverages
Consumer demand and consumption of foodstuffs is essentially affected by the development of consumer prices of food articles in relation to the development of durable goods, services and nominal earnings. Although subsistent demand is growing in the Czech Republic, consumer prices continue to be one of most the important factors essentially affecting the demand for particular goods or services. Approximately since 1995, the demand is also affected by the supply of products in the rapidly changing trade network. The demand and purchasing are affected by the entry to our market of major international commercial chains together with new forms of supply of products. However, international commercial companies played a role mostly in price setting and development of consumer prices of foodstuffs.
At the beginning of the 90´s considerable changes in food consumption, its volume and structure, were observed. In recent years, changes in consumption are far less significant. The increase in the influence of consumer prices of particular foodstuffs on their consumption is now evident.
The most significant decline in consumption between 2000-2005 was recorded in case of the following food commodities:
Beef meet. Consumption declined by 18.5%. Consumer demand for beef meet has declined. However, this trend was observed since a longer time and it did not change after the Czech Republic’s EU accession. The decrease in consumption is mainly due to its lengthy cooking, declining preference for conventional meals in community alimentation, and the competition of poultry and pork meat.
Eggs. The consumption declined by 10.5%. The decline in eggs has continued constantly, combined with relatively significant year-to-year fluctuation. This trend also continued after the EU accession. Considering the
70
large self-supply of the inhabitants, the domestic market does not affect the consumption of eggs as much as in the case of other products.
The most significant increase in consumption occurred in the case of the
following food items:
Non-alcoholic beverages (soft drinks). The consumption of this category of beverages (mineral water, soda water, flavoured soda water and other soft drinks) increased by more than 36.0%. The greatest increase was documented from 2002 onwards. The increase of consumption of non-alcoholic beverages was a result of the supply of a wide product assortment in bargain-priced packaging.
Poultry. Total consumption increased by 17.0%. The increase in poultry continued also after 2004. Consumption was affected by consumer prices (mainly in relation to prices of other sorts of meat), wider supply of poultry parts, poultry products and by health education. Bird flu did not influence the consumption of poultry in the Czech Republic.
Milk and milk products. The consumption of milk a and milk products (after a relatively long lasting sharp decline at the beginning of the 90´s) is increasing. This is documented by the change in consumer demand especially for products with high utility value. The consumption of canned milk and fresh milk is decreasing. On the other hand, the consumption of cheese, quark and other products is rising. Overall, consumption increased by 11.3% and it has been also increasing after our accession to the EU.
Southern fruit. The consumption is growing by 21.5%. After the decline in the late 90´s, consumption has been growing since 2002. The demand for southern fruit is mainly influenced by the price relation between temperate zone fruit and southern fruit, and by the level of supply in hyper and supermarkets.
The consumption of other groups of food articles was varying by ±10.0% during the period under the consideration. The tendency of demand for foodstuffs and beverages has not changed after the Czech Republic’s accession to the EU. However, the increasing share of imported goods in the consumption of particular food commodities is another problem.
The conclusion may be made that other changes in consumption will take place rather in the demand for particular foodstuff assortments. The differentiation in consumption will definitely not cause an increase of its total volume. Supply tends to favour the assortment of foodstuff in the relatively higher priced range, in many cases reflecting higher quality. Although
71
expenditure on foodstuff in the period 1995-2005 increased by 40.9%, food consumption rose by just about 3.6%. The development of demand is influenced more significantly by the development of the proportions between earnings, expenditures, prices of substitute foodstuffs, prices of other goods and services, than by the development of prices of particular foodstuffs.
3. Development of Food Trade, Particularly with EU Members
The development of the balance of foreign trade in the NACE 15 in the period from 2000-2005, which is presented in Table 1, was permanently worsening since 2002 and in the year 2005 it achieved the negative value of almost CZK 19 billions. This trend has been increasing, even under significant growth of exports of these products, since 2003. The reason behind such development consists of the prevailing impact of imports on the balance of foreign trade with NACE 15 products, for which favourable conditions were created, including import custom-duties and the movement of the exchange rate of the CZK in the relation to EUR and USD.
It follows from the assessment of the commodity structure of foreign trade with NACE 15 products that a significant worsening of the negative balance in the years 2004 and 2005 occurred in the case of meat and meat products, mainly due to acceleration of the pace of imports of these products to the Czech Republic, unlike the lower dynamics of the growth of their exports. This concerns mainly the imports of cheaper meat parts. A favourable balance of foreign trade was reported only in dairy products (NACE 15.5), although it was significantly lower than in the years 2000 and 2001, and traditionally also beverages (NACE 15.9), where the important export commodities in this group consisted of beer and malt.
The territorial distribution of foreign trade in the manufacture of food products and beverages (NACE 15) in 2005 is illustrated in Figure 2, broken down between export and import territories. The main export territory NACE 15 products in 2005, similarly as in earlier years, was Slovakia, with a share of 28% (in 2004 – 24%). The second place in the monitored period was held by Germany with a share of 20% (in 2004 – 18%). The third place also belonged to a neighbouring country, Poland, with a share of 10% (the same share as in 2004).
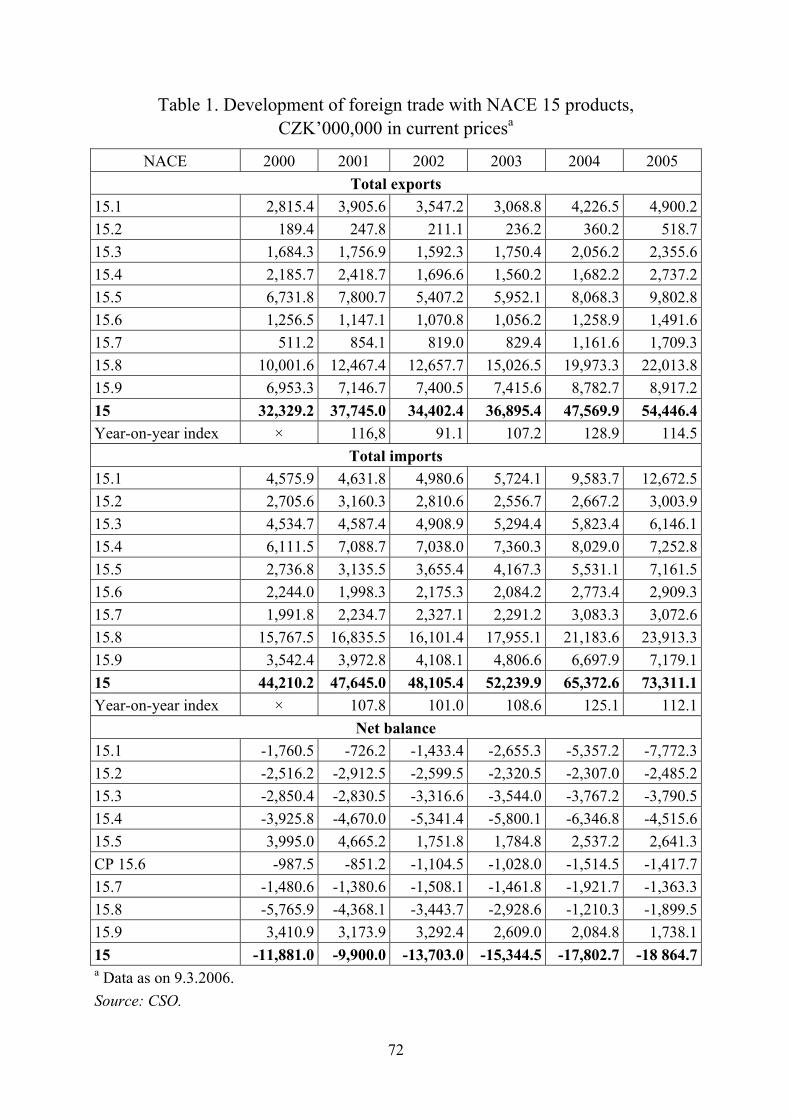
72
Table 1. Development of foreign trade with NACE 15 products, CZK’000,000 in current pricesa
NACE 2000 2001 2002 2003 2004 2005 Total exports
15.1 2,815.4 3,905.6 3,547.2 3,068.8 4,226.5 4,900.215.2 189.4 247.8 211.1 236.2 360.2 518.715.3 1,684.3 1,756.9 1,592.3 1,750.4 2,056.2 2,355.615.4 2,185.7 2,418.7 1,696.6 1,560.2 1,682.2 2,737.215.5 6,731.8 7,800.7 5,407.2 5,952.1 8,068.3 9,802.815.6 1,256.5 1,147.1 1,070.8 1,056.2 1,258.9 1,491.615.7 511.2 854.1 819.0 829.4 1,161.6 1,709.315.8 10,001.6 12,467.4 12,657.7 15,026.5 19,973.3 22,013.815.9 6,953.3 7,146.7 7,400.5 7,415.6 8,782.7 8,917.215 32,329.2 37,745.0 34,402.4 36,895.4 47,569.9 54,446.4Year-on-year index × 116,8 91.1 107.2 128.9 114.5
Total imports 15.1 4,575.9 4,631.8 4,980.6 5,724.1 9,583.7 12,672.515.2 2,705.6 3,160.3 2,810.6 2,556.7 2,667.2 3,003.915.3 4,534.7 4,587.4 4,908.9 5,294.4 5,823.4 6,146.115.4 6,111.5 7,088.7 7,038.0 7,360.3 8,029.0 7,252.815.5 2,736.8 3,135.5 3,655.4 4,167.3 5,531.1 7,161.515.6 2,244.0 1,998.3 2,175.3 2,084.2 2,773.4 2,909.315.7 1,991.8 2,234.7 2,327.1 2,291.2 3,083.3 3,072.615.8 15,767.5 16,835.5 16,101.4 17,955.1 21,183.6 23,913.315.9 3,542.4 3,972.8 4,108.1 4,806.6 6,697.9 7,179.115 44,210.2 47,645.0 48,105.4 52,239.9 65,372.6 73,311.1Year-on-year index × 107.8 101.0 108.6 125.1 112.1
Net balance 15.1 -1,760.5 -726.2 -1,433.4 -2,655.3 -5,357.2 -7,772.315.2 -2,516.2 -2,912.5 -2,599.5 -2,320.5 -2,307.0 -2,485.215.3 -2,850.4 -2,830.5 -3,316.6 -3,544.0 -3,767.2 -3,790.515.4 -3,925.8 -4,670.0 -5,341.4 -5,800.1 -6,346.8 -4,515.615.5 3,995.0 4,665.2 1,751.8 1,784.8 2,537.2 2,641.3CP 15.6 -987.5 -851.2 -1,104.5 -1,028.0 -1,514.5 -1,417.715.7 -1,480.6 -1,380.6 -1,508.1 -1,461.8 -1,921.7 -1,363.315.8 -5,765.9 -4,368.1 -3,443.7 -2,928.6 -1,210.3 -1,899.515.9 3,410.9 3,173.9 3,292.4 2,609.0 2,084.8 1,738.115 -11,881.0 -9,900.0 -13,703.0 -15,344.5 -17,802.7 -18 864.7a Data as on 9.3.2006. Source: CSO.
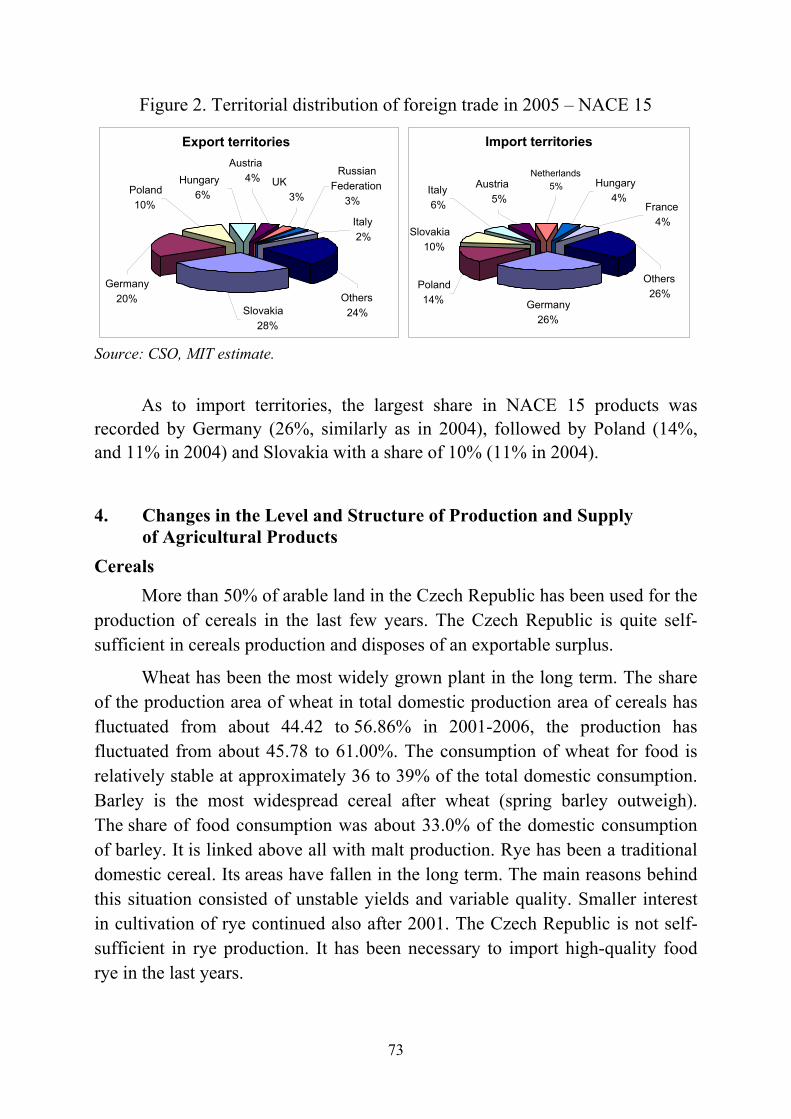
73
Figure 2. Territorial distribution of foreign trade in 2005 – NACE 15
Source: CSO, MIT estimate.
As to import territories, the largest share in NACE 15 products was recorded by Germany (26%, similarly as in 2004), followed by Poland (14%, and 11% in 2004) and Slovakia with a share of 10% (11% in 2004).
4. Changes in the Level and Structure of Production and Supply of Agricultural Products
Cereals More than 50% of arable land in the Czech Republic has been used for the
production of cereals in the last few years. The Czech Republic is quite self-sufficient in cereals production and disposes of an exportable surplus.
Wheat has been the most widely grown plant in the long term. The share of the production area of wheat in total domestic production area of cereals has fluctuated from about 44.42 to 56.86% in 2001-2006, the production has fluctuated from about 45.78 to 61.00%. The consumption of wheat for food is relatively stable at approximately 36 to 39% of the total domestic consumption. Barley is the most widespread cereal after wheat (spring barley outweigh). The share of food consumption was about 33.0% of the domestic consumption of barley. It is linked above all with malt production. Rye has been a traditional domestic cereal. Its areas have fallen in the long term. The main reasons behind this situation consisted of unstable yields and variable quality. Smaller interest in cultivation of rye continued also after 2001. The Czech Republic is not self-sufficient in rye production. It has been necessary to import high-quality food rye in the last years.
Export territories
Others24%
Hungary 6% Poland
10%
Austria4%
Slovakia28%
RussianFederation
3%
Italy2%
UK 3%
Germany 20%
Import territories
Others26%
France4%
Germany 26%
Austria5%
Hungary 4%
Slovakia10%
Poland14%
Italy6%
Netherlands5%
74
Sugar Beet – Sugar From 2001/2 to 2004/5, i.e. before the Czech Republic’s EU accession,
the sugar beet market and the sugar market were regulated by government decree No. 114/2001 as amended. The basic mechanism of the market regulation consisted quotas and minimum prices of sugar beet and sugar. The sugar market was protected by territorial tariff rate quotas (Poland, EU, other countries). After exhaustion of these quotas, the market was protected by the increased tariff rate. The quantitative import restriction on sugar from Slovakia was valid at the same time. Quantitative restrictions were also imposed on imports of selected products containing sugar.
After the Czech Republic ´s EU accession, the sugar beet market and the sugar market were regulated by decree of the Council of the EU No. 1260/2001 concerning the common market in the sugar sector until the agricultural year-end 2005/06. The national sugar production quota was 505 thousand tonnes in 2001/02. From 2002/03 until the Czech Republic’s EU accession the total sugar production quota A and B was 454 thousand tonnes, i.e. the quota was fixed at the level of the sugar quota for the Czech Republic ´s EU accession.
Average saccharinity of sugar beet was 18.57% in 2004/05 – 2006/07, while it was only 15.67% in 2001/02. Intensity of production (measured by the yield of refined sugar per hectare) increased substantially after the Czech Republic’s EU accession. From 2004/05 to 2006/07 the refined sugar yield was 8.43 tonnes per hectare, i.e. about 35.5% more than in 2001/02. This indicates that Czech sugar beet growing and sugar industry are able to compete.
The sugar beet area for production of sugar declined by 23.1 thousand hectares, i.e. by 29.3%, from 2001/02 to 2006/07. The EU decided to withdraw sugar from the market in 2006/07. The Czech Republic will withdraw 43.53 thousand tonnes of sugar from market in 2006/07 and more than 10,000 tonnes of sugar will be shifted from production of the year 2005/06.
Further decrease of areas and production will be made by cutting the sugar production quota at the level of 102,473 tonnes (22.5% from total national quota) by the British-French company Eastern Sugar. The area of sugar beet will fall by more than 12,000 hectares, representing more than 640,000 tonnes of sugar beet. Production will be further cut in EU member countries in 2007 and 2008, if the European Commission cuts sugar quotas by about 12%. This quota reduction will be probably decided in October 2007. These cuts of national sugar quotas will be provisional, and will be valid only in the years 2007 and 2008. The Czech Republic does not agree to the blanket cutting of sugar
75
quotas, that was caused by the withdrawal of Eastern Sugar, as it would harm those countries, which involuntarily had given up a part of their national quotas.
14 sugar factories operated in the Czech Republic in 2001/02. Only 7 sugar factories will operate in the Czech Republic in 2007/08, and it is possible that there will be a raw material shortage and the number of sugar factories will fall in the Czech Republic. Oil Plant – Rape
In the marketing year 1999/00 the rape area reached the maximum of 349,000 hectares. After a change in legislation, the interest of producers began to fall gradually until 2001/02. However, the total year production of rape seed was over 900,000 tonnes. The great drop in rape areas was caused by the flood in 2002. More than 80,000 hectares had to be ploughed under and production was only 709,500 tonnes. The wet lands could not be sown in 2003/04. Producers suffered from economic problems in 2003/04, when there only 387,800 tonnes of rape seed was harvested from 251,000 hectares. The yield reached only 1.55 t/ha because of unfavourable weather. However, the following record year 2004/05 with 3.60 t/ha did not compensate for the financial losses, as over 170,000 tonnes of seed remained on stock. In 2005-2006 rape became a competitive commodity again, bringing profit from its cultivation. The area of 292,200 ha under cultivation in 2006/07, a yield of 3.01 t/ha and total output of 880,100 tonnes, are projections of the expected growth to 320,000 hectares. Such acreage is needed to obtain sufficient supply for food and nonfood use. Potatoes – for Starch Production
Good preparation of the Czech Republic’s EU accession enabled the smooth adoption of the rules governing potato production and processing after the Czech Republic’s EU accession. Producers coped well with the quota system as well as with rules of the common market organization (CMO) (the Czech starch quota is 33,660 tonnes). Producers accommodated crop areas to the requirements of the Czech Starch Industry Association. The first year in the EU was successful for producers and for starch factories. They processed 147,900 tonnes of potatoes and produced 33,644 tonnes of starch. In the following year 2005/06 starch factories processed 166,400 tonnes of potatoes and produced 36,281 tonnes of starch, wanting to help growers by processing the surplus production. Thereby they broke the common market organization rules and had to face the prescribed sanctions. The year 2006/07 will be unfavourable because of weather inclemency for producers and processors of potatoes. Only 115,600 tonnes of potatoes and 26,800 tonnes of starch were produced.
76
Milk Milk production is relatively stable, after a significant drop in the 1990-
ties. Milk production ranged from 2.7 to 2.8 million tonnes per year in the period 2001 to 2006.
Market milk production is limited by the milk quota. Market milk production has ranged in the upper limit since the acceptance of the common organisation of the EU market for milk. An increased interest in milk production became evident after the Czech Republic’s EU accession in connection with the rising producer milk prices.
The releasing of restructuring reserves since 2006/07 increased the milk quota almost by 2.1% to the current level of 2,737,931 tonnes. However, market milk production decreased in this period in comparison with the previous period mainly because of the fall in producer prices of milk and the excess of the milk quota in the previous period.
The use of market milk production for processing is increasing in the Czech Republic, although market milk production ranges within the limit of the reference quantity. Exports of raw milk are increasing, 8% of the total volume of raw milk supplied by Czech producers was exported, in 2006 it was almost 11%. As a rule, the quality of supplied milk is high.
Beef
Cattle numbers and the number of cows have been decreasing in the period 2001 to 2006. The total cattle number decreased from 1,582,000 heads to 1,374,000 heads in this period, i.e. by more than 13%. The total number of cows declined by less than 8% (from 611,000 to 564,000 animals). The adjustment of production to demand for beef and milk had an impact on a decrease in cattle numbers, including cows. A fall in dairy cow numbers was in some measure offset by increasing suckler cow numbers. Suckler cow numbers increased from 82,000 heads in 2001 to 140,000 heads in 2006. Beef production has decreased from 208,000 tonnes to 170,000 tonnes live weight (almost by 18%) as a consequence of downward cattle numbers. Beef production has significantly decreased after the Czech Republic’s EU accession as a consequence of increasing exports of live cattle, especially exports of calves and yarded cattle. Export prices were more profitable for farmers.
77
Pork The production of pork, the total consumption and the consumption of
pork meat per inhabitant in the Czech Republic is ranked in the first place among meats. The situation on the pork market has not been favourable for Czech agriculture for several years. Production has decreased annually together with the number of pigs, while domestic consumption of pork is stagnant. This situation did not improve even after the Czech Republic’s EU accession. By contrast, there was a significant fall in pork production as a consequence of rising imports of low-priced pork. The Czech producers cannot compete.
Pork production has declined by 23.1% to 449,000 tonnes live weight in the period 2001 to 2006, while domestic consumption declined only by 2.8% to 572,500 tonnes live weight. The measure of self-sufficiency decreased from 99.1% in 2001 to 78.5% in 2006. Per capita consumption of pork is moderately above 40 kg/person per year. The number of pigs decreased by 18.1% in the period 2001 to 2006, i.e. by 629,400 heads. Imports increased almost sevenfold – from 22,300 tonnes to 165,700 tonnes during the same period. Exports increased only threefold to 44,900 tonnes live weight during the same period.
Poultry Meat
Poultry meat production increased by 3.1% in the period 2001 to 2005. An interruption of the upward trend occurred in 2003 and production declined by 4.1% year-on-year. One reason was the fall in producer prices below profitability. The occurence of avian influenza early in 2006 had an impact on another decline of poultry meat production. Poultry meat production has decreased annually by 5.4% to 304,900 tonnes live weight. Domestic consumption increased by 15.1% to 360,000 tonnes in the period 2001 to 2005 and decreased annually by 4.7% in 2006. The self-sufficiency measure was 99.9% in 2001 and 88.9% in 2006. Poultry numbers declined by 12.1% to 25,376,000 heads in the period 2001 to 2006. Imports rose fourfold (i.e. from 21,200 tonnes to 96,100 tonnes) during the period 2001-2005. Exports increased threefold during the period 2001-2004, since 2005 they have been decreasing and in 2006 reached the volume of 52,900 tonnes.
Eggs
The last few years are characterized by a downward trend both in egg production and in egg consumption. The main reason for the decreasing egg production is the decline in hen numbers as a consequence of long-lasting low egg prices and the decline in demand.
78
Egg production declined by almost 24% to 2,432.3 million pcs during the period 2001-2005. Egg consumption decreased by 16.8% to 2,624.2 million pcs in the same period. In 2006 egg production increased annually slightly by 1.78% and egg consumption increased annually by 5.3%. The main problem of the Czech egg market is the large volume of imports of low-priced eggs. Imports of eggs rose sevenfold in the period 2001-2006. Exports are only slightly increasing. The foreign trade balance with eggs was positive until 2003, since 2004 it has been unfavourable. The self-sufficiency measure in egg production declined during the period 2001-2006 and the Czech Republic has not been self-sufficient in egg production since 2005.
5. Trends in Agricultural and Food Prices APP (Agricultural Producer Prices) of Cereals
The trend in prices of cereals followed the situation on the market in each marketing year. The extraordinary production of cereals in the marketing year 2001/02 resulted in falling APP of most species already in August, and prices continued to fall also in the marketing year 2002/03. The decrease of production of wheat in the marketing year 2003 caused the gradual growth of the APP for food and feed wheat from September 2003. In terms of annual average price, this was reflected in APP as late as in the year 2004. Extraordinarily high production of cereals from 2004 harvest caused problems in the cereals market in all of EU 25 countries. Opportunities for exports from the Czech Republic to the EU were limited by generally high production, possibilities for export outside the EU were limited by the land-locked position of the Czech Republic and by high costs of transport to the ports. A marked surplus of supply over demand caused rapid decrease of cereal prices not only in Czech Republic, but also in most EU 25 countries. The decline of APP slowed down at the end of the marketing year 2004/2005 thanks to sales through special export tenders from the intervention stocks. A marked surplus balance at the beginning of the marketing year 2005/06 maintained the stability of APP for cereals. Only by the end of the first half of the marketing year 2005/06 there was a slow rise of APP in consequence of a revival on the EU market for cereals. As a consequence of increasing domestic and foreign demand for cereals, the growth of APP in the marketing year 2006/2007 has been continuing.
The average APP of all cereals reached interannual improvement in 2006. APP for food wheat increased interannually by 401 CZK/t (14.6%) and reached 3,150 CZK/t, i.e. 111.1 EUR/t, APP of malting barley increased just by 29 CZK/t
79
(0.9%) to 3,270 CZK/t, i.e. 115.4 EUR/t. Compared to the previous year, APP of rye in 2006 increased by 585 CZK/t (25%) to 2 927 CZK/t, i.e. 103.3 EUR/t. APP of Sugar Beet and Industrial Producer Prices (IPP) of Sugar
Before the Czech Republic’s EU accession, during the years 2001-2003, the average APP of sugar-beet with actual sugar content according to CZSO (Czech Statistical Office) amounted to 29.77 EUR/t (960 CZK/t). After the Czech Republic’s EU accession in 2004 this price reached 47.67 EUR/t (1,521 CZK/t) and in 2005 45.23 EUR/t (1,347 CZK/t). In view of the decrease of sugar beet floor price after the CMO reform in the sugar sector, the APP of sugar beet (with standard actual sugar content) reached 37.40 EUR/t (1,060 CZK/t) in 2006.
The average APP of sugar beet from the harvest in 2005, after conversion to standard 16% sugar content, and after price adjustment of beet B according to Commission Regulation (EC) No 1462/2004, and prices realized under the beet “C” production quota, amounted 35.71 EUR/t (1,063.60 CZK/t).
The IPP of sugar stemmed from state-set floor prices of bulk refined granulated sugar before the Czech Republic’s EU accession. After the Czech Republic’s EU accession, the IPP of granulated sugar increased sharply due to the high intervention sugar price implemented in the EU. IPP of granulated sugar remained for a few months after accession at the level of over 0.70 EUR/kg (22 CZK/kg) from July to October 2004. At the end of 2004 it started to fall. In September 2005, IPP of granulated sugar fell to 0.61 EUR/kg (17.86 CZK/kg), i.e. approximately to the level observed before the Czech Republic’s EU accession. The reason behind this price decline in the domestic market was the decline of total sales of sugar from sugar refineries, problems with sugar C exports to third countries, price cutting pressure from the retail chains, and rising exports of other sweeteners (isoglucose, glucose). The sale of sugar at the intervention price was also caused by the fact that intervention purchases started as late as October 2005. IPP of granulated sugar has been rising gradually above the level of intervention price since October 2005 because of the higher sales of sugar from sugar refineries and because of the reduction of sugar stocks, but it fell short of the level of the period just after the accession.
APP of Oil Crops – Oilseed Rape
APP of oilseed rape began to fall slightly following large supply of rapeseed since 2000/01. Ups and downs in 2003/04 were due to floods in 2002 and to absolute crop failure in 2003. In 2001/02 APP of rapeseed reached 7,316

80
CZK/t (237.44 EUR/t), in 2002/03 it fell to 6,904 CZK/t (216.81 EUR/t) and after the growth to 8,048 CZK/t (253.39 EUR/t) in 2003/04, it fell again to 6,070 CZK/t (208.80 EUR/t) in 2005/06. Prices began to rise again following the increased interest in rapeseed for non-food use as late as in this year, when the average APP reached 6,853 CZK/t (244.44 EUR/t) in the first half the year.
APP of Potatoes – for Starch Production
The average price of potatoes for starch production with the average starch content of 20.11% reached 2040 CZK/t (63.94 EUR/t) in 2004, according to the Czech Starch Industry Association and in 2005 with the average starch content 18.80% reached on average 1,815 CZK/t (60.94 EUR/t). Data for the year 2006 have not been published yet. APP of Milk
The average APP of milk rose markedly in 2004, after the Czech Republic’s EU accession, however in 2005 it fell again. In 2006 a seasonal trend in APP emerged, with slow price increase in the second half of the year. However, the average APP of whole milk was 7.81 CZK/l (i.e. 26.83 EUR/100 kg) in 2006.
The trend in average IPP of pivotal dairy produce in 2001-2006 differed individually between products, but after the Czech Republic’s EU accession the average annual IPP of all primary products, i.e. dry skimmed milk, dry whole milk, was falling, with the exception of butter and a significant part of cheeses – Edam especially.
APP of Beef
The trend in APP of slaughter cattle in 2001-2003 was influenced by a surplus of supply over demand, which was affected by BSE also in Europe. The relatively favourable price reached after the Czech Republic’s EU accession when APP of slaughter cattle increased by c. 8-12% and over the last two years reached 42 CZK/kg live weight (269 EUR/100 kg slaughter weight) for bulls, 32 CZK/kg l. w. (213 EUR/100 kg sl. w.) for heifers and 30 CZK/kg l. w. (201 EUR/100 kg sl. w.) for slaughter cows.
APP of Pork
Agricultural producer prices of slaughter pigs are affected markedly in the domestic market by the trend in prices in the EU. They were falling slightly from 2001 to 2006. They reached the highest levels in 2001, thanks to growing
81
demand for pork due to falling consumption of beef caused by BSE and FMD (foot and mouth disease) occurrence in ruminants. A relatively abundant supply affected negatively the trend in prices in the Czech Republic in 2002. This trend continued in 2003, when the prices also reached the lowest level over the last five years. After the Czech Republic’s EU accession, i.e. in 2004, they have been rising again. In 2006 the price of SEU pigs on the domestic market reached 40.98 CZK/kg sl. w. (i.e. 144.59 EUR/100 kg sl. w.).
APP of Poultry Meat
Agricultural producer prices of slaughter chickens declined markedly through the years 2001-2006, namely by 26%, from 25,963 CZK/t (762 EUR/t) to 19,177 CZK/t live weight, in line with growing production, rising demand for poultry meat and declining supply of forage mixtures. Slight APP increase was noted in 2004.
APP of Eggs
Agricultural producer prices declined over the years 2001-2006 from 1,899 CZK/1000 pieces (55.7 EUR/1000 pieces) to 1,468 CZK/1000 pieces. The price decline was caused especially by imports of eggs at lower cost than offered by domestic producers. This led to the fact that a number of producers with outstanding economic efficiency and technology of hen rearing intentionally reduced their production or discontinued hen-raising.
Consumer Prices of Foodstuffs and Beverages
The APP level (and consequently the IPP of foodstuffs) is linked, to a degree, with the trend in consumer prices of foodstuffs. Consumer prices of foodstuffs and beverages are affected essentially by the level of inflation, owing to their significant representation in the consumption basket. The total level of consumer prices increased by 9.5% from 2001 to 2006. Prices of foodstuffs and beverages fell overall by 0.3% (prices of foodstuffs alone increased by 0.5%, prices of beverages, to the contrary, decreased by 6.2%) thereby mitigating the inflation level.
As shown in Figure 3, consumer prices of baked products increased most dynamically among individual food groups (almost by 17%) between 2001 and 2006. The high price increase was caused by substantial rise in prices of common pastry (by 16%) and bread (by 14%). Relatively marked interannual price variations (the highest increase in 2004) of this group are connected, to
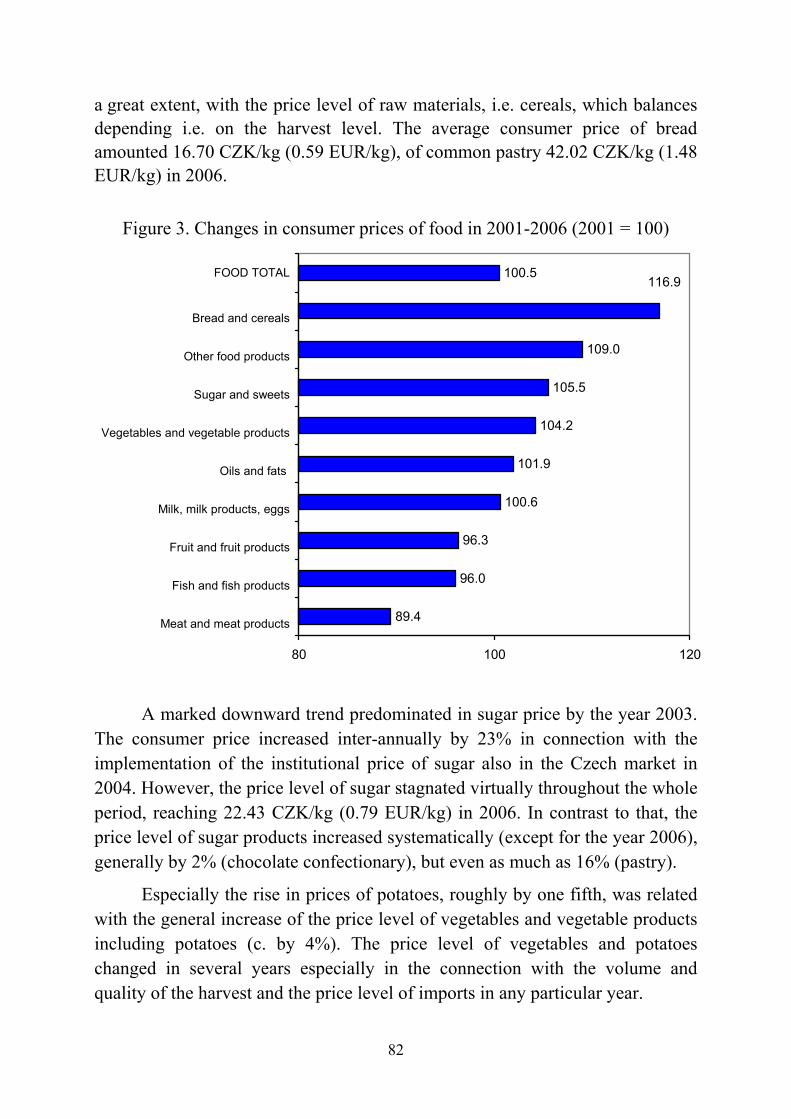
82
a great extent, with the price level of raw materials, i.e. cereals, which balances depending i.e. on the harvest level. The average consumer price of bread amounted 16.70 CZK/kg (0.59 EUR/kg), of common pastry 42.02 CZK/kg (1.48 EUR/kg) in 2006.
Figure 3. Changes in consumer prices of food in 2001-2006 (2001 = 100)
89.4
96.0
96.3
100.6
101.9
104.2
105.5
109.0
100.5116.9
80 100 120
Meat and meat products
Fish and fish products
Fruit and fruit products
Milk, milk products, eggs
Oils and fats
Vegetables and vegetable products
Sugar and sweets
Other food products
Bread and cereals
FOOD TOTAL
A marked downward trend predominated in sugar price by the year 2003. The consumer price increased inter-annually by 23% in connection with the implementation of the institutional price of sugar also in the Czech market in 2004. However, the price level of sugar stagnated virtually throughout the whole period, reaching 22.43 CZK/kg (0.79 EUR/kg) in 2006. In contrast to that, the price level of sugar products increased systematically (except for the year 2006), generally by 2% (chocolate confectionary), but even as much as 16% (pastry).
Especially the rise in prices of potatoes, roughly by one fifth, was related with the general increase of the price level of vegetables and vegetable products including potatoes (c. by 4%). The price level of vegetables and potatoes changed in several years especially in the connection with the volume and quality of the harvest and the price level of imports in any particular year.
83
In the oils and fats range (increasing by 2%), prices of animal fats rose (butter almost by 15%, lard by 5%) from 2001 to 2006, contrasting with prices of edible oils and vegetable fats, which decreased (by 8%, respective by 3%). The price of butter rose throughout the whole period (except 2006), most markedly in 2004 due to the rise in milk prices, output reduction and the decrease of stocks.
Essentially, the aggregate sector of milk, dairy products and eggs on the whole, presented a stagnating price trend. However, the development within this sector was different. While the price of market milk fell almost by 5%, prices of dairy products increased between 1.8% (other dairy products) and as much as 14.5% (preserved milk). Prices of milk and cheeses rose essentially after the EU accession in 2004 (interannually by 4.4%, respectively by 4.1%) when the revival of demand on the milk market took place, combined with the rise in world prices of milk and dairy products and also the APP of milk. Prices of eggs in 2006 were lower in comparison to 2001 by roughly 15%. By the year 2003 they fluctuated, in 2004 interannually they sharply increased, and over the last two monitored years they were decreasing, owing to the large imports of eggs at favourable prices.
The price level decrease was recorded in the monitored period in three food categories: fish and fish products, fruit and fruit products, meat and meat products.
The highest price decline (almost by 11%) was recorded in the meat and meat products sector. The development direction of consumer prices of particular types of meat varied. The price of jointed beef rose almost by 13%. There was a slightly downward trend by the year 2003, after the EU accession it was continually rising (reaction to APP increase, withdrawal of supply excess). The price levels of jointed pork meat and poultry decreased significantly (roughly by 19% and 23%, respectively). The long-term trend in the development of pork and poultry consumer prices was not very different, because both meat types are easily substitutable. After the slump in prices of both meat types in 2002 and 2003, in 2004 there occurred their temporary upswing (in pork as a consequence of APP rise), followed by their fall again.
While the prices of foodstuffs in 2001-2006 slightly rose, on the contrary, the prices of total beverages were reduced by 6.2%. The prices of the subgroup of coffee, tea and cocoa were falling faster (almost by 12%) than the prices of mineral waters, syrups, juice, or others beverages in total (decrease by 2.6%).
84
When analysing price development, it needs to be kept in mind that consumer prices of foodstuffs result from numerous factors. Apart from the level of farmgate and industrial producers´ prices, the prices of foodstuffs are significantly affected by the development of prices of non-food goods and services, the development of purchasing power of the population, the development of prices in the world, as well as on the domestic commodity market for raw materials and products, the level of import prices, the exchange rate development, and last but not least, by the trade policy and fierce competition among multinational retail chains. Especially the last factor begins to play an increasing role in the development of food prices.
The consumer prices level is one of the factors affecting the share of expenditure for foodstuffs in total household expenditure. In 2005, the share of expenditure for foodstuffs and beverages in total household expenditure amounted to 20.6% (of which 18.5% was for groceries and 2.1% for beverages), which, in comparison to the year 2001 represented a decline by 2.3 percentage points. However, this indicator has been declining, contrasting with rising total household expenditure for foodstuffs. From 2001 to 2006 the total expenditure for foodstuffs and beverages rose by 5.2% (by 5.3%for foodstuffs, by 5.0% for beverages).
6. Trends in Food Industry Sector Production Developments in the manufacture of selected food products and beverages
(NACE 15) in the period from 2000 to 2005 are presented in Table 2.
The comparison of the manufacture of selected food products and beverages (NACE 15) in 2005 compared with 2004 is illustrated in Figure 4.

85
Table 2. Manufacture of chosen food products and beverages (NACE 15)
Product Unit 2000 2001 2002 2003 2004 2005
Fresh or chilled bovine meat t 74,687 63,585 75,289 78,680 69,653 62,884
Fresh or chilled swine meat t 181,512 192,664 219,943 227,789 301,585 284,456
Meat of poultry, fresh or chilled, not cut in pieces t 41,723 33,145 36,267 74,208 78,121 84,550
Meat of poultry, frozen, not divided t 66,011 67,199 72,290 38,133 30,102 28,316
Potatoes, prepared and preserved t 54,144 58,019 58,833 54,814 51,974 53,988
Milk and cream up to 6% in fat l’000 474,586 483,187 509,172 496,772 570,682 635,877
Milk and cream over 6% in fat l’000 26,032 29,116 28,414 27,113 35,246 44,429
Butter t 63,882 58,231 58,420 58,108 61,362 55,575
Cheese Curd t 151,666 151,233 150,317 149,112 151,573 147,668
Yoghurt and fermented or acidified milk t 137,230 129,545 124,590 131,677 149,899 169,218
Wheat flour t 802,600 783,234 816,105 760,576 829,150 855,531
Fresh bread t 335,784 336,972 341,633 345,828 346,551 349,452
Fresh white bread and similar products t 267,994 274,325 282,605 279,440 275,169 289,087
Fresh pastry goods and cakes t 43,637 45,350 51,830 52,495 56,540 58,087
Refined sugar t’000 367 482 517 521 557 573
Pasta, not cooked, stuffed or otherwise prepared
t 57,146 48,755 56,850 51,248 50,895 52,268
Spirits, liqueurs and other spirituous beverages
l’000 69,367 56,718 55,528 57,636 42,239 49,333
Wine of fresh grapes, except sparkling wine l’000 53,815 60,516 68,029 73,978 66,206 66,107
Beer made from malt hl’000 17,796 17,734 17,987 18,216 18,596 18,885
Mineral waters l’000 680,091 677,628 763,966 846,702 818,878 812,998
Other non-alcoholic beverages l’000 1,508,221 1,601,648 1,642,441 1,619,548 1,632,331 1,701,603
Source: CSO, for corporate bodies and natural persons with 20 and more employees.
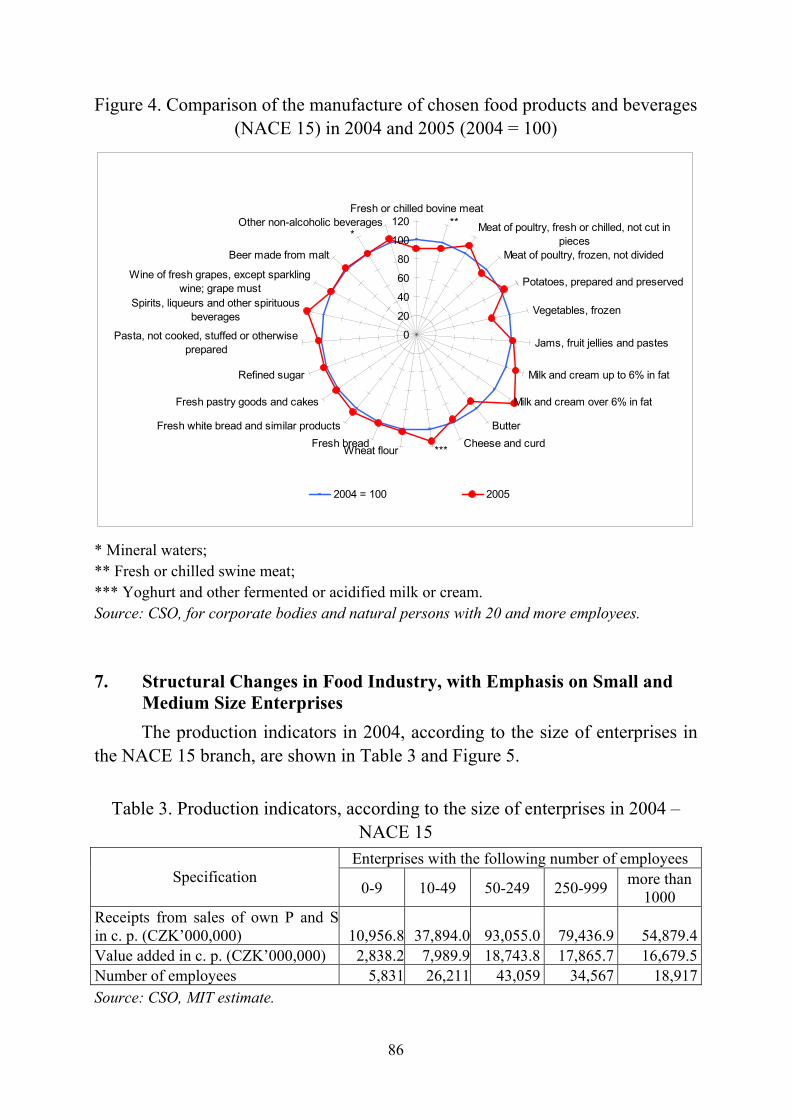
86
Figure 4. Comparison of the manufacture of chosen food products and beverages (NACE 15) in 2004 and 2005 (2004 = 100)
0
20
40
60
80
100
120Fresh or chilled bovine meat
** Meat of poultry, fresh or chilled, not cut inpieces
Meat of poultry, frozen, not divided
Potatoes, prepared and preserved
Vegetables, frozen
Jams, fruit jellies and pastes
Milk and cream up to 6% in fat
Milk and cream over 6% in fat
ButterCheese and curd
***Wheat flourFresh bread
Fresh white bread and similar products
Fresh pastry goods and cakes
Refined sugar
Pasta, not cooked, stuffed or otherwiseprepared
Spirits, liqueurs and other spirituousbeverages
Wine of fresh grapes, except sparklingwine; grape must
Beer made from malt
*Other non-alcoholic beverages
2004 = 100 2005
* Mineral waters; ** Fresh or chilled swine meat; *** Yoghurt and other fermented or acidified milk or cream. Source: CSO, for corporate bodies and natural persons with 20 and more employees. 7. Structural Changes in Food Industry, with Emphasis on Small and
Medium Size Enterprises The production indicators in 2004, according to the size of enterprises in
the NACE 15 branch, are shown in Table 3 and Figure 5.
Table 3. Production indicators, according to the size of enterprises in 2004 –
NACE 15 Enterprises with the following number of employees
Specification 0-9 10-49 50-249 250-999 more than
1000 Receipts from sales of own P and Sin c. p. (CZK’000,000) 10,956.8 37,894.0 93,055.0 79,436.9 54,879.4Value added in c. p. (CZK’000,000) 2,838.2 7,989.9 18,743.8 17,865.7 16,679.5Number of employees 5,831 26,211 43,059 34,567 18,917Source: CSO, MIT estimate.
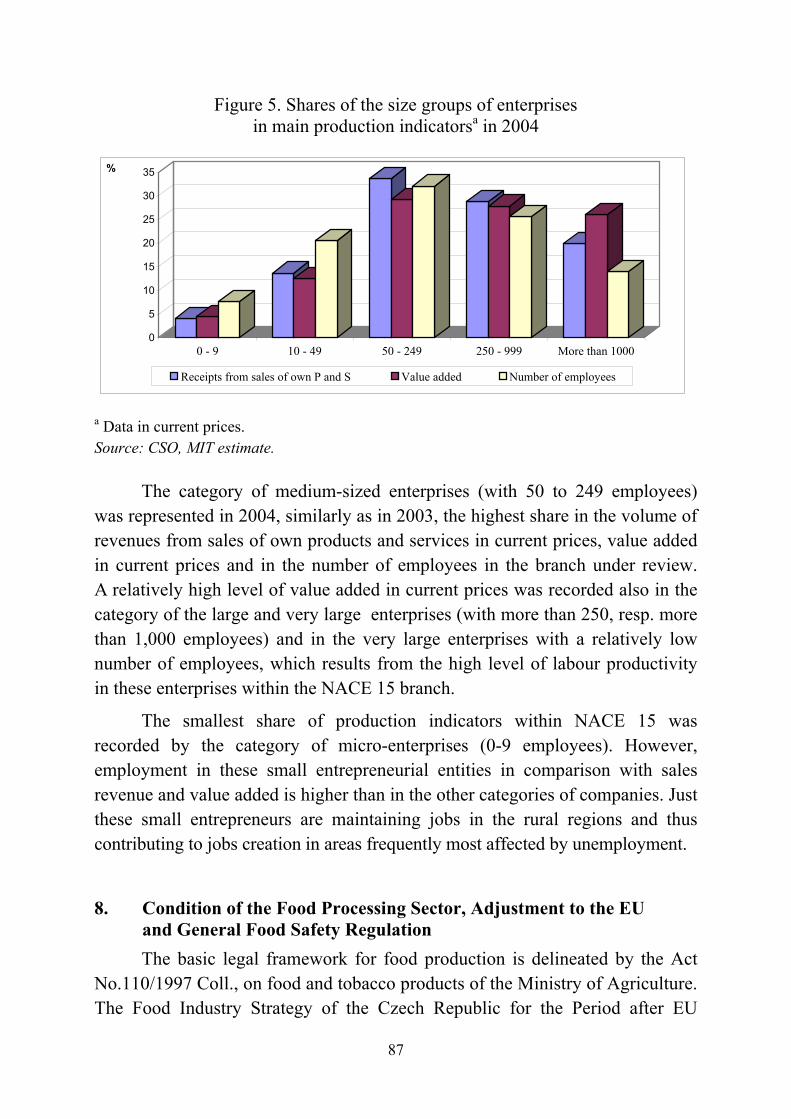
87
Figure 5. Shares of the size groups of enterprises in main production indicatorsa in 2004
a Data in current prices. Source: CSO, MIT estimate.
The category of medium-sized enterprises (with 50 to 249 employees) was represented in 2004, similarly as in 2003, the highest share in the volume of revenues from sales of own products and services in current prices, value added in current prices and in the number of employees in the branch under review. A relatively high level of value added in current prices was recorded also in the category of the large and very large enterprises (with more than 250, resp. more than 1,000 employees) and in the very large enterprises with a relatively low number of employees, which results from the high level of labour productivity in these enterprises within the NACE 15 branch.
The smallest share of production indicators within NACE 15 was recorded by the category of micro-enterprises (0-9 employees). However, employment in these small entrepreneurial entities in comparison with sales revenue and value added is higher than in the other categories of companies. Just these small entrepreneurs are maintaining jobs in the rural regions and thus contributing to jobs creation in areas frequently most affected by unemployment.
8. Condition of the Food Processing Sector, Adjustment to the EU and General Food Safety Regulation The basic legal framework for food production is delineated by the Act
No.110/1997 Coll., on food and tobacco products of the Ministry of Agriculture. The Food Industry Strategy of the Czech Republic for the Period after EU
0 5
10 15 20 25 30 35 %
0 - 9 10 - 49 50 - 249 250 - 999 More than 1000 Receipts from sales of own P and S Value added Number of employees
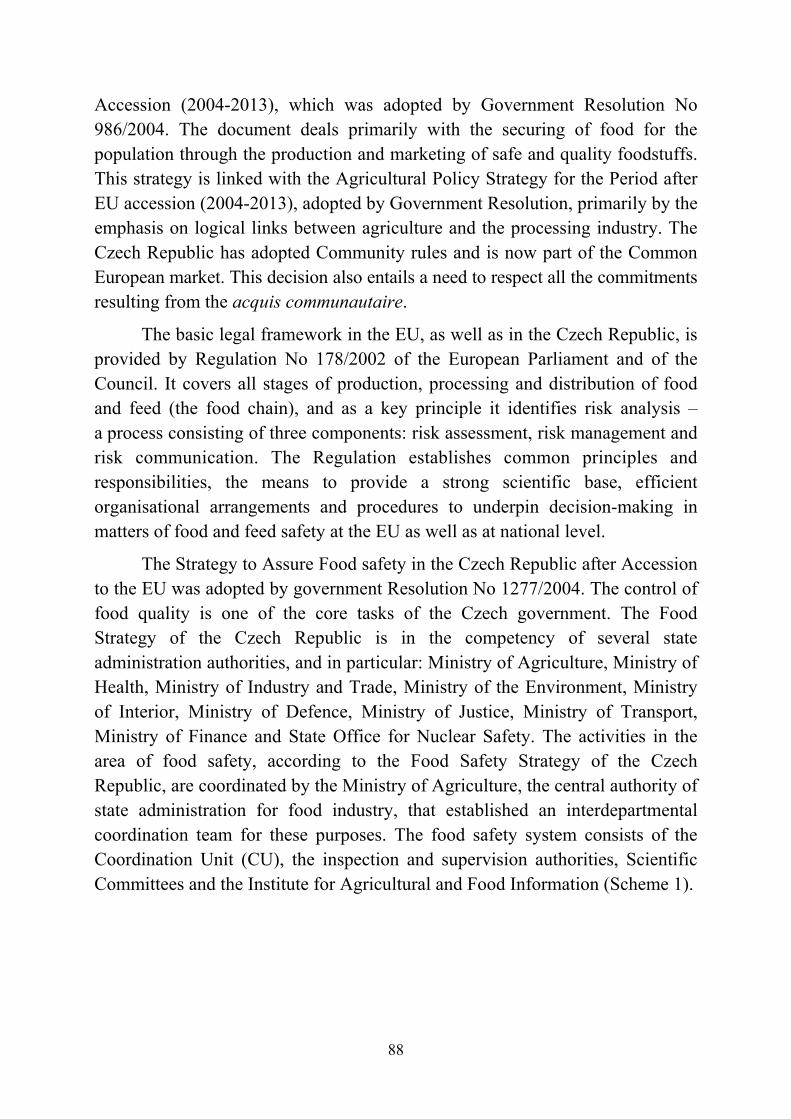
88
Accession (2004-2013), which was adopted by Government Resolution No 986/2004. The document deals primarily with the securing of food for the population through the production and marketing of safe and quality foodstuffs. This strategy is linked with the Agricultural Policy Strategy for the Period after EU accession (2004-2013), adopted by Government Resolution, primarily by the emphasis on logical links between agriculture and the processing industry. The Czech Republic has adopted Community rules and is now part of the Common European market. This decision also entails a need to respect all the commitments resulting from the acquis communautaire.
The basic legal framework in the EU, as well as in the Czech Republic, is provided by Regulation No 178/2002 of the European Parliament and of the Council. It covers all stages of production, processing and distribution of food and feed (the food chain), and as a key principle it identifies risk analysis – a process consisting of three components: risk assessment, risk management and risk communication. The Regulation establishes common principles and responsibilities, the means to provide a strong scientific base, efficient organisational arrangements and procedures to underpin decision-making in matters of food and feed safety at the EU as well as at national level.
The Strategy to Assure Food safety in the Czech Republic after Accession to the EU was adopted by government Resolution No 1277/2004. The control of food quality is one of the core tasks of the Czech government. The Food Strategy of the Czech Republic is in the competency of several state administration authorities, and in particular: Ministry of Agriculture, Ministry of Health, Ministry of Industry and Trade, Ministry of the Environment, Ministry of Interior, Ministry of Defence, Ministry of Justice, Ministry of Transport, Ministry of Finance and State Office for Nuclear Safety. The activities in the area of food safety, according to the Food Safety Strategy of the Czech Republic, are coordinated by the Ministry of Agriculture, the central authority of state administration for food industry, that established an interdepartmental coordination team for these purposes. The food safety system consists of the Coordination Unit (CU), the inspection and supervision authorities, Scientific Committees and the Institute for Agricultural and Food Information (Scheme 1).
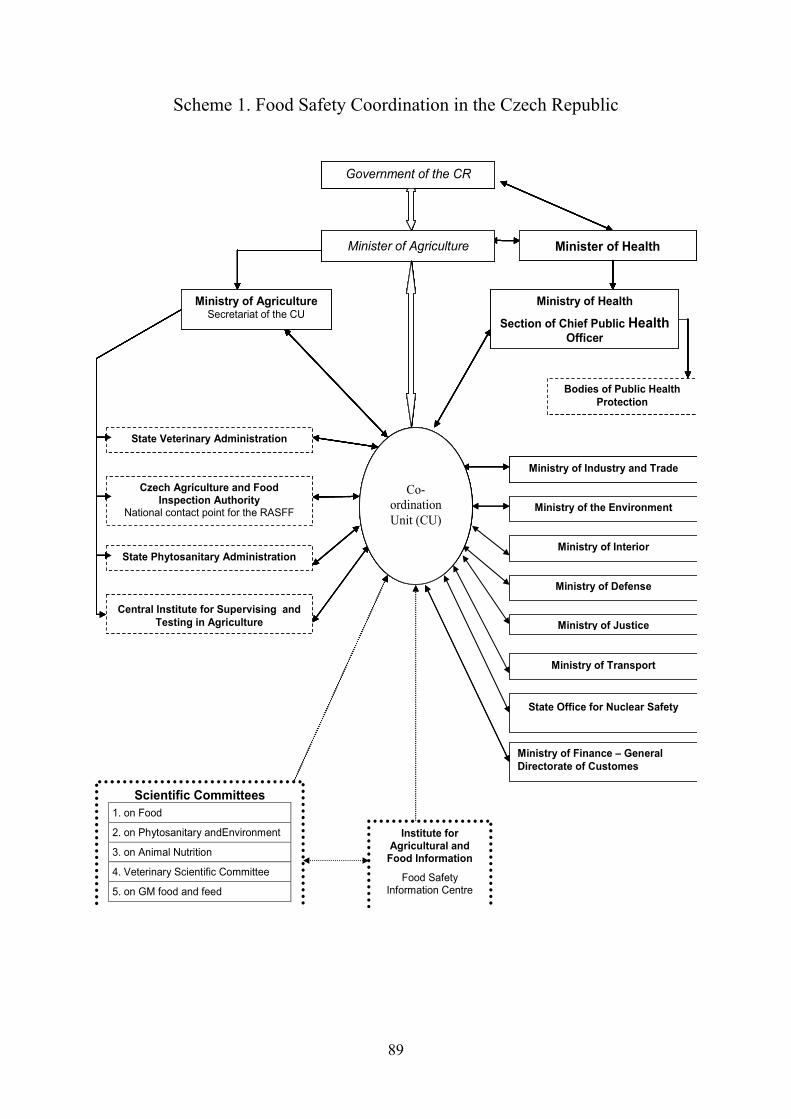
89
Scheme 1. Food Safety Coordination in the Czech Republic
Government of the CR
Minister of Agriculture
Co-ordination Unit (CU)
Ministry of Agriculture Secretariat of the CU
Ministry of Health
Section of Chief Public Health Officer
Ministry of the Environment
Ministry of Transport
State Office for Nuclear Safety
Ministry of Industry and Trade
Bodies of Public Health Protection
State Veterinary Administration
Czech Agriculture and Food Inspection Authority
National contact point for the RASFF
State Phytosanitary Administration
Central Institute for Supervising and Testing in Agriculture
Scientific Committees 1. on Food
2. on Phytosanitary andEnvironment
3. on Animal Nutrition
4. Veterinary Scientific Committee
5. on GM food and feed
Institute for Agricultural and
Food Information
Food Safety Information Centre
Ministry of Interior
Minister of Health
Ministry of Defense
Ministry of Justice
Ministry of Finance – General Directorate of Customes
Government of the CR
Minister of Agriculture
Ministry of Agriculture Secretariat of the CU
Ministry of Health
Section of Chief Public Health Officer
Minister of Health
Government of the CR
Co-ordination Unit (CU)
Bodies of Public Health Protection
Minister of Agriculture
Ministry of Agriculture Secretariat of the CU
Ministry of Health
Section of Chief Public Health Officer
Minister of Health
Government of the CR
Co-ordination Unit (CU)
Bodies of Public Health Protection
Minister of Agriculture
Ministry of Agriculture Secretariat of the CU
Ministry of Health
Section of Chief Public Health Officer
Minister of Health
Government of the CR
State Veterinary Administration
Czech Agriculture and Food Inspection Authority
National contact point for the RASFF
State Phytosanitary Administration
Central Institute for Supervising and Testing in Agriculture
Co-ordination Unit (CU)
Bodies of Public Health Protection
Minister of Agriculture
Ministry of Agriculture Secretariat of the CU
Ministry of Health
Section of Chief Public Health Officer
Minister of Health
Government of the CR
Minister of Agriculture
Ministry of Agriculture Secretariat of the CU
Ministry of Health
Section of Chief Public Health Officer
Minister of Health
Government of the CR
Minister of Agriculture
Ministry of Agriculture Secretariat of the CU
Ministry of Health
Section of Chief Public Health Officer
Minister of Health
Government of the CR
State Veterinary Administration
Czech Agriculture and Food Inspection Authority
National contact point for the RASFF
Minister of Agriculture
Ministry of Agriculture Secretariat of the CU
Ministry of Health
Section of Chief Public Health Officer
Minister of Health
Government of the CR
State Phytosanitary Administration
Central Institute for Supervising and Testing in Agriculture
Co-ordination Unit (CU)
Bodies of Public Health Protection
State Veterinary Administration
Czech Agriculture and Food Inspection Authority
National contact point for the RASFF
Minister of Agriculture
Ministry of Agriculture Secretariat of the CU
Ministry of Health
Section of Chief Public Health Officer
Minister of Health
Government of the CR
Ministry of Industry and Trade
State Phytosanitary Administration
Central Institute for Supervising and Testing in Agriculture
Co-ordination Unit (CU)
Bodies of Public Health Protection
State Veterinary Administration
Czech Agriculture and Food Inspection Authority
National contact point for the RASFF
Minister of Agriculture
Ministry of Agriculture Secretariat of the CU
Ministry of Health
Section of Chief Public Health Officer
Minister of Health
Government of the CR
90
There are also several alert systems, such as EPIDAT (a system operated by the Ministry of Health in case of notification, registration and analysis of
morbidity due to infections), RAPEX ((Rapid Alert System for Foodstuffs), TRACES (Trade Control and Expert System) and RASFF (Rapid Alert System for Food and Feed). Food safety is linked with the quality of foodstuffs in some features. Proving the quality of products is the base of marketing
support, which is available to all food producers doing business in the Czech Republic. The KLASA mark of national produce quality has been created for this purpose. This reputable mark is awarded to high-quality food and agricultural products.
Following accession to the EU, the Czech Republic’s role in the field of food law changed from passive adoption of Community legislation to active participation in the development of Community rules. Legislation dealing with food safety, from farm to consumer, falls within the remit of several central state administration authorities and has a direct impact on businesses. The number of food processing companies declined after 2000. A reduction in the number of companies was mainly caused by ever harder competition conditions both in the purchase and distribution markets, and the conditions set by food and veterinary regulations ensuring health safety and quality of food, but also requirements of protecting the environment. Before EU accession, dozens of companies yearly closed/discontinued their activities due to so-called pasportization.
The fulfilment of the Strategy to Assure Food Safety in the Czech Republic after Accession to the EU for the period from January 2005 through September 2006 was evaluated by the members of the Coordination Group for Food Safety. The roles of institutions, which are involved in issues of food safety, have not substantially changed, the Strategy has been successfully fulfilled. However, it is needles to accentuate, that the work does not finish yet with fulfilling certain tasks, as it is necessary to develop further and improve the existing activities. Some of the tasks are continuous processes, or their implementation was merely launched following the accession to the European Union, so they shall be taken care of in the future as well. This especially holds for the application of European Communities legislation in the field of food and feedstuffs safety, animal health and welfare, phytosanitary care and official controls, the so-called “set of public health measures”. At the national level the system ensuring food safety appears to be working well, nevertheless it is under continuous development also on the basis of recommendations given by control missions of the European Communities institutions, especially the Directorate
91
General for Health and Consumer Affairs (DG SANCO), Directorate General for Research (DG Research), and Directorate General for Agriculture and Rural Development (DG Agri). The Strategy will undergo essential revision by the Ministries involved by the end of 2008. The revision objective will be to define clearly the major priorities of the Czech Republic for the Czech Republic Presidency of the Council of the European Union.
9. The Level and Dynamics of Investment in the Food Industry Sector, Involving Foreign and Public Origin of Finance and Structural Funds The development of gross fixed capital investment in the period from
2000 to 2005 is illustrated in Table 4, which clearly shows the increase of investment until the year 2004, followed by decline in the year 2005.
Table 4. Development of gross fixed capital investment (CZK’000,000,000)
Item 2000 2001 2002 2003 2004 2005 NACE 15 11 12 13 14 15 13
The inflow of foreign direct investments (FDI) in the NACE 15 branch and NACE 16 (manufacture of tobacco products) exceeded CZK 2,478.6 million in the year 2006, representing 1.8% share in the total volume of FDI incoming to the national economy of the Czech Republic. Compared with 2005, the volume of FDI inflow declined in 2006, but not the share of total FDI.
The outflow of PDI from the Czech Republic in 2006 within the NACE 15 and 16 amounted to CZK 1,115.1 millions (i.e. 3.7% of total volume). Compared with 2006, this is a significant increase in 2005. Within the whole period under consideration, this outflow amounted to CZK 1,766.1 millions.
For the performance and competitiveness of NACE 15 branch, with respect to its company structure, there are important supports, which are determined for small and medium-sized enterprises (SMEs). In 2005 the support for SMEs in the area of preferentially priced credits (Programme PROGRES – in total) amounted to CZK 125.5 millions (the share from the support was 11%) and in the provided guarantees the support amounted to CZK 42.3% (the share – 5.3%). As to the contributions for interest settlement (Programme VESNICE), the support amounted to CZK 0.3 million (the share from the support attained 3.4%), and as to other contributions (Programme TRH – certificate, SPECIAL) it was CZK 2.1 millions (the share – 1.1%) in 2005. In total, the volume of the supports, including credits within the manufacture of food products and
92
beverages, amounted to CZK 170.2 millions. In comparison with preceding years 2004 and 2003, the volume of the supports is declining.
The supportive programme 13. Support of enhancement of the competitiveness of the Czech foodstuff industry (with the sub-programmes 13.A and 13.B), which was applied by the Ministry of Agriculture in the years 2002 and 2003, was not continued in 2004, but a similar programme was restored at the end of 2005 only, thus the supports by means of subsidies from the national budget will not be paid before the end of 2006. Within the framework of the supports from public resources (both EU and Czech Republic ones) from the “Operational programme of the countryside development and multifunctional agriculture” (Operational Programme Agriculture) was drawn down for the measure “Improvement of processing of agriculture products and their marketing” and for the sub-measure “Processing of fish and marketing of fish products” the total of CZK 44 millions in 2005.
The support from the means of the Operational Programme Industry and Business (OPIB) amounted to CZK 28 millions in 2005.
In both programmes (i.e. Operational Programme Agriculture and OPIB) the supports were paid out in 2004. Furthermore, for the subjects that belong, by prevailing activity, to NACE 15, some other specific supports were provided in 2005 (e.g., for settlement of a part of interest from credits PGRLF, bonuses for the manufacturers of starch, tax relief for small independent breweries, etc.).
10. Conclusion In the first decade of the 21st century the sector of food products and
beverages was not attaining such a high growth rate as the entire manufacturing industry in Czech Republic. Czech food industry has stayed at the fourth place in the manufacturing industry. At the same time, decisive shares in sales revenues within NACE 15 belong to the four following groups: the manufacture of other food products, dominated by the manufacture of bakery and confectionery products, the production of meat and meat products, the manufacture of beverages, and the processing of milk.
The most significant decline in consumption from 2000 till 2005 was recorded by beef meet and eggs, contrasting with the increase by non-alcoholic beverages, poultry, milk and milk products. The tendency of demand for foodstuffs and beverages did not change after the EU accession of the Czech Republic.
Development of the foreign trade balance in the case of food products and beverages in the same period was permanently worsening. The reason behind

93
such development is the prevailing impact of imports. EU accession opened a much bigger market for the purchase of raw materials and also for sales.
Changes in the level and structure of production and supply of agricultural production vary, depending on the commodities concerned and follow the demand. Trends in agricultural and food prices were similar. The total level of consumer prices was raised by 9.5% from 2001 to 2006. Prices of foodstuffs and beverages fell overall by 0.3%, mitigating the level of inflation. The share of expenditures for foodstuffs and beverages in total household expenditure amounted to 20.6%; in comparison to the year 2001 it declined by 2.3 p.p.
The tendency in the food industry sector production corresponds with changes of domestic demand and of the development in foreign trade with food products and beverages. In the Czech Republic there are various forms of support serving to increase the performance and competitiveness of the food sector. Some are determined for SMEs.
For the time being, as well as in the future, it is necessary to consider food safety as the main priority. Controlling of the quality of foodstuffs is part of the core tasks of the Czech government. The Strategy to Assure Food safety in the Czech Republic after Accession to the EU has been successfully fulfilled. The strategy will undergo essential revision by the Ministries involved by the end of 2008.
The Food Industry Strategy in the Czech Republic for the Period after EU Accession 2004-2013 was adopted by the Government in the year 2004. This Strategy is ambitious, but it is important to create conditions for its fulfilment.
References 1. Panorama of the Czech Industry, Manufacture of Food Products and Beverages 2002-
2005, MZe and VÚZE, Prague 2003-2006. 2. Mezera, J. et al.: Position, performance and efficiency of Manufacture of Food Products
and Beverages, Thematic task, 2006, VÚZE Prague.
94
Dr. Norbert Potori, Dr. Levente Nyárs
Research Institute for Agricultural Economics (AKI) Budapest, Hungary
EU Integration Experiences of the Agri-Food Sector in Hungary
1. Agricultural Policy 1.1. Agricultural Policy Before the Accession
Since the start of the transition to market economy in the early 1990s, only limited progress has been made towards the market orientation of the agricultural sector in Hungary. Although regulations and the subsidy system played an important role especially in stabilizing the livestock sectors, producers were used to the national intervention mechanism, and production, in general, became rather neutral towards market signals. For a long time, Hungarian agricultural policy decision makers failed to focus on adopting the Acquis Communautaire, therefore, until the 2003/04 season, no substantial changes occurred in agricultural policies. As a consequence, there remained a considerable workload to be dealt with in the year before EU-entry.
Until 2004, border measures, administered prices, input subsidies, area and headage payments, were the main policy instruments used to support agriculture. Export subsidies constituted an important albeit declining policy instrument to regulate crops and animal product markets, especially for poultry and pork meat. Imports were regulated by ad-valorem tariffs and tariff rate quotas. Agri-environmental and rural development measures were gaining importance. Per hectare subsidies to limit soil erosion and to promote organic farming were the two main environmental policy measures.
Among payments based on the use of inputs, the most important were subsidized credits and capital grants, as well as fuel-tax subsidies. Budgetary support, based on capital, was provided mainly in the form of subsidized interest rates for farm credit (for investments as well as for working capital) and capital grants (for land improvement and irrigation, for purchases of breeding animals or for farms that would otherwise have difficulty getting access to credit). Part of the support, in the form of capital grants, was provided to young farmers. Fuel tax concessions were granted to farms based
95
on standard fuel consumption per hectare of agricultural land (arable land, plantations, grassland) and per dairy cow.
For milling wheat and feed maize, a system of guaranteed prices combined with minimum and maximum intervention prices existed. Buy-up quantities were strictly limited. Prices for milk, pork and beef were supported by a system of guaranteed, intervention and reference prices. For these livestock products, output-based payments were used to cover the gap between market prices and reference prices. In addition, price premiums for high-quality production were provided mainly for beef, milk, pork, poultry and game meat, although some vegetable products were also eligible. Support was also granted for the distillation and storage of high quality wines, as well as for the storage of apples.
An area based payment scheme was established in 1999 and remained one of the main programs providing direct payments to farmers. Farms with less than 300 hectares of agricultural land were granted area payments inversely related to farm size (this discriminative feature was later discontinued). Headage payments were provided for the purchase and breeding of animals. For milk, an output quota was introduced. None of these policy measures complied fully with the CAP.
An agricultural trade agreement between Hungary and the EU entered into force on 1 July 2000. This agreement liberalized agri-food trade according to the so-called “double-zero” principle, under which the two parties agreed not to use export refunds or import duties for a range of products. For certain more sensitive products, where this principle was not applied, preferential quotas were extended. In 2002, the agreement was replaced by a new trade liberalization agreement. As a result, 97% of Hungarian agri-food exports to the EU and 84% of EU exports to Hungary became free of import duties before accession.
During the period 1998-2003, the producer support estimate (PSE) almost doubled from a 15% average in 1991-1997 to 33% and 28% respectively in 2002 and 2003 (Figure 1). The downward trend of the PSE during the period 1998-2001 conceals considerable fluctuation in market price support (MPS). In the years before accession, the share of MPS declined as area based and headage payments were increased. Overall support to agriculture increased from HUF 99 billion in 1998 to HUF 235 billion (EUR 0.94 billion) in 2003.
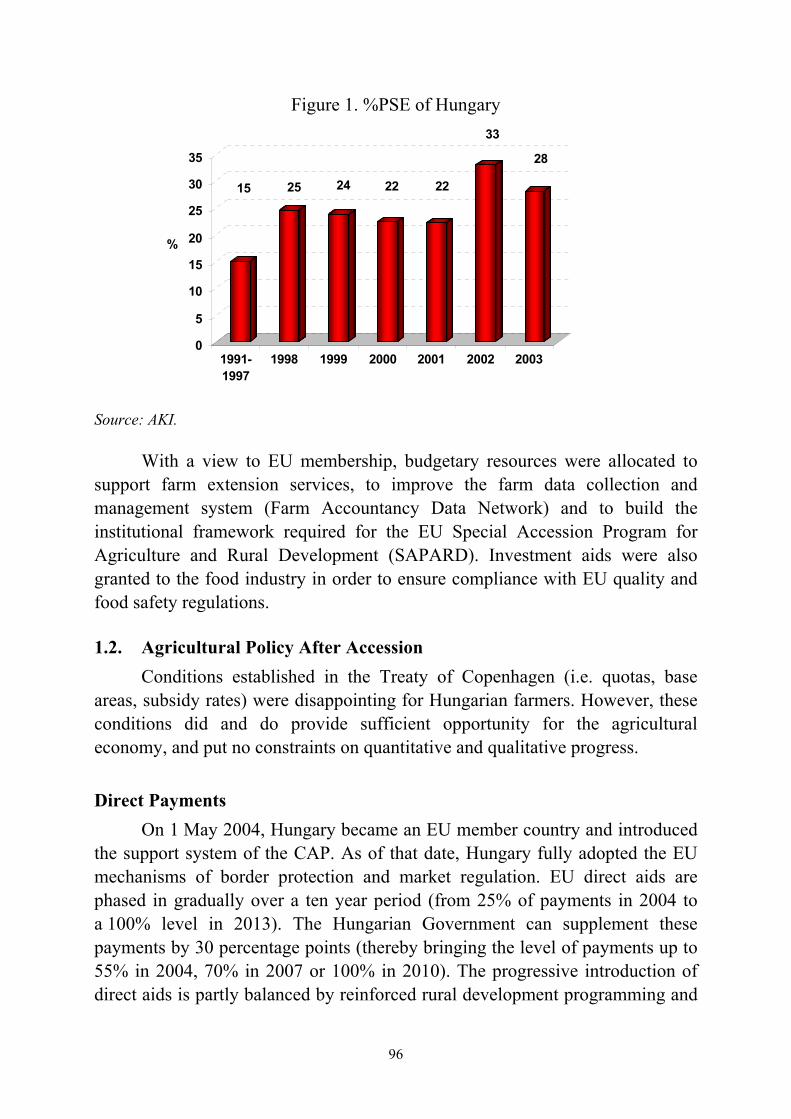
96
Figure 1. %PSE of Hungary
Source: AKI.
With a view to EU membership, budgetary resources were allocated to
support farm extension services, to improve the farm data collection and management system (Farm Accountancy Data Network) and to build the institutional framework required for the EU Special Accession Program for Agriculture and Rural Development (SAPARD). Investment aids were also granted to the food industry in order to ensure compliance with EU quality and food safety regulations.
1.2. Agricultural Policy After Accession
Conditions established in the Treaty of Copenhagen (i.e. quotas, base areas, subsidy rates) were disappointing for Hungarian farmers. However, these conditions did and do provide sufficient opportunity for the agricultural economy, and put no constraints on quantitative and qualitative progress.
Direct Payments
On 1 May 2004, Hungary became an EU member country and introduced the support system of the CAP. As of that date, Hungary fully adopted the EU mechanisms of border protection and market regulation. EU direct aids are phased in gradually over a ten year period (from 25% of payments in 2004 to a 100% level in 2013). The Hungarian Government can supplement these payments by 30 percentage points (thereby bringing the level of payments up to 55% in 2004, 70% in 2007 or 100% in 2010). The progressive introduction of direct aids is partly balanced by reinforced rural development programming and
15 25 24 22 22
33
28
0
5
10
15
20
25
30
35
%
1991-1997
1998 1999 2000 2001 2002 2003
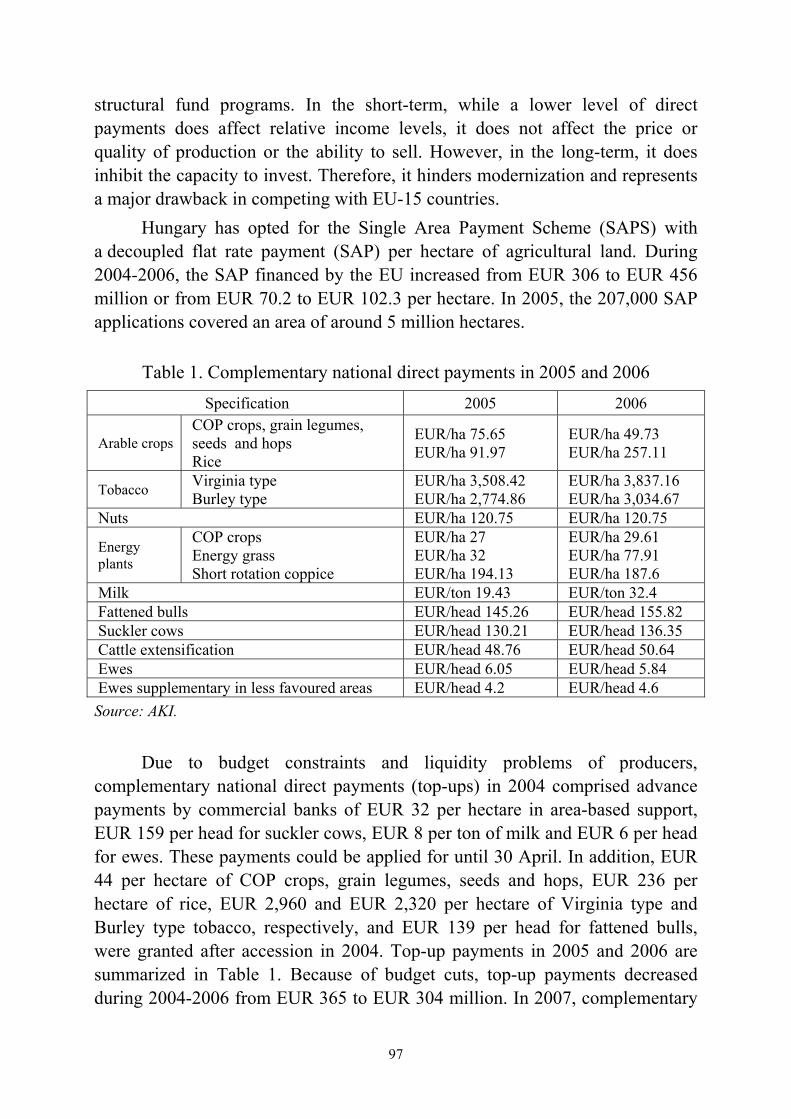
97
structural fund programs. In the short-term, while a lower level of direct payments does affect relative income levels, it does not affect the price or quality of production or the ability to sell. However, in the long-term, it does inhibit the capacity to invest. Therefore, it hinders modernization and represents a major drawback in competing with EU-15 countries.
Hungary has opted for the Single Area Payment Scheme (SAPS) with a decoupled flat rate payment (SAP) per hectare of agricultural land. During 2004-2006, the SAP financed by the EU increased from EUR 306 to EUR 456 million or from EUR 70.2 to EUR 102.3 per hectare. In 2005, the 207,000 SAP applications covered an area of around 5 million hectares.
Table 1. Complementary national direct payments in 2005 and 2006 Specification 2005 2006
Arable crops COP crops, grain legumes, seeds and hops Rice
EUR/ha 75.65 EUR/ha 91.97
EUR/ha 49.73 EUR/ha 257.11
Tobacco Virginia type Burley type
EUR/ha 3,508.42 EUR/ha 2,774.86
EUR/ha 3,837.16 EUR/ha 3,034.67
Nuts EUR/ha 120.75 EUR/ha 120.75
Energy plants
COP crops Energy grass Short rotation coppice
EUR/ha 27 EUR/ha 32 EUR/ha 194.13
EUR/ha 29.61 EUR/ha 77.91 EUR/ha 187.6
Milk EUR/ton 19.43 EUR/ton 32.4 Fattened bulls EUR/head 145.26 EUR/head 155.82 Suckler cows EUR/head 130.21 EUR/head 136.35 Cattle extensification EUR/head 48.76 EUR/head 50.64 Ewes EUR/head 6.05 EUR/head 5.84 Ewes supplementary in less favoured areas EUR/head 4.2 EUR/head 4.6 Source: AKI.
Due to budget constraints and liquidity problems of producers, complementary national direct payments (top-ups) in 2004 comprised advance payments by commercial banks of EUR 32 per hectare in area-based support, EUR 159 per head for suckler cows, EUR 8 per ton of milk and EUR 6 per head for ewes. These payments could be applied for until 30 April. In addition, EUR 44 per hectare of COP crops, grain legumes, seeds and hops, EUR 236 per hectare of rice, EUR 2,960 and EUR 2,320 per hectare of Virginia type and Burley type tobacco, respectively, and EUR 139 per head for fattened bulls, were granted after accession in 2004. Top-up payments in 2005 and 2006 are summarized in Table 1. Because of budget cuts, top-up payments decreased during 2004-2006 from EUR 365 to EUR 304 million. In 2007, complementary

98
national direct payments should be partly or fully decoupled from production, according to Council Regulation (EC) No 1782/2003.
Hungary plans to introduce the Single Payment Scheme in 2009. EU direct support to the country will increase to EUR 1.31 billion or 3.15% of the EU-25 total direct support by 2013.
Rural Development During 2004-2006, other payments to agriculture were provided through
programs elaborated within the framework of the EU Rural Development Regulation and financed both by the EU and national budget. Prior to accession, SAPARD provided funds for four broad groups of measures: investments in agricultural holdings; improvement of the processing and marketing of agricultural and fishery products; development and improvement of rural infrastructure; and diversification of activity in rural areas. After accession, implementation of the Agriculture and Rural Development Operational Program (ARDOP) and the National Rural Development Plan (NRDP) for the EAGGF Guarantee Section Measures started, both covering the period 2004-2006. However, due to the late approval of these programs by the European Commission, there were no payments in 2004, which have also contributed to the decline of the livestock sectors. The NRDP was worth EUR 754 million for the period 2004-2006, of which 20% or EUR 152 million was financed by the national budget (Table 2). This was spent out of the EAGGF Guarantee Fund on rural development priorities, i.e. different agri-environmental schemes, as well as to help less-favoured areas (LFA) or to finance early retirement, etc. In 2006, HUF 61 billion (EUR 244 million) was paid from the NRDP budget. A total of EUR 423 million was made available through ARDOP over the period 2004- -2006, with 25% financed by the national budget (Table 3). During 2004-2006, the Agriculture and Rural Development Agency (ARDA) received over 11,000 applications for ARDOP support, of which almost 40% were approved. Over 60% of the approved applications were submitted for investment aids. Until March 2007, about HUF 77 billion (EUR 308 million) has been paid from the ARDOP budget.
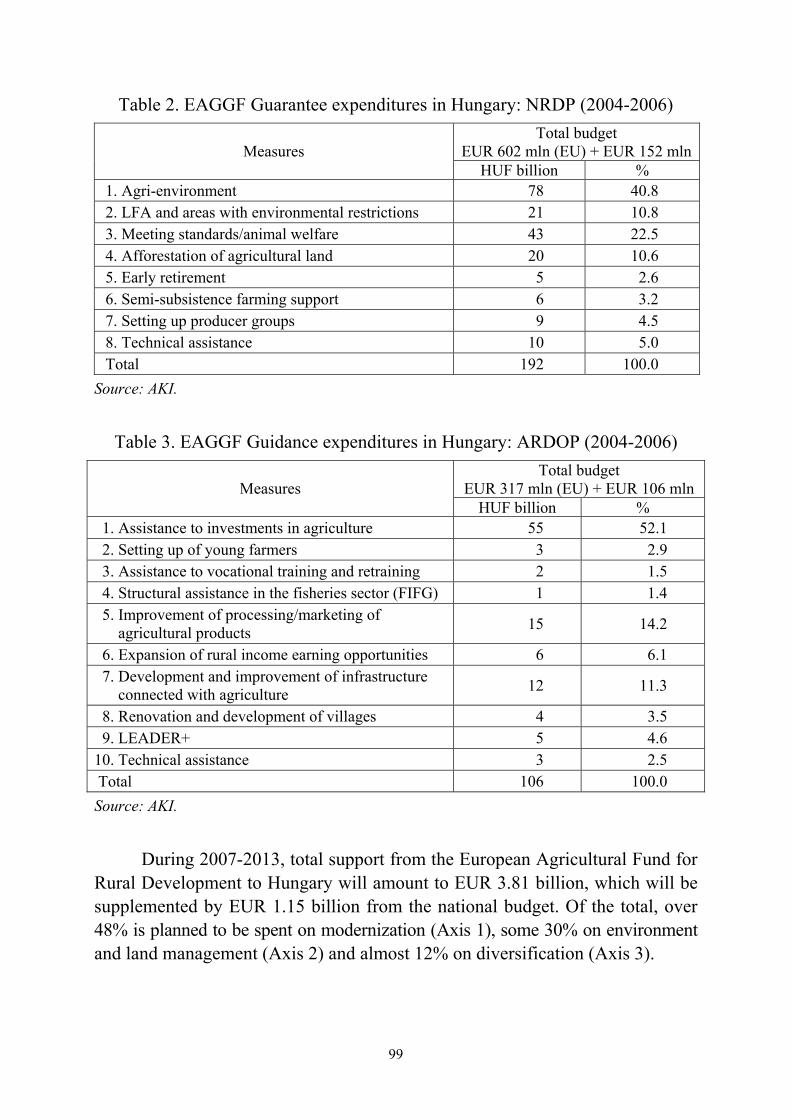
99
Table 2. EAGGF Guarantee expenditures in Hungary: NRDP (2004-2006) Total budget
EUR 602 mln (EU) + EUR 152 mlnMeasures HUF billion %
1. Agri-environment 78 40.8 2. LFA and areas with environmental restrictions 21 10.8 3. Meeting standards/animal welfare 43 22.5 4. Afforestation of agricultural land 20 10.6 5. Early retirement 5 2.6 6. Semi-subsistence farming support 6 3.2 7. Setting up producer groups 9 4.5 8. Technical assistance 10 5.0 Total 192 100.0
Source: AKI.
Table 3. EAGGF Guidance expenditures in Hungary: ARDOP (2004-2006) Total budget
EUR 317 mln (EU) + EUR 106 mln Measures HUF billion %
1. Assistance to investments in agriculture 55 52.1 2. Setting up of young farmers 3 2.9 3. Assistance to vocational training and retraining 2 1.5 4. Structural assistance in the fisheries sector (FIFG) 1 1.4 5. Improvement of processing/marketing of
agricultural products 15 14.2
6. Expansion of rural income earning opportunities 6 6.1 7. Development and improvement of infrastructure
connected with agriculture 12 11.3
8. Renovation and development of villages 4 3.5 9. LEADER+ 5 4.6 10. Technical assistance 3 2.5 Total 106 100.0 Source: AKI.
During 2007-2013, total support from the European Agricultural Fund for Rural Development to Hungary will amount to EUR 3.81 billion, which will be supplemented by EUR 1.15 billion from the national budget. Of the total, over 48% is planned to be spent on modernization (Axis 1), some 30% on environment and land management (Axis 2) and almost 12% on diversification (Axis 3).
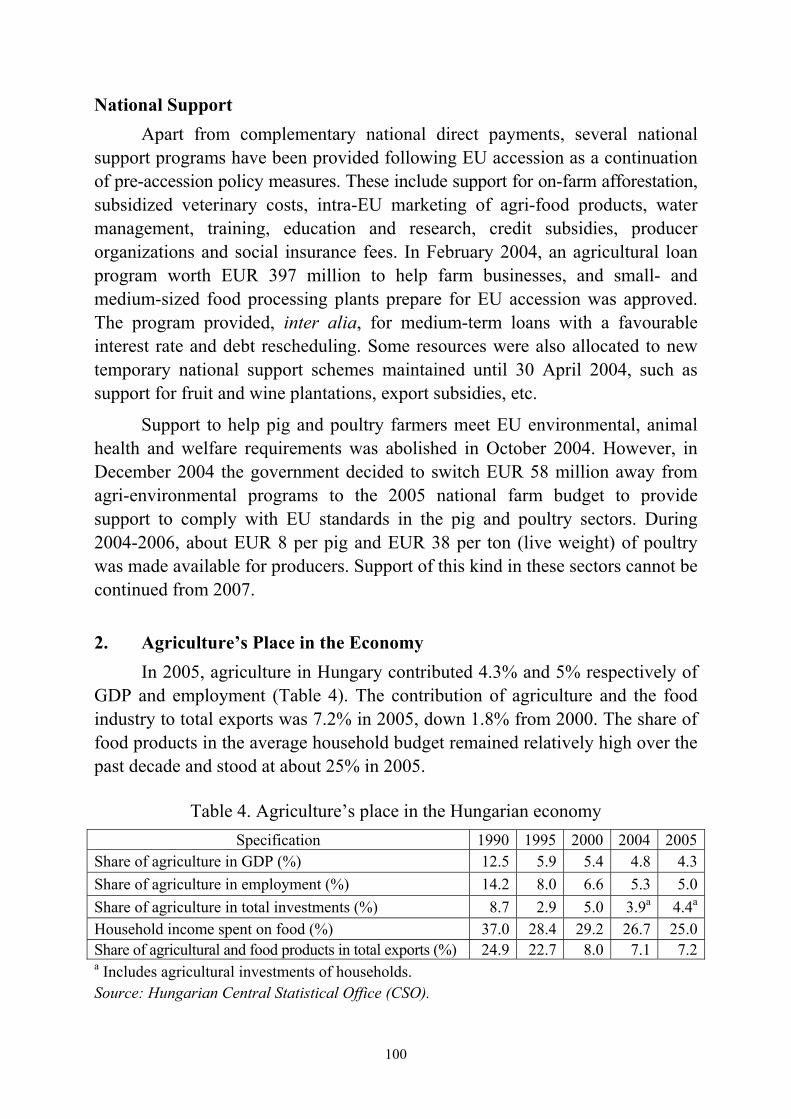
100
National Support Apart from complementary national direct payments, several national
support programs have been provided following EU accession as a continuation of pre-accession policy measures. These include support for on-farm afforestation, subsidized veterinary costs, intra-EU marketing of agri-food products, water management, training, education and research, credit subsidies, producer organizations and social insurance fees. In February 2004, an agricultural loan program worth EUR 397 million to help farm businesses, and small- and medium-sized food processing plants prepare for EU accession was approved. The program provided, inter alia, for medium-term loans with a favourable interest rate and debt rescheduling. Some resources were also allocated to new temporary national support schemes maintained until 30 April 2004, such as support for fruit and wine plantations, export subsidies, etc.
Support to help pig and poultry farmers meet EU environmental, animal health and welfare requirements was abolished in October 2004. However, in December 2004 the government decided to switch EUR 58 million away from agri-environmental programs to the 2005 national farm budget to provide support to comply with EU standards in the pig and poultry sectors. During 2004-2006, about EUR 8 per pig and EUR 38 per ton (live weight) of poultry was made available for producers. Support of this kind in these sectors cannot be continued from 2007.
2. Agriculture’s Place in the Economy
In 2005, agriculture in Hungary contributed 4.3% and 5% respectively of GDP and employment (Table 4). The contribution of agriculture and the food industry to total exports was 7.2% in 2005, down 1.8% from 2000. The share of food products in the average household budget remained relatively high over the past decade and stood at about 25% in 2005.
Table 4. Agriculture’s place in the Hungarian economy
Specification 1990 1995 2000 2004 2005Share of agriculture in GDP (%) 12.5 5.9 5.4 4.8 4.3Share of agriculture in employment (%) 14.2 8.0 6.6 5.3 5.0Share of agriculture in total investments (%) 8.7 2.9 5.0 3.9a 4.4a
Household income spent on food (%) 37.0 28.4 29.2 26.7 25.0Share of agricultural and food products in total exports (%) 24.9 22.7 8.0 7.1 7.2a Includes agricultural investments of households. Source: Hungarian Central Statistical Office (CSO).
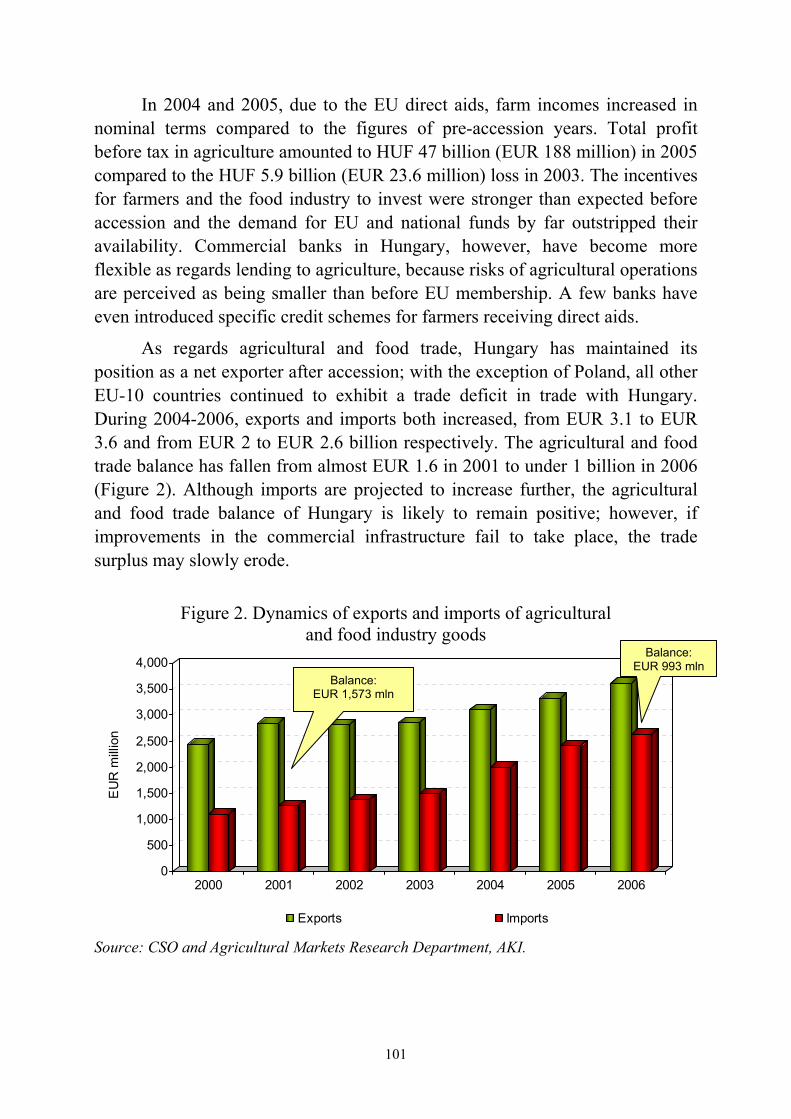
101
In 2004 and 2005, due to the EU direct aids, farm incomes increased in nominal terms compared to the figures of pre-accession years. Total profit before tax in agriculture amounted to HUF 47 billion (EUR 188 million) in 2005 compared to the HUF 5.9 billion (EUR 23.6 million) loss in 2003. The incentives for farmers and the food industry to invest were stronger than expected before accession and the demand for EU and national funds by far outstripped their availability. Commercial banks in Hungary, however, have become more flexible as regards lending to agriculture, because risks of agricultural operations are perceived as being smaller than before EU membership. A few banks have even introduced specific credit schemes for farmers receiving direct aids.
As regards agricultural and food trade, Hungary has maintained its position as a net exporter after accession; with the exception of Poland, all other EU-10 countries continued to exhibit a trade deficit in trade with Hungary. During 2004-2006, exports and imports both increased, from EUR 3.1 to EUR 3.6 and from EUR 2 to EUR 2.6 billion respectively. The agricultural and food trade balance has fallen from almost EUR 1.6 in 2001 to under 1 billion in 2006 (Figure 2). Although imports are projected to increase further, the agricultural and food trade balance of Hungary is likely to remain positive; however, if improvements in the commercial infrastructure fail to take place, the trade surplus may slowly erode.
Figure 2. Dynamics of exports and imports of agricultural
and food industry goods
Source: CSO and Agricultural Markets Research Department, AKI.
0
500
1,000
1,500
2,000
2,500
3,000
3,500
4,000
EU
R m
illio
n
2000 2001 2002 2003 2004 2005 2006
Exports Imports
Balance: EUR 993 mln
Balance: EUR 1,573 mln
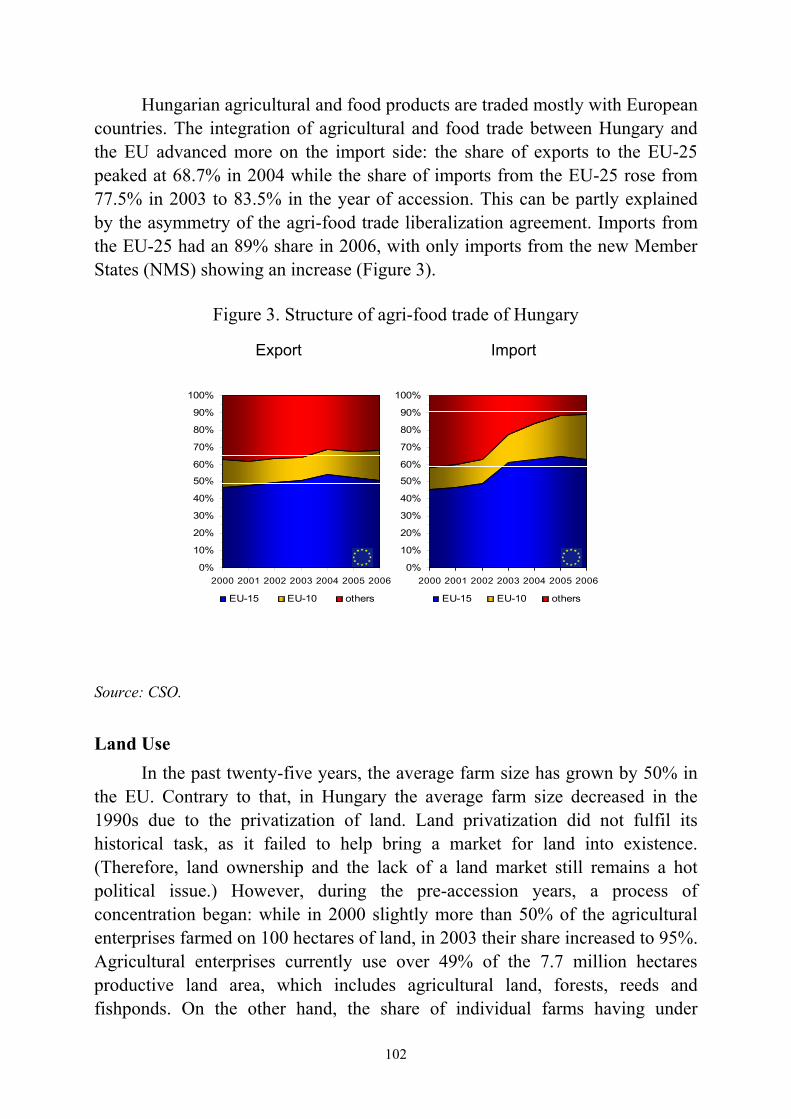
102
Hungarian agricultural and food products are traded mostly with European countries. The integration of agricultural and food trade between Hungary and the EU advanced more on the import side: the share of exports to the EU-25 peaked at 68.7% in 2004 while the share of imports from the EU-25 rose from 77.5% in 2003 to 83.5% in the year of accession. This can be partly explained by the asymmetry of the agri-food trade liberalization agreement. Imports from the EU-25 had an 89% share in 2006, with only imports from the new Member States (NMS) showing an increase (Figure 3).
Figure 3. Structure of agri-food trade of Hungary
Export Import
Share of exports (2000-2006) Share of imports (2000-2006)
0%
10%
20%
30%
40%
50%
60%
70%
80%
90%
100%
2000 2001 2002 2003 2004 2005 2006
EU-15 EU-10 others
0%
10%
20%
30%
40%
50%
60%
70%
80%
90%
100%
2000 2001 2002 2003 2004 2005 2006
EU-15 EU-10 others
Source: CSO.
Land Use In the past twenty-five years, the average farm size has grown by 50% in
the EU. Contrary to that, in Hungary the average farm size decreased in the 1990s due to the privatization of land. Land privatization did not fulfil its historical task, as it failed to help bring a market for land into existence. (Therefore, land ownership and the lack of a land market still remains a hot political issue.) However, during the pre-accession years, a process of concentration began: while in 2000 slightly more than 50% of the agricultural enterprises farmed on 100 hectares of land, in 2003 their share increased to 95%. Agricultural enterprises currently use over 49% of the 7.7 million hectares productive land area, which includes agricultural land, forests, reeds and fishponds. On the other hand, the share of individual farms having under
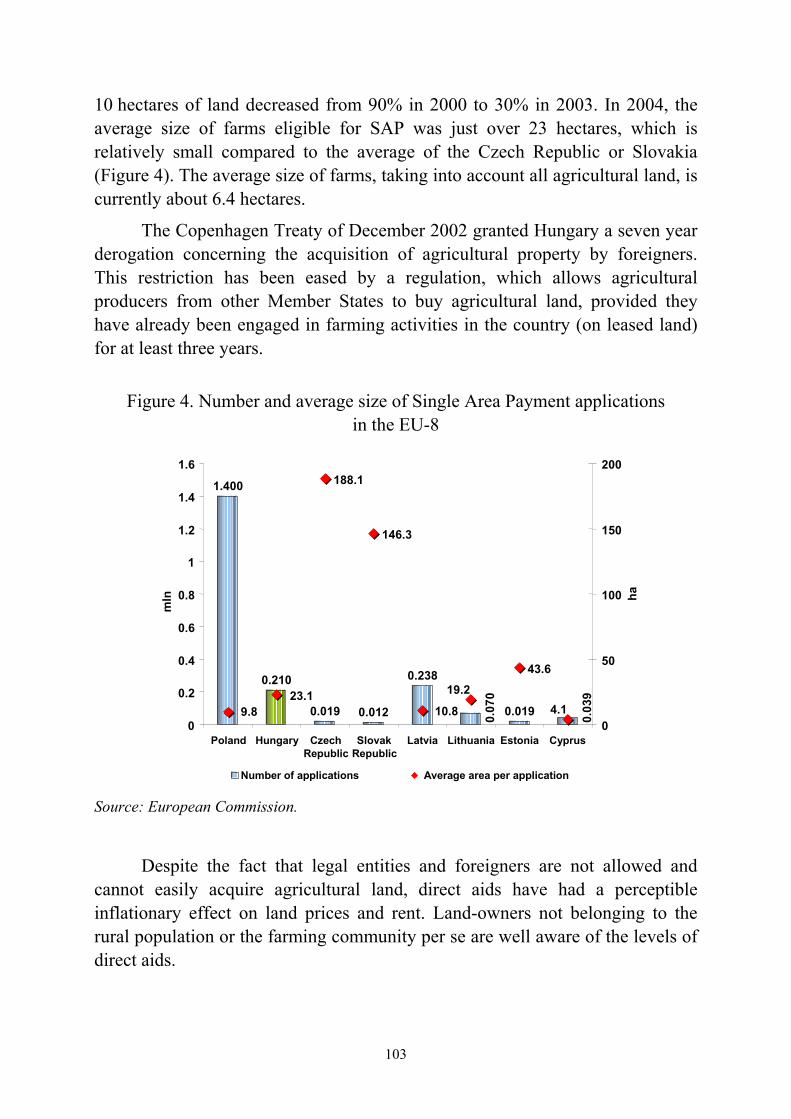
103
10 hectares of land decreased from 90% in 2000 to 30% in 2003. In 2004, the average size of farms eligible for SAP was just over 23 hectares, which is relatively small compared to the average of the Czech Republic or Slovakia (Figure 4). The average size of farms, taking into account all agricultural land, is currently about 6.4 hectares.
The Copenhagen Treaty of December 2002 granted Hungary a seven year derogation concerning the acquisition of agricultural property by foreigners. This restriction has been eased by a regulation, which allows agricultural producers from other Member States to buy agricultural land, provided they have already been engaged in farming activities in the country (on leased land) for at least three years.
Figure 4. Number and average size of Single Area Payment applications
in the EU-8
Source: European Commission.
Despite the fact that legal entities and foreigners are not allowed and cannot easily acquire agricultural land, direct aids have had a perceptible inflationary effect on land prices and rent. Land-owners not belonging to the rural population or the farming community per se are well aware of the levels of direct aids.
1.400
0.210
0.019 0.012
0.238
0.019 0.03
9
0.07
0 188.1
146.3
43.6
19.2
10.823.1
9.8 4.1 0
0.2
0.4
0.6
0.8
1
1.2
1.4
1.6
Poland Hungary CzechRepublic
SlovakRepublic
Latvia Lithuania Estonia Cyprus
mln
0
50
100
150
200
ha
Number of applications Average area per application
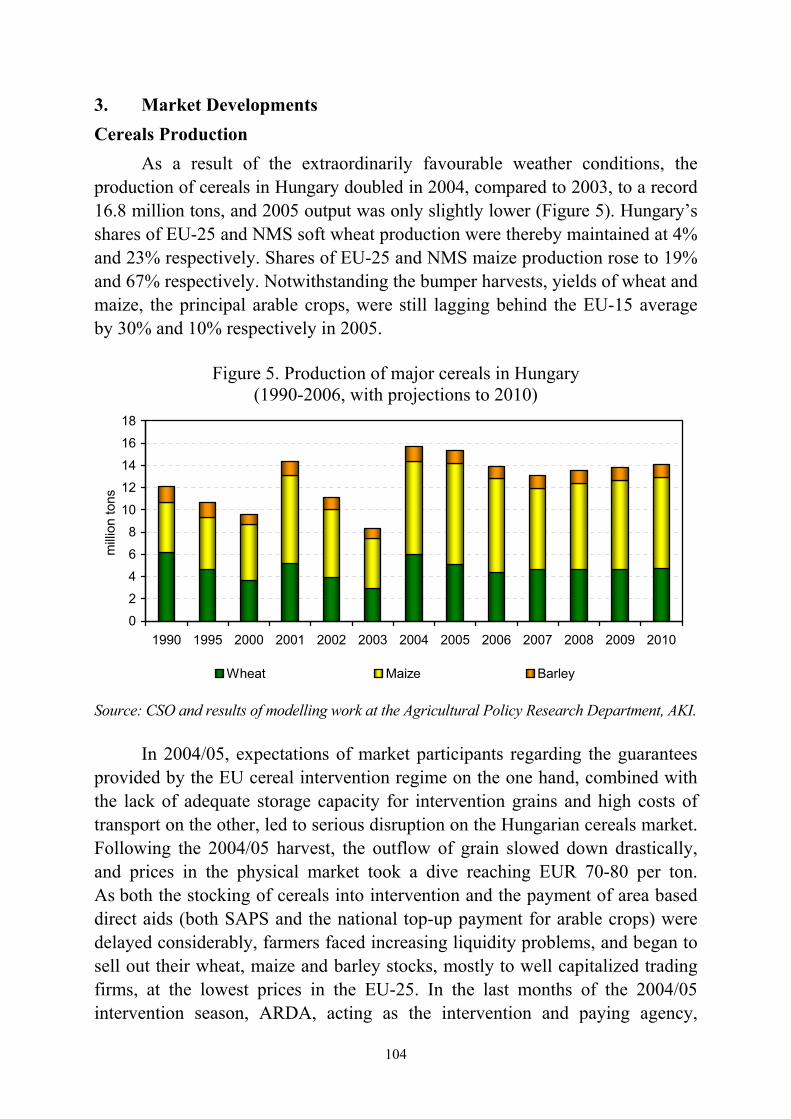
104
3. Market Developments Cereals Production
As a result of the extraordinarily favourable weather conditions, the production of cereals in Hungary doubled in 2004, compared to 2003, to a record 16.8 million tons, and 2005 output was only slightly lower (Figure 5). Hungary’s shares of EU-25 and NMS soft wheat production were thereby maintained at 4% and 23% respectively. Shares of EU-25 and NMS maize production rose to 19% and 67% respectively. Notwithstanding the bumper harvests, yields of wheat and maize, the principal arable crops, were still lagging behind the EU-15 average by 30% and 10% respectively in 2005.
Figure 5. Production of major cereals in Hungary (1990-2006, with projections to 2010)
0
2
4
6
8
10
12
14
16
18
1990 1995 2000 2001 2002 2003 2004 2005 2006 2007 2008 2009 2010
milli
on to
ns
Wheat Maize Barley
Source: CSO and results of modelling work at the Agricultural Policy Research Department, AKI.
In 2004/05, expectations of market participants regarding the guarantees provided by the EU cereal intervention regime on the one hand, combined with the lack of adequate storage capacity for intervention grains and high costs of transport on the other, led to serious disruption on the Hungarian cereals market. Following the 2004/05 harvest, the outflow of grain slowed down drastically, and prices in the physical market took a dive reaching EUR 70-80 per ton. As both the stocking of cereals into intervention and the payment of area based direct aids (both SAPS and the national top-up payment for arable crops) were delayed considerably, farmers faced increasing liquidity problems, and began to sell out their wheat, maize and barley stocks, mostly to well capitalized trading firms, at the lowest prices in the EU-25. In the last months of the 2004/05 intervention season, ARDA, acting as the intervention and paying agency,
105
bought 3.9 million tons of cereals into intervention, 21% of that from only four market players.
Market participants with insufficient storage capacity began to invest in the building of new stores in order to bridge the gap between harvest time and the beginning of the intervention season, and thereby to fully benefit from the CAP. To speed up this process, rural development funds were made available. By August 2005, contracts for the building of 2.4 million tons of storage capacity were concluded with the ARDA, and by the end of 2006, a total of 4.1 million tons of new storage capacity became available for the storing of intervention grain. Unfortunately, these investments were not fitted into an overall infrastructure development strategy, and therefore the whole program might prove economically unsuccessful in the longer term.
In the 2005/06 intervention season, 4.2 million tons of cereals were taken into intervention. Intervention opening stocks at the beginning of the 2006/07 crop year totalled 6.98 million tons. Of that 3.33 million tons were sold until mid-April 2007. In the first five months of the 2006/07 intervention season, only 1,500 tons of cereals were taken into intervention. The disappearance of intervention stocks became a rapid process. If this would continue at the pace observed in the last months of 2006 and in the first months of 2007, intervention stocks could fall bellow 1 million tons by the beginning of the 2007/08 intervention season.
Undoubtedly, Hungary will remain the largest potential exporter of wheat in the NMS: production of wheat is expected to stabilize between 4.5 and 5 million tons, while domestic consumption is unlikely to exceed 2.5-3 million tons. Demand from the milling industry will stay at around 1.3-1.5 million tons of high quality wheat, while the expansion of feed wheat use may be largely constrained by the excess of by-products from the emerging bioethanol industry. The area sown with winter wheat in 2005 and 2006 exceeded 1.1 million hectares, showing virtually no change over 2004 or any of the pre-accession years. It should be noted that even after almost two decades of the political and economic transition, Hungarian wheat exports provide only an outlet for internal surpluses; this is not a vertically well-organized trade satisfying the specific needs of external markets.
With around 3.5-4 million tons a year used for feed, Hungary is the largest consumer of maize in the NMS. After the bumper harvest of 8.3 million tons in 2004, maize production reached an all-time record of 9 million tons in 2005. Total domestic consumption of maize dropped back to 4.1 million tons by 2004, and demand for feed maize is expected to remain well below 4 million tons in
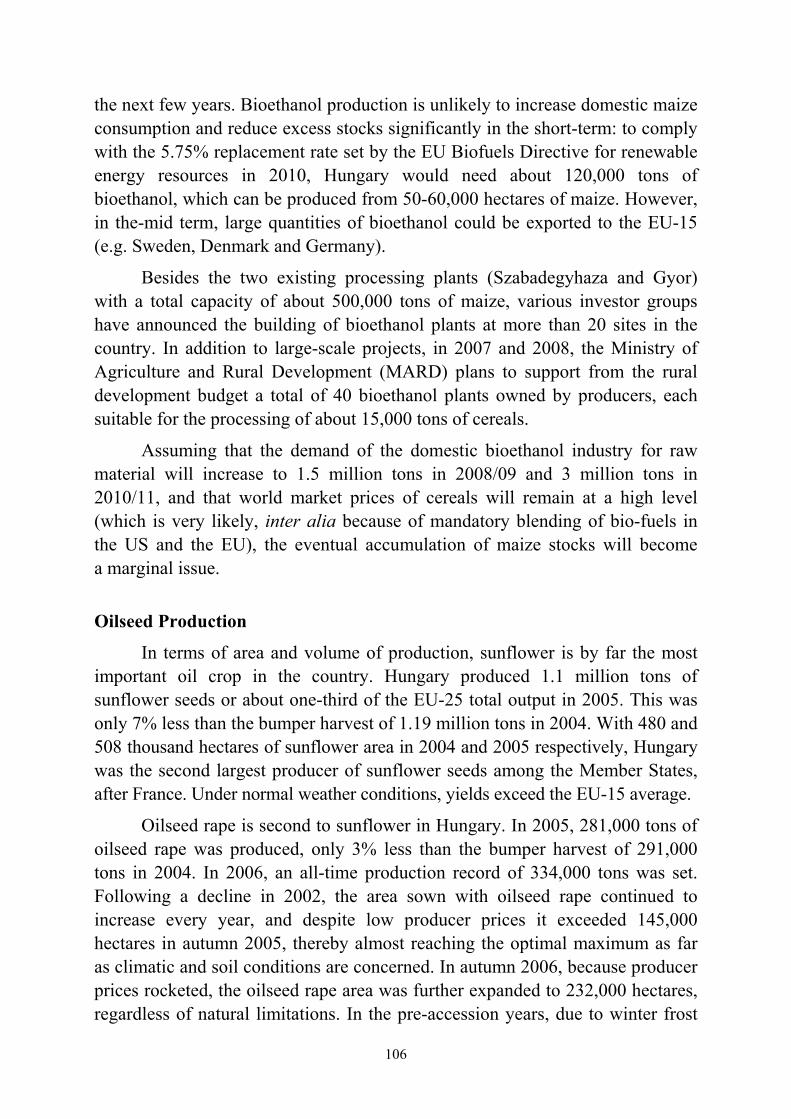
106
the next few years. Bioethanol production is unlikely to increase domestic maize consumption and reduce excess stocks significantly in the short-term: to comply with the 5.75% replacement rate set by the EU Biofuels Directive for renewable energy resources in 2010, Hungary would need about 120,000 tons of bioethanol, which can be produced from 50-60,000 hectares of maize. However, in the-mid term, large quantities of bioethanol could be exported to the EU-15 (e.g. Sweden, Denmark and Germany).
Besides the two existing processing plants (Szabadegyhaza and Gyor) with a total capacity of about 500,000 tons of maize, various investor groups have announced the building of bioethanol plants at more than 20 sites in the country. In addition to large-scale projects, in 2007 and 2008, the Ministry of Agriculture and Rural Development (MARD) plans to support from the rural development budget a total of 40 bioethanol plants owned by producers, each suitable for the processing of about 15,000 tons of cereals.
Assuming that the demand of the domestic bioethanol industry for raw material will increase to 1.5 million tons in 2008/09 and 3 million tons in 2010/11, and that world market prices of cereals will remain at a high level (which is very likely, inter alia because of mandatory blending of bio-fuels in the US and the EU), the eventual accumulation of maize stocks will become a marginal issue.
Oilseed Production
In terms of area and volume of production, sunflower is by far the most important oil crop in the country. Hungary produced 1.1 million tons of sunflower seeds or about one-third of the EU-25 total output in 2005. This was only 7% less than the bumper harvest of 1.19 million tons in 2004. With 480 and 508 thousand hectares of sunflower area in 2004 and 2005 respectively, Hungary was the second largest producer of sunflower seeds among the Member States, after France. Under normal weather conditions, yields exceed the EU-15 average.
Oilseed rape is second to sunflower in Hungary. In 2005, 281,000 tons of oilseed rape was produced, only 3% less than the bumper harvest of 291,000 tons in 2004. In 2006, an all-time production record of 334,000 tons was set. Following a decline in 2002, the area sown with oilseed rape continued to increase every year, and despite low producer prices it exceeded 145,000 hectares in autumn 2005, thereby almost reaching the optimal maximum as far as climatic and soil conditions are concerned. In autumn 2006, because producer prices rocketed, the oilseed rape area was further expanded to 232,000 hectares, regardless of natural limitations. In the pre-accession years, due to winter frost
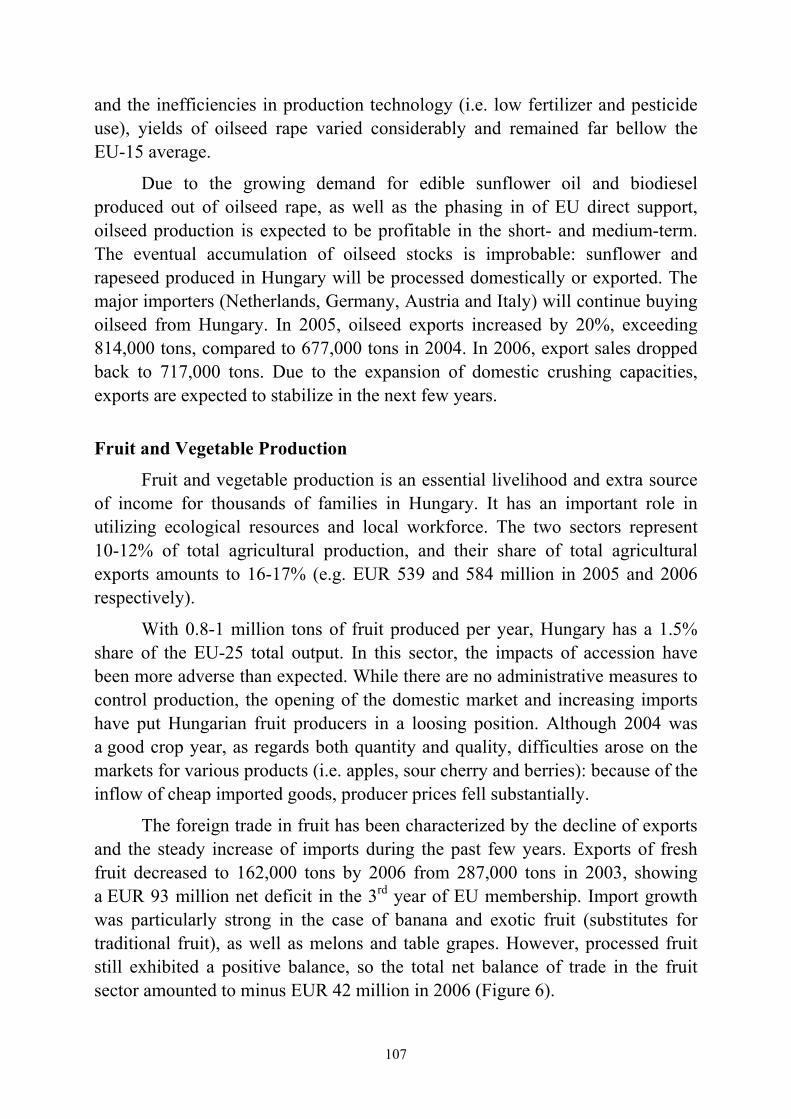
107
and the inefficiencies in production technology (i.e. low fertilizer and pesticide use), yields of oilseed rape varied considerably and remained far bellow the EU-15 average.
Due to the growing demand for edible sunflower oil and biodiesel produced out of oilseed rape, as well as the phasing in of EU direct support, oilseed production is expected to be profitable in the short- and medium-term. The eventual accumulation of oilseed stocks is improbable: sunflower and rapeseed produced in Hungary will be processed domestically or exported. The major importers (Netherlands, Germany, Austria and Italy) will continue buying oilseed from Hungary. In 2005, oilseed exports increased by 20%, exceeding 814,000 tons, compared to 677,000 tons in 2004. In 2006, export sales dropped back to 717,000 tons. Due to the expansion of domestic crushing capacities, exports are expected to stabilize in the next few years.
Fruit and Vegetable Production
Fruit and vegetable production is an essential livelihood and extra source of income for thousands of families in Hungary. It has an important role in utilizing ecological resources and local workforce. The two sectors represent 10-12% of total agricultural production, and their share of total agricultural exports amounts to 16-17% (e.g. EUR 539 and 584 million in 2005 and 2006 respectively).
With 0.8-1 million tons of fruit produced per year, Hungary has a 1.5% share of the EU-25 total output. In this sector, the impacts of accession have been more adverse than expected. While there are no administrative measures to control production, the opening of the domestic market and increasing imports have put Hungarian fruit producers in a loosing position. Although 2004 was a good crop year, as regards both quantity and quality, difficulties arose on the markets for various products (i.e. apples, sour cherry and berries): because of the inflow of cheap imported goods, producer prices fell substantially.
The foreign trade in fruit has been characterized by the decline of exports and the steady increase of imports during the past few years. Exports of fresh fruit decreased to 162,000 tons by 2006 from 287,000 tons in 2003, showing a EUR 93 million net deficit in the 3rd year of EU membership. Import growth was particularly strong in the case of banana and exotic fruit (substitutes for traditional fruit), as well as melons and table grapes. However, processed fruit still exhibited a positive balance, so the total net balance of trade in the fruit sector amounted to minus EUR 42 million in 2006 (Figure 6).
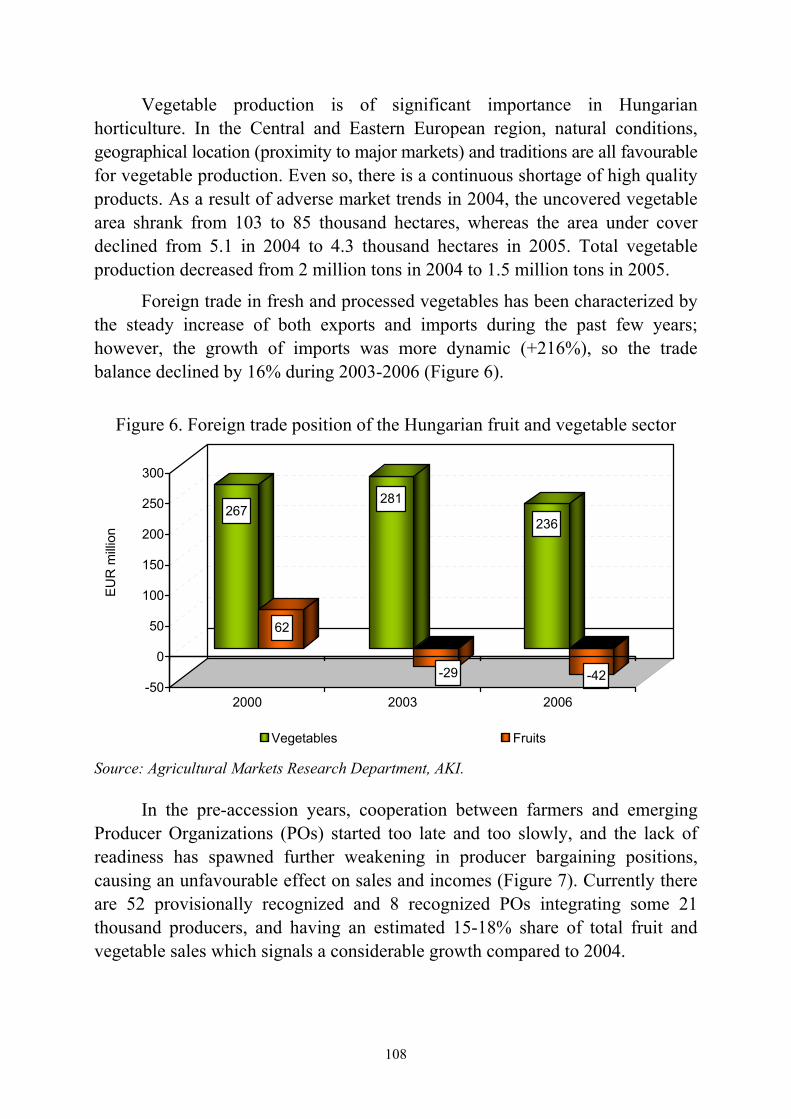
108
Vegetable production is of significant importance in Hungarian horticulture. In the Central and Eastern European region, natural conditions, geographical location (proximity to major markets) and traditions are all favourable for vegetable production. Even so, there is a continuous shortage of high quality products. As a result of adverse market trends in 2004, the uncovered vegetable area shrank from 103 to 85 thousand hectares, whereas the area under cover declined from 5.1 in 2004 to 4.3 thousand hectares in 2005. Total vegetable production decreased from 2 million tons in 2004 to 1.5 million tons in 2005.
Foreign trade in fresh and processed vegetables has been characterized by the steady increase of both exports and imports during the past few years; however, the growth of imports was more dynamic (+216%), so the trade balance declined by 16% during 2003-2006 (Figure 6).
Figure 6. Foreign trade position of the Hungarian fruit and vegetable sector
267
62
281
-29
236
-42-50
0
50
100
150
200
250
300
EUR
milli
on
2000 2003 2006
Vegetables Fruits
Source: Agricultural Markets Research Department, AKI. In the pre-accession years, cooperation between farmers and emerging
Producer Organizations (POs) started too late and too slowly, and the lack of readiness has spawned further weakening in producer bargaining positions, causing an unfavourable effect on sales and incomes (Figure 7). Currently there are 52 provisionally recognized and 8 recognized POs integrating some 21 thousand producers, and having an estimated 15-18% share of total fruit and vegetable sales which signals a considerable growth compared to 2004.
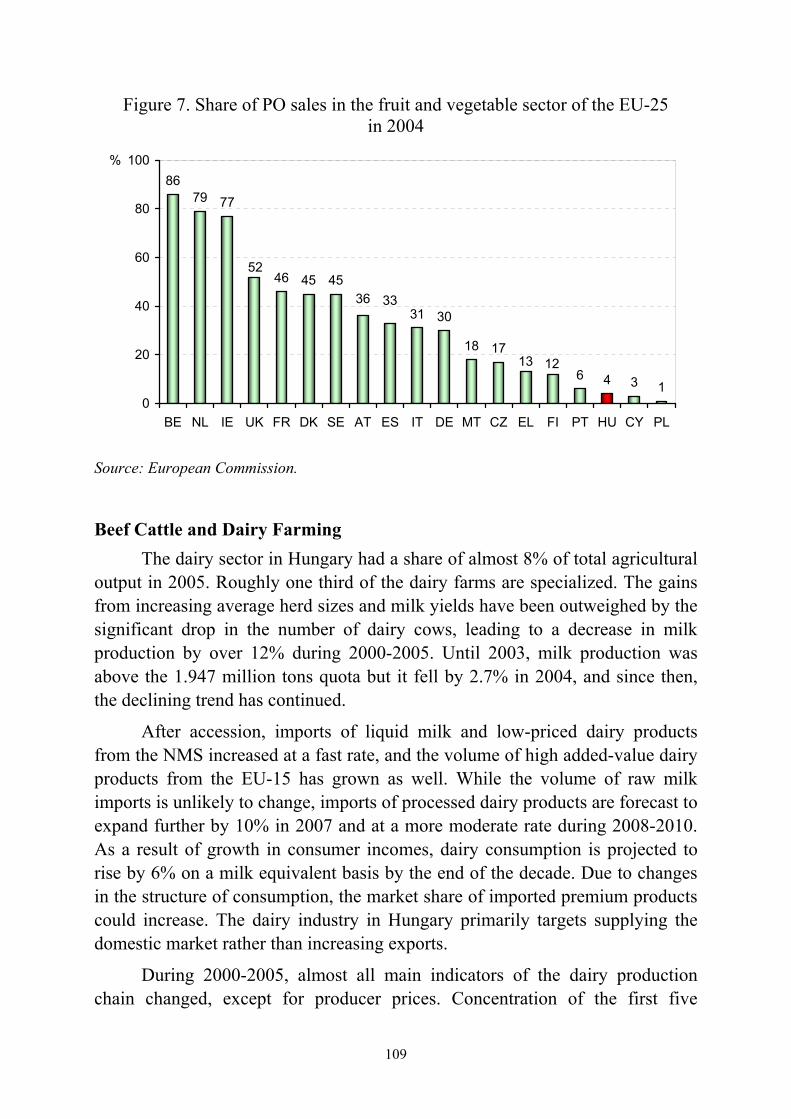
109
Figure 7. Share of PO sales in the fruit and vegetable sector of the EU-25 in 2004
8679 77
46 45 45
31 30
18 17
6 4 3 1
1213
3336
52
0
20
40
60
80
100
BE NL IE UK FR DK SE AT ES IT DE MT CZ EL FI PT HU CY PL
%
Source: European Commission.
Beef Cattle and Dairy Farming The dairy sector in Hungary had a share of almost 8% of total agricultural
output in 2005. Roughly one third of the dairy farms are specialized. The gains from increasing average herd sizes and milk yields have been outweighed by the significant drop in the number of dairy cows, leading to a decrease in milk production by over 12% during 2000-2005. Until 2003, milk production was above the 1.947 million tons quota but it fell by 2.7% in 2004, and since then, the declining trend has continued.
After accession, imports of liquid milk and low-priced dairy products from the NMS increased at a fast rate, and the volume of high added-value dairy products from the EU-15 has grown as well. While the volume of raw milk imports is unlikely to change, imports of processed dairy products are forecast to expand further by 10% in 2007 and at a more moderate rate during 2008-2010. As a result of growth in consumer incomes, dairy consumption is projected to rise by 6% on a milk equivalent basis by the end of the decade. Due to changes in the structure of consumption, the market share of imported premium products could increase. The dairy industry in Hungary primarily targets supplying the domestic market rather than increasing exports.
During 2000-2005, almost all main indicators of the dairy production chain changed, except for producer prices. Concentration of the first five

110
processing companies increased by 15% while the number of milk producers dropped by 52% and milk production declined by 12%. Imports of dairy products such as cheese and curd doubled, while total exports decreased by 34% (Figure 8). On the other hand, raw milk exports to Italy increased continuously thanks to high prices on the Italian market. Indeed, one of the positive effects of accession in the Hungarian dairy sector was the opportunity to deliver to the Italian market. As a result, exports of raw milk almost doubled yearly since 2004, reaching almost 230,000 tons in 2006.
Figure 8. Changes of the dairy production chain in Hungary (2005/2000)
188.0
-12.5-34.0
195.0
-11.6-51.9
14.5 0.4
-100
-50
0
50
100
150
200
250
Con
cent
ratio
nof
pro
cess
ing
(firs
t 5)
Num
ber o
fpr
oduc
ers
Prod
uctio
n of
raw
milk
Liqu
id m
ilkpr
oduc
tion
Prod
ucer
pric
es
Expo
rts o
fra
w m
ilk
Expo
rts o
fch
eese
and
curd
Impo
rts o
fch
eese
and
curd
%
Source: Calculations based on CSO and AKI data.
During 2000-2006, producer prices of milk in Hungary showed more
seasonal fluctuations than prices in the old Member States. Due to the strengthening of the national currency in the second half of 2002, prices in Hungary reached the German level, and since then, they have exhibited a seasonal peak very close to the actual price niveau in Germany every year (Figure 9).
The total number of cattle in Hungary is expected to remain at the same level in the next few years, which can be regarded as a positive change after experiencing continuous decline during the period between the start of economic transition and EU accession. This is primarily due to the EU and national direct subsidies, which are considerably higher compared to direct payments granted before accession, and as far as beef cattle is concerned, to the push-up effect of the EU institutional price on domestic producer prices.
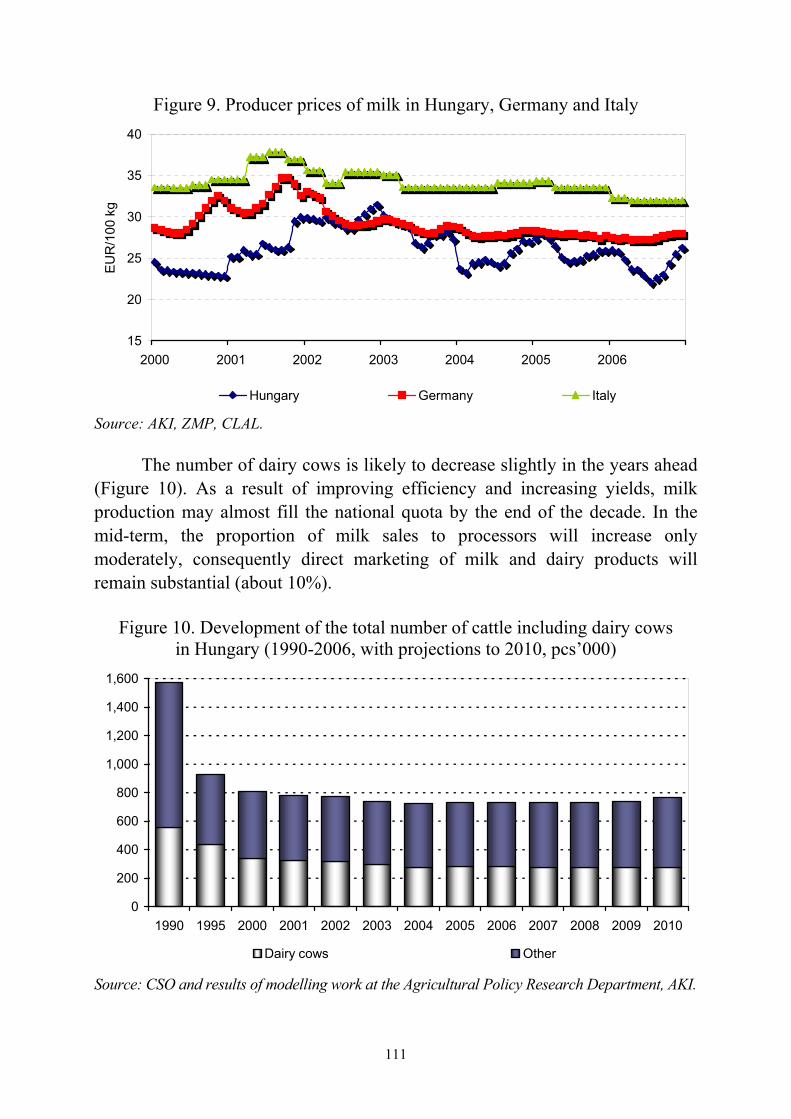
111
Figure 9. Producer prices of milk in Hungary, Germany and Italy
15
20
25
30
35
40
2000 2001 2002 2003 2004 2005 2006
EUR
/100
kg
Hungary Germany Italy
Source: AKI, ZMP, CLAL.
The number of dairy cows is likely to decrease slightly in the years ahead (Figure 10). As a result of improving efficiency and increasing yields, milk production may almost fill the national quota by the end of the decade. In the mid-term, the proportion of milk sales to processors will increase only moderately, consequently direct marketing of milk and dairy products will remain substantial (about 10%).
Figure 10. Development of the total number of cattle including dairy cows
in Hungary (1990-2006, with projections to 2010, pcs’000)
0
200
400
600
800
1,000
1,200
1,400
1,600
1990 1995 2000 2001 2002 2003 2004 2005 2006 2007 2008 2009 2010
Dairy cows Other
Source: CSO and results of modelling work at the Agricultural Policy Research Department, AKI.
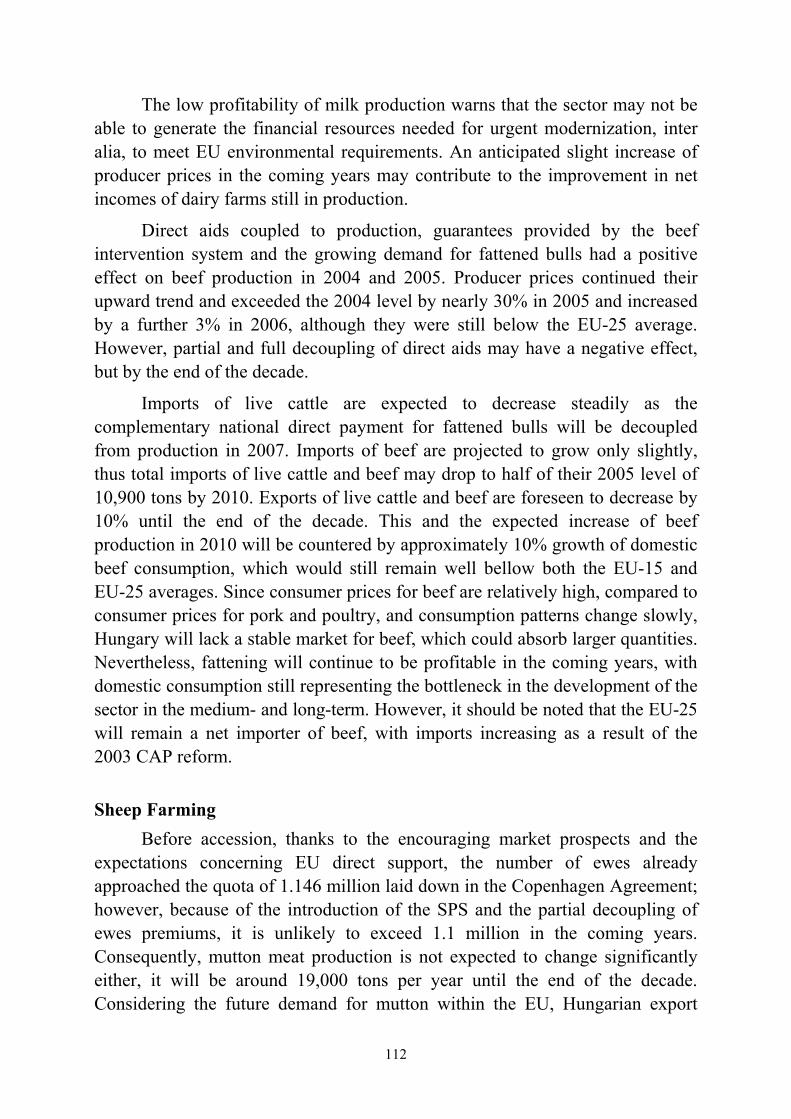
112
The low profitability of milk production warns that the sector may not be able to generate the financial resources needed for urgent modernization, inter alia, to meet EU environmental requirements. An anticipated slight increase of producer prices in the coming years may contribute to the improvement in net incomes of dairy farms still in production.
Direct aids coupled to production, guarantees provided by the beef intervention system and the growing demand for fattened bulls had a positive effect on beef production in 2004 and 2005. Producer prices continued their upward trend and exceeded the 2004 level by nearly 30% in 2005 and increased by a further 3% in 2006, although they were still below the EU-25 average. However, partial and full decoupling of direct aids may have a negative effect, but by the end of the decade.
Imports of live cattle are expected to decrease steadily as the complementary national direct payment for fattened bulls will be decoupled from production in 2007. Imports of beef are projected to grow only slightly, thus total imports of live cattle and beef may drop to half of their 2005 level of 10,900 tons by 2010. Exports of live cattle and beef are foreseen to decrease by 10% until the end of the decade. This and the expected increase of beef production in 2010 will be countered by approximately 10% growth of domestic beef consumption, which would still remain well bellow both the EU-15 and EU-25 averages. Since consumer prices for beef are relatively high, compared to consumer prices for pork and poultry, and consumption patterns change slowly, Hungary will lack a stable market for beef, which could absorb larger quantities. Nevertheless, fattening will continue to be profitable in the coming years, with domestic consumption still representing the bottleneck in the development of the sector in the medium- and long-term. However, it should be noted that the EU-25 will remain a net importer of beef, with imports increasing as a result of the 2003 CAP reform.
Sheep Farming
Before accession, thanks to the encouraging market prospects and the expectations concerning EU direct support, the number of ewes already approached the quota of 1.146 million laid down in the Copenhagen Agreement; however, because of the introduction of the SPS and the partial decoupling of ewes premiums, it is unlikely to exceed 1.1 million in the coming years. Consequently, mutton meat production is not expected to change significantly either, it will be around 19,000 tons per year until the end of the decade. Considering the future demand for mutton within the EU, Hungarian export
113
sales seem secured, even though the accession of Romania, Hungary’s major competitor in that respect, may cause disturbances from 2007.
About 90% of Hungarian mutton (overwhelmingly light-weight lambs) is sold live. While until 2004, Italy was Hungary’s major and almost exclusive market for sheep meat, a substantial quantity of mutton was sold to Greece in 2005 and 2006. No considerable change is expected in the medium-term as regards the exported product (light-weight live lambs), the volume of export sales (15-16,000 tons a year) and the major importer countries (Italy and perhaps Greece). This is partly due to the fact that sheep abattoirs in Hungary are owned by Italian companies, which, for the time being, are neither interested in changing the current product structure nor in looking for new markets.
In the medium-term, the level of support for sheep farmers without sufficient land area could decrease considerably. It should also be noted that since over half of the grasslands used by sheep farmers are not owned by them, the level of rents for land will remain a crucial factor in profitability.
Pork Production
In December 2005, the number of pigs in Hungary hardly exceeded 3.85 million (for comparison, that figure varied between 8 and 10 million in the second half of 1980s). The number of breeding sows was 277,000. In December 2006, the headage if swine increased slightly, but did not reach 4 million. In the first years of EU membership, the domestic supply from the Hungarian pigmeat industry became rather uncertain.
Contrary to the decline in livestock numbers, the value of exports of the sector did not decrease in 2004 and 2005; moreover, thanks to favourable prices, it reached its highest level since the turn of the century in 2005.
The main export market of Hungarian pork meat and processed products is the EU, with a 48% share in 2005. The major buyers are traditionally Spain, Germany and Italy. Of third countries, the now EU member Romania as well as Japan and South Korea should be mentioned. Hungary’s main export products are pricey meat parts, while imports tend to be cheap raw materials replacing higher quality domestic produce.
Prior to accession, imports were insignificant in the sector but in 2004, the number of imported live pigs shot up, while the volume of imported pig meat products tripled. In 2005, imports of live pigs doubled and imports of pork increased further by one third. Most of the imported live pigs came from Holland; however, in 2006, Poland became the major supplier.
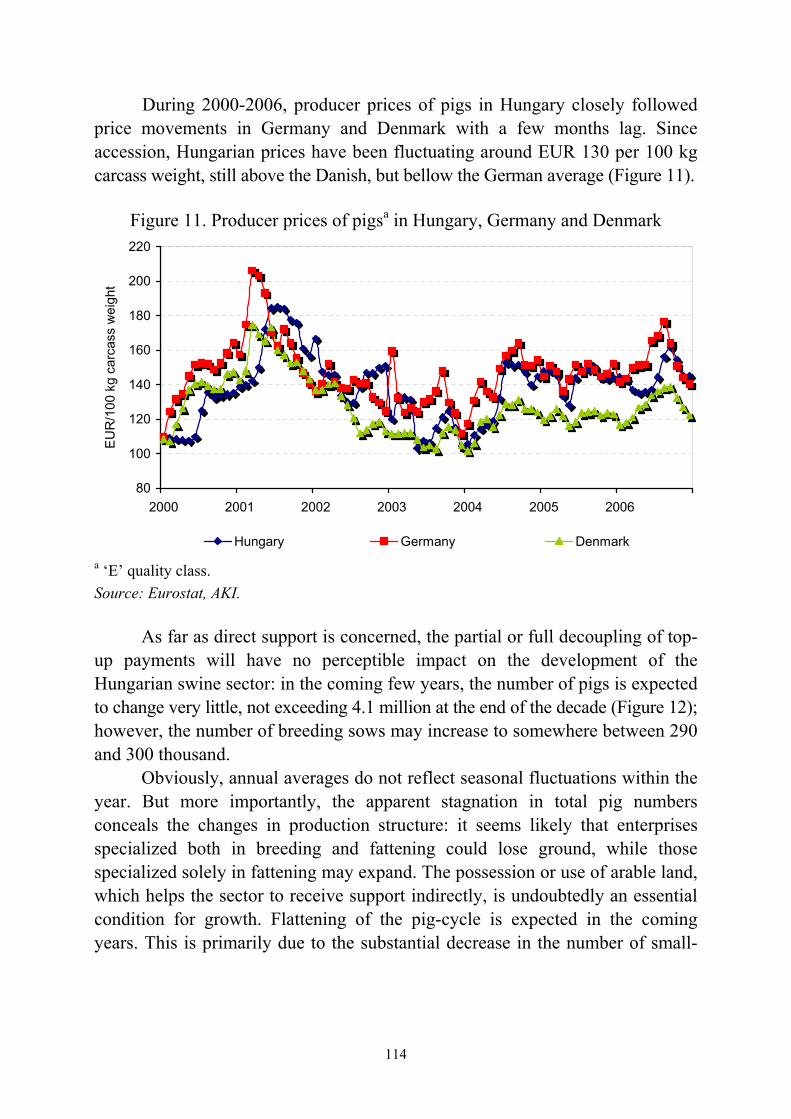
114
During 2000-2006, producer prices of pigs in Hungary closely followed price movements in Germany and Denmark with a few months lag. Since accession, Hungarian prices have been fluctuating around EUR 130 per 100 kg carcass weight, still above the Danish, but bellow the German average (Figure 11).
Figure 11. Producer prices of pigsa in Hungary, Germany and Denmark
80
100
120
140
160
180
200
220
2000 2001 2002 2003 2004 2005 2006
EU
R/1
00 k
g ca
rcas
s w
eigh
t
Hungary Germany Denmark
a ‘E’ quality class. Source: Eurostat, AKI.
As far as direct support is concerned, the partial or full decoupling of top-
up payments will have no perceptible impact on the development of the Hungarian swine sector: in the coming few years, the number of pigs is expected to change very little, not exceeding 4.1 million at the end of the decade (Figure 12); however, the number of breeding sows may increase to somewhere between 290 and 300 thousand.
Obviously, annual averages do not reflect seasonal fluctuations within the year. But more importantly, the apparent stagnation in total pig numbers conceals the changes in production structure: it seems likely that enterprises specialized both in breeding and fattening could lose ground, while those specialized solely in fattening may expand. The possession or use of arable land, which helps the sector to receive support indirectly, is undoubtedly an essential condition for growth. Flattening of the pig-cycle is expected in the coming years. This is primarily due to the substantial decrease in the number of small-
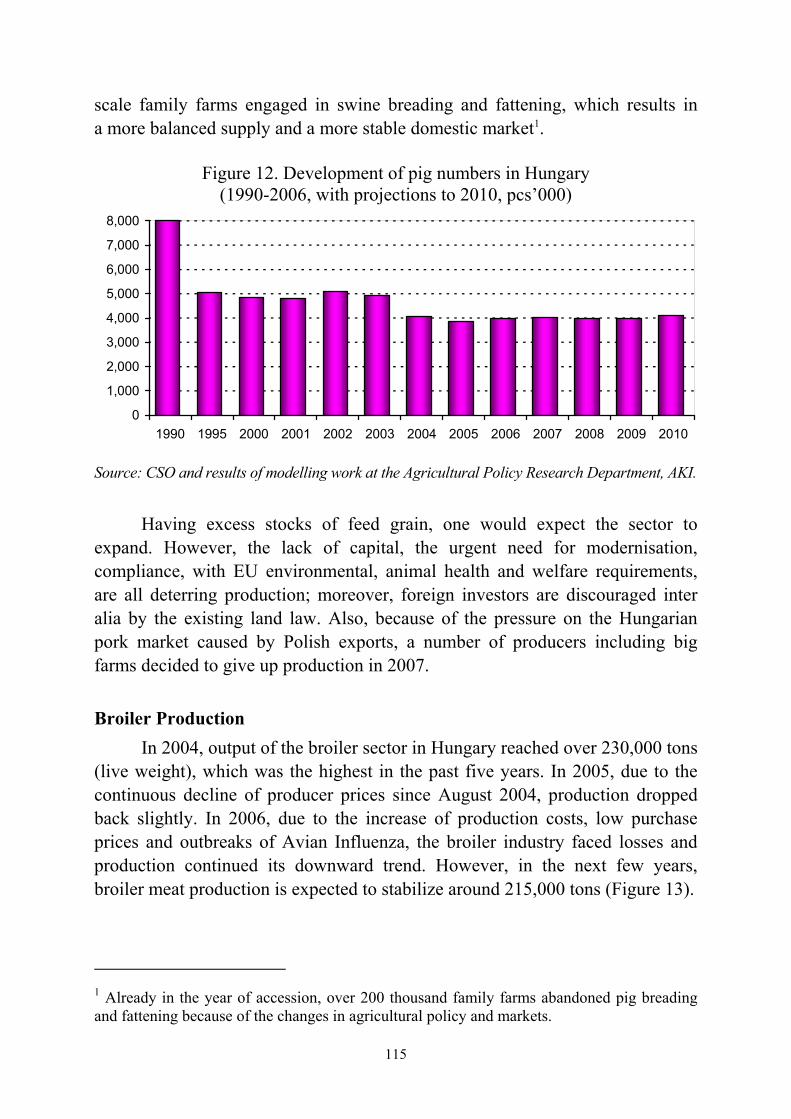
115
scale family farms engaged in swine breading and fattening, which results in a more balanced supply and a more stable domestic market1.
Figure 12. Development of pig numbers in Hungary
(1990-2006, with projections to 2010, pcs’000)
0
1,000
2,000
3,000
4,000
5,000
6,000
7,000
8,000
1990 1995 2000 2001 2002 2003 2004 2005 2006 2007 2008 2009 2010 Source: CSO and results of modelling work at the Agricultural Policy Research Department, AKI.
Having excess stocks of feed grain, one would expect the sector to expand. However, the lack of capital, the urgent need for modernisation, compliance, with EU environmental, animal health and welfare requirements, are all deterring production; moreover, foreign investors are discouraged inter alia by the existing land law. Also, because of the pressure on the Hungarian pork market caused by Polish exports, a number of producers including big farms decided to give up production in 2007.
Broiler Production
In 2004, output of the broiler sector in Hungary reached over 230,000 tons (live weight), which was the highest in the past five years. In 2005, due to the continuous decline of producer prices since August 2004, production dropped back slightly. In 2006, due to the increase of production costs, low purchase prices and outbreaks of Avian Influenza, the broiler industry faced losses and production continued its downward trend. However, in the next few years, broiler meat production is expected to stabilize around 215,000 tons (Figure 13).
1 Already in the year of accession, over 200 thousand family farms abandoned pig breading and fattening because of the changes in agricultural policy and markets.
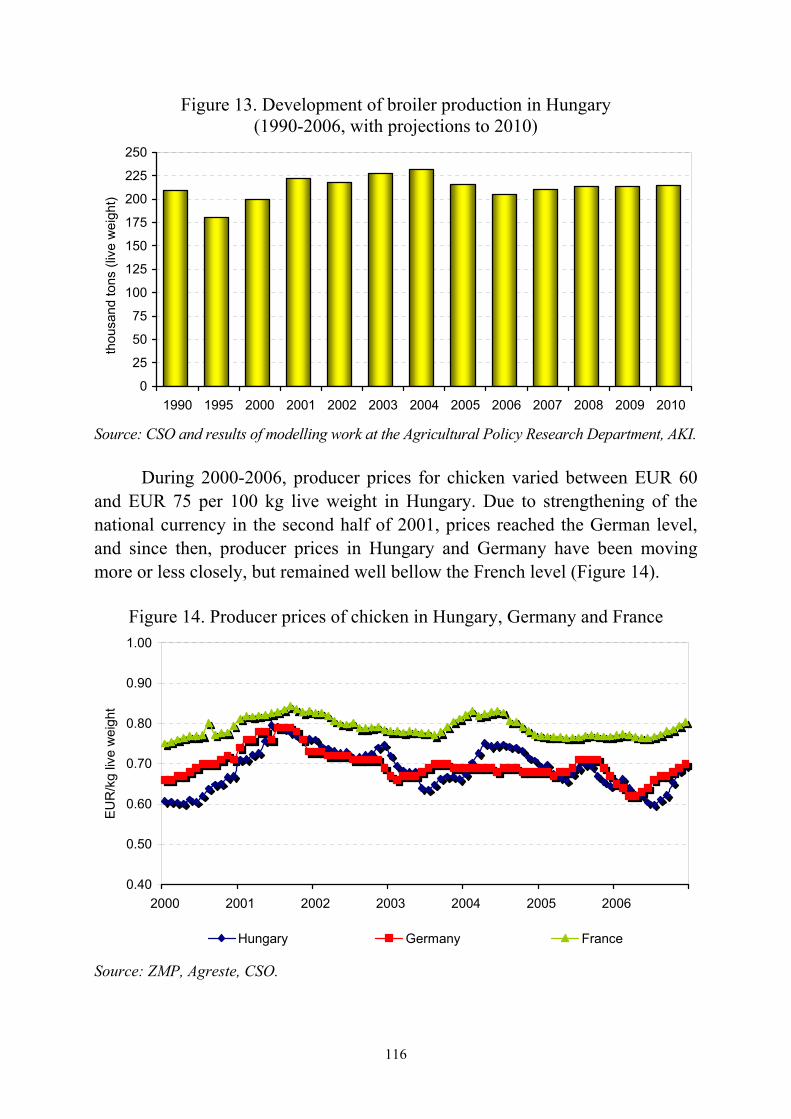
116
Figure 13. Development of broiler production in Hungary (1990-2006, with projections to 2010)
0
25
50
75
100
125
150
175
200
225
250
1990 1995 2000 2001 2002 2003 2004 2005 2006 2007 2008 2009 2010
thou
sand
tons
(liv
e w
eigh
t)
Source: CSO and results of modelling work at the Agricultural Policy Research Department, AKI.
During 2000-2006, producer prices for chicken varied between EUR 60 and EUR 75 per 100 kg live weight in Hungary. Due to strengthening of the national currency in the second half of 2001, prices reached the German level, and since then, producer prices in Hungary and Germany have been moving more or less closely, but remained well bellow the French level (Figure 14).
Figure 14. Producer prices of chicken in Hungary, Germany and France
0.40
0.50
0.60
0.70
0.80
0.90
1.00
2000 2001 2002 2003 2004 2005 2006
EUR
/kg
live
wei
ght
Hungary Germany France
Source: ZMP, Agreste, CSO.
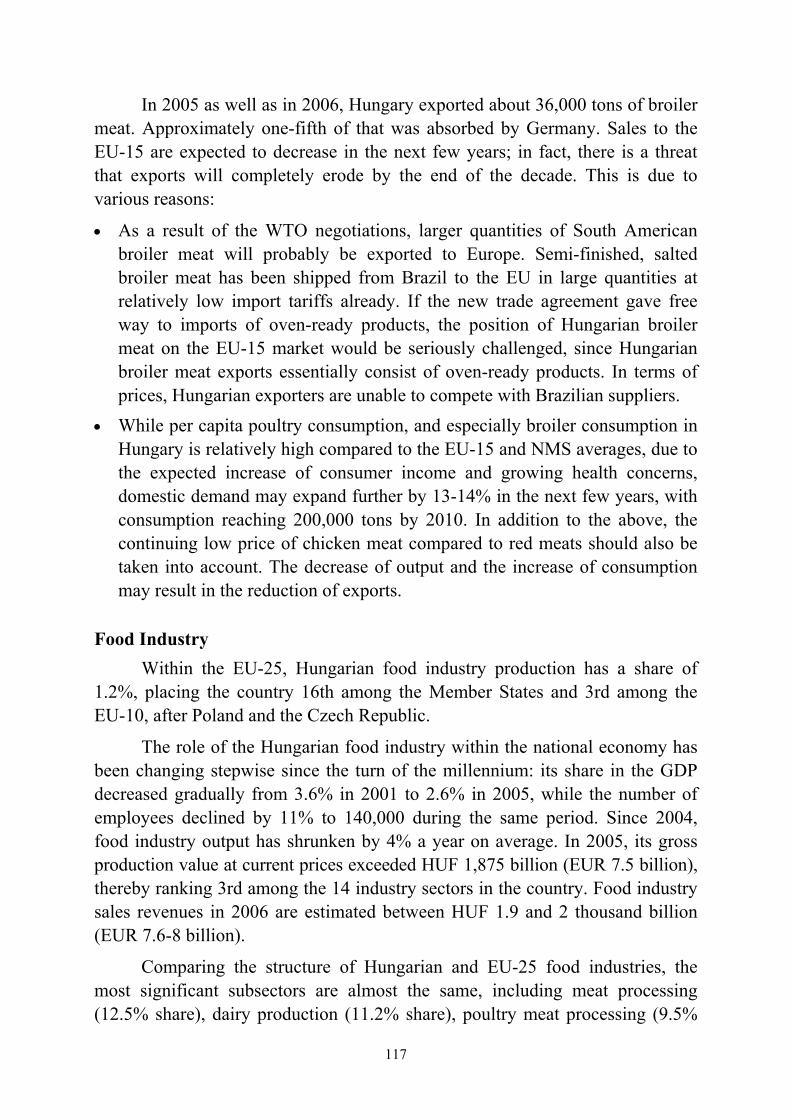
117
In 2005 as well as in 2006, Hungary exported about 36,000 tons of broiler meat. Approximately one-fifth of that was absorbed by Germany. Sales to the EU-15 are expected to decrease in the next few years; in fact, there is a threat that exports will completely erode by the end of the decade. This is due to various reasons:
• As a result of the WTO negotiations, larger quantities of South American broiler meat will probably be exported to Europe. Semi-finished, salted broiler meat has been shipped from Brazil to the EU in large quantities at relatively low import tariffs already. If the new trade agreement gave free way to imports of oven-ready products, the position of Hungarian broiler meat on the EU-15 market would be seriously challenged, since Hungarian broiler meat exports essentially consist of oven-ready products. In terms of prices, Hungarian exporters are unable to compete with Brazilian suppliers.
• While per capita poultry consumption, and especially broiler consumption in Hungary is relatively high compared to the EU-15 and NMS averages, due to the expected increase of consumer income and growing health concerns, domestic demand may expand further by 13-14% in the next few years, with consumption reaching 200,000 tons by 2010. In addition to the above, the continuing low price of chicken meat compared to red meats should also be taken into account. The decrease of output and the increase of consumption may result in the reduction of exports.
Food Industry
Within the EU-25, Hungarian food industry production has a share of 1.2%, placing the country 16th among the Member States and 3rd among the EU-10, after Poland and the Czech Republic.
The role of the Hungarian food industry within the national economy has been changing stepwise since the turn of the millennium: its share in the GDP decreased gradually from 3.6% in 2001 to 2.6% in 2005, while the number of employees declined by 11% to 140,000 during the same period. Since 2004, food industry output has shrunken by 4% a year on average. In 2005, its gross production value at current prices exceeded HUF 1,875 billion (EUR 7.5 billion), thereby ranking 3rd among the 14 industry sectors in the country. Food industry sales revenues in 2006 are estimated between HUF 1.9 and 2 thousand billion (EUR 7.6-8 billion).
Comparing the structure of Hungarian and EU-25 food industries, the most significant subsectors are almost the same, including meat processing (12.5% share), dairy production (11.2% share), poultry meat processing (9.5%

118
share) and soft drink production (6.3% share), with the addition of fruit and vegetable processing (6.2% share) in Hungary (Table 5). However, there is a difference between Hungary and the EU-25 in the percentage share of the various subsectors, as soft drink production and grain milling, as well as feed production and fruit and vegetable processing have a bigger share in Hungary, primarily at the expense of other food production (which includes nine subsectors). In general, specialization within the sector is not strong, and the rather balanced structure is similar to that of the French food industry.
During the past decade, the consolidation and concentration process has been speeded up thanks to foreign and domestic capital; however, companies having more than 250 employees or sales returns over HUF 100 million (EUR 0.4 million) had virtually a constant share in the food industry GDP (67%) and sales revenues (77%), respectively, in the past few years. The share of large companies with more than 500 employees is still very low, a mere 0.6%, whereas they represent 74% of output and 85% of exports.
Table 5. Structure of gross production values of Hungarian
food industry in 2005
Specification Gross production value HUF billion
Share %
Meat processing, preserving 233.6 12.5 Dairy production 210.2 11.2 Poultry meat processing, preserving 177.9 9.5 Soft drink production 118.9 6.3 Other fruit and vegetable processing 115.4 6.2 Bread, fresh pasta production 95.5 5.1 Animal feed production 90.8 4.9 Beer production 88.8 4.7 Confectionary and cake production 84.7 4.5 Meat and poultry meat produce production 73.1 3.9 Sugar production 68.4 3.6 Milling products 61.5 3.3 Others 456.2 24.3 Food industry total 1,875.0 100.0 Source: CSO.
The overall share of foreign capital in the food industry has declined during the pre-accession years, dropping to 52% by 2004 from 63% in 2000, i.e. foreign capital has begun to withdraw from various subsectors. These include the tobacco and beverage industries as well as fruit and vegetable processing, where the ratio of foreign capital decreased by some 20 percentage points during 2000-2004. The dairy industry was the only subsector, where the share of
119
foreign capital increased until 2004, and although the growth was a mere 2%, foreign investors held 87% ownership. However, their share diminished by about 50%, as domestic investors started acquiring plants and companies in 2005. In some subsectors, foreign capital currently has a very low share (e.g. 17% in meat processing).
Equipped with modern technology and being in many cases owned by foreign companies, large firms in the food industry have trade and corporate connections to be reckoned with as an integral part of the food supply network of the EU. The position of small- and medium-sized food companies, producing mainly for local markets, is rather weak, as their business opportunities are severely limited by low capitalization and poor efficiency. However, the Hungarian food processing sector has plenty of such small- and medium-sized ventures, almost 90% of which employ less than 20 people. The vast majority, especially the small- and medium-sized companies, are handicapped by the lack of funds to apply the results of innovation and R&D, and, in some cases, to implement EU quality assurance, food safety and environmental schemes. Challenges are particularly great in meat and dairy processing, where the meeting of standards and the improvement of marketing remain major issues.
The productivity indicator of the Hungarian food industry is rather poor in international comparison, placing the country in the lower third of the EU-25. Per employee productivity of the Belgian, Dutch and Portuguese food industries (countries with similar population as Hungary) was respectively 6.3, 4.4 and 1.6 times higher in 2004 (Table 6). This is partly due to cheap labour in Hungary. Although the sector generated profits each year during the period 1997-2005, it declined continuously. Investments increased significantly until the accession, reaching HUF 113 billion (EUR 452 million) in 2004, as compared to HUF 57 billion in 1997. However, the rate of investment growth dropped back drastically in 2005, when the sector absorbed only HUF 117 billion (EUR 468 million) in total. This change can be explained by the absence of financial support in 2005.
In comparison with the EU-25 average, the level of concentration in the Hungarian food industry is relatively high, similar to some of the economically more developed EU Member States, such as Denmark or the Netherlands. The share of the top five companies is 70% to 85% in the meat processing, poultry slaughtering, sweets and pasta industries. During 1997-2004, concentration in the milling, feed and dairy industries increased by 15-20%. In the dairy industry, parallel to this, the share of foreign ownership increased in the run up to the accession, whereas in the milling and feed industries, corporate mergers and
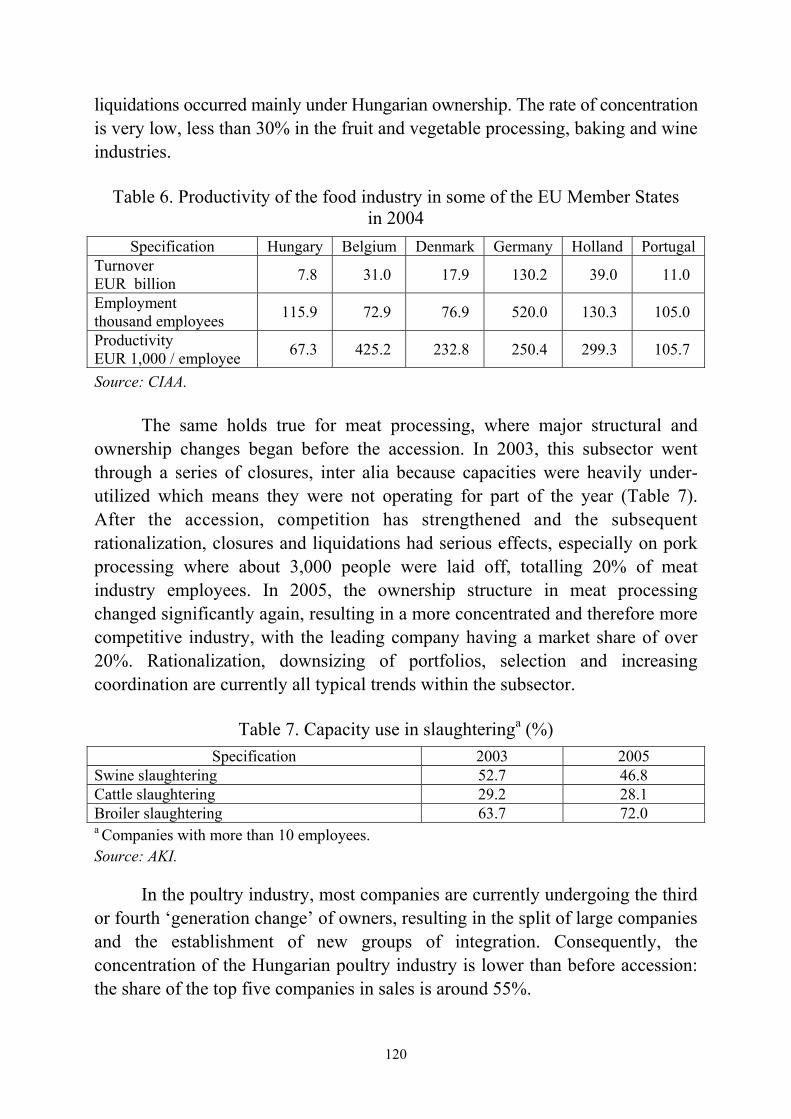
120
liquidations occurred mainly under Hungarian ownership. The rate of concentration is very low, less than 30% in the fruit and vegetable processing, baking and wine industries.
Table 6. Productivity of the food industry in some of the EU Member States in 2004
Specification Hungary Belgium Denmark Germany Holland Portugal Turnover EUR billion 7.8 31.0 17.9 130.2 39.0 11.0
Employment thousand employees 115.9 72.9 76.9 520.0 130.3 105.0
Productivity EUR 1,000 / employee 67.3 425.2 232.8 250.4 299.3 105.7
Source: CIAA.
The same holds true for meat processing, where major structural and ownership changes began before the accession. In 2003, this subsector went through a series of closures, inter alia because capacities were heavily under-utilized which means they were not operating for part of the year (Table 7). After the accession, competition has strengthened and the subsequent rationalization, closures and liquidations had serious effects, especially on pork processing where about 3,000 people were laid off, totalling 20% of meat industry employees. In 2005, the ownership structure in meat processing changed significantly again, resulting in a more concentrated and therefore more competitive industry, with the leading company having a market share of over 20%. Rationalization, downsizing of portfolios, selection and increasing coordination are currently all typical trends within the subsector.
Table 7. Capacity use in slaughteringa (%) Specification 2003 2005
Swine slaughtering 52.7 46.8 Cattle slaughtering 29.2 28.1 Broiler slaughtering 63.7 72.0 a Companies with more than 10 employees. Source: AKI.
In the poultry industry, most companies are currently undergoing the third or fourth ‘generation change’ of owners, resulting in the split of large companies and the establishment of new groups of integration. Consequently, the concentration of the Hungarian poultry industry is lower than before accession: the share of the top five companies in sales is around 55%.
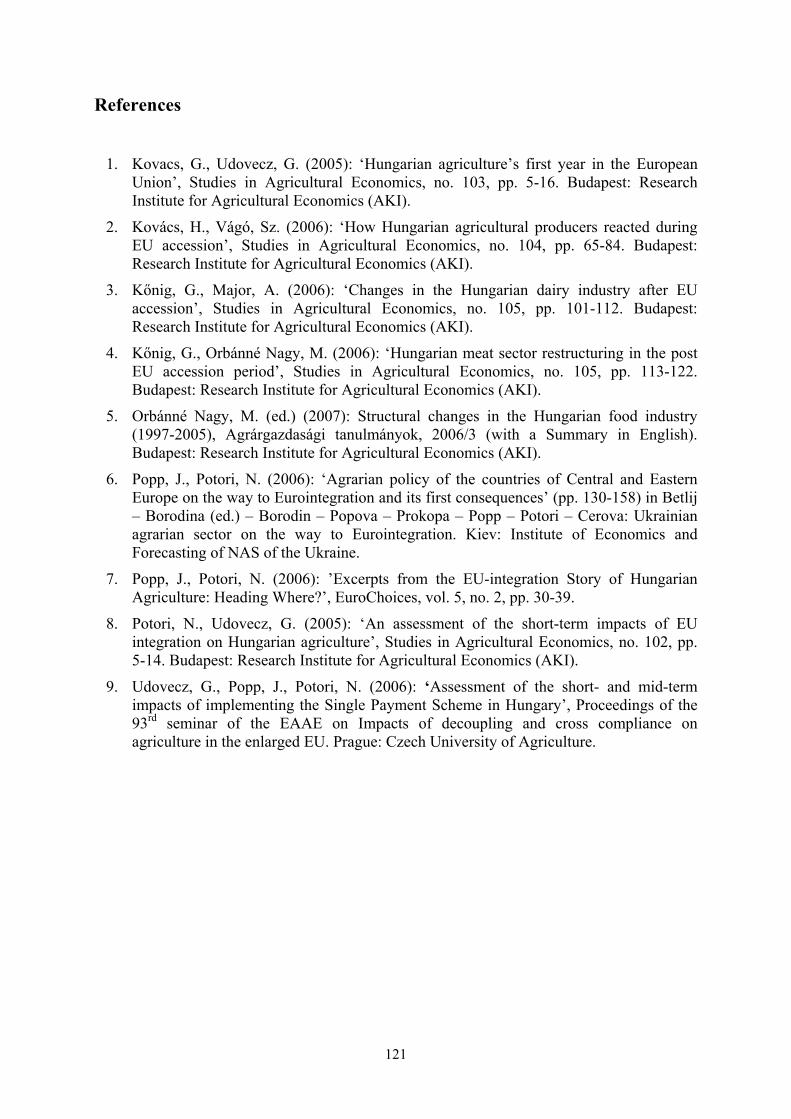
121
References
1. Kovacs, G., Udovecz, G. (2005): ‘Hungarian agriculture’s first year in the European Union’, Studies in Agricultural Economics, no. 103, pp. 5-16. Budapest: Research Institute for Agricultural Economics (AKI).
2. Kovács, H., Vágó, Sz. (2006): ‘How Hungarian agricultural producers reacted during EU accession’, Studies in Agricultural Economics, no. 104, pp. 65-84. Budapest: Research Institute for Agricultural Economics (AKI).
3. Kőnig, G., Major, A. (2006): ‘Changes in the Hungarian dairy industry after EU accession’, Studies in Agricultural Economics, no. 105, pp. 101-112. Budapest: Research Institute for Agricultural Economics (AKI).
4. Kőnig, G., Orbánné Nagy, M. (2006): ‘Hungarian meat sector restructuring in the post EU accession period’, Studies in Agricultural Economics, no. 105, pp. 113-122. Budapest: Research Institute for Agricultural Economics (AKI).
5. Orbánné Nagy, M. (ed.) (2007): Structural changes in the Hungarian food industry (1997-2005), Agrárgazdasági tanulmányok, 2006/3 (with a Summary in English). Budapest: Research Institute for Agricultural Economics (AKI).
6. Popp, J., Potori, N. (2006): ‘Agrarian policy of the countries of Central and Eastern Europe on the way to Eurointegration and its first consequences’ (pp. 130-158) in Betlij – Borodina (ed.) – Borodin – Popova – Prokopa – Popp – Potori – Cerova: Ukrainian agrarian sector on the way to Eurointegration. Kiev: Institute of Economics and Forecasting of NAS of the Ukraine.
7. Popp, J., Potori, N. (2006): ’Excerpts from the EU-integration Story of Hungarian Agriculture: Heading Where?’, EuroChoices, vol. 5, no. 2, pp. 30-39.
8. Potori, N., Udovecz, G. (2005): ‘An assessment of the short-term impacts of EU integration on Hungarian agriculture’, Studies in Agricultural Economics, no. 102, pp. 5-14. Budapest: Research Institute for Agricultural Economics (AKI).
9. Udovecz, G., Popp, J., Potori, N. (2006): ‘Assessment of the short- and mid-term impacts of implementing the Single Payment Scheme in Hungary’, Proceedings of the 93rd seminar of the EAAE on Impacts of decoupling and cross compliance on agriculture in the enlarged EU. Prague: Czech University of Agriculture.
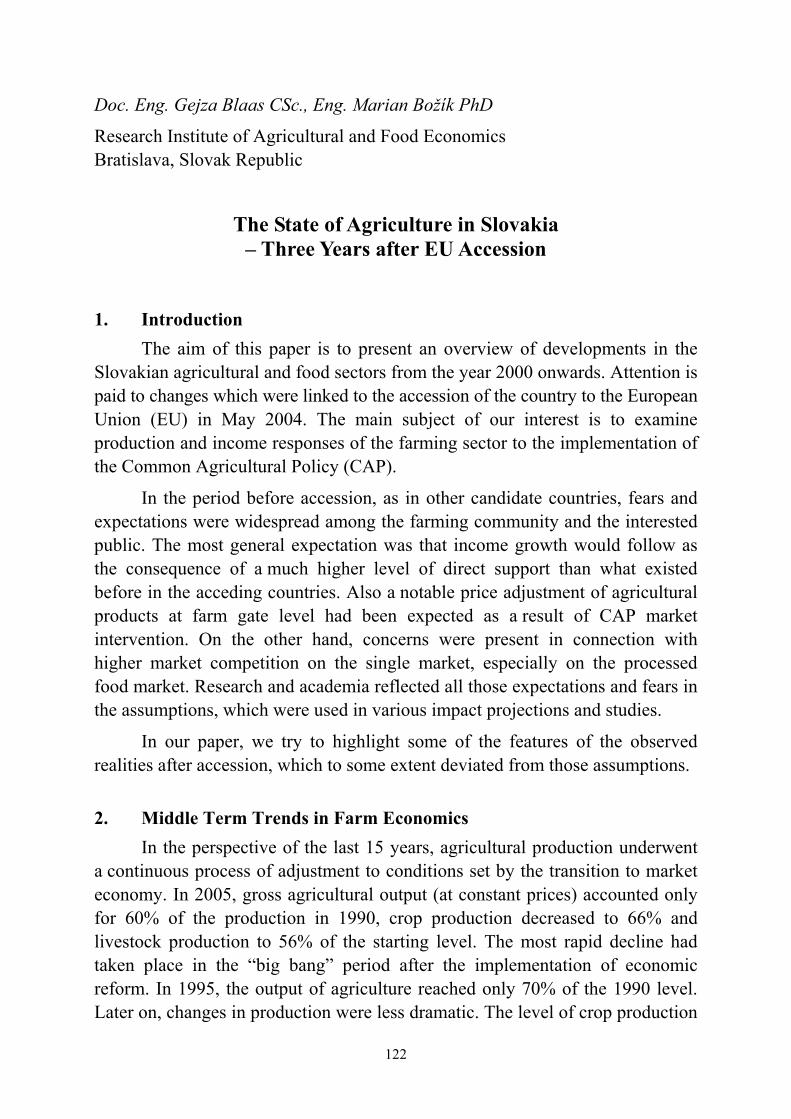
122
Doc. Eng. Gejza Blaas CSc., Eng. Marian Božík PhD
Research Institute of Agricultural and Food Economics Bratislava, Slovak Republic
The State of Agriculture in Slovakia – Three Years after EU Accession
1. Introduction The aim of this paper is to present an overview of developments in the
Slovakian agricultural and food sectors from the year 2000 onwards. Attention is paid to changes which were linked to the accession of the country to the European Union (EU) in May 2004. The main subject of our interest is to examine production and income responses of the farming sector to the implementation of the Common Agricultural Policy (CAP).
In the period before accession, as in other candidate countries, fears and expectations were widespread among the farming community and the interested public. The most general expectation was that income growth would follow as the consequence of a much higher level of direct support than what existed before in the acceding countries. Also a notable price adjustment of agricultural products at farm gate level had been expected as a result of CAP market intervention. On the other hand, concerns were present in connection with higher market competition on the single market, especially on the processed food market. Research and academia reflected all those expectations and fears in the assumptions, which were used in various impact projections and studies.
In our paper, we try to highlight some of the features of the observed realities after accession, which to some extent deviated from those assumptions.
2. Middle Term Trends in Farm Economics
In the perspective of the last 15 years, agricultural production underwent a continuous process of adjustment to conditions set by the transition to market economy. In 2005, gross agricultural output (at constant prices) accounted only for 60% of the production in 1990, crop production decreased to 66% and livestock production to 56% of the starting level. The most rapid decline had taken place in the “big bang” period after the implementation of economic reform. In 1995, the output of agriculture reached only 70% of the 1990 level. Later on, changes in production were less dramatic. The level of crop production
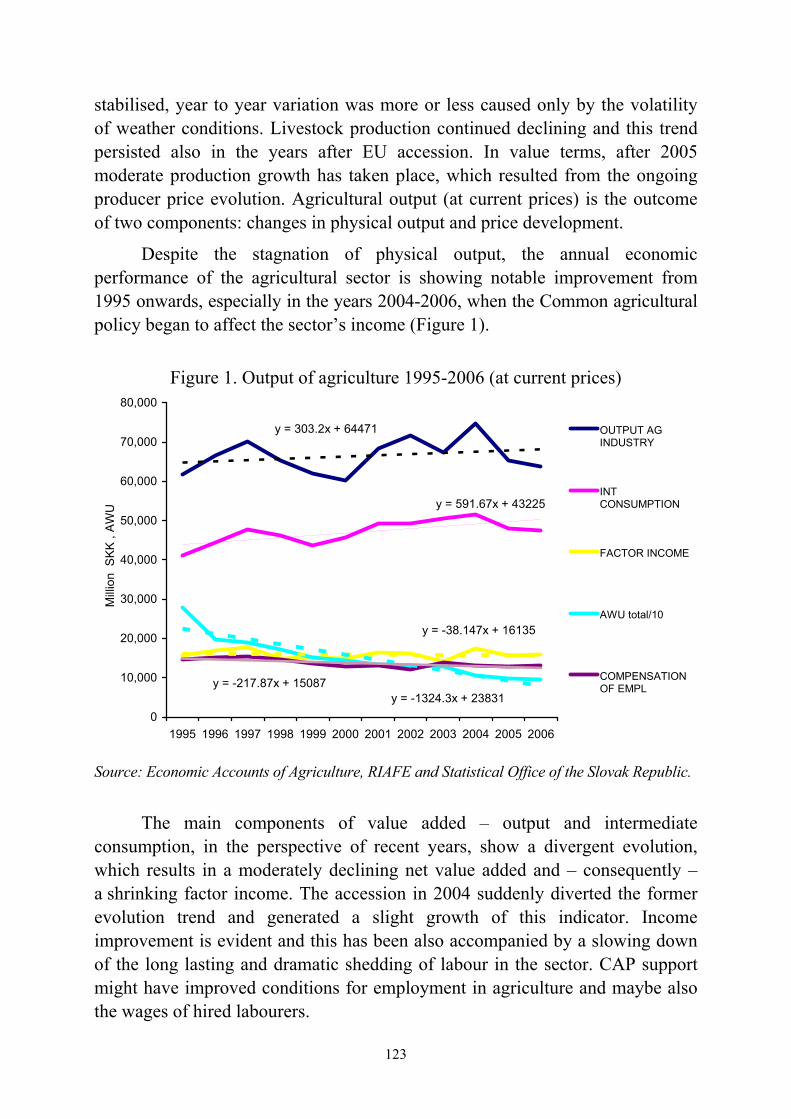
123
stabilised, year to year variation was more or less caused only by the volatility of weather conditions. Livestock production continued declining and this trend persisted also in the years after EU accession. In value terms, after 2005 moderate production growth has taken place, which resulted from the ongoing producer price evolution. Agricultural output (at current prices) is the outcome of two components: changes in physical output and price development.
Despite the stagnation of physical output, the annual economic performance of the agricultural sector is showing notable improvement from 1995 onwards, especially in the years 2004-2006, when the Common agricultural policy began to affect the sector’s income (Figure 1).
Figure 1. Output of agriculture 1995-2006 (at current prices)
y = 591.67x + 43225
y = -38.147x + 16135
y = -1324.3x + 23831y = -217.87x + 15087
y = 303.2x + 64471
0
10,000
20,000
30,000
40,000
50,000
60,000
70,000
80,000
1995 1996 1997 1998 1999 2000 2001 2002 2003 2004 2005 2006
Mill
ion
SK
K ,
AW
U
OUTPUT AGINDUSTRY
INTCONSUMPTION
FACTOR INCOME
AWU total/10
COMPENSATIONOF EMPL
Source: Economic Accounts of Agriculture, RIAFE and Statistical Office of the Slovak Republic.
The main components of value added – output and intermediate
consumption, in the perspective of recent years, show a divergent evolution, which results in a moderately declining net value added and – consequently – a shrinking factor income. The accession in 2004 suddenly diverted the former evolution trend and generated a slight growth of this indicator. Income improvement is evident and this has been also accompanied by a slowing down of the long lasting and dramatic shedding of labour in the sector. CAP support might have improved conditions for employment in agriculture and maybe also the wages of hired labourers.
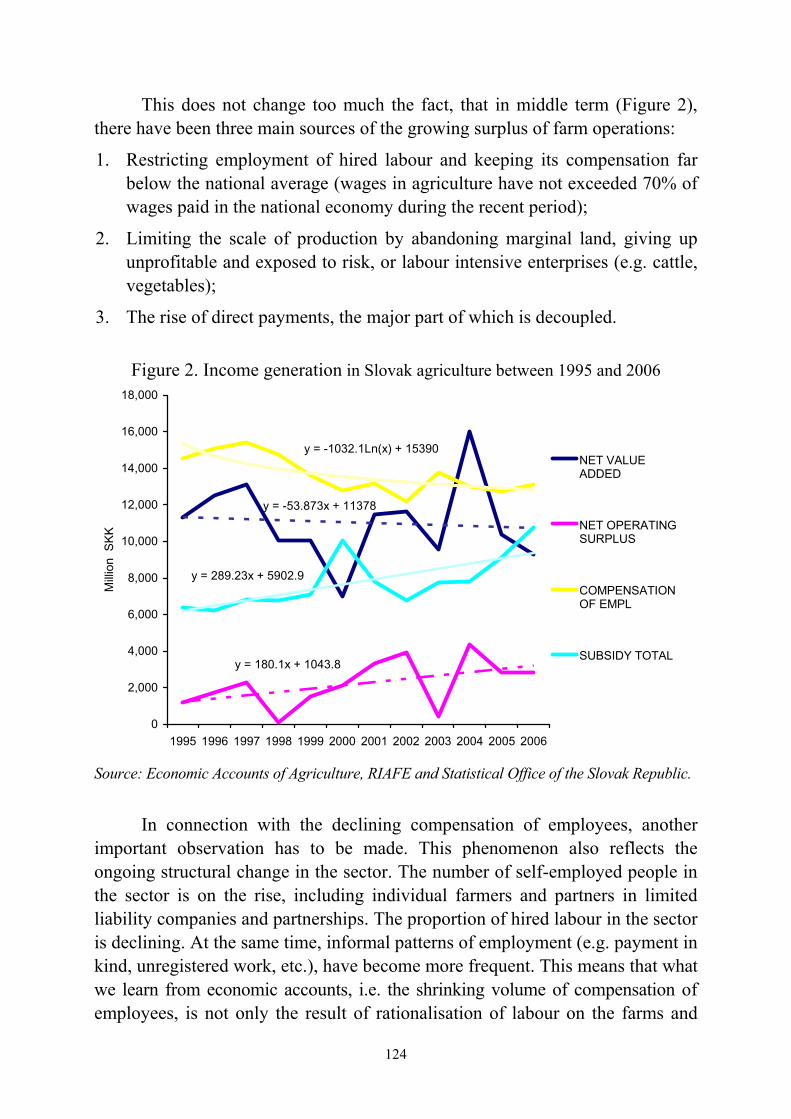
124
This does not change too much the fact, that in middle term (Figure 2), there have been three main sources of the growing surplus of farm operations:
1. Restricting employment of hired labour and keeping its compensation far below the national average (wages in agriculture have not exceeded 70% of wages paid in the national economy during the recent period);
2. Limiting the scale of production by abandoning marginal land, giving up unprofitable and exposed to risk, or labour intensive enterprises (e.g. cattle, vegetables);
3. The rise of direct payments, the major part of which is decoupled.
Figure 2. Income generation in Slovak agriculture between 1995 and 2006
y = -1032.1Ln(x) + 15390
y = -53.873x + 11378
y = 289.23x + 5902.9
y = 180.1x + 1043.8
0
2,000
4,000
6,000
8,000
10,000
12,000
14,000
16,000
18,000
1995 1996 1997 1998 1999 2000 2001 2002 2003 2004 2005 2006
Mill
ion
SK
K
NET VALUEADDED
NET OPERATINGSURPLUS
COMPENSATIONOF EMPL
SUBSIDY TOTAL
Source: Economic Accounts of Agriculture, RIAFE and Statistical Office of the Slovak Republic.
In connection with the declining compensation of employees, another
important observation has to be made. This phenomenon also reflects the ongoing structural change in the sector. The number of self-employed people in the sector is on the rise, including individual farmers and partners in limited liability companies and partnerships. The proportion of hired labour in the sector is declining. At the same time, informal patterns of employment (e.g. payment in kind, unregistered work, etc.), have become more frequent. This means that what we learn from economic accounts, i.e. the shrinking volume of compensation of employees, is not only the result of rationalisation of labour on the farms and
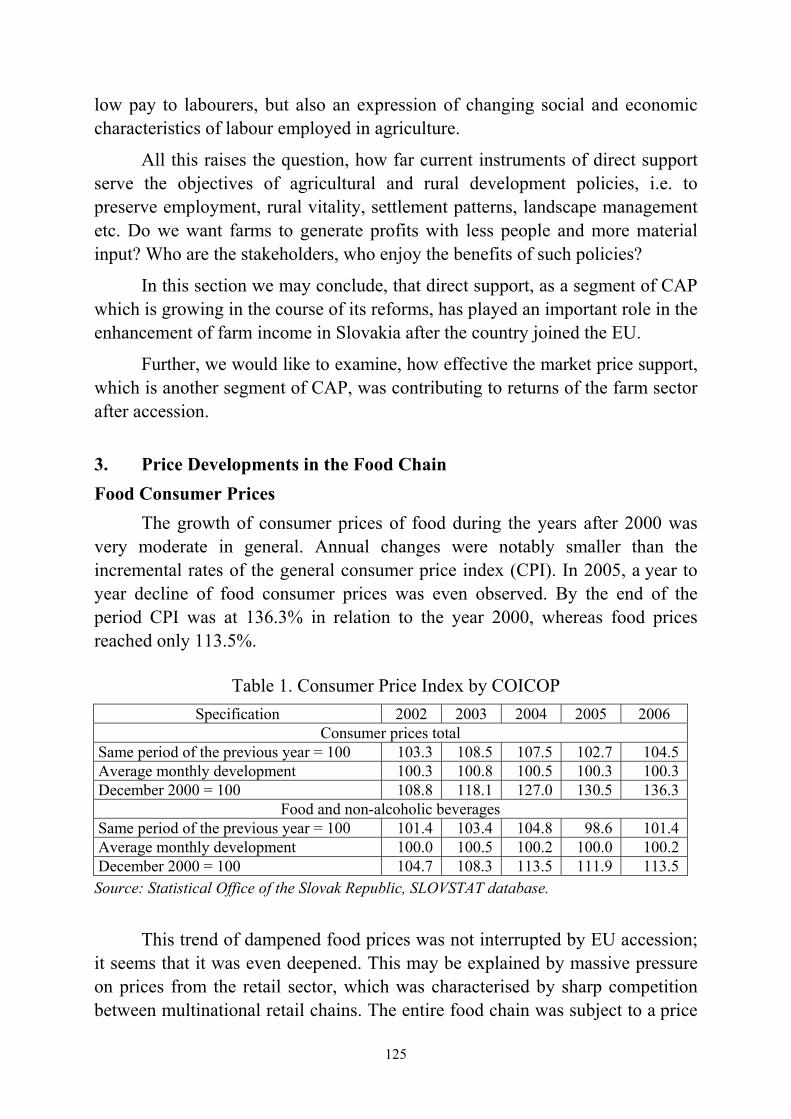
125
low pay to labourers, but also an expression of changing social and economic characteristics of labour employed in agriculture.
All this raises the question, how far current instruments of direct support serve the objectives of agricultural and rural development policies, i.e. to preserve employment, rural vitality, settlement patterns, landscape management etc. Do we want farms to generate profits with less people and more material input? Who are the stakeholders, who enjoy the benefits of such policies?
In this section we may conclude, that direct support, as a segment of CAP which is growing in the course of its reforms, has played an important role in the enhancement of farm income in Slovakia after the country joined the EU.
Further, we would like to examine, how effective the market price support, which is another segment of CAP, was contributing to returns of the farm sector after accession.
3. Price Developments in the Food Chain Food Consumer Prices
The growth of consumer prices of food during the years after 2000 was very moderate in general. Annual changes were notably smaller than the incremental rates of the general consumer price index (CPI). In 2005, a year to year decline of food consumer prices was even observed. By the end of the period CPI was at 136.3% in relation to the year 2000, whereas food prices reached only 113.5%.
Table 1. Consumer Price Index by COICOP Specification 2002 2003 2004 2005 2006
Consumer prices total Same period of the previous year = 100 103.3 108.5 107.5 102.7 104.5 Average monthly development 100.3 100.8 100.5 100.3 100.3 December 2000 = 100 108.8 118.1 127.0 130.5 136.3
Food and non-alcoholic beverages Same period of the previous year = 100 101.4 103.4 104.8 98.6 101.4 Average monthly development 100.0 100.5 100.2 100.0 100.2 December 2000 = 100 104.7 108.3 113.5 111.9 113.5 Source: Statistical Office of the Slovak Republic, SLOVSTAT database.
This trend of dampened food prices was not interrupted by EU accession; it seems that it was even deepened. This may be explained by massive pressure on prices from the retail sector, which was characterised by sharp competition between multinational retail chains. The entire food chain was subject to a price
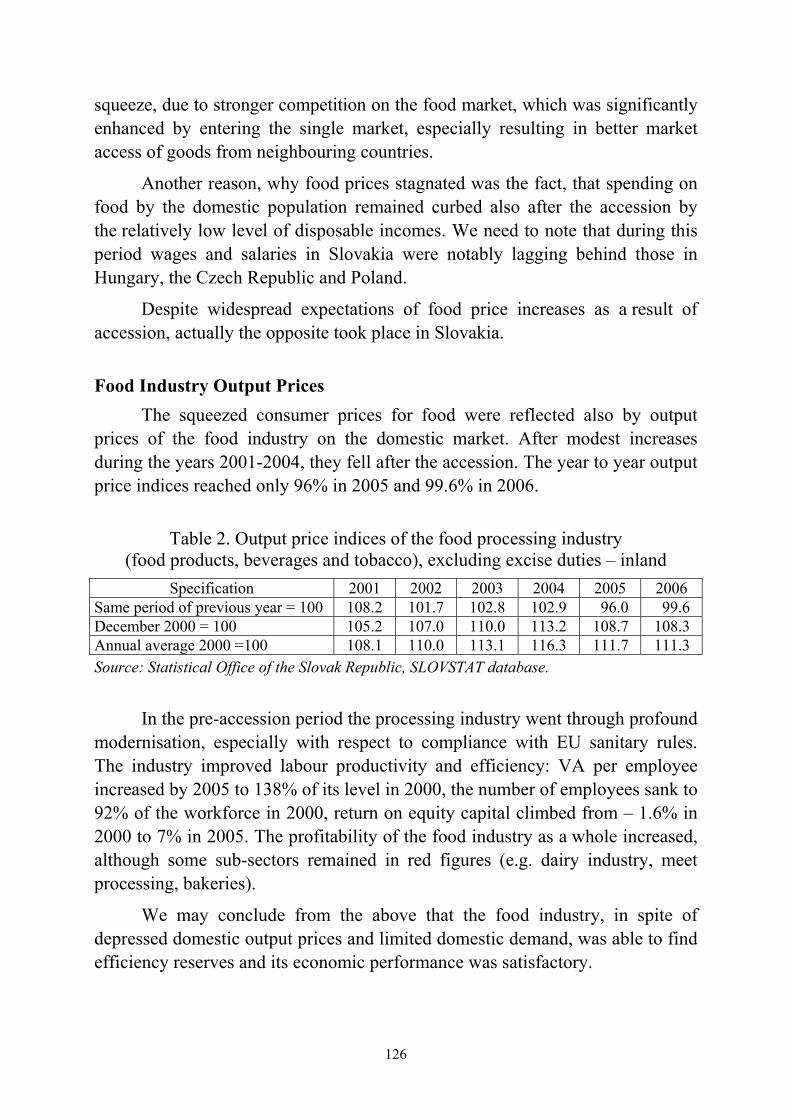
126
squeeze, due to stronger competition on the food market, which was significantly enhanced by entering the single market, especially resulting in better market access of goods from neighbouring countries.
Another reason, why food prices stagnated was the fact, that spending on food by the domestic population remained curbed also after the accession by the relatively low level of disposable incomes. We need to note that during this period wages and salaries in Slovakia were notably lagging behind those in Hungary, the Czech Republic and Poland.
Despite widespread expectations of food price increases as a result of accession, actually the opposite took place in Slovakia.
Food Industry Output Prices
The squeezed consumer prices for food were reflected also by output prices of the food industry on the domestic market. After modest increases during the years 2001-2004, they fell after the accession. The year to year output price indices reached only 96% in 2005 and 99.6% in 2006.
Table 2. Output price indices of the food processing industry
(food products, beverages and tobacco), excluding excise duties – inland Specification 2001 2002 2003 2004 2005 2006
Same period of previous year = 100 108.2 101.7 102.8 102.9 96.0 99.6 December 2000 = 100 105.2 107.0 110.0 113.2 108.7 108.3 Annual average 2000 =100 108.1 110.0 113.1 116.3 111.7 111.3 Source: Statistical Office of the Slovak Republic, SLOVSTAT database.
In the pre-accession period the processing industry went through profound modernisation, especially with respect to compliance with EU sanitary rules. The industry improved labour productivity and efficiency: VA per employee increased by 2005 to 138% of its level in 2000, the number of employees sank to 92% of the workforce in 2000, return on equity capital climbed from – 1.6% in 2000 to 7% in 2005. The profitability of the food industry as a whole increased, although some sub-sectors remained in red figures (e.g. dairy industry, meet processing, bakeries).
We may conclude from the above that the food industry, in spite of depressed domestic output prices and limited domestic demand, was able to find efficiency reserves and its economic performance was satisfactory.
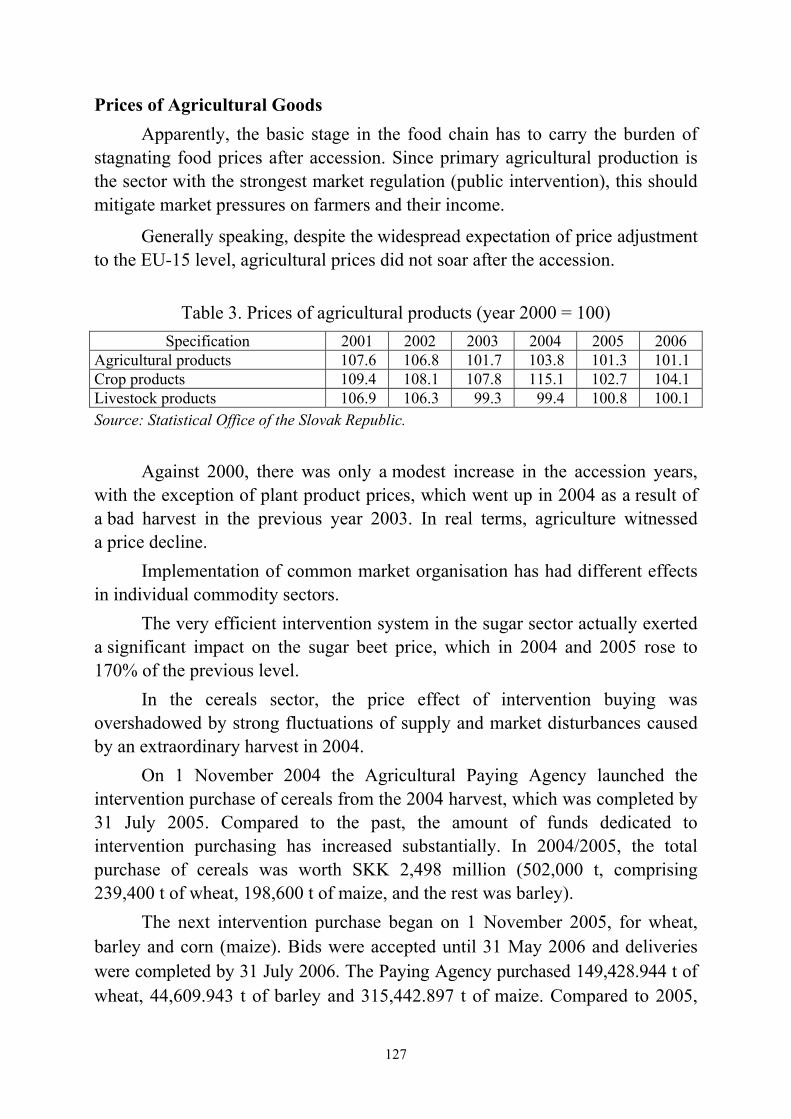
127
Prices of Agricultural Goods Apparently, the basic stage in the food chain has to carry the burden of
stagnating food prices after accession. Since primary agricultural production is the sector with the strongest market regulation (public intervention), this should mitigate market pressures on farmers and their income.
Generally speaking, despite the widespread expectation of price adjustment to the EU-15 level, agricultural prices did not soar after the accession.
Table 3. Prices of agricultural products (year 2000 = 100)
Specification 2001 2002 2003 2004 2005 2006 Agricultural products 107.6 106.8 101.7 103.8 101.3 101.1 Crop products 109.4 108.1 107.8 115.1 102.7 104.1 Livestock products 106.9 106.3 99.3 99.4 100.8 100.1 Source: Statistical Office of the Slovak Republic.
Against 2000, there was only a modest increase in the accession years, with the exception of plant product prices, which went up in 2004 as a result of a bad harvest in the previous year 2003. In real terms, agriculture witnessed a price decline.
Implementation of common market organisation has had different effects in individual commodity sectors.
The very efficient intervention system in the sugar sector actually exerted a significant impact on the sugar beet price, which in 2004 and 2005 rose to 170% of the previous level.
In the cereals sector, the price effect of intervention buying was overshadowed by strong fluctuations of supply and market disturbances caused by an extraordinary harvest in 2004.
On 1 November 2004 the Agricultural Paying Agency launched the intervention purchase of cereals from the 2004 harvest, which was completed by 31 July 2005. Compared to the past, the amount of funds dedicated to intervention purchasing has increased substantially. In 2004/2005, the total purchase of cereals was worth SKK 2,498 million (502,000 t, comprising 239,400 t of wheat, 198,600 t of maize, and the rest was barley).
The next intervention purchase began on 1 November 2005, for wheat, barley and corn (maize). Bids were accepted until 31 May 2006 and deliveries were completed by 31 July 2006. The Paying Agency purchased 149,428.944 t of wheat, 44,609.943 t of barley and 315,442.897 t of maize. Compared to 2005,
128
the intervention purchase declined by 11.3%. The intervention stock was sold out during 2006. After the 2006 harvest, intervention purchasing started on 1 November 2006, but no supply was offered.
Intervention in the cereals sector did not manage to eliminate the price impact of surplus production from the harvest of 2004 in its entirety, but helped to mitigate the problem to some extent.
In addition to intervention buying, the warehouse receipt scheme based on subsidised storage of stocks used as collateral for commodity credit continued to operate. This had been negotiated as a transitional measure. In 2005, approximately 353,700 t of cereals were put into public warehouses. Compared to the year before, this represented a decline by 31%. This development suggests that with the introduction of fully operational intervention purchase system, the importance of the warehouse receipt scheme declined. It will be phased out in the intervention year 2007-2008.
The CMO effect in the dairy sector was not clear cut. Intervention purchase of a certain quantity of butter took place. Nevertheless, growth in producer price of raw milk occurred, which may be explained by competition created by demand from dairies in neighbouring countries.
In the fruit and vegetable sector disastrous price fluctuations took place in the after-accession period. Free trade on one hand, and the lack of functioning CMO for fruit and vegetables on the other hand, contributed to this situation. The reluctance of growers to associate into producer organisations may be considered as the main reason for the absence of effective market intervention in this sector.
In the beef, pork and poultry sector, only market forces have been influencing the respective markets. Domestic demand for beef is extremely low (corresponding with per capita consumption of 6.2 kg per year), but notable external demand for live animals is pushing beef prices upwards. The prices of swine (recently at their low – 32 SKK per kg l.w.) suffer, besides seasonal fluctuations, from chronically competitive external supply. Similarly, the price for poultry meet has been falling.
The evolution of prices, commodity by commodity, is shown in Table 4.
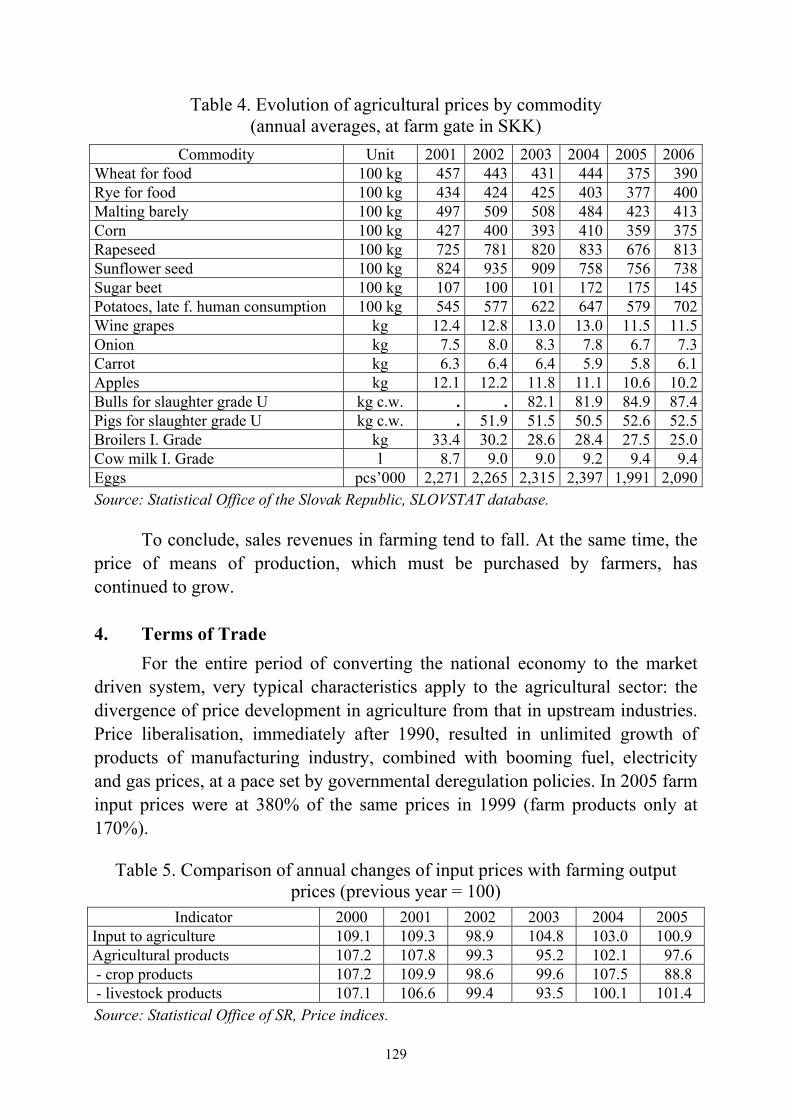
129
Table 4. Evolution of agricultural prices by commodity (annual averages, at farm gate in SKK)
Commodity Unit 2001 2002 2003 2004 2005 2006Wheat for food 100 kg 457 443 431 444 375 390Rye for food 100 kg 434 424 425 403 377 400Malting barely 100 kg 497 509 508 484 423 413Corn 100 kg 427 400 393 410 359 375Rapeseed 100 kg 725 781 820 833 676 813Sunflower seed 100 kg 824 935 909 758 756 738Sugar beet 100 kg 107 100 101 172 175 145Potatoes, late f. human consumption 100 kg 545 577 622 647 579 702Wine grapes kg 12.4 12.8 13.0 13.0 11.5 11.5Onion kg 7.5 8.0 8.3 7.8 6.7 7.3Carrot kg 6.3 6.4 6.4 5.9 5.8 6.1Apples kg 12.1 12.2 11.8 11.1 10.6 10.2Bulls for slaughter grade U kg c.w. . . 82.1 81.9 84.9 87.4Pigs for slaughter grade U kg c.w. . 51.9 51.5 50.5 52.6 52.5Broilers I. Grade kg 33.4 30.2 28.6 28.4 27.5 25.0Cow milk I. Grade l 8.7 9.0 9.0 9.2 9.4 9.4Eggs pcs’000 2,271 2,265 2,315 2,397 1,991 2,090Source: Statistical Office of the Slovak Republic, SLOVSTAT database.
To conclude, sales revenues in farming tend to fall. At the same time, the price of means of production, which must be purchased by farmers, has continued to grow. 4. Terms of Trade
For the entire period of converting the national economy to the market driven system, very typical characteristics apply to the agricultural sector: the divergence of price development in agriculture from that in upstream industries. Price liberalisation, immediately after 1990, resulted in unlimited growth of products of manufacturing industry, combined with booming fuel, electricity and gas prices, at a pace set by governmental deregulation policies. In 2005 farm input prices were at 380% of the same prices in 1999 (farm products only at 170%).
Table 5. Comparison of annual changes of input prices with farming output prices (previous year = 100)
Indicator 2000 2001 2002 2003 2004 2005 Input to agriculture 109.1 109.3 98.9 104.8 103.0 100.9 Agricultural products 107.2 107.8 99.3 95.2 102.1 97.6 - crop products 107.2 109.9 98.6 99.6 107.5 88.8 - livestock products 107.1 106.6 99.4 93.5 100.1 101.4 Source: Statistical Office of SR, Price indices.
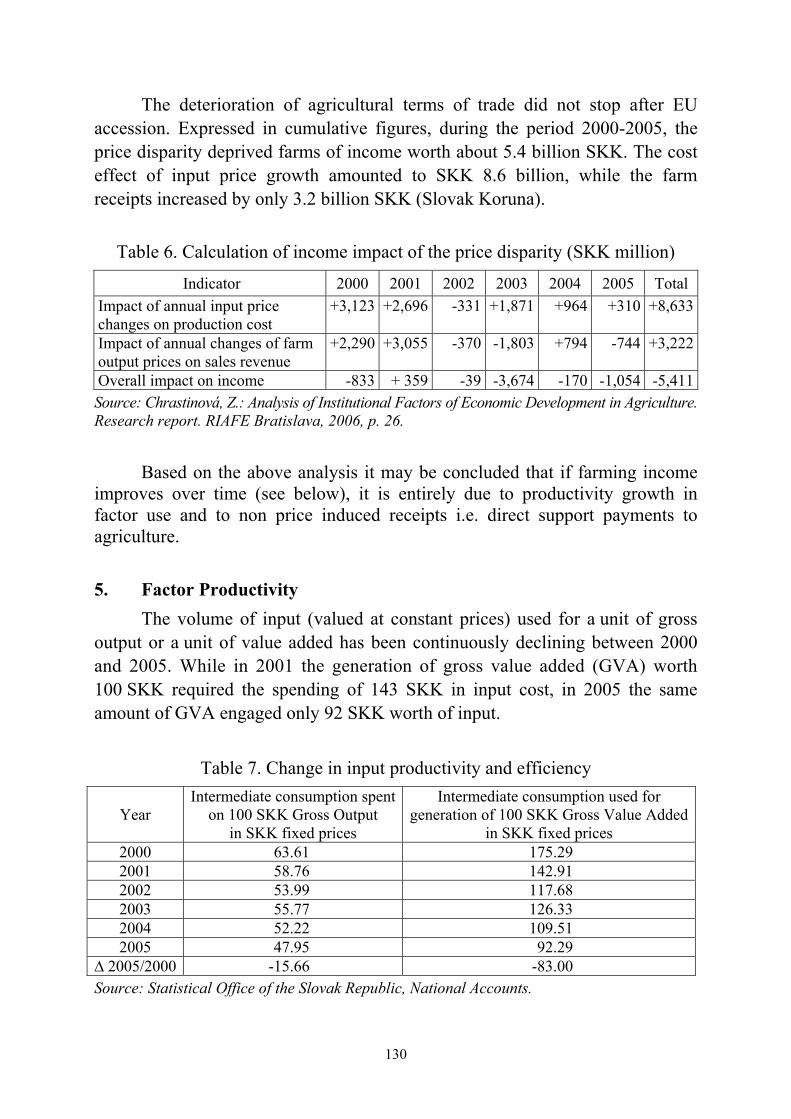
130
The deterioration of agricultural terms of trade did not stop after EU accession. Expressed in cumulative figures, during the period 2000-2005, the price disparity deprived farms of income worth about 5.4 billion SKK. The cost effect of input price growth amounted to SKK 8.6 billion, while the farm receipts increased by only 3.2 billion SKK (Slovak Koruna).
Table 6. Calculation of income impact of the price disparity (SKK million)
Indicator 2000 2001 2002 2003 2004 2005 Total Impact of annual input price changes on production cost
+3,123 +2,696 -331 +1,871 +964 +310 +8,633
Impact of annual changes of farm output prices on sales revenue
+2,290 +3,055 -370 -1,803 +794 -744 +3,222
Overall impact on income -833 + 359 -39 -3,674 -170 -1,054 -5,411Source: Chrastinová, Z.: Analysis of Institutional Factors of Economic Development in Agriculture. Research report. RIAFE Bratislava, 2006, p. 26.
Based on the above analysis it may be concluded that if farming income improves over time (see below), it is entirely due to productivity growth in factor use and to non price induced receipts i.e. direct support payments to agriculture.
5. Factor Productivity The volume of input (valued at constant prices) used for a unit of gross
output or a unit of value added has been continuously declining between 2000 and 2005. While in 2001 the generation of gross value added (GVA) worth 100 SKK required the spending of 143 SKK in input cost, in 2005 the same amount of GVA engaged only 92 SKK worth of input.
Table 7. Change in input productivity and efficiency
Year Intermediate consumption spent
on 100 SKK Gross Output in SKK fixed prices
Intermediate consumption used for generation of 100 SKK Gross Value Added
in SKK fixed prices 2000 63.61 175.29 2001 58.76 142.91 2002 53.99 117.68 2003 55.77 126.33 2004 52.22 109.51 2005 47.95 92.29
∆ 2005/2000 -15.66 -83.00 Source: Statistical Office of the Slovak Republic, National Accounts.
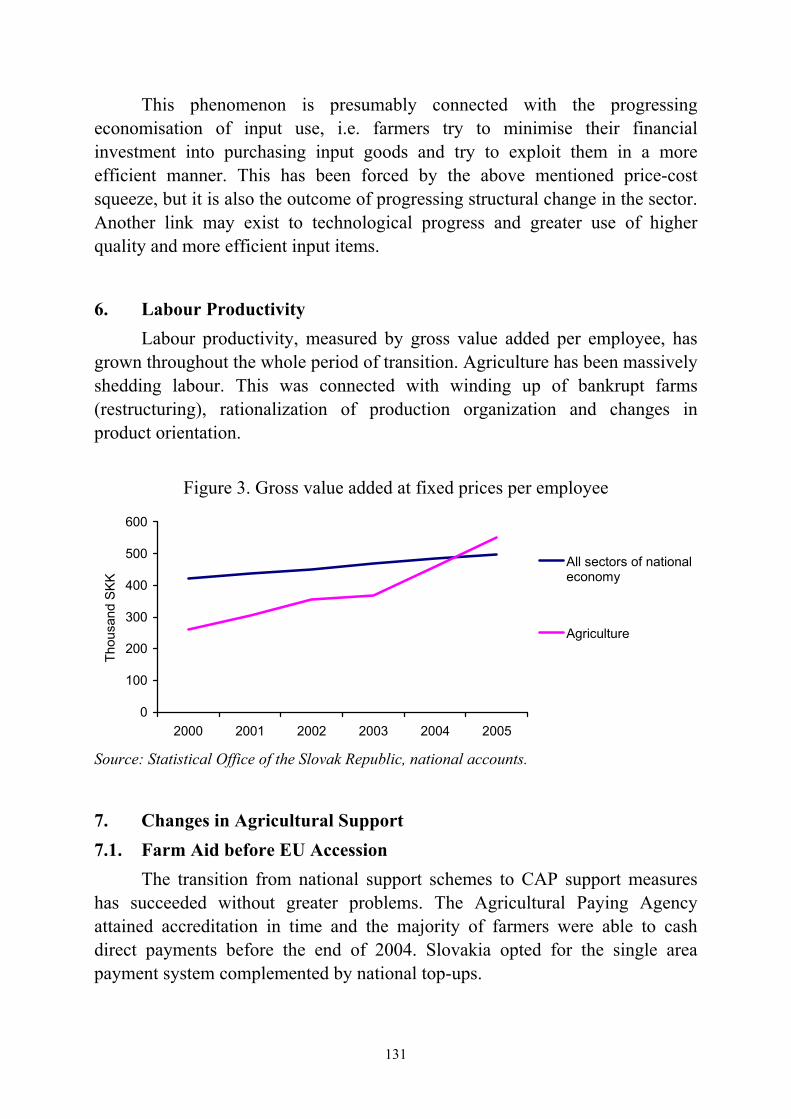
131
This phenomenon is presumably connected with the progressing economisation of input use, i.e. farmers try to minimise their financial investment into purchasing input goods and try to exploit them in a more efficient manner. This has been forced by the above mentioned price-cost squeeze, but it is also the outcome of progressing structural change in the sector. Another link may exist to technological progress and greater use of higher quality and more efficient input items.
6. Labour Productivity Labour productivity, measured by gross value added per employee, has
grown throughout the whole period of transition. Agriculture has been massively shedding labour. This was connected with winding up of bankrupt farms (restructuring), rationalization of production organization and changes in product orientation.
Figure 3. Gross value added at fixed prices per employee
0
100
200
300
400
500
600
2000 2001 2002 2003 2004 2005
Thou
sand
SKK
All sectors of nationaleconomy
Agriculture
Source: Statistical Office of the Slovak Republic, national accounts.
7. Changes in Agricultural Support 7.1. Farm Aid before EU Accession
The transition from national support schemes to CAP support measures has succeeded without greater problems. The Agricultural Paying Agency attained accreditation in time and the majority of farmers were able to cash direct payments before the end of 2004. Slovakia opted for the single area payment system complemented by national top-ups.
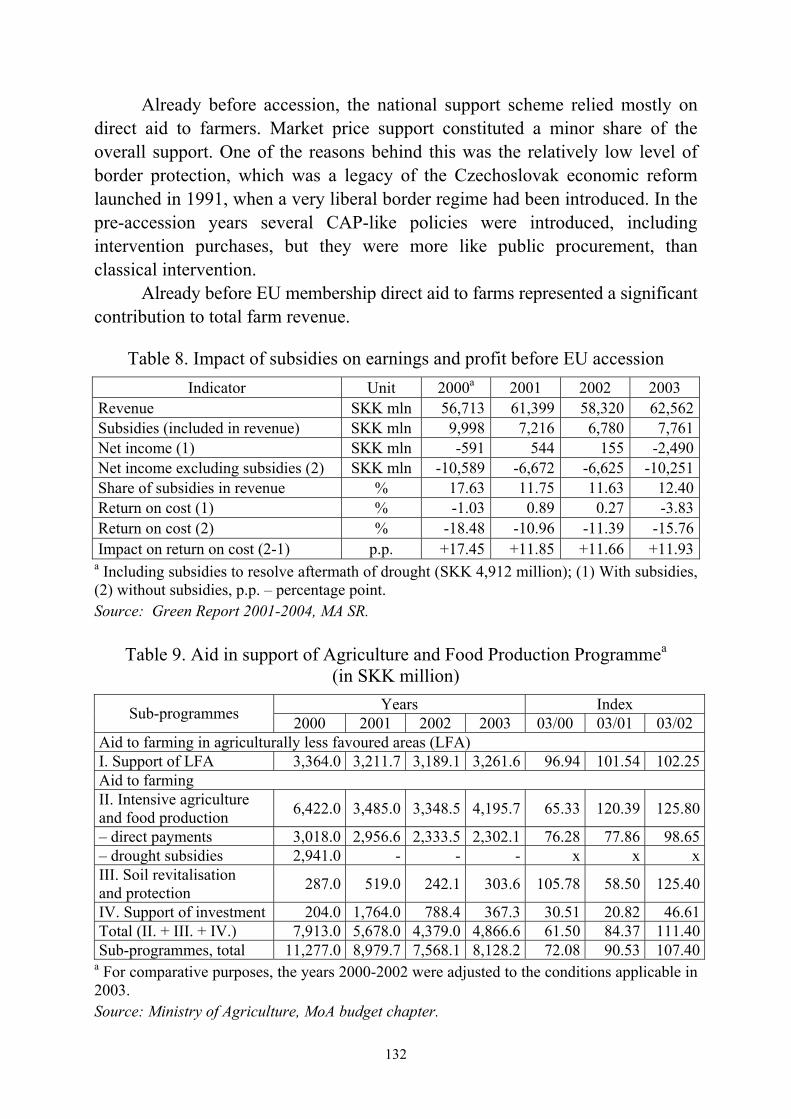
132
Already before accession, the national support scheme relied mostly on direct aid to farmers. Market price support constituted a minor share of the overall support. One of the reasons behind this was the relatively low level of border protection, which was a legacy of the Czechoslovak economic reform launched in 1991, when a very liberal border regime had been introduced. In the pre-accession years several CAP-like policies were introduced, including intervention purchases, but they were more like public procurement, than classical intervention.
Already before EU membership direct aid to farms represented a significant contribution to total farm revenue.
Table 8. Impact of subsidies on earnings and profit before EU accession Indicator Unit 2000a 2001 2002 2003
Revenue SKK mln 56,713 61,399 58,320 62,562Subsidies (included in revenue) SKK mln 9,998 7,216 6,780 7,761Net income (1) SKK mln -591 544 155 -2,490Net income excluding subsidies (2) SKK mln -10,589 -6,672 -6,625 -10,251Share of subsidies in revenue % 17.63 11.75 11.63 12.40Return on cost (1) % -1.03 0.89 0.27 -3.83Return on cost (2) % -18.48 -10.96 -11.39 -15.76Impact on return on cost (2-1) p.p. +17.45 +11.85 +11.66 +11.93
a Including subsidies to resolve aftermath of drought (SKK 4,912 million); (1) With subsidies, (2) without subsidies, p.p. – percentage point. Source: Green Report 2001-2004, MA SR.
Table 9. Aid in support of Agriculture and Food Production Programmea (in SKK million)
Years Index Sub-programmes 2000 2001 2002 2003 03/00 03/01 03/02 Aid to farming in agriculturally less favoured areas (LFA) I. Support of LFA 3,364.0 3,211.7 3,189.1 3,261.6 96.94 101.54 102.25Aid to farming II. Intensive agriculture and food production 6,422.0 3,485.0 3,348.5 4,195.7 65.33 120.39 125.80
– direct payments 3,018.0 2,956.6 2,333.5 2,302.1 76.28 77.86 98.65– drought subsidies 2,941.0 - - - x x xIII. Soil revitalisation and protection 287.0 519.0 242.1 303.6 105.78 58.50 125.40
IV. Support of investment 204.0 1,764.0 788.4 367.3 30.51 20.82 46.61Total (II. + III. + IV.) 7,913.0 5,678.0 4,379.0 4,866.6 61.50 84.37 111.40Sub-programmes, total 11,277.0 8,979.7 7,568.1 8,128.2 72.08 90.53 107.40
a For comparative purposes, the years 2000-2002 were adjusted to the conditions applicable in 2003. Source: Ministry of Agriculture, MoA budget chapter.
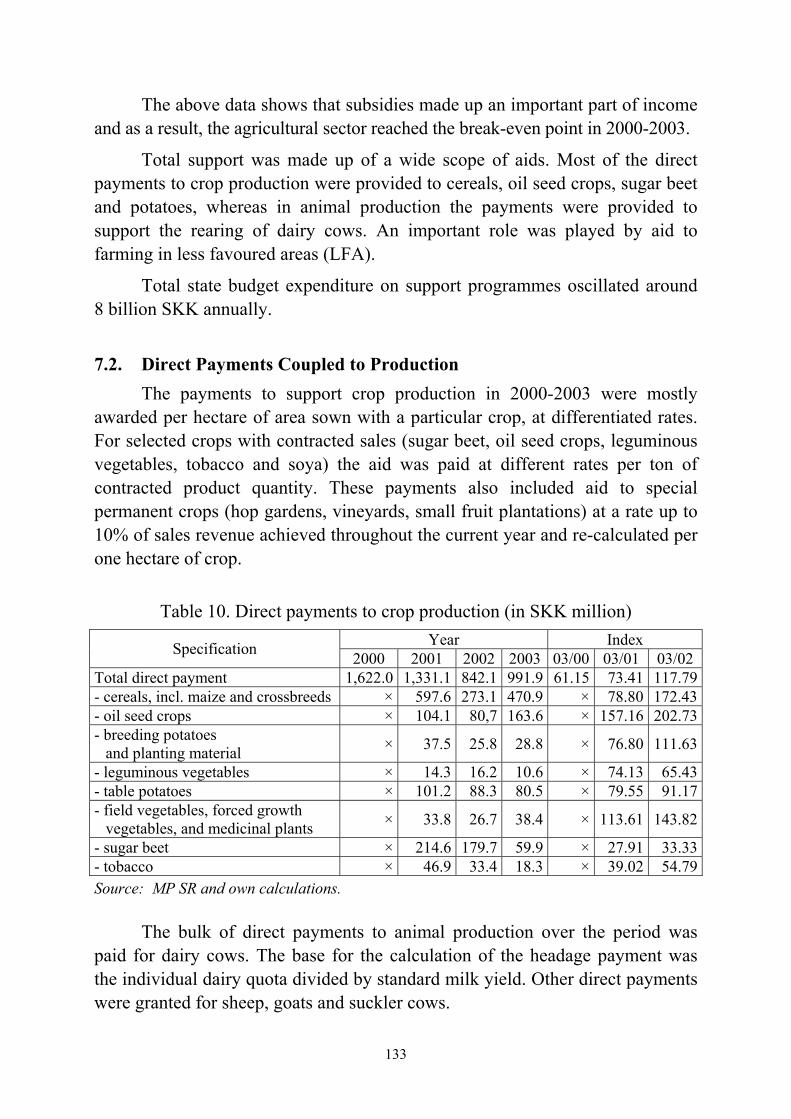
133
The above data shows that subsidies made up an important part of income and as a result, the agricultural sector reached the break-even point in 2000-2003.
Total support was made up of a wide scope of aids. Most of the direct payments to crop production were provided to cereals, oil seed crops, sugar beet and potatoes, whereas in animal production the payments were provided to support the rearing of dairy cows. An important role was played by aid to farming in less favoured areas (LFA).
Total state budget expenditure on support programmes oscillated around 8 billion SKK annually.
7.2. Direct Payments Coupled to Production
The payments to support crop production in 2000-2003 were mostly awarded per hectare of area sown with a particular crop, at differentiated rates. For selected crops with contracted sales (sugar beet, oil seed crops, leguminous vegetables, tobacco and soya) the aid was paid at different rates per ton of contracted product quantity. These payments also included aid to special permanent crops (hop gardens, vineyards, small fruit plantations) at a rate up to 10% of sales revenue achieved throughout the current year and re-calculated per one hectare of crop.
Table 10. Direct payments to crop production (in SKK million)
Year Index Specification 2000 2001 2002 2003 03/00 03/01 03/02 Total direct payment 1,622.0 1,331.1 842.1 991.9 61.15 73.41 117.79- cereals, incl. maize and crossbreeds × 597.6 273.1 470.9 × 78.80 172.43- oil seed crops × 104.1 80,7 163.6 × 157.16 202.73- breeding potatoes
and planting material × 37.5 25.8 28.8 × 76.80 111.63
- leguminous vegetables × 14.3 16.2 10.6 × 74.13 65.43- table potatoes × 101.2 88.3 80.5 × 79.55 91.17- field vegetables, forced growth
vegetables, and medicinal plants × 33.8 26.7 38.4 × 113.61 143.82
- sugar beet × 214.6 179.7 59.9 × 27.91 33.33- tobacco × 46.9 33.4 18.3 × 39.02 54.79Source: MP SR and own calculations.
The bulk of direct payments to animal production over the period was paid for dairy cows. The base for the calculation of the headage payment was the individual dairy quota divided by standard milk yield. Other direct payments were granted for sheep, goats and suckler cows.
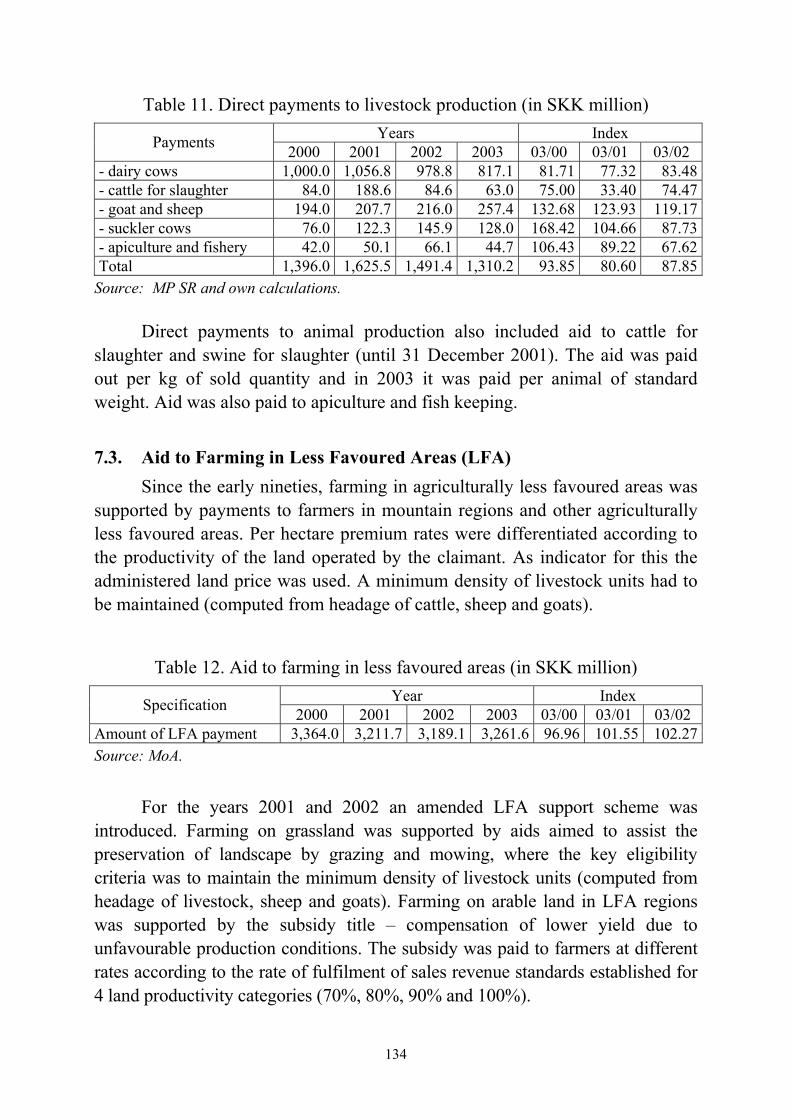
134
Table 11. Direct payments to livestock production (in SKK million) Years Index Payments 2000 2001 2002 2003 03/00 03/01 03/02
- dairy cows 1,000.0 1,056.8 978.8 817.1 81.71 77.32 83.48- cattle for slaughter 84.0 188.6 84.6 63.0 75.00 33.40 74.47- goat and sheep 194.0 207.7 216.0 257.4 132.68 123.93 119.17- suckler cows 76.0 122.3 145.9 128.0 168.42 104.66 87.73- apiculture and fishery 42.0 50.1 66.1 44.7 106.43 89.22 67.62Total 1,396.0 1,625.5 1,491.4 1,310.2 93.85 80.60 87.85
Source: MP SR and own calculations.
Direct payments to animal production also included aid to cattle for slaughter and swine for slaughter (until 31 December 2001). The aid was paid out per kg of sold quantity and in 2003 it was paid per animal of standard weight. Aid was also paid to apiculture and fish keeping.
7.3. Aid to Farming in Less Favoured Areas (LFA)
Since the early nineties, farming in agriculturally less favoured areas was supported by payments to farmers in mountain regions and other agriculturally less favoured areas. Per hectare premium rates were differentiated according to the productivity of the land operated by the claimant. As indicator for this the administered land price was used. A minimum density of livestock units had to be maintained (computed from headage of cattle, sheep and goats).
Table 12. Aid to farming in less favoured areas (in SKK million) Year Index Specification 2000 2001 2002 2003 03/00 03/01 03/02
Amount of LFA payment 3,364.0 3,211.7 3,189.1 3,261.6 96.96 101.55 102.27Source: MoA.
For the years 2001 and 2002 an amended LFA support scheme was introduced. Farming on grassland was supported by aids aimed to assist the preservation of landscape by grazing and mowing, where the key eligibility criteria was to maintain the minimum density of livestock units (computed from headage of livestock, sheep and goats). Farming on arable land in LFA regions was supported by the subsidy title – compensation of lower yield due to unfavourable production conditions. The subsidy was paid to farmers at different rates according to the rate of fulfilment of sales revenue standards established for 4 land productivity categories (70%, 80%, 90% and 100%).
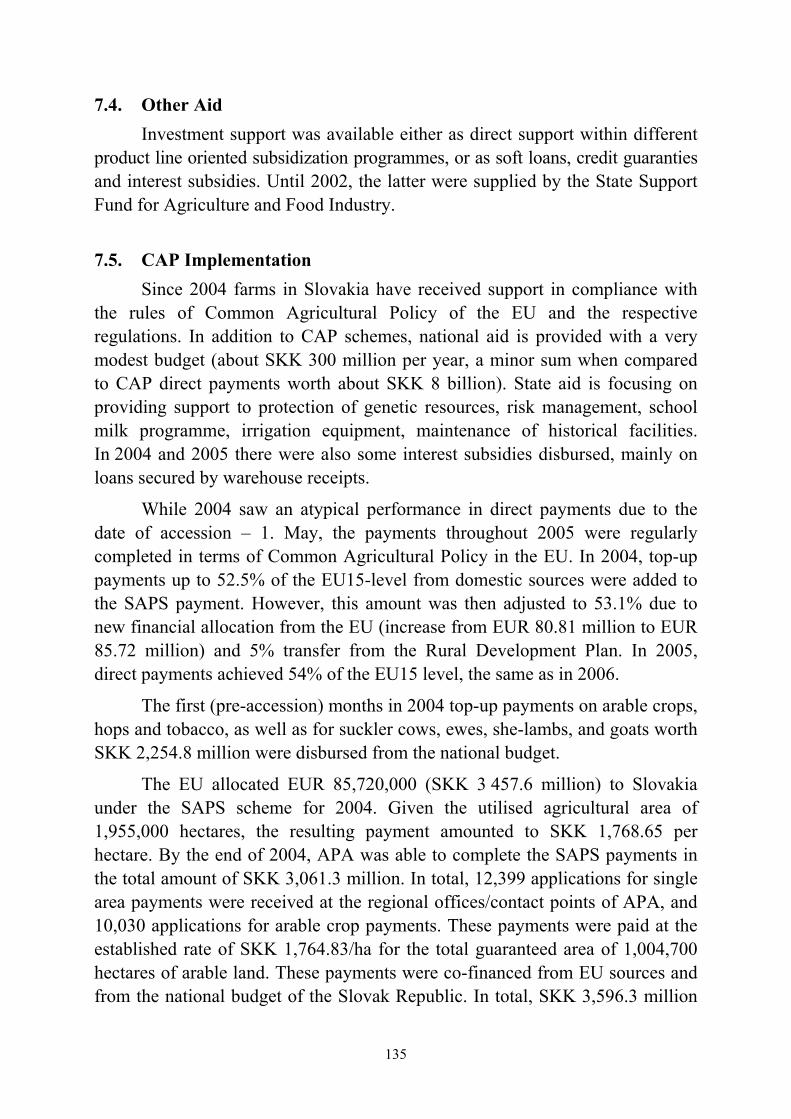
135
7.4. Other Aid Investment support was available either as direct support within different
product line oriented subsidization programmes, or as soft loans, credit guaranties and interest subsidies. Until 2002, the latter were supplied by the State Support Fund for Agriculture and Food Industry.
7.5. CAP Implementation
Since 2004 farms in Slovakia have received support in compliance with the rules of Common Agricultural Policy of the EU and the respective regulations. In addition to CAP schemes, national aid is provided with a very modest budget (about SKK 300 million per year, a minor sum when compared to CAP direct payments worth about SKK 8 billion). State aid is focusing on providing support to protection of genetic resources, risk management, school milk programme, irrigation equipment, maintenance of historical facilities. In 2004 and 2005 there were also some interest subsidies disbursed, mainly on loans secured by warehouse receipts.
While 2004 saw an atypical performance in direct payments due to the date of accession – 1. May, the payments throughout 2005 were regularly completed in terms of Common Agricultural Policy in the EU. In 2004, top-up payments up to 52.5% of the EU15-level from domestic sources were added to the SAPS payment. However, this amount was then adjusted to 53.1% due to new financial allocation from the EU (increase from EUR 80.81 million to EUR 85.72 million) and 5% transfer from the Rural Development Plan. In 2005, direct payments achieved 54% of the EU15 level, the same as in 2006.
The first (pre-accession) months in 2004 top-up payments on arable crops, hops and tobacco, as well as for suckler cows, ewes, she-lambs, and goats worth SKK 2,254.8 million were disbursed from the national budget.
The EU allocated EUR 85,720,000 (SKK 3 457.6 million) to Slovakia under the SAPS scheme for 2004. Given the utilised agricultural area of 1,955,000 hectares, the resulting payment amounted to SKK 1,768.65 per hectare. By the end of 2004, APA was able to complete the SAPS payments in the total amount of SKK 3,061.3 million. In total, 12,399 applications for single area payments were received at the regional offices/contact points of APA, and 10,030 applications for arable crop payments. These payments were paid at the established rate of SKK 1,764.83/ha for the total guaranteed area of 1,004,700 hectares of arable land. These payments were co-financed from EU sources and from the national budget of the Slovak Republic. In total, SKK 3,596.3 million
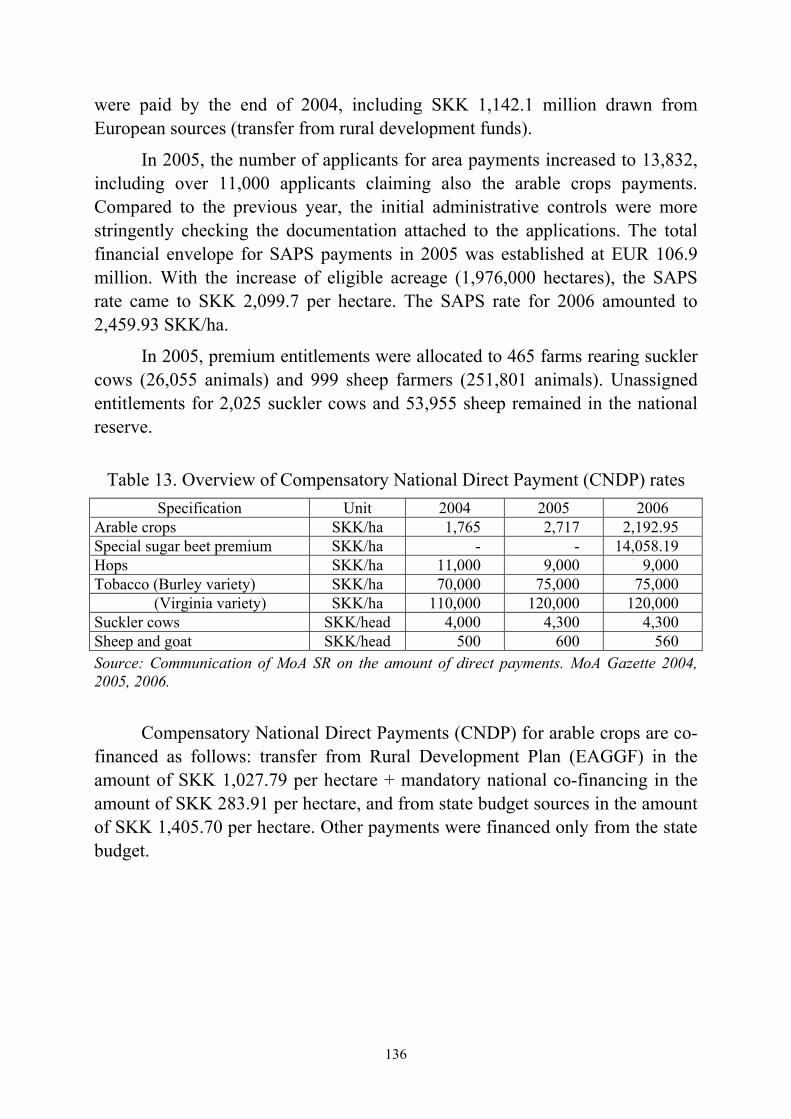
136
were paid by the end of 2004, including SKK 1,142.1 million drawn from European sources (transfer from rural development funds).
In 2005, the number of applicants for area payments increased to 13,832, including over 11,000 applicants claiming also the arable crops payments. Compared to the previous year, the initial administrative controls were more stringently checking the documentation attached to the applications. The total financial envelope for SAPS payments in 2005 was established at EUR 106.9 million. With the increase of eligible acreage (1,976,000 hectares), the SAPS rate came to SKK 2,099.7 per hectare. The SAPS rate for 2006 amounted to 2,459.93 SKK/ha.
In 2005, premium entitlements were allocated to 465 farms rearing suckler cows (26,055 animals) and 999 sheep farmers (251,801 animals). Unassigned entitlements for 2,025 suckler cows and 53,955 sheep remained in the national reserve.
Table 13. Overview of Compensatory National Direct Payment (CNDP) rates
Specification Unit 2004 2005 2006 Arable crops SKK/ha 1,765 2,717 2,192.95 Special sugar beet premium SKK/ha - - 14,058.19 Hops SKK/ha 11,000 9,000 9,000 Tobacco (Burley variety) SKK/ha 70,000 75,000 75,000
(Virginia variety) SKK/ha 110,000 120,000 120,000 Suckler cows SKK/head 4,000 4,300 4,300 Sheep and goat SKK/head 500 600 560 Source: Communication of MoA SR on the amount of direct payments. MoA Gazette 2004, 2005, 2006.
Compensatory National Direct Payments (CNDP) for arable crops are co-financed as follows: transfer from Rural Development Plan (EAGGF) in the amount of SKK 1,027.79 per hectare + mandatory national co-financing in the amount of SKK 283.91 per hectare, and from state budget sources in the amount of SKK 1,405.70 per hectare. Other payments were financed only from the state budget.
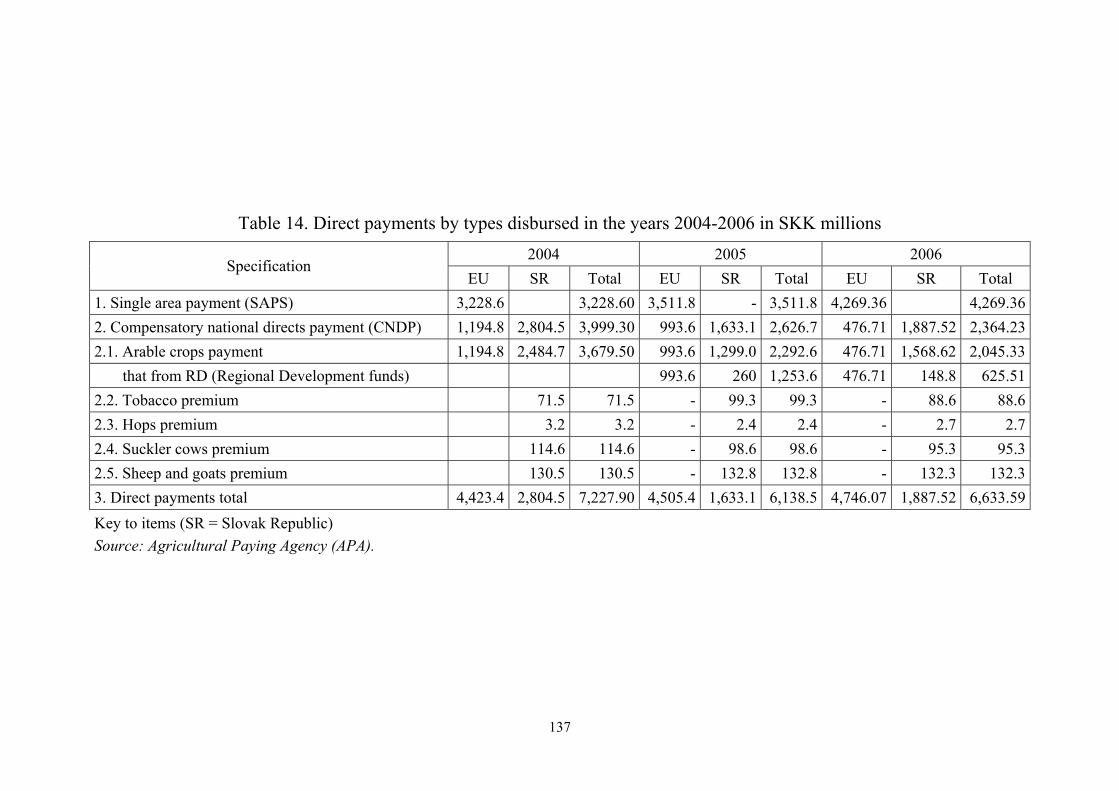
137
Table 14. Direct payments by types disbursed in the years 2004-2006 in SKK millions 2004 2005 2006
Specification EU SR Total EU SR Total EU SR Total
1. Single area payment (SAPS) 3,228.6 3,228.60 3,511.8 - 3,511.8 4,269.36 4,269.36 2. Compensatory national directs payment (CNDP) 1,194.8 2,804.5 3,999.30 993.6 1,633.1 2,626.7 476.71 1,887.52 2,364.23 2.1. Arable crops payment 1,194.8 2,484.7 3,679.50 993.6 1,299.0 2,292.6 476.71 1,568.62 2,045.33
that from RD (Regional Development funds) 993.6 260 1,253.6 476.71 148.8 625.51 2.2. Tobacco premium 71.5 71.5 - 99.3 99.3 - 88.6 88.6 2.3. Hops premium 3.2 3.2 - 2.4 2.4 - 2.7 2.7 2.4. Suckler cows premium 114.6 114.6 - 98.6 98.6 - 95.3 95.3 2.5. Sheep and goats premium 130.5 130.5 - 132.8 132.8 - 132.3 132.3 3. Direct payments total 4,423.4 2,804.5 7,227.90 4,505.4 1,633.1 6,138.5 4,746.07 1,887.52 6,633.59 Key to items (SR = Slovak Republic) Source: Agricultural Paying Agency (APA).
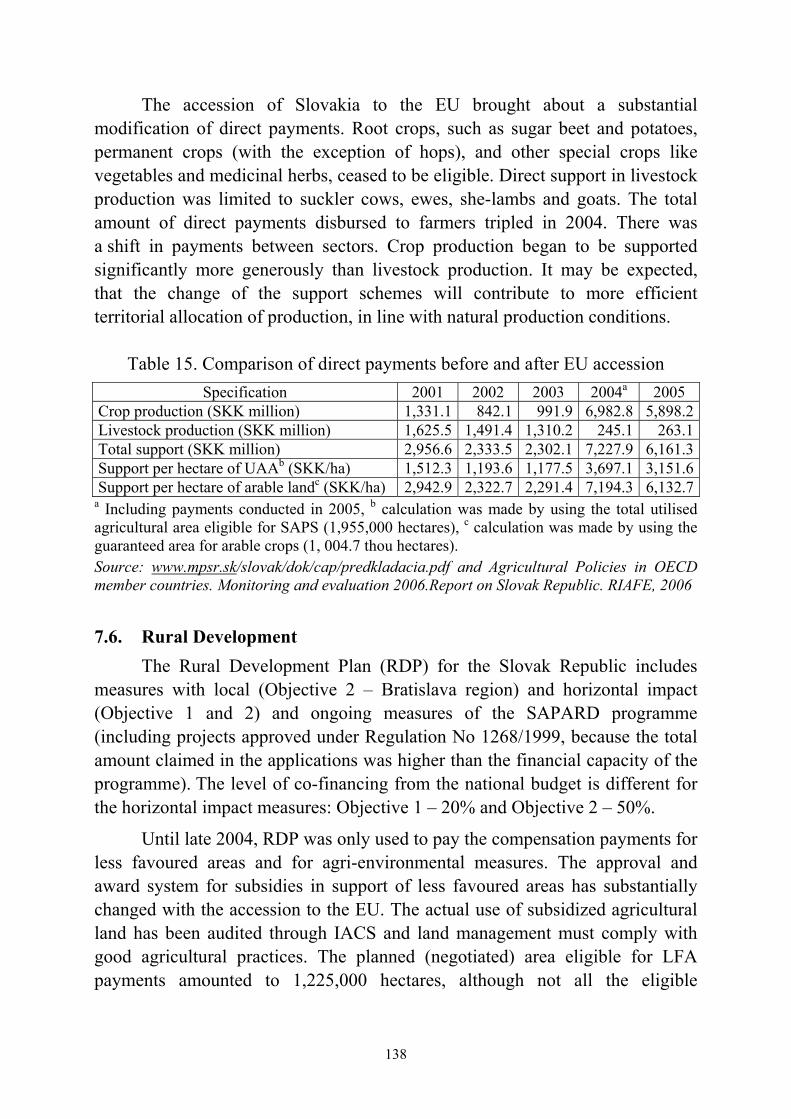
138
The accession of Slovakia to the EU brought about a substantial modification of direct payments. Root crops, such as sugar beet and potatoes, permanent crops (with the exception of hops), and other special crops like vegetables and medicinal herbs, ceased to be eligible. Direct support in livestock production was limited to suckler cows, ewes, she-lambs and goats. The total amount of direct payments disbursed to farmers tripled in 2004. There was a shift in payments between sectors. Crop production began to be supported significantly more generously than livestock production. It may be expected, that the change of the support schemes will contribute to more efficient territorial allocation of production, in line with natural production conditions.
Table 15. Comparison of direct payments before and after EU accession Specification 2001 2002 2003 2004a 2005
Crop production (SKK million) 1,331.1 842.1 991.9 6,982.8 5,898.2Livestock production (SKK million) 1,625.5 1,491.4 1,310.2 245.1 263.1Total support (SKK million) 2,956.6 2,333.5 2,302.1 7,227.9 6,161.3Support per hectare of UAAb (SKK/ha) 1,512.3 1,193.6 1,177.5 3,697.1 3,151.6Support per hectare of arable landc (SKK/ha) 2,942.9 2,322.7 2,291.4 7,194.3 6,132.7
a Including payments conducted in 2005, b calculation was made by using the total utilised agricultural area eligible for SAPS (1,955,000 hectares), c calculation was made by using the guaranteed area for arable crops (1, 004.7 thou hectares). Source: www.mpsr.sk/slovak/dok/cap/predkladacia.pdf and Agricultural Policies in OECD member countries. Monitoring and evaluation 2006.Report on Slovak Republic. RIAFE, 2006
7.6. Rural Development The Rural Development Plan (RDP) for the Slovak Republic includes
measures with local (Objective 2 – Bratislava region) and horizontal impact (Objective 1 and 2) and ongoing measures of the SAPARD programme (including projects approved under Regulation No 1268/1999, because the total amount claimed in the applications was higher than the financial capacity of the programme). The level of co-financing from the national budget is different for the horizontal impact measures: Objective 1 – 20% and Objective 2 – 50%.
Until late 2004, RDP was only used to pay the compensation payments for less favoured areas and for agri-environmental measures. The approval and award system for subsidies in support of less favoured areas has substantially changed with the accession to the EU. The actual use of subsidized agricultural land has been audited through IACS and land management must comply with good agricultural practices. The planned (negotiated) area eligible for LFA payments amounted to 1,225,000 hectares, although not all the eligible
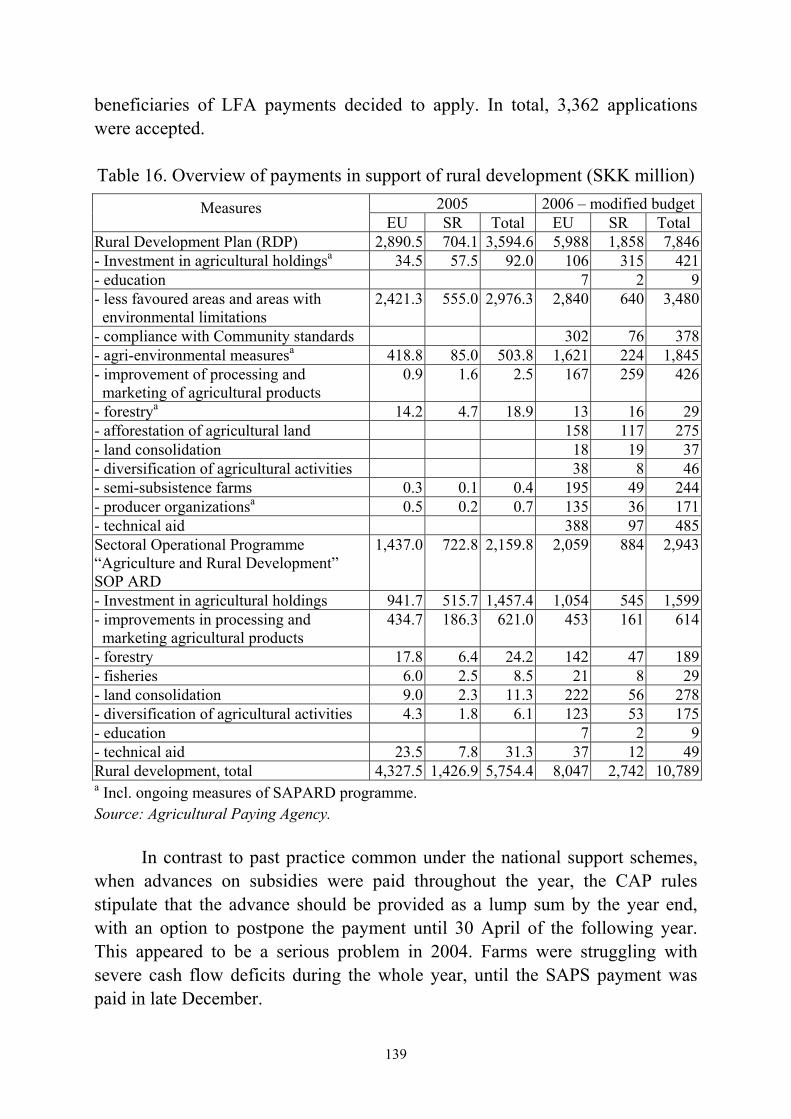
139
beneficiaries of LFA payments decided to apply. In total, 3,362 applications were accepted. Table 16. Overview of payments in support of rural development (SKK million)
2005 2006 – modified budgetMeasures EU SR Total EU SR Total
Rural Development Plan (RDP) 2,890.5 704.1 3,594.6 5,988 1,858 7,846 - Investment in agricultural holdingsa 34.5 57.5 92.0 106 315 421- education 7 2 9- less favoured areas and areas with environmental limitations
2,421.3 555.0 2,976.3 2,840 640 3,480
- compliance with Community standards 302 76 378- agri-environmental measuresa 418.8 85.0 503.8 1,621 224 1,845- improvement of processing and marketing of agricultural products
0.9 1.6 2.5 167 259 426
- forestrya 14.2 4.7 18.9 13 16 29- afforestation of agricultural land 158 117 275- land consolidation 18 19 37- diversification of agricultural activities 38 8 46- semi-subsistence farms 0.3 0.1 0.4 195 49 244- producer organizationsa 0.5 0.2 0.7 135 36 171- technical aid 388 97 485Sectoral Operational Programme “Agriculture and Rural Development” SOP ARD
1,437.0 722.8 2,159.8 2,059 884 2,943
- Investment in agricultural holdings 941.7 515.7 1,457.4 1,054 545 1,599- improvements in processing and marketing agricultural products
434.7 186.3 621.0 453 161 614
- forestry 17.8 6.4 24.2 142 47 189- fisheries 6.0 2.5 8.5 21 8 29- land consolidation 9.0 2.3 11.3 222 56 278- diversification of agricultural activities 4.3 1.8 6.1 123 53 175- education 7 2 9- technical aid 23.5 7.8 31.3 37 12 49Rural development, total 4,327.5 1,426.9 5,754.4 8,047 2,742 10,789a Incl. ongoing measures of SAPARD programme. Source: Agricultural Paying Agency.
In contrast to past practice common under the national support schemes,
when advances on subsidies were paid throughout the year, the CAP rules stipulate that the advance should be provided as a lump sum by the year end, with an option to postpone the payment until 30 April of the following year. This appeared to be a serious problem in 2004. Farms were struggling with severe cash flow deficits during the whole year, until the SAPS payment was paid in late December.
140
In 2004, the amount of EUR 77,615 million was allocated to LFA payments and for the subsequent year the limit for LFA payments was set at EUR 81,251 million.
The Sectoral Operational Programme “Agriculture and Rural Development” (SOP ARD) included measures for Objective 1, co-financed from Structural Funds – EAGGF and FIFG Guidance Section: 1,056 projects were submitted in 2004, of which 838 projects were approved, totalling SKK 4.75 billion in public expenditure, representing almost half of the funds from the total limit of public expenditure in 2004-2006, allocated to individual measures under SOP ARD.
7.7. SAPARD Programme
Even though the SAPARD programme supports rural development measures, the programme should be evaluated separately due to its special nature of funding (pre-accession aid). In total, 947 projects were approved from the programme inception in 2001 until late 2003. Since 2004 new projects were not accepted. Based on the Multi Annual Financial Agreement and Annual Financial Agreements between the European Commission and the Slovak Republic, the funding of this programme continued until the end of 2006.
In 2006, APA completed the process of acceptance, evaluation and contracting of applications for financial contributions under the Sectoral Operation Programme Agriculture and Rural Development 2004-2006 (SOP ARD), and under the Rural Development Plan of the Slovak Republic (RDP). The approved projects will receive funding until the end of 2008.
The funding of projects contracted under the pre-accession SAPARD programme was completed by the end of 2006.
7.8. Farm Level Impacts of CAP Implementation
Corporate farms, which operate about 80% of agricultural land in Slovakia, attained returns which overran their costs during the past 6 years (except for 2003). Accountancy data indicate that profitability has generally improved after EU accession. The proportion of profitable farms has slightly increased (from 73% to 79%) after the accession. All the three years, from which data are available, show moderate profits in aggregate figures. Profit per hectare of land is showing regional deviations.
Changes in farm behaviour after the accession are visible in two important indicators: the scale of investments and new loans. Corporate farms managed to double the per hectare value of acquisition of fixed assets in 2005 against 2003.
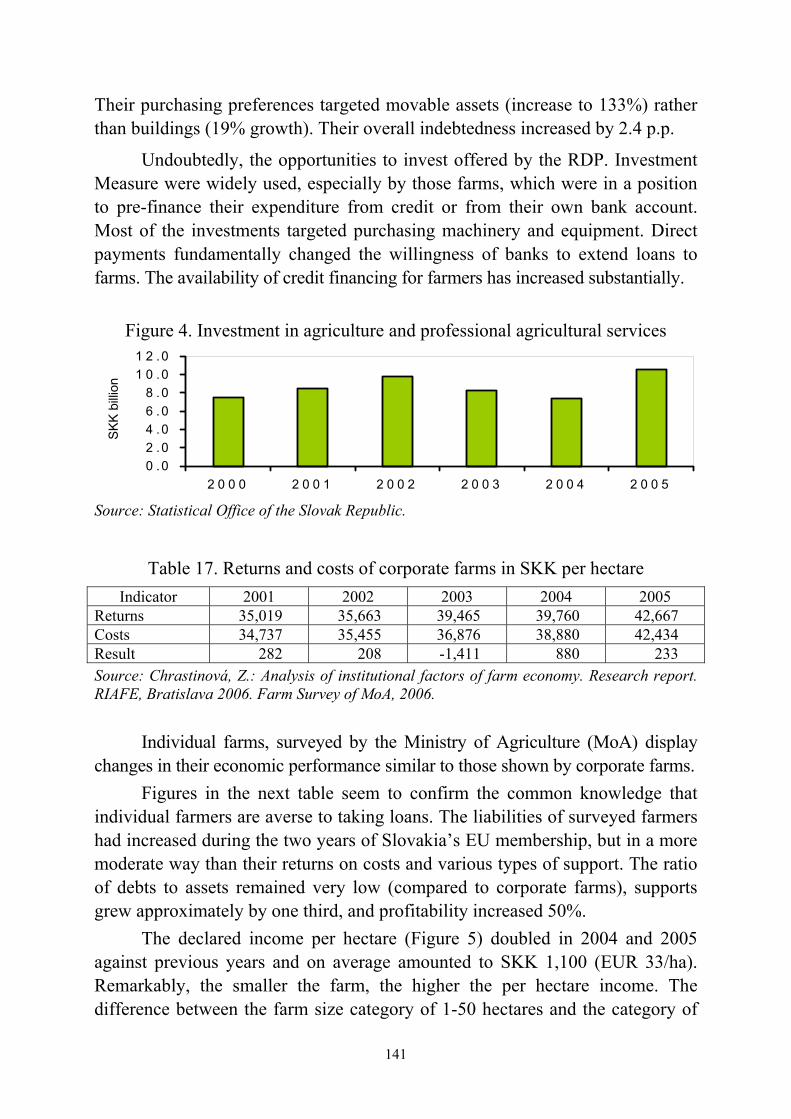
141
Their purchasing preferences targeted movable assets (increase to 133%) rather than buildings (19% growth). Their overall indebtedness increased by 2.4 p.p.
Undoubtedly, the opportunities to invest offered by the RDP. Investment Measure were widely used, especially by those farms, which were in a position to pre-finance their expenditure from credit or from their own bank account. Most of the investments targeted purchasing machinery and equipment. Direct payments fundamentally changed the willingness of banks to extend loans to farms. The availability of credit financing for farmers has increased substantially.
Figure 4. Investment in agriculture and professional agricultural services
0 .02 .04 .06 .08 .0
1 0 .01 2 .0
2 0 0 0 2 0 0 1 2 0 0 2 2 0 0 3 2 0 0 4 2 0 0 5
SKK
billio
n
Source: Statistical Office of the Slovak Republic.
Table 17. Returns and costs of corporate farms in SKK per hectare Indicator 2001 2002 2003 2004 2005
Returns 35,019 35,663 39,465 39,760 42,667 Costs 34,737 35,455 36,876 38,880 42,434 Result 282 208 -1,411 880 233 Source: Chrastinová, Z.: Analysis of institutional factors of farm economy. Research report. RIAFE, Bratislava 2006. Farm Survey of MoA, 2006.
Individual farms, surveyed by the Ministry of Agriculture (MoA) display changes in their economic performance similar to those shown by corporate farms.
Figures in the next table seem to confirm the common knowledge that individual farmers are averse to taking loans. The liabilities of surveyed farmers had increased during the two years of Slovakia’s EU membership, but in a more moderate way than their returns on costs and various types of support. The ratio of debts to assets remained very low (compared to corporate farms), supports grew approximately by one third, and profitability increased 50%.
The declared income per hectare (Figure 5) doubled in 2004 and 2005 against previous years and on average amounted to SKK 1,100 (EUR 33/ha). Remarkably, the smaller the farm, the higher the per hectare income. The difference between the farm size category of 1-50 hectares and the category of

142
over 500 ha is approximately 100%, in the 6-year average. This difference is obviously influenced by different use of family versus hired labour. In the largest farms, more extensive use of paid labour is obviously reducing the reported income.
Figure 5. Income of individual farmer by scale of farmed land
(in SKK per hectare)
-1,000
-500
0
500
1,000
1,500
2,000
2,500
2000 2001 2002 2003 2004 2005
0,1-50
51-100
101-500
over 500
Source: Chrastinová, Z.: Analysis of institutional factors of farm economy. Research report. RIAFE Bratislava, 2006. Farm Survey of MoA, 2006. Table 18. Economics of an individual farm (average values of surveyed sample)
Indicator Unit 2000 2001 2002 2003 2004 2005 AverageFarmed area ha 130 139 140 143 139 141 139 Support to current operations SKK’000 489 375 365 409 683 663 499 Investment support SKK’000 81 127 79 58 45 177 96 Result SKK’000 32 4 110 95 163 168 95 Proportion of profitable farms % 69 71 80 76 86 84 78 Returns on costs % 1.08 0.14 3.26 3.32 4.86 5.05 3.00 Assets SKK’000 2,828 3,071 3,344 3,092 3,547 4,005 3,321 Liabilities SKK’000 597 625 768 769 988 1184 822 Receivables SKK’000 465 473 526 459 572 721 537 Debts to assets ratio % 21.12 20.35 22.95 24.88 27.87 29.58 24.75 Source: Chrastinová, Z.: Analysis of institutional factors of farm economy. Research report. RIAFE Bratislava, 2006. Farm Survey of MoA, 2006.
Farms sized over 100 hectares and over 500 hectares earned the same amount per hectare after EU accession. This might be the effect of the decoupled area payment and arable crops payment. The weight of those payments in the per hectare income of farms with larger land endowment, which brings a certain production pattern with it, has obviously increased.
143
7.9. Production Response to CAP Implementation In the RIAFE, several analyses have been made on agricultural production
changes in the country’s natural agricultural regions, which have taken place in recent years. In summary, the findings of these studies are as follows:
• Changes in the structure of agricultural output, among which the permanent decline of livestock production is a reality, continued. The overall physical output has been stagnating also in the years after EU accession.
• In the cereals sector, the area sown has stabilised and yields have increased. Nevertheless, the year to year fluctuation of areas sown by different kinds of cereals has been influenced by the volatility of weather conditions and yields. Oilseed production expanded, but the regional allocation of production areas changed. The planted area of potatoes has been shrinking, but potato growing is moving to more productive regions. The production of fodder on arable land has decreased, mainly due to falling headage of cattle. Also the permanent grass area decreased, but the intensity of its utilisation has been growing. The reduction of grassland area was a result of the more stringent registration of utilised agricultural land under the Land Parcel Identification System.
• As already mentioned, the headage of cattle has been falling, but the productivity in the dairy, but also in the beef sector, has been growing. Pork production has been permanently under the pressure of competitive imports, the headage of swine has been unstable and is currently in decline. Poultry production immediately after the accession plummeted, but later on it recovered and is currently increasing. The headage of sheep and lamb is about to rise.
• The general observation can be made that changes in the regional production structure have been on the way. The overall direction of relocation of production is towards the most productive regions in western and southern parts of the country, where the intensity of land use is about to grow.
8. Summary and Conclusions
The period, over which the effects of EU membership in agriculture and the food sector can be empirically measured, is too short to provide valid judgments. Nevertheless, some conclusions may be drawn.
Above all, we should note the positive development of returns from agricultural activity, which is a consequence of the increased volume of financial aid to the sector. This is the reality, despite the unfavourable producer
144
price development and the continuous worsening of terms of trade, which did not stop during the years of EU membership. The regional allocation of direct payments (including LFA support) significantly influences the profitability of farm production in different parts of the country. A significant contribution is made by the rural development programmes, especially towards capital investment, modernisation and technical refurbishment of the sector.
The growth of input factor productivity (especially that of labour) is continuing and better access to efficient inputs increases the productivity of commodity sectors, especially in the highly productive regions. Regional productivity differentiation is progressing, but this does not apply to the differentiation of incomes. The system of decoupled payments (together with LFA and environmental payments) generates equitable distribution of incomes.
One of the most evident effects of implementation of the CAP support system is the radical improvement in the financing of farm operations. The supply of bank credits has immensely widened and the chronically persisting problem of financing current operations has disappeared. The increased loan repayment credibility of farming entities, together with RDP support, has boosted farm investments along with their debt records.
Last but not least, it should be mentioned, that agriculture in Slovakia is heading toward the situation, where overall returns from farm operations will be increased by abandoning marginal productivity factors and giving up those activities, which show an insufficient cost to return ratio. The reduction of unprofitable production activities combined with receiving regular decoupled CAP payments is a reliable method of securing stable (and possibly growing) income. The next step should be to conduct a closer examination of the social and economic implications of the above mentioned phenomenon, from the perspective of the specific structural fabric of agriculture and rural areas in Slovakia.
References 1. Banse, M., Balkhausen, O., Blaas, G., Božík, M., Buday, S., Davidova, S., Douarin, E.,
Happe, K., Latruffe, L., Sahrbacher, Ch., Schnicke, H., Šípová, H., Uhrinčaťová, E.: Effects of the CAP Direct Payments on Slovakian Agriculture. Working paper of Joint Research Project (SSPE-CT-2003-502171) The Impact of Decoupling and Modulation in the Enlarged Union. A Sectoral and Farm Level Assessment. Lund, March 2007.
2. Blaas, G., Varoščák, J.: Slovak agricultural markets and farm income after the EU accession (Agrárny trh a príjmy poľnohospodárskych podnikov po vstupe Slovenska do EÚ). Agricultural Economics, 52, 2006, No. 1, p. 23-29. Tab. 2, graphs 7, lit. 5.
145
3. Blaas, G.: Opportunities and Challenges of the Agricultural Sector in Slovakia under the EU Membership. In: Application of the Common Agricultural Policy in the Enlarged European Union. Proceedings of International Seminar. Budapest: AKI. 2004, p. 182-189. Tab. 3. Lit. 3.
4. Blaas, G.: Slovak Agriculture Heading for the EU Membership. Agricultural Economics. ISSN 0139-570X – Vol. 49, No. 3 (2003), s. 120-127. tab. 12. Lit. 10.
5. Blaas, G., Božík, M.: Vplyv vstupu Slovenskej republiky do Európskej únie na agropotravinársky sektor a na ceny potravín. (Impact of the EU Accession on the Agro-food Sector and Food Prices). Ekonomický časopis, 50, 2002, No. 5, pp. 876-896. Tab. 12, graph 1. Lit. 20.
6. Blaas, G., Božik, M. (2006): Production-economic implications of the agrofood sector and rural adaptation to conditions of the European integration and globalization. Final stage of the Project SP 51/028 06 00/028 06 04 VUEPP, Bratislava, graphs, tables, 90 p.
7. Božík, M.: Distribučné efekty prechodu na Jednotnú platbu na farmu v poľnohospodárstva Slovenska (Distribution effects of the SFP implementation in the Slovakian agriculture). Ekonomika poľnohospodárstva (Economics of Agriculture) VI., 2006, No. 3, p. 3-12.
8. Božík, M. et all.: Analysis and Evaluation of the Changes in the Production and Economic Characteristics of Agriculture and Food Industry in connection with enforcement of CAP in the Years 2004-2005. Research report. RIAFE Bratislava, 2006.
9. Chrastinová, Z.: Analysis of Institutional Factors Influencing Economics of the Agricultural Sector in Slovakia. Research report. RIAFE, Bratislava 2006.
10. Economic Accounts for Agriculture. Statistical Office of SR 2004, 2005, 2006. 11. Report by Slovak Republic to Agricultural Policies in OECD Member Countries:
Monitoring and Evaluation. MoA and RIAFE Bratislava, 2007. 12. Report on State of Agriculture and Food in the Slovak Republic 2006. Ministry of
Agriculture SR, Bratislava, 2006. 13. Swinnen, S, Berkum, S., Božik, M.: Market Linkages in the Slovak Agri-Food Sector,
working paper No. 43, the World Bank 2006, 46 s., ISBN 80-89244-02-5.
146
Dr. Tsvetana Kovacheva, Dr. Izide Petrova Dr. Nona Malamova, Dr. Plamena Yovchevska
National Centre for Agricultural Sciences, Institute of Agricultural Economics Sofia, Bulgaria
Bulgarian Food Industry in the Pre-Accession Period:
Trends and Challenges
1. Introduction
The food, beverage and tobacco industry (FBTI) is one of the branches that mostly carried the burdens related to the accession of Bulgaria to the European Union and the necessity to promptly introduce the European standards – for food hygiene and safety, for occupational safety and health, for environmental protection, as well as the new trade rules. As a result, the branch went through substantial structural changes. Many of the small-sized enterprises that did not have the necessary financial resources to bring their products in line with the EU sanitary requirements and safety guarantees, were closed. The “grey” sector has been substantially limited and the competitive environment has improved. The possibilities for trade with the EU member states have increased and the market orientation of the enterprises in the separate branches has changed.
This report presents the results of a survey aimed at revealing the changes, trends and challenges of the development of the food industry during the pre-accession period – the pace of development of production in the branch and the sub-branches; the changes in the inter-branch structure, the availability of resources and the foreign trade turnover of foods, beverages and tobacco; the trends in changes of prices, sales and consumption of food products; the importance of the branch for the economy of the country and its prospects in the new economic environment after the accession of Bulgaria to the EU. 2. Place of the FBTI in the Country’s Economy
The food, beverage and tobacco industry is a structure-defining branch in the economy of the country. In spite of the fact that its share in the industrial production of the country for the period 2001-2005 showed a trend towards decrease – from 16.7% to 15.5%, it still has a leading position compared to the other industrial sectors (metallurgy – 14.8%, electric power, gas and water 12.4%, textile and apparel – 7.1%).
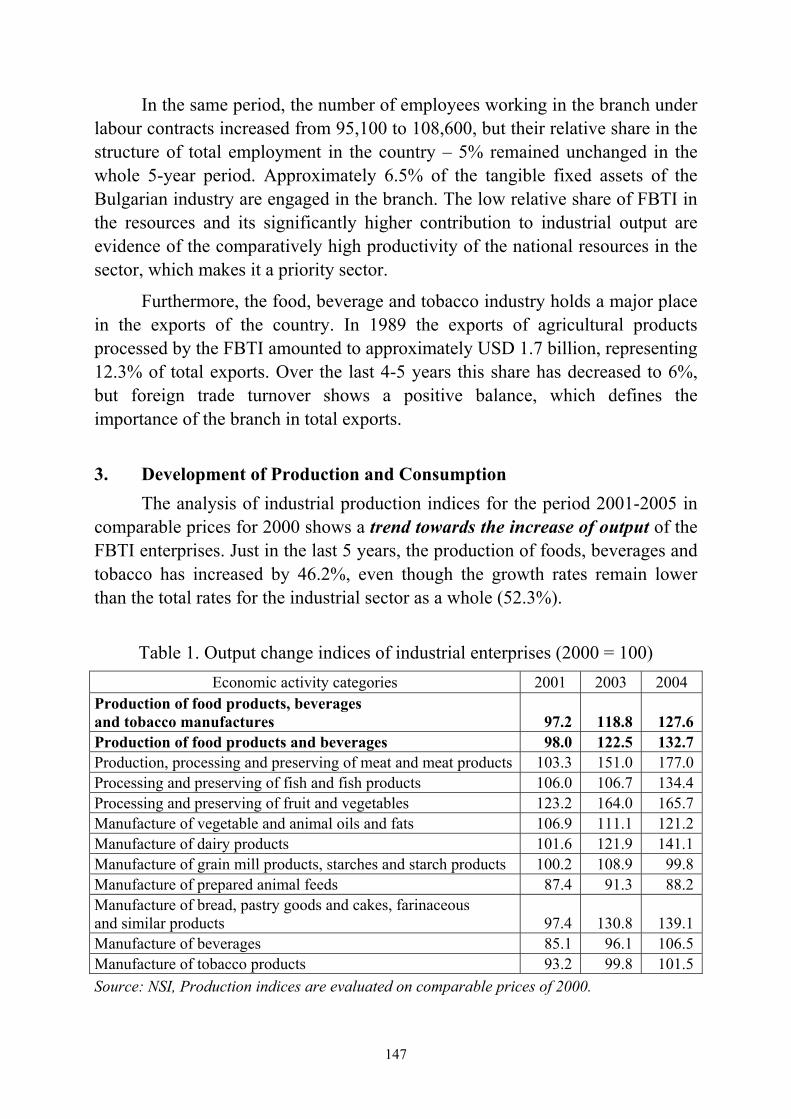
147
In the same period, the number of employees working in the branch under labour contracts increased from 95,100 to 108,600, but their relative share in the structure of total employment in the country – 5% remained unchanged in the whole 5-year period. Approximately 6.5% of the tangible fixed assets of the Bulgarian industry are engaged in the branch. The low relative share of FBTI in the resources and its significantly higher contribution to industrial output are evidence of the comparatively high productivity of the national resources in the sector, which makes it a priority sector.
Furthermore, the food, beverage and tobacco industry holds a major place in the exports of the country. In 1989 the exports of agricultural products processed by the FBTI amounted to approximately USD 1.7 billion, representing 12.3% of total exports. Over the last 4-5 years this share has decreased to 6%, but foreign trade turnover shows a positive balance, which defines the importance of the branch in total exports.
3. Development of Production and Consumption
The analysis of industrial production indices for the period 2001-2005 in comparable prices for 2000 shows a trend towards the increase of output of the FBTI enterprises. Just in the last 5 years, the production of foods, beverages and tobacco has increased by 46.2%, even though the growth rates remain lower than the total rates for the industrial sector as a whole (52.3%).
Table 1. Output change indices of industrial enterprises (2000 = 100)
Economic activity categories 2001 2003 2004 Production of food products, beverages and tobacco manufactures 97.2 118.8 127.6 Production of food products and beverages 98.0 122.5 132.7 Production, processing and preserving of meat and meat products 103.3 151.0 177.0 Processing and preserving of fish and fish products 106.0 106.7 134.4 Processing and preserving of fruit and vegetables 123.2 164.0 165.7 Manufacture of vegetable and animal oils and fats 106.9 111.1 121.2 Manufacture of dairy products 101.6 121.9 141.1 Manufacture of grain mill products, starches and starch products 100.2 108.9 99.8 Manufacture of prepared animal feeds 87.4 91.3 88.2 Manufacture of bread, pastry goods and cakes, farinaceous and similar products 97.4 130.8 139.1 Manufacture of beverages 85.1 96.1 106.5 Manufacture of tobacco products 93.2 99.8 101.5 Source: NSI, Production indices are evaluated on comparable prices of 2000.
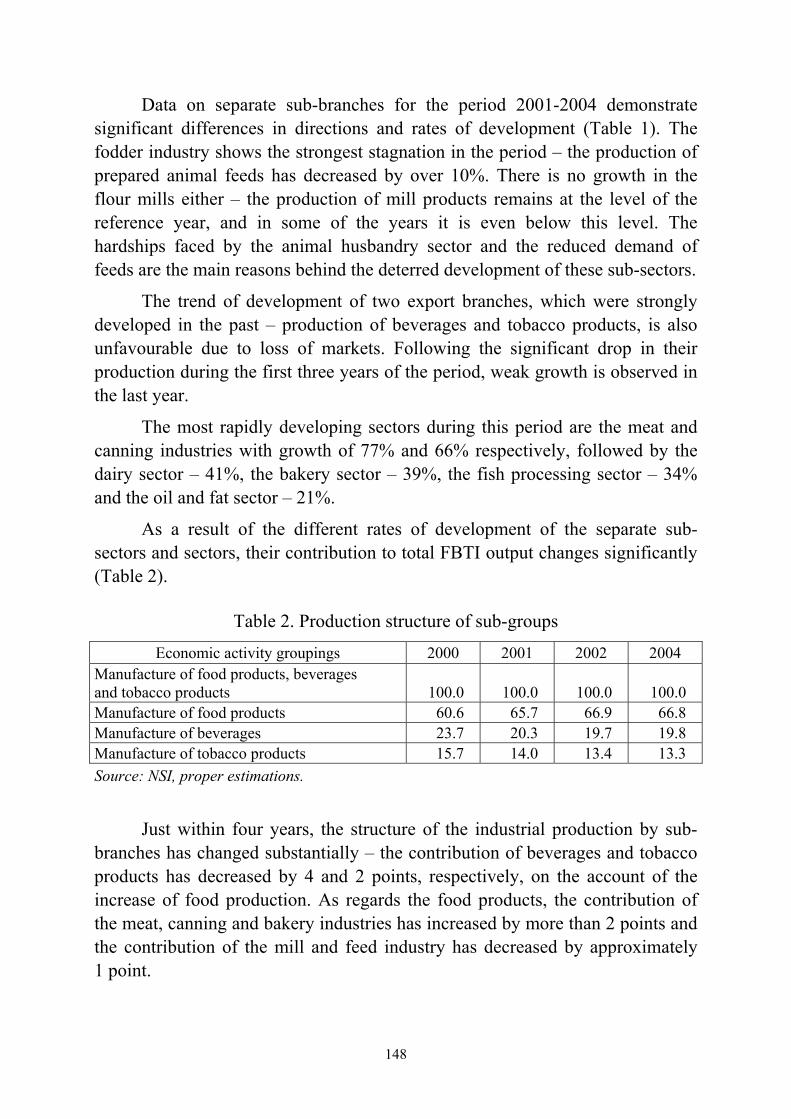
148
Data on separate sub-branches for the period 2001-2004 demonstrate significant differences in directions and rates of development (Table 1). The fodder industry shows the strongest stagnation in the period – the production of prepared animal feeds has decreased by over 10%. There is no growth in the flour mills either – the production of mill products remains at the level of the reference year, and in some of the years it is even below this level. The hardships faced by the animal husbandry sector and the reduced demand of feeds are the main reasons behind the deterred development of these sub-sectors.
The trend of development of two export branches, which were strongly developed in the past – production of beverages and tobacco products, is also unfavourable due to loss of markets. Following the significant drop in their production during the first three years of the period, weak growth is observed in the last year.
The most rapidly developing sectors during this period are the meat and canning industries with growth of 77% and 66% respectively, followed by the dairy sector – 41%, the bakery sector – 39%, the fish processing sector – 34% and the oil and fat sector – 21%.
As a result of the different rates of development of the separate sub-sectors and sectors, their contribution to total FBTI output changes significantly (Table 2).
Table 2. Production structure of sub-groups
Economic activity groupings 2000 2001 2002 2004 Manufacture of food products, beverages and tobacco products 100.0 100.0 100.0 100.0 Manufacture of food products 60.6 65.7 66.9 66.8 Manufacture of beverages 23.7 20.3 19.7 19.8 Manufacture of tobacco products 15.7 14.0 13.4 13.3 Source: NSI, proper estimations.
Just within four years, the structure of the industrial production by sub- branches has changed substantially – the contribution of beverages and tobacco products has decreased by 4 and 2 points, respectively, on the account of the increase of food production. As regards the food products, the contribution of the meat, canning and bakery industries has increased by more than 2 points and the contribution of the mill and feed industry has decreased by approximately 1 point.
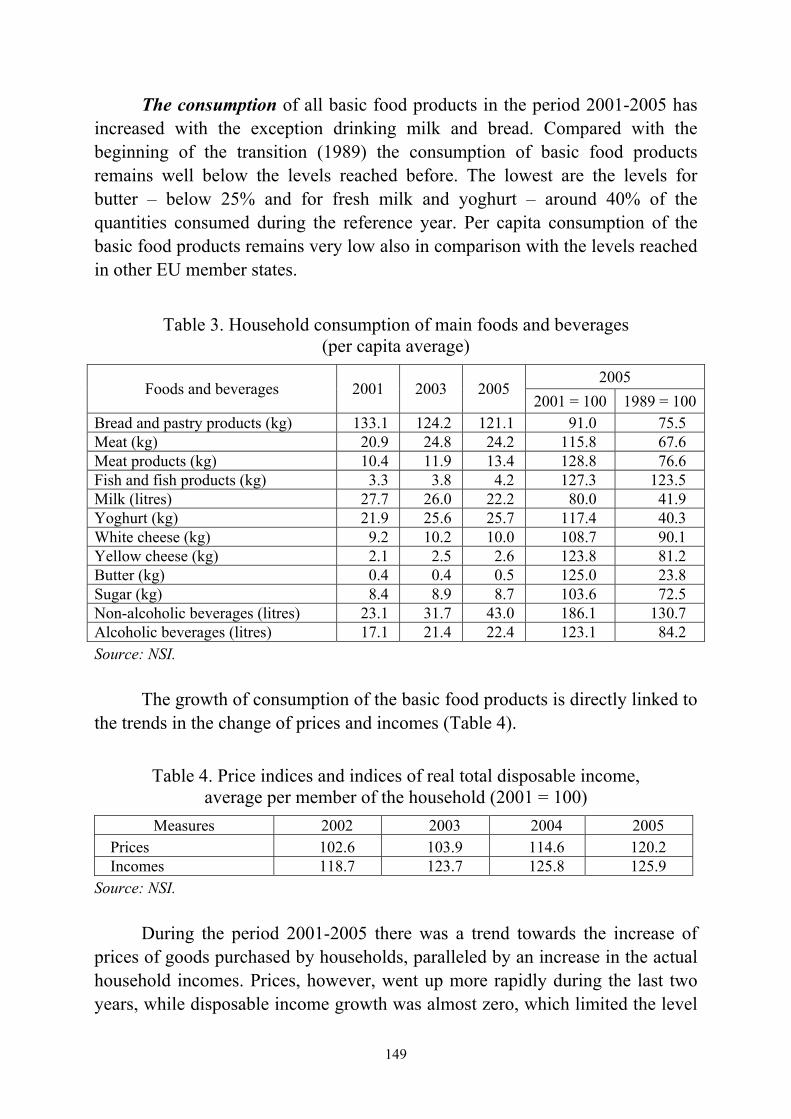
149
The consumption of all basic food products in the period 2001-2005 has increased with the exception drinking milk and bread. Compared with the beginning of the transition (1989) the consumption of basic food products remains well below the levels reached before. The lowest are the levels for butter – below 25% and for fresh milk and yoghurt – around 40% of the quantities consumed during the reference year. Per capita consumption of the basic food products remains very low also in comparison with the levels reached in other EU member states.
Table 3. Household consumption of main foods and beverages
(per capita average) 2005
Foods and beverages 2001 2003 2005 2001 = 100 1989 = 100
Bread and pastry products (kg) 133.1 124.2 121.1 91.0 75.5 Meat (kg) 20.9 24.8 24.2 115.8 67.6 Meat products (kg) 10.4 11.9 13.4 128.8 76.6 Fish and fish products (kg) 3.3 3.8 4.2 127.3 123.5 Milk (litres) 27.7 26.0 22.2 80.0 41.9 Yoghurt (kg) 21.9 25.6 25.7 117.4 40.3 White cheese (kg) 9.2 10.2 10.0 108.7 90.1 Yellow cheese (kg) 2.1 2.5 2.6 123.8 81.2 Butter (kg) 0.4 0.4 0.5 125.0 23.8 Sugar (kg) 8.4 8.9 8.7 103.6 72.5 Non-alcoholic beverages (litres) 23.1 31.7 43.0 186.1 130.7 Alcoholic beverages (litres) 17.1 21.4 22.4 123.1 84.2 Source: NSI.
The growth of consumption of the basic food products is directly linked to
the trends in the change of prices and incomes (Table 4).
Table 4. Price indices and indices of real total disposable income,
average per member of the household (2001 = 100) Measures 2002 2003 2004 2005
Prices 102.6 103.9 114.6 120.2 Incomes 118.7 123.7 125.8 125.9
Source: NSI.
During the period 2001-2005 there was a trend towards the increase of prices of goods purchased by households, paralleled by an increase in the actual household incomes. Prices, however, went up more rapidly during the last two years, while disposable income growth was almost zero, which limited the level
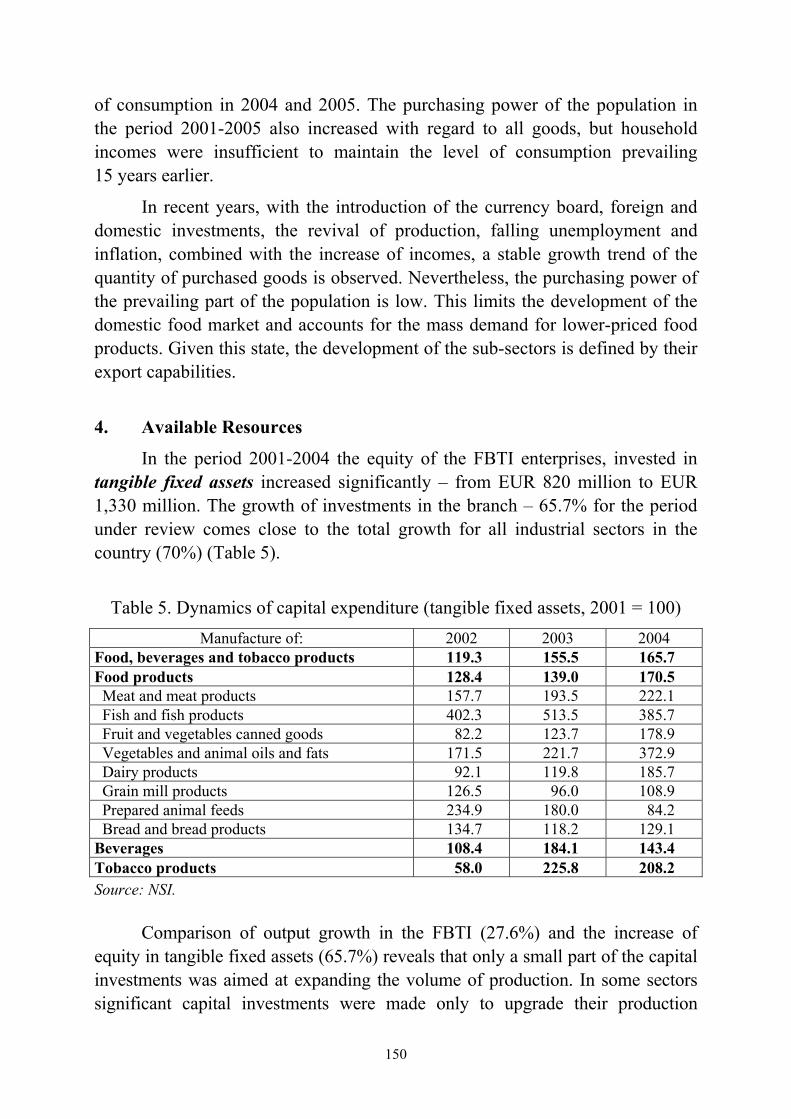
150
of consumption in 2004 and 2005. The purchasing power of the population in the period 2001-2005 also increased with regard to all goods, but household incomes were insufficient to maintain the level of consumption prevailing 15 years earlier.
In recent years, with the introduction of the currency board, foreign and domestic investments, the revival of production, falling unemployment and inflation, combined with the increase of incomes, a stable growth trend of the quantity of purchased goods is observed. Nevertheless, the purchasing power of the prevailing part of the population is low. This limits the development of the domestic food market and accounts for the mass demand for lower-priced food products. Given this state, the development of the sub-sectors is defined by their export capabilities.
4. Available Resources
In the period 2001-2004 the equity of the FBTI enterprises, invested in tangible fixed assets increased significantly – from EUR 820 million to EUR 1,330 million. The growth of investments in the branch – 65.7% for the period under review comes close to the total growth for all industrial sectors in the country (70%) (Table 5).
Table 5. Dynamics of capital expenditure (tangible fixed assets, 2001 = 100)
Manufacture of: 2002 2003 2004 Food, beverages and tobacco products 119.3 155.5 165.7 Food products 128.4 139.0 170.5 Meat and meat products 157.7 193.5 222.1 Fish and fish products 402.3 513.5 385.7 Fruit and vegetables canned goods 82.2 123.7 178.9 Vegetables and animal oils and fats 171.5 221.7 372.9 Dairy products 92.1 119.8 185.7 Grain mill products 126.5 96.0 108.9 Prepared animal feeds 234.9 180.0 84.2 Bread and bread products 134.7 118.2 129.1 Beverages 108.4 184.1 143.4 Tobacco products 58.0 225.8 208.2 Source: NSI.
Comparison of output growth in the FBTI (27.6%) and the increase of
equity in tangible fixed assets (65.7%) reveals that only a small part of the capital investments was aimed at expanding the volume of production. In some sectors significant capital investments were made only to upgrade their production
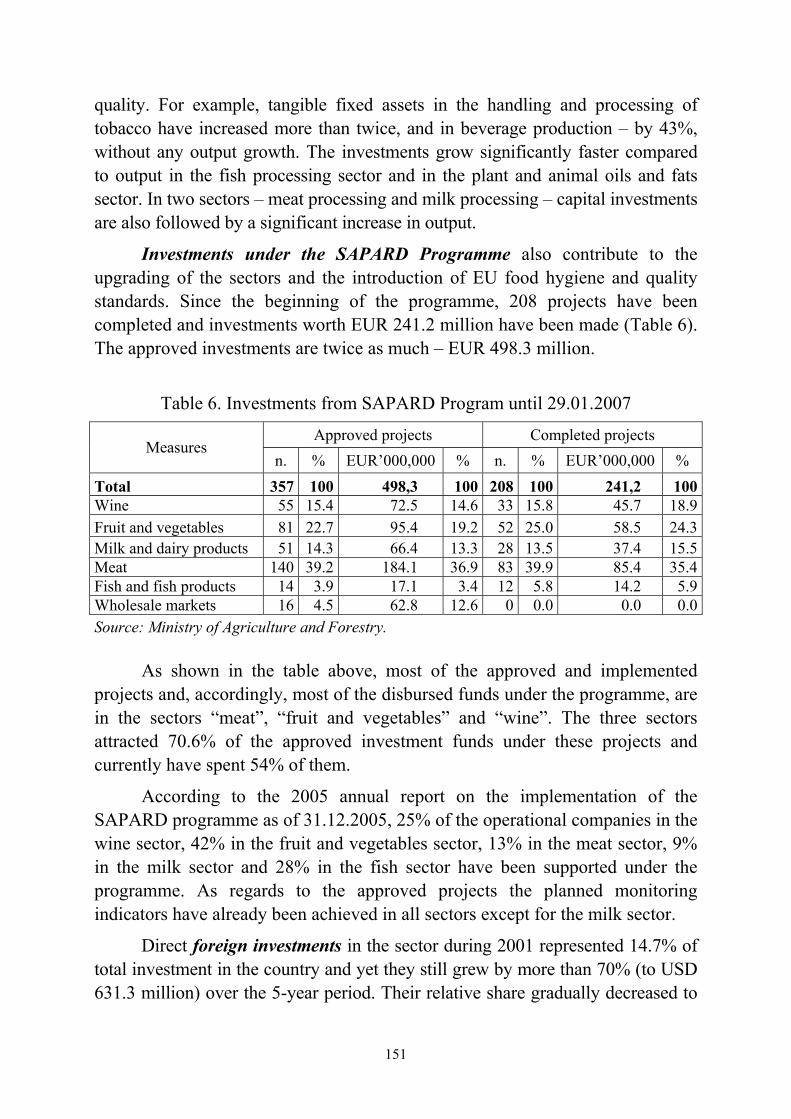
151
quality. For example, tangible fixed assets in the handling and processing of tobacco have increased more than twice, and in beverage production – by 43%, without any output growth. The investments grow significantly faster compared to output in the fish processing sector and in the plant and animal oils and fats sector. In two sectors – meat processing and milk processing – capital investments are also followed by a significant increase in output.
Investments under the SAPARD Programme also contribute to the upgrading of the sectors and the introduction of EU food hygiene and quality standards. Since the beginning of the programme, 208 projects have been completed and investments worth EUR 241.2 million have been made (Table 6). The approved investments are twice as much – EUR 498.3 million.
Table 6. Investments from SAPARD Program until 29.01.2007
Approved projects Completed projects Measures
n. % EUR’000,000 % n. % EUR’000,000 % Total 357 100 498,3 100 208 100 241,2 100Wine 55 15.4 72.5 14.6 33 15.8 45.7 18.9Fruit and vegetables 81 22.7 95.4 19.2 52 25.0 58.5 24.3Milk and dairy products 51 14.3 66.4 13.3 28 13.5 37.4 15.5Meat 140 39.2 184.1 36.9 83 39.9 85.4 35.4Fish and fish products 14 3.9 17.1 3.4 12 5.8 14.2 5.9Wholesale markets 16 4.5 62.8 12.6 0 0.0 0.0 0.0Source: Ministry of Agriculture and Forestry.
As shown in the table above, most of the approved and implemented
projects and, accordingly, most of the disbursed funds under the programme, are in the sectors “meat”, “fruit and vegetables” and “wine”. The three sectors attracted 70.6% of the approved investment funds under these projects and currently have spent 54% of them.
According to the 2005 annual report on the implementation of the SAPARD programme as of 31.12.2005, 25% of the operational companies in the wine sector, 42% in the fruit and vegetables sector, 13% in the meat sector, 9% in the milk sector and 28% in the fish sector have been supported under the programme. As regards to the approved projects the planned monitoring indicators have already been achieved in all sectors except for the milk sector.
Direct foreign investments in the sector during 2001 represented 14.7% of total investment in the country and yet they still grew by more than 70% (to USD 631.3 million) over the 5-year period. Their relative share gradually decreased to
152
7% in 2005. The lower growth rate of foreign capital in the branch is evidence of the loss of part of the competitive advantages of the sector and some of its sub-sectors compared to other branches and activities in the country’s economy. Foreign investors show greatest interest in the beverage sector (spirits, beer, wine, soft drinks, mineral waters) in which 42.4% of total capital expenditure in this branch was invested, as well as in bread, pastry goods and cakes, chocolate and sugar products sector – 20.4%. There was a growing interest in the meat processing sector during recent years and the foreign investments increased 14 times, while their relative share grew from 0.4% to 4.2%.
The development in production during the last 5 years was accompanied by an increase in the labour force. The number of FBTI employees working under labour contracts in the period 2001-2005 increased on average by 14.2%, the growth being highest in the food product group – 20.5%, in beverages it was 15%, while in the manufacture of tobacco products the number of permanently employed staff decreased by 29%. In the food group the largest number of additional workforce was attracted to the fish processing sector – about 60% against 2000, in meat processing – around 30%, and in bread and pastry goods – 34.3%. According to data of the NSI for 2005, the biggest part of the labour resources in the branch is engaged in the latter sector – 36.1%, followed by the beverages sector – 17.8% and the meat processing sector – 13.5%.
The provision of raw materials for processing is one of the major constraining issues in almost all sectors of the food industry. A poll among managers of enterprises from the basic five sectors showed that companies consider this as a major factor preventing them from entering the European market. Only 27% of the inquired companies face no difficulties to procure the necessary quantities of raw materials, and hardly 9% of them respond that the quality of raw materials meets their requirements. In the SWOT analysis that was carried out, most managers (54%) pointed at the low quality of raw materials in their establishments as the major obstacle for their successful entry to the European market The inability of agriculture to upgrade and to offer high quality raw materials is considered as a serious threat for the European future of the food companies.
5. Exports and Imports
Foreign trade turnover of FBTI products doubled over the period 2000- -2005 – from around USD 590 million to USD 1,380 million. Exports of foods, beverages and tobacco products grew at a slightly faster pace than imports, and the foreign trade balance is in surplus with a trend to increase, although it had
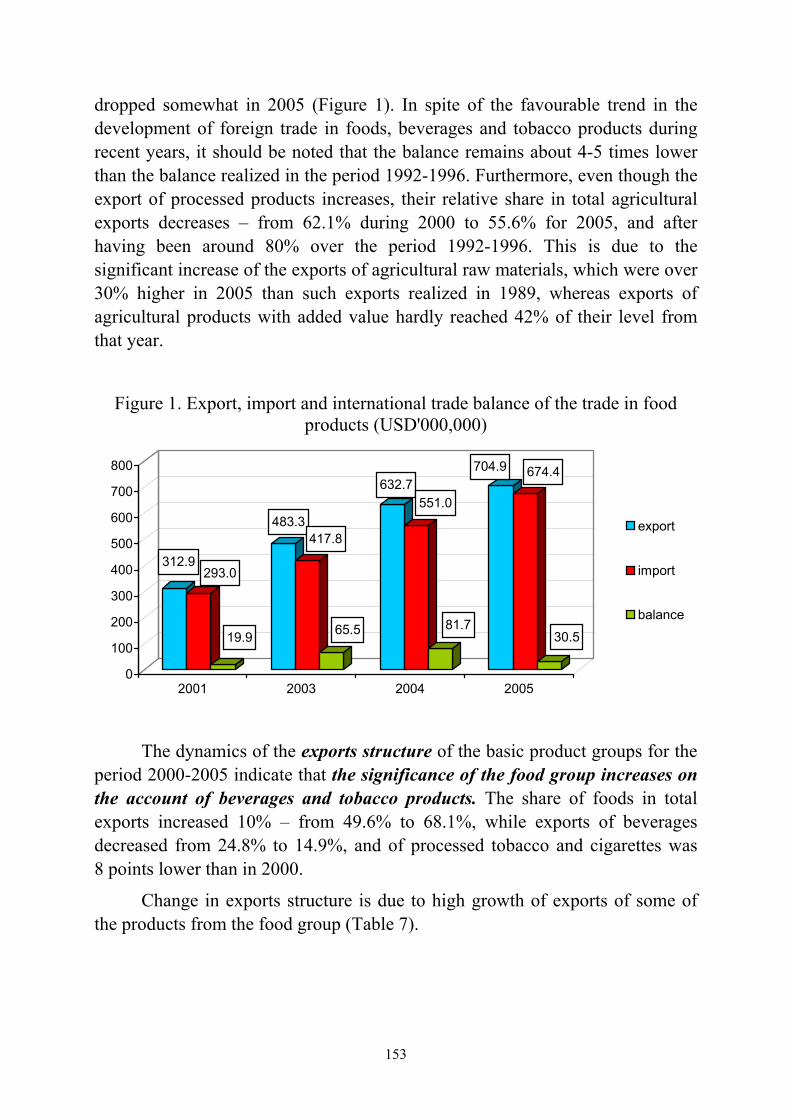
153
dropped somewhat in 2005 (Figure 1). In spite of the favourable trend in the development of foreign trade in foods, beverages and tobacco products during recent years, it should be noted that the balance remains about 4-5 times lower than the balance realized in the period 1992-1996. Furthermore, even though the export of processed products increases, their relative share in total agricultural exports decreases – from 62.1% during 2000 to 55.6% for 2005, and after having been around 80% over the period 1992-1996. This is due to the significant increase of the exports of agricultural raw materials, which were over 30% higher in 2005 than such exports realized in 1989, whereas exports of agricultural products with added value hardly reached 42% of their level from that year.
Figure 1. Export, import and international trade balance of the trade in food products (USD'000,000)
The dynamics of the exports structure of the basic product groups for the period 2000-2005 indicate that the significance of the food group increases on the account of beverages and tobacco products. The share of foods in total exports increased 10% – from 49.6% to 68.1%, while exports of beverages decreased from 24.8% to 14.9%, and of processed tobacco and cigarettes was 8 points lower than in 2000.
Change in exports structure is due to high growth of exports of some of the products from the food group (Table 7).
312.9293.0
19.9
483.3417.8
65.5
632.7551.0
81.7
704.9 674.4
30.5
0
100
200
300
400
500
600
700
800
2001 2003 2004 2005
export
import
balance
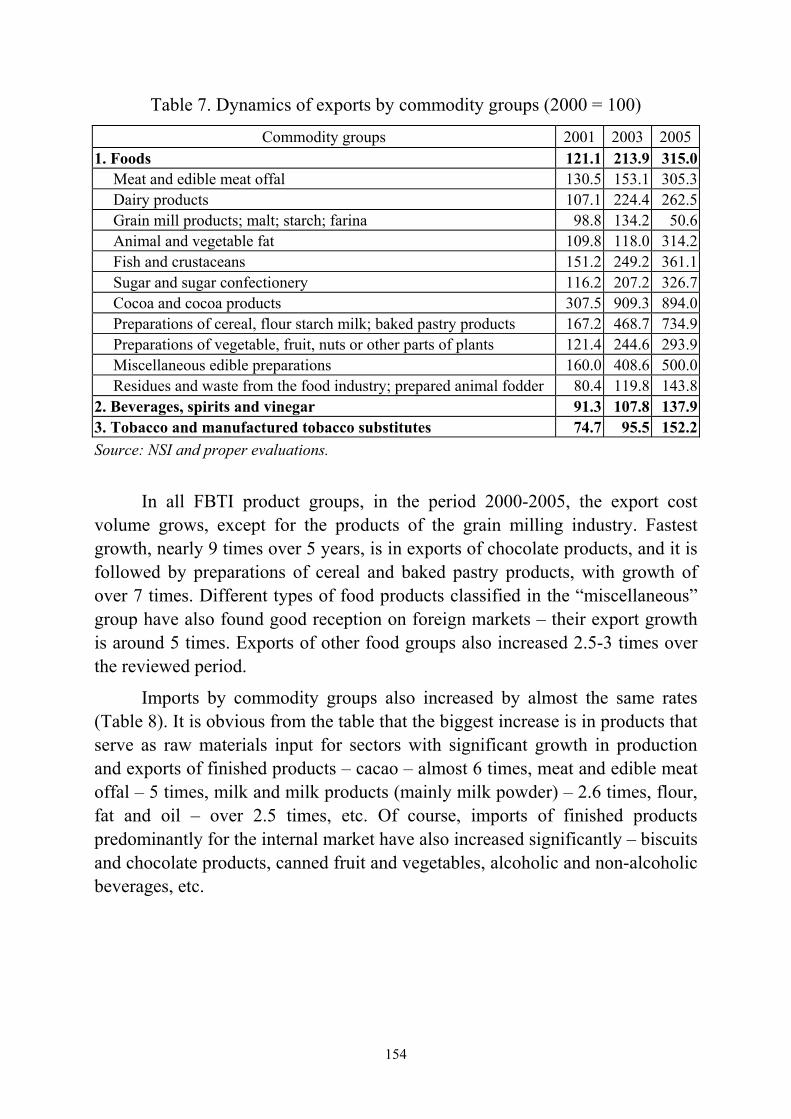
154
Table 7. Dynamics of exports by commodity groups (2000 = 100)
Commodity groups 2001 2003 20051. Foods 121.1 213.9 315.0
Meat and edible meat offal 130.5 153.1 305.3Dairy products 107.1 224.4 262.5Grain mill products; malt; starch; farina 98.8 134.2 50.6Animal and vegetable fat 109.8 118.0 314.2Fish and crustaceans 151.2 249.2 361.1Sugar and sugar confectionery 116.2 207.2 326.7Cocoa and cocoa products 307.5 909.3 894.0Preparations of cereal, flour starch milk; baked pastry products 167.2 468.7 734.9Preparations of vegetable, fruit, nuts or other parts of plants 121.4 244.6 293.9Miscellaneous edible preparations 160.0 408.6 500.0Residues and waste from the food industry; prepared animal fodder 80.4 119.8 143.8
2. Beverages, spirits and vinegar 91.3 107.8 137.93. Tobacco and manufactured tobacco substitutes 74.7 95.5 152.2Source: NSI and proper evaluations.
In all FBTI product groups, in the period 2000-2005, the export cost volume grows, except for the products of the grain milling industry. Fastest growth, nearly 9 times over 5 years, is in exports of chocolate products, and it is followed by preparations of cereal and baked pastry products, with growth of over 7 times. Different types of food products classified in the “miscellaneous” group have also found good reception on foreign markets – their export growth is around 5 times. Exports of other food groups also increased 2.5-3 times over the reviewed period.
Imports by commodity groups also increased by almost the same rates (Table 8). It is obvious from the table that the biggest increase is in products that serve as raw materials input for sectors with significant growth in production and exports of finished products – cacao – almost 6 times, meat and edible meat offal – 5 times, milk and milk products (mainly milk powder) – 2.6 times, flour, fat and oil – over 2.5 times, etc. Of course, imports of finished products predominantly for the internal market have also increased significantly – biscuits and chocolate products, canned fruit and vegetables, alcoholic and non-alcoholic beverages, etc.
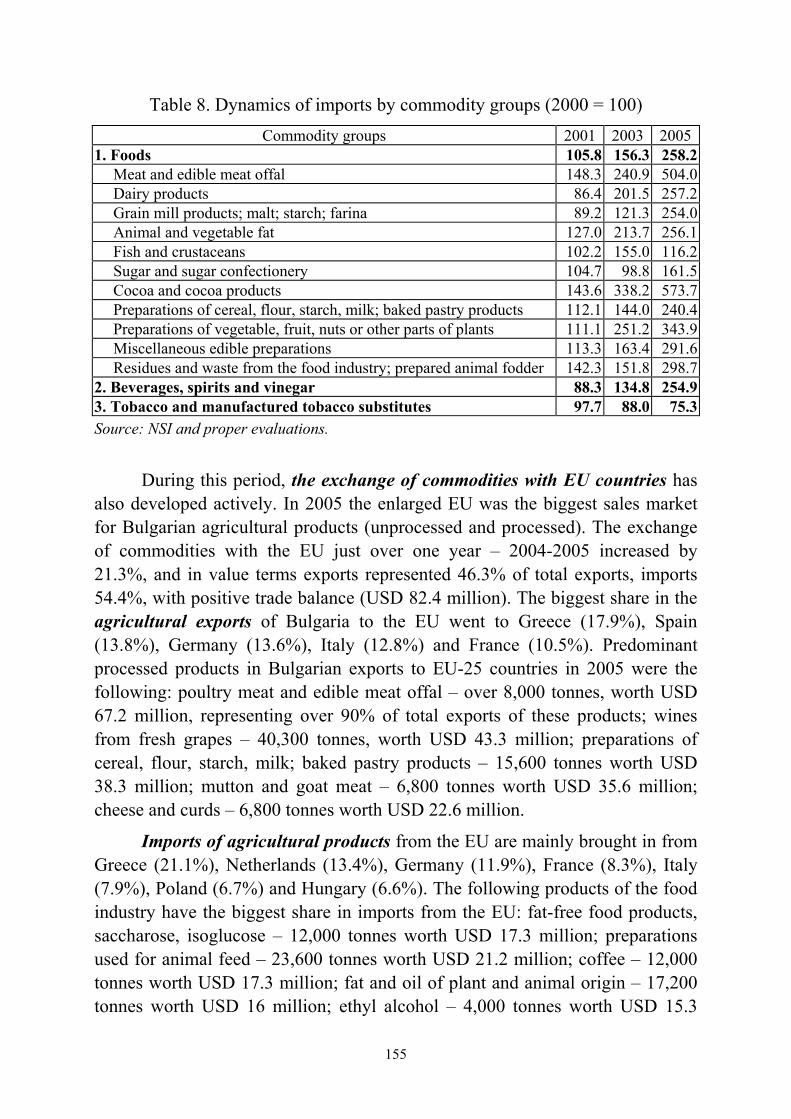
155
Table 8. Dynamics of imports by commodity groups (2000 = 100) Commodity groups 2001 2003 2005
1. Foods 105.8 156.3 258.2Meat and edible meat offal 148.3 240.9 504.0Dairy products 86.4 201.5 257.2Grain mill products; malt; starch; farina 89.2 121.3 254.0Animal and vegetable fat 127.0 213.7 256.1Fish and crustaceans 102.2 155.0 116.2Sugar and sugar confectionery 104.7 98.8 161.5Cocoa and cocoa products 143.6 338.2 573.7Preparations of cereal, flour, starch, milk; baked pastry products 112.1 144.0 240.4Preparations of vegetable, fruit, nuts or other parts of plants 111.1 251.2 343.9Miscellaneous edible preparations 113.3 163.4 291.6Residues and waste from the food industry; prepared animal fodder 142.3 151.8 298.7
2. Beverages, spirits and vinegar 88.3 134.8 254.93. Tobacco and manufactured tobacco substitutes 97.7 88.0 75.3Source: NSI and proper evaluations.
During this period, the exchange of commodities with EU countries has also developed actively. In 2005 the enlarged EU was the biggest sales market for Bulgarian agricultural products (unprocessed and processed). The exchange of commodities with the EU just over one year – 2004-2005 increased by 21.3%, and in value terms exports represented 46.3% of total exports, imports 54.4%, with positive trade balance (USD 82.4 million). The biggest share in the agricultural exports of Bulgaria to the EU went to Greece (17.9%), Spain (13.8%), Germany (13.6%), Italy (12.8%) and France (10.5%). Predominant processed products in Bulgarian exports to EU-25 countries in 2005 were the following: poultry meat and edible meat offal – over 8,000 tonnes, worth USD 67.2 million, representing over 90% of total exports of these products; wines from fresh grapes – 40,300 tonnes, worth USD 43.3 million; preparations of cereal, flour, starch, milk; baked pastry products – 15,600 tonnes worth USD 38.3 million; mutton and goat meat – 6,800 tonnes worth USD 35.6 million; cheese and curds – 6,800 tonnes worth USD 22.6 million.
Imports of agricultural products from the EU are mainly brought in from Greece (21.1%), Netherlands (13.4%), Germany (11.9%), France (8.3%), Italy (7.9%), Poland (6.7%) and Hungary (6.6%). The following products of the food industry have the biggest share in imports from the EU: fat-free food products, saccharose, isoglucose – 12,000 tonnes worth USD 17.3 million; preparations used for animal feed – 23,600 tonnes worth USD 21.2 million; coffee – 12,000 tonnes worth USD 17.3 million; fat and oil of plant and animal origin – 17,200 tonnes worth USD 16 million; ethyl alcohol – 4,000 tonnes worth USD 15.3
156
million; chocolate – 4,000 tonnes worth USD 14.9 million; pork meat – 8,000 tonnes worth USD 14.3 million; poultry meat and edible meat offal – 18,300 tonnes worth USD 13.5 million.
6. Upgrading of Production
In the last ten years all sub-branches of the food industry went through large-scale structural changes as a result of privatization, the arrival of foreign investments and last but not least – the adoption of EU legislation and requirements for hygiene and safety of foods placed on the market.
The privatization of state-owned establishments and the numerous, but small scale investments, resulted in pronounced fragmentation of production in a number of sub-branches, such as meat, milk, bread and pastry, canned vegetables and fruit, etc. A large number of micro and small-sized processing establishments emerged, but a large part of them in unsuitable buildings and non-sanitary production conditions. The “grey” sector expanded, suppressing innovations in the registered establishments due to the unfair competition of those evading taxes, fees, duties, insurance.
As a result of the introduction of European sanitary standards and safety guarantees in the food establishments during the pre-accession period there was a reverse process – of concentration of production. Many enterprises, which did not comply with European requirements with regard to buildings and equipment, and lacked the necessary resources for upgrading, terminated their activity. Most of the closed enterprises were in the animal product processing branches, where the requirements are also most stringent. Out of more than 800 establishments that operated in the meat and milk sectors, 379 meat production and processing establishments and 216 milk processing establishments remained on the market. About 40% of industrial capacity and about 60% of the small capacity meat production and processing establishments were closed; 77% of the small capacity and 35% of the industrial capacity establishments in the dairy sector were closed.
In spite of the considerable investments made by the establishments from the dairy and meat sector, only few of them, three months after the accession of Bulgaria to the EU, have access to the markets of the EU member states (only 44 establishments – 22 milk processing and 22 meat establishments). The main obstacle preventing the enterprises from both sectors from entering the EU market is the quality of the processed raw materials.
157
In the dairy sector, the main restricting factor for the milk processors does not consist of the low milk quota, but of the inability of the dairy cattle breeding farms to upgrade in the short term and to deliver quality milk. Due to the low investments in the dairy cattle breeding, which is still small and fragmented, only around 30% of the cow’s milk for processing meets EU standards. Only 15 of the 216 establishments operate entirely with EU compliant milk. There are 69 establishments with two separate technological lines – one for compliant and one for non-compliant milk, but the risk of mixing the two categories of milk limits their access to the EU market. Nearly 60% of dairies delivering and processing non-compliant milk may have to terminate their operation in 2009, if the dairy cattle breeding is not upgraded within this period.
The restrictions in the meat sector arise from the risk that meat might be derived from pigs vaccinated against classical swine fever, practiced in the past in the country. Notwithstanding the commitment of Bulgaria to terminate the vaccination from 1 January 2006, there are no sufficient guarantees in the small farms and the EC imposed a ban on the placing of meat products obtained from Bulgarian raw materials on the EU market until the end of 2007. If the operation of these small farms is not terminated and if no guarantees are provided that vaccination against classical swine fever is not practised, this period may be extended, which will cause huge losses for the meat industry.
The production structure of the enterprises in the fodder industry is defined largely by the structure of the stock-breeding farms. Out of 170 operating enterprises for production of combined fodder, 127 small fodder shops satisfying the necessities of the small farms are prevailing.
The largest number of enterprises is operating in the manufacture of bread, pastry goods and cakes. About 3,600 enterprises are registered, but according to the branch associations further 1,500 enterprises operate illegally in the sector. The branch lags in the introduction of European sanitary standards and sanitary control is too liberal, which impedes the development of the upgraded enterprises due to unfair competition. The enterprises that have introduced good manufacturing and sanitary practices insist for more efficient control. That is why closure of many enterprises in this sector is expected.
The practice of de-concentration of production aimed at delivery of smaller lots, higher quality wines in the higher priced segment is becoming established in the sector of wine production, which is a traditional export branch in Bulgaria. At the moment, 255 enterprises are registered, from which 174 are in operation. Many of the enterprises solve their raw material problem through creation of their own vineyards.
158
The other traditional export branch of Bulgaria – the production of vegetable and fruit preserved food, underwent big structural changes. Until the 90-ties there have been around 40 big enterprises, but mainly due to the loss of the Russian market, many of them stopped operation or went bankrupt. As of this moment, around 130 canning enterprises are registered, but according to the branch association only 70-80 are actually operating. Twenty enterprises are ISO-9001 certified. Many of the enterprises operate with imported raw materials due to the liquidation of a big part of the fruit plants resulting from the agrarian reform and of the big areas for vegetables for processing.
The analysis of the trends in the development of the FBTI for the last five-year period before the accession of Bulgaria to the EU, justifies the following summary and conclusions:
• The food, beverage and tobacco industry is a structure-defining branch in the economy of the country, holding leading place among the industrial branches;
• The process of adaptation of the enterprises for their operation on the Single Market has positively affected the development of the sectors – bigger investments have been made for the upgrading of production and the introduction of European standards, the export capabilities of almost all sectors have increased;
• The raw material base is the main risk factor for the integration of the enterprises processing agricultural raw materials on the European market and for raising their competitive capacity;
• The production structure has changed significantly due to the altered market possibilities and consequently the different rates of development of the sectors;
• The low purchasing power of the population limits the demand for food products on the internal market, due to which the development of the branches and enterprises is connected to the expansion of their participation on the European and international markets;
• The development of production in some sectors (meat, milk, bread, pastry, food-preserving) is based on the increased imports of raw materials and semi-finished products.
159
Prof. Dr. Dinu Gavrilescu Dr. Dan Marius Voicilas
Romanian Academy – Institute of Agricultural Economics Bucarest, Romania
The Romanian Agri-Food Sector – How Well is it Prepared to Join the EU?
1. General Characteristics The transition period was difficult for all Central and Eastern European
Countries, in all sectors of the economy. Probably the most difficult aspects were encountered in agriculture.
Romania is one of the countries with an important agricultural sector, due to the size, number of persons involved in agriculture, product lines and the share of agriculture in the economy as a whole. At the same time, the rural environment has a distinct complexity and requires special attention, due to its features and transformations. More favourable evolution took place in the food industry. It was easier adapted to market economy.
The study shows the state of the Romanian agri-food sector before the accession to the European Union (EU). Some general characteristics and recommendations are given in order to clarify the main directions of action to implement necessary decisions in the years following the accession. We focus on the economic dimension of rural development. The importance of this approach is evident, if we take into consideration that agriculture and rural development issues belonged to the most important files of Romania’s accession negotiations and will represent a very sensitive chapter also in the future. This approach starts from the idea that rural development needs to combine national characteristics with EU requirements.
Starting from 1990, the trends in Romanian agriculture began to differ significantly from the long-term trends that had prevailed under central planning. During the first 10 years of the transition, agricultural output (measured as gross value-added in agriculture) declined less than industrial output. Since 2000, the industrial sector has enjoyed continuous growth, while the agricultural sector has experienced significant fluctuations due to its sensitivity to droughts.
160
The share of agriculture in GDP has declined since 1990, stabilizing at about 11-13% after 1999 (Table 1). This decline is a normal trend in developing economies, but it is usually accompanied by a decrease in the share of agricultural employment, as labour migrates to other growing sectors. Summing up the contribution of agriculture and food industry to total GVA (Gross Value Added) we can say that both sectors accounted for just under 30% of its total in the first decade of transition and not more than 20% in the last few years.
Table 1. The contribution of the agri-food sector in economy (%)
1990 1991 1992 1993 1994 1995 1996 1997 1998 1999 2000 2001 2002 2003 2004Indicator ESA 1979 Methodology ESA 1995 Methodology
Agriculturea in GDP 21.8 18.9 19.0 21.0 19.9 19.8 19.2 18.0 14.5 13.3 11.1 13.4 11.4 11.6 12.8
Agriculturea GVA in Total GVA 23.8 20.1 19.4 22.6 21.5 21.4 20.6 19.6 16.1 15.1 12.5 15.0 12.8 13.0 14.1
Food and Beverage GVA in Total GVA 6.5 6.1 6.4 7.3 7.7 7.9 9.2 9.4 7.9 6.3 7.6 8.3 7.3 6.9 7.4 a Agriculture + hunting + forestry. Source: National Institute of Statistic (INS) Database.
Until 1989, the total labour force in Romania was increasing, while the agricultural labour force was decreasing. After 1990, the trends reversed, with the total labour force shrinking and the agricultural labour force increasing fairly rapidly until 2000, when it reached 117% of 1989 levels. Data for 2003-2004 show a measurable decline in the share of agriculture in the total labour force (to 35%) for the first time since 1996.
The statistical database shows that before 2001 almost 3.6 million people worked in Romanian agriculture, which means about 54% of the number of people working in agriculture in EU-15 countries [Csaki, C., Kray, H. 2005]. It is remarkable that the agricultural labour force in Romania and Poland is 6.3 million, which is close to the total number of people employed in agriculture in the EU-15 (6.7 million). Even if the 3.6 million agricultural workers in Romania were compared with broader EU statistics covering the “total number of persons working on agricultural holdings” in the EU-15, the number of Romanian agricultural workers would still be equivalent to 27% of total agriculture-related labour in the EU-15. Given the huge size of the agricultural labour force in Romania, it is remarkable that the sector contributed just about 12% to GDP in recent years.
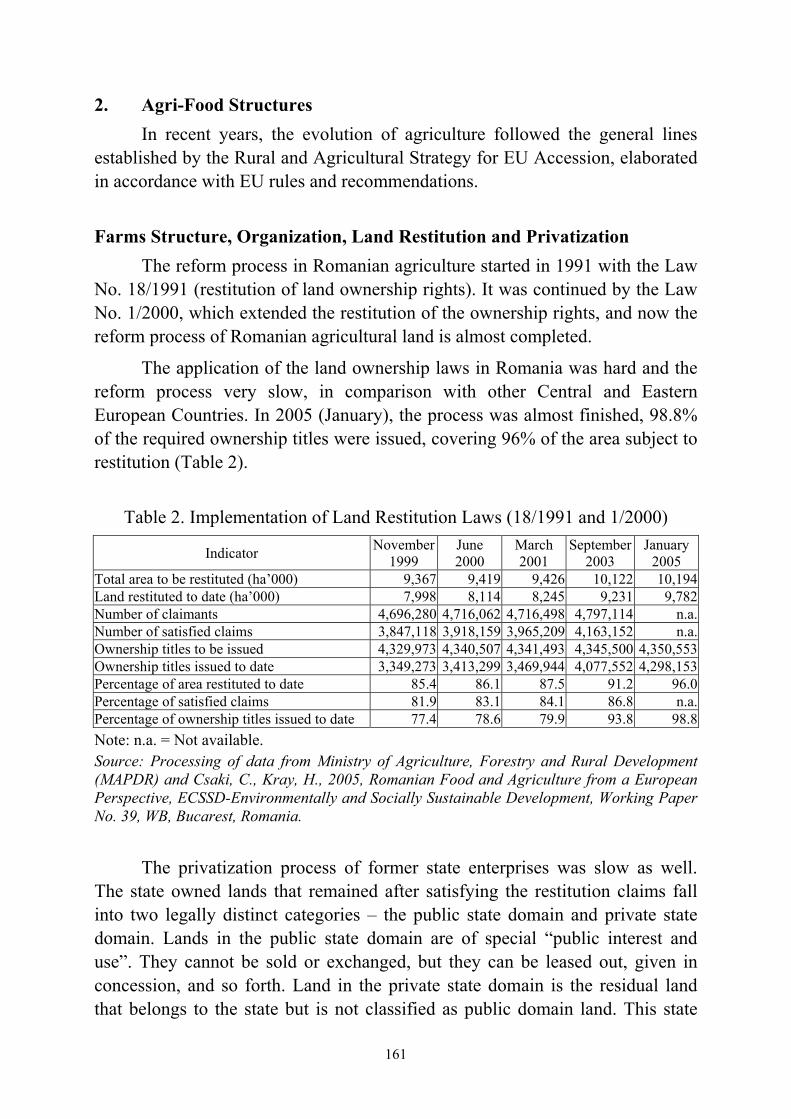
161
2. Agri-Food Structures In recent years, the evolution of agriculture followed the general lines
established by the Rural and Agricultural Strategy for EU Accession, elaborated in accordance with EU rules and recommendations.
Farms Structure, Organization, Land Restitution and Privatization
The reform process in Romanian agriculture started in 1991 with the Law No. 18/1991 (restitution of land ownership rights). It was continued by the Law No. 1/2000, which extended the restitution of the ownership rights, and now the reform process of Romanian agricultural land is almost completed.
The application of the land ownership laws in Romania was hard and the reform process very slow, in comparison with other Central and Eastern European Countries. In 2005 (January), the process was almost finished, 98.8% of the required ownership titles were issued, covering 96% of the area subject to restitution (Table 2).
Table 2. Implementation of Land Restitution Laws (18/1991 and 1/2000)
Indicator November1999
June 2000
March 2001
September 2003
January 2005
Total area to be restituted (ha’000) 9,367 9,419 9,426 10,122 10,194Land restituted to date (ha’000) 7,998 8,114 8,245 9,231 9,782Number of claimants 4,696,280 4,716,062 4,716,498 4,797,114 n.a.Number of satisfied claims 3,847,118 3,918,159 3,965,209 4,163,152 n.a.Ownership titles to be issued 4,329,973 4,340,507 4,341,493 4,345,500 4,350,553Ownership titles issued to date 3,349,273 3,413,299 3,469,944 4,077,552 4,298,153Percentage of area restituted to date 85.4 86.1 87.5 91.2 96.0Percentage of satisfied claims 81.9 83.1 84.1 86.8 n.a.Percentage of ownership titles issued to date 77.4 78.6 79.9 93.8 98.8Note: n.a. = Not available. Source: Processing of data from Ministry of Agriculture, Forestry and Rural Development (MAPDR) and Csaki, C., Kray, H., 2005, Romanian Food and Agriculture from a European Perspective, ECSSD-Environmentally and Socially Sustainable Development, Working Paper No. 39, WB, Bucarest, Romania.
The privatization process of former state enterprises was slow as well. The state owned lands that remained after satisfying the restitution claims fall into two legally distinct categories – the public state domain and private state domain. Lands in the public state domain are of special “public interest and use”. They cannot be sold or exchanged, but they can be leased out, given in concession, and so forth. Land in the private state domain is the residual land that belongs to the state but is not classified as public domain land. This state
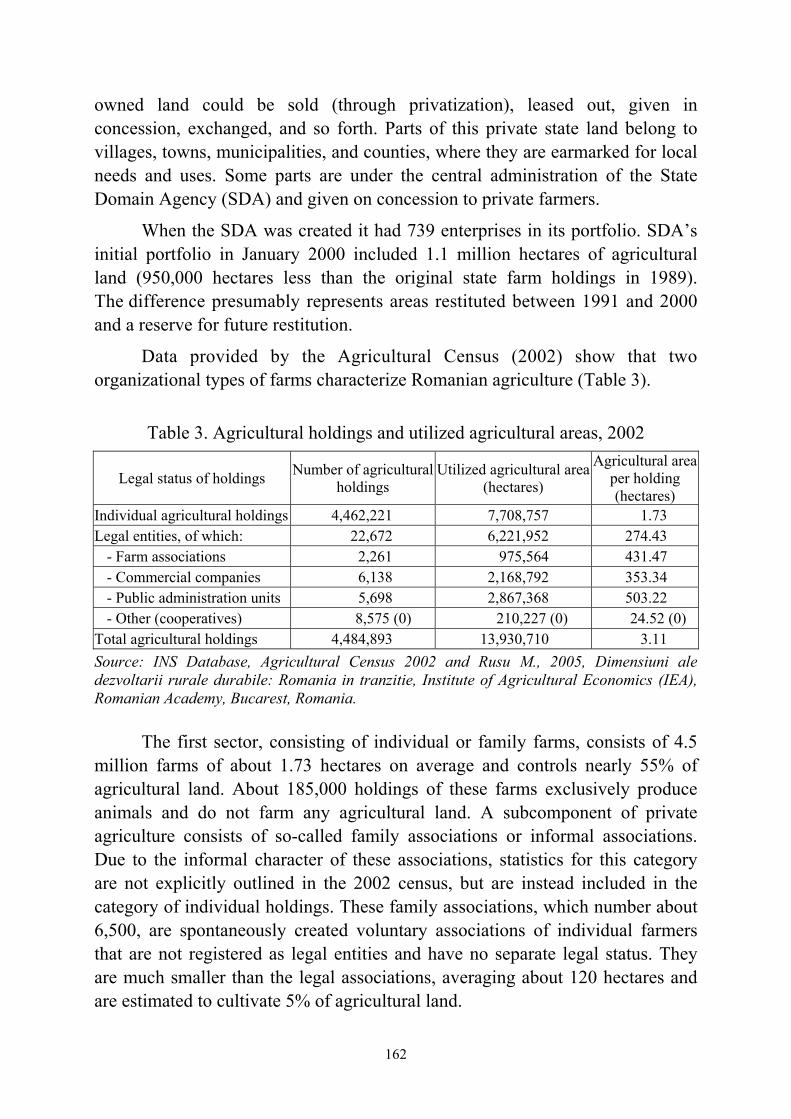
162
owned land could be sold (through privatization), leased out, given in concession, exchanged, and so forth. Parts of this private state land belong to villages, towns, municipalities, and counties, where they are earmarked for local needs and uses. Some parts are under the central administration of the State Domain Agency (SDA) and given on concession to private farmers.
When the SDA was created it had 739 enterprises in its portfolio. SDA’s initial portfolio in January 2000 included 1.1 million hectares of agricultural land (950,000 hectares less than the original state farm holdings in 1989). The difference presumably represents areas restituted between 1991 and 2000 and a reserve for future restitution.
Data provided by the Agricultural Census (2002) show that two organizational types of farms characterize Romanian agriculture (Table 3).
Table 3. Agricultural holdings and utilized agricultural areas, 2002
Legal status of holdings Number of agriculturalholdings
Utilized agricultural area (hectares)
Agricultural areaper holding (hectares)
Individual agricultural holdings 4,462,221 7,708,757 1.73 Legal entities, of which: 22,672 6,221,952 274.43
- Farm associations 2,261 975,564 431.47 - Commercial companies 6,138 2,168,792 353.34 - Public administration units 5,698 2,867,368 503.22 - Other (cooperatives) 8,575 (0) 210,227 (0) 24.52 (0)
Total agricultural holdings 4,484,893 13,930,710 3.11 Source: INS Database, Agricultural Census 2002 and Rusu M., 2005, Dimensiuni ale dezvoltarii rurale durabile: Romania in tranzitie, Institute of Agricultural Economics (IEA), Romanian Academy, Bucarest, Romania.
The first sector, consisting of individual or family farms, consists of 4.5 million farms of about 1.73 hectares on average and controls nearly 55% of agricultural land. About 185,000 holdings of these farms exclusively produce animals and do not farm any agricultural land. A subcomponent of private agriculture consists of so-called family associations or informal associations. Due to the informal character of these associations, statistics for this category are not explicitly outlined in the 2002 census, but are instead included in the category of individual holdings. These family associations, which number about 6,500, are spontaneously created voluntary associations of individual farmers that are not registered as legal entities and have no separate legal status. They are much smaller than the legal associations, averaging about 120 hectares and are estimated to cultivate 5% of agricultural land.
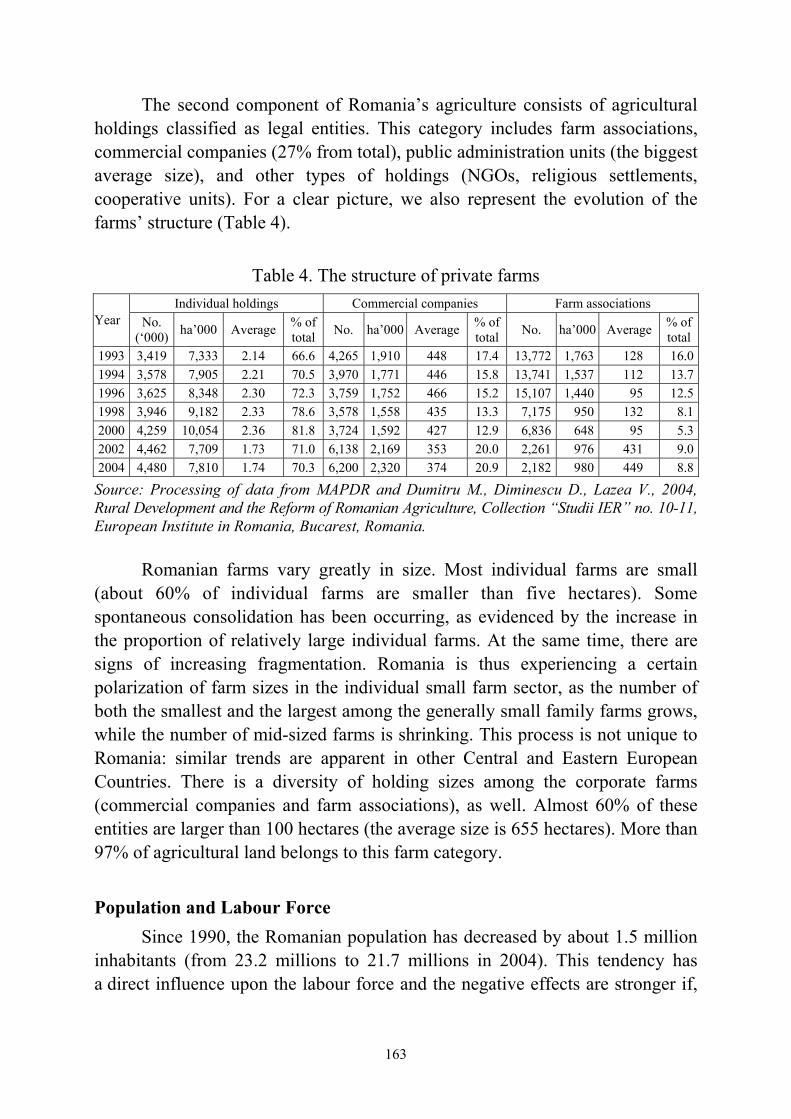
163
The second component of Romania’s agriculture consists of agricultural holdings classified as legal entities. This category includes farm associations, commercial companies (27% from total), public administration units (the biggest average size), and other types of holdings (NGOs, religious settlements, cooperative units). For a clear picture, we also represent the evolution of the farms’ structure (Table 4).
Table 4. The structure of private farms
Individual holdings Commercial companies Farm associations Year No.
(‘000) ha’000 Average % of total No. ha’000 Average % of
total No. ha’000 Average % of total
1993 3,419 7,333 2.14 66.6 4,265 1,910 448 17.4 13,772 1,763 128 16.01994 3,578 7,905 2.21 70.5 3,970 1,771 446 15.8 13,741 1,537 112 13.71996 3,625 8,348 2.30 72.3 3,759 1,752 466 15.2 15,107 1,440 95 12.51998 3,946 9,182 2.33 78.6 3,578 1,558 435 13.3 7,175 950 132 8.12000 4,259 10,054 2.36 81.8 3,724 1,592 427 12.9 6,836 648 95 5.32002 4,462 7,709 1.73 71.0 6,138 2,169 353 20.0 2,261 976 431 9.02004 4,480 7,810 1.74 70.3 6,200 2,320 374 20.9 2,182 980 449 8.8
Source: Processing of data from MAPDR and Dumitru M., Diminescu D., Lazea V., 2004, Rural Development and the Reform of Romanian Agriculture, Collection “Studii IER” no. 10-11, European Institute in Romania, Bucarest, Romania.
Romanian farms vary greatly in size. Most individual farms are small (about 60% of individual farms are smaller than five hectares). Some spontaneous consolidation has been occurring, as evidenced by the increase in the proportion of relatively large individual farms. At the same time, there are signs of increasing fragmentation. Romania is thus experiencing a certain polarization of farm sizes in the individual small farm sector, as the number of both the smallest and the largest among the generally small family farms grows, while the number of mid-sized farms is shrinking. This process is not unique to Romania: similar trends are apparent in other Central and Eastern European Countries. There is a diversity of holding sizes among the corporate farms (commercial companies and farm associations), as well. Almost 60% of these entities are larger than 100 hectares (the average size is 655 hectares). More than 97% of agricultural land belongs to this farm category.
Population and Labour Force
Since 1990, the Romanian population has decreased by about 1.5 million inhabitants (from 23.2 millions to 21.7 millions in 2004). This tendency has a direct influence upon the labour force and the negative effects are stronger if,
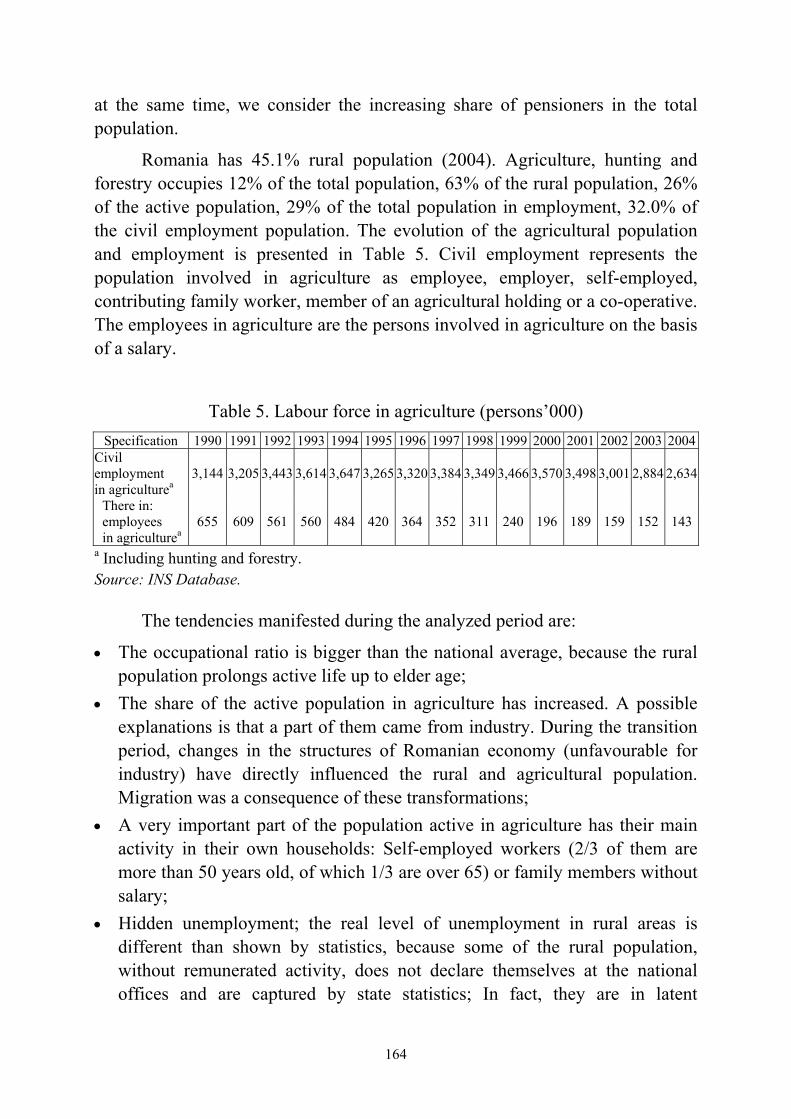
164
at the same time, we consider the increasing share of pensioners in the total population.
Romania has 45.1% rural population (2004). Agriculture, hunting and forestry occupies 12% of the total population, 63% of the rural population, 26% of the active population, 29% of the total population in employment, 32.0% of the civil employment population. The evolution of the agricultural population and employment is presented in Table 5. Civil employment represents the population involved in agriculture as employee, employer, self-employed, contributing family worker, member of an agricultural holding or a co-operative. The employees in agriculture are the persons involved in agriculture on the basis of a salary.
Table 5. Labour force in agriculture (persons’000) Specification 1990 1991 1992 1993 1994 1995 1996 1997 1998 1999 2000 2001 2002 2003 2004
Civil employment in agriculturea
3,144 3,205 3,443 3,614 3,647 3,265 3,320 3,384 3,349 3,466 3,570 3,498 3,001 2,884 2,634
There in: employees in agriculturea
655 609 561 560 484 420 364 352 311 240 196 189 159 152 143
a Including hunting and forestry. Source: INS Database.
The tendencies manifested during the analyzed period are:
• The occupational ratio is bigger than the national average, because the rural population prolongs active life up to elder age;
• The share of the active population in agriculture has increased. A possible explanations is that a part of them came from industry. During the transition period, changes in the structures of Romanian economy (unfavourable for industry) have directly influenced the rural and agricultural population. Migration was a consequence of these transformations;
• A very important part of the population active in agriculture has their main activity in their own households: Self-employed workers (2/3 of them are more than 50 years old, of which 1/3 are over 65) or family members without salary;
• Hidden unemployment; the real level of unemployment in rural areas is different than shown by statistics, because some of the rural population, without remunerated activity, does not declare themselves at the national offices and are captured by state statistics; In fact, they are in latent
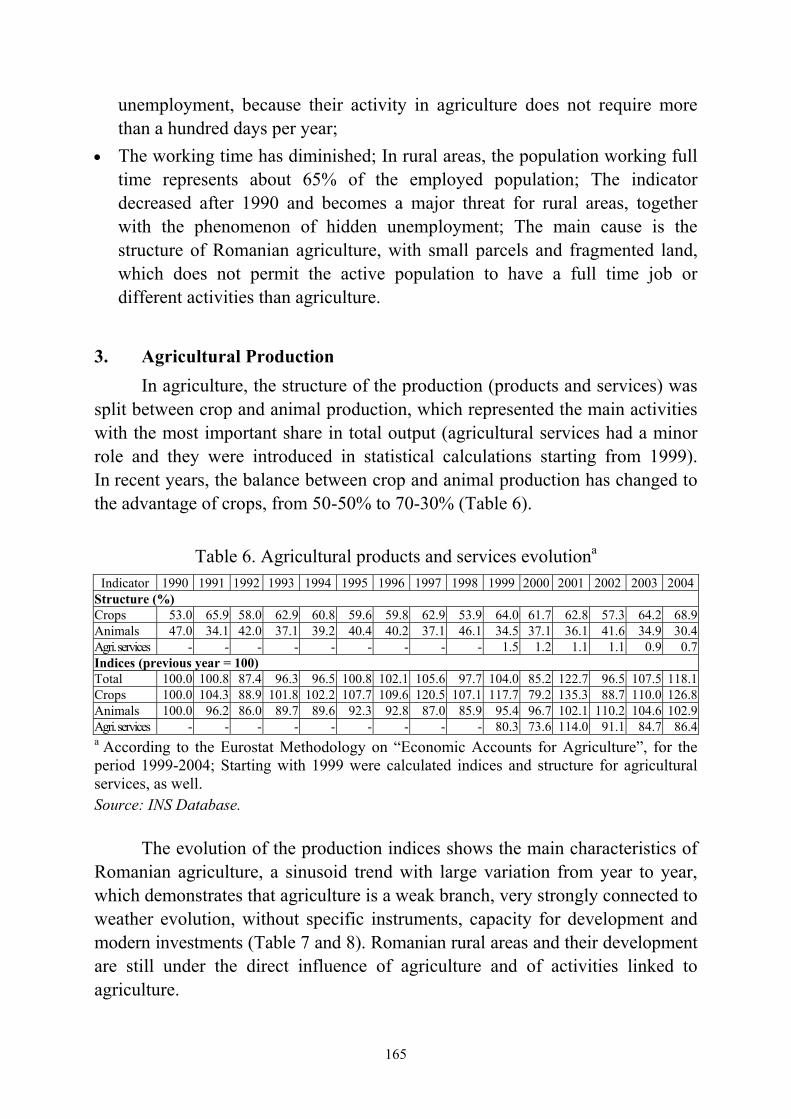
165
unemployment, because their activity in agriculture does not require more than a hundred days per year;
• The working time has diminished; In rural areas, the population working full time represents about 65% of the employed population; The indicator decreased after 1990 and becomes a major threat for rural areas, together with the phenomenon of hidden unemployment; The main cause is the structure of Romanian agriculture, with small parcels and fragmented land, which does not permit the active population to have a full time job or different activities than agriculture.
3. Agricultural Production In agriculture, the structure of the production (products and services) was
split between crop and animal production, which represented the main activities with the most important share in total output (agricultural services had a minor role and they were introduced in statistical calculations starting from 1999). In recent years, the balance between crop and animal production has changed to the advantage of crops, from 50-50% to 70-30% (Table 6).
Table 6. Agricultural products and services evolutiona
Indicator 1990 1991 1992 1993 1994 1995 1996 1997 1998 1999 2000 2001 2002 2003 2004Structure (%) Crops 53.0 65.9 58.0 62.9 60.8 59.6 59.8 62.9 53.9 64.0 61.7 62.8 57.3 64.2 68.9Animals 47.0 34.1 42.0 37.1 39.2 40.4 40.2 37.1 46.1 34.5 37.1 36.1 41.6 34.9 30.4Agri. services - - - - - - - - - 1.5 1.2 1.1 1.1 0.9 0.7Indices (previous year = 100) Total 100.0 100.8 87.4 96.3 96.5 100.8 102.1 105.6 97.7 104.0 85.2 122.7 96.5 107.5 118.1Crops 100.0 104.3 88.9 101.8 102.2 107.7 109.6 120.5 107.1 117.7 79.2 135.3 88.7 110.0 126.8Animals 100.0 96.2 86.0 89.7 89.6 92.3 92.8 87.0 85.9 95.4 96.7 102.1 110.2 104.6 102.9Agri. services - - - - - - - - - 80.3 73.6 114.0 91.1 84.7 86.4a According to the Eurostat Methodology on “Economic Accounts for Agriculture”, for the period 1999-2004; Starting with 1999 were calculated indices and structure for agricultural services, as well. Source: INS Database.
The evolution of the production indices shows the main characteristics of Romanian agriculture, a sinusoid trend with large variation from year to year, which demonstrates that agriculture is a weak branch, very strongly connected to weather evolution, without specific instruments, capacity for development and modern investments (Table 7 and 8). Romanian rural areas and their development are still under the direct influence of agriculture and of activities linked to agriculture.

166
Table 7. Area and production by main cereals
There in: Total crops Total cereals
Wheat & rye Corn & sorghum Year Area
(ha’000) Area
(ha’000) Production(ton’000)
Area (ha’000)
Production(ton’000)
Area (ha’000)
Production(ton’000)
1990 9,402.1 5,704.0 17,173.5 2,297.7 7,379.0 2,471.9 6,813.1 1991 9,197.3 6,049.0 19,306.6 2,217.1 5,558.9 2,578.8 10,503.3 1992 8,909.1 5,773.9 12,288.5 1,475.4 3,227.6 3,344.1 6,832.8 1993 9,166.1 6,395.0 15,493.1 2,307.4 5,354.5 3,071.3 7,993.0 1994 9,220.0 6,557.6 18,183.8 2,440.9 6,186.5 2,991.0 9,350.3 1995 9,224.6 6,444.8 19,882.8 2,501.4 7,709.3 3,115.0 9,927.5 1996 8,878.8 5,842.8 14,199.7 1,797.7 3,164.1 3,284.3 9,612.2 1997 9,059.8 6,319.8 22,107.3 2,424.4 7,185.6 3,043.0 12,691.5 1998 8,972.6 5,920.6 15,452.7 2,033.4 5,207.9 3,136.1 8,634.8 1999 8,493.9 5,370.7 17,037.3 1,686.9 4,682.5 3,015.1 10,937.3 2000 8,499.8 5,655.2 10,477.5 1,954.3 4,456.2 3,051.0 4,899.1 2001 8,905.0 6,294.9 18,870.9 2,558.6 7,763.8 2,980.2 9,124.8 2002 9,001.6 6,038.1 14,356.5 2,309.8 4,441.1 2,897.3 8,402.4 2003 8,880.6 5,541.8 12,964.4 1,748.0 2,496.4 3,206.5 9,582.0 2004 8,527.8 6,265.4 24,403.0 2,317.8 7,867.4 3,282.8 14,570.0 Source: INS Database.
Table 8. The share of the main crops in total area (%) Crop 1990 1991 1992 1993 1994 1995 1996 1997 1998 1999 2000 2001 2002 2003 2004
Wheat & rye 24.44 24.11 16.56 25.17 26.47 27.12 20.25 26.76 22.66 19.86 22.99 28.73 25.66 19.68 27.18
Corn & sorghum 26.29 28.04 37.54 33.51 32.44 33.77 36.99 33.59 34.95 35.50 35.89 33.47 32.19 36.11 38.50
Sunflower 4.20 5.18 6.84 6.42 6.31 7.75 10.33 8.62 10.72 12.28 10.32 10.97 13.20 10.20 9.38Potatoes 3.08 2.55 2.45 2.72 2.70 2.65 2.89 2.81 2.91 3.22 3.33 3.11 3.15 3.18 3.12Source: Processing of data from INS.
We shall analyze Romanian agriculture focusing on the evolution of the main crops and changes in their structure (from the point of view of area under cultivation and output), sunflower, sugar beet, potatoes, vegetables and fruit.
The crop structure is highly extensive and dominated by field crops (about 65% of arable land). The main crops cultivated in Romania are: wheat, rye, corn and sorghum (Figure 1 and 2).

167
Figure 1. Production by main cereals (t’000)
0
5,000
10,000
15,000
20,000
25,000
30,000
1990 1991 1992 1993 1994 1995 1996 1997 1998 1999 2000 2001 2002 2003 2004
Cereals Wheat & rye Corn & sorghum Source: National Institute of Statistic Database
Acreage variation, in the case of total crops, was in the range of one million hectares in the last fifteen years, with a decreasing trend especially in the second part of the period. A large area of land (up to one million ha) was set aside from agricultural use and turned into idle land. Some land was destroyed due to the lack of investments and natural degradation, some was unused and abandoned by the owners because of their incapacity to adapt to the market economy, a insufficient financial resources and obsolete technologies.
In the case of cereals, the general characteristic is a large year to year variation of the cultivated area, which reflects the lack of consistency in Romanian agricultural policy. Analyzed separately, cereals have the same characteristics when we take into consideration the area.
The dynamics of production were very closely connected to climatic evolution and the results are well shown in Table 7 and Figure 1. One explanation of these results is the lack of irrigation, little use of pesticides in Romanian agriculture and, additionally, the lack of investment in mechanization and modern technologies, as well as land fragmentation.
Generally, Romania cultivated and produced more corn and sorghum than wheat and rye (see Table 8). Together they accounted for over 50% of total crops acreage in every year of transition (corn and sorghum alone reached almost 40% in 2004; all together they reached over 65% in 2004). This is a characteristic of Romanian agriculture in the transition period, which became mostly “cereal country”, similarly as before the Second World War.
At the same time, we can observe that, especially in the case of corn and sorghum, on almost the same cultivated area Romania almost doubled the yield
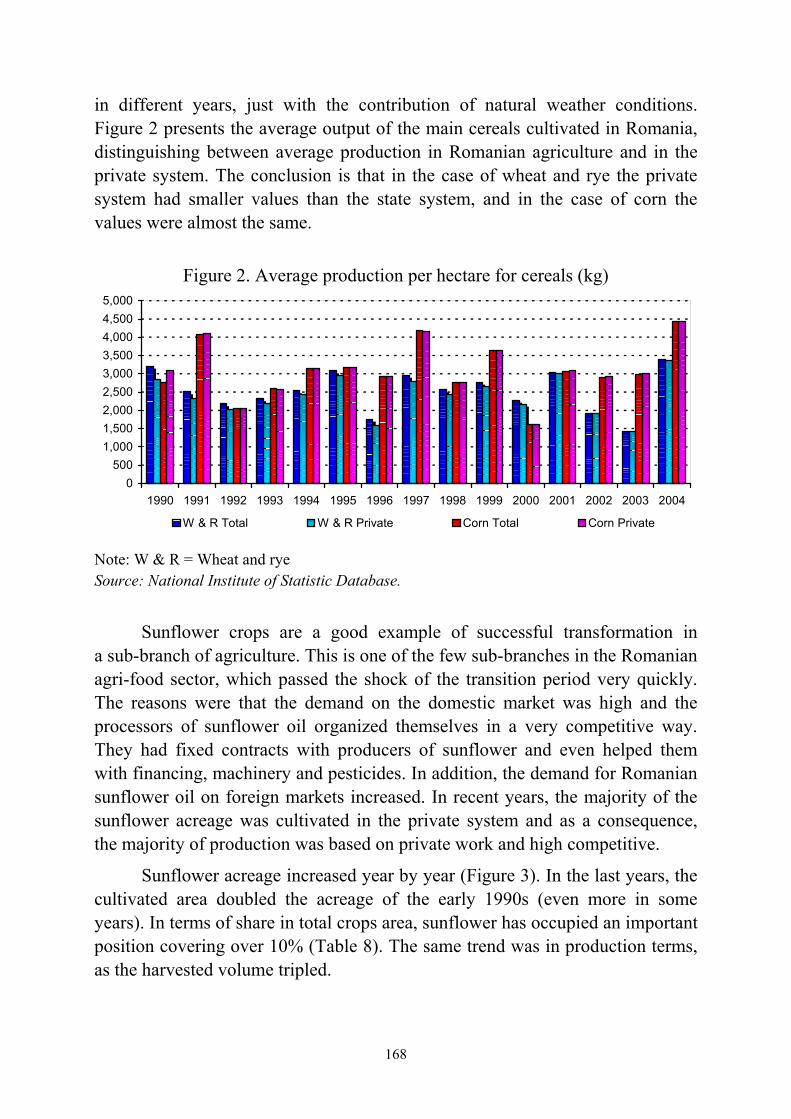
168
in different years, just with the contribution of natural weather conditions. Figure 2 presents the average output of the main cereals cultivated in Romania, distinguishing between average production in Romanian agriculture and in the private system. The conclusion is that in the case of wheat and rye the private system had smaller values than the state system, and in the case of corn the values were almost the same.
Figure 2. Average production per hectare for cereals (kg)
0500
1,0001,5002,0002,5003,0003,5004,0004,5005,000
1990 1991 1992 1993 1994 1995 1996 1997 1998 1999 2000 2001 2002 2003 2004
W & R Total W & R Private Corn Total Corn Private
Note: W & R = Wheat and rye Source: National Institute of Statistic Database.
Sunflower crops are a good example of successful transformation in a sub-branch of agriculture. This is one of the few sub-branches in the Romanian agri-food sector, which passed the shock of the transition period very quickly. The reasons were that the demand on the domestic market was high and the processors of sunflower oil organized themselves in a very competitive way. They had fixed contracts with producers of sunflower and even helped them with financing, machinery and pesticides. In addition, the demand for Romanian sunflower oil on foreign markets increased. In recent years, the majority of the sunflower acreage was cultivated in the private system and as a consequence, the majority of production was based on private work and high competitive.
Sunflower acreage increased year by year (Figure 3). In the last years, the cultivated area doubled the acreage of the early 1990s (even more in some years). In terms of share in total crops area, sunflower has occupied an important position covering over 10% (Table 8). The same trend was in production terms, as the harvested volume tripled.
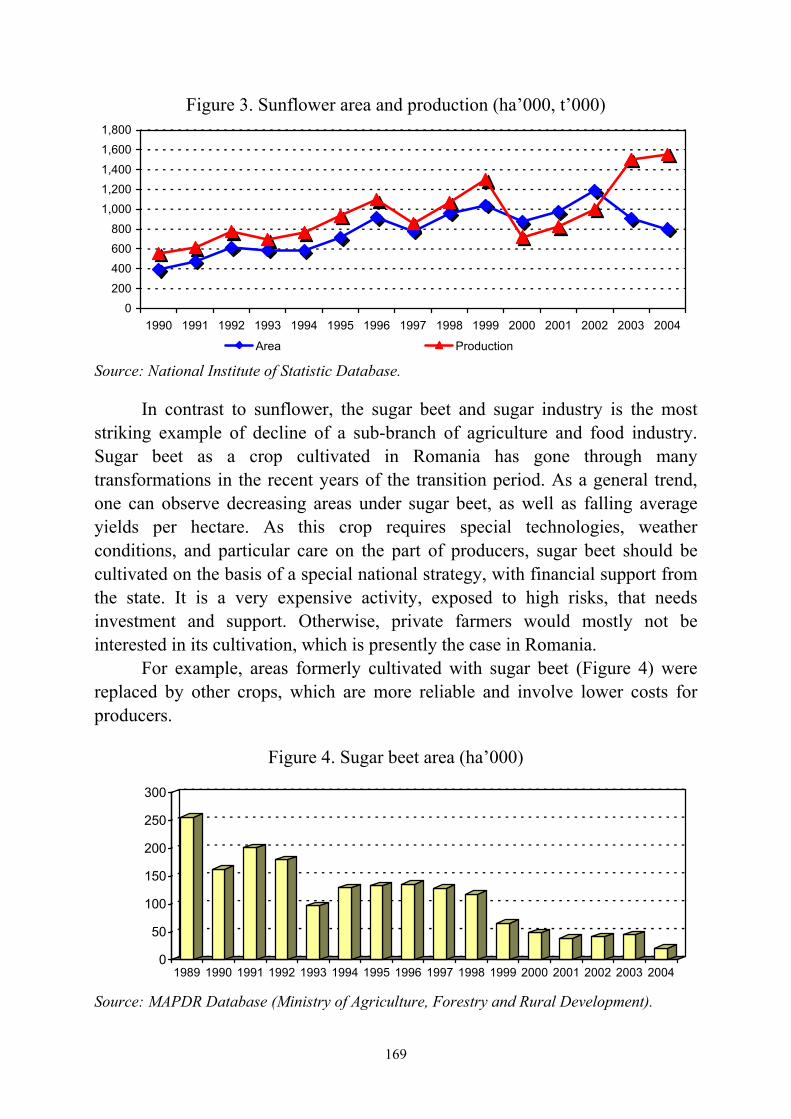
169
Figure 3. Sunflower area and production (ha’000, t’000)
0200
400600800
1,0001,2001,400
1,6001,800
1990 1991 1992 1993 1994 1995 1996 1997 1998 1999 2000 2001 2002 2003 2004
Area Production Source: National Institute of Statistic Database.
In contrast to sunflower, the sugar beet and sugar industry is the most striking example of decline of a sub-branch of agriculture and food industry. Sugar beet as a crop cultivated in Romania has gone through many transformations in the recent years of the transition period. As a general trend, one can observe decreasing areas under sugar beet, as well as falling average yields per hectare. As this crop requires special technologies, weather conditions, and particular care on the part of producers, sugar beet should be cultivated on the basis of a special national strategy, with financial support from the state. It is a very expensive activity, exposed to high risks, that needs investment and support. Otherwise, private farmers would mostly not be interested in its cultivation, which is presently the case in Romania.
For example, areas formerly cultivated with sugar beet (Figure 4) were replaced by other crops, which are more reliable and involve lower costs for producers.
Figure 4. Sugar beet area (ha’000)
Source: MAPDR Database (Ministry of Agriculture, Forestry and Rural Development).
0
50
100
150
200
250
300
1989 1990 1991 1992 1993 1994 1995 1996 1997 1998 1999 2000 2001 2002 2003 2004
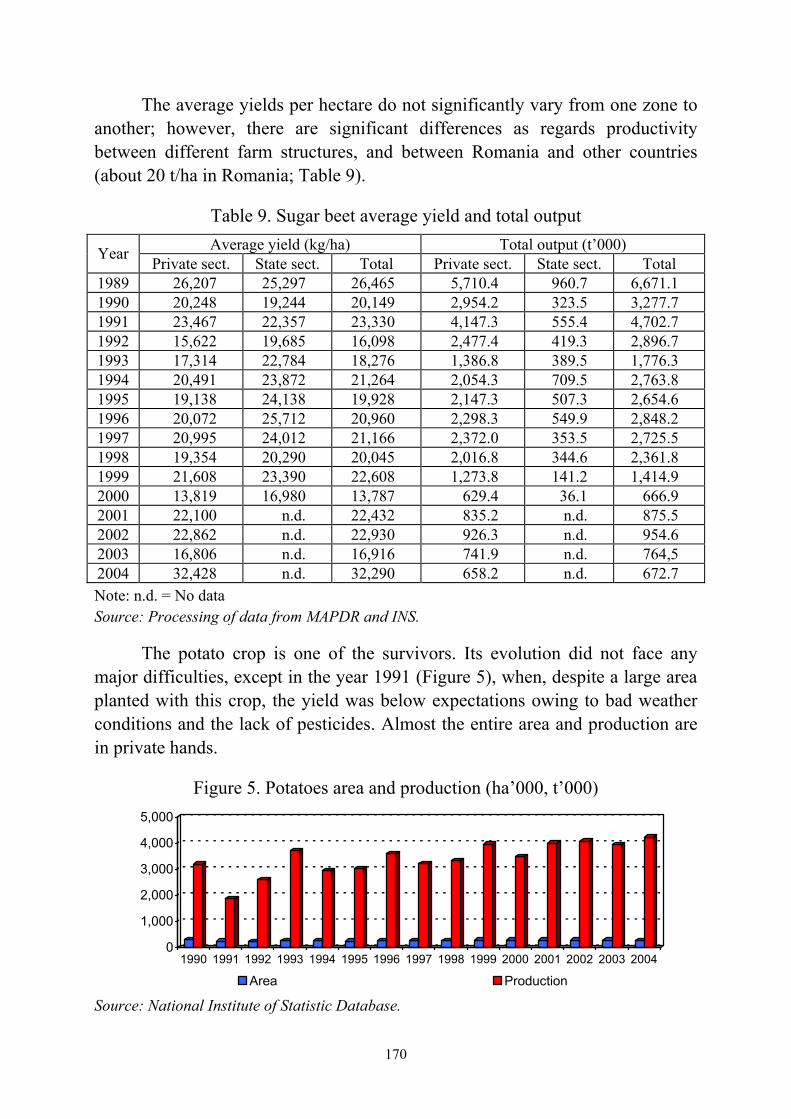
170
The average yields per hectare do not significantly vary from one zone to another; however, there are significant differences as regards productivity between different farm structures, and between Romania and other countries (about 20 t/ha in Romania; Table 9).
Table 9. Sugar beet average yield and total output Average yield (kg/ha) Total output (t’000) Year Private sect. State sect. Total Private sect. State sect. Total
1989 26,207 25,297 26,465 5,710.4 960.7 6,671.1 1990 20,248 19,244 20,149 2,954.2 323.5 3,277.7 1991 23,467 22,357 23,330 4,147.3 555.4 4,702.7 1992 15,622 19,685 16,098 2,477.4 419.3 2,896.7 1993 17,314 22,784 18,276 1,386.8 389.5 1,776.3 1994 20,491 23,872 21,264 2,054.3 709.5 2,763.8 1995 19,138 24,138 19,928 2,147.3 507.3 2,654.6 1996 20,072 25,712 20,960 2,298.3 549.9 2,848.2 1997 20,995 24,012 21,166 2,372.0 353.5 2,725.5 1998 19,354 20,290 20,045 2,016.8 344.6 2,361.8 1999 21,608 23,390 22,608 1,273.8 141.2 1,414.9 2000 13,819 16,980 13,787 629.4 36.1 666.9 2001 22,100 n.d. 22,432 835.2 n.d. 875.5 2002 22,862 n.d. 22,930 926.3 n.d. 954.6 2003 16,806 n.d. 16,916 741.9 n.d. 764,5 2004 32,428 n.d. 32,290 658.2 n.d. 672.7 Note: n.d. = No data Source: Processing of data from MAPDR and INS.
The potato crop is one of the survivors. Its evolution did not face any major difficulties, except in the year 1991 (Figure 5), when, despite a large area planted with this crop, the yield was below expectations owing to bad weather conditions and the lack of pesticides. Almost the entire area and production are in private hands.
Figure 5. Potatoes area and production (ha’000, t’000)
0
1,000
2,000
3,000
4,000
5,000
1990 1991 1992 1993 1994 1995 1996 1997 1998 1999 2000 2001 2002 2003 2004
Area Production
Source: National Institute of Statistic Database.

171
In the case of vegetables and fruit (Figure 6), the evolution of the cultivation area and production were under the influence of barriers of the transition period similarly as other crops (except for the year 2004 for vegetables). Viniculture and fruit growing have an important place in Romanian crop production because of their big natural potential. Despite of this potential, the domestic performance was weak. In viniculture, the main challenge was the quality, because of the expansion of hybrids and soil degradation. The same situation concerned fruit growing. The lack of new investments and fertilizers had an important impact on productivity. At the same time, a large horticultural area was destroyed by cutting (Figure 6). For these reasons, Romania became an importer of vegetables and fruit.
Figure 6. Vegetables and fruits area and production (ha’000; t’000)
0
50
100
150
200
250
300
350
1990 1991 1992 1993 1994 1995 1996 1997 1998 1999 2000 2001 2002 2003 2004
ha'0
00
0
1,000
2,000
3,000
4,000
5,000
6,000
t'000
Vegetables Area Fruits Area Vegetables Production Fruits Production
Source: INS Database.
Average per capita production of the main crops in Romania (Table 10) is inferior to the performance in other Central and Eastern European Countries and reflects the lengthy Romanian transition, with negative effects on the balance of trade, the balance of payments, and not the least, on the quality of food and standard of living. The gap between production and consumption is covered by imports, not always at the best quality level.
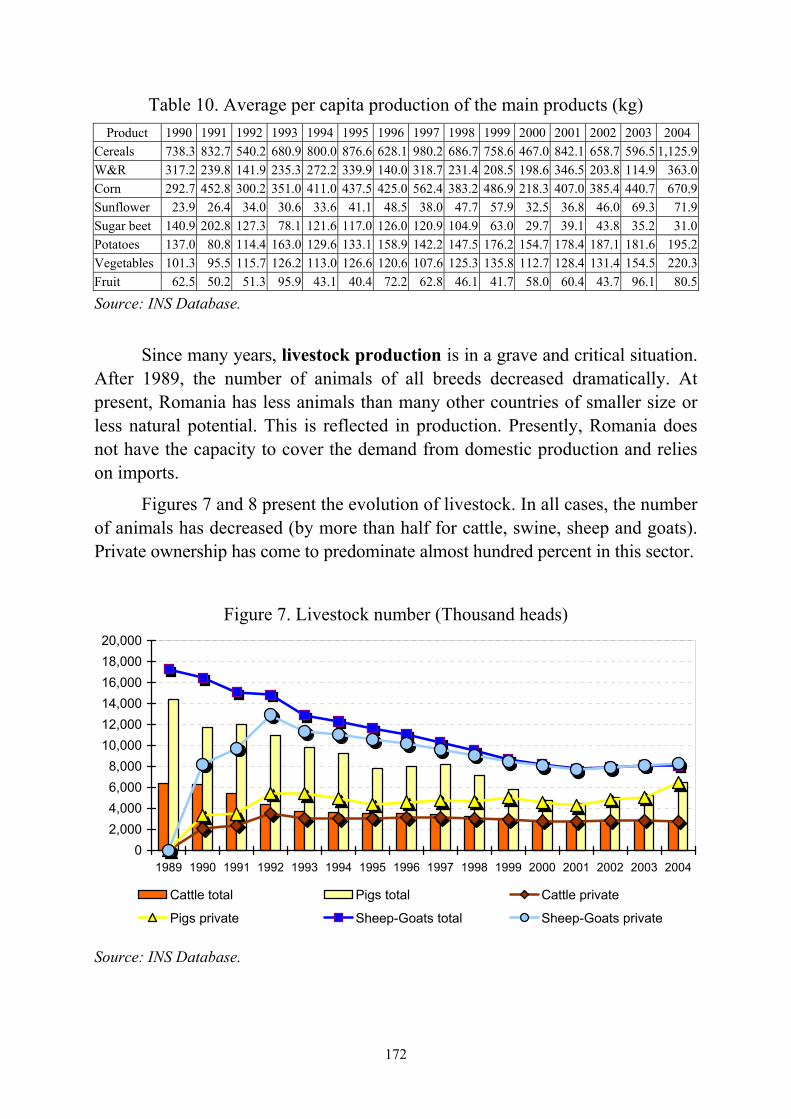
172
Table 10. Average per capita production of the main products (kg) Product 1990 1991 1992 1993 1994 1995 1996 1997 1998 1999 2000 2001 2002 2003 2004
Cereals 738.3 832.7 540.2 680.9 800.0 876.6 628.1 980.2 686.7 758.6 467.0 842.1 658.7 596.5 1,125.9W&R 317.2 239.8 141.9 235.3 272.2 339.9 140.0 318.7 231.4 208.5 198.6 346.5 203.8 114.9 363.0Corn 292.7 452.8 300.2 351.0 411.0 437.5 425.0 562.4 383.2 486.9 218.3 407.0 385.4 440.7 670.9Sunflower 23.9 26.4 34.0 30.6 33.6 41.1 48.5 38.0 47.7 57.9 32.5 36.8 46.0 69.3 71.9Sugar beet 140.9 202.8 127.3 78.1 121.6 117.0 126.0 120.9 104.9 63.0 29.7 39.1 43.8 35.2 31.0Potatoes 137.0 80.8 114.4 163.0 129.6 133.1 158.9 142.2 147.5 176.2 154.7 178.4 187.1 181.6 195.2Vegetables 101.3 95.5 115.7 126.2 113.0 126.6 120.6 107.6 125.3 135.8 112.7 128.4 131.4 154.5 220.3Fruit 62.5 50.2 51.3 95.9 43.1 40.4 72.2 62.8 46.1 41.7 58.0 60.4 43.7 96.1 80.5
Source: INS Database.
Since many years, livestock production is in a grave and critical situation. After 1989, the number of animals of all breeds decreased dramatically. At present, Romania has less animals than many other countries of smaller size or less natural potential. This is reflected in production. Presently, Romania does not have the capacity to cover the demand from domestic production and relies on imports.
Figures 7 and 8 present the evolution of livestock. In all cases, the number of animals has decreased (by more than half for cattle, swine, sheep and goats). Private ownership has come to predominate almost hundred percent in this sector.
Figure 7. Livestock number (Thousand heads)
02,0004,0006,0008,000
10,00012,00014,00016,00018,00020,000
1989 1990 1991 1992 1993 1994 1995 1996 1997 1998 1999 2000 2001 2002 2003 2004
Cattle total Pigs total Cattle private
Pigs private Sheep-Goats total Sheep-Goats private
Source: INS Database.
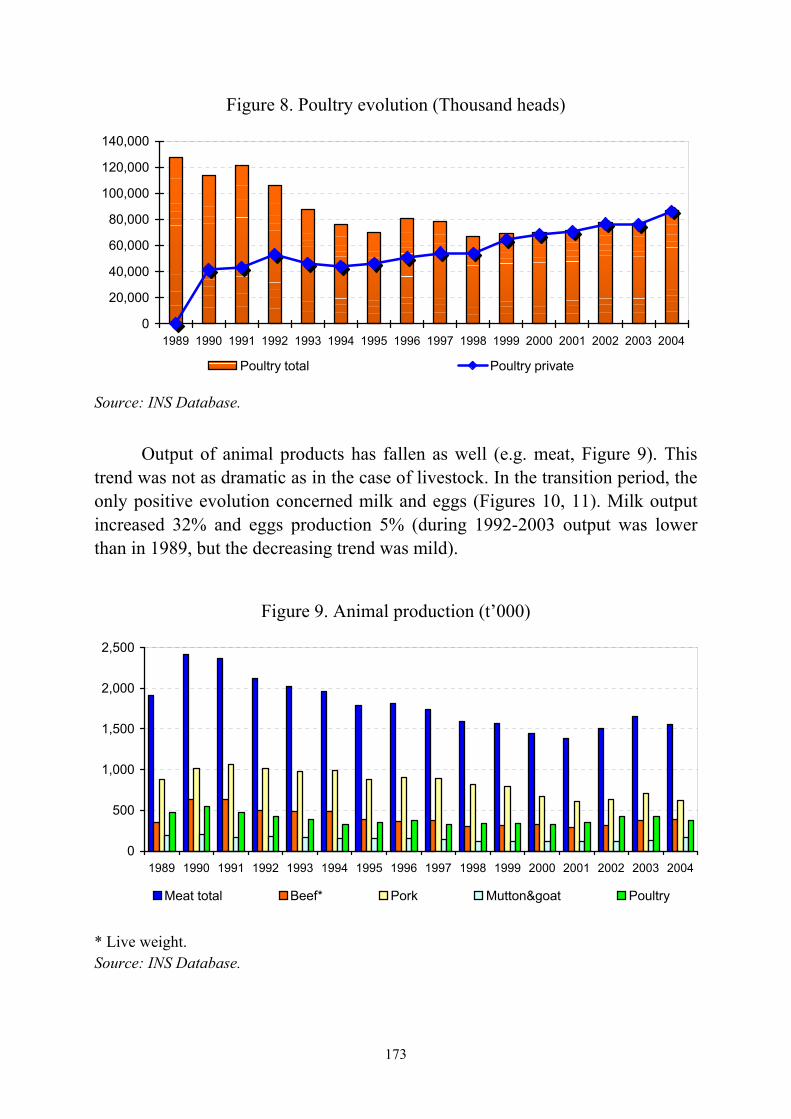
173
Figure 8. Poultry evolution (Thousand heads)
0
20,000
40,000
60,000
80,000
100,000
120,000
140,000
1989 1990 1991 1992 1993 1994 1995 1996 1997 1998 1999 2000 2001 2002 2003 2004
Poultry total Poultry private
Source: INS Database.
Output of animal products has fallen as well (e.g. meat, Figure 9). This trend was not as dramatic as in the case of livestock. In the transition period, the only positive evolution concerned milk and eggs (Figures 10, 11). Milk output increased 32% and eggs production 5% (during 1992-2003 output was lower than in 1989, but the decreasing trend was mild).
Figure 9. Animal production (t’000)
0
500
1,000
1,500
2,000
2,500
1989 1990 1991 1992 1993 1994 1995 1996 1997 1998 1999 2000 2001 2002 2003 2004
Meat total Beef* Pork Mutton&goat Poultry
* Live weight. Source: INS Database.
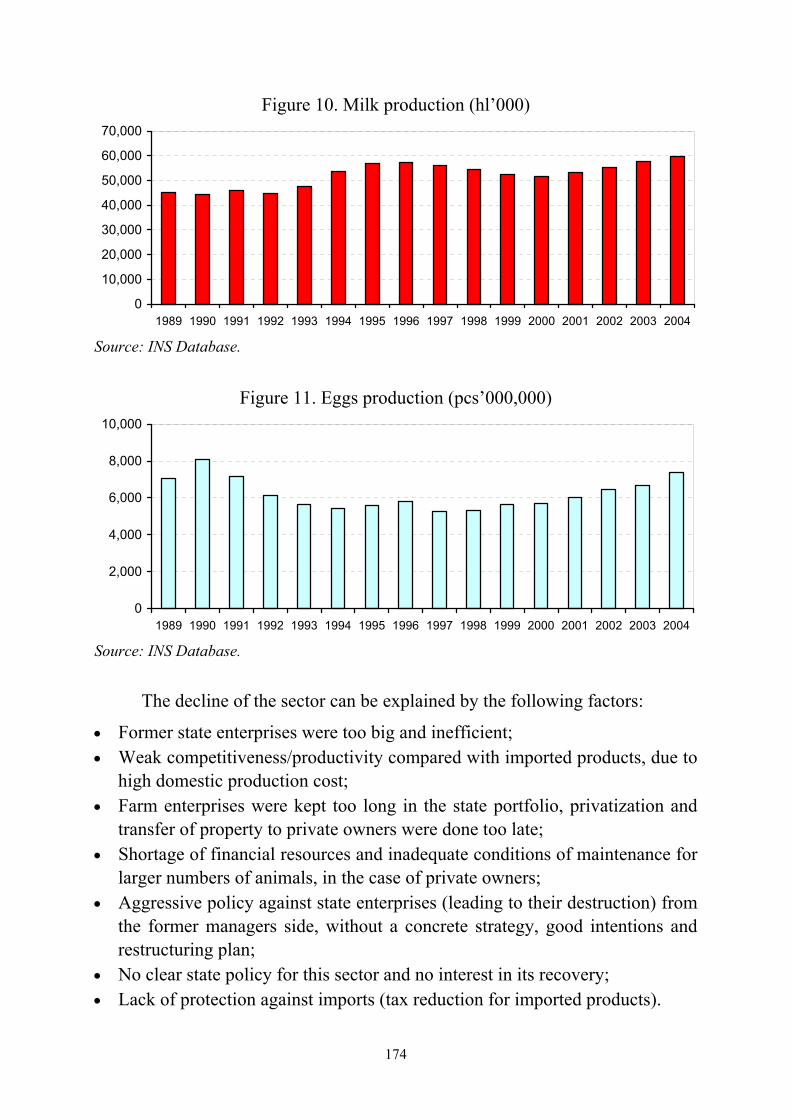
174
Figure 10. Milk production (hl’000)
0
10,000
20,000
30,000
40,000
50,000
60,000
70,000
1989 1990 1991 1992 1993 1994 1995 1996 1997 1998 1999 2000 2001 2002 2003 2004
Source: INS Database.
Figure 11. Eggs production (pcs’000,000)
0
2,000
4,000
6,000
8,000
10,000
1989 1990 1991 1992 1993 1994 1995 1996 1997 1998 1999 2000 2001 2002 2003 2004
Source: INS Database.
The decline of the sector can be explained by the following factors:
• Former state enterprises were too big and inefficient; • Weak competitiveness/productivity compared with imported products, due to
high domestic production cost; • Farm enterprises were kept too long in the state portfolio, privatization and
transfer of property to private owners were done too late; • Shortage of financial resources and inadequate conditions of maintenance for
larger numbers of animals, in the case of private owners; • Aggressive policy against state enterprises (leading to their destruction) from
the former managers side, without a concrete strategy, good intentions and restructuring plan;
• No clear state policy for this sector and no interest in its recovery; • Lack of protection against imports (tax reduction for imported products).
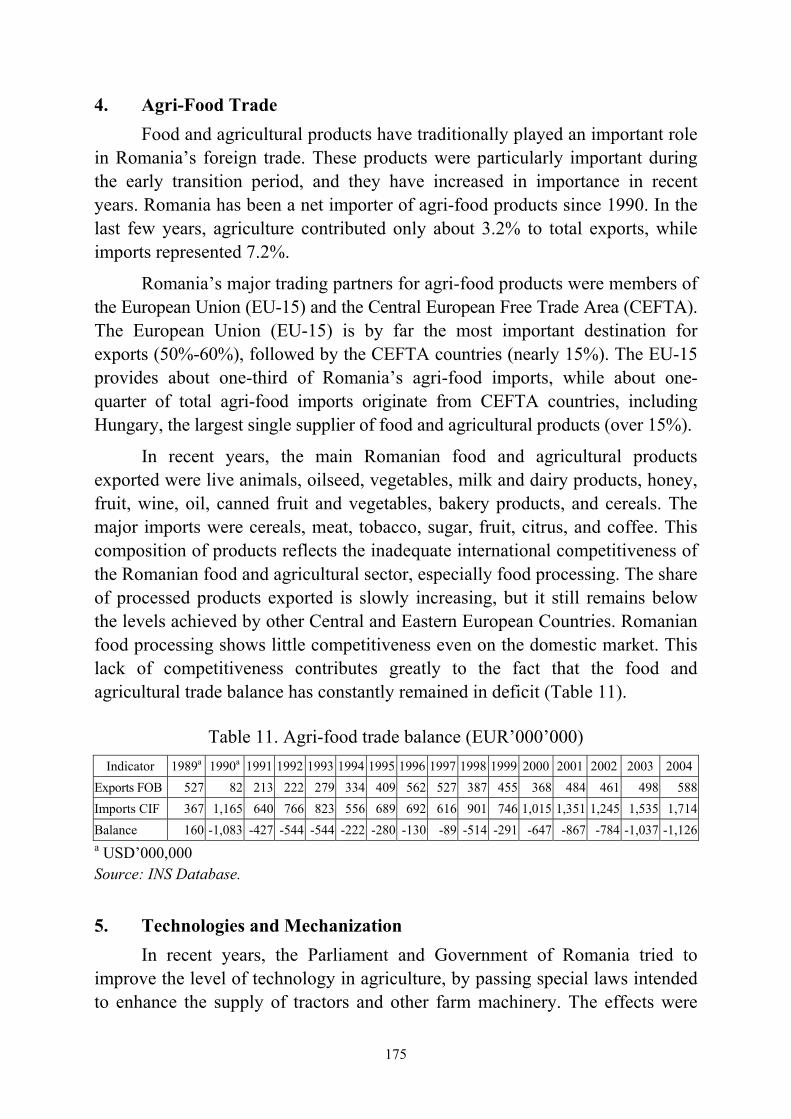
175
4. Agri-Food Trade Food and agricultural products have traditionally played an important role
in Romania’s foreign trade. These products were particularly important during the early transition period, and they have increased in importance in recent years. Romania has been a net importer of agri-food products since 1990. In the last few years, agriculture contributed only about 3.2% to total exports, while imports represented 7.2%.
Romania’s major trading partners for agri-food products were members of the European Union (EU-15) and the Central European Free Trade Area (CEFTA). The European Union (EU-15) is by far the most important destination for exports (50%-60%), followed by the CEFTA countries (nearly 15%). The EU-15 provides about one-third of Romania’s agri-food imports, while about one-quarter of total agri-food imports originate from CEFTA countries, including Hungary, the largest single supplier of food and agricultural products (over 15%).
In recent years, the main Romanian food and agricultural products exported were live animals, oilseed, vegetables, milk and dairy products, honey, fruit, wine, oil, canned fruit and vegetables, bakery products, and cereals. The major imports were cereals, meat, tobacco, sugar, fruit, citrus, and coffee. This composition of products reflects the inadequate international competitiveness of the Romanian food and agricultural sector, especially food processing. The share of processed products exported is slowly increasing, but it still remains below the levels achieved by other Central and Eastern European Countries. Romanian food processing shows little competitiveness even on the domestic market. This lack of competitiveness contributes greatly to the fact that the food and agricultural trade balance has constantly remained in deficit (Table 11).
Table 11. Agri-food trade balance (EUR’000’000)
Indicator 1989a 1990a 1991 1992 1993 1994 1995 1996 1997 1998 1999 2000 2001 2002 2003 2004Exports FOB 527 82 213 222 279 334 409 562 527 387 455 368 484 461 498 588Imports CIF 367 1,165 640 766 823 556 689 692 616 901 746 1,015 1,351 1,245 1,535 1,714Balance 160 -1,083 -427 -544 -544 -222 -280 -130 -89 -514 -291 -647 -867 -784 -1,037 -1,126a USD’000,000 Source: INS Database.
5. Technologies and Mechanization In recent years, the Parliament and Government of Romania tried to
improve the level of technology in agriculture, by passing special laws intended to enhance the supply of tractors and other farm machinery. The effects were
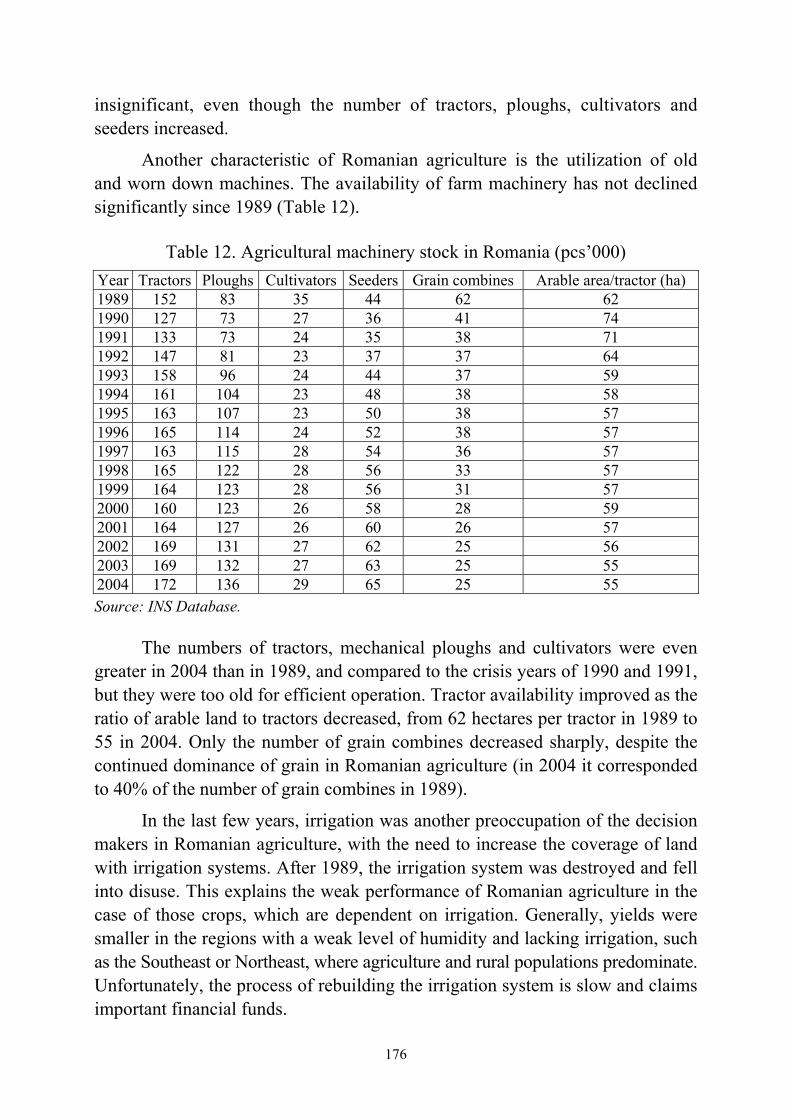
176
insignificant, even though the number of tractors, ploughs, cultivators and seeders increased.
Another characteristic of Romanian agriculture is the utilization of old and worn down machines. The availability of farm machinery has not declined significantly since 1989 (Table 12).
Table 12. Agricultural machinery stock in Romania (pcs’000)
Year Tractors Ploughs Cultivators Seeders Grain combines Arable area/tractor (ha) 1989 152 83 35 44 62 62 1990 127 73 27 36 41 74 1991 133 73 24 35 38 71 1992 147 81 23 37 37 64 1993 158 96 24 44 37 59 1994 161 104 23 48 38 58 1995 163 107 23 50 38 57 1996 165 114 24 52 38 57 1997 163 115 28 54 36 57 1998 165 122 28 56 33 57 1999 164 123 28 56 31 57 2000 160 123 26 58 28 59 2001 164 127 26 60 26 57 2002 169 131 27 62 25 56 2003 169 132 27 63 25 55 2004 172 136 29 65 25 55 Source: INS Database.
The numbers of tractors, mechanical ploughs and cultivators were even greater in 2004 than in 1989, and compared to the crisis years of 1990 and 1991, but they were too old for efficient operation. Tractor availability improved as the ratio of arable land to tractors decreased, from 62 hectares per tractor in 1989 to 55 in 2004. Only the number of grain combines decreased sharply, despite the continued dominance of grain in Romanian agriculture (in 2004 it corresponded to 40% of the number of grain combines in 1989).
In the last few years, irrigation was another preoccupation of the decision makers in Romanian agriculture, with the need to increase the coverage of land with irrigation systems. After 1989, the irrigation system was destroyed and fell into disuse. This explains the weak performance of Romanian agriculture in the case of those crops, which are dependent on irrigation. Generally, yields were smaller in the regions with a weak level of humidity and lacking irrigation, such as the Southeast or Northeast, where agriculture and rural populations predominate. Unfortunately, the process of rebuilding the irrigation system is slow and claims important financial funds.
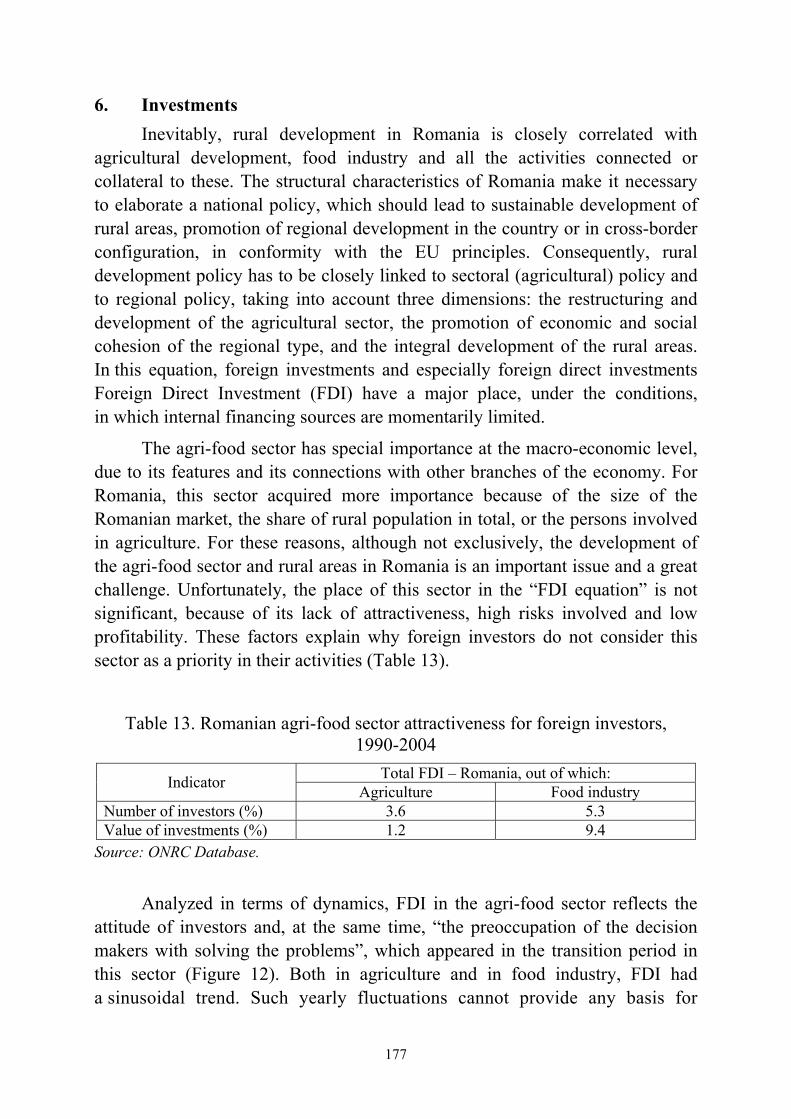
177
6. Investments Inevitably, rural development in Romania is closely correlated with
agricultural development, food industry and all the activities connected or collateral to these. The structural characteristics of Romania make it necessary to elaborate a national policy, which should lead to sustainable development of rural areas, promotion of regional development in the country or in cross-border configuration, in conformity with the EU principles. Consequently, rural development policy has to be closely linked to sectoral (agricultural) policy and to regional policy, taking into account three dimensions: the restructuring and development of the agricultural sector, the promotion of economic and social cohesion of the regional type, and the integral development of the rural areas. In this equation, foreign investments and especially foreign direct investments Foreign Direct Investment (FDI) have a major place, under the conditions, in which internal financing sources are momentarily limited.
The agri-food sector has special importance at the macro-economic level, due to its features and its connections with other branches of the economy. For Romania, this sector acquired more importance because of the size of the Romanian market, the share of rural population in total, or the persons involved in agriculture. For these reasons, although not exclusively, the development of the agri-food sector and rural areas in Romania is an important issue and a great challenge. Unfortunately, the place of this sector in the “FDI equation” is not significant, because of its lack of attractiveness, high risks involved and low profitability. These factors explain why foreign investors do not consider this sector as a priority in their activities (Table 13).
Table 13. Romanian agri-food sector attractiveness for foreign investors, 1990-2004
Total FDI – Romania, out of which: Indicator Agriculture Food industry Number of investors (%) 3.6 5.3 Value of investments (%) 1.2 9.4
Source: ONRC Database.
Analyzed in terms of dynamics, FDI in the agri-food sector reflects the attitude of investors and, at the same time, “the preoccupation of the decision makers with solving the problems”, which appeared in the transition period in this sector (Figure 12). Both in agriculture and in food industry, FDI had a sinusoidal trend. Such yearly fluctuations cannot provide any basis for
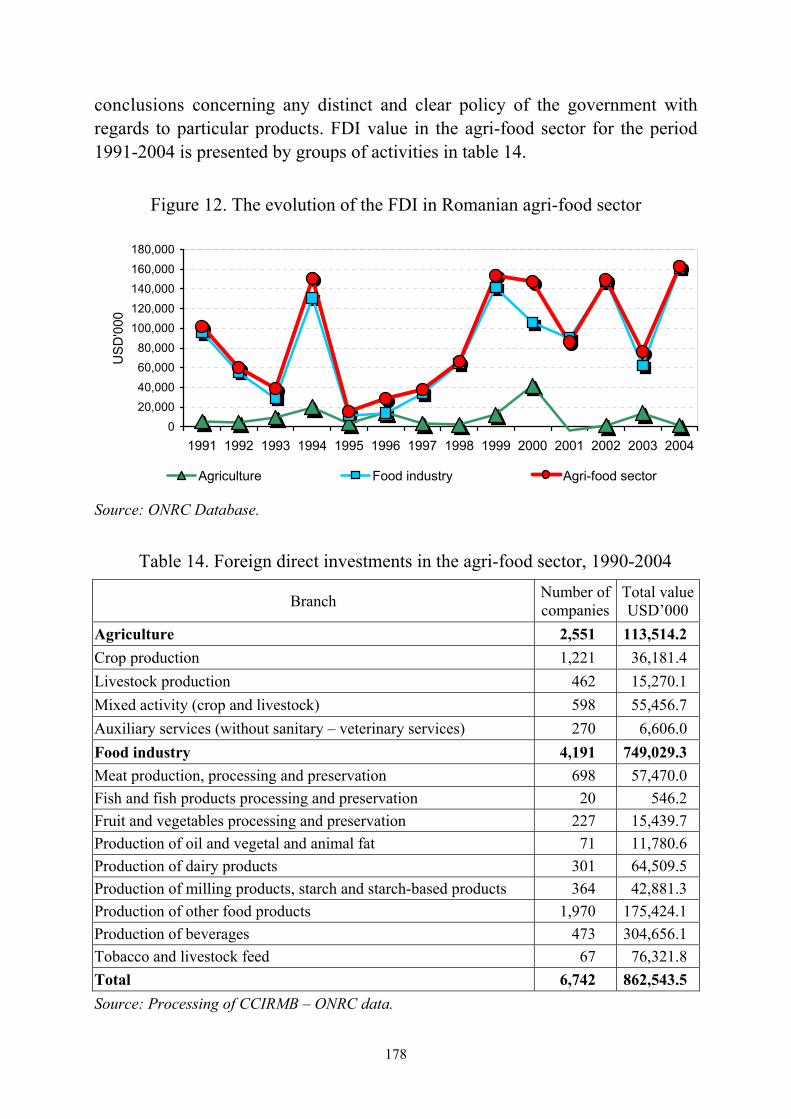
178
conclusions concerning any distinct and clear policy of the government with regards to particular products. FDI value in the agri-food sector for the period 1991-2004 is presented by groups of activities in table 14.
Figure 12. The evolution of the FDI in Romanian agri-food sector
Source: ONRC Database.
Table 14. Foreign direct investments in the agri-food sector, 1990-2004
Branch Number of companies
Total valueUSD’000
Agriculture 2,551 113,514.2 Crop production 1,221 36,181.4 Livestock production 462 15,270.1 Mixed activity (crop and livestock) 598 55,456.7 Auxiliary services (without sanitary – veterinary services) 270 6,606.0 Food industry 4,191 749,029.3 Meat production, processing and preservation 698 57,470.0 Fish and fish products processing and preservation 20 546.2 Fruit and vegetables processing and preservation 227 15,439.7 Production of oil and vegetal and animal fat 71 11,780.6 Production of dairy products 301 64,509.5 Production of milling products, starch and starch-based products 364 42,881.3 Production of other food products 1,970 175,424.1 Production of beverages 473 304,656.1 Tobacco and livestock feed 67 76,321.8 Total 6,742 862,543.5 Source: Processing of CCIRMB – ONRC data.
020,00040,00060,00080,000
100,000120,000140,000160,000180,000
1991 1992 1993 1994 1995 1996 1997 1998 1999 2000 2001 2002 2003 2004
USD
'000
Agriculture Food industry Agri-food sector

179
Out of the total number of commercial companies registered in the agri-food sector 37.8% from the companies were established in agriculture, while the remaining 62.2% in the food industry. Crop production has the largest share in total agriculture i.e. 47.8%, which reflects the general orientation of entrepreneurs. In food industry, many companies were registered in production of other food products branch, then in meat and beverage branch, that together account for more than 74.9% of total.
The participation to the nominal capital of commercial companies in foreign currency was not balanced, i.e. 13.1% in agriculture and 86.9% in food industry. The main funds in agriculture went to mixed activity (48.8%), then to crop production (31.8%) and livestock production. In food industry, the capital participation in foreign currency was the following: production of beverages (40.6%), production of other food products (23.4%), dairy products (8.6%).
In conclusion, we can say that the orientation of investment flows in Romanian agri-food economy took place with no significant state support; investors moved into the activity branches with lower risk, in which they could adjust more rapidly to market economy needs, and where consumer demand was strong. The following sectors fulfilled these conditions, hence were more attractive: milling industry, fruit and vegetables, whereas in agriculture crop production and auxiliary services.
7. Conclusions and Recommendations According to our analysis, there are some directions, in which the need for
improvement and change is imperative: in labour, local industries, services and rural crafts, tourism, infrastructure and agriculture.
The human factor will be important for rural development in the future. The main directions must be focused on: professional qualifications of the young generations in activities connected with the rural environment, special programmes for young people to implement their ideas in rural areas (agriculture or non-agricultural activities), identification and stimulation of activities specific for each region and of actors able to start a business, providing a network consultancy special for rural activities. It is possible to increase the level of the rural population occupied in rural activities by implementing a system of incentives for different areas and activities, combined with the transfer of management from the older to the younger generation.
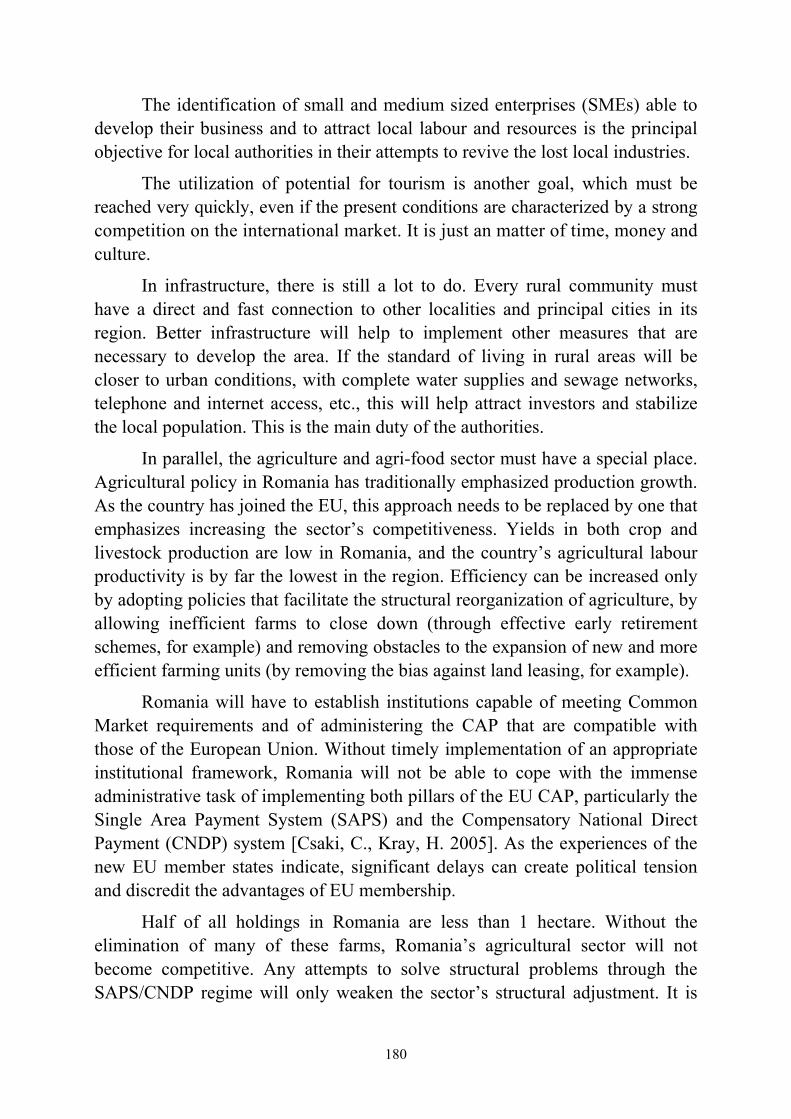
180
The identification of small and medium sized enterprises (SMEs) able to develop their business and to attract local labour and resources is the principal objective for local authorities in their attempts to revive the lost local industries.
The utilization of potential for tourism is another goal, which must be reached very quickly, even if the present conditions are characterized by a strong competition on the international market. It is just an matter of time, money and culture.
In infrastructure, there is still a lot to do. Every rural community must have a direct and fast connection to other localities and principal cities in its region. Better infrastructure will help to implement other measures that are necessary to develop the area. If the standard of living in rural areas will be closer to urban conditions, with complete water supplies and sewage networks, telephone and internet access, etc., this will help attract investors and stabilize the local population. This is the main duty of the authorities.
In parallel, the agriculture and agri-food sector must have a special place. Agricultural policy in Romania has traditionally emphasized production growth. As the country has joined the EU, this approach needs to be replaced by one that emphasizes increasing the sector’s competitiveness. Yields in both crop and livestock production are low in Romania, and the country’s agricultural labour productivity is by far the lowest in the region. Efficiency can be increased only by adopting policies that facilitate the structural reorganization of agriculture, by allowing inefficient farms to close down (through effective early retirement schemes, for example) and removing obstacles to the expansion of new and more efficient farming units (by removing the bias against land leasing, for example).
Romania will have to establish institutions capable of meeting Common Market requirements and of administering the CAP that are compatible with those of the European Union. Without timely implementation of an appropriate institutional framework, Romania will not be able to cope with the immense administrative task of implementing both pillars of the EU CAP, particularly the Single Area Payment System (SAPS) and the Compensatory National Direct Payment (CNDP) system [Csaki, C., Kray, H. 2005]. As the experiences of the new EU member states indicate, significant delays can create political tension and discredit the advantages of EU membership.
Half of all holdings in Romania are less than 1 hectare. Without the elimination of many of these farms, Romania’s agricultural sector will not become competitive. Any attempts to solve structural problems through the SAPS/CNDP regime will only weaken the sector’s structural adjustment. It is

181
therefore recommended that the government should clearly separate rural development and rural social measures from agricultural income support.
One of the original goals of transition was to eliminate the large farm bias built into the Romanian agricultural mentality since 1948. Commercial farming should be supported and encouraged in Romania, but support should be based on measures of commercial activity, not size. The objective should be to help small farmers increase their level of commercialization, something that cannot be achieved by cutting them off from subsidies because of their size.
Consolidation of small farms should be encouraged, because empirical evidence from farm surveys in Romania and other countries indicates that owning more land is associated with a higher standard of living in rural households. Consolidation will occur naturally when farming becomes a profitable business: farmers will seek ways to increase their holdings, if they can earn enough money from agriculture.
Policymakers face two main tasks in the agro-processing sector: they need to facilitate the consolidation of privatized agro-processing industries, and they need to promote and attract (FDI) into the sector. The government should study the experience of other European countries (especially Ireland) in encouraging FDI. No special measures are needed to attract foreign investment into the food retail or restaurant business, but it is imperative to attract FDI for modernizing and upgrading privatized agro-processing firms.
The government should also develop policies that encourage domestic investment in small and medium-size processing plants in rural areas. Food processing is an ideal complement to the agricultural activities of the rural population, and it can be set up in villages with little effort or investment. In addition, to increasing the income of entrepreneurial families, this activity would create local jobs. These policies should be part of a forward-looking rural development strategy that no longer relies on simply providing subsidies for the purchase of agricultural machinery and equipment.
Most small farms in Romania are subsistence farms that have only marginal contacts with markets. Most of the contacts that do occur are with local markets or in the form of direct sales from the farm. These firms have almost no direct relations with large retailing systems. To benefit from the revolution in retailing, these farms need to be integrated into vertical supply chains. Becoming integrated will require fundamental change on the part of small farmers, many of whom are not willing or able to make such changes. Farms that do not become integrated will either remain as subsistence farms, providing only additional

182
income, or disappear, providing scope for consolidation. Farms that do become integrated will become larger and more commercial, they will adopt improved technologies, and they will meet the challenges of vertical chains.
The financial system needs to be upgraded to meet the requirements of the rural population. Banks and non-bank institutions have made modest progress in recent years and rural credit remains inadequate. The existence of SAPARD grants funds and the need for bank financing of SAPARD-approved farm and agro-industrial projects raise the demand for rural bank lending. The rural banking sector needs to be strengthened to meet these needs. Other problems that may require increased attention include the need to strengthen legal institutions, which are unable to adequately enforce existing collateral laws; develop non-bank sources of finance, including reduction of tax constraints on equipment leasing firms; support expansion (and regulation) of micro-finance institutions serving rural clients; and support the development of private sector risk management tools in rural areas.
References
1. Csaki C., Kray H., Romanian Food and Agriculture from a European Perspective, ECSSD-Environmentally and Socially Sustainable Development, Working Paper No. 39, WB, Bucarest 2005.
2. Dumitru M., Diminescu D., Lazea V., Rural Development and the Reform of Romanian Agriculture, Collection “Studii IER” no. 10-11, European Institute in Romania, Bucarest 2004.
3. Rusu M., Dimensiuni ale dezvoltarii rurale durabile: Romania in tranzitie, Institute of Agricultural Economics (IEA), Romanian Academy, Bucarest 2005.
4. Green Book – 1998.
5. National Institute of Statistic Database.
6. Ministry of Agriculture, Forestry and Rural Development Database.
7. National Office of Trade Register Database.
183
Dr. R. Melnikienė, A. Gapšys, T. Petuchova, D. Mikelionytė Dr. V. Bradūnas, Dr. V. Vaikutis, I. Lukošiutė, A. Motova
Lithuanian Institute of Agrarian Economics Vilnius, Lithuania
Development of the Food Sector after Lithuania Joined the EU
1. Agricultural and Food Sector under new Economic Conditions
Membership in the EU opened new opportunities for the Lithuanian agriculture and food industries and created preconditions for the competitiveness of the sector and income growth, by combining the intensification of production with protection of the environment. However, it was necessary to meet the challenges of the open market at the same time – to compete with technologically more progressive, advanced and efficient sectors of agriculture and food industries of other countries, in particular of the EU-15, receiving also more support.
Many doubts were expressed in the pre-accession period with regards to the level of competitiveness of Lithuanian farms and companies and their capacity to absorb the support from the EU. Farmers were a particularly active social group opposing the membership of Lithuania in the EU.
In the period 2005-2006 the sector of agriculture and food industries in Lithuania had the chance to experience the significant impact of free movement of goods, labour force and capital on the economic growth of the country. As a matter of fact, the advantages of EU membership for the Lithuanian sector of agriculture and food industries were experienced already since 4 May 2004, but the year 2006 was particularly significant and disclosed the essential changes. Firstly, macroeconomic indicators in the sector of agriculture improved – total agricultural production increased, exports both to EU and to third countries expanded, disposable personal incomes increased. Secondly, direct payments and structural support reached the rural areas, creating preconditions for streamlining the structure of farms and enterprises, for the improvement and diversification of activities, for promoting the development of problematic regions.
Trends of sustainable development in the sector could be traced since the year 2000, when the Lithuanian economy began to recover after the impact of the Russian crisis. The period of 2004-2006 is marked with particularly rapid development of the sector. The value of total agricultural production in current prices reached EUR 1,515 million in 2006, and its growth rates were the highest within the period, amounting to 15%.
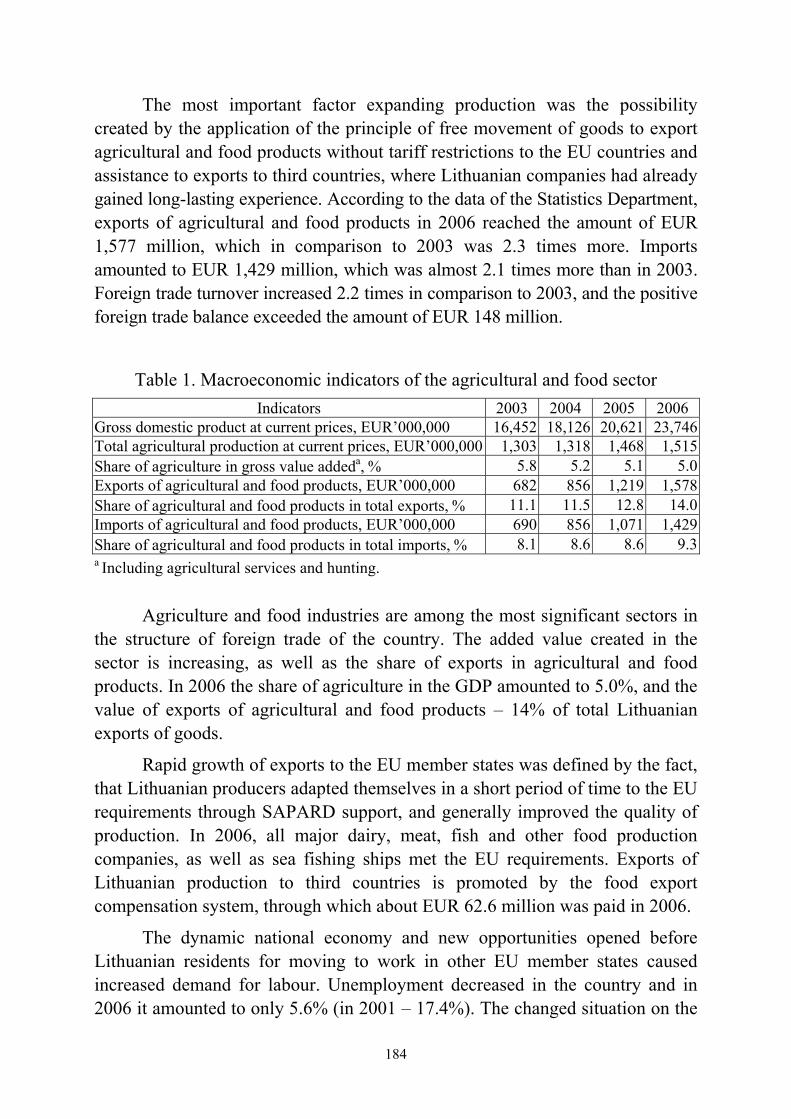
184
The most important factor expanding production was the possibility created by the application of the principle of free movement of goods to export agricultural and food products without tariff restrictions to the EU countries and assistance to exports to third countries, where Lithuanian companies had already gained long-lasting experience. According to the data of the Statistics Department, exports of agricultural and food products in 2006 reached the amount of EUR 1,577 million, which in comparison to 2003 was 2.3 times more. Imports amounted to EUR 1,429 million, which was almost 2.1 times more than in 2003. Foreign trade turnover increased 2.2 times in comparison to 2003, and the positive foreign trade balance exceeded the amount of EUR 148 million.
Table 1. Macroeconomic indicators of the agricultural and food sector Indicators 2003 2004 2005 2006
Gross domestic product at current prices, EUR’000,000 16,452 18,126 20,621 23,746Total agricultural production at current prices, EUR’000,000 1,303 1,318 1,468 1,515Share of agriculture in gross value addeda, % 5.8 5.2 5.1 5.0Exports of agricultural and food products, EUR’000,000 682 856 1,219 1,578Share of agricultural and food products in total exports, % 11.1 11.5 12.8 14.0Imports of agricultural and food products, EUR’000,000 690 856 1,071 1,429Share of agricultural and food products in total imports, % 8.1 8.6 8.6 9.3a Including agricultural services and hunting.
Agriculture and food industries are among the most significant sectors in
the structure of foreign trade of the country. The added value created in the sector is increasing, as well as the share of exports in agricultural and food products. In 2006 the share of agriculture in the GDP amounted to 5.0%, and the value of exports of agricultural and food products – 14% of total Lithuanian exports of goods.
Rapid growth of exports to the EU member states was defined by the fact, that Lithuanian producers adapted themselves in a short period of time to the EU requirements through SAPARD support, and generally improved the quality of production. In 2006, all major dairy, meat, fish and other food production companies, as well as sea fishing ships met the EU requirements. Exports of Lithuanian production to third countries is promoted by the food export compensation system, through which about EUR 62.6 million was paid in 2006.
The dynamic national economy and new opportunities opened before Lithuanian residents for moving to work in other EU member states caused increased demand for labour. Unemployment decreased in the country and in 2006 it amounted to only 5.6% (in 2001 – 17.4%). The changed situation on the
185
labour market greatly increased wages. Only during the year 2006, the average monthly wage in Lithuania increased by 23% and reached the amount of EUR 459. Disposable income and purchasing power of the population was also increasing alongside with demand for quality food products. The lively internal market combined with increased export opportunities created preconditions for the development of agriculture and the growth of food production.
It was expected when joining the EU that the EU membership would help Lithuania to attract foreign direct investments. According to the Statistics Department, by the end of 2006 foreign direct investments into the sector of agriculture, forestry and fisheries reached the amount of EUR 60 million, and accounted for 0.6% of total foreign investment in the country. However, the sector of food industries appeared to be more attractive to foreign capital. Direct foreign investments into food industries during the same period reached EUR 640 million, or 7.69% of the total amount of all foreign investments in Lithuania.
Support of the EU Structural Funds has become an important factor for increasing investments. About EUR 191 million has been allocated for the implementation of measures in 2004-2006, under priority 4 “Agriculture and Fisheries” of the Single Programming Document (SPD). In addition, EUR 100 million has been already invested during the pre-accession period through the implementation of the SAPARD programme.
Alongside with the investment programme, during the period of 2004- -2006 rural areas also received direct payments and implemented measures under the Rural Development Plan leading to the increase of farmers’ income and the improvement of financial performance of the farms. Subsequently, commercial banks recognised farmers and agricultural enterprises as equal partners, no longer sidestepping in awarding long-term loans under acceptable terms and conditions. Significant financial support to agricultural and other rural businesses is provided by the joint stock company "Guarantee Fund of Agricultural Loans" by extending guarantees to banks within the limits set by the Government on behalf of business entities, which do not have enough property for mortgage when taking loans.
Priority measures for the implementation of which most financial resources were allocated within the programming period of 2004-2006, were the following: “Investments in Agricultural Holdings”– EUR 61.6 million (32.1% of structural support funds), “Settlement of Young Farmers”– EUR 16.3 million (8.5%), “The Improvement of processing of agricultural products and marketing” – EUR 30.1 million (15.7%), “Promotion of Rural Tourism and Crafts”– EUR 21.0 million (10.9%).
186
However, there were doubts concerning the capacities of Lithuanian economic entities to absorb the investment support, but the activeness of applicants surpassed all expectations. Applications submitted during the period of 2004-2006 requested for a considerably larger amount than anticipated. The total sum of requested support exceeded the funds allocated for support by 38% on average, and in the case of certain other measures it was much greater, whereas the demand under the measure “Investments in Agricultural Holdings” exceeded the allocated financial resources almost by two times.
Support to farmers in 2004-2006 was provided according to six measures of the Rural Development Plan, aimed at improving the age structure among farmers, creating more favourable farming conditions in less advantageous farming areas, promoting sustainable agriculture, and providing assistance in streamlining small farms. The budget allocated for the implementation of the Rural Development Plan in three years amounted to EUR 472 million, and the support was provided as irrevocable subsidy on non-competitive terms. The amount of EUR 276.8 million was paid to farmers during the period 2004-2006. Most of the resources were allocated to the implementation of most popular measures: “Less advantageous areas for farming and locations bearing environmental restrictions" – EUR 141.1 million, "Support of early withdrawal from marketable agricultural production" – EUR 47.6 million, "Observation of Standard Norms" – EUR 53.9 million, "Agrarian environment protection" – EUR 27.6 million.
The most important measure providing support to farmers and having impact on the income of actually each rural inhabitant was that of direct payments. In 2006, according to the data of NPA (National Payment Agency), over 213 thousand individuals declared 2.6 million hectares of agricultural land and crops for qualifying to the provision of direct payments. Analysis of implementation of the EU and the National Budget support measures indicates the positive impact of the investment support, in particular direct payments and compensations, on the development of the sector. Positive changes in the development of the sector were observed in the period of 2004-2006: increasing investments, possibilities to acquire efficient agricultural machinery and apply modern technologies, increasing labour efficiency, larger farms and more opportunities for senior farmers to withdraw from economic activities at an earlier stage, transferring the management of the farm to younger farmers.
A relatively high number of working people in agriculture still remains in Lithuania, and their created value added is relatively low. This indicates that labour efficiency in this sector lags behind other economic branches in Lithuania.
187
According to data of the Statistics Department, the average annual number of workers in agriculture in 2006 was 188,900, by 28% less than in 2003.
Small, semi-natural farms prevail in Lithuania, and the age structure of farmers is not favourable for the development of a competitive modern farm. Deep agricultural traditions, restitution of land, poor investment possibilities of the rural population and the lack of entrepreneurship, determined the situation, where the majority of the rural population, in particular senior persons, remained in the agricultural business. About 60% of farmers are aged 55 and over, and only some 14% of them – under 40. Active participation of farmers in the implementation of the measure “Early withdrawal from marketable agricultural production" within the framework of the Rural Development Plan, support of young farmers and other structural measures, encourage positive changes in the future.
The average registered farm in Lithuania with declared agricultural land and crops in 2006 was 23 ha, and not many changes were observed during the period of three years. Their size is close to the average farm in the EU countries. Yet, the average size of the farm does not indicate the scope of structural problems in the country. Data of legal and natural persons, who have declared agricultural land, indicate, that in 2006 the average holding was only some 12.4 ha, and there were about 3.2% of farms in Lithuania with holdings of 50 ha, which accounted for 46% of the total declared agricultural land.
Analysis of the peculiarities of the Lithuanian and the EU-15 structure of the economy, revealed the following major differences: first, the share of competitive farms in Lithuania is very small; second, some commercial farms manage huge agricultural areas and other production resources, having thus the advantage in competing for the investment support. Aiming at increasing the competitiveness not only of separate farms, but of the entire sector as well, and defining the priorities for the financial perspective of 2013, it is necessary to endeavour at the growth of the number of competitive farms and at the distribution of financial support covering more economic entities.
2. Lithuanian Agricultural and Food Sector in the single Market 2.1. Changes in the Trade of Agricultural and Food Products
on the Domestic Market Food expenditures are among the major lines of spending in the
household budget of the Lithuanian population. In 2006 more than one third of all expenditures accounted for food products.
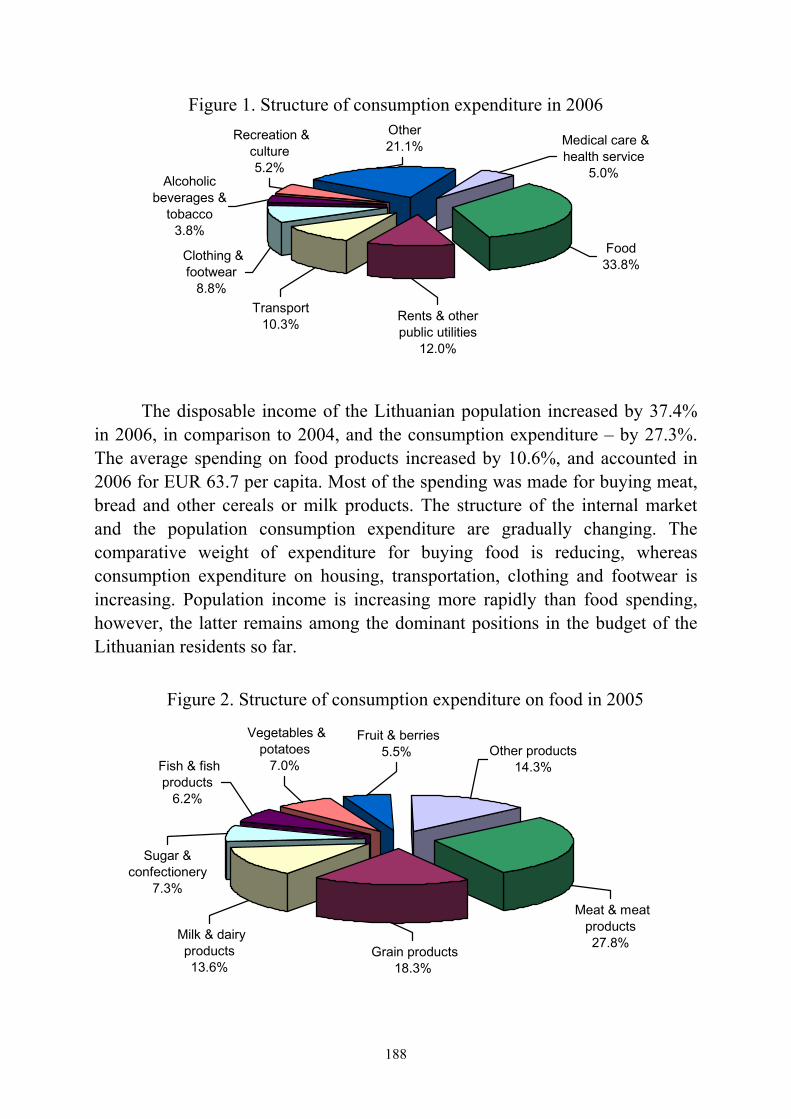
188
Figure 1. Structure of consumption expenditure in 2006
Medical care & health service
5.0%Alcoholic beverages &
tobacco 3.8%
Food 33.8%
Recreation & culture5.2%
Clothing & footwear
8.8%
Rents & other public utilities
12.0%
Transport 10.3%
Other 21.1%
The disposable income of the Lithuanian population increased by 37.4%
in 2006, in comparison to 2004, and the consumption expenditure – by 27.3%. The average spending on food products increased by 10.6%, and accounted in 2006 for EUR 63.7 per capita. Most of the spending was made for buying meat, bread and other cereals or milk products. The structure of the internal market and the population consumption expenditure are gradually changing. The comparative weight of expenditure for buying food is reducing, whereas consumption expenditure on housing, transportation, clothing and footwear is increasing. Population income is increasing more rapidly than food spending, however, the latter remains among the dominant positions in the budget of the Lithuanian residents so far.
Figure 2. Structure of consumption expenditure on food in 2005
Fish & fish products
6.2%
Vegetables & potatoes
7.0%
Fruit & berries5.5% Other products
14.3%
Sugar & confectionery
7.3%
Milk & dairy products13.6%
Grain products18.3%
Meat & meat products27.8%
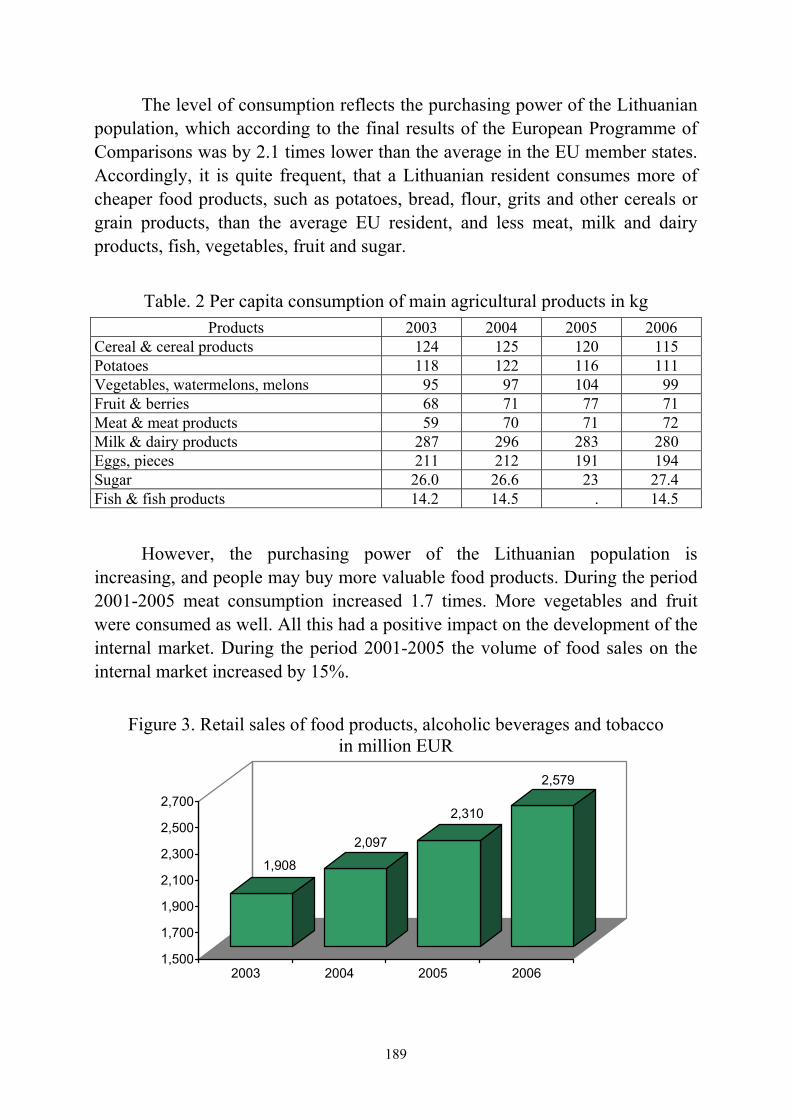
189
The level of consumption reflects the purchasing power of the Lithuanian population, which according to the final results of the European Programme of Comparisons was by 2.1 times lower than the average in the EU member states. Accordingly, it is quite frequent, that a Lithuanian resident consumes more of cheaper food products, such as potatoes, bread, flour, grits and other cereals or grain products, than the average EU resident, and less meat, milk and dairy products, fish, vegetables, fruit and sugar.
Table. 2 Per capita consumption of main agricultural products in kg
Products 2003 2004 2005 2006 Cereal & cereal products 124 125 120 115 Potatoes 118 122 116 111 Vegetables, watermelons, melons 95 97 104 99 Fruit & berries 68 71 77 71 Meat & meat products 59 70 71 72 Milk & dairy products 287 296 283 280 Eggs, pieces 211 212 191 194 Sugar 26.0 26.6 23 27.4 Fish & fish products 14.2 14.5 . 14.5
However, the purchasing power of the Lithuanian population is increasing, and people may buy more valuable food products. During the period 2001-2005 meat consumption increased 1.7 times. More vegetables and fruit were consumed as well. All this had a positive impact on the development of the internal market. During the period 2001-2005 the volume of food sales on the internal market increased by 15%.
Figure 3. Retail sales of food products, alcoholic beverages and tobacco
in million EUR
1,908
2,097
2,310
2,579
1,500
1,700
1,900
2,100
2,300
2,500
2,700
2003 2004 2005 2006

190
The growing needs of the internal market and the increasing export opportunities encouraged the production of agricultural products and their purchase as well. However, the unfavourable harvest of 2006 influenced the lower purchase of vegetative crops than expected.
Table 3. Production and purchase of agricultural products (t’000)
Indicators 2003 2004 2005 2006 2006,
comparedto 2003, %
Production Livestock & poultry, slaughtered (live weight) 265 303 323 314 118 Milk production 1,796 1,849 1,862 1,955 109 Egg production, pcs’000,000 811 863 864 929 115 Purchases Cereals 1,129 1,403 1,760 1,097 97 Rapeseed 110 173 215 140 127 Sugar beet for industry 881 905 798 716 81 Potatoes 32 21 11 12 38 Vegetables 36 34 28 31 86 Fruit & berries 76 14 72 80 105 Livestock & poultry (live weight) 191 200 211 225 118 Natural milk 1,026 1,140 1,200 1,281 125 Milk (equivalent of base fatness) 1,226 1,371 1,432 1,539 126 Eggs, pcs’000,000 466 486 487 482 103
Production of livestock produce in 2005 accounted for 49.2% within the structure of total agricultural production. Owing to increased efficiency meat production increased by 18%, and milk production – by 9% during the period 2003-2006.
The purchasing rate of certain products, such as pork, poultry, vegetables and fruit, was lower than consumption, therefore imports of corresponding products increased.
2.2. Tendencies of Foreign Trade in Agricultural and Food Products
Foreign trade of Lithuania in agricultural and food products is developing rapidly and accounts annually for a larger share in the structure of Lithuanian foreign trade.
In 2004 – the year of joining the EU – exports of agricultural and food products represented 11.5% of total Lithuanian exports, and in 2006 – 14.0%;

191
imports of the corresponding products in total imports to Lithuania accounted for 8.6% and 9.3% respectively.
According to Lithuanian Statistics, exports of agricultural and food products amounted to EUR 1,577 million in 2006, and in comparison to 2005 they increased 1.3 times, and in comparison to 2003, the year preceding EU accession, 2.3 times. Imports reached the amount of EUR 1,429 million, and in comparison to 2005 increased over 1.3 times, and in comparison to 2003 – 2.1 times. The turnover of foreign trade in comparison to 2005 increased by 31% and exceeded the amount of EUR 3 billion.
Figure 4. Exports, imports and foreign trade balance of agricultural and food products in million EUR
682856
1,577
1,219
690856
1,429
1,071
-200
0
200
400
600
800
1,000
1,200
1,400
1,600
1,800
2003 2004 2005 2006
Exports Imports Balance
The structure of trade by groups of countries has also changed. Although
the largest share of exports in 2006 went to the old EU member states as it was the case in 2004 (the value of exported products to the EU member states in 2006 accounted for 40% of the total value of agricultural and food product exports, and in 2004 – for 42%), the share of exported products to the EU-10 states decreased by 5 percentage points, and the share of exports to third countries increased actually by 7 percentage points. The structure of imports by groups of countries differs from the structure of exports. In 2006 the value of products imported from the old and the new EU member states accounted for 39% and 40% of total imports, respectively. Meanwhile this share reached 46% and 32% respectively in 2004. Even though exports to third countries increased 1.7 times, their share decreased by 1 percentage point.
192
Export refunds paid for exports to third countries had a great impact on the growth of exports to third countries. In 2006 the amount of almost EUR 63 million was paid for such refunds and it was 1.4 times greater than in 2005.
Lithuanian producers managed to react flexibly to changes on the market and paid great attention to marketing measures in looking for new markets for their products. Cheese producers, for instance, exported to the USA 49% of all exported cheese in 2000. As a result of the fall of the dollar exchange rate and the changed conditions of trade, the share of exports to the USA accounted only for 0.4% in 2006. However, cheese producers found new markets during this period and increased the exports of cheese almost 2 times.
Analysis of trade in the period from 2003, reveals that imports and exports had annually increased, but exports were growing at a faster pace. The foreign trade balance in 2003 was still negative, and in 2006 exports exceeded imports by EUR 148 million.
Table 4. Foreign trade in agricultural and food products in million EUR 2004 2006 Groups of countries
Exports Imports Turnover Balance Exports Imports Turnover BalanceEU 615 666 1,281 -51 1,024 1,123 2,147 -99 EU-10 256 276 532 -20 399 568 966 -169 EU-15 359 390 749 -31 625 555 1,181 70 Third countries 242 190 432 52 553 306 859 247 Total 857 856 1,713 1 1,577 1,429 3,006 148
In 2006 the largest share of exports consisted of ready-made food products, beverages and tobacco. They accounted for 41% of total export of agricultural and food products. The next place was taken by products of animal origin (33%), and the third – by vegetable products (24%).
In 2006, as before, milk and dairy products were among the mostly exported products (to 52 countries of the world). Much fruit was exported too, as well as ready-made animal feed, tobacco items, meat and fish products, grain and meat. In comparison to 2005 the amount of exported cheese products increased 1.2 times, butter – 1.5 times, apples – 12 times, mushrooms – 3.6 times, chocolate and other products with cacao – 3.1 times, non-concentrated milk and sweet cream – 1.4 times.
In comparison to 2005 the export value of almost all product groups increased, except for grain and oilseeds, and fodder. Exports of sugar decreased almost 3 times, however, the average price of sugar was 1.9 times higher than in
193
2005. Wheat exports declined 1.9 times (according to the data of the Statistics Department, the purchased amount of wheat was 1.6 times smaller), and exports of oilseeds and fodder – 3.5 times.
Exports to the EU member states consisted mainly of milk and milk products, processed animal feed, meat and fish products, tobacco items, fish; and mostly milk and dairy products, fruit, tobacco items, vegetables and grain were exported to third countries.
In 2006 Lithuania mostly imported ready-made food products, beverages and tobacco items. They accounted for 43% of total imports of agricultural and food products. Unlike in exports, the second place here is taken by vegetable products (29%), the third – by live animals and products of animal origin (22%).
In 2006 Lithuania mostly imported fruit and nuts, various strong and soft drinks, fish, dressings, soup and broth concentrates, meat and vegetables. Rare products that are not produced or grown in Lithuania prevail on this list. However, pork and poultry are among them as well, accounting for imports of 33 and 30 thousand of tons of these products, accordingly.
Imports of almost all products increased in 2006 as compared to 2005. With the exception of fish, the imports of which decreased by 3%, imports of fruit and beverages increased most of all, the value of which increased in 2005 by 1.7 and 1.5 times respectively.
Imports from the EU countries mostly consisted of fruit and nuts, various beverages, meat and edible meat sub-products, dressings, soup and broth concentrates, dairy products and vegetables. Imports from third countries consisted in the main of fish, fruit and nuts, tobacco and its items, fat and oil.
In comparison to 2005 imports increase was observed in such products as apples, milk and sweet cream, cigarettes, sunflower oil, fresh apricots, cherries, peaches and plums.
In 2006 the balance of foreign trade in agricultural and food products was positive (EUR 148 million). Though export and import increased in comparison to 2005, the balance remained almost the same. The highest positive balance was in the group of trading in live animals and products of animal origin (it increased by almost EUR 47 million in comparison to 2005). Positive balance was also reached in the trade of ready-made food products, beverages and tobacco items (increased almost by EUR 3 million). The highest negative balance remained traditionally in the trade of fat and oil – it has become higher in 2006 as compared to 2005. Trade balance in vegetative products became negative as well.

194
Figure 5. Balance of foreign trade in the main groups of agricultural and food products, in 2006, in million EUR
650
29
385
514
620
77
416
317
30
-48-31
198
-100
0
100
200
300
400
500
600
700
Live animals; products Vegetable products Fats and oils Prepared food products;beverages, apirits andvinegar; tobacco and
manufactured substitutes
Export Import Balance
Most of products were exported to Russia, Latvia, Germany, Estonia, United Kingdom and Italy (this share accounted for 70% of total exports in agricultural and food products), and imported from Poland, Latvia, Germany, the Netherlands, Estonia (56% of total imports). Major trade partners in agricultural and food products are Russia, Latvia, Germany, Poland, the Netherlands and Estonia. The turnover of trade with these countries was the biggest.
3. The Situation and the Development of Traditional Production Sectors 3.1. Dairy Sector
The Lithuanian dairy sector felt a positive impact of the single EU market in 2004-2006. The demand for raw milk increased, and could not be satisfied even by the additionally increased milk procurement of 25%. In 2006 about 8.6% of processed milk at the Lithuanian dairy enterprises was imported.
The reduced milk purchasing prices before joining the EU started to grow in 2004. In comparison to 2003, prices increased by 42% in 2006, and reached the amount of EUR 167/ton (for the basic fat content of 3.4%), and EUR 201/ton for whole milk.
The competitive pressure of milk buyers from neighbouring countries forced local producers of diary products to raise purchase prices, since it was the lowest in the entire European Union. However, the increasing price in the
195
neighbouring states left the average milk purchase price in Lithuania the lowest in the EU again, actually because of small dairy farms, which are paid lower prices than the big ones.
The average Lithuanian dairy sector in 2003 was 13 times less than in the EU-15 and by 5.7 times less than the EU-25 average. Nevertheless, the average size of a dairy farm increased from 2.3 cows in 2003 to 3.0 cows in 2006, or by 30%. In the period of 2003-2006 the number of very small dairy farms with 1-2 cows decreased even by 27%. Some of them became larger, but the majority of them withdraw from milk production. Rapid growth is observed among dairy farms with 20-99 cows – the number of such farms increased 2.8 times. The opening of the single EU market had a major impact on structural changes influencing all partners on the market. Structural assistance was provided only to approximately 12% of diary farms, and the impact of structural support was not very big. In 2006 about 71% of diary farms were commercial, i.e. had quotas for milk production.
Small farms define low productivity of cows accordingly, which is only 70% of the EU average and is among the lowest in the EU member states. Nevertheless, the average productivity of cows in Lithuania is increasing. In 2005 the average yield of one cow was 4,312 kg of milk, by 7.4% more than in 2003. The increasing productivity of cows influenced the growth in milk production and purchase, even after the year of 2003, when the number of cows was reduced. In 2006 the number of cows decreased by 11% as compared to 2003, and amounted to 399 thousand of milking cows.
Three milk processing groups of companies prevail in the Lithuanian milk processing sector. In 2006 they received about 80% of all marketing returns in the milk processing sector. Restructuring of the milk processing sector actually took place before joining the EU. All Lithuanian milk processing companies as well as their affiliates, except for one, have met the set EU sanitary and hygiene requirements for food production and obtained the EU certificates permitting to export their production to EU member states before joining the EU. In 2006 such certificate was awarded also to the remaining one milk processing plant. 17 milk processing enterprises have permits for exporting their production to Russia.
In 2006 Lithuanian milk processing companies sold their production for EUR 523.1 million, 52% more than in 2003. In 2006 the comparative weight of sales on foreign markets increased by 10 percentage points, as compared to 2003.
196
Table 5. Main indicators of the milk processing industry Indicators 2003 2004 2005 2006
Number of milk processing enterprises 36 37 37 35 Sales, EUR’000,000 344.3 430.5 468.3 523.1 share in total sales of the food industry, % 22.9 26.3 25.6 25.3 Exports, EUR’000,000 163.5 231.0 257.4 297.6 share in total dairy sales income, % 47 54 55 57
Within the period of 2004-2006 production of almost all dairy produce increased, mostly the production of sweet cream (by 4.7 times), canned milk (1.9 times), cheese and curd (53%). Cheese and curd output in terms of physical weight increased to 36,300 tonnes. The Lithuanian dairy industry is specialising in the production of cheese and curd. These products have the biggest comparative weight in the structure of sales in dairy products – 50% (in 2006).
Over the period from 2003 to 2005 the consumption of milk and dairy products, converted into milk equivalent per capita in Lithuania has decreased by 1.4%. Per capita consumption of milk and dairy products in 2005 was 283 kg. The reduction in consumption of dairy products was greatly influenced by the increased prices of dairy products in 2005: in December 2005, compared to the same month of 2004, the price of milk increased by 8.4%, of cheese and curd – by 6.6%, of other dairy products – by 1.5%, except for canned milk, the price of which was cut down by 3.3%. The internal structure in consumption of dairy products sold through the retail sales network has changed: more sour milk products, butter and cheese were consumed, and less drinking milk.
The larger portion of dairy products consumed on the internal market is produced by Lithuanian milk processing enterprises or milk producers, who make dairy products for their own consumption. In 2005 only 4.4% of milk consumed on the internal market was imported, but the share of imported milk increased by 2.1 percent point since 2003. Cheese and yoghurt are largely imported.
The cost prices of dairy products on the internal market increased during the period 2004-2006: in December 2006 prices on the internal market increased by 11% in comparison to December 2003, and average sales – by 13%. Prices of exported dairy products increased most – by 21%. EU accession made a strong impact on the growth of cost prices on dairy products of Lithuania. At the moment of joining the EU, Lithuanian cost prices of dairy products were lower than in the EU-15 countries, therefore the period of 2004-2006 was the period for adjusting prices in the common economic area. In 2006 prices were actually
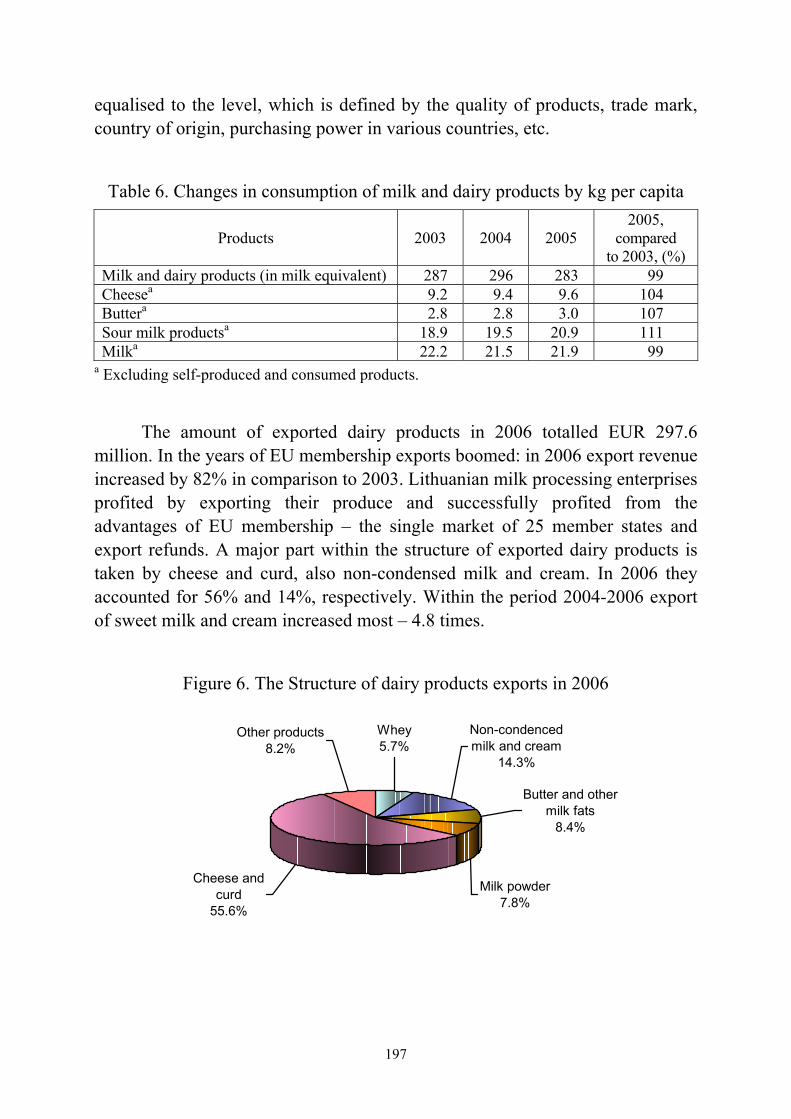
197
equalised to the level, which is defined by the quality of products, trade mark, country of origin, purchasing power in various countries, etc.
Table 6. Changes in consumption of milk and dairy products by kg per capita
Products 2003 2004 2005 2005,
compared to 2003, (%)
Milk and dairy products (in milk equivalent) 287 296 283 99 Cheesea 9.2 9.4 9.6 104 Buttera 2.8 2.8 3.0 107 Sour milk productsa 18.9 19.5 20.9 111 Milka 22.2 21.5 21.9 99
a Excluding self-produced and consumed products.
The amount of exported dairy products in 2006 totalled EUR 297.6
million. In the years of EU membership exports boomed: in 2006 export revenue increased by 82% in comparison to 2003. Lithuanian milk processing enterprises profited by exporting their produce and successfully profited from the advantages of EU membership – the single market of 25 member states and export refunds. A major part within the structure of exported dairy products is taken by cheese and curd, also non-condensed milk and cream. In 2006 they accounted for 56% and 14%, respectively. Within the period 2004-2006 export of sweet milk and cream increased most – 4.8 times.
Figure 6. The Structure of dairy products exports in 2006
Non-condenced milk and cream
14.3%
Butter and other milk fats
8.4%
Milk powder7.8%
Whey5.7%
Other products8.2%
Cheese and curd
55.6%
198
EU accession made a great impact on the geographical structure of exports. In 2006, most dairy products were exported to the markets of the EU-25 countries – 60%. In comparison to 2003, when Lithuania was not yet an EU member, exports to EU countries increased by 18 percentage points. Russia remains the most important third country exports destination for Lithuanian dairy products and its significance is growing: sales to this country increased from 20% to 35% of total exports. Meanwhile, the USA market, which was important for Lithuania before joining the EU (25% of exports in 2003 went there), lost its significance. In 2006 less than 1% of dairy products were exported to the USA. The reduction of exports to the USA was also influenced by the fall of the US dollar exchange rate, which subsequently reduced the actual price of the products sold there. Moreover, the EU does not support exports of the main item sold to the USA – cheese. Higher prices on the recently opened single EU market and export benefits from exporting production to Russia and other third countries, made the USA market unattractive for Lithuanian milk processing entities.
Export refunds belong to the measures for organising the dairy market and are mostly used by participants on the dairy market: in the general structure of support to the dairy sector within the period 2004-2006 they accounted for 52% of total support provided. 45% of the support was awarded for payments per quota milk ton, and the remaining 3% of the support was disbursed through other market organisation measures.
3.2. Meat Sector Lithuanian residents allocate one sixth of food expenditure for buying
meat and meat products. Pork is purchased most (51%), less poultry (25%), and beef (15%). This structure is defined by national traditions of consumption.
Lithuania has long lasting traditions in animal husbandry due to favourable climate conditions. Currently, 2-3 times less animals are raised in Lithuania than before 1990 and it cannot fully satisfy the demand of the domestic market, so meat has to be imported.
For Lithuanian animal breeders and meat processing entities the accession to the single EU meat market was beneficial. During two previous years livestock purchasing prices increased almost by 70%. Returns were also increased by direct payments disbursed to cattle and sheep breeders. Animal husbandry has been recognised as the priority branch receiving EU support.

199
Lithuanian meat processing entities have also experienced on the recently opened EU market the increasing competition from other EU member states, in particular in purchasing calves. In the period 2005-2006 every fourth calf was exported from Lithuania. Distrust of farmers concerning the handling by meat processing plants of the payments for livestock according to the quality of carcass meat and uncertainty of the future, stimulated livestock breeders to sell out small calves. Such exports may ruin the activities of quite a few slaughter houses and meat processing businesses.
The number of beef cattle is increasing very slowly. The system of direct payments does not encourage the breeding of heavy weight cattle, and the support system for purchasing pedigree livestock – the exchange of dairy cattle into beef cattle breeds. The number of pigs is not increasing either (only by 5% in four years). The rapid growth in pork consumption requires a certain proportion of pork to be imported.
The lack of good beef cattle breeds is the major problem of livestock breeders in Lithuania. State support is not sufficient for purchasing pedigree livestock. Meanwhile, time is lost for further development of beef cattle husbandry, and this will have impact on the competitiveness of this sector in the future.
It is complicated for the Lithuanian meat sector to compete for the influence on the market with other EU member states, however, strong sides and opportunities of this sector might be also defined, leading to positive assessment of future developments and perspectives: there are sufficiently many modern slaughter houses in the country, having industrial capacities available for slaughtering livestock and poultry, and almost all slaughter houses can assess the quality of livestock according to the SEUROP system; the growing economy in the country promotes the consumption of meat and its products; low breeding cost and outlet price; rather favourable climate conditions for livestock breeding and welfare; the defined priority possibilities for receiving support in 2007-2013 for streamlining the sector and the implementation of the Nitrate Programme from the EU funds; increase of the scope of exports to the Russian markets; increase meat production for meeting the consumption demands of the domestic market.
Stockbreeding
Pigs, cows and poultry are the most popular livestock for stockbreeding in Lithuania. Raising of sheep, goats, rabbits and other exotic animals is not very popular. Farmers and household farms account for breeding of 87% of cattle,

200
51% of pigs, almost all rabbits and 97% of sheep and goats. Even 78% of poultry is raised at agricultural holdings and poultry farms. Table 7. Number of livestock and poultry in thousand head (at the end of the year)
Item 2002 2003 2004 2005 2006 Cattle 779.1 812.1 792.0 800.3 838.8 Cows 443.3 448.1 433.9 416.5 410.9 Pigs 1,061.0 1,057.4 1,073.3 1,114.7 1,127.1 Poultry 6,848 8,067 8,419 9,397 .
Livestock breeding farms are very small. The number of livestock on a farm
consists on average of 7 pigs (in agricultural partnerships and enterprises – over 6 thousand), 44 poultry birds (in agricultural partnerships and enterprises – about 150 thousand), 2 calves, and 14 sheep. In terms of concentration level of production and the degree of specialisation, productivity of livestock and poultry, Lithuania still remains behind the EU average. Cattle
By the end of 2006 about 411,000 of milk cows were kept in Lithuania – almost 49% of the total cattle herd. At present two breeds of cows – the Lithuanian Black-and-White (73%) and the Lithuanian Brown (24%) – are mostly raised in Lithuania. The number of the Lithuanian Brown cows is slightly decreasing every year, and the number of cross-bread cows and beef cattle is increasing. At the beginning of 2006 about 163,200 farms were involved in stockbreeding. It accounts for 26% less farms than at the beginning of 2004. Purchases decreased even by 13% within the year 2006, and the average price per live weight increased by 39% during the period 2004-2006.
Figure 7. Purchases of cattle (live weight)
69.9
80.9
69.3
74.71,697
2,209
2,993 3,064
60
65
70
75
80
85
2003 2004 2005 2006
t'000
0
500
1,000
1,500
2,000
2,500
3,000
3,500LTL/t
Yield (live weight) in thousand tons Purchase price, in LTL/ton
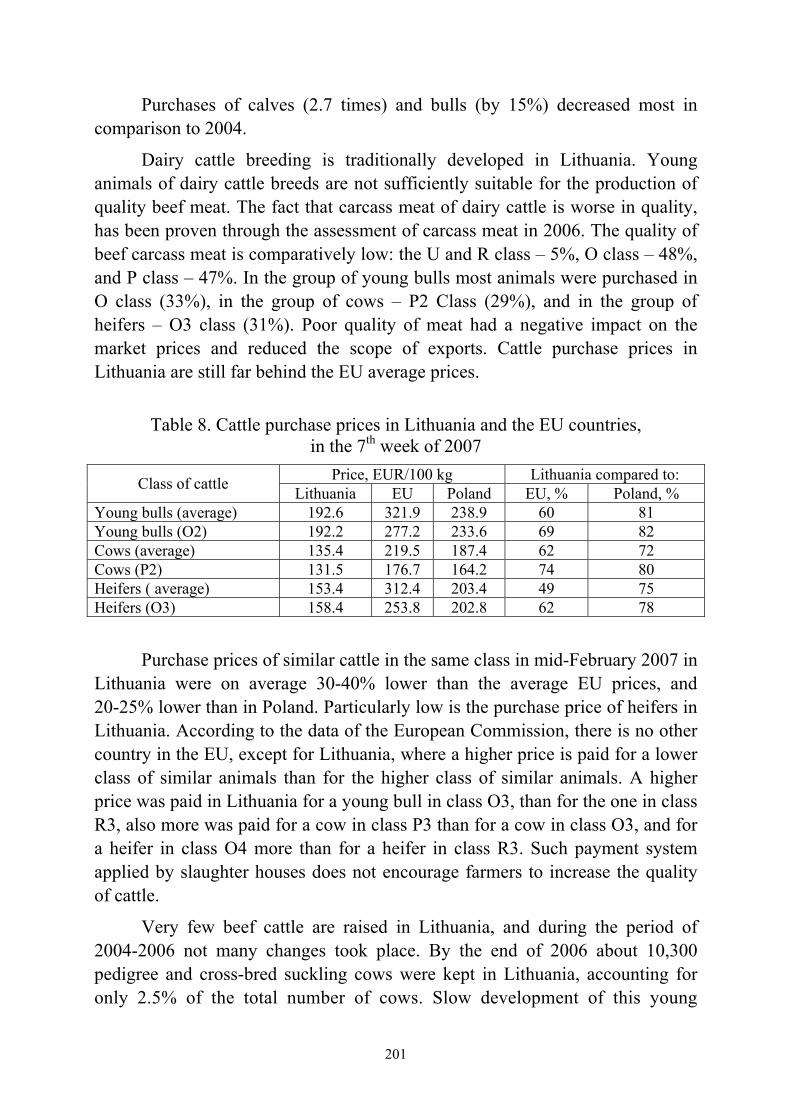
201
Purchases of calves (2.7 times) and bulls (by 15%) decreased most in comparison to 2004.
Dairy cattle breeding is traditionally developed in Lithuania. Young animals of dairy cattle breeds are not sufficiently suitable for the production of quality beef meat. The fact that carcass meat of dairy cattle is worse in quality, has been proven through the assessment of carcass meat in 2006. The quality of beef carcass meat is comparatively low: the U and R class – 5%, O class – 48%, and P class – 47%. In the group of young bulls most animals were purchased in O class (33%), in the group of cows – P2 Class (29%), and in the group of heifers – O3 class (31%). Poor quality of meat had a negative impact on the market prices and reduced the scope of exports. Cattle purchase prices in Lithuania are still far behind the EU average prices.
Table 8. Cattle purchase prices in Lithuania and the EU countries,
in the 7th week of 2007 Price, EUR/100 kg Lithuania compared to: Class of cattle Lithuania EU Poland EU, % Poland, %
Young bulls (average) 192.6 321.9 238.9 60 81 Young bulls (O2) 192.2 277.2 233.6 69 82 Cows (average) 135.4 219.5 187.4 62 72 Cows (P2) 131.5 176.7 164.2 74 80 Heifers ( average) 153.4 312.4 203.4 49 75 Heifers (O3) 158.4 253.8 202.8 62 78
Purchase prices of similar cattle in the same class in mid-February 2007 in Lithuania were on average 30-40% lower than the average EU prices, and 20-25% lower than in Poland. Particularly low is the purchase price of heifers in Lithuania. According to the data of the European Commission, there is no other country in the EU, except for Lithuania, where a higher price is paid for a lower class of similar animals than for the higher class of similar animals. A higher price was paid in Lithuania for a young bull in class O3, than for the one in class R3, also more was paid for a cow in class P3 than for a cow in class O3, and for a heifer in class O4 more than for a heifer in class R3. Such payment system applied by slaughter houses does not encourage farmers to increase the quality of cattle.
Very few beef cattle are raised in Lithuania, and during the period of 2004-2006 not many changes took place. By the end of 2006 about 10,300 pedigree and cross-bred suckling cows were kept in Lithuania, accounting for only 2.5% of the total number of cows. Slow development of this young
202
agricultural sector has several causes. The most important among them are the unfavourable conditions for increasing the herd of pedigree beef cattle. Purchase of pedigree beef cattle is very costly in the EU countries – from 8 to 18 thousand LTL, and the state support (up to 50%) was limited by the EU Regulations, and from 2007 this support is no longer available at all.
Pigs
According to the data of the 2003 agricultural census, Lithuania had almost 160 thousand farms, where over a million pigs were raised, and by the end of 2006 – 70 thousand more. On average, it made almost 7 pigs per farm. About 40% of pigs are raised at semi-natural farms (1-9 pigs), and usually meat processing plants do not purchase from them. There are only 65 farms (0.04%) raising at the same time over one thousand of pigs, however the concentration of pigs there is rather high (7 thousand on the average). They raise more than half of marketed pigs. In terms of the quality of carcass meat Lithuania is slightly behind the EU member states. Almost all pig slaughter houses have introduced a single payment system according to the quality and weight of carcass meat. Within the year 2006 slaughter houses and meat processing plants purchased 739,200 pigs. In comparison to 2004, the purchased amount of pig carcass meat (live weight) accounted for 4.1% more. The average purchase price in 2004-2006 was almost similar – about EUR 143/100 kg. Not only the purchasing of pigs increased, but also the imports of pork. Almost 35% of imported pork is used for the production of pork meat products. More than by one fourth (7,400 tonnes) of pork was imported in 2006 in comparison to 2005.
Poultry
By the end of 2006 about 9.4 million of various species of poultry was raised in Lithuania, including 98% of chicks. Two thirds of poultry are kept at large farms with over 50 thousand of birds. During the period 2003-2006 the number of poultry increased by 17%. The volume of poultry meat production is constantly increasing. The live weight of purchased poultry in 2006 reached 79,500 tonnes, and the carcass meat accounted for 25.5% more than in the previous year and even 1.5 times more than in 2004.
Processing
During the period 2001-2005 the number of small meat processing companies was reduced almost by half, as a result of incapacity to compete on the market or to implement the EU safety and quality requirements for food
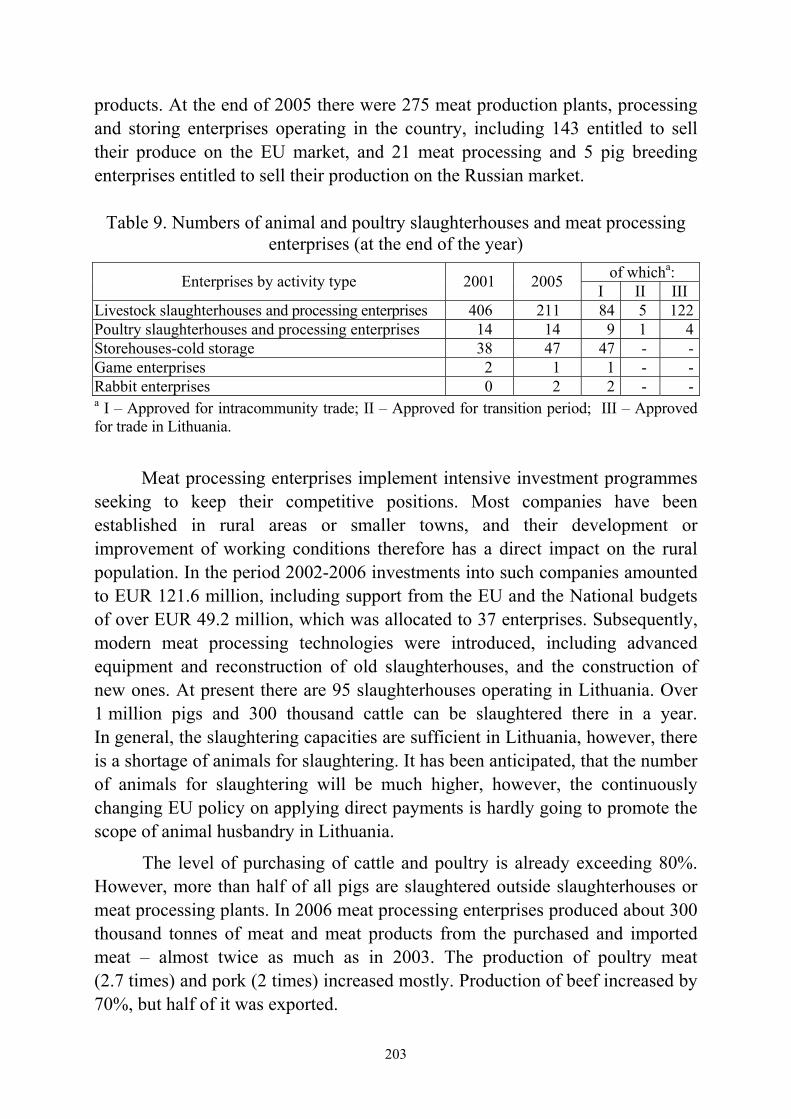
203
products. At the end of 2005 there were 275 meat production plants, processing and storing enterprises operating in the country, including 143 entitled to sell their produce on the EU market, and 21 meat processing and 5 pig breeding enterprises entitled to sell their production on the Russian market.
Table 9. Numbers of animal and poultry slaughterhouses and meat processing
enterprises (at the end of the year) of whicha: Enterprises by activity type 2001 2005 I II III
Livestock slaughterhouses and processing enterprises 406 211 84 5 122Poultry slaughterhouses and processing enterprises 14 14 9 1 4Storehouses-cold storage 38 47 47 - -Game enterprises 2 1 1 - -Rabbit enterprises 0 2 2 - -a I – Approved for intracommunity trade; II – Approved for transition period; III – Approved for trade in Lithuania.
Meat processing enterprises implement intensive investment programmes seeking to keep their competitive positions. Most companies have been established in rural areas or smaller towns, and their development or improvement of working conditions therefore has a direct impact on the rural population. In the period 2002-2006 investments into such companies amounted to EUR 121.6 million, including support from the EU and the National budgets of over EUR 49.2 million, which was allocated to 37 enterprises. Subsequently, modern meat processing technologies were introduced, including advanced equipment and reconstruction of old slaughterhouses, and the construction of new ones. At present there are 95 slaughterhouses operating in Lithuania. Over 1 million pigs and 300 thousand cattle can be slaughtered there in a year. In general, the slaughtering capacities are sufficient in Lithuania, however, there is a shortage of animals for slaughtering. It has been anticipated, that the number of animals for slaughtering will be much higher, however, the continuously changing EU policy on applying direct payments is hardly going to promote the scope of animal husbandry in Lithuania.
The level of purchasing of cattle and poultry is already exceeding 80%. However, more than half of all pigs are slaughtered outside slaughterhouses or meat processing plants. In 2006 meat processing enterprises produced about 300 thousand tonnes of meat and meat products from the purchased and imported meat – almost twice as much as in 2003. The production of poultry meat (2.7 times) and pork (2 times) increased mostly. Production of beef increased by 70%, but half of it was exported.

204
Table 10. Production of main meat products in thousand tons Product 2003 2004 2005 2006
Beef 27.3 35.3 49.1 46.6 Pork 41.6 49.8 76.2 84.7 Poultry meat 19.4 31.1 45.8 53.5 Sausages and smoked products 51.1 69.6 76.1 76.1 Ready-to-cook meat products 6.9 9.8 23.4 22.9
The sales price of beef at Lithuanian meat production companies
increased by 60% within the period of 2004-2006, and the retail price – almost by 90%. Such growth of prices is related to the increase of prices for cattle.
Figure 8. Retail price of beef with bone (I category) LTL/kg
7.987.607.18
6.466.15
9.81
8.80
9.43
10.08
8.60 8.49
9.22
9.32 9.43
10.2510.5 10.5
11.08 11.19 11.22 11.12 10.9810.63
11.01
11.38 11.64
6
7
8
9
10
11
12
I II III IV V VI VII VIII IX X XI XII
2004 2005 2006
However, retail prices of pork and poultry meat varied significantly less in the period of 2004-2006 – for about 10%-15%.
While in 2003 one Lithuanian resident consumed 59 kg of meat and meat products (including category I and II of variety meat), in 2006 this amount increased to 72 kg. Such growth in meat consumption was influenced not only by the membership in the EU, but also by the reduced VAT tariff since 2003 on carcass meat from 18% to 5%, and the increasing purchase power of the population. The higher level of meat consumption could be conditioned by reducing VAT tariff to 5% for meat products as well. Lithuanian population consumes most of pork meat. In 2006 consumption per capita reached the level of 40 kg, accounting for 47% more than in 2004. Consumption of poultry meat amounts to 25 kg, which is 2 times more than in 2003. Consumption of beef is the smallest – only 8 kg. The demand for this type of meat has decreased by 2 kg

205
within three years. Beef supply is sufficient for the domestic market, but pork and poultry meat is additionally imported. In the period of 2004-2006 the number of pigs raised on domestic farms could not satisfy the demand of the internal market, therefore, about 25% of pork has been imported from abroad.
Further increase of meat consumption will be defined by the insufficient level of consumption. Meat consumption in the period 2007-2013 should grow at least by 10 kg. It is anticipated, that the demand for pork and poultry meat will increase mostly, whereas the consumption of beef should not rise.
Foreign Trade
According to the Lithuanian meat balance of 2006, the provision for beef accounted for 170%, pork – 79%, and poultry meat – 77%. The Lithuanian meat foreign trade balance became positive in 2006. Meat imports in 2003 exceeded exports 4.3 times, and in 2006 – exports exceeded imports by 13%. Exports of livestock are higher than imports 3 times. In the general export structure of the meat sector, transportation of livestock abroad reached 29%. In 2006 even 71% of meat and livestock was exported to EU countries.
Mostly beef is exported. During the period 2003-2006 the amount of exports increased 5 times. Exports rapidly increased in particular during the previous two years. 50% of beef produced at slaughterhouses and meat processing plants is exported. Most beef is exported to Russia, Germany, and the Netherlands. Exports of calves is also rapidly increasing. In 2005 about 83,600 calves were exported, and in 2006 – 42% more. This accounts for 30% of all born calves. Most of the claves were exported to the Netherlands (34%), Spain (28%), and Israel (19%). Exports of raised cattle is not big – only about 0.6% of all sold cattle.
In the period 2003-2006 imports of pork increased almost 3.5 times, since local pig breeders were not ready to satisfy the increased demand on the domestic market. Mostly pork is imported from Poland (43% of total imports), Estonia and Germany.
Exports of poultry meat has increased 4 times during the period of 2003- -2006. Exports in 2005 accounted for about 24% of total poultry meat production, and imports – for one third of total demand. Almost half of the amount is exported to Latvia, some 20%-25% to Estonia and Russia, accordingly. Lithuania imports 2.5 times more poultry than it exports. Poultry meat is largely imported from the Netherlands, Poland and Denmark. The imported poultry
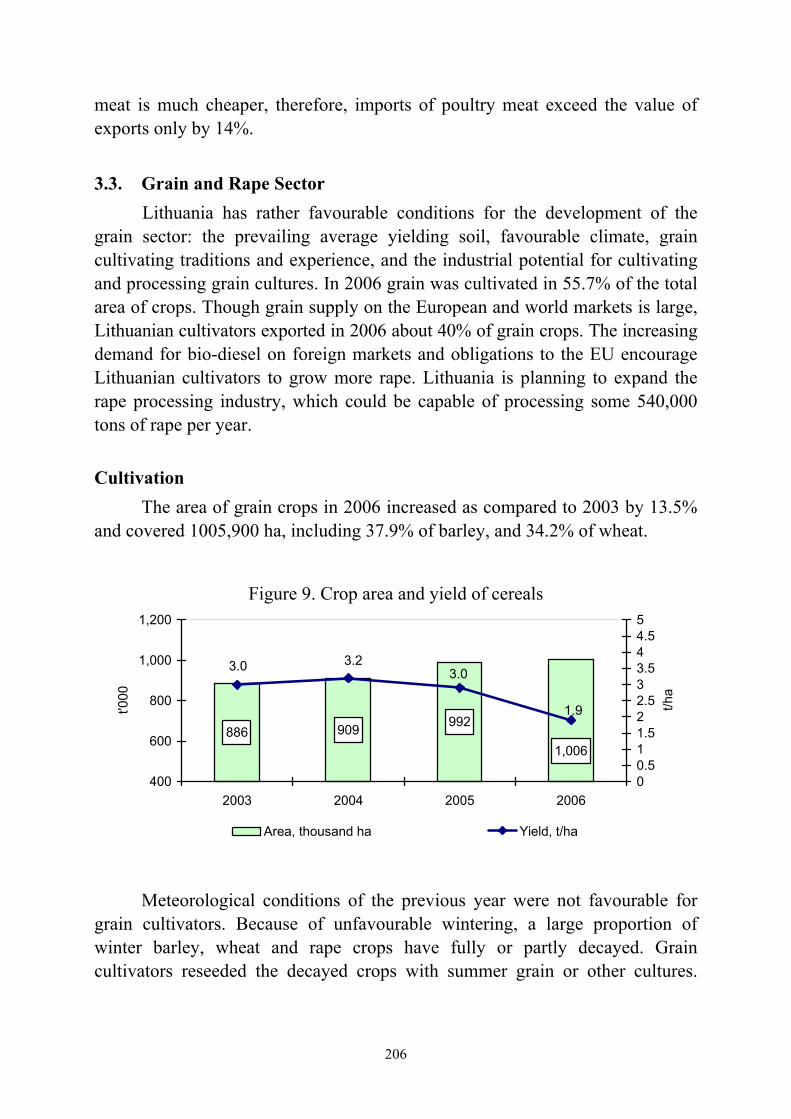
206
meat is much cheaper, therefore, imports of poultry meat exceed the value of exports only by 14%.
3.3. Grain and Rape Sector
Lithuania has rather favourable conditions for the development of the grain sector: the prevailing average yielding soil, favourable climate, grain cultivating traditions and experience, and the industrial potential for cultivating and processing grain cultures. In 2006 grain was cultivated in 55.7% of the total area of crops. Though grain supply on the European and world markets is large, Lithuanian cultivators exported in 2006 about 40% of grain crops. The increasing demand for bio-diesel on foreign markets and obligations to the EU encourage Lithuanian cultivators to grow more rape. Lithuania is planning to expand the rape processing industry, which could be capable of processing some 540,000 tons of rape per year.
Cultivation
The area of grain crops in 2006 increased as compared to 2003 by 13.5% and covered 1005,900 ha, including 37.9% of barley, and 34.2% of wheat.
Figure 9. Crop area and yield of cereals
1,006
992909886
3.0 3.23.0
1.9
400
600
800
1,000
1,200
2003 2004 2005 2006
t'000
00.511.522.533.544.55
t/ha
Area, thousand ha Yield, t/ha
Meteorological conditions of the previous year were not favourable for grain cultivators. Because of unfavourable wintering, a large proportion of winter barley, wheat and rape crops have fully or partly decayed. Grain cultivators reseeded the decayed crops with summer grain or other cultures.
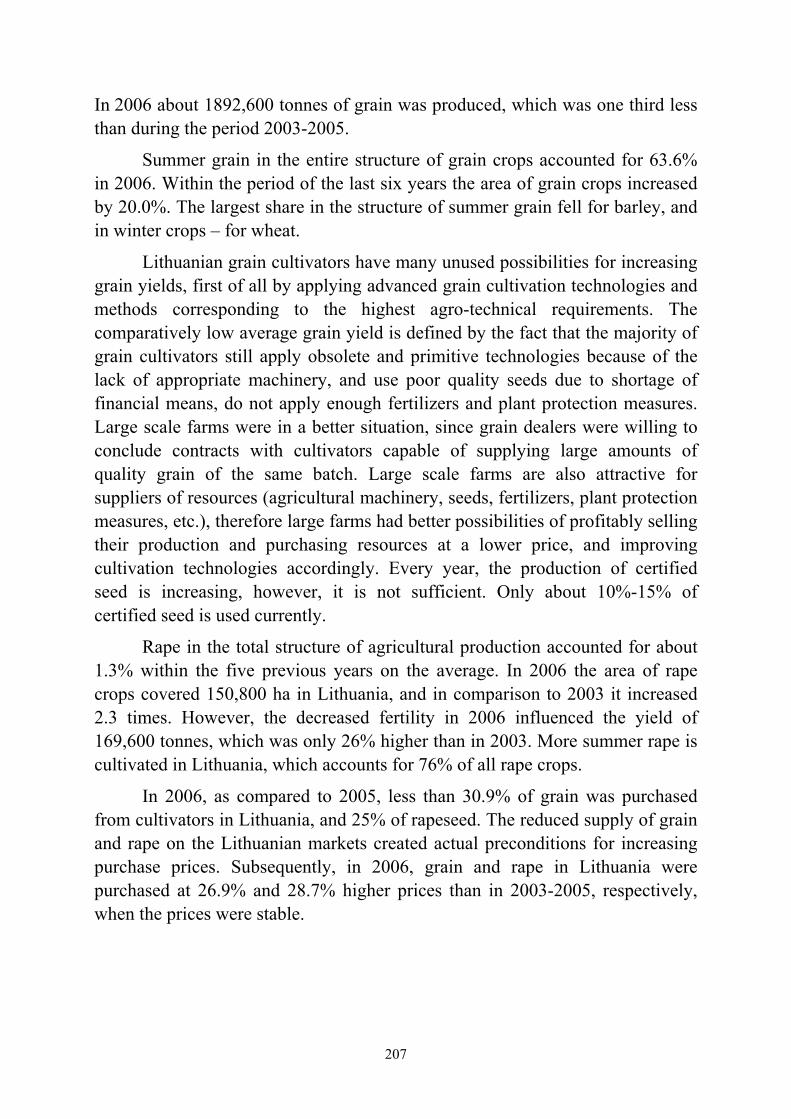
207
In 2006 about 1892,600 tonnes of grain was produced, which was one third less than during the period 2003-2005.
Summer grain in the entire structure of grain crops accounted for 63.6% in 2006. Within the period of the last six years the area of grain crops increased by 20.0%. The largest share in the structure of summer grain fell for barley, and in winter crops – for wheat.
Lithuanian grain cultivators have many unused possibilities for increasing grain yields, first of all by applying advanced grain cultivation technologies and methods corresponding to the highest agro-technical requirements. The comparatively low average grain yield is defined by the fact that the majority of grain cultivators still apply obsolete and primitive technologies because of the lack of appropriate machinery, and use poor quality seeds due to shortage of financial means, do not apply enough fertilizers and plant protection measures. Large scale farms were in a better situation, since grain dealers were willing to conclude contracts with cultivators capable of supplying large amounts of quality grain of the same batch. Large scale farms are also attractive for suppliers of resources (agricultural machinery, seeds, fertilizers, plant protection measures, etc.), therefore large farms had better possibilities of profitably selling their production and purchasing resources at a lower price, and improving cultivation technologies accordingly. Every year, the production of certified seed is increasing, however, it is not sufficient. Only about 10%-15% of certified seed is used currently.
Rape in the total structure of agricultural production accounted for about 1.3% within the five previous years on the average. In 2006 the area of rape crops covered 150,800 ha in Lithuania, and in comparison to 2003 it increased 2.3 times. However, the decreased fertility in 2006 influenced the yield of 169,600 tonnes, which was only 26% higher than in 2003. More summer rape is cultivated in Lithuania, which accounts for 76% of all rape crops.
In 2006, as compared to 2005, less than 30.9% of grain was purchased from cultivators in Lithuania, and 25% of rapeseed. The reduced supply of grain and rape on the Lithuanian markets created actual preconditions for increasing purchase prices. Subsequently, in 2006, grain and rape in Lithuania were purchased at 26.9% and 28.7% higher prices than in 2003-2005, respectively, when the prices were stable.

208
Processing In 2006 national grain processing enterprises handled 768,100 tonnes of
grain, including 221,600 tonnes of wheat, 76,300 tonnes of rye, and 182,700 tonnes of barley. Last year, 11.6% more grain was handled in comparison to 2005, including over 30,800 tonnes more of rape, i.e. 36.9% more than in 2005, and 10,300 tonnes of bio-diesel was manufactured from rape.
National grain processing companies produced in 2006 over 166,400 tonnes of wheat flour and 21,100 tonnes of various grits. In comparison to 2005, last year they produced about 20% less grain products. Accordingly, sales of almost all grain products in 2006 decreased in comparison to 2005. Over 90% of flour and grits are consumed on the internal market.
Great attention is given to the production of bio-diesel from rape. Now it is manufactured in one company, but some four more companies are planning to start operating before 2008. The output capacity of all companies will total 190,000 tonnes of bio-diesel.
Consumption
The yield of grain produced in the period 2003-2006 was sufficient to satisfy the needs of the domestic market. Analysis of the structure of grain consumption indicates that most grain is consumed in animal husbandry. In 2003-2006 about 55% of the grain produced on national farms was used for fodder, whereas the consumption of bread and grain products is decreasing. This is related to better financial possibilities and the increasing supply on the market, offering a larger variety of food products.
Table 11. Balance of resources in grain and cereals in thousand tons Specification 2003 2004 2005 2006
Resources at the beginning of the year 1,418.9 1,465.9 1,507.6 1,027.1 Yield 2,680.3 2,916.9 2,870.0 1,892.6 Import 271.7 206.5 187.2 177.0 Total resources 4,370.9 4,589.3 4,564.8 3,096.7 Exports 608.9 582.8 1181.3 766.7 Consumed for domestic needs: 2,296.1 2,498.9 2,356.4 1,886.1
for seeds 240.6 257.7 215.8 220.7 for fodder 1,429.3 1,570.5 1,503.7 1,104.2 losses 79.8 93.0 71.4 47.1 utilized in industry 119.7 148.2 155.4 124.1 population consumption fund 426.7 429.5 410.1 390.0
Consumption per capita, in kg 124 125 120 115 Resources at the end of the year 1,465.9 1,507.6 1,027.1 443.9 Provisions, % 117 117 122 100.3
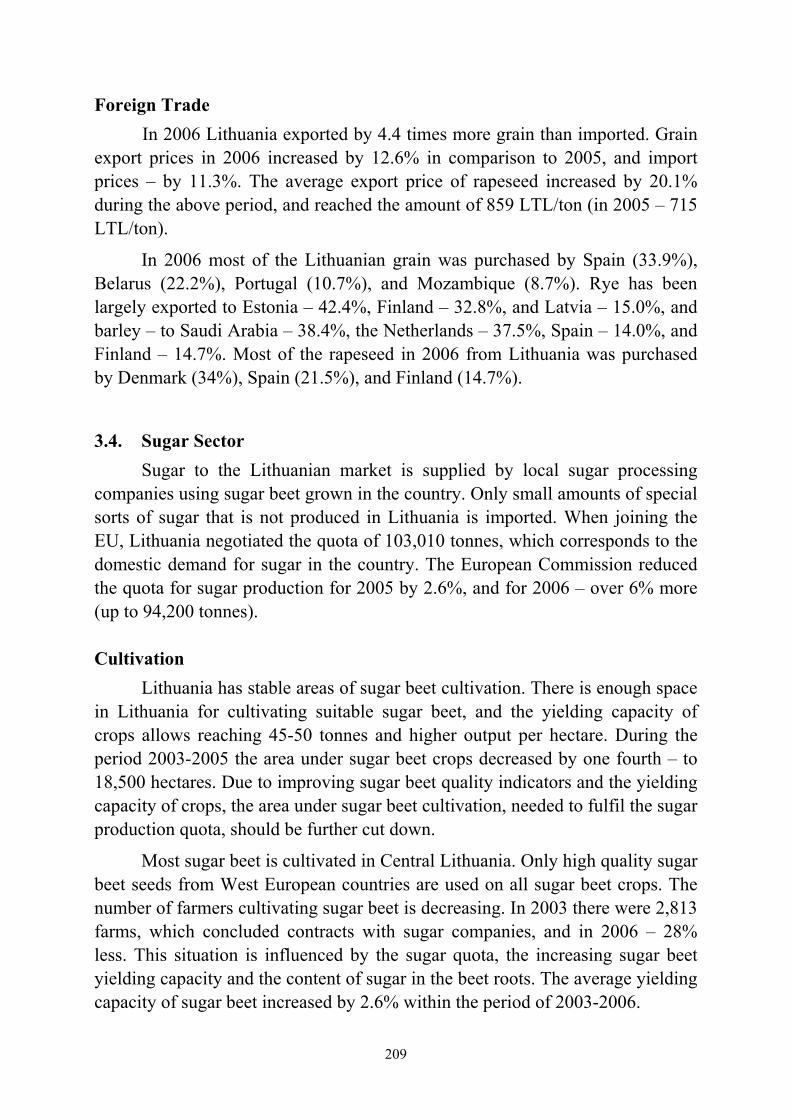
209
Foreign Trade In 2006 Lithuania exported by 4.4 times more grain than imported. Grain
export prices in 2006 increased by 12.6% in comparison to 2005, and import prices – by 11.3%. The average export price of rapeseed increased by 20.1% during the above period, and reached the amount of 859 LTL/ton (in 2005 – 715 LTL/ton).
In 2006 most of the Lithuanian grain was purchased by Spain (33.9%), Belarus (22.2%), Portugal (10.7%), and Mozambique (8.7%). Rye has been largely exported to Estonia – 42.4%, Finland – 32.8%, and Latvia – 15.0%, and barley – to Saudi Arabia – 38.4%, the Netherlands – 37.5%, Spain – 14.0%, and Finland – 14.7%. Most of the rapeseed in 2006 from Lithuania was purchased by Denmark (34%), Spain (21.5%), and Finland (14.7%).
3.4. Sugar Sector Sugar to the Lithuanian market is supplied by local sugar processing
companies using sugar beet grown in the country. Only small amounts of special sorts of sugar that is not produced in Lithuania is imported. When joining the EU, Lithuania negotiated the quota of 103,010 tonnes, which corresponds to the domestic demand for sugar in the country. The European Commission reduced the quota for sugar production for 2005 by 2.6%, and for 2006 – over 6% more (up to 94,200 tonnes).
Cultivation
Lithuania has stable areas of sugar beet cultivation. There is enough space in Lithuania for cultivating suitable sugar beet, and the yielding capacity of crops allows reaching 45-50 tonnes and higher output per hectare. During the period 2003-2005 the area under sugar beet crops decreased by one fourth – to 18,500 hectares. Due to improving sugar beet quality indicators and the yielding capacity of crops, the area under sugar beet cultivation, needed to fulfil the sugar production quota, should be further cut down.
Most sugar beet is cultivated in Central Lithuania. Only high quality sugar beet seeds from West European countries are used on all sugar beet crops. The number of farmers cultivating sugar beet is decreasing. In 2003 there were 2,813 farms, which concluded contracts with sugar companies, and in 2006 – 28% less. This situation is influenced by the sugar quota, the increasing sugar beet yielding capacity and the content of sugar in the beet roots. The average yielding capacity of sugar beet increased by 2.6% within the period of 2003-2006.
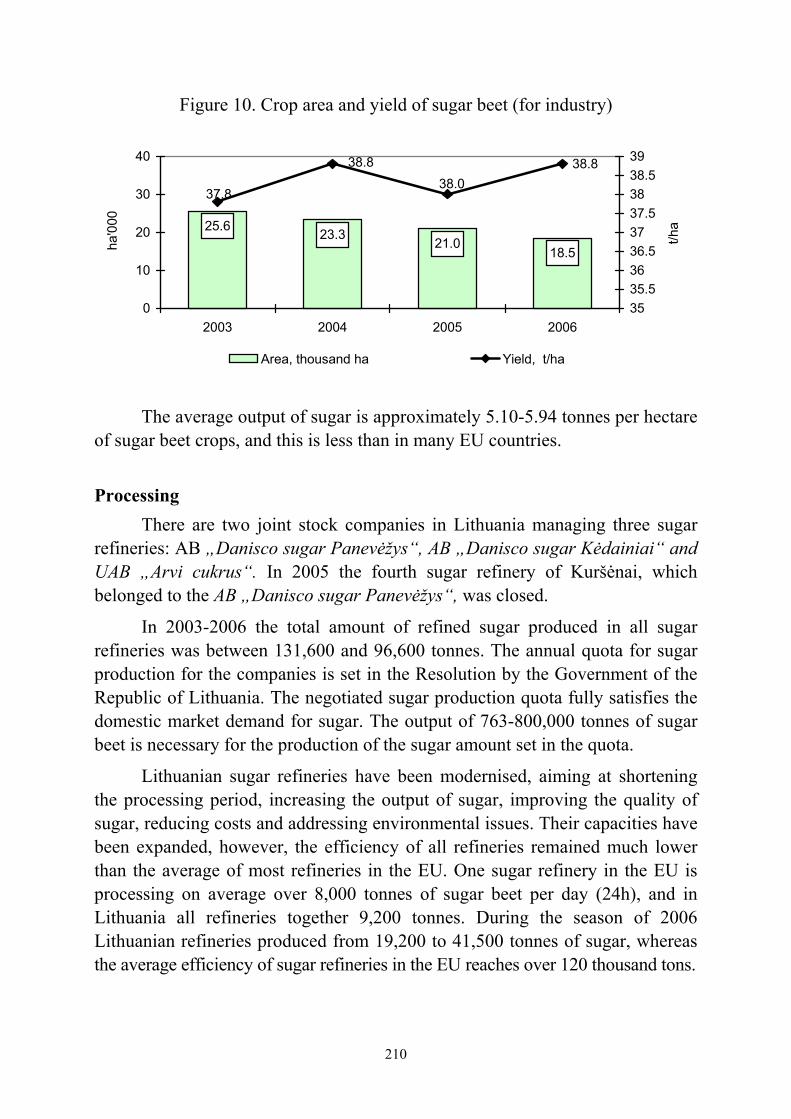
210
Figure 10. Crop area and yield of sugar beet (for industry)
The average output of sugar is approximately 5.10-5.94 tonnes per hectare
of sugar beet crops, and this is less than in many EU countries.
Processing
There are two joint stock companies in Lithuania managing three sugar refineries: AB „Danisco sugar Panevėžys“, AB „Danisco sugar Kėdainiai“ and UAB „Arvi cukrus“. In 2005 the fourth sugar refinery of Kuršėnai, which belonged to the AB „Danisco sugar Panevėžys“, was closed.
In 2003-2006 the total amount of refined sugar produced in all sugar refineries was between 131,600 and 96,600 tonnes. The annual quota for sugar production for the companies is set in the Resolution by the Government of the Republic of Lithuania. The negotiated sugar production quota fully satisfies the domestic market demand for sugar. The output of 763-800,000 tonnes of sugar beet is necessary for the production of the sugar amount set in the quota.
Lithuanian sugar refineries have been modernised, aiming at shortening the processing period, increasing the output of sugar, improving the quality of sugar, reducing costs and addressing environmental issues. Their capacities have been expanded, however, the efficiency of all refineries remained much lower than the average of most refineries in the EU. One sugar refinery in the EU is processing on average over 8,000 tonnes of sugar beet per day (24h), and in Lithuania all refineries together 9,200 tonnes. During the season of 2006 Lithuanian refineries produced from 19,200 to 41,500 tonnes of sugar, whereas the average efficiency of sugar refineries in the EU reaches over 120 thousand tons.
25.6
18.521.0
23.3
38.838.838.0
37.8
0
10
20
30
40
2003 2004 2005 2006
ha'
000
3535.53636.53737.53838.539
t/ha
Area, thousand ha Yield, t/ha
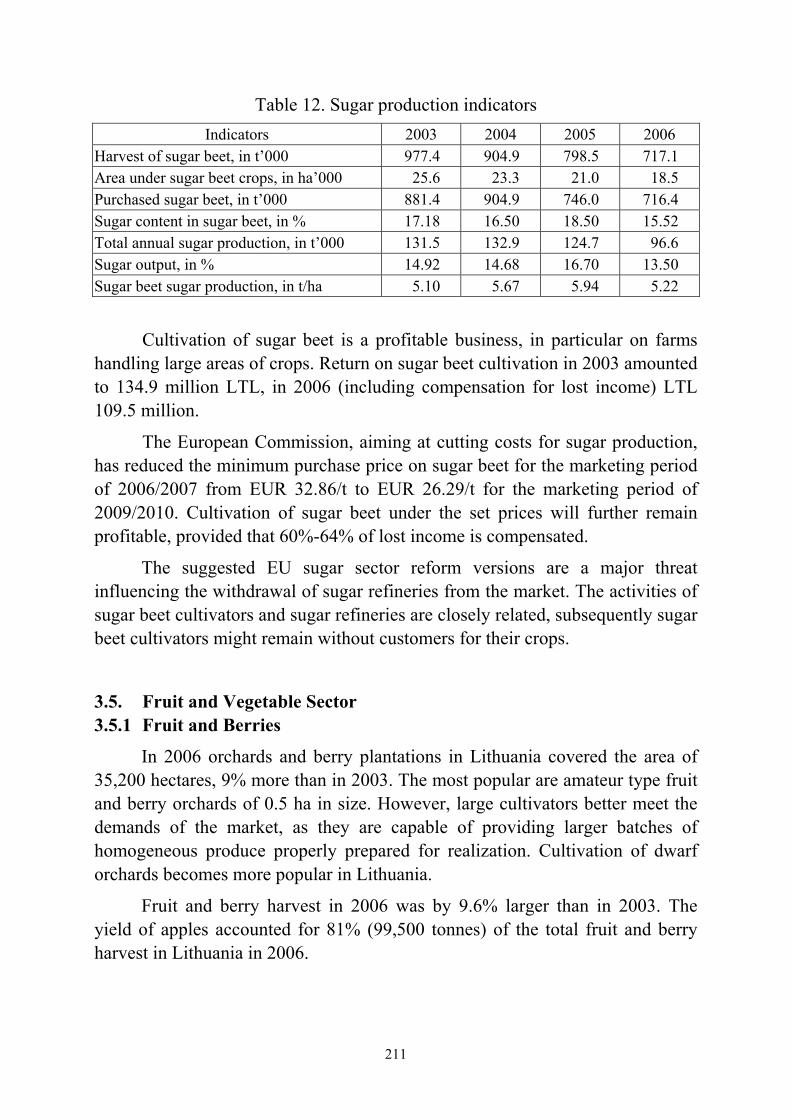
211
Table 12. Sugar production indicators Indicators 2003 2004 2005 2006
Harvest of sugar beet, in t’000 977.4 904.9 798.5 717.1 Area under sugar beet crops, in ha’000 25.6 23.3 21.0 18.5 Purchased sugar beet, in t’000 881.4 904.9 746.0 716.4 Sugar content in sugar beet, in % 17.18 16.50 18.50 15.52 Total annual sugar production, in t’000 131.5 132.9 124.7 96.6 Sugar output, in % 14.92 14.68 16.70 13.50 Sugar beet sugar production, in t/ha 5.10 5.67 5.94 5.22
Cultivation of sugar beet is a profitable business, in particular on farms handling large areas of crops. Return on sugar beet cultivation in 2003 amounted to 134.9 million LTL, in 2006 (including compensation for lost income) LTL 109.5 million.
The European Commission, aiming at cutting costs for sugar production, has reduced the minimum purchase price on sugar beet for the marketing period of 2006/2007 from EUR 32.86/t to EUR 26.29/t for the marketing period of 2009/2010. Cultivation of sugar beet under the set prices will further remain profitable, provided that 60%-64% of lost income is compensated.
The suggested EU sugar sector reform versions are a major threat influencing the withdrawal of sugar refineries from the market. The activities of sugar beet cultivators and sugar refineries are closely related, subsequently sugar beet cultivators might remain without customers for their crops.
3.5. Fruit and Vegetable Sector 3.5.1 Fruit and Berries
In 2006 orchards and berry plantations in Lithuania covered the area of 35,200 hectares, 9% more than in 2003. The most popular are amateur type fruit and berry orchards of 0.5 ha in size. However, large cultivators better meet the demands of the market, as they are capable of providing larger batches of homogeneous produce properly prepared for realization. Cultivation of dwarf orchards becomes more popular in Lithuania.
Fruit and berry harvest in 2006 was by 9.6% larger than in 2003. The yield of apples accounted for 81% (99,500 tonnes) of the total fruit and berry harvest in Lithuania in 2006.
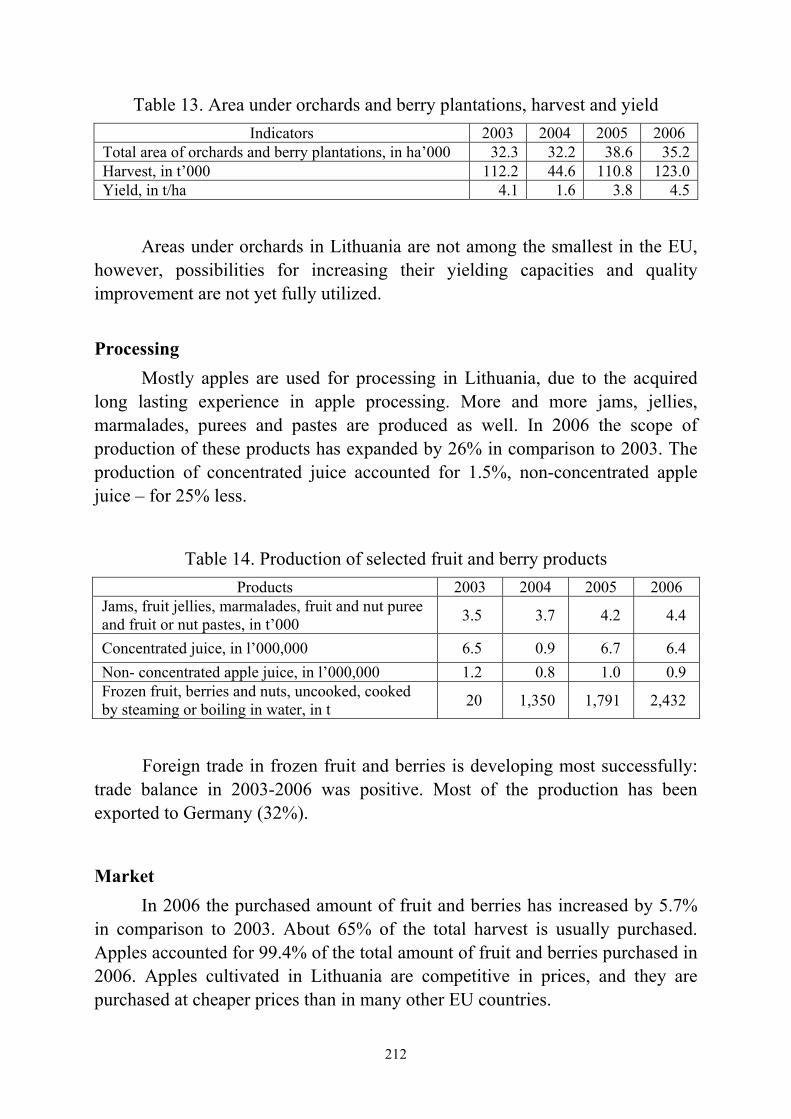
212
Table 13. Area under orchards and berry plantations, harvest and yield Indicators 2003 2004 2005 2006
Total area of orchards and berry plantations, in ha’000 32.3 32.2 38.6 35.2Harvest, in t’000 112.2 44.6 110.8 123.0Yield, in t/ha 4.1 1.6 3.8 4.5
Areas under orchards in Lithuania are not among the smallest in the EU, however, possibilities for increasing their yielding capacities and quality improvement are not yet fully utilized.
Processing
Mostly apples are used for processing in Lithuania, due to the acquired long lasting experience in apple processing. More and more jams, jellies, marmalades, purees and pastes are produced as well. In 2006 the scope of production of these products has expanded by 26% in comparison to 2003. The production of concentrated juice accounted for 1.5%, non-concentrated apple juice – for 25% less.
Table 14. Production of selected fruit and berry products Products 2003 2004 2005 2006
Jams, fruit jellies, marmalades, fruit and nut puree and fruit or nut pastes, in t’000 3.5 3.7 4.2 4.4
Concentrated juice, in l’000,000 6.5 0.9 6.7 6.4 Non- concentrated apple juice, in l’000,000 1.2 0.8 1.0 0.9 Frozen fruit, berries and nuts, uncooked, cooked by steaming or boiling in water, in t 20 1,350 1,791 2,432
Foreign trade in frozen fruit and berries is developing most successfully: trade balance in 2003-2006 was positive. Most of the production has been exported to Germany (32%).
Market In 2006 the purchased amount of fruit and berries has increased by 5.7%
in comparison to 2003. About 65% of the total harvest is usually purchased. Apples accounted for 99.4% of the total amount of fruit and berries purchased in 2006. Apples cultivated in Lithuania are competitive in prices, and they are purchased at cheaper prices than in many other EU countries.

213
Figure 11. Purchase of fruit and berries in 2003-2006
79.772.112.875.4
44 6774
83.0
0102030405060708090
2003 2004 2005 2006
t'000
0102030405060708090
EUR
/t
Quantity, thousand t Average price, EUR/t
Consumption In 2005 about 89% of fruit and berries intended for food were consumed
on the domestic market of Lithuania. Consumption per capita is increasing and is not influenced by fluctuations in production capacities. On average, one Lithuanian resident has consumed about 77 kg of fruit and berries in 2005, that is 5kg more than in 2004, and 16 kg more than 2003.
Foreign Trade The increasing demand for fruit and berries promotes imports. During the
period 2003-2006 the export value of fruit and berries has been increasing, however, the foreign trade balance remained negative. In 2006 exports increased 11.2 times in comparison to 2003. The largest proportion of fruit and berries was exported to Russia (83%). EU countries, major cultivators of fruit and berries, are getting established on the Lithuanian market, but they are competing among themselves and their share of the market is not stable. In 2006 most fruit and berries were imported from Poland (50%), the Netherlands (9%), Italy (8%), and Spain (6%). Imports from EU countries in 2006 accounted for 83% of total imports of fruit and berries.

214
Figure 12. Exports and imports of fruit and berries in thousand tons
21.8
142.5
31.2
166.7
55.2
172.8
244.0290.8
0
50
100
150
200
250
300
2003 2004 2005 2006
3.5.2. Vegetables Within the general structure of agricultural crops of Lithuania in 2006
vegetables accounted for 0.9%. In 2006 open field vegetable crops decreased by 43% in comparison to 2003. Root vegetables (56%) and cabbage (30%) constitute the major part within the structure of open field vegetable crops.
Table 15. Crop area, harvest and yield of vegetables grown in the open field Indicators 2003 2004 2005 2006
Crop area, in ha’000 27.1 20.4 20.7 15.5 Total harvest, in t’000 516.9 342.8 333.3 178.7 Yield, in t/ha 19.1 16.8 16.1 11.6
Yielding capacity of vegetables in 2006 was the lowest within the period of 2003-2006. Productivity of cabbage cultivated in Lithuania is higher than in the neighbouring countries of Latvia and Estonia, however, more than 4 times less than in the Netherlands. Productivity of carrots in Lithuania is among the lowest in the EU – it is lower only in Latvia. Beetroot and onion productivity is lower than in Lithuania only in Estonia and Latvia.
Seed is of great importance for the harvest of vegetables, however, the certified seed grown in Lithuania covers only 0.01% of the entire seed demand. Contrasting weather conditions in summer time, lack or surplus of rain, had a negative impact on the vegetable yields and the keeping quality. In 2006 the vegetable harvest was 46% smaller than in 2005, as a result of reduced areas

215
under vegetables by 25%, and because of unfavourable weather conditions leading to the decreased productivity of vegetables by 28%.
Almost all vegetables harvested (97%) are cultivated by farmers and family households. Small farms prevail in Lithuania, which are not capable of making necessary investments and introducing new technologies due to small income flows. Sparse farms are also weak in negotiating prices, so it is more difficult for them to introduce quality improvement programmes, prepare and supply properly the production to the consumer, and be capable of supplying bulk batches of production to supermarkets and vegetable processing companies. Moreover, shortage of labour force is already felt in rural areas, and it is becoming costly. Only large vegetable cultivators may afford to acquire combine harvesters substituting dozens of workers, and the small farmers cannot make such investments.
Processing Lithuanian fruit and vegetable processing companies produce a variety of
vegetables. Products are in demand both on the domestic market and abroad. In 2006 vegetable and fruit produce was 1.5 times larger than in 2003, including 20% more of fruit and vegetable juice, 23% more of tomato ketchup and other tomato sauces.
Table 16. Production of selected fruit and vegetable products
Products 2003 2004 2005 2006 2006
comparedto 2003, %
Prepared or preserved fruit and vegetable products (juice excl.), in t’000 14.7 13.3 21.2 21.6 147
Fruit and vegetable juice, in l’000,000 13.9 8.1 16.4 16.7 120 of which tomato juice, in l’000,000 2.5 2.3 3.4 4.5 180
Tomato ketchup and other tomato sauces, in t’000 11.3 12.5 13.9 13.9 123 Cabbages prepared or preserved, in t 33.2 135.2 650.7 721.9 21.7a Shelled bean prepared or preserved, in t 29.8 18.1 51.3 48.2 162 Frozen vegetables and mixtures, in t 756.1 651.5 761.3 383.1 51
a Times.
Production of tomato juice and paste is oriented towards the domestic market, where the output of tomato juice (93%) and tomato ketchup and other tomato sauces (88%) is sold. The production of frozen vegetables and mixtures sold on the domestic market accounts for 77%, canned cabbage – 73%, prepared or canned shelled beans – almost the entire amount.
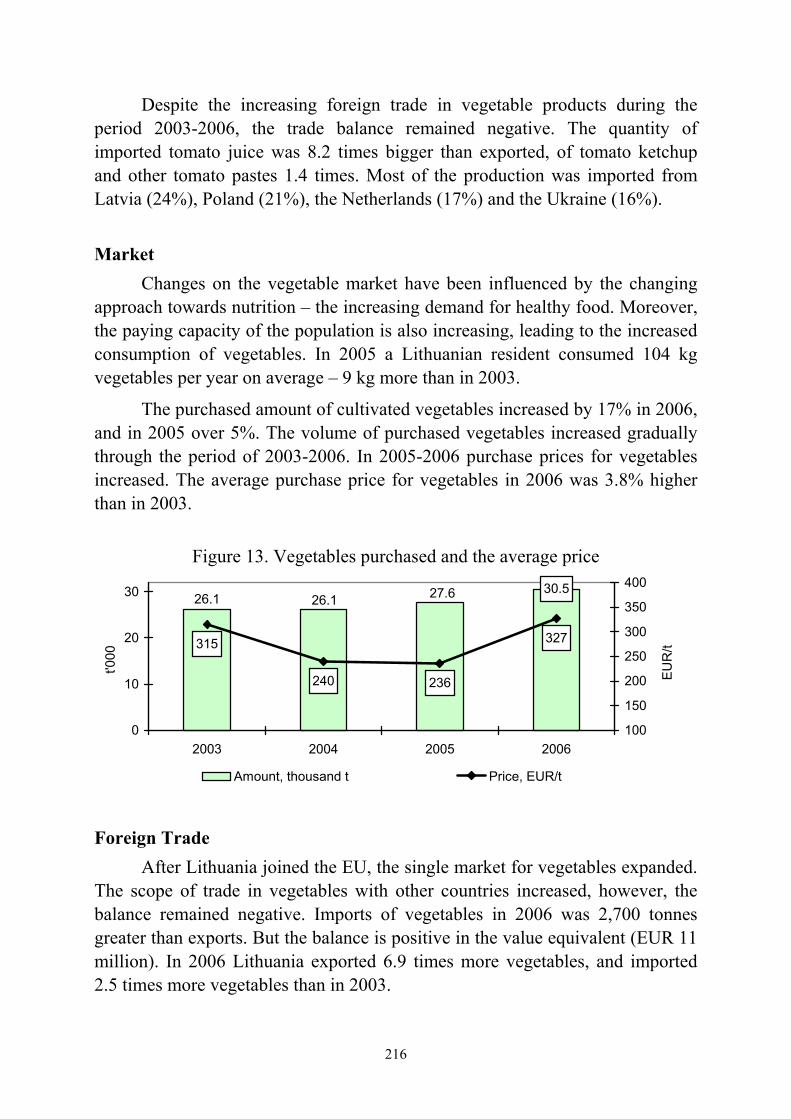
216
Despite the increasing foreign trade in vegetable products during the period 2003-2006, the trade balance remained negative. The quantity of imported tomato juice was 8.2 times bigger than exported, of tomato ketchup and other tomato pastes 1.4 times. Most of the production was imported from Latvia (24%), Poland (21%), the Netherlands (17%) and the Ukraine (16%).
Market
Changes on the vegetable market have been influenced by the changing approach towards nutrition – the increasing demand for healthy food. Moreover, the paying capacity of the population is also increasing, leading to the increased consumption of vegetables. In 2005 a Lithuanian resident consumed 104 kg vegetables per year on average – 9 kg more than in 2003.
The purchased amount of cultivated vegetables increased by 17% in 2006, and in 2005 over 5%. The volume of purchased vegetables increased gradually through the period of 2003-2006. In 2005-2006 purchase prices for vegetables increased. The average purchase price for vegetables in 2006 was 3.8% higher than in 2003.
Figure 13. Vegetables purchased and the average price
30.526.1 26.1 27.6
240
315
236
327
0
10
20
30
2003 2004 2005 2006
t'000
100
150
200
250
300
350
400
EUR
/t
Amount, thousand t Price, EUR/t
Foreign Trade After Lithuania joined the EU, the single market for vegetables expanded.
The scope of trade in vegetables with other countries increased, however, the balance remained negative. Imports of vegetables in 2006 was 2,700 tonnes greater than exports. But the balance is positive in the value equivalent (EUR 11 million). In 2006 Lithuania exported 6.9 times more vegetables, and imported 2.5 times more vegetables than in 2003.

217
In 2006 vegetables were mostly imported from Poland – 52%, and the Netherlands – 22%. Polish vegetable cultivators are considered the main competitors for Lithuanians, as they manage to cultivate their production at considerably lower costs. Most vegetables were exported to Russia (76%) and Latvia (9%) in 2006.
Figure 14. Exports and imports of vegetables in thousand tons
13.7
38.8
21.3
50.1
26.6
57.5
95.1 97.8
0
20
40
60
80
100
2003 2004 2005 2006
Exports Imports
3.5.3. Potatoes Cultivation of potatoes has deep traditions in Lithuania. Even in soviet
times potatoes were grown not only on collective farms, but also in people’s gardens. Despite the annually decreasing consumption of potatoes, they remain the traditionally major product in the Lithuanian diet. Every year, over a million tons of potatoes have been harvested so far, however, in recent years, areas under potatoes and their harvests are falling. During the period 2003-2006 the area under potatoes in Lithuania has decreased by 38%. Almost the entire crops of potatoes (99%) are grown on farmsteads.
Table 17. Crop area, harvest and yield of potatoes Indicators 2003 2004 2005 2006
Crop area, in ha’000 93.6 79.3 74.0 57.8 Total harvest, in t’000 1,445 1,021 895 457.1 Yield, in t/ha 15.4 12.9 12.1 7.9
The second in turn hot and dry summer had a negative impact on the yield of potatoes. The reduced area (by 22%), bad climate conditions and fallen yields (by 35%) in 2006 resulted in almost half the harvest in comparison to 2005.
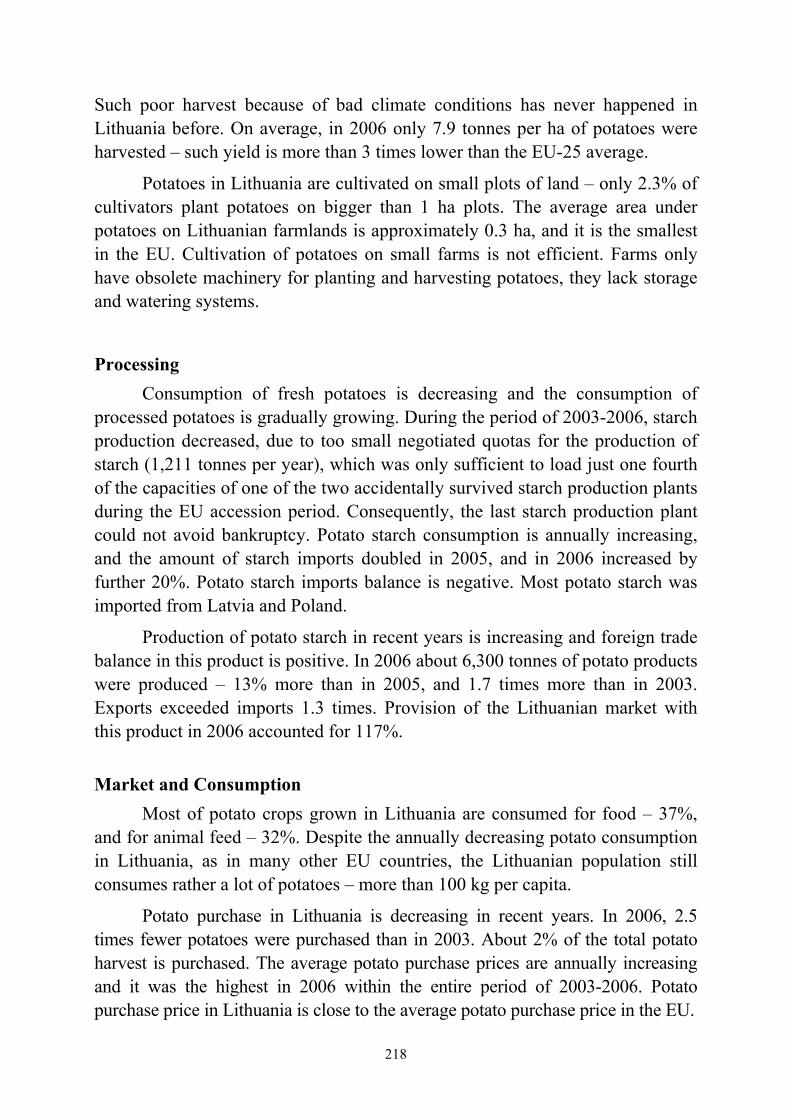
218
Such poor harvest because of bad climate conditions has never happened in Lithuania before. On average, in 2006 only 7.9 tonnes per ha of potatoes were harvested – such yield is more than 3 times lower than the EU-25 average.
Potatoes in Lithuania are cultivated on small plots of land – only 2.3% of cultivators plant potatoes on bigger than 1 ha plots. The average area under potatoes on Lithuanian farmlands is approximately 0.3 ha, and it is the smallest in the EU. Cultivation of potatoes on small farms is not efficient. Farms only have obsolete machinery for planting and harvesting potatoes, they lack storage and watering systems.
Processing Consumption of fresh potatoes is decreasing and the consumption of
processed potatoes is gradually growing. During the period of 2003-2006, starch production decreased, due to too small negotiated quotas for the production of starch (1,211 tonnes per year), which was only sufficient to load just one fourth of the capacities of one of the two accidentally survived starch production plants during the EU accession period. Consequently, the last starch production plant could not avoid bankruptcy. Potato starch consumption is annually increasing, and the amount of starch imports doubled in 2005, and in 2006 increased by further 20%. Potato starch imports balance is negative. Most potato starch was imported from Latvia and Poland.
Production of potato starch in recent years is increasing and foreign trade balance in this product is positive. In 2006 about 6,300 tonnes of potato products were produced – 13% more than in 2005, and 1.7 times more than in 2003. Exports exceeded imports 1.3 times. Provision of the Lithuanian market with this product in 2006 accounted for 117%.
Market and Consumption
Most of potato crops grown in Lithuania are consumed for food – 37%, and for animal feed – 32%. Despite the annually decreasing potato consumption in Lithuania, as in many other EU countries, the Lithuanian population still consumes rather a lot of potatoes – more than 100 kg per capita.
Potato purchase in Lithuania is decreasing in recent years. In 2006, 2.5 times fewer potatoes were purchased than in 2003. About 2% of the total potato harvest is purchased. The average potato purchase prices are annually increasing and it was the highest in 2006 within the entire period of 2003-2006. Potato purchase price in Lithuania is close to the average potato purchase price in the EU.

219
Figure 15. Quantities and average prices of potatoes purchased
31.4
20.4
11.4 12.475
230
142
71
0
5
10
15
20
25
30
35
2003 2004 2005 2006
t'000
0
50
100
150
200
250
EUR
/t
Quantity, thousand t Average price, EUR/t
Foreign Trade Lithuanian farmers may export potatoes to EU countries since 1 January
2006, when the transition period for Lithuania set by the European Commission under the EU Directive concerning the implementation of measures for the control of potato ring rot expired.
However, Lithuanian foreign trade in potatoes is not very active. In 2006 the foreign trade balance in potatoes remained negative, and imports accounted only for about 3% of the total annual domestic demand for potatoes. Imports of potatoes exceeded exports 9.9 times. Potatoes were largely imported from Sweden, Germany and Denmark. The largest potato export flows are directed to Russia (65%) and Latvia (23%).
Figure 16. Foreign trade in potatoes in thousand tons
2.5 1.7 0.92.63.4 2.9
26.0
16.8
0
10
20
30
2003 2004 2005 2006
Export Import
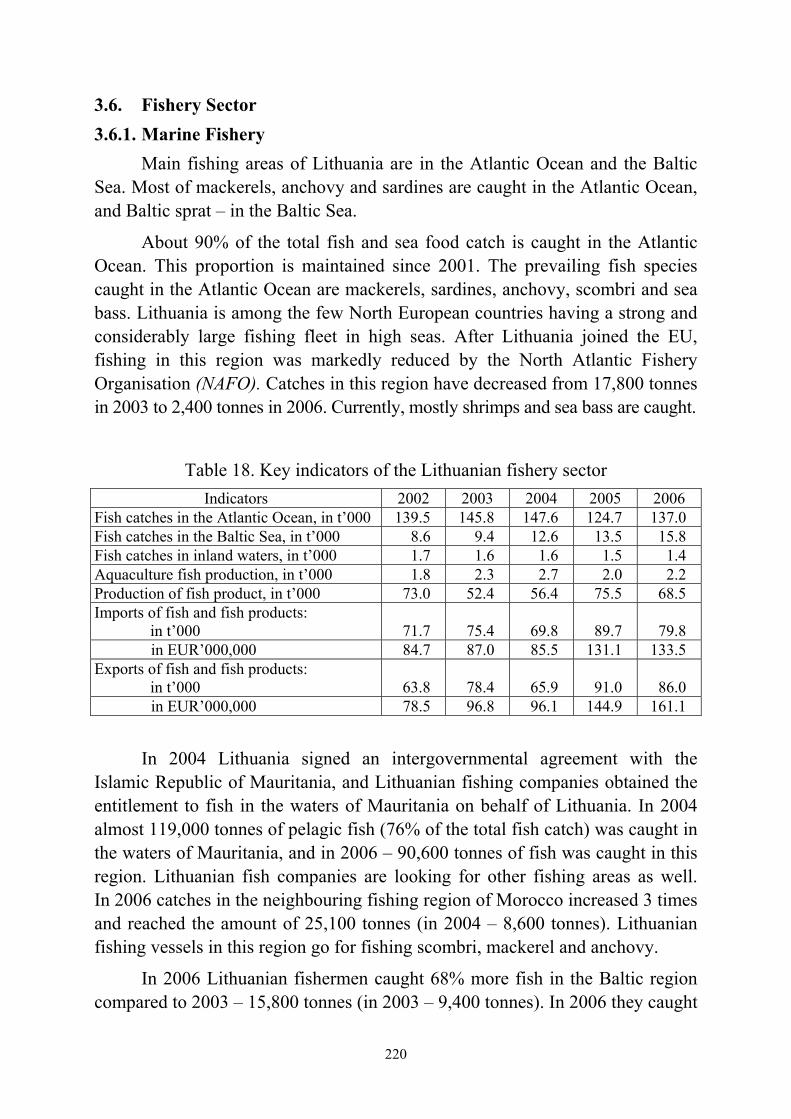
220
3.6. Fishery Sector 3.6.1. Marine Fishery
Main fishing areas of Lithuania are in the Atlantic Ocean and the Baltic Sea. Most of mackerels, anchovy and sardines are caught in the Atlantic Ocean, and Baltic sprat – in the Baltic Sea.
About 90% of the total fish and sea food catch is caught in the Atlantic Ocean. This proportion is maintained since 2001. The prevailing fish species caught in the Atlantic Ocean are mackerels, sardines, anchovy, scombri and sea bass. Lithuania is among the few North European countries having a strong and considerably large fishing fleet in high seas. After Lithuania joined the EU, fishing in this region was markedly reduced by the North Atlantic Fishery Organisation (NAFO). Catches in this region have decreased from 17,800 tonnes in 2003 to 2,400 tonnes in 2006. Currently, mostly shrimps and sea bass are caught.
Table 18. Key indicators of the Lithuanian fishery sector Indicators 2002 2003 2004 2005 2006
Fish catches in the Atlantic Ocean, in t’000 139.5 145.8 147.6 124.7 137.0 Fish catches in the Baltic Sea, in t’000 8.6 9.4 12.6 13.5 15.8 Fish catches in inland waters, in t’000 1.7 1.6 1.6 1.5 1.4 Aquaculture fish production, in t’000 1.8 2.3 2.7 2.0 2.2 Production of fish product, in t’000 73.0 52.4 56.4 75.5 68.5 Imports of fish and fish products:
in t’000 71.7 75.4 69.8 89.7 79.8 in EUR’000,000 84.7 87.0 85.5 131.1 133.5
Exports of fish and fish products: in t’000 63.8 78.4 65.9 91.0 86.0 in EUR’000,000 78.5 96.8 96.1 144.9 161.1
In 2004 Lithuania signed an intergovernmental agreement with the Islamic Republic of Mauritania, and Lithuanian fishing companies obtained the entitlement to fish in the waters of Mauritania on behalf of Lithuania. In 2004 almost 119,000 tonnes of pelagic fish (76% of the total fish catch) was caught in the waters of Mauritania, and in 2006 – 90,600 tonnes of fish was caught in this region. Lithuanian fish companies are looking for other fishing areas as well. In 2006 catches in the neighbouring fishing region of Morocco increased 3 times and reached the amount of 25,100 tonnes (in 2004 – 8,600 tonnes). Lithuanian fishing vessels in this region go for fishing scombri, mackerel and anchovy.
In 2006 Lithuanian fishermen caught 68% more fish in the Baltic region compared to 2003 – 15,800 tonnes (in 2003 – 9,400 tonnes). In 2006 they caught
221
26% more of Baltic sprat (11,000 tonnes), however, the set quota was not fully exhausted. Catches of sprat in the Baltic Sea are annually increasing, however, most of this sort of fish is unloaded in Denmark due to the lack of demand and processing capacities. The most profitable fishing in the open waters of the Baltic Sea remains the fishing of cod, which ensures for fishing companies about 75%-77% of returns. The highest efficiency of fishing is reached through catching cod – 22%-25%.
The Fleet At the beginning of 2006 the EU Register of Ships registered 271 fishing
vessels, boats and dinghies of Lithuania. Most of these vessels (201) are dinghies or fishing boats, shorter than 12 m., adjusted for fishing in coastal waters, not far from the coast. 91% of fishing capacities in the fleet (GT) and 78% of engine power (kW) fall under 17 vessels adjusted for fishing in remote waters. 46 fishing vessels of Lithuania, the total capacity of which is 5,400 GT and 10,200 kW, were fishing in the open waters of the Baltic Sea. In 2006 the average age of fishing vessels entered into the Lithuanian Register of fishing ships was 23 years. The average age of fishing vessels, which are longer than 12 m., is 29 years.
20 contracts were concluded at the beginning of 2005 concerning the writing off of the fishing vessels for scrap-iron with the help of the means from the EU structural support. For the implementation of this measure EUR 3.3 million has been already utilised out of the total amount of EUR 17.2 million of the EU support allocated for the sector of fishery for the period of 2004-2006. The average age of the written-off fishing ships is 35 years. The total fishing capacity of the fleet decreased by 1,576 GT and the average engine power by 3,104 kW. In 2006 another 11 applications have been submitted for writing off fishing vessels for scrap-iron, the assessment of which is not yet finalised.
Infrastructure
In 2003 a fishing harbour was constructed at the influx of the Smiltelė river in the Klaipėda State Seaport, where the embankments and engineering networks were equipped, and an ice production plant and a warehouse were built, too. It is planned to equip the premises for fish auction in this harbour as well. In 2004 the joint-stock company „Klaipėdos žuvininkystės produktų aukcionas“ (Klaipėda auction of fish products) was established. The entire package of shares is state owned. The construction of the building shall be
222
finished in 2007 using for this purpose also the means from the EU structural support fund.
At present, fish caught in the coastal waters of the Baltic Sea is unloaded at 30 specially set points, where the declaration of first sales is applied for registered purchasers, the freshness of fish is checked, and information on fish prices collected.
After joining the EU, general EU principles on organising fish product markets shall be applied in Lithuania, including the application of intervention measures. Organisations of fish product producers are responsible for the implementation of the above measures. In 2004 the Department of Fishery recognised 2 organisations of producers – Lithuanian Association of fish product producers and the National Association of Aquaculture and Producers of fish products, which represent correspondingly the interests of sea fishermen and fish breeders.
Fish Processing
In 2001 there were about 90 fish processing enterprises in Lithuania, though only half of them were operational. During the period of five years this number decreased almost three times. In 2005 there were 35 operational fish processing companies in Lithuania, including 29 of them having acquired the certificate approved by the State food and veterinary service for producing, keeping and supplying fish products for the domestic and the single EU markets. 5 companies had the approved entitlement for producing, keeping and supplying fish products only for the domestic market, and one company was given the transitional period for getting ready to produce fish products under the set EU requirements. Moreover, in 2005 certificates were awarded to 12 fishing vessels granting the right to sell fish products abroad.
Since 2003 industrial fish processing capacities increased by almost one third. In 2005 Lithuanian fish processing companies (except for processing on vessels) produced 75,500 tonnes of products, the total value of which amounted to EUR 155.4 million. In 2006 this produce decreased by 9%. More varieties of fish products are now manufactured. A large proportion among the processed fish products is taken by delicatessen pickled products – crab meat sticks, fish fingers, crayfish tails and other products. Pickled products and vacuum packed frozen fish fillet take the major share among the exported products. Other sorts of products are chilled and frozen fish, salted or smoked fish, and ready made food products of herring and scombri, largely sold on the domestic market.
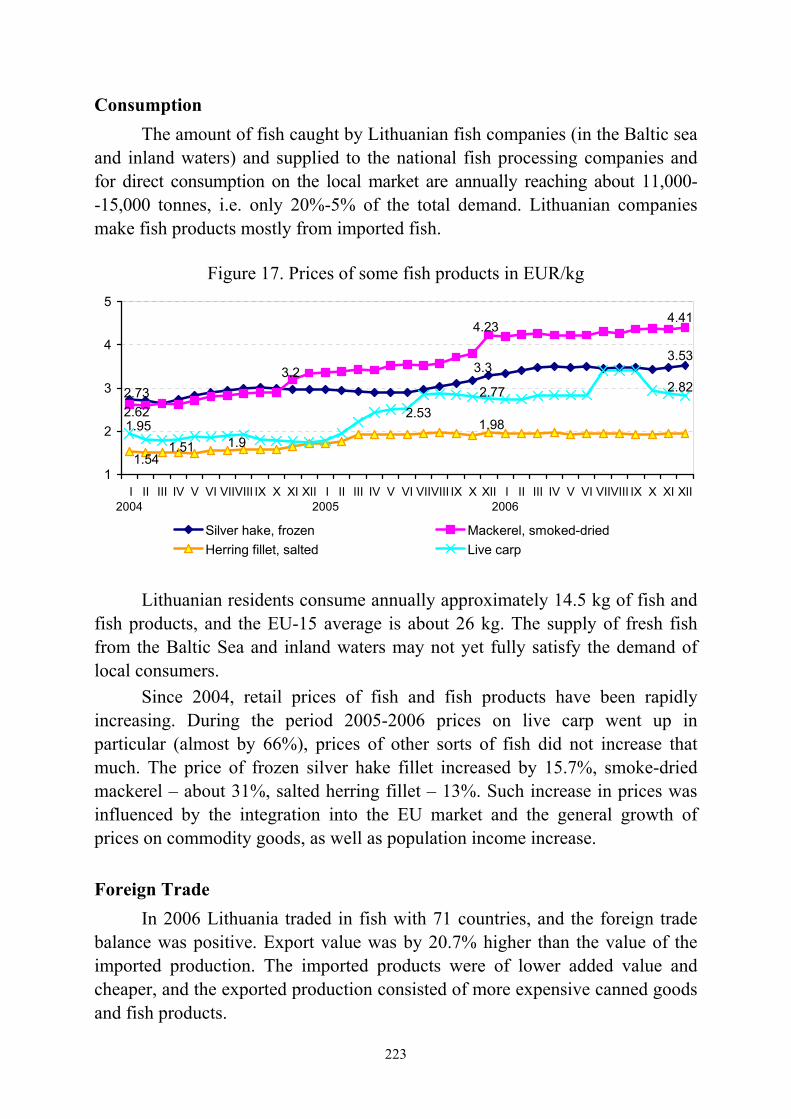
223
Consumption The amount of fish caught by Lithuanian fish companies (in the Baltic sea
and inland waters) and supplied to the national fish processing companies and for direct consumption on the local market are annually reaching about 11,000- -15,000 tonnes, i.e. only 20%-5% of the total demand. Lithuanian companies make fish products mostly from imported fish.
Figure 17. Prices of some fish products in EUR/kg
3.53
2.73
3.3
4.41
2.62
3.2
4.23
1.511.54
1.98
2.82
2.53
1.91.95
2.77
1
2
3
4
5
I2004
II III IV V VI VIIVIII IX X XI XII I2005
II III IV V VI VIIVIII IX X XII I2006
II III IV V VI VIIVIII IX X XI XII
Silver hake, frozen Mackerel, smoked-driedHerring fillet, salted Live carp
Lithuanian residents consume annually approximately 14.5 kg of fish and
fish products, and the EU-15 average is about 26 kg. The supply of fresh fish from the Baltic Sea and inland waters may not yet fully satisfy the demand of local consumers.
Since 2004, retail prices of fish and fish products have been rapidly increasing. During the period 2005-2006 prices on live carp went up in particular (almost by 66%), prices of other sorts of fish did not increase that much. The price of frozen silver hake fillet increased by 15.7%, smoke-dried mackerel – about 31%, salted herring fillet – 13%. Such increase in prices was influenced by the integration into the EU market and the general growth of prices on commodity goods, as well as population income increase. Foreign Trade
In 2006 Lithuania traded in fish with 71 countries, and the foreign trade balance was positive. Export value was by 20.7% higher than the value of the imported production. The imported products were of lower added value and cheaper, and the exported production consisted of more expensive canned goods and fish products.
224
In 2006 Lithuania imported 79,800 tonnes of fish and fish products, and the value of the imported production amounted to EUR 133.5 million. The average price of imported fish products in comparison to 2005 increased by 14.5%. The main countries exporting their production to Lithuania are Iceland, Norway, Latvia, Germany, USA, the Netherlands and Estonia. Fish production is imported into Lithuania from 50 countries around the globe. 44% of the imported amount of fish (43% in the value equivalent) was from the EU countries, 6% (14% in the value equivalent) – from the CIS countries. Import quantities since 2003 increased slightly (about 6%), whereas the value of imported production increased more than 50%. This was influenced by the general growth of prices on fish and the changes in the variety of production.
3.6.2. Inland fishery The total area of inland waters in Lithuania amounts to 2,621sq. km., i.e.
4% of the territory of the country. There are 2,827 lakes over 0.5 ha (87,359 ha), 1,589 ponds (24,434 ha) and 733 rivers longer than 10 km (32,601 ha). The largest pool of national inland waters is the Curonian Lagoon, the total area of which is 1,584 sq. km. The Northern part of the waters in the area of 413 sq. km. (26%) belongs to the Republic of Lithuania, and the remaining part belongs to the Russian Federation.
The Curonian Lagoon, the Kaunas Sea and the lower reaches of the Nemunas river are the most significant water areas for commercial fishery in the natural inland waters. The least important are lakes and rivers. In 2003-2006 about 1,100-1,300 tonnes of fish was caught in the Curonian lagoon, i.e. about 30% of the total amount of fresh water fish, and in other water areas only about 328-279 tonnes, approximately 9%-10% of fresh water fish. The catch of fish cultivated in specialised fish breeding pools amounts to 2,014-2,697 tonnes (about 60%) of fresh water fish and represents the largest proportion thereof.
Part of fishing is carried out in the territories of protected environmental zones under the “Natura 2000” programme. More strict environmental requirements are applied there, and subsequently fishery and aqua-cultural activities in certain water areas are much more restricted and sustain losses. Huge damage to water pools and fishermen in the Curonian Lagoon is done by the protected populations of birds in these territories.
The total area of aqua-cultural pools reaches 10,500 ha. No less than 5,500 tonnes of commercial fish could be raised there annually. In 2003 the amount of fish raised there totalled to 2,348 tonnes, and in 2006 – to 2,225 tonnes of production, where carp accounts for 94%-97%. Due to limited market

225
for production, about 50% of the capacities of the ponds remain unused. Trouts, pikes, crucian carps, sturgeons, catfish, and other sorts of fish are raised in the ponds. Most of fish is sold on the domestic market. In 2003-2006 about 30%- -32% of commercial carp fish was annually exported.
In recent years, aqua-culture is to some extent supported from the national support means, allocated for the implementation of the Rural Development Programme. National aqua-cultural partnerships are rapidly developing organic fishery activities. In 2003 fish breeding areas in the ponds of 10 fishing partnership were certified, and in 2006 – 14 (out of 18 operating partnerships). In 2003 the total area of certified fish breeding ponds amounted to 2,848 ha, and their commercial production accounted for 19.5% (457 tonnes) of the total fish production from ponds, in 2006 – 5,169 ha and 39% (868 tonnes) accordingly.
More and more attention is given in Lithuania to reproduction of the resources of fish. For incubation of fish into the non-rented water areas and the supervision of migration paths annual governmental programmes are drafted, for the implementation of which the responsibility is charged to the Lithuanian state research centre in fish breeding and fisheries. Every year about 140-210 million maggots or young fish of various commercial and other rare or disappearing fish species are let out into the waters. Water pool lessees also participate in the implementation of these programmes.

226
Dr. Inguna Gulbe, Dr. Ligita Melece, Juris Hazners Latvian State Institute of Agrarian Economics, Riga, Latvia,
Ph.D. Csaba Jansik MTT Agrifood Research, Helsinki, Finland
The Impact of EU Accession on Latvia’s Food Sector
1. Introduction During the pre-accession period Latvia adapted its institutions, standards
and infrastructure to enable them to meet their EU obligations at the time of accession.
As part of the process of accession to the EU and after becoming a member state, Latvia harmonised and implemented the requirements of community legislation as well as EU policies affecting the food sector.
Latvia has harmonised and implemented the EU policies (CAP, Common Market Organization, White Paper and Green Paper on Food Safety) and the requirements of the EU legislation (Regulations, Decisions, Directives) regarding food quality and common market organization (export refunds).
2. Latvian Agri-Food Sector 2.1. Agriculture in the Economy
Agriculture plays an important role in the national economy, despite the fact that it contributes only a small share toward GDP in terms of value added (2.4%). The fact is that almost 1/3rd of Latvia’s population lives in the countryside, and agricultural production is the main activity and means of subsistence and source of income.
In 2004, 97,000 people, or 10% of all employees, had jobs in agriculture. Since 2001, the overall number of employed people in Latvia has been increasing, but in agriculture that number has decreased 2.2 times in comparison to 1990 (Central Statistical Bureau of Latvia, 2005).
According to the data provided by the Central Statistical Bureau in 2005 the Gross Domestic Product (GDP) of Latvia reached 8,937.3 million LVL showing GDP increase of 10.2 percent compared to 2004. GDP in the agricultural sector increased to 204.7 million lats or by 6.9% compared to 2004.
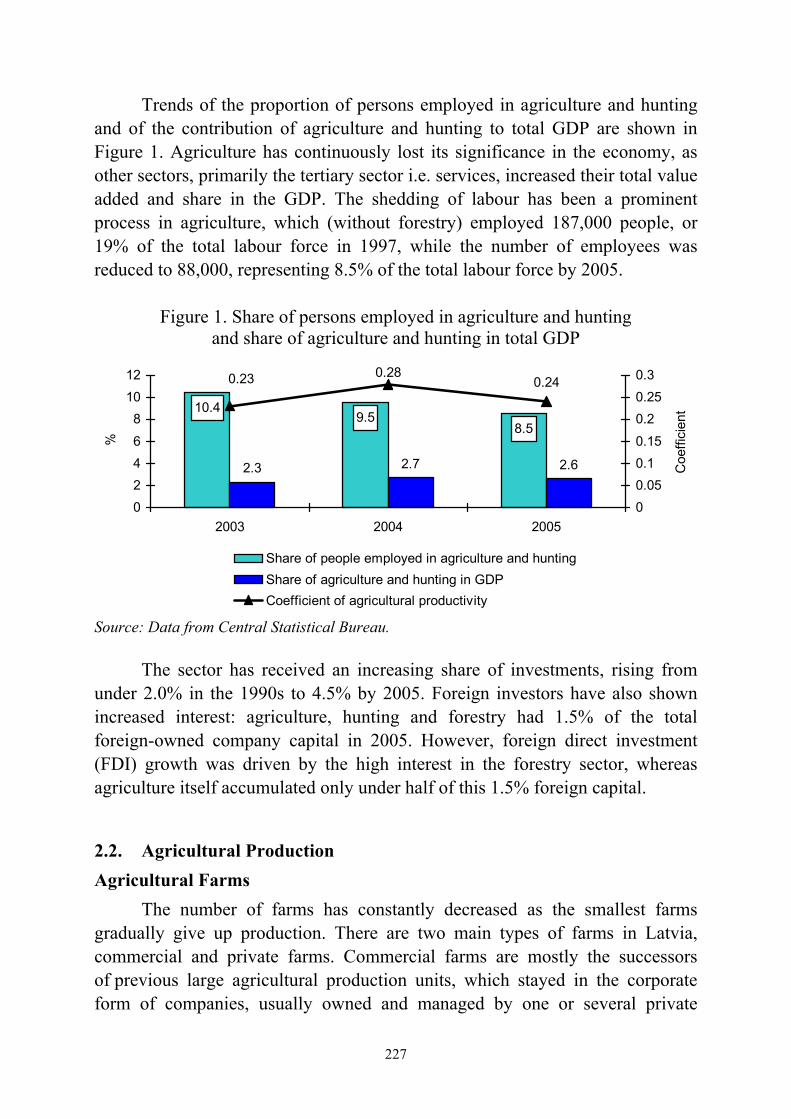
227
Trends of the proportion of persons employed in agriculture and hunting and of the contribution of agriculture and hunting to total GDP are shown in Figure 1. Agriculture has continuously lost its significance in the economy, as other sectors, primarily the tertiary sector i.e. services, increased their total value added and share in the GDP. The shedding of labour has been a prominent process in agriculture, which (without forestry) employed 187,000 people, or 19% of the total labour force in 1997, while the number of employees was reduced to 88,000, representing 8.5% of the total labour force by 2005.
Figure 1. Share of persons employed in agriculture and hunting
and share of agriculture and hunting in total GDP
9.510.4
8.5
2.3 2.7 2.6
0.240.280.23
0246
81012
2003 2004 2005
%
00.050.10.15
0.20.250.3
Coe
ffici
ent
Share of people employed in agriculture and huntingShare of agriculture and hunting in GDPCoefficient of agricultural productivity
Source: Data from Central Statistical Bureau.
The sector has received an increasing share of investments, rising from under 2.0% in the 1990s to 4.5% by 2005. Foreign investors have also shown increased interest: agriculture, hunting and forestry had 1.5% of the total foreign-owned company capital in 2005. However, foreign direct investment (FDI) growth was driven by the high interest in the forestry sector, whereas agriculture itself accumulated only under half of this 1.5% foreign capital.
2.2. Agricultural Production Agricultural Farms
The number of farms has constantly decreased as the smallest farms gradually give up production. There are two main types of farms in Latvia, commercial and private farms. Commercial farms are mostly the successors of previous large agricultural production units, which stayed in the corporate form of companies, usually owned and managed by one or several private
228
owners. Private farms are typically family farms, which acquired assets, land and livestock during the reforms in the 1990s and continued production since then. Commercial farms are large entities. Although there are only a few hundred of them, their share in agricultural production can be considerable in some product groups; in 2005 they accounted for 80% of egg, 50%-60% of meat, over 40% of sugar beet and 23% of cereal production.
Along with the accession to the EU, the prices of resources used in production (diesel fuel, mineral fertilisers, etc.) have increased. The prices of fertilisers have increased gradually.
Crop Production
The amount of sown area has apparently grown in the past two years, which is presumably the encouraging effect of EU accession and growing subsidies.
A slight structural realignment can be observed among the crop groups over the past five years. Cereals and industrial crops have increased their relative significance at the expense of potato and fodder crops. The absolute amount of cereal area has not changed much over the past ten years, but their relative weight has. In the case of industrial crops, the rapid increase can be attributed to the rapidly growing rapeseed acreage.
Rapeseed was sown on 54,000; 71,000 and 83,000 hectares in 2004, 2005 and 2006, respectively. Both cereal and rapeseed areas are projected to increase further in the next ten years due to the demand raised by bioenergy production. This area increase may press down the area used for fodder crops, which in fact is in line with the structural changes of the dairy sector. Land will be used more efficiently in the milk sector, due to the concentration of the dairy farm sructure and the increasing share of the large dairy farms. The production of grain and rapeseed has rapidly increased in the past years.
As a logical result of changing weather conditions, grain production shows peaks such as 1997 and 2002, but the three latest years are a sign of more permanent growth for grain production. Among these years, 2005 was certainly the record year, with good weather and high average yields. Rapeseed production shows a steadily rising trend, although the considerably worse yield in 2006 interrupted the dynamic increase compared to 2005. Yields have been fluctuating, but there is a long term growth trend for both grains and rapeseed.
Among the other crops, the yield of sugar beet has improved considerably over the past years, offsetting the acreage reduction, so that output has almost doubled between 1995 and 2006. Potato and vegetable production has been declining over the ten year period.
229
Livestock Production The cattle sector is under the process of structural change, the number of
other cattle has increased, while the number of dairy cows has continuously decreased. The development in the dairy cow herd is in line with the general international trends also observed elsewhere in Europe. The number of animals decline with the rapid productivity increase. On the other hand, the number of other cattle has been slightly growing and this is partly attributable to the EU subsidy mechanisms, which favour the beef cattle sector.
The pig-breeding sector has a significant share in the agricultural product market of Latvia. The ultimate aim in 2005 was to stabilise the pig-breeding industry and to stimulate product competition on the market, by using breeding material of genetically high-quality and reducing product cost price.
Amounts of the pork production are stable and there are potential possibilities to increase the output. Self-provision with pork in 2005 was 52%.
Currently, structural changes are taking place in the pig-breeding industry and production is concentrated in the largest farms. Compared to 2004, the number of animals on farms with 100 to 199 pigs has increased by 17%, but in farms with 2,000-4,999 pigs the number of animals has grown by 11%. In 2005, compared to the previous year, the total number of pigs decreased by only 1.8%. At the same time, the number of farms where sows are kept has decreased by 22%, but the total number of sows has slightly increased (Ministry of Agriculture, 2006).
The pig sector has struggled with serious structural and profitability problems for several years, which were remedied with protectionist trade measures in the early 2002, but the sector started to face more fierce foreign competition again after the accession to the EU. This can be seen in the gradual decline in the number of pigs since 2003, despite the fact that the meat processing sector has recently concentrated and some of the largest processors have shown dynamic growth and efficiency improvement.
The number of poultry declined steadily in the second half of the 1990s, when the inefficient domestic poultry sector lost its market share to imported products. Both large domestic processors invested into production technology, strengthened vertical integration and, as a very important factor, improved the distribution. These facts are reflected in constant growth of the number of poultry since 2000. However, it is hard to regain the markets from the imported products.
230
Although the geographical origin of the imports changed in 2004, as the USA lost its previous strong positions, the import pressure remained the same, this time coming from EU countries. Total meat production including meat of all livestock and poultry sources has increased since 2003. Milk production started to grow again in 2005, the first time in three years, which fact verifies the milk productivity improvement. The increased production was achieved despite the declining number of dairy cows. The number of eggs has grown steadily, but since domestic markets do not expand, the surplus always has to be placed abroad.
Sector Income Economic Accounts for Agriculture (EAA) were used to evaluate income
in the agricultural sector as a whole (including non-agricultural activities). When evaluating the final product structure of agricultural products, Vēveris and Krieviņa [2005] looked at the basic price of products (including subsidies which apply to the various products), covering the period between 1996 and 2004. The authors concluded that milk and cereals have always had the highest proportion in the structure: a significant increase in milk output in 2004 was the result of higher purchase prices in the wake of Latvia’s accession to the EU. Traditionally, the main sectors of Latvian agriculture have been pork production and potato growing, even though their proportion in end products declined a bit in 2004. The growing of sugar beet has always been an important source of income for Latvian farmers, but the future of that sector depends very much on EU sugar reforms and their effect in Latvia. Over the last few years, the proportion of rapeseed in the end products has increased rapidly – this can be seen as a long-term change in the structure of farm production.
Income in the sector declined between 1996 and 1999 because of declines in output and purchase prices, and of an increase in input prices, particularly fuel. As was mentioned before, crises in the latter half of the 1990s had an effect on agriculture in terms of a drop in the income of the agricultural sector. Income began to increase again in 2000 because of stabilization of input prices and increase of output and purchase prices. Particularly rapid increases in income were registered in 2004, largely because of Latvia’s accession to the EU.
Increased subsidies were the most important factor in this. Production and area linked EU and national support (except investment support) amounted to LVL 105.3 million in 2004 – approximately three times more than in 2003. When Latvia joined the EU’s Common Agricultural Policy, that changed the structure of subsidies: product linked subsidies declined, while the proportion of aforementioned subsidies increased. Single area payments were added to the

231
mix, steps were taken under the “Agro-Environment” Development Plan, and support was given to less favourable regions (Vēveris and Krieviņa, 2005).
2.3. Food Industry Food industry is one of the most important branches of Latvia’s industry.
According to the data of the Statistical Office of Latvia, the food industry in 2005 forms 21% of the total sales of industrial products.
Over the past four years, the number of enterprises manufacturing food products and beverages has gradually decreased, but the number of people employed in such enterprises has increased, and in 2005 this industry was providing jobs for 3.4% of all employed persons.
The food industry also plays an important role in foreign trade, because it accounts for 6.9% of total exports.
The food industry has always been the most important manufacturing sector, although its share in total manufacturing decreased from the peak level of over 40% in 1996 to 24.3% by 2005. The output of some other industries increased even more dynamically than that of food processing. Wood processing – the largest of the fast growing industries – increased its share in manufacturing from 10% to 22.6% between 1996 and 2005.
The sales of food industry increased fairly steadily after the Russian crisis, except for 2003. Total sales were about EUR 0.9 billion at the end of the 1990s, but they amounted to as much as EUR 1.3 billion in 2005. Approximately 77% of the total food industry output is consumed on the domestic market.
This increase was achieved with a relatively stable labour force. Unlike many other food industries in Europe, the Latvian food industry has not been characterised by shedding labour during recent years. In 2005, the three largest branches were dairy (20%), meat (18%) and fish (12%) industries.
Meat and dairy industries have developed steadily, but the fish industry is very vulnerable, as it is heavily oriented to the eastern export markets, which is refelected in the sales figures both in 1999 and in 2003-2004. Distilling has been the most dynamically expanding industry, primarily due to the success in export sales; its share in food industry output increased from under 7% in 2000 to nearly 11% in 2005. At the same time, the importance of the milling-bakery chain among the food processing industries slightly declined from over 18% in 2000 to about 15%-16% in 2005.
232
Prices Consumer price indices show the inflation rate accelerating over the past
three years. While inflation was kept under 3% in the early 2000s, it surged over 6% annually since 2004. The Russian crisis interrupted the rise of producer prices after 1998, but they picked up again as fast as consumer prices from 2004 onwards.
2.4. Impact of Hygiene Legislation The new food-hygiene legislation, which came into force on 20 May
2004, seeks to ensure a high level of consumer-protection as regards the safety of food products by pursuing an integrated approach covering the whole of the food chain ("from farm gate to plate").
However, in the last few years there has been a sharp decline in structures of small, artisanal and/or traditional processing businesses, especially in the areas of meat and milk processing and marketing, that are of particular importance for the economic development in rural areas (Figure 2). It has often been suggested by those affected and by the competent authorities, that high EU hygiene requirements are responsible for this structural change (European Economic and Social Committee, 2005).
Special attention must be paid to food businesses engaged in processing meat products and milk, because meat and milk are important sectors with respect to value added of agricultural products in Latvia and as specific hygienic rules have been laid down covering these sectors.
Comparing the number and structure of milk and meat enterprises in 2002 and 2006, we note the considerable decrease in the number of slaughterhouses and milk processing enterprises, and some increase in the number of milk collecting enterprises (Figure 2). These changes were mainly caused by the implementation of strict hygienic requirements.
Regulation 852/2004 calls for the application of the concept of Hazard Analysis and Critical Control Point (HACCP) to food safety procedures (The European Parliament and The Council, 2004). In Latvia’s case the use of this instrument forced costs upwards, because too much importance is attached to documentation and extensive checklists.
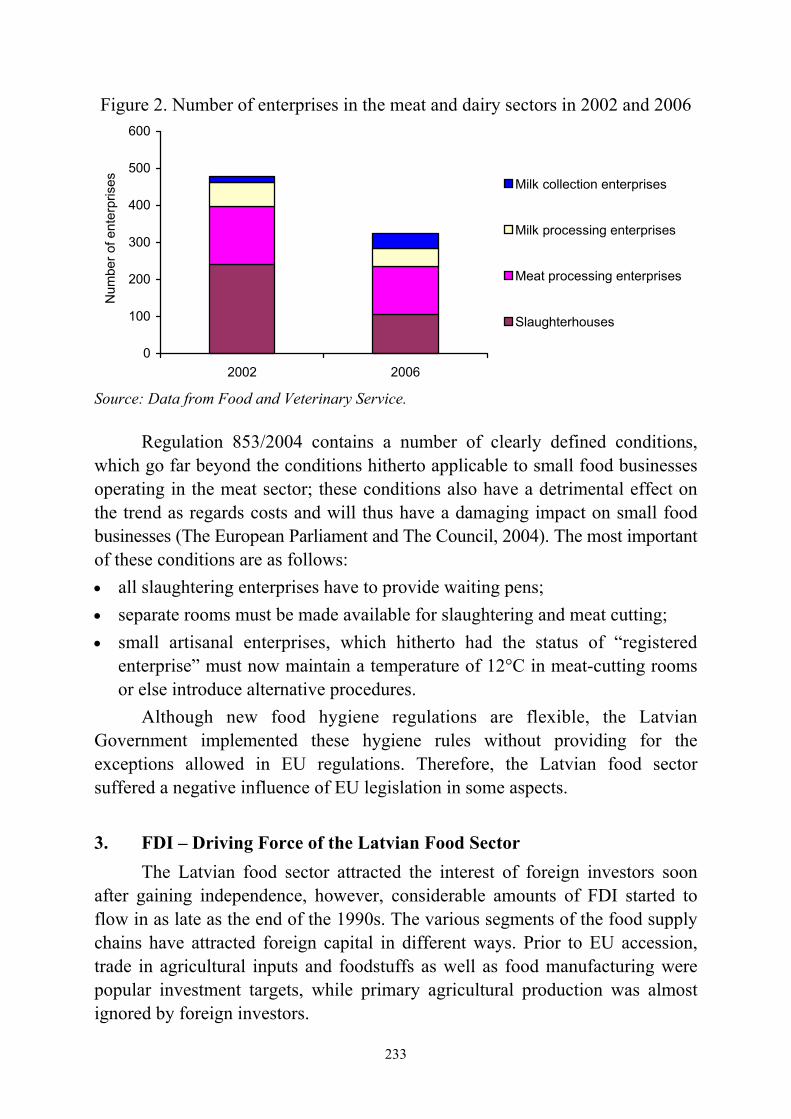
233
Figure 2. Number of enterprises in the meat and dairy sectors in 2002 and 2006
0
100
200
300
400
500
600
2002 2006
Num
ber o
f ent
erpr
ises Milk collection enterprises
Milk processing enterprises
Meat processing enterprises
Slaughterhouses
Source: Data from Food and Veterinary Service.
Regulation 853/2004 contains a number of clearly defined conditions, which go far beyond the conditions hitherto applicable to small food businesses operating in the meat sector; these conditions also have a detrimental effect on the trend as regards costs and will thus have a damaging impact on small food businesses (The European Parliament and The Council, 2004). The most important of these conditions are as follows: • all slaughtering enterprises have to provide waiting pens; • separate rooms must be made available for slaughtering and meat cutting; • small artisanal enterprises, which hitherto had the status of “registered
enterprise” must now maintain a temperature of 12°C in meat-cutting rooms or else introduce alternative procedures.
Although new food hygiene regulations are flexible, the Latvian Government implemented these hygiene rules without providing for the exceptions allowed in EU regulations. Therefore, the Latvian food sector suffered a negative influence of EU legislation in some aspects.
3. FDI – Driving Force of the Latvian Food Sector The Latvian food sector attracted the interest of foreign investors soon
after gaining independence, however, considerable amounts of FDI started to flow in as late as the end of the 1990s. The various segments of the food supply chains have attracted foreign capital in different ways. Prior to EU accession, trade in agricultural inputs and foodstuffs as well as food manufacturing were popular investment targets, while primary agricultural production was almost ignored by foreign investors.

234
Agricultural Inputs The market of agricultural input suppliers changed substantially since the
beginning of the 1990s, the earlier central machinery and chemical distribution networks Lauktehnika and Agroķīmija disaggregated and the gap was filled by newly established domestic companies, which often specialised in one product group. The market changed substantially with the arrival of foreign-owned agricultural input suppliers in the second half of the 1990s. Kesko Agro Latvia and Kemira GrowHow have achieved dominance in the market. Recently, two other foreign-owned companies entered the Latvian agricultural input markets, Linas Agro from Lithuania and a Danish-Swedish joint venture, BTC (Baltic Transshipment Service) associated with Scandinavian Farmers. The foreign companies have widely applied the concept of agricultural input supply of the Nordic countries. They provide farmers with a full range of inputs including fertilisers, pesticides, seed, feed and machinery, as well as services such as technical assistance, logistics, financial arrangements and grain and oilseed procurement. They have usually established a network of regional trade and service centres or regional offices in order to ensure an adequate geographical coverage and to be close to the customers.
The largest agricultural input suppliers are aware of the fact that their customers change rapidly. Farm structure has steadily concentrated among the dairy, meat and grain farms, with the elimination of small units and concurrent expansion of large farms. Year by year, less farms make purchase decisions concerning a higher volume of agricultural inputs. EU membership has apparently contributed to farm concentration by offering means of modernisation, which were utilised especially by dynamic middle-sized and large farms.
The first experiences suggest that Latvian dairy, meat and grain farmers have rapidly learnt to take advantage of the EU and national support mechanisms. Subsidies, albeit started off low, have ascended every year approaching the EU-15 level and raised the profitability of production. Many farms have expanded and modernised their production facilities such as milking and cooling equipment, grain drying and storage capacity with the partial help of subsidies. Agriculture was long the only segment in the food supply chain, which did not attract notable foreign investments. This was attributed to the moratoria on foreigner’s agricultural land purchase and a general reluctance to enter the sector in a deep structural crisis.
Agriculture became an increasingly popular target of foreign investments after the EU accession of Latvia. Foreign owned capital in agricultural production almost doubled in just two years, increasing from LVL 5.1 million in

235
2003 to LVL 9.8 million by the end of 2005. Over two-thirds of the acquisitions have been made by Danish farmers. Nevertheless, foreigners have concentrated mostly on the livestock sector, while relatively low interest has been shown towards the crop production sector.
Food processing
Most of the FDI, which was received by the food processing sector, already arrived to Latvia prior to the EU accession. In fact, foreign-owned capital in the food industry declined between 2003 and 2005 from LVL 65 million to LVL 55 million. Foreigners accounted for over 34% of total company capital in the Latvian food industry in 2004. The most popular industries have been milling, beer, tobacco and miscellaneous food production, where well over half of the capital was acquired by foreign investors by 2004. Additionally, the bakery, meat and starch industry, as well as potato processing, have attracted considerable foreign investments. Most of the food industry FDI originated from Sweden (23%) followed by Estonia (18%), the Netherlands (17%) and the United Kingdom (17%). Denmark, Finland and USA accounted for 5%-10% of all FDI to the food processing at the end of 2005.
4. Food Retail Sector
Food retail has been constantly growing in Latvia since the second half of the 1990s, the total turnover in the sector reached nearly EUR 1.7 billion by 2005. Since the year of EU accession, the retail market has been dominated and characterised by the fierce competition of the two largest players, Swedish-owned1 Rimi Latvia and the Lithuanian Maxima chain. The other retail chains have been much smaller in size. New retail chains, such as Palink (IKI), the second largest Lithuanian retail company, or Selver, the most dynamically spreading Estonian chain, are about to enter the Latvian market, which is still much less concentrated than the retail sector in other European countries. Individual shops and smaller chains have recently organised cooperative associations or umbrella organisations to manage joint purchases in response to the aggressive competition imposed by the two leading chains. The largest associations are Baltstor uniting Mego and over 30 other companies in a purchasing collective, Aibe, a network of 495 shops and Iepirkumu grupa established in 2003 by several small chains. So far, the retail market has been rather polarised with two large and several small players. Foreign chains will continue
1 Until 2006 Rimi Latvia was jointly owned by Swedish ICA and Finnish Kesko.
236
to gain market share at the expense of small individually run food stores. However, a few middle-sized chains are likely to emerge in the next few years out of the group of new foreign chains and the recently established domestic cooperative alliances of individual shops and smaller chains. This development will accelerate the concentration process.
5. Future Developments in the Food Chain
The largest agricultural input supply companies will continue to focus on the few thousand large farms and cooperatives, which account for the majority of agricultural production. Agricultural input suppliers have unquestionably taken their own share of the growing wealth of the agricultural sector, especially after EU accession. At the same time, they also provide farmers with a complex package of diverse inputs and services, the agronomic and economic conditions for successful farming. Due to EU membership and stabilising agricultural income, FDI will continue to flow into agricultural production. It is likely that foreign owners will also acquire some crop production units. As for food processing, it is likely that one or two of the largest dairy processors will attract foreign investments in the next five years and further FDI may also be probable in meat processing. Instead of just purchasing one processing facility, foreigners may also consider setting up compact vertically integrated production and processing units in Latvia, as examples in the Estonian and Lithuanian meat supply chains indicate. Vertically integrated concerns already exist among the domestically owned companies, e.g. in the meat, poultry and egg business. New vertically integrated units may be initiated virtually from any segment in the chain, but it usually requires a background of strong capital, therefore it is more likely to be organised by foreign investors. Concentration of the retail market implies higher negotiation power in relation to food manufacturing companies, which in turn will have to respond to this challenge by corporate growth, streamlining production, improving efficiency and possibly specialisation or outsourcing certain activities.
6. Latvian Foreign Trade in Agricultural Commodities and Food Products
6.1. Total Agricultural and Food Trade Latvian total trade in agricultural commodities and food products
continuously increases. After joining the EU, total trade has shown twofold increase and total trade turnover in value terms has passed one billion LVL in 2006.

237
EU countries are the main Latvian trading partners (Figure 3), representing almost 80% of total agricultural trade over the last three years. Among the EU countries, the share of other new member states in total trade increases, while the share of EU-15 states slightly declines. The share of CIS in total trade turnover is stable for years at the rate of 12%.
Figure 3. Export of agricultural products from Latvia by groups of countries
88
140
245
107.675
69.3616940
90
140
190
240
290
2002 2003 2004 2005
milli
on L
VL
EU-25 Third countries
Source: Data from Central Statistical Bureau.
The value of exported processed food products exceeds the value of
imported agricultural commodities for the last two years. Since 2004, two-way trade in similar products between Latvia and EU has became especially important, having 20%-25% share in total trade: cheese, cereals and rapeseed are exported to EU-15 countries while the same products are imported from Lithuania; raw milk is exported to Lithuania and imported from Estonia; coffee beans are imported from Denmark, ground coffee is exported to Lithuania. Large volumes of rapeseed oil are returning to Latvia after being refined in Estonia. Fish fillet made from imported chilled and frozen fish is exported back to the same EU-15 countries. Chocolate confectionery besides the two-way trade between Latvia and other EU countries is traded similarly between Latvia and CIS.
6.2. Foreign Trade Balance Traditionally, Latvia has been a net importer of agricultural commodities
and food products, but after EU accession Latvia’s trade balance shows some trends of negative balance (Figure 4, 5, 6).
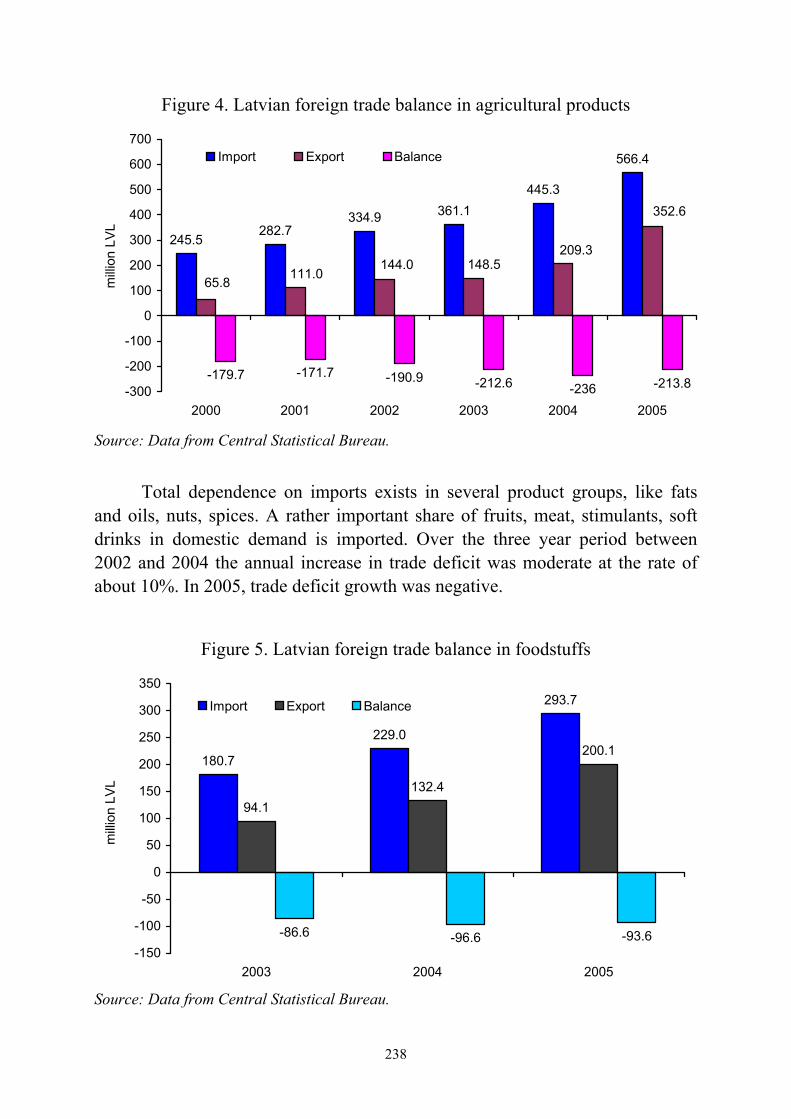
238
Figure 4. Latvian foreign trade balance in agricultural products
245.5282.7
334.9 361.1445.3
566.4
-179.7 -171.7 -190.9 -212.6 -236 -213.8
352.6
209.3148.5144.0
111.065.8
-300
-200
-100
0
100
200
300
400
500
600
700
2000 2001 2002 2003 2004 2005
milli
on L
VL
Import Export Balance
Source: Data from Central Statistical Bureau.
Total dependence on imports exists in several product groups, like fats and oils, nuts, spices. A rather important share of fruits, meat, stimulants, soft drinks in domestic demand is imported. Over the three year period between 2002 and 2004 the annual increase in trade deficit was moderate at the rate of about 10%. In 2005, trade deficit growth was negative.
Figure 5. Latvian foreign trade balance in foodstuffs
180.7
229.0
293.7
94.1132.4
200.1
-86.6 -96.6 -93.6-150
-100
-50
0
50
100
150
200
250
300
350
2003 2004 2005
milli
on L
VL
Import Export Balance
Source: Data from Central Statistical Bureau.
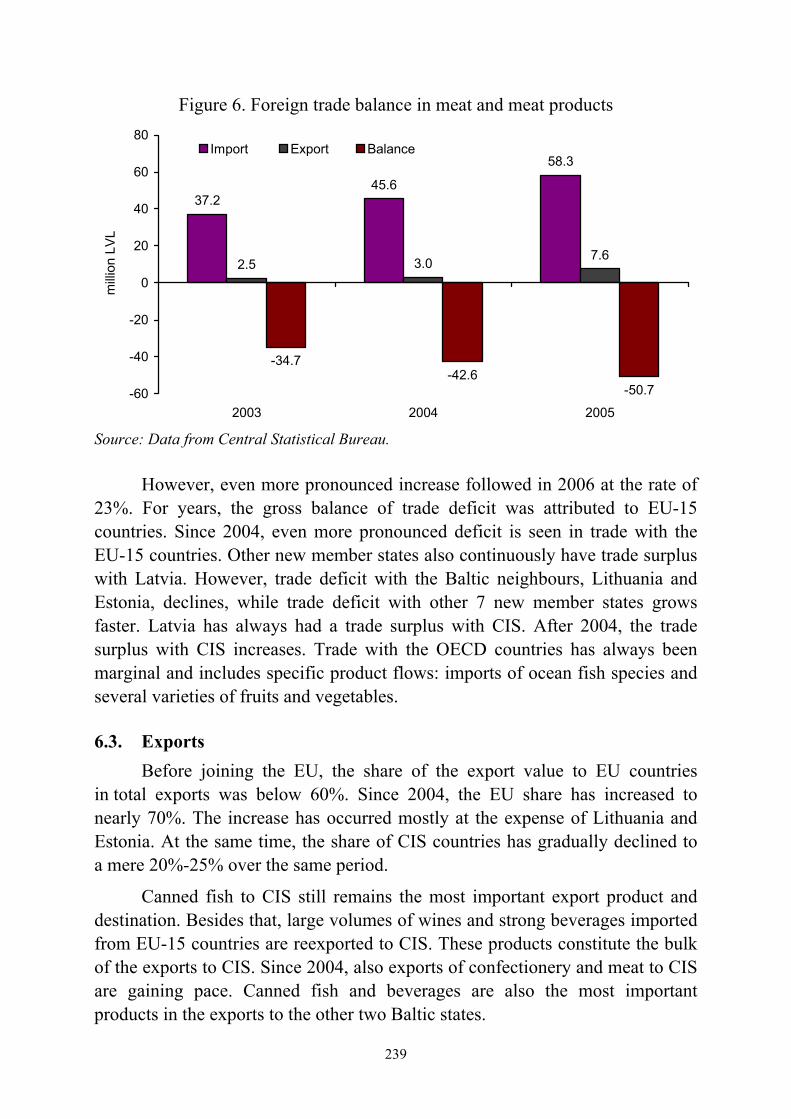
239
Figure 6. Foreign trade balance in meat and meat products
37.245.6
58.3
2.5 3.0 7.6
-34.7-42.6
-50.7-60
-40
-20
0
20
40
60
80
2003 2004 2005
milli
on L
VL
Import Export Balance
Source: Data from Central Statistical Bureau.
However, even more pronounced increase followed in 2006 at the rate of 23%. For years, the gross balance of trade deficit was attributed to EU-15 countries. Since 2004, even more pronounced deficit is seen in trade with the EU-15 countries. Other new member states also continuously have trade surplus with Latvia. However, trade deficit with the Baltic neighbours, Lithuania and Estonia, declines, while trade deficit with other 7 new member states grows faster. Latvia has always had a trade surplus with CIS. After 2004, the trade surplus with CIS increases. Trade with the OECD countries has always been marginal and includes specific product flows: imports of ocean fish species and several varieties of fruits and vegetables.
6.3. Exports
Before joining the EU, the share of the export value to EU countries in total exports was below 60%. Since 2004, the EU share has increased to nearly 70%. The increase has occurred mostly at the expense of Lithuania and Estonia. At the same time, the share of CIS countries has gradually declined to a mere 20%-25% over the same period.
Canned fish to CIS still remains the most important export product and destination. Besides that, large volumes of wines and strong beverages imported from EU-15 countries are reexported to CIS. These products constitute the bulk of the exports to CIS. Since 2004, also exports of confectionery and meat to CIS are gaining pace. Canned fish and beverages are also the most important products in the exports to the other two Baltic states.
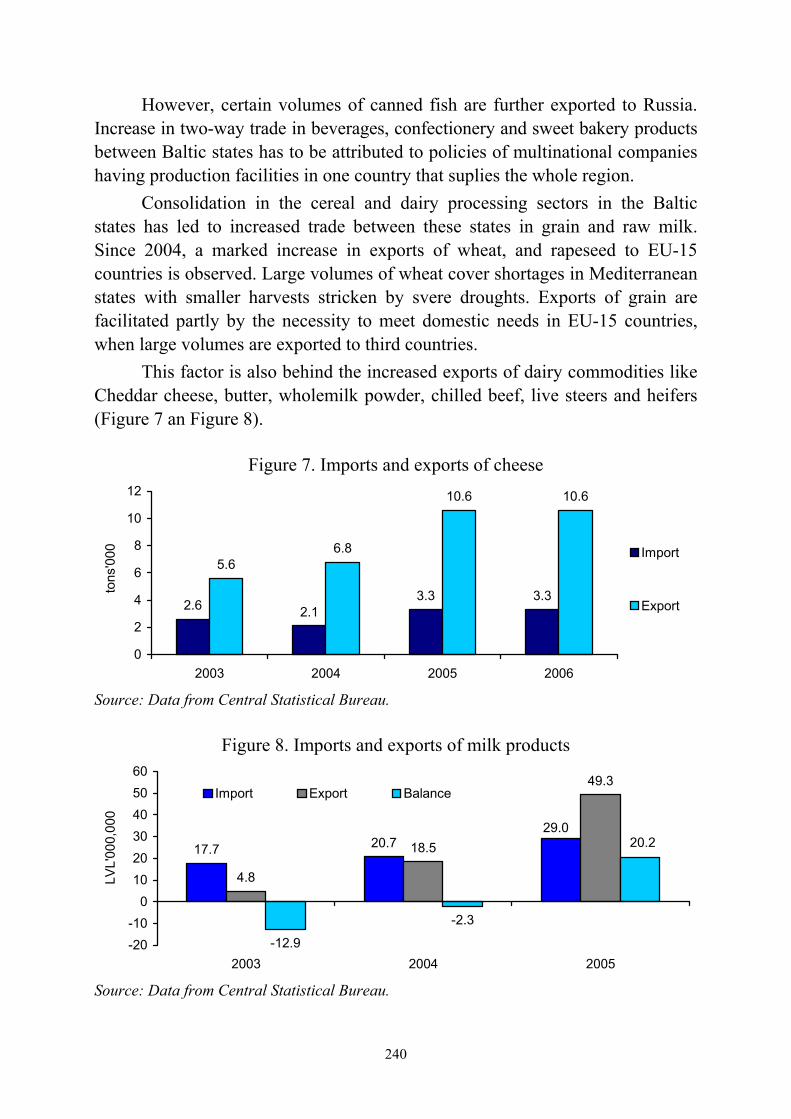
240
However, certain volumes of canned fish are further exported to Russia. Increase in two-way trade in beverages, confectionery and sweet bakery products between Baltic states has to be attributed to policies of multinational companies having production facilities in one country that suplies the whole region.
Consolidation in the cereal and dairy processing sectors in the Baltic states has led to increased trade between these states in grain and raw milk. Since 2004, a marked increase in exports of wheat, and rapeseed to EU-15 countries is observed. Large volumes of wheat cover shortages in Mediterranean states with smaller harvests stricken by svere droughts. Exports of grain are facilitated partly by the necessity to meet domestic needs in EU-15 countries, when large volumes are exported to third countries.
This factor is also behind the increased exports of dairy commodities like Cheddar cheese, butter, wholemilk powder, chilled beef, live steers and heifers (Figure 7 an Figure 8).
Figure 7. Imports and exports of cheese
2.6 2.13.3 3.3
5.66.8
10.6 10.6
0
2
4
6
8
10
12
2003 2004 2005 2006
tons
'000 Import
Export
Source: Data from Central Statistical Bureau.
Figure 8. Imports and exports of milk products
17.7 20.7
49.3
29.018.5
4.8
-12.9
-2.3
20.2
-20-10
0102030405060
2003 2004 2005
LVL'
000,
000
Import Export Balance
Source: Data from Central Statistical Bureau.
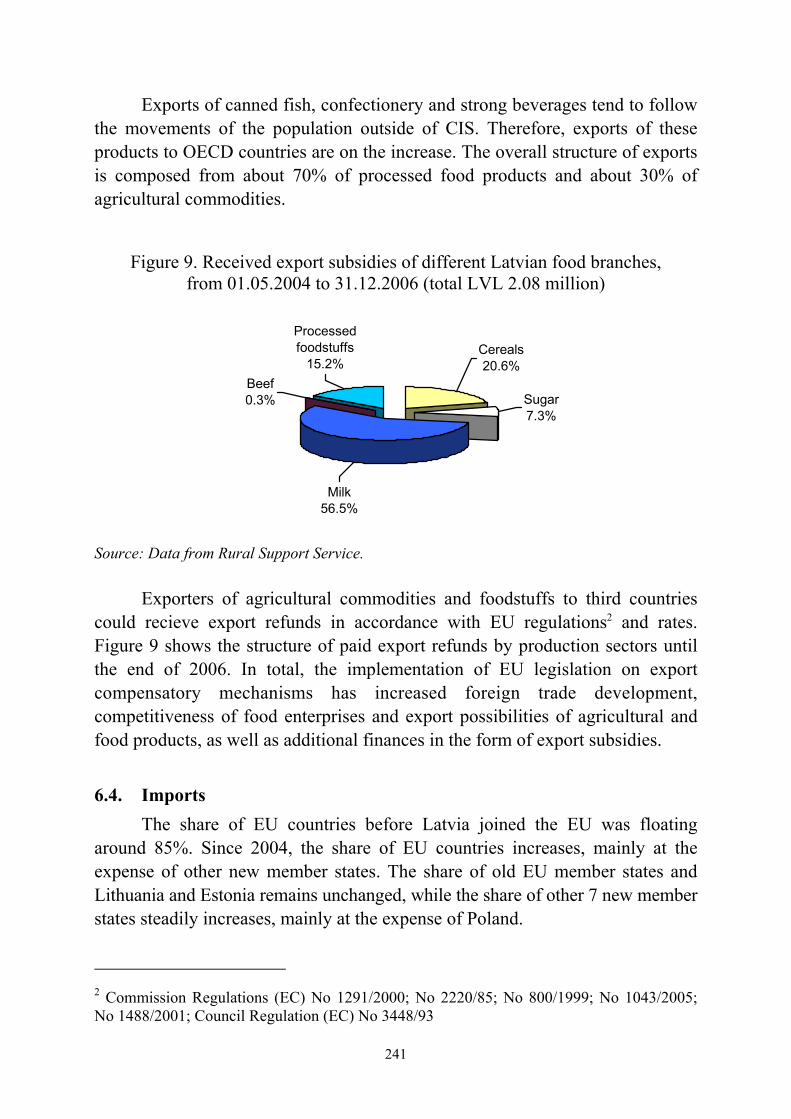
241
Exports of canned fish, confectionery and strong beverages tend to follow the movements of the population outside of CIS. Therefore, exports of these products to OECD countries are on the increase. The overall structure of exports is composed from about 70% of processed food products and about 30% of agricultural commodities.
Figure 9. Received export subsidies of different Latvian food branches, from 01.05.2004 to 31.12.2006 (total LVL 2.08 million)
Processed foodstuffs
15.2%Beef0.3%
Cereals20.6%
Sugar7.3%
Milk56.5%
Source: Data from Rural Support Service.
Exporters of agricultural commodities and foodstuffs to third countries could recieve export refunds in accordance with EU regulations2 and rates. Figure 9 shows the structure of paid export refunds by production sectors until the end of 2006. In total, the implementation of EU legislation on export compensatory mechanisms has increased foreign trade development, competitiveness of food enterprises and export possibilities of agricultural and food products, as well as additional finances in the form of export subsidies.
6.4. Imports
The share of EU countries before Latvia joined the EU was floating around 85%. Since 2004, the share of EU countries increases, mainly at the expense of other new member states. The share of old EU member states and Lithuania and Estonia remains unchanged, while the share of other 7 new member states steadily increases, mainly at the expense of Poland.
2 Commission Regulations (EC) No 1291/2000; No 2220/85; No 800/1999; No 1043/2005; No 1488/2001; Council Regulation (EC) No 3448/93
242
In 2006, the value of imports from Poland doubled in relation to 2004. As many multinational processors have facilities in Poland, trade flows to other new member states are on the increase, especially fermented dairy products, sugar confectionery and sweet bakery products.
On the other hand, problems with the temporary closure of Russian imported meat market raise the pressure from Polish chilled and frozen pigmeat on other EU country markets. As domestic supply of vegetables for processing is unsatisfactory either in terms of quality or volumes, growing volumes of canned vegetables are produced in Poland upon the processors orders and imported to Latvia. The share of Poland in total Latvian agricultural imports has increased to 11%. Since 2004, beverages from EU-15 countries are the main products with almost twofold increase in the value of imports. This can partly be attributed to reexported volumes to CIS, partly to domestic consumer choice, preferring wines from France, Spain and Italy.
Only domestic apples after harvesting, and seasonal berries, are available on the Latvian fruit market. Citrus fruits, stonefruits, grapes, melons, watermelons, plums, cherries and tropical fruits almost entirely are imported. Also the domestic supply of vegetables is rather narrow and insufficient.
As customers are becoming more sophisticated, growing volumes of globally known brands of canned fruits and vegetables are imported. If imports of fresh and canned fruits and vegetables in volume terms grow moderately, drastic price increases are the main factor behind the increase in import value.
Structural changes in domestic fish processing and lower availability of raw fish have caused increased two-way trade in fish between Latvia and other EU countries.
Consistent shortages and sometimes high producer prices of meat increasingly force processors to seek cheaper raw material in EU-15 countries. The overall structure of imports is composed of about 65% of processed food products and about 35% of agricultural commodities.
A good stimulus for the promotion of competitiveness of the branches of agriculture and development of rural areas came from the EU and state support payments, particularly the common area payment, national supplementary direct payments, less favourable area payments and support payments for the implementation of sub-activities of “Agri-Environment”.
243
References 1. Central Statistical Bureau of Latvia (2005). Agricultural farms of Latvia 2004. 2. Ministry of Agriculture Republic of Latvia (2006). Agriculture and Rural Area of Latvia. 3. Central Statistical Bureau of Latvia (2004), Structure of Agricultural Farms of Latvia in
June 2003. Riga. 4. Central Statistical Bureau of Latvia (2006). Statistical Yearbook of Latvia 2005. Riga. 5. Vēveris, A., Krieviņa, A. (2005), Economic Accounts for Agriculture of Latvia
2004-2005. Latvian State Institute of Agrarian Economics, Riga, 2005 [in Latvian].

244
Dr. Tina Volk, Dr. Miroslav Rednak Agricultural Institute of Slovenia Ljubljana, Slovenia
Dr. Emil Erjavec
University of Ljubljana, Biotechnical Faculty Domžale, Slovenia
The Agri-Food Sector in Slovenia after European Union Accession
1. Introduction
As concluded by various authors [OECD, 2001, Volk, 2004, Rednak et al, 2003a], agriculture in Slovenia was less adversely affected by transition than in many other accession countries. At the beginning of the transition process, Slovenia adopted a protectionist concept of agricultural policy with relatively high level of border protection. Agricultural output did not drop considerably and producer prices remained relatively high. Changes in agricultural policy progressed gradually and were modelled on the Common Agricultural Policy (CAP) from the very beginning.
Since the mid-1990s and especially in the period of preparation for accession, foreign trade protection was gradually reduced through various free trade agreements and direct producer support in the form of area and headage payments was introduced and increased. Slovenia thus introduced all CAP-like measures even before the actual accession and in the last year before accession (2003) direct payments reached 75% of the level of these payments in EU-15 [Erjavec et al, 2003b]. During the negotiation process, Slovenia succeeded to obtain a relatively high level of quotas and premium rights, gained the possibility to further increase direct payments from the national budget, up to the level of 100% compared to EU-15 by 2007, and obtained relatively high EU funds for rural development.
The starting position for agriculture before the accession was thus quite favourable. Therefore, the accession impact assessment with market and income prospects was quite optimistic [the summary of different studies is presented by Erjavec et al, 2003a, Kavčič et al, 2003, Muench et al, 2002]. The agricultural factor income after accession was expected to remain at least at the pre-accession level, if not improved. The agricultural producer price level before the accession was at a comparable level or in some cases even higher than in the

245
EU, so the continuation of the negative price trend was expected also after the accession. However, increased budgetary supports would compensate for the losses incurred due to the expected drop in prices at the aggregate level. As a consequence of the differences in product specific supports in Slovenia and the EU, considerable changes might be expected in the economic position of individual products. The products receiving higher budgetary support after accession (beef, maize) were expected to be better off than the products, which in the European Union are largely exposed to market forces (swine, poultry and eggs production).
The outlook for the food processing industry was rather more pessimistic [Erjavec et al, 2003a]. Despite the general trends of opening the markets already before the accession, processed products remained relatively highly protected. Exports of some products, such as dairy, were supported by high export subsidies. Therefore, it was expected that the economic results of the food industry at the aggregate level should worsen after the accession. This should be especially the case for dairy and wine, and to some extent also the milling industry, processed fruit and vegetables. Difficulties were expected to emerge immediately after the accession, with the opening of borders and higher competition in the retail sector.
The aim of this article is to present the main changes in Slovenian agriculture and food processing industry in the pre-accession period and in the initial years of EU membership. The changes are presented in the form of preliminary impact assessment of the accession effects. The analysis is limited due to the short time period after the accession.
Despite the limited time series and missing data, the analysis has been done on the basis of available primary statistical data, data from the Ministry of Agriculture, Forestry and Food for budgetary expenditures [MoAFF-KIS, 2006, KIS, 2007] and AJPES [AJPES, 2007] about the accountancy data for food industry sectors. The time frame of the analysis has been from 1992 onwards, with more emphasis on the last years before and the first years after accession, i.e. for the period 2000-2005/06.
The paper starts by describing the macroeconomic context and the role of the agri-food sector in the economy. The description of agricultural policy begins by an outline of the characteristics of policy before and after the accession. The evolution of budgetary expenditures by type of instruments underpins the discussion. Trends in production, prices, income and farm structure are presented in the next chapter. This is followed by the discussion of the situation and changes in the food industry with the description of trade and consumption patterns. The paper is rounded off by conclusions on the accession effects.
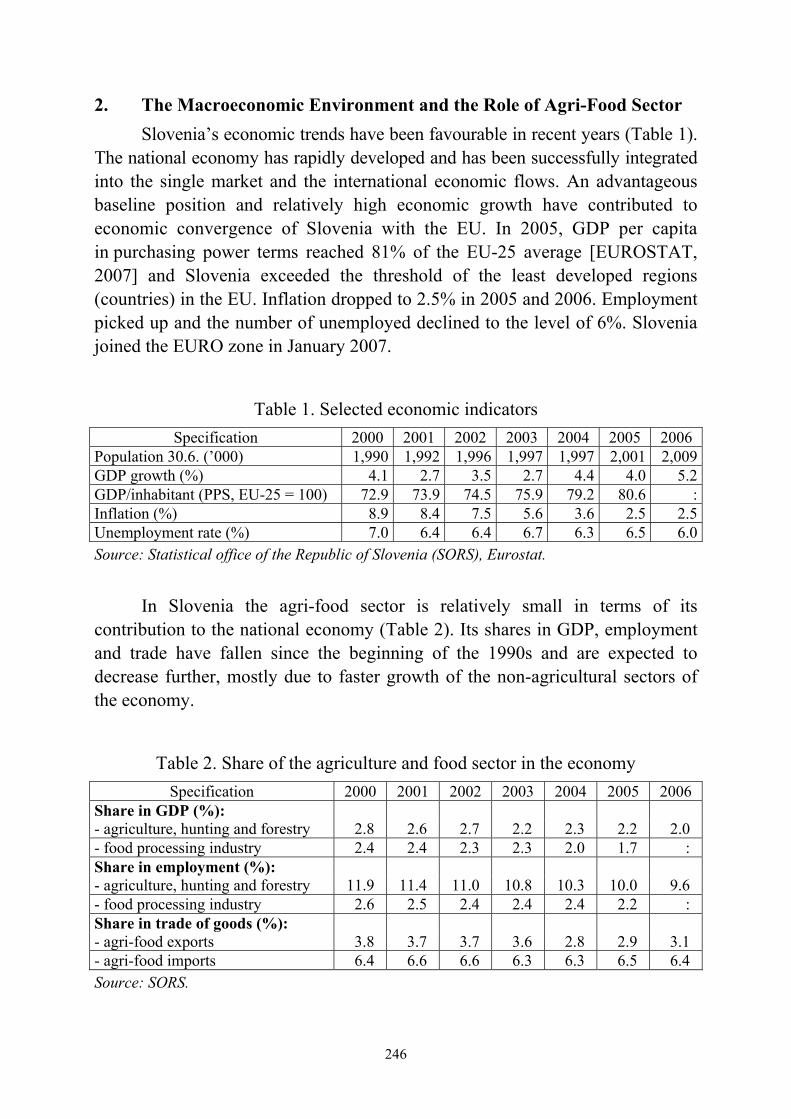
246
2. The Macroeconomic Environment and the Role of Agri-Food Sector Slovenia’s economic trends have been favourable in recent years (Table 1).
The national economy has rapidly developed and has been successfully integrated into the single market and the international economic flows. An advantageous baseline position and relatively high economic growth have contributed to economic convergence of Slovenia with the EU. In 2005, GDP per capita in purchasing power terms reached 81% of the EU-25 average [EUROSTAT, 2007] and Slovenia exceeded the threshold of the least developed regions (countries) in the EU. Inflation dropped to 2.5% in 2005 and 2006. Employment picked up and the number of unemployed declined to the level of 6%. Slovenia joined the EURO zone in January 2007.
Table 1. Selected economic indicators Specification 2000 2001 2002 2003 2004 2005 2006
Population 30.6. (’000) 1,990 1,992 1,996 1,997 1,997 2,001 2,009GDP growth (%) 4.1 2.7 3.5 2.7 4.4 4.0 5.2GDP/inhabitant (PPS, EU-25 = 100) 72.9 73.9 74.5 75.9 79.2 80.6 :Inflation (%) 8.9 8.4 7.5 5.6 3.6 2.5 2.5Unemployment rate (%) 7.0 6.4 6.4 6.7 6.3 6.5 6.0Source: Statistical office of the Republic of Slovenia (SORS), Eurostat.
In Slovenia the agri-food sector is relatively small in terms of its contribution to the national economy (Table 2). Its shares in GDP, employment and trade have fallen since the beginning of the 1990s and are expected to decrease further, mostly due to faster growth of the non-agricultural sectors of the economy.
Table 2. Share of the agriculture and food sector in the economy Specification 2000 2001 2002 2003 2004 2005 2006
Share in GDP (%): - agriculture, hunting and forestry 2.8 2.6 2.7 2.2 2.3 2.2 2.0 - food processing industry 2.4 2.4 2.3 2.3 2.0 1.7 : Share in employment (%): - agriculture, hunting and forestry 11.9 11.4 11.0 10.8 10.3 10.0 9.6 - food processing industry 2.6 2.5 2.4 2.4 2.4 2.2 : Share in trade of goods (%): - agri-food exports 3.8 3.7 3.7 3.6 2.8 2.9 3.1 - agri-food imports 6.4 6.6 6.6 6.3 6.3 6.5 6.4 Source: SORS.
247
3. Agricultural Policy and Budgetary Support 3.1. Policy Concept and Main Mechanism
After the break with the former political and economic system and the gaining of independence, Slovenian parliament adopted new guidelines for agricultural policy with the Strategy of Agricultural Development of Slovenia [Erjavec, 2003b], which set forth the following basic agricultural policy goals: (1) stable production of cheap and quality food and food security in Slovenia; (2) preservation of population density, cultural landscapes and agricultural land (preservation of production potential in case of interrupted supply), protection of agricultural land and water from pollution and misuse; (3) permanent increase of competitiveness; (4) guaranteed parity income for above-average producers. Behind this decision, there was a clear strategy to adopt European Union-like agricultural policy with similar objectives, instruments and understanding of the role of agriculture in society. A protectionist concept of agricultural policy was adopted, which assured a relatively high level of support to agriculture throughout the entire transition period. However, under this concept, the agricultural policy instruments and measures were gradually changed.
In the first period after the adoption of the Strategy, the most important agricultural policy measure was border protection based on import levies [Erjavec et al, 2003b]. Slovenia's membership of the World Trade Organisation (1994) and the ensuing trade commitments, as well as numerous bilateral free trade agreements concluded in the years that followed, altogether led to the opening of the agricultural products market and limited border protection. This, in turn, also called for change in agricultural policy. Another important reason behind the required changes of agricultural policy was the beginning of the process of Slovenia's accession to the European Union, which dictated the gradual transposition of the acquis and also formal adaptation of Slovenia's agricultural policy to the Common Agricultural Policy. The processes, which later led to adoption of the main guidelines of agricultural policy reform (liberalisation of prices, increase of the agricultural budget), have been under way since the mid-nineties. These new agricultural policy guidelines were formalised in the Programme of Agricultural Policy Reform (1999-2002) [MAFF, 1998 cit. Erjavec et al, 2003b] and the National Development Programme for Agriculture, Food, Forestry and Fisheries for the period 2000-2002 [MAFF, 1999, cit. Erjavec et al, 2003b].
The reform switched the burden of agricultural support from a consumer to taxpayer, which means also a changeover from market-price support policy to the policy of budgetary support (especially direct payments, export subsidies
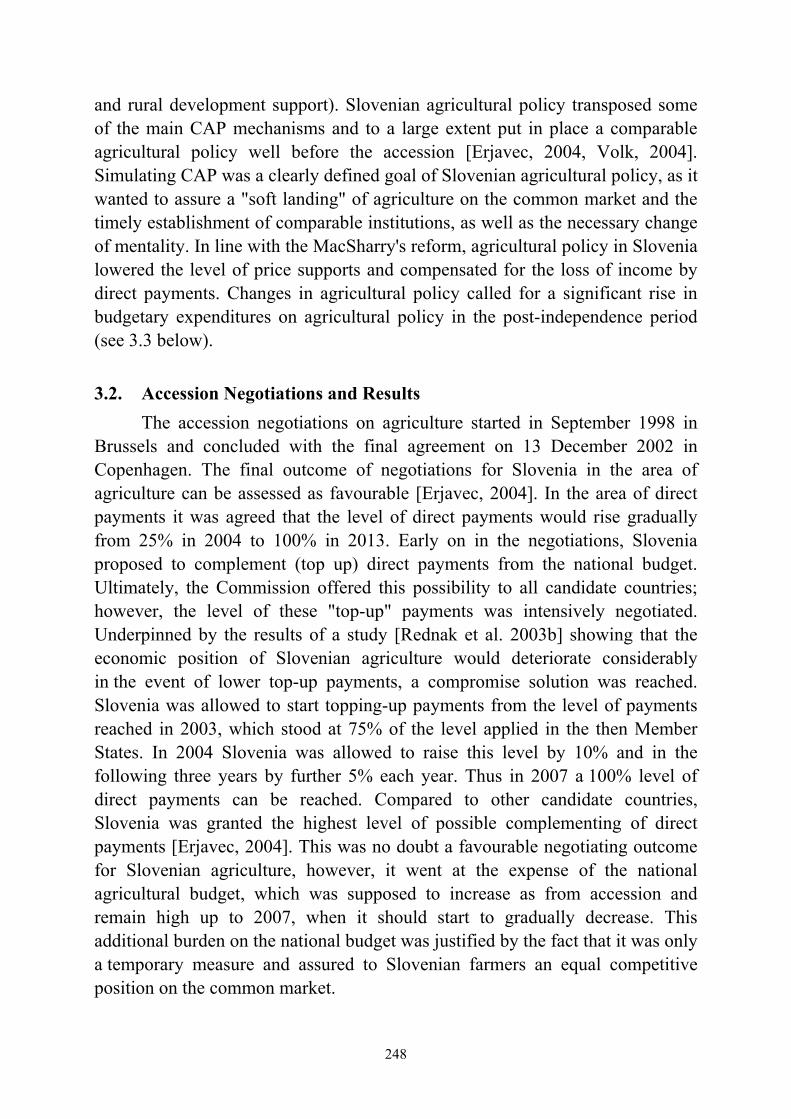
248
and rural development support). Slovenian agricultural policy transposed some of the main CAP mechanisms and to a large extent put in place a comparable agricultural policy well before the accession [Erjavec, 2004, Volk, 2004]. Simulating CAP was a clearly defined goal of Slovenian agricultural policy, as it wanted to assure a "soft landing" of agriculture on the common market and the timely establishment of comparable institutions, as well as the necessary change of mentality. In line with the MacSharry's reform, agricultural policy in Slovenia lowered the level of price supports and compensated for the loss of income by direct payments. Changes in agricultural policy called for a significant rise in budgetary expenditures on agricultural policy in the post-independence period (see 3.3 below).
3.2. Accession Negotiations and Results
The accession negotiations on agriculture started in September 1998 in Brussels and concluded with the final agreement on 13 December 2002 in Copenhagen. The final outcome of negotiations for Slovenia in the area of agriculture can be assessed as favourable [Erjavec, 2004]. In the area of direct payments it was agreed that the level of direct payments would rise gradually from 25% in 2004 to 100% in 2013. Early on in the negotiations, Slovenia proposed to complement (top up) direct payments from the national budget. Ultimately, the Commission offered this possibility to all candidate countries; however, the level of these "top-up" payments was intensively negotiated. Underpinned by the results of a study [Rednak et al. 2003b] showing that the economic position of Slovenian agriculture would deteriorate considerably in the event of lower top-up payments, a compromise solution was reached. Slovenia was allowed to start topping-up payments from the level of payments reached in 2003, which stood at 75% of the level applied in the then Member States. In 2004 Slovenia was allowed to raise this level by 10% and in the following three years by further 5% each year. Thus in 2007 a 100% level of direct payments can be reached. Compared to other candidate countries, Slovenia was granted the highest level of possible complementing of direct payments [Erjavec, 2004]. This was no doubt a favourable negotiating outcome for Slovenian agriculture, however, it went at the expense of the national agricultural budget, which was supposed to increase as from accession and remain high up to 2007, when it should start to gradually decrease. This additional burden on the national budget was justified by the fact that it was only a temporary measure and assured to Slovenian farmers an equal competitive position on the common market.
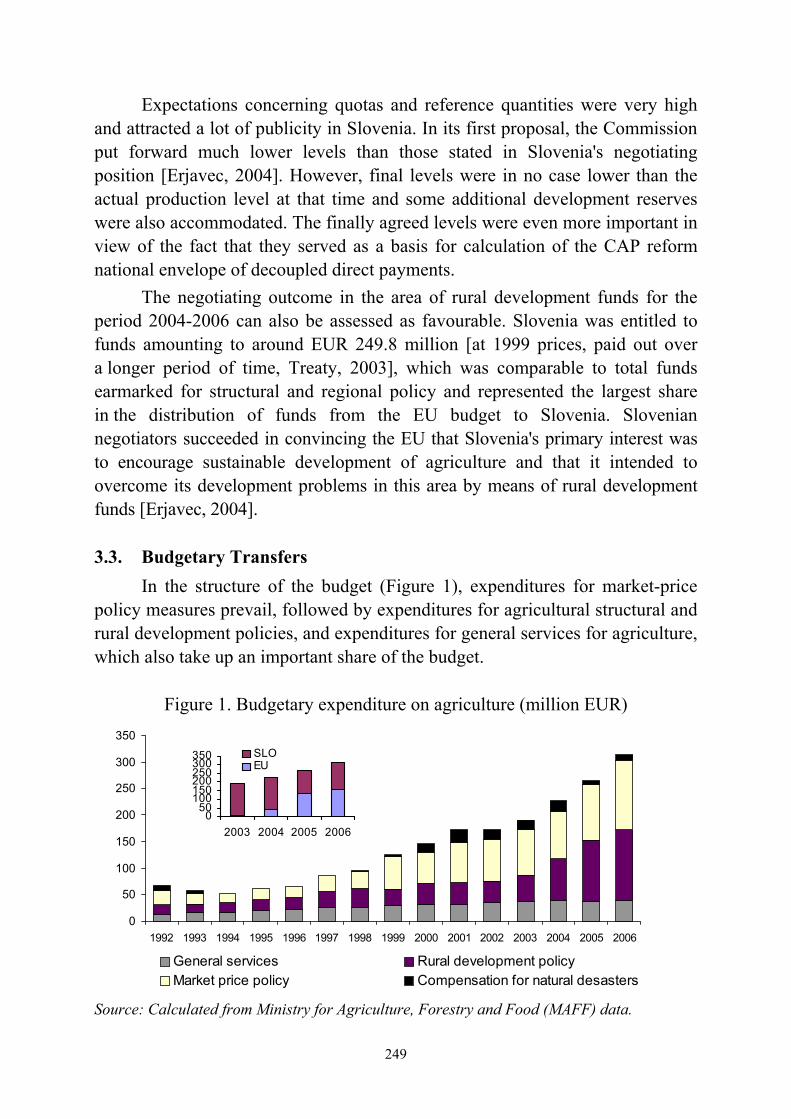
249
Expectations concerning quotas and reference quantities were very high and attracted a lot of publicity in Slovenia. In its first proposal, the Commission put forward much lower levels than those stated in Slovenia's negotiating position [Erjavec, 2004]. However, final levels were in no case lower than the actual production level at that time and some additional development reserves were also accommodated. The finally agreed levels were even more important in view of the fact that they served as a basis for calculation of the CAP reform national envelope of decoupled direct payments.
The negotiating outcome in the area of rural development funds for the period 2004-2006 can also be assessed as favourable. Slovenia was entitled to funds amounting to around EUR 249.8 million [at 1999 prices, paid out over a longer period of time, Treaty, 2003], which was comparable to total funds earmarked for structural and regional policy and represented the largest share in the distribution of funds from the EU budget to Slovenia. Slovenian negotiators succeeded in convincing the EU that Slovenia's primary interest was to encourage sustainable development of agriculture and that it intended to overcome its development problems in this area by means of rural development funds [Erjavec, 2004]. 3.3. Budgetary Transfers
In the structure of the budget (Figure 1), expenditures for market-price policy measures prevail, followed by expenditures for agricultural structural and rural development policies, and expenditures for general services for agriculture, which also take up an important share of the budget.
Figure 1. Budgetary expenditure on agriculture (million EUR)
Source: Calculated from Ministry for Agriculture, Forestry and Food (MAFF) data.
0
50
100
150
200
250
300
350
1992 1993 1994 1995 1996 1997 1998 1999 2000 2001 2002 2003 2004 2005 2006
General services Rural development policyMarket price policy Compensation for natural desasters
050
100150200250300350
2003 2004 2005 2006
SLOEU
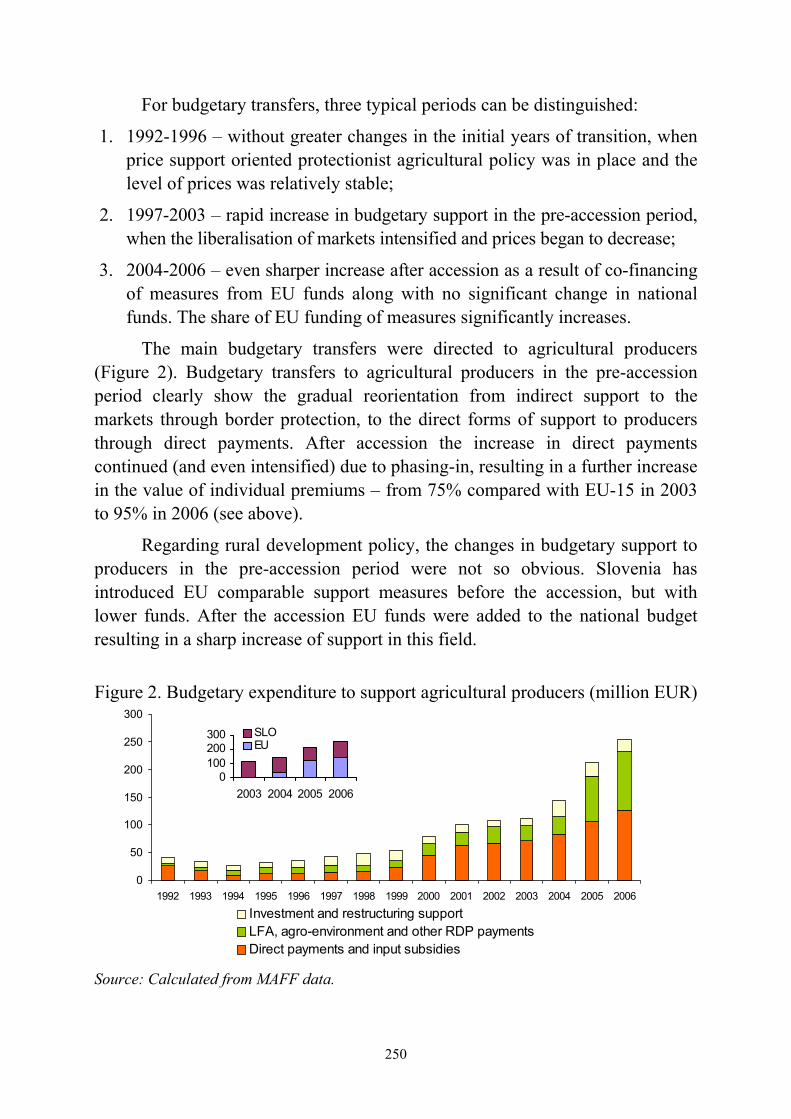
250
For budgetary transfers, three typical periods can be distinguished:
1. 1992-1996 – without greater changes in the initial years of transition, when price support oriented protectionist agricultural policy was in place and the level of prices was relatively stable;
2. 1997-2003 – rapid increase in budgetary support in the pre-accession period, when the liberalisation of markets intensified and prices began to decrease;
3. 2004-2006 – even sharper increase after accession as a result of co-financing of measures from EU funds along with no significant change in national funds. The share of EU funding of measures significantly increases.
The main budgetary transfers were directed to agricultural producers (Figure 2). Budgetary transfers to agricultural producers in the pre-accession period clearly show the gradual reorientation from indirect support to the markets through border protection, to the direct forms of support to producers through direct payments. After accession the increase in direct payments continued (and even intensified) due to phasing-in, resulting in a further increase in the value of individual premiums – from 75% compared with EU-15 in 2003 to 95% in 2006 (see above).
Regarding rural development policy, the changes in budgetary support to producers in the pre-accession period were not so obvious. Slovenia has introduced EU comparable support measures before the accession, but with lower funds. After the accession EU funds were added to the national budget resulting in a sharp increase of support in this field.
Figure 2. Budgetary expenditure to support agricultural producers (million EUR)
Source: Calculated from MAFF data.
0
50
100
150
200
250
300
1992 1993 1994 1995 1996 1997 1998 1999 2000 2001 2002 2003 2004 2005 2006
Investment and restructuring supportLFA, agro-environment and other RDP paymentsDirect payments and input subsidies
0100200300
2003 2004 2005 2006
SLOEU
251
The food processing industry has received significantly less budgetary support than agriculture (Figure 3). In the period 1992-2004 the share of food industry relevant measures in total budgetary transfers to the agri-food sector was on average 30%. The main support came in the form of export subsidies, where dairy industry was the main beneficiary. A relatively low share of available funds was given for investment support for restructuring of the food industry.
Direct support to food industry decreased drastically after the accession. The main reason was the loss of export subsidies, which, according to the acquis, are not permitted for the trade with Western Balkan countries, the main market for the Slovenian food industry. This change in policy has been worsening the economic situation especially in the dairy sector.
Figure 3. Budgetary expenditure to support food industry (million EUR)
Finally, the accession increased budgetary transfers to the agri-food sector only to a lesser extent and indirectly contributed to solving structural disparities in Slovenian agriculture and food industry. Policy transfers are tied mainly to income supports for agriculture in the form of CAP ‘Pillar One’ and ‘Pillar Two’ direct payments. The structural measures of development nature, such as investment supports, are only limited and do not significantly affect the competitiveness and economic position of the Slovenian agri-food sector.
0
10
20
30
40
50
60
1992 1993 1994 1995 1996 1997 1998 1999 2000 2001 2002 2003 2004 2005 2006Investment supportInterventions and other market stabilisation measuresExport subsidies
0204060
2003 2004 2005 2006
SLOEU
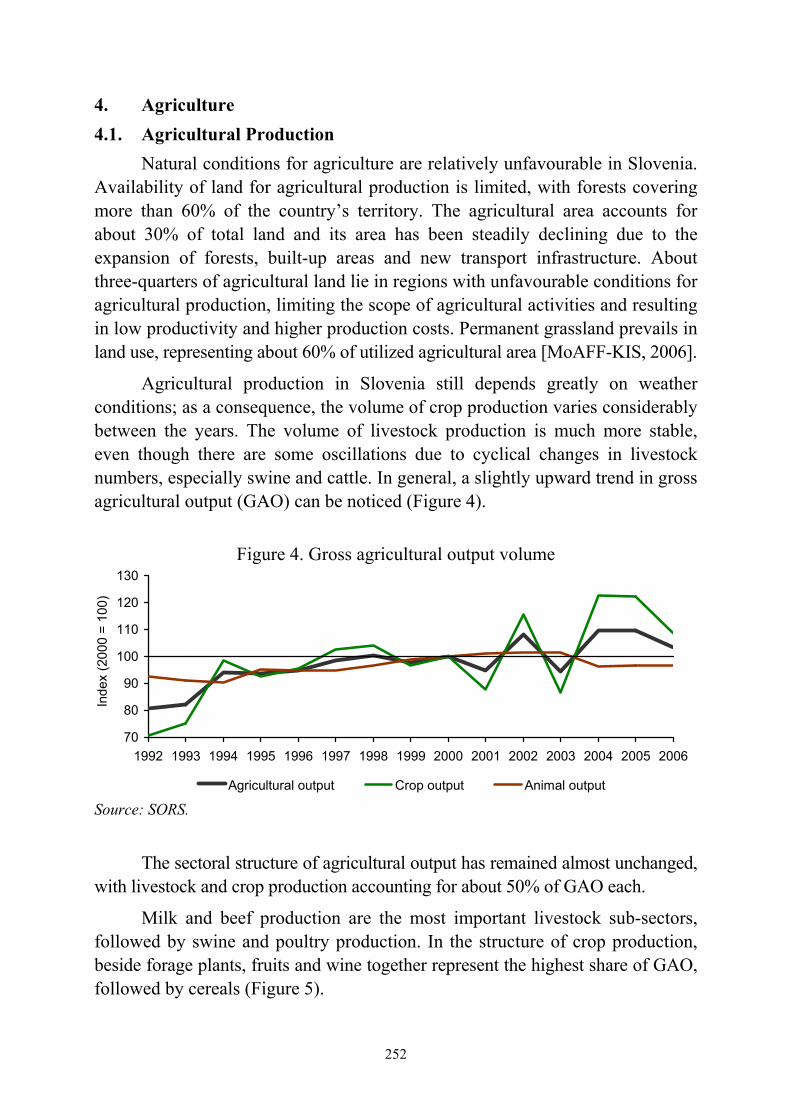
252
4. Agriculture 4.1. Agricultural Production
Natural conditions for agriculture are relatively unfavourable in Slovenia. Availability of land for agricultural production is limited, with forests covering more than 60% of the country’s territory. The agricultural area accounts for about 30% of total land and its area has been steadily declining due to the expansion of forests, built-up areas and new transport infrastructure. About three-quarters of agricultural land lie in regions with unfavourable conditions for agricultural production, limiting the scope of agricultural activities and resulting in low productivity and higher production costs. Permanent grassland prevails in land use, representing about 60% of utilized agricultural area [MoAFF-KIS, 2006].
Agricultural production in Slovenia still depends greatly on weather conditions; as a consequence, the volume of crop production varies considerably between the years. The volume of livestock production is much more stable, even though there are some oscillations due to cyclical changes in livestock numbers, especially swine and cattle. In general, a slightly upward trend in gross agricultural output (GAO) can be noticed (Figure 4).
Figure 4. Gross agricultural output volume
Source: SORS.
The sectoral structure of agricultural output has remained almost unchanged,
with livestock and crop production accounting for about 50% of GAO each.
Milk and beef production are the most important livestock sub-sectors, followed by swine and poultry production. In the structure of crop production, beside forage plants, fruits and wine together represent the highest share of GAO, followed by cereals (Figure 5).
70
80
90
100
110
120
130
1992 1993 1994 1995 1996 1997 1998 1999 2000 2001 2002 2003 2004 2005 2006
Inde
x (2
000
= 10
0)
Agricultural output Crop output Animal output
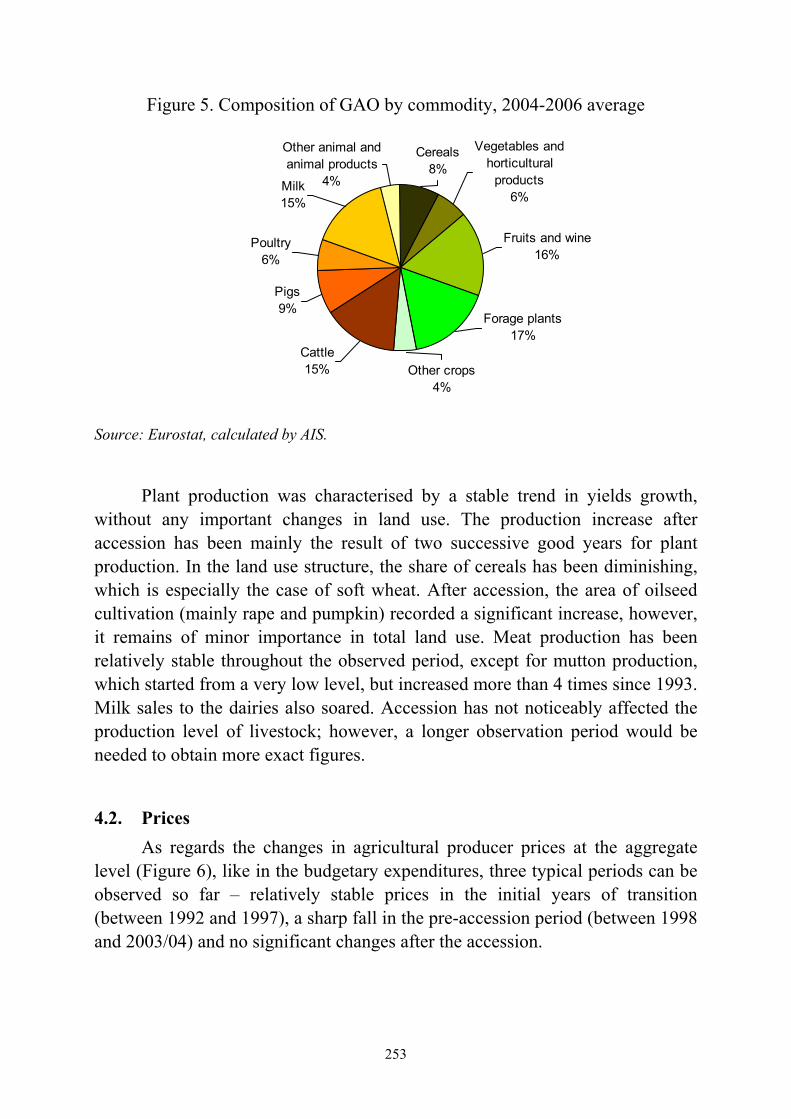
253
Figure 5. Composition of GAO by commodity, 2004-2006 average
Source: Eurostat, calculated by AIS.
Plant production was characterised by a stable trend in yields growth, without any important changes in land use. The production increase after accession has been mainly the result of two successive good years for plant production. In the land use structure, the share of cereals has been diminishing, which is especially the case of soft wheat. After accession, the area of oilseed cultivation (mainly rape and pumpkin) recorded a significant increase, however, it remains of minor importance in total land use. Meat production has been relatively stable throughout the observed period, except for mutton production, which started from a very low level, but increased more than 4 times since 1993. Milk sales to the dairies also soared. Accession has not noticeably affected the production level of livestock; however, a longer observation period would be needed to obtain more exact figures.
4.2. Prices As regards the changes in agricultural producer prices at the aggregate
level (Figure 6), like in the budgetary expenditures, three typical periods can be observed so far – relatively stable prices in the initial years of transition (between 1992 and 1997), a sharp fall in the pre-accession period (between 1998 and 2003/04) and no significant changes after the accession.
Cattle 15%
Pigs9%
Poultry6%
Milk15%
Other animal and animal products
4%
Cereals8%
Vegetables and horticultural
products6%
Fruits and wine16%
Forage plants17%
Other crops4%
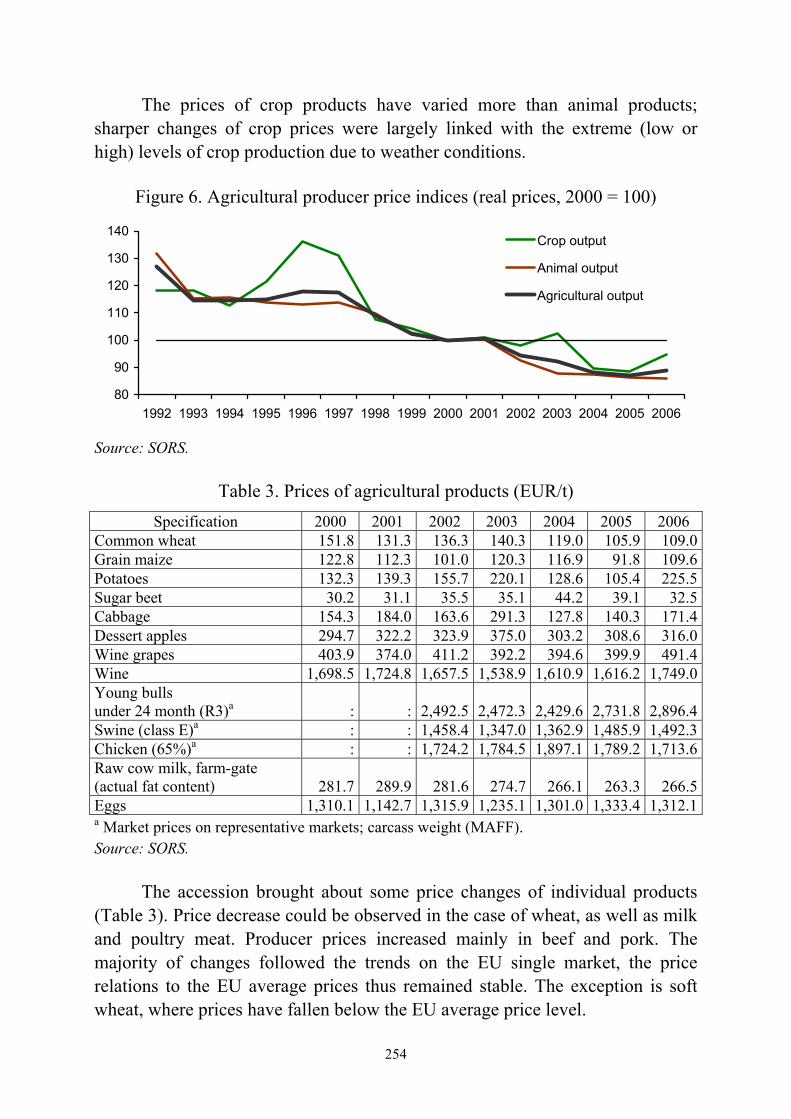
254
The prices of crop products have varied more than animal products; sharper changes of crop prices were largely linked with the extreme (low or high) levels of crop production due to weather conditions.
Figure 6. Agricultural producer price indices (real prices, 2000 = 100)
80
90
100
110
120
130
140
1992 1993 1994 1995 1996 1997 1998 1999 2000 2001 2002 2003 2004 2005 2006
Crop output
Animal output
Agricultural output
Source: SORS.
Table 3. Prices of agricultural products (EUR/t) Specification 2000 2001 2002 2003 2004 2005 2006
Common wheat 151.8 131.3 136.3 140.3 119.0 105.9 109.0Grain maize 122.8 112.3 101.0 120.3 116.9 91.8 109.6Potatoes 132.3 139.3 155.7 220.1 128.6 105.4 225.5Sugar beet 30.2 31.1 35.5 35.1 44.2 39.1 32.5Cabbage 154.3 184.0 163.6 291.3 127.8 140.3 171.4Dessert apples 294.7 322.2 323.9 375.0 303.2 308.6 316.0Wine grapes 403.9 374.0 411.2 392.2 394.6 399.9 491.4Wine 1,698.5 1,724.8 1,657.5 1,538.9 1,610.9 1,616.2 1,749.0Young bulls under 24 month (R3)a : : 2,492.5 2,472.3 2,429.6 2,731.8 2,896.4Swine (class E)a : : 1,458.4 1,347.0 1,362.9 1,485.9 1,492.3Chicken (65%)a : : 1,724.2 1,784.5 1,897.1 1,789.2 1,713.6Raw cow milk, farm-gate (actual fat content) 281.7 289.9 281.6 274.7 266.1 263.3 266.5Eggs 1,310.1 1,142.7 1,315.9 1,235.1 1,301.0 1,333.4 1,312.1a Market prices on representative markets; carcass weight (MAFF). Source: SORS.
The accession brought about some price changes of individual products (Table 3). Price decrease could be observed in the case of wheat, as well as milk and poultry meat. Producer prices increased mainly in beef and pork. The majority of changes followed the trends on the EU single market, the price relations to the EU average prices thus remained stable. The exception is soft wheat, where prices have fallen below the EU average price level.

255
4.3. Agricultural Income As a result of gradual and relatively consistent changes in agricultural
policy, the agricultural factor income remained relatively stable throughout the transition and pre-accession period. Lower income levels in some years (1992, 1993, 2001, 2003) were connected mainly with lower levels of production due to bad weather conditions (Figure 7).
Figure 7. Agricultural income (billion SIT, at constant prices)
0
20
40
60
80
100
120
92 93 94 95 96 97 98 99 00 01 02 03 04 05 06
NVA (pp) Subsidies on productionSubsidies on products GVA (bp)NVA (bp) Factor income
Source: Eurostat, calculated by AIS.
After the accession the factor income stabilised at a relatively high level compared to previous years. Trends from the past have continued – a slightly upward trend in agricultural output volume, a downward trend in producer prices and a substantial increase in subsidies for farmers. The situation after the accession thus changed little for producers, and it remained relatively favourable for agriculture in general. However, the structure of income changed significantly – the share of all forms of subsidies to producers increased gradually to the level of about 50%.
So far, beef producers benefited most after the accession as market prices rose significantly compared to previous years, due to an upward trend of prices on the EU beef market and besides, they were supported by higher direct payments. The situation for beef producers improved also as a result of exports of live animals to neighbouring countries.
On the other hand, EU membership worsened the situation in the majority of the crop sectors, with cereals production being the most affected. Following the accession, prices of cereals, especially wheat, fell sharply, though this was mainly due to the bumper harvest in the EU as a whole. The income loss was partly compensated for through higher direct payments, but nevertheless the cereal area decreased slightly (on average by 4%) and the share of grains
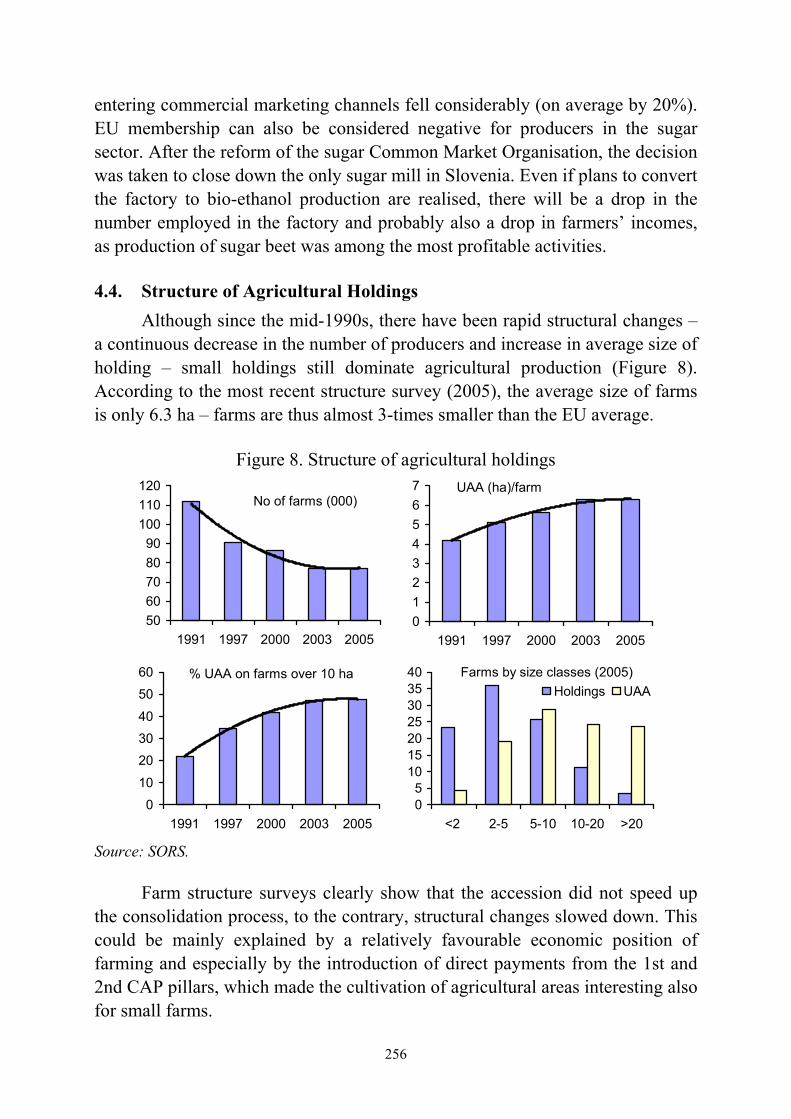
256
entering commercial marketing channels fell considerably (on average by 20%). EU membership can also be considered negative for producers in the sugar sector. After the reform of the sugar Common Market Organisation, the decision was taken to close down the only sugar mill in Slovenia. Even if plans to convert the factory to bio-ethanol production are realised, there will be a drop in the number employed in the factory and probably also a drop in farmers’ incomes, as production of sugar beet was among the most profitable activities. 4.4. Structure of Agricultural Holdings
Although since the mid-1990s, there have been rapid structural changes – a continuous decrease in the number of producers and increase in average size of holding – small holdings still dominate agricultural production (Figure 8). According to the most recent structure survey (2005), the average size of farms is only 6.3 ha – farms are thus almost 3-times smaller than the EU average.
Figure 8. Structure of agricultural holdings
No of farms (000)
5060708090
100110120
1991 1997 2000 2003 2005
% UAA on farms over 10 ha
010
203040
5060
1991 1997 2000 2003 2005
UAA (ha)/farm
01234567
1991 1997 2000 2003 2005
Farms by size classes (2005)
05
10152025303540
<2 2-5 5-10 10-20 >20
Holdings UAA
Source: SORS.
Farm structure surveys clearly show that the accession did not speed up the consolidation process, to the contrary, structural changes slowed down. This could be mainly explained by a relatively favourable economic position of farming and especially by the introduction of direct payments from the 1st and 2nd CAP pillars, which made the cultivation of agricultural areas interesting also for small farms.

257
5. Food Industry 5.1. Production and Size Structures
Manufacturing of food and beverages (NACE 15) is the fourth most important processing activity in terms of its value added contribution and the third largest employer in the manufacturing aggregate. The share of food industry in total GDP was 1.7% in 2005, and the share in employment was 2.2%.
Figure 9. Composition of food industry (NACE 15) by activity according to GVA, 2005
15.3 Fruit&vegetables
5%
15.2 Fish1%
15.4 Oils&fats1%
15.5 Dairy products
7%15.6 Grain mill
products4%
15.7 Prepared animal feeds
2%
15.8 Other food products
37%
15.9 Beverages21%
15.1 Meat22%
Source: Agency of the Republic of Slovenia for Public Legal Records and Related Services.
The highest share in valued added (Figure 9) belongs to the Manufacture of other food products (NACE 15.8), within which the most important branch is Manufacture of bread, fresh pastry and cakes (NACE 15.81), which contributes more the half the value of GDP of this group. Important food sectors are the production of meat and meat products (NACE 15.1) and Manufacture of beverages (NACE 15.9), where beer production prevails. From agriculture and agricultural policy perspective, milk processing is also an important branch based on local raw materials.
Slovenian food industry is characterised by a dual size structure (Figure 10). Of around 800 enterprises, more than 70% had less than 10 employees (micro firms) in 2005, large firms, employing more than 250 workers represent less than 3% share. Despite the high numbers of micro and small firms, the majority of production is concentrated in large firms, which employed more than 50% of labour and generated around 70% of sector value added in 2005.

258
Figure 10. Composition of food industry (NACE 15) by size of enterprise, 2005
Source: SORS.
5.2. Economic Performance Opening up of the market after the accession increased a competitive
pressure on the food industry and consequently, the business performance of the sector deteriorated significantly (Figure 11). Production decreased by 10% and real GVA by 12%.
Figure 11. Main economic indicators of the food industry (NACE 15)
85
90
95
100
105
110
2000 2001 2002 2003 2004 2005
Inde
x (2
000
= 10
0)
GVA (real) Production volume Producer prices No of employees
Source: SORS.
The accession had varied impact on the economic position of food industry sub-sectors (Figure 12). Significant aggravation could be observed in the dairy industry and in the processing of fruit and vegetables.
No of enterprises
Large, 2.6%
Medium-sized, 7.0%
Small, 18.0%
Micro, 72.4%
No of employeesMicro, 7.4%
Small, 13.6%
Medium-sized, 30.5%
Large, 48.5%
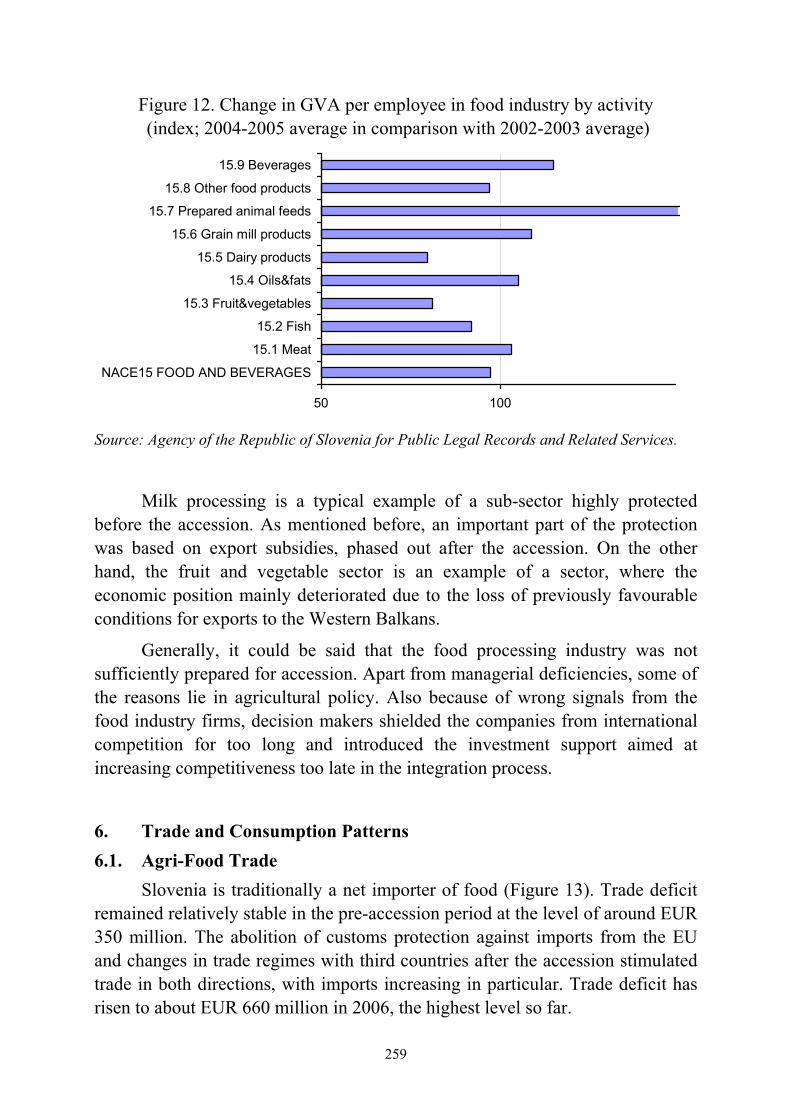
259
Figure 12. Change in GVA per employee in food industry by activity (index; 2004-2005 average in comparison with 2002-2003 average)
50 100
NACE15 FOOD AND BEVERAGES
15.1 Meat
15.2 Fish
15.3 Fruit&vegetables
15.4 Oils&fats
15.5 Dairy products
15.6 Grain mill products
15.7 Prepared animal feeds
15.8 Other food products
15.9 Beverages
Source: Agency of the Republic of Slovenia for Public Legal Records and Related Services.
Milk processing is a typical example of a sub-sector highly protected before the accession. As mentioned before, an important part of the protection was based on export subsidies, phased out after the accession. On the other hand, the fruit and vegetable sector is an example of a sector, where the economic position mainly deteriorated due to the loss of previously favourable conditions for exports to the Western Balkans.
Generally, it could be said that the food processing industry was not sufficiently prepared for accession. Apart from managerial deficiencies, some of the reasons lie in agricultural policy. Also because of wrong signals from the food industry firms, decision makers shielded the companies from international competition for too long and introduced the investment support aimed at increasing competitiveness too late in the integration process.
6. Trade and Consumption Patterns 6.1. Agri-Food Trade
Slovenia is traditionally a net importer of food (Figure 13). Trade deficit remained relatively stable in the pre-accession period at the level of around EUR 350 million. The abolition of customs protection against imports from the EU and changes in trade regimes with third countries after the accession stimulated trade in both directions, with imports increasing in particular. Trade deficit has risen to about EUR 660 million in 2006, the highest level so far.
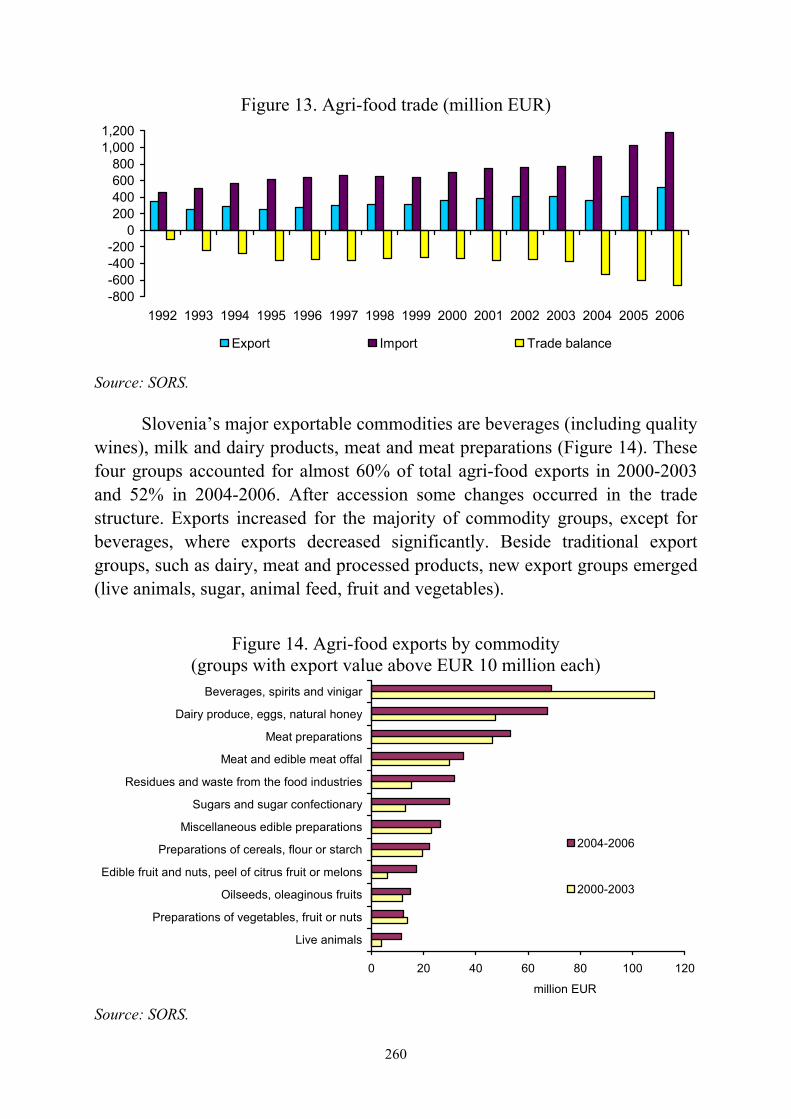
260
Figure 13. Agri-food trade (million EUR)
-800-600-400-200
0200400600800
1,0001,200
1992 1993 1994 1995 1996 1997 1998 1999 2000 2001 2002 2003 2004 2005 2006
Export Import Trade balance
Source: SORS.
Slovenia’s major exportable commodities are beverages (including quality wines), milk and dairy products, meat and meat preparations (Figure 14). These four groups accounted for almost 60% of total agri-food exports in 2000-2003 and 52% in 2004-2006. After accession some changes occurred in the trade structure. Exports increased for the majority of commodity groups, except for beverages, where exports decreased significantly. Beside traditional export groups, such as dairy, meat and processed products, new export groups emerged (live animals, sugar, animal feed, fruit and vegetables).
Figure 14. Agri-food exports by commodity (groups with export value above EUR 10 million each)
0 20 40 60 80 100 120
Live animals
Preparations of vegetables, fruit or nuts
Oilseeds, oleaginous fruits
Edible fruit and nuts, peel of citrus fruit or melons
Preparations of cereals, flour or starch
Miscellaneous edible preparations
Sugars and sugar confectionary
Residues and waste from the food industries
Meat and edible meat offal
Meat preparations
Dairy produce, eggs, natural honey
Beverages, spirits and vinigar
million EUR
2004-2006
2000-2003
Source: SORS.
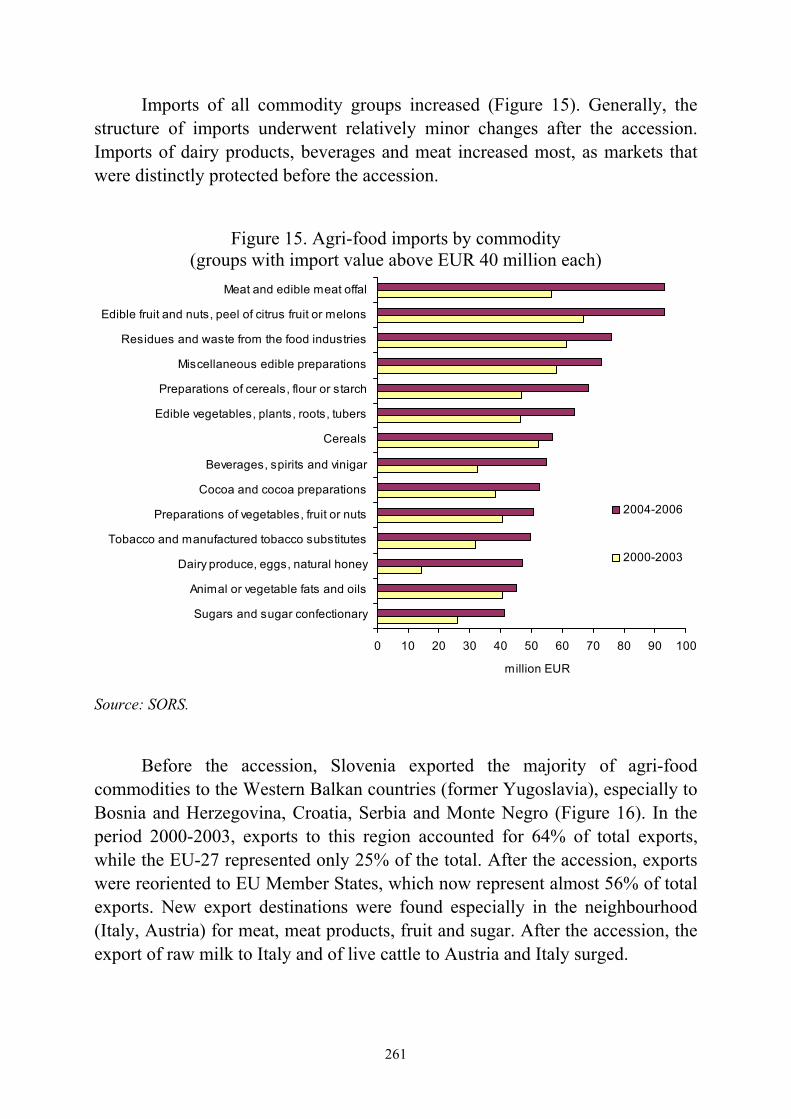
261
Imports of all commodity groups increased (Figure 15). Generally, the structure of imports underwent relatively minor changes after the accession. Imports of dairy products, beverages and meat increased most, as markets that were distinctly protected before the accession.
Figure 15. Agri-food imports by commodity (groups with import value above EUR 40 million each)
Source: SORS.
Before the accession, Slovenia exported the majority of agri-food commodities to the Western Balkan countries (former Yugoslavia), especially to Bosnia and Herzegovina, Croatia, Serbia and Monte Negro (Figure 16). In the period 2000-2003, exports to this region accounted for 64% of total exports, while the EU-27 represented only 25% of the total. After the accession, exports were reoriented to EU Member States, which now represent almost 56% of total exports. New export destinations were found especially in the neighbourhood (Italy, Austria) for meat, meat products, fruit and sugar. After the accession, the export of raw milk to Italy and of live cattle to Austria and Italy surged.
0 10 20 30 40 50 60 70 80 90 100
Sugars and sugar confectionary
Animal or vegetable fats and oils
Dairy produce, eggs, natural honey
Tobacco and manufactured tobacco substitutes
Preparations of vegetables, fruit or nuts
Cocoa and cocoa preparations
Beverages, spirits and vinigar
Cereals
Edible vegetables, plants, roots, tubers
Preparations of cereals, flour or starch
Miscellaneous edible preparations
Residues and waste from the food industries
Edible fruit and nuts, peel of citrus fruit or melons
Meat and edible meat offal
million EUR
2004-2006
2000-2003
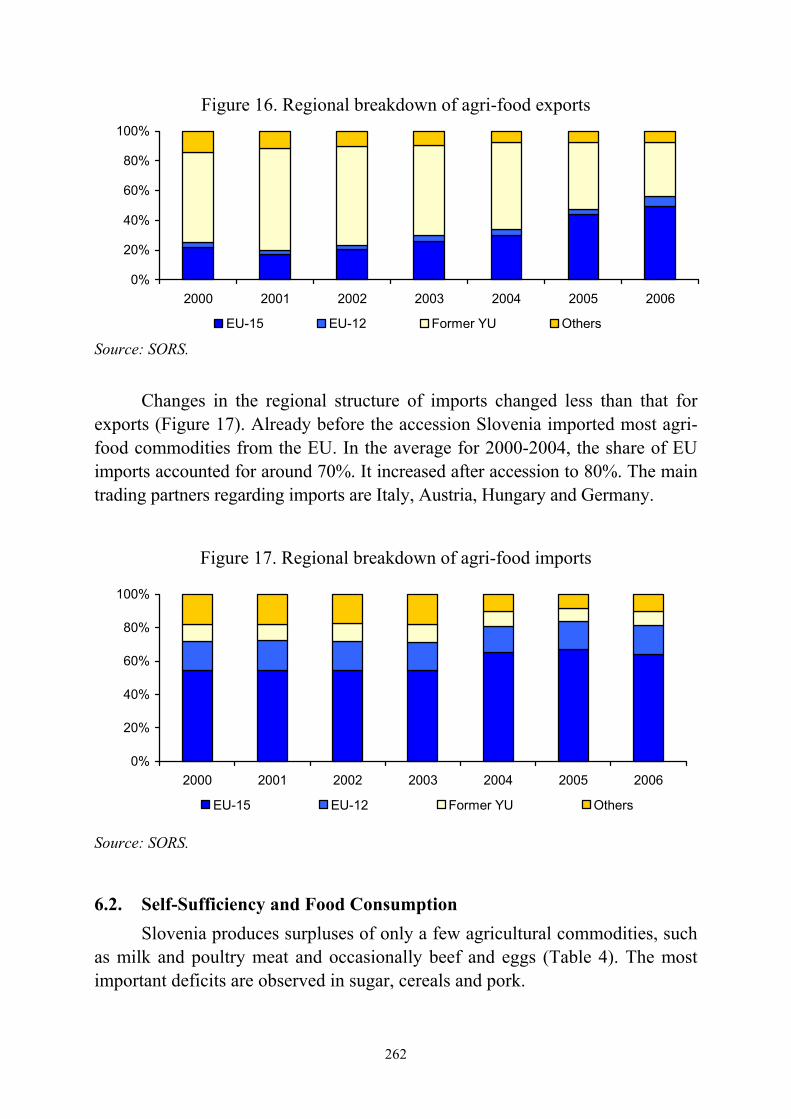
262
Figure 16. Regional breakdown of agri-food exports
0%
20%
40%
60%
80%
100%
2000 2001 2002 2003 2004 2005 2006
EU-15 EU-12 Former YU Others
Source: SORS.
Changes in the regional structure of imports changed less than that for exports (Figure 17). Already before the accession Slovenia imported most agri-food commodities from the EU. In the average for 2000-2004, the share of EU imports accounted for around 70%. It increased after accession to 80%. The main trading partners regarding imports are Italy, Austria, Hungary and Germany.
Figure 17. Regional breakdown of agri-food imports
0%
20%
40%
60%
80%
100%
2000 2001 2002 2003 2004 2005 2006
EU-15 EU-12 Former YU Others
Source: SORS.
6.2. Self-Sufficiency and Food Consumption Slovenia produces surpluses of only a few agricultural commodities, such
as milk and poultry meat and occasionally beef and eggs (Table 4). The most important deficits are observed in sugar, cereals and pork.
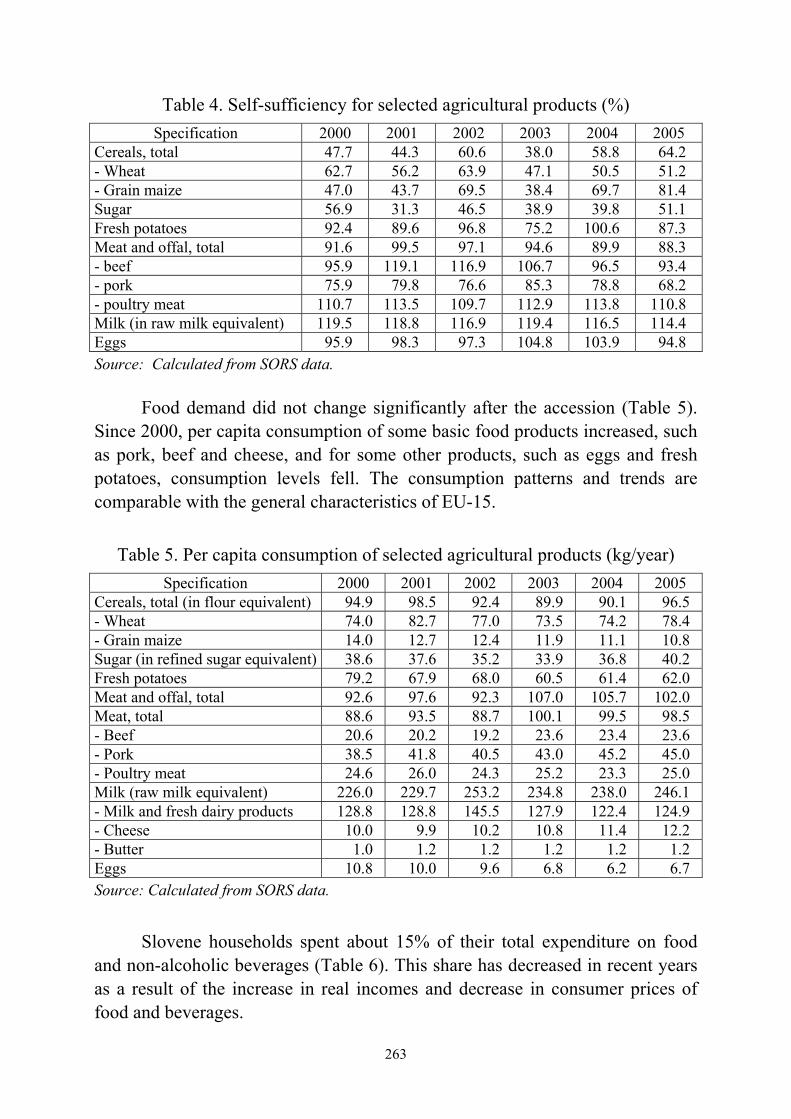
263
Table 4. Self-sufficiency for selected agricultural products (%) Specification 2000 2001 2002 2003 2004 2005
Cereals, total 47.7 44.3 60.6 38.0 58.8 64.2 - Wheat 62.7 56.2 63.9 47.1 50.5 51.2 - Grain maize 47.0 43.7 69.5 38.4 69.7 81.4 Sugar 56.9 31.3 46.5 38.9 39.8 51.1 Fresh potatoes 92.4 89.6 96.8 75.2 100.6 87.3 Meat and offal, total 91.6 99.5 97.1 94.6 89.9 88.3 - beef 95.9 119.1 116.9 106.7 96.5 93.4 - pork 75.9 79.8 76.6 85.3 78.8 68.2 - poultry meat 110.7 113.5 109.7 112.9 113.8 110.8 Milk (in raw milk equivalent) 119.5 118.8 116.9 119.4 116.5 114.4 Eggs 95.9 98.3 97.3 104.8 103.9 94.8 Source: Calculated from SORS data.
Food demand did not change significantly after the accession (Table 5). Since 2000, per capita consumption of some basic food products increased, such as pork, beef and cheese, and for some other products, such as eggs and fresh potatoes, consumption levels fell. The consumption patterns and trends are comparable with the general characteristics of EU-15.
Table 5. Per capita consumption of selected agricultural products (kg/year)
Specification 2000 2001 2002 2003 2004 2005 Cereals, total (in flour equivalent) 94.9 98.5 92.4 89.9 90.1 96.5 - Wheat 74.0 82.7 77.0 73.5 74.2 78.4 - Grain maize 14.0 12.7 12.4 11.9 11.1 10.8 Sugar (in refined sugar equivalent) 38.6 37.6 35.2 33.9 36.8 40.2 Fresh potatoes 79.2 67.9 68.0 60.5 61.4 62.0 Meat and offal, total 92.6 97.6 92.3 107.0 105.7 102.0 Meat, total 88.6 93.5 88.7 100.1 99.5 98.5 - Beef 20.6 20.2 19.2 23.6 23.4 23.6 - Pork 38.5 41.8 40.5 43.0 45.2 45.0 - Poultry meat 24.6 26.0 24.3 25.2 23.3 25.0 Milk (raw milk equivalent) 226.0 229.7 253.2 234.8 238.0 246.1 - Milk and fresh dairy products 128.8 128.8 145.5 127.9 122.4 124.9 - Cheese 10.0 9.9 10.2 10.8 11.4 12.2 - Butter 1.0 1.2 1.2 1.2 1.2 1.2 Eggs 10.8 10.0 9.6 6.8 6.2 6.7 Source: Calculated from SORS data.
Slovene households spent about 15% of their total expenditure on food and non-alcoholic beverages (Table 6). This share has decreased in recent years as a result of the increase in real incomes and decrease in consumer prices of food and beverages.
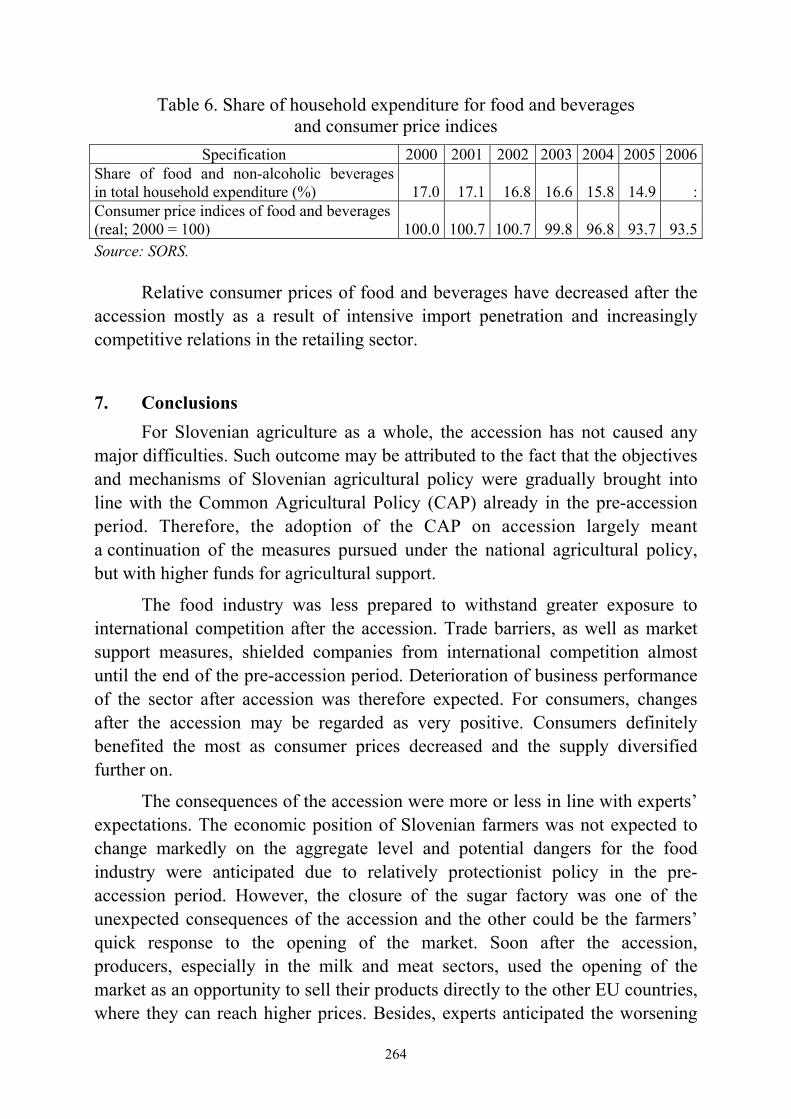
264
Table 6. Share of household expenditure for food and beverages and consumer price indices
Specification 2000 2001 2002 2003 2004 2005 2006Share of food and non-alcoholic beveragesin total household expenditure (%) 17.0 17.1 16.8 16.6 15.8 14.9 :Consumer price indices of food and beverages (real; 2000 = 100) 100.0 100.7 100.7 99.8 96.8 93.7 93.5Source: SORS.
Relative consumer prices of food and beverages have decreased after the accession mostly as a result of intensive import penetration and increasingly competitive relations in the retailing sector.
7. Conclusions For Slovenian agriculture as a whole, the accession has not caused any
major difficulties. Such outcome may be attributed to the fact that the objectives and mechanisms of Slovenian agricultural policy were gradually brought into line with the Common Agricultural Policy (CAP) already in the pre-accession period. Therefore, the adoption of the CAP on accession largely meant a continuation of the measures pursued under the national agricultural policy, but with higher funds for agricultural support.
The food industry was less prepared to withstand greater exposure to international competition after the accession. Trade barriers, as well as market support measures, shielded companies from international competition almost until the end of the pre-accession period. Deterioration of business performance of the sector after accession was therefore expected. For consumers, changes after the accession may be regarded as very positive. Consumers definitely benefited the most as consumer prices decreased and the supply diversified further on.
The consequences of the accession were more or less in line with experts’ expectations. The economic position of Slovenian farmers was not expected to change markedly on the aggregate level and potential dangers for the food industry were anticipated due to relatively protectionist policy in the pre-accession period. However, the closure of the sugar factory was one of the unexpected consequences of the accession and the other could be the farmers’ quick response to the opening of the market. Soon after the accession, producers, especially in the milk and meat sectors, used the opening of the market as an opportunity to sell their products directly to the other EU countries, where they can reach higher prices. Besides, experts anticipated the worsening
265
of performance in the pig and poultry sector. However, producer prices remained relatively high and feed prices decreased and the terms of trade did not deteriorate.
The Slovenian agri-food chain is faced with some important challenges. In the coming years agriculture will have to face the CAP reform of direct payments. The reform will increase the role of the market as most payments will become decoupled from production. Reform will also bring a re-distribution of premium rights. The long-term effects of the reform are hard to predict. Besides, after the year 2007/8, when the level of budgetary support to producers will reach 100% compared to EU-15, agriculture will have to operate with the same support even though the prices may decrease. All this will probably increase the pressure for faster structural adjustment.
Although the first years of EU membership were quite positive, the problem of relatively poor competitiveness of the sector has not yet been solved. Labour productivity, measured by GVA per employee, is well below the EU average – in agriculture about three-times and in food industry two-times. In the long run, this is the main problem of further development of these sectors. Comprehensive structural changes and adjustments are therefore needed both in agriculture and food industry, and the process is expected to intensify in the coming years.
References 1. Agencija za javnopravne evidence in storitve (AJPES) 2006. Kazalniki uspešnosti
poslovanja podjetij živilsko predelovlane industrije. Podatkovna baza.
2. Erjavec E. et all. 2003a. V: Nekatera odprta vprašanja nacionalne kmetijske politike ob pristopu Slovenije k Evropski Uniji. Slovensko kmetijstvo in Evropska unija. 2. konferenca DAES. Kavčič S. (ur.). Ljubljana, Društvo agrarnih ekonomistov Slovenije.
3. Erjavec, E., Rednak, M., Volk, T., Turk, J. 2003b. The transition from 'socialist' agriculture to the common agricultural policy: the case of Slovenia. Post-communist econ. (Print), Dec. 2003, vol. 15, no. 4, p. [557]-569.
4. Erjavec, E. 2004. Common agricultural policy and Slovenia. Banč. vestn., 2004, letn. 53, št. 5 (Special issue), p. 115-121.
5. EUROSTAT, 2007. Different sources.
6. Kavčič, S., Erjavec, E., Mergos, G., Stoforos, C. 2003. EU enlargement and the Common Agricultural Policy: the case of Slovenia. Agric. food sci. Finl., 2003, vol. 12, no. 1, p. 3-29.
7. Kmetijski inštitut Slovenije 2007. Agrarnopolitični informacijski sistem. Podatkovna baza.
266
8. Ministrstvo za kmetijstvo, gozdarstvo in prehrano, Kmetijski inštitut Slovenije (MAFF - KIS). 2006. Poročilo o stanju kmetijstva, gozdarstva in prehrane v letu 2005. KIS, Ljubljana.
9. Münch, W. 2000. ‘Effects of CEEC-EU accession on agricultural markets in the CEEC and on government expenditure’, in S. Tangerman & M. Banse (eds), Central and Eastern European agriculture in an expanding European Union (Wallingford, CAB International, 2000), pp. 113-132.
10. Organisation for Economic Cooperation and Development (OECD), 2001. Review of Agricultural Policies - Slovenia (Paris, OECD - Centre for co-operation with non-member, 2001).
11. Rednak, M., Kavčič, S., Volk, T., Erjavec, E. 2003a. Complementary CAP direct payments from the national budget and farm income issue in Slovenia. East. Europ. econ., 2003, vol. 41, no. 6, p. 26-42.
12. Rednak, M., Volk, T., Erjavec, E. 2003b. Der Transformationsprozess und die EU-Beitrittsanpassungen in der slowenischen Landwirtschaft. Ber. Landwirtsch., 2003, letn. 81, št. 4, p. 614-636.
13. Treaty concerning the accession of the Czech Republic, the Republic of Estonia, the Republic of Cyprus, the Republic of Latvia, the Republic of Lithuania, the Republic of Hungary, the Republic of Malta, the Republic of Poland, the Republic of Slovenia and the Slovak Republic to the European Union.
14. Volk, T. 2004. Uticaj agrarne politike na razvoj poljoprivrede Slovenije u periodu tranzicije i uključenja u Evropsku uniju.. Doktorski rad, Poljoprivredni fakultet, Beograd.