Embed Size (px)
Citation preview

Installation Manual
Models 4911/4911A Vibrating Wire Rebar Strain Meters
No part of this instruction manual may be reproduced, by any means, without the written consent of Geokon, Inc.
The information contained herein is believed to be accurate and reliable. However, Geokon, Inc. assumes no responsibility for errors, omissions, or misinterpretation. The information herein is subject to change without notification.
Copyright © 1989-2018 Geokon, Inc.
(Doc Rev Q, 4/27/2018)


Warranty Statement Geokon, Inc. warrants its products to be free of defects in materials and workmanship, under normal use and service for a period of 13 months from date of purchase. If the unit should malfunction, it must be returned to the factory for evaluation, freight prepaid. Upon examination by Geokon, if the unit is found to be defective, it will be repaired or replaced at no charge. However, the WARRANTY is VOID if the unit shows evidence of having been tampered with or shows evidence of being damaged as a result of excessive corrosion or current, heat, moisture or vibration, improper specification, misapplication, misuse or other operating conditions outside of Geokon's control. Components which wear or which are damaged by misuse are not warranted. This includes fuses and batteries. Geokon manufactures scientific instruments whose misuse is potentially dangerous. The instruments are intended to be installed and used only by qualified personnel. There are no warranties except as stated herein. There are no other warranties, expressed or implied, including but not limited to the implied warranties of merchantability and of fitness for a particular purpose. Geokon, Inc. is not responsible for any damages or losses caused to other equipment, whether direct, indirect, incidental, special or consequential which the purchaser may experience as a result of the installation or use of the product. The buyer's sole remedy for any breach of this agreement by Geokon, Inc. or any breach of any warranty by Geokon, Inc. shall not exceed the purchase price paid by the purchaser to Geokon, Inc. for the unit or units, or equipment directly affected by such breach. Under no circumstances will Geokon reimburse the claimant for loss incurred in removing and/or reinstalling equipment. Every precaution for accuracy has been taken in the preparation of manuals and/or software, however, Geokon, Inc. neither assumes responsibility for any omissions or errors that may appear nor assumes liability for any damages or losses that result from the use of the products in accordance with the information contained in the manual or software.


TABLE of CONTENTS
1. INTRODUCTION ................................................................................................................................................... 1
2. INSTALLATION .................................................................................................................................................... 2
2.1 PRELIMINARY TEST ............................................................................................................................................. 2 2.2 INSTALLING MODEL 4911, “SISTER BAR” ........................................................................................................... 2 2.3 INSTALLING MODEL 4911A ................................................................................................................................. 4 2.4 CABLE INSTALLATION ......................................................................................................................................... 5 2.5 CABLE SPLICING AND TERMINATION ................................................................................................................... 5 2.6 LIGHTNING PROTECTION ..................................................................................................................................... 5
3. TAKING READINGS ............................................................................................................................................. 7
3.1 GK-404 READOUT BOX ....................................................................................................................................... 7 3.1.1 Operating the GK-404 ................................................................................................................................ 7
3.2 GK-405 READOUT BOX ....................................................................................................................................... 8 3.2.1 Connecting Sensors 10-pin Bulkhead Connectors Attached ....................................................................... 8 3.2.2 Connecting Sensors with Bare Leads .......................................................................................................... 8 3.2.3 Operating the GK-405 ................................................................................................................................ 8
3.3 GK-403 READOUT BOX (OBSOLETE MODEL) ...................................................................................................... 9 3.3.1 Connecting Sensors with 10-pin Bulkhead Connectors Attached ............................................................... 9 3.3.2 Connecting Sensors with Bare Leads .......................................................................................................... 9 3.3.3 Operating the GK-403 ................................................................................................................................ 9
3.4 MEASURING TEMPERATURES ............................................................................................................................. 10
4. DATA REDUCTION ............................................................................................................................................ 11
4.1 STRAIN CALCULATION ...................................................................................................................................... 11 4.2 TEMPERATURE CORRECTION ............................................................................................................................. 11 4.3 ENVIRONMENTAL FACTORS ............................................................................................................................... 13 4.4 SHRINKAGE EFFECTS ......................................................................................................................................... 13 4.5 CONVERTING STRAINS TO LOADS ...................................................................................................................... 13
5. TROUBLESHOOTING ........................................................................................................................................ 15
APPENDIX A. SPECIFICATIONS ......................................................................................................................... 17
A.1 REBAR STRAIN METERS .................................................................................................................................... 17 A.2 THERMISTOR ..................................................................................................................................................... 17
APPENDIX B. THERMISTOR TEMPERATURE DERIVATION ..................................................................... 18
APPENDIX C. DERIVING THE CALIBRATION FACTOR (C) FROM THE TEST DATA ......................... 19

FIGURES FIGURE 1 - MODEL 4911 REBAR STRAIN METER ........................................................................................................... 1 FIGURE 2 - MODEL 4911A REBAR STRAIN METER ........................................................................................................ 1 FIGURE 3 - MODEL 4911 “SISTER BAR” INSTALLATION ................................................................................................ 3 FIGURE 4 - MODEL 4911 “SISTER BAR” INSTALLATION DETAIL .................................................................................... 3 FIGURE 5 - MODEL 4911A INSTALLATION ..................................................................................................................... 4 FIGURE 6 - RECOMMENDED LIGHTNING PROTECTION SCHEME ..................................................................................... 6 FIGURE 7 - LEMO CONNECTOR TO GK-404 ................................................................................................................... 7 FIGURE 8 - LIVE READINGS – RAW READINGS............................................................................................................... 8 FIGURE 9 - SAMPLE MODEL 4911 CALIBRATION REPORT .............................................................................................14 FIGURE 10 - REBAR STRAIN METER SCHEMATIC ..........................................................................................................19
TABLES TABLE 1 - THERMAL COEFFICIENTS .............................................................................................................................11 TABLE 2 - SAMPLE RESISTANCE ...................................................................................................................................16 TABLE 3 - RESISTANCE WORK SHEET ...........................................................................................................................16 TABLE 4 - MODEL 4911A/4911 STRAIN METER SPECIFICATIONS .................................................................................17 TABLE 5 - THERMISTOR RESISTANCE VERSUS TEMPERATURE .....................................................................................18 TABLE 6 - UNBONDED SECTION DIMENSIONS ...............................................................................................................20 TABLE 7 - MICROSTRAIN CONVERSION FACTORS .........................................................................................................21
EQUATIONS EQUATION 1 - DIGITS CALCULATION ............................................................................................................................11 EQUATION 2 - APPARENT STRAIN .................................................................................................................................11 EQUATION 3 - LOAD RELATED STRAIN .........................................................................................................................12 EQUATION 4 - ACTUAL STRAIN ....................................................................................................................................12 EQUATION 5 - STRAIN TO LOAD FORMULA ...................................................................................................................13 EQUATION 6 - RESISTANCE TO TEMPERATURE .............................................................................................................18 EQUATION 7 - TOTAL STRAIN CALCULATION ...............................................................................................................19 EQUATION 8 - ZONE TWO CALCULATION .....................................................................................................................20 EQUATION 9 - ZONE THREE CALCULATION ..................................................................................................................20 EQUATION 10 - LOAD IN POUNDS/KILOGRAMS .............................................................................................................20
1
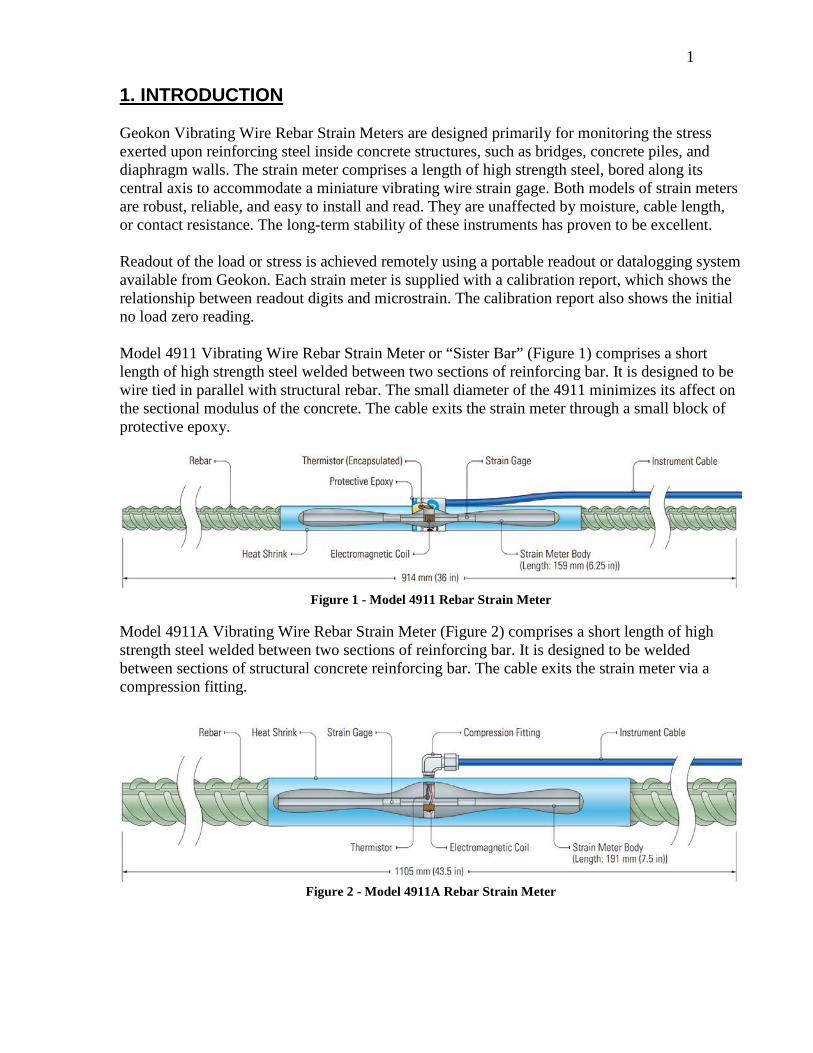
1. INTRODUCTION Geokon Vibrating Wire Rebar Strain Meters are designed primarily for monitoring the stress exerted upon reinforcing steel inside concrete structures, such as bridges, concrete piles, and diaphragm walls. The strain meter comprises a length of high strength steel, bored along its central axis to accommodate a miniature vibrating wire strain gage. Both models of strain meters are robust, reliable, and easy to install and read. They are unaffected by moisture, cable length, or contact resistance. The long-term stability of these instruments has proven to be excellent. Readout of the load or stress is achieved remotely using a portable readout or datalogging system available from Geokon. Each strain meter is supplied with a calibration report, which shows the relationship between readout digits and microstrain. The calibration report also shows the initial no load zero reading. Model 4911 Vibrating Wire Rebar Strain Meter or “Sister Bar” (Figure 1) comprises a short length of high strength steel welded between two sections of reinforcing bar. It is designed to be wire tied in parallel with structural rebar. The small diameter of the 4911 minimizes its affect on the sectional modulus of the concrete. The cable exits the strain meter through a small block of protective epoxy.
Figure 1 - Model 4911 Rebar Strain Meter
Model 4911A Vibrating Wire Rebar Strain Meter (Figure 2) comprises a short length of high strength steel welded between two sections of reinforcing bar. It is designed to be welded between sections of structural concrete reinforcing bar. The cable exits the strain meter via a compression fitting.
Figure 2 - Model 4911A Rebar Strain Meter

2
2. INSTALLATION 2.1 Preliminary Test A preliminary check should be performed before installing gages in the field. To perform the preliminary check, complete the following steps: Warning! Do not lift the strain meter by the cable. 1) Connect the gage to a readout box. (See readout instructions in Section 3.) Observe the
displayed readout. 2) Compare the zero reading given on the calibration report to the current zero reading. Under
normal circumstances the two readings should not differ by more than 25 digits (10 microstrains), however, shocks incurred during shipping may cause larger shifts. If the reading is within 100 digits (40 microstrains) of the factory zero, and is stable, it is safe to proceed with the installation.
3) Pull on the strain meter ends; confirm that digits on the readout rise as the tension increases. Checks of electrical continuity can be made using an ohmmeter. The resistance between the two lead wires (usually red and black) should be around 50 ohms. Remember to add the cable resistance, approximately 14.7Ω for every 1000 ft. (48.5Ω per km) at 20 °C. Multiply these factors by two to account for both directions. Resistance between the two thermistor wires (usually white and green) varies with temperature. Use Table 5 in Appendix B to convert the resistance to temperature and compare the result to the ambient temperature. Resistance between any conductor and the shield should exceed two megohms. If the strain meter fails any of the preliminary tests, see Section 5 for troubleshooting.
2.2 Installing Model 4911, “Sister Bar” Sister Bars are usually installed using standard iron tie wire. Ties near the ends and at the one-third points are sufficient if the gage is being wired to a larger section of rebar or to horizontal bars. Wiring at the one third points alone is sufficient if the gage is being wired in parallel to the structural rebar. Route the instrument cable along the rebar system and tie it off every three to four feet (one-meter) using nylon cable ties. Avoid using the tie wire on the instrument cable as it could cut the cable. See Figure 3 and Figure 4 on the following page. Be sure to note the location and serial numbers of all instruments during the installation process. This information is necessary in order to apply the proper calibration factors and determine strain characteristics when reducing data.

3
Figure 3 - Model 4911 “Sister Bar” Installation
Figure 4 - Model 4911 “Sister Bar” Installation Detail

4
2.3 Installing Model 4911A Normally the strain meter is welded in series with the reinforcing steel that is to be instrumented on site. The strain meter is of sufficient length that it may be welded in place without damaging the internal strain gage element. However, care should still be taken to ensure that the central portion of the strain meter does not become too hot, as the plucking coil and protective epoxy could melt. In order to prevent this it may be necessary to place wet rags between the weld area and the coil housing. Take care not to damage or burn the instrument cable during welding. After welding, route the instrument cable along the rebar system and tie it off every three to four feet (one-meter) using nylon cable ties. Avoid using iron tie wire to secure the cable as the cable could be cut. Figure 5 show a typical 4911 installation. Be sure to note the location and serial numbers of all instruments during the installation process. This information is necessary for applying the proper calibration factors and determining strain characteristics when reducing data.
Figure 5 - Model 4911A Installation

5
2.4 Cable Installation As noted in the in the previous sections, instrument cables should be routed along the structural rebar and secured with nylon cable ties every two to three feet (one-meter). Outside of the instrumented structure, the cable should be protected from accidental damage caused by moving equipment or other construction activity.
2.5 Cable Splicing and Termination Terminal boxes with sealed cable entries are available from Geokon for all types of applications. These allow many gages to be terminated at one location with complete protection of the lead wires. The interior panel of the terminal box can have built-in jacks or a single connection with a rotary position selector switch. Contact Geokon for specific application information. Cables may be terminated by stripping and tinning the individual conductors and then connecting them to the patch cord of a readout box. Alternatively, a connector may be used which will plug directly into the readout box or to a receptacle on a special patch cord. The cable from the strain meters can also be protected by the use of flexible conduit, which can be supplied by Geokon. Because the vibrating wire output signal is a frequency rather than a current or voltage, variations in cable resistance have little effect on gage readings; therefore, splicing of cables has no ill effects, and in some cases may in fact be beneficial. The cable used for making splices should be a high quality twisted pair type, with 100% shielding and an integral shield drain wire. When splicing, it is very important that the shield drain wires be spliced together. Always maintain polarity by connecting color to color. Splice kits recommended by Geokon incorporate casts that are placed around the splice and are then filled with epoxy to waterproof the connections. When properly made, this type of splice is equal or superior to the cable in strength and electrical properties. Contact Geokon for splicing materials and additional cable splicing instructions.
2.6 Lightning Protection Unlike numerous other types of instrumentation available from Geokon, rebar strain meters do not have any integral lightning protection components, such as transorbs or plasma surge arrestors. Usually this is not a problem, as these types of gages are installed within concrete and are somewhat isolated from potentially damaging electrical transients. However, there may be occasions where some sort of lightning protection is desirable, for example, where the instrument is in contact with rebar that is exposed to direct or indirect lightning strikes. In addition, if the instrument cable is exposed, it may be appropriate to install lightning protection components, as the transient could travel down the cable to the gage and possibly destroy it.

6
Suggested Lightning Protection Options: • If the instrument is connected to a terminal box or multiplexer, components such as plasma
surge arrestors (spark gaps) may be installed in the terminal box/multiplexer to provide a measure of transient protection. Terminal boxes and multiplexers available from Geokon provide locations for the installation of these components.
• Lighting arrestor boards and enclosures are also available from Geokon. These units install
where the instrument cable exits the structure being monitored. The enclosure has a removable top to allow the customer to service the components or replace the board in the event that the unit is damaged by a lightning strike. A connection is made between the enclosure and earth ground to facilitate the passing of transients away from the strain meter. See Figure 6 below.
• Plasma surge arrestors can be epoxied into the instrument cable, close to the instrument. A
ground strap then connects the surge arrestor to an earth ground, such as a grounding stake or the rebar itself.
Consult the factory for additional information on available lightning protection.
Figure 6 - Recommended Lightning Protection Scheme

7
3. TAKING READINGS 3.1 GK-404 Readout Box The GK-404 is a palm sized readout box, which displays the vibrating wire value and the temperature in degrees centigrade.
3.1.1 Operating the GK-404
Before use, attach the flying leads to the GK-404 by aligning the red circle on the silver “Lemo” connector of the flying leads with the red line on the top of the GK-404 (Figure 7). Insert the Lemo connector into the GK-404 until it locks into place.
Figure 7 - Lemo Connector to GK-404
Connect each of the clips on the leads to the matching colors of the sensor conductors, with blue representing the shield (bare).
To turn the GK-404 on, press the “ON/OFF” button on the front panel of the unit. The initial startup screen will be displayed. After approximately one second, the GK-404 will start taking readings and display them based on the settings of the POS and MODE buttons.
The unit display (from left to right) is as follows:
• The current Position: Set by the POS button. Displayed as a letter A through F. • The current Reading: Set by the MODE button. Displayed as a numeric value
followed by the unit of measure. • Temperature reading of the attached gage in degrees Celsius.
Use the POS button to select position B and the MODE button to select Dg (digits). (Other functions can be selected as described in the GK-404 Manual.)
The GK-404 will continue to take measurements and display readings until the unit is turned off, either manually, or if enabled, by the Auto-Off timer. If the no reading displays or the reading is unstable, see Section 5 for troubleshooting suggestions. For further details, please refer to the GK-404 manual.

8
3.2 GK-405 Readout Box The GK-405 Vibrating Wire Readout is made up of two components: The Readout Unit, consisting of a Windows Mobile handheld PC running the GK-405 Vibrating Wire Readout Application; and the GK-405 Remote Module, which is housed in a weatherproof enclosure and connects to the vibrating wire gage to be measured. The two components communicate wirelessly using Bluetooth®, a reliable digital communications protocol. The Readout Unit can operate from the cradle of the Remote Module, or, if more convenient, can be removed and operated up to 20 meters from the Remote Module.
3.2.1 Connecting Sensors 10-pin Bulkhead Connectors Attached Align the grooves on the sensor connector (male), with the appropriate connector on the readout (female connector labeled senor or load cell). Push the connector into place, and then twist the outer ring of the male connector until it locks into place.
3.2.2 Connecting Sensors with Bare Leads Attach the GK-403-2 flying leads to the bare leads of a Geokon vibrating wire sensor by connecting each of the clips on the leads to the matching colors of the sensor conductors, with blue representing the shield (bare). 3.2.3 Operating the GK-405 Press the button labeled “POWER ON (BLUETOOTH)”. A blue light will begin blinking, signifying that the Remote Module is waiting to connect to the handheld unit. Launch the GK-405 VWRA program by tapping on “Start” from the handheld PC’s main window, then “Programs” then the GK-405 VWRA icon. After a few seconds, the blue light on the Remote Module should stop flashing and remain lit. The Live Readings Window will be displayed on the handheld PC. Figure 8 shows a typical vibrating wire output in digits and thermistor output in degrees Celsius. If the no reading displays or the reading is unstable, see Section 5 for troubleshooting suggestions. For further information, consult the GK-405 Instruction Manual.
Figure 8 - Live Readings – Raw Readings

9
3.3 GK-403 Readout Box (Obsolete Model) The GK-403 can store gage readings and apply calibration factors to convert readings to engineering units. The following instructions explain taking gage measurements using Modes “B”. Consult the GK-403 Instruction Manual for additional information.
3.3.1 Connecting Sensors with 10-pin Bulkhead Connectors Attached Align the grooves on the sensor connector (male), with the appropriate connector on the readout (female connector labeled senor or load cell). Push the connector into place, and then twist the outer ring of the male connector until it locks into place.
3.3.2 Connecting Sensors with Bare Leads Attach the GK-403-2 flying leads to the bare leads of a Geokon vibrating wire sensor by connecting each of the clips on the leads to the matching colors of the sensor conductors, with blue representing the shield (bare).
3.3.3 Operating the GK-403
1) Turn the display selector to position “B”.
2) Turn the unit on.
3) The readout will display the vibrating wire output in digits. The last digit may change
one or two digits while reading.
4) The thermistor reading will be displayed above the gage reading in degrees centigrade.
5) Press the “Store” button to record the value displayed. If the no reading displays or the reading is unstable, see Section 5 for troubleshooting suggestions. The unit will automatically turn off after approximately two minutes to conserve power.

10
3.4 Measuring Temperatures All vibrating wire strain meters are equipped with a thermistor, which gives a varying resistance output as the temperature changes. The white and green leads of the instrument cable are normally connected to the internal thermistor. The GK-403, GK-404, and GK-405 readout boxes will read the thermistor and display the temperature in degrees C. To read temperatures using an ohmmeter: 1) Connect an ohmmeter to the green and white thermistor leads coming from the strain meter.
(Since the resistance changes with temperature are large, the effect of cable resistance is usually insignificant. For long cables a correction can be applied, equal to approximately 14.7Ω per 1000 ft. (48.5Ω per km) at 20 °C. Multiply these factors by two to account for both directions.)
2) Look up the temperature for the measured resistance in Appendix B, Table 5.
11
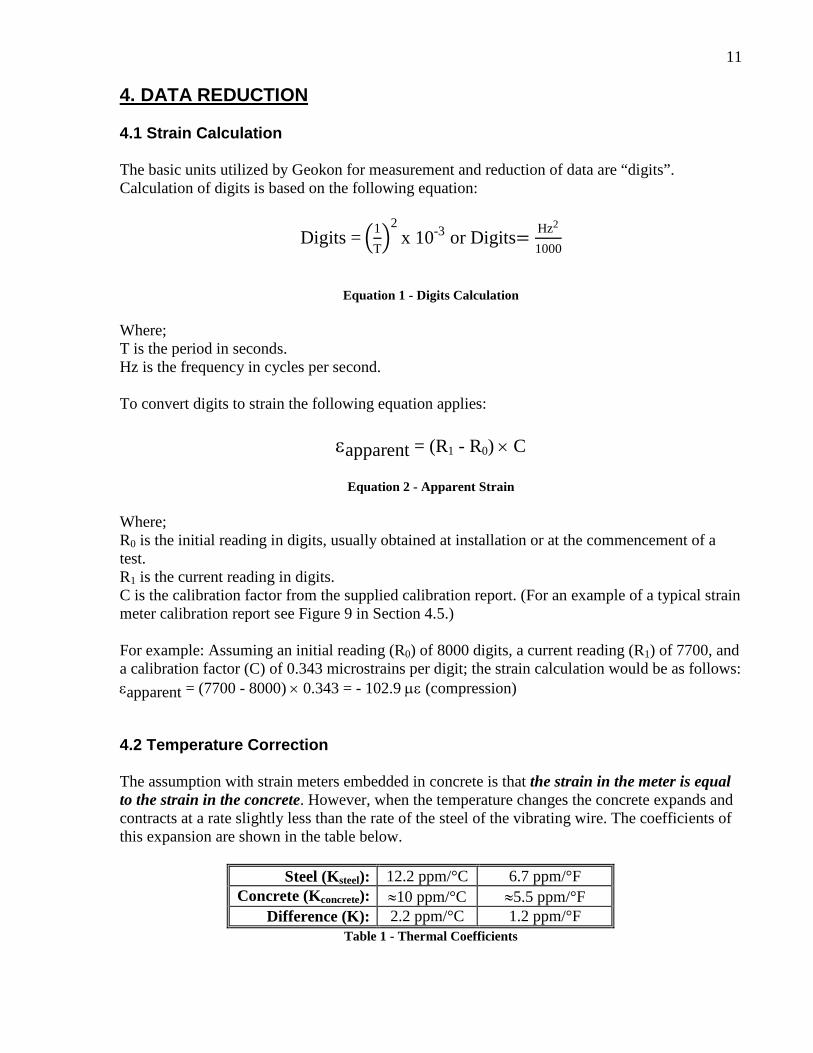
4. DATA REDUCTION 4.1 Strain Calculation The basic units utilized by Geokon for measurement and reduction of data are “digits”. Calculation of digits is based on the following equation:
Digits = 1T
2x 10⁻³ or Digits= Hz2
1000
Equation 1 - Digits Calculation
Where; T is the period in seconds. Hz is the frequency in cycles per second. To convert digits to strain the following equation applies:
εapparent = (R1 - R0) × C
Equation 2 - Apparent Strain Where; R0 is the initial reading in digits, usually obtained at installation or at the commencement of a test. R1 is the current reading in digits. C is the calibration factor from the supplied calibration report. (For an example of a typical strain meter calibration report see Figure 9 in Section 4.5.) For example: Assuming an initial reading (R0) of 8000 digits, a current reading (R1) of 7700, and a calibration factor (C) of 0.343 microstrains per digit; the strain calculation would be as follows: εapparent = (7700 - 8000) × 0.343 = - 102.9 µε (compression)
4.2 Temperature Correction The assumption with strain meters embedded in concrete is that the strain in the meter is equal to the strain in the concrete. However, when the temperature changes the concrete expands and contracts at a rate slightly less than the rate of the steel of the vibrating wire. The coefficients of this expansion are shown in the table below.
Steel (Ksteel): 12.2 ppm/°C 6.7 ppm/°F Concrete (Kconcrete): ≈10 ppm/°C ≈5.5 ppm/°F
Difference (K): 2.2 ppm/°C 1.2 ppm/°F Table 1 - Thermal Coefficients

12
Because of the difference in these two coefficients, a correction is required to the apparent strains, equal to the difference of the two coefficients. The equation for this correction is as follows:
εload related = ((R1 - R0) × C) + ((T1 - T0) × K)
Equation 3 - Load Related Strain
Where; T0 is the initial temperature recorded at the time of installation. T1 is the current temperature. K is the thermal coefficient from Table 1. The strains thus calculated are due to load changes only. Using the same theoretical example from Section 4.1, where R0 = 8000 digits on channel B, and R1 = 7700 digits on channel B, with the addition of temperature, T0 = 20 °C and T1 = 60 °C (during the concrete curing); the strain corrected for temperature (i.e. due to load changes only) can be calculated as follows: εload related = (7700 – 8000) 0.343 + (60 – 20) (12.2 – 10) = – 14.9 µstrain (compression) Please note that the actual strain undergone by the concrete, (e.g., that which would be measured by a tape measure,) is given by the formula:
εactual = ((R1 - R0) × C) + ((T1 - T0) ×Ksteel)
Equation 4 - Actual Strain
Apparent strain = (7700 – 8000) x 0.343 = – 103 µstrain (compression) Load related strain = (7700 – 8000) x 0.343 + (60 – 20) x (12.2 – 10) = – 15 µstrain (compression) Actual strain = (7700 – 8000) x 0.343 + (60-20) x (12.2) = +385 µstrain (tension) From the above example, it can be seen that while the concrete was actually expanding by 385 microstrains due to the temperature increase, the apparent strain was 103 microstrains in compression, and the actual change of strain due to increased stress in the concrete was only 15 microstrains compression.
13
4.3 Environmental Factors Since the purpose of the strain meter installation is to monitor site conditions, factors which may affect these conditions should always be observed and recorded. Seemingly minor effects may have a real influence on the behavior of the structure being monitored, and may give an early indication of potential problems. Some of these factors include, but are not limited to: blasting, rainfall, tidal levels, traffic, temperature and barometric changes, weather conditions, changes in personnel, nearby construction activities, excavation and fill level sequences, seasonal changes, etc.
4.4 Shrinkage Effects A well know property of concrete is its propensity to shrink as the water content diminishes and to swell as it absorbs water. This shrinkage and swelling can give rise to large strain changes that are not related to load or stress. The magnitude of these strains can be several hundred microstrains. It is difficult to compensate for these unwanted strains. An attempt may be made to keep the concrete under a constant condition of water content, but this is frequently impossible on concrete structures exposed to varying weather conditions. The shrinkage and/or swelling effect may be measured by casting a strain gage inside a concrete block that remains unloaded, yet still exposed to the same moisture conditions as the active gages. Strains measured on this gage may be used as a correction factor.
4.5 Converting Strains to Loads The load in any structural element to which the strain meter is attached is given by the formula:
L = E µ A
Equation 5 - Strain to Load Formula Where; L is the load. E is the elastic modulus of the structural element in the appropriate units. µ is the strain in microstrains. A is the cross-sectional area in the appropriate units. When installing strain gages in concrete piles it is standard practice to install them in pairs on either side of the neutral axis. This allows any strains imposed by bending to be corrected by taking the average strain of the two gages. It is also standard practice to install a pair of strain gages close to the top of the pile. The measured strain of these two gages is used to calculate the modulus of the concrete.

14
Figure 9 - Sample Model 4911 Calibration Report

15
5. TROUBLESHOOTING Maintenance and troubleshooting of rebar strain meters is confined to periodic checks of cable connections and maintenance of terminals. Once installed, the strain meters are usually inaccessible and remedial action is limited. Gages should not be opened in the field. Should difficulties arise, consult the following list of problems and possible solutions. Return any faulty gages to the factory. For additional troubleshooting and support contact Geokon. Symptom: Thermistor resistance is too high It is likely that there is an open circuit. Check all connections, terminals, and plugs. If a cut is
located in the cable, splice according to instructions in Section 2.5. Symptom: Thermistor resistance is too low It is likely that there is a short. Check all connections, terminals, and plugs. If a short is
located in the cable, splice according to instructions in Section 2.5.
Water may have penetrated the interior of the strain meter. There is no remedial action. Symptom: Strain Meter Readings are Unstable Is the readout box position set correctly? If using a datalogger to record readings
automatically, are the swept frequency excitation settings correct? Is there a source of electrical noise nearby? Likely candidates are generators, motors, arc
welding equipment, high voltage lines, etc. If possible, move the instrument cable away from power lines and electrical equipment or install electronic filtering.
Make sure the shield drain wire is connected to ground whether using a portable readout or
datalogger. Connect the shield drain wire to the readout using the blue clip. (Green for the GK-401.)
Does the readout work with another strain meter? If not, it may have a low battery or possibly be malfunctioning.
Symptom: Strain Meter Fails to Read
Is the cable cut or crushed? Check the resistance of the cable by connecting an ohmmeter to
the gage leads. Table 2 shows the expected resistance for the various wire combinations; Table 3 is provided for the user to fill in the actual resistance found. Cable resistance is approximately 14.7Ω per 1,000 feet (48.5Ω per km); multiply this factor by two to account for both directions. If the resistance is very high or infinite (megohms), the cable is probably broken or cut. If the resistance is very low (<20Ω), the gage conductors may be shorted. If a cut or a short is located in the cable, splice according to the instructions in Section 2.5.
Does the readout or datalogger work with another gage? If not, it may have a low battery or possibly be malfunctioning.

16
Vibrating Wire Sensor Lead Grid - SAMPLE VALUES Red Black White Green Shield
Red N/A ≅50Ω infinite infinite infinite
Black ≅50Ω N/A infinite infinite infinite
White infinite infinite N/A 3000Ω at 25°C
infinite
Green infinite infinite 3000Ω at 25°C
N/A infinite
Shield infinite infinite infinite infinite N/A Table 2 - Sample Resistance
Vibrating Wire Sensor Lead Grid - SENSOR NAME/## :
Red Black White Green Shield
Red
Black
White
Green
Shield Table 3 - Resistance Work Sheet

17
APPENDIX A. SPECIFICATIONS A.1 Rebar Strain Meters
Model: 4911A 4911 “Sister Bar” Range: 3000 µε (Standard range is 60% in compression)
Rebar Sizes Available:¹ #6, #7, #8, #9, #10, #11, #12 #4, #5 Sensitivity: 0.025% FSR Accuracy: 0.25% FSR Linearity: 0.25% FSR
Operating Temperature: °C -40 to +90, °F -40 to 200 Operating Frequency: 1400-3200 Hz
Coil Resistance: 50Ω, ±5Ω Length: 43.5", 1105 mm 36", 914 mm
Materials: Grade 60 Rebar, (60 ksi yield), and High Strength Steel
Electrical Cable: Two twisted pair (Four conductor) 22 AWG Foil shield, PVC jacket, nominal OD=6.3 mm (0.250")
Table 4 - Model 4911A/4911 Strain Meter Specifications Notes: ¹ Consult the factory for other sizes available.
A.2 Thermistor (See Appendix B also) Range: -80 to +150° C Accuracy: ±0.5° C

18
APPENDIX B. THERMISTOR TEMPERATURE DERIVATION
Thermistor Type: YSI 44005, Dale #1C3001-B3, Alpha #13A3001-B3 Resistance to Temperature Equation:
T=1
A+B(LnR)+C(LnR)3 -273.2
Equation 6 - Resistance to Temperature
Where; T = Temperature in °C. LnR = Natural Log of Thermistor Resistance. A = 1.4051 × 10⁻³ B = 2.369 × 10⁻⁴ C = 1.019 × 10⁻⁷ Note: Coefficients calculated over the −50 to +150° C. span.
Ohms Temp Ohms Temp Ohms Temp Ohms Temp Ohms Temp 201.1K -50 16.60K -10 2417 +30 525.4 +70 153.2 +110 187.3K -49 15.72K -9 2317 31 507.8 71 149.0 111 174.5K -48 14.90K -8 2221 32 490.9 72 145.0 112 162.7K -47 14.12K -7 2130 33 474.7 73 141.1 113 151.7K -46 13.39K -6 2042 34 459.0 74 137.2 114 141.6K -45 12.70K -5 1959 35 444.0 75 133.6 115 132.2K -44 12.05K -4 1880 36 429.5 76 130.0 116 123.5K -43 11.44K -3 1805 37 415.6 77 126.5 117 115.4K -42 10.86K -2 1733 38 402.2 78 123.2 118 107.9K -41 10.31K -1 1664 39 389.3 79 119.9 119 101.0K -40 9796 0 1598 40 376.9 80 116.8 120 94.48K -39 9310 +1 1535 41 364.9 81 113.8 121 88.46K -38 8851 2 1475 42 353.4 82 110.8 122 82.87K -37 8417 3 1418 43 342.2 83 107.9 123 77.66K -36 8006 4 1363 44 331.5 84 105.2 124 72.81K -35 7618 5 1310 45 321.2 85 102.5 125 68.30K -34 7252 6 1260 46 311.3 86 99.9 126 64.09K -33 6905 7 1212 47 301.7 87 97.3 127 60.17K -32 6576 8 1167 48 292.4 88 94.9 128 56.51K -31 6265 9 1123 49 283.5 89 92.5 129 53.10K -30 5971 10 1081 50 274.9 90 90.2 130 49.91K -29 5692 11 1040 51 266.6 91 87.9 131 46.94K -28 5427 12 1002 52 258.6 92 85.7 132 44.16K -27 5177 13 965.0 53 250.9 93 83.6 133 41.56K -26 4939 14 929.6 54 243.4 94 81.6 134 39.13K -25 4714 15 895.8 55 236.2 95 79.6 135 36.86K -24 4500 16 863.3 56 229.3 96 77.6 136 34.73K -23 4297 17 832.2 57 222.6 97 75.8 137 32.74K -22 4105 18 802.3 58 216.1 98 73.9 138 30.87K -21 3922 19 773.7 59 209.8 99 72.2 139 29.13K -20 3748 20 746.3 60 203.8 100 70.4 140 27.49K -19 3583 21 719.9 61 197.9 101 68.8 141 25.95K -18 3426 22 694.7 62 192.2 102 67.1 142 24.51K -17 3277 23 670.4 63 186.8 103 65.5 143 23.16K -16 3135 24 647.1 64 181.5 104 64.0 144 21.89K -15 3000 25 624.7 65 176.4 105 62.5 145 20.70K -14 2872 26 603.3 66 171.4 106 61.1 146 19.58K -13 2750 27 582.6 67 166.7 107 59.6 147 18.52K -12 2633 28 562.8 68 162.0 108 58.3 148 17.53K -11 2523 29 543.7 69 157.6 109 56.8 149
Table 5 - Thermistor Resistance Versus Temperature 55.6 150

19
APPENDIX C. DERIVING THE CALIBRATION FACTOR (C) FROM THE TEST DATA Geokon Rebar Strain Meters are calibrated by loading them in a testing machine; hence, the gage factor (C) must be determined after converting loads to strains. This is done as follows: The central section of the rebar strain meter, (the unbonded length) which is 7.5" or 19.05 cm long, contains a vibrating wire sensor located axially at the midsection. See Figure 10.
Figure 10 - Rebar Strain Meter Schematic
To convert the observed change in readout digits (∆R) into a strain (εt) for the entire length of the unbonded section (7.5 in./19.05 cm), requires the following equation:
εt=(ε1×L1)+(ε2×L2)+(ε3×L3)
L1+L2+L3
Equation 7 - Total Strain Calculation
Where; L1 is 2.000" (5.08 cm). L2 is 5.000" (12.7 cm). L3 is 0.500" (1.27 cm). εt is the total strain of the unbonded section.
ε1 is the strain in zone one, determined empirically from the equation for the vibrating wire sensor, i.e., ε1 = ∆R × 0.359 × 10⁻⁶ where ∆R is the change in readout digits. ε2, ε3 are the strains in zones two and three, respectively, dependent on the load and cross-sectional area, see Equation 8 and Equation 9.

20
ε2 =P
a2×E
Equation 8 - Zone Two Calculation
ε3 =P
a3×E
Equation 9 - Zone Three Calculation Where; P is the load in pounds or kilograms. a2 and a3 are the cross-sectional areas in inches2 or cm2. See Table 6.
Ε is the Young's Modulus, 30×106 psi or 2.1×10⁶ kg/cm2 (or MPa × 10.197) P is also given by the following equation:
P=∆R×F
Equation 10 - Load in Pounds/Kilograms Where; P is the applied load in pounds or kilograms. ∆R is the corresponding change in readout digits. F is the calibration factor expressed as lbs. or kg. per readout digit.
Rebar Size Diameter a2 a3 #4 0.500 in.
1.27 cm 0.196 in2 1.264 cm2
0.248 in2
1.60 cm2 #5 0.625 in.
1.59 cm 0.3058 in2 1.973 cm2
0.357 in2
2.303 cm2 #6 0.750 in.
1.905 cm 0.390 in2
2.516 cm2 0.442 in2
2.852 cm2 #7 0.875 in.
2.222 cm 0.549 in2
3.542 cm2 0.601 in2
3.877 cm2 #8 1.000 in.
2.54 cm 0.733 in2
4.729 cm2 0.785 in2
5.065 cm2 #9 1.125 in.
2.858 cm 0.942 in2
6.077 cm2 0.994 in2
6.413 cm2 #10 1.250 in.
3.175 cm 1.175 in2
7.580 cm2 1.227 in2
7.916 cm2 #11 1.375 in.
3.493 cm 1.432 in2
9.239 cm2 1.485 in2
9.580 cm2 #12 1.500 in 1.714 in2 1.766 in2 #14 1.750 in 2.352 in2 2.404 in2
Table 6 - Unbonded Section Dimensions

21
By making the various substitutions of Table 6 the relationship between strain in the unbonded section versus change in readout digits can be obtained. Using the #6 rebar as an example, with English conventions, yields the following:
6105.7
442.0305.0
390.03052359.0
−×
×+
×+×
×∆=F
Rtε
( )( )61006205.00957.0 −×+∆= FRtε
Doing these calculations for the other sizes of rebar yields the data shown in Table 7. Use Table 7 to obtain the microstrain/digit gage factor (C) from the lbs. or kg. per digit gage factor (F).
Rebar Size Conversion Formula - English Conversion Formula - Metric #4 C = 0.0957 + F x 0.12220 C = 0.0957 + F x 0.2707 #5 C = 0.0957 + F x 0.07888 C = 0.0957 + F x 0.2091 #6 C = 0.0957 + F x 0.06205 C = 0.0957 + F x 0.1373 #7 C = 0.0957 + F x 0.04416 C = 0.0957 + F x 0.0977 #8 C = 0.0957 + F x 0.03310 C = 0.0957 + F x 0.0733 #9 C = 0.0957 + F x 0.02584 C = 0.0957 + F x 0.0572 #10 C = 0.0957 + F x 0.02073 C = 0.0957 + F x 0.0459 #11 C = 0.0957 + F x 0.01700 C = 0.0957 + F x 0.0377 #12 C = 0.0957 + F x 0.01422 C = 0.0957 + F x 0.0315 #14 C = 0.0957 + F x 0.01037 C = 0.0957 + F x 0.0230
Table 7 - Microstrain Conversion Factors